1. Introduction
The Kingdom of Saudi Arabia (KSA) ranks third globally in smartphone use. Smartphones have made many aspects of life more manageable and are considered the most used technological tool worldwide [
1,
2]. Mobile phones have become an integral part of our lives, especially for mobile users in Saudi Arabia [
3]. The behavior of mobile users in Saudi Arabia is heavily influenced by the country's cultural, social, and economic factors.
The smartphone has evolved into a multifunctional mobile device with advanced features. Some health-related apps can be beneficial in various clinical areas. The success of using these applications depends on how easily they can be learned and used [
4,
5,
6,
7]. A prior study indicated that smartphones give practitioners quick access to medical and health information, which benefits the healthcare system. This technology has lowered medical errors and improved decision-making, boosting telemedicine communication between healthcare workers and patients. [
8,
9,
10].
In 1994, Denso Wave developed quick response (QR) codes to monitor car components during manufacturing and distribution [
11], Denso Wave, the patent holder for QR codes, has made this technology freely available, leading to its rapid adoption. These black-and-white pixelated squares can store much more data than traditional barcodes, take up only a tenth of the space, and enable quick, omnidirectional scanning. [
12,
13,
14,
15,
16].
A wide range of websites offer the ability to create QR codes online. These links can connect to plain text, a website, a template email or text message, initiate a phone call, display a geographical location, or open a PDF or a specific application on a mobile device [
17]. The widespread use of smartphones with cameras has resulted in the widespread application of QR codes in various commercial settings, including marketing [
6], In transportation ticket management [
18], and more recently, social media applications like Snapchat, technology continues to evolve in exciting ways to meet our needs. [
19]. QR code technology in Saudi Arabia enables users to pay bills, make money transfers, check in, log in to websites, participate in promotions, exchange information, and more.
The versatility of QR codes has also sparked interest in their application across different healthcare environments. They have been considered for storing case histories in maxillofacial radiology [
9], enhancing medication safety for elderly patients [
20], and providing patient instructions after orthopedic cast application. [
21].
Additionally, these applications are freely available and have minimal technical needs, such as a smartphone and an internet connection. [
22]. Since most healthcare workers and patients have access to these facilities, they can be readily created and used to store and access data without incurring any additional costs [
23,
24,
25]. QR codes have numerous applications, including dental education, practice management, and product promotion [
26,
27,
28].
To reinforce the prevention of oral health problems, we advocated for the use of Quick Response (QR) codes in delivering patient information leaflets (PILs), thereby minimizing the need for resources and the spread of infection. However, data on the use of QR codes in pediatric dentistry is minimal. To our knowledge, few studies have examined patients’ use of QR codes, their preferences, efficiency, and the effectiveness of QR codes in providing preventive oral health information leaflets. Therefore, this study aims to explore (1) patient awareness of QR codes and how they use them, (2) the ease of using QR codes as a digital method to deliver patient information, and (3) patient preferences for receiving information electronically versus on paper PILs.
2. Materials and Methods
We developed a specific questionnaire after receiving ethical approval from the Standing Committee of Bioethics Research (SCBR-172/2023) at Prince Sattam Bin Abdulaziz University (PSAU). This questionnaire(
Table 1) assesses patients’ understanding of QR codes, their scanning methods, the convenience of using this digital option compared to traditional paper leaflets, and their preferences. All parents or guardians accompanying pediatric patients are invited to participate. We collected their demographics and compared those who scanned the QR codes. The study sample consisted mainly of well-educated, middle-aged parents attending only one university hospital. This makes the sample homogeneous, severely limiting the generalizability of the findings to the broader population.
The QR codes were generated using the free web application QR Stuff, linking to a PDF-format digital Patient Information Leaflet (PIL) containing essential preventive oral health information, optimized for mobile viewing, and accessible throughout the study period.
2.1. Sample size calculation
Post hoc statistical power analysis was conducted, assuming a null hypothesis of 0.5 for the proportion of patients using the QR code, with a difference of 0.65, at a significance level of α = 0.05 and a power of 0.9. This calculation yielded a sample size of 107, rounded up to 118. Additionally, our sample size was guided by a previous study that involved 79 participants assessing familiarity and use of QR codes (Ozkaya et al., 2015). [
27].
2.2. Generating the QR code
The process of creating a QR code involves reformatting three PILs into an A4 PDF to make them easier for smartphone users. Our photography team generates QR codes using a free web-based application. Laminated sheets of these QR codes are then placed in accessible areas throughout all cubicles. The parents accompanying the child are then gently guided to scan this visual code and are kindly asked to compare it with the PIL. Afterwards, we invite the person who scanned the QR code to complete a brief questionnaire through the provided link, helping us prevent cross-contamination smoothly. The age and gender of the individual scanning the QR code are also documented, and the collected data are organized within a Microsoft Excel database. Furthermore, descriptive analyses are performed utilizing SPSS version 26.0 (SPSS Inc., Chicago, IL, USA).
3. Results
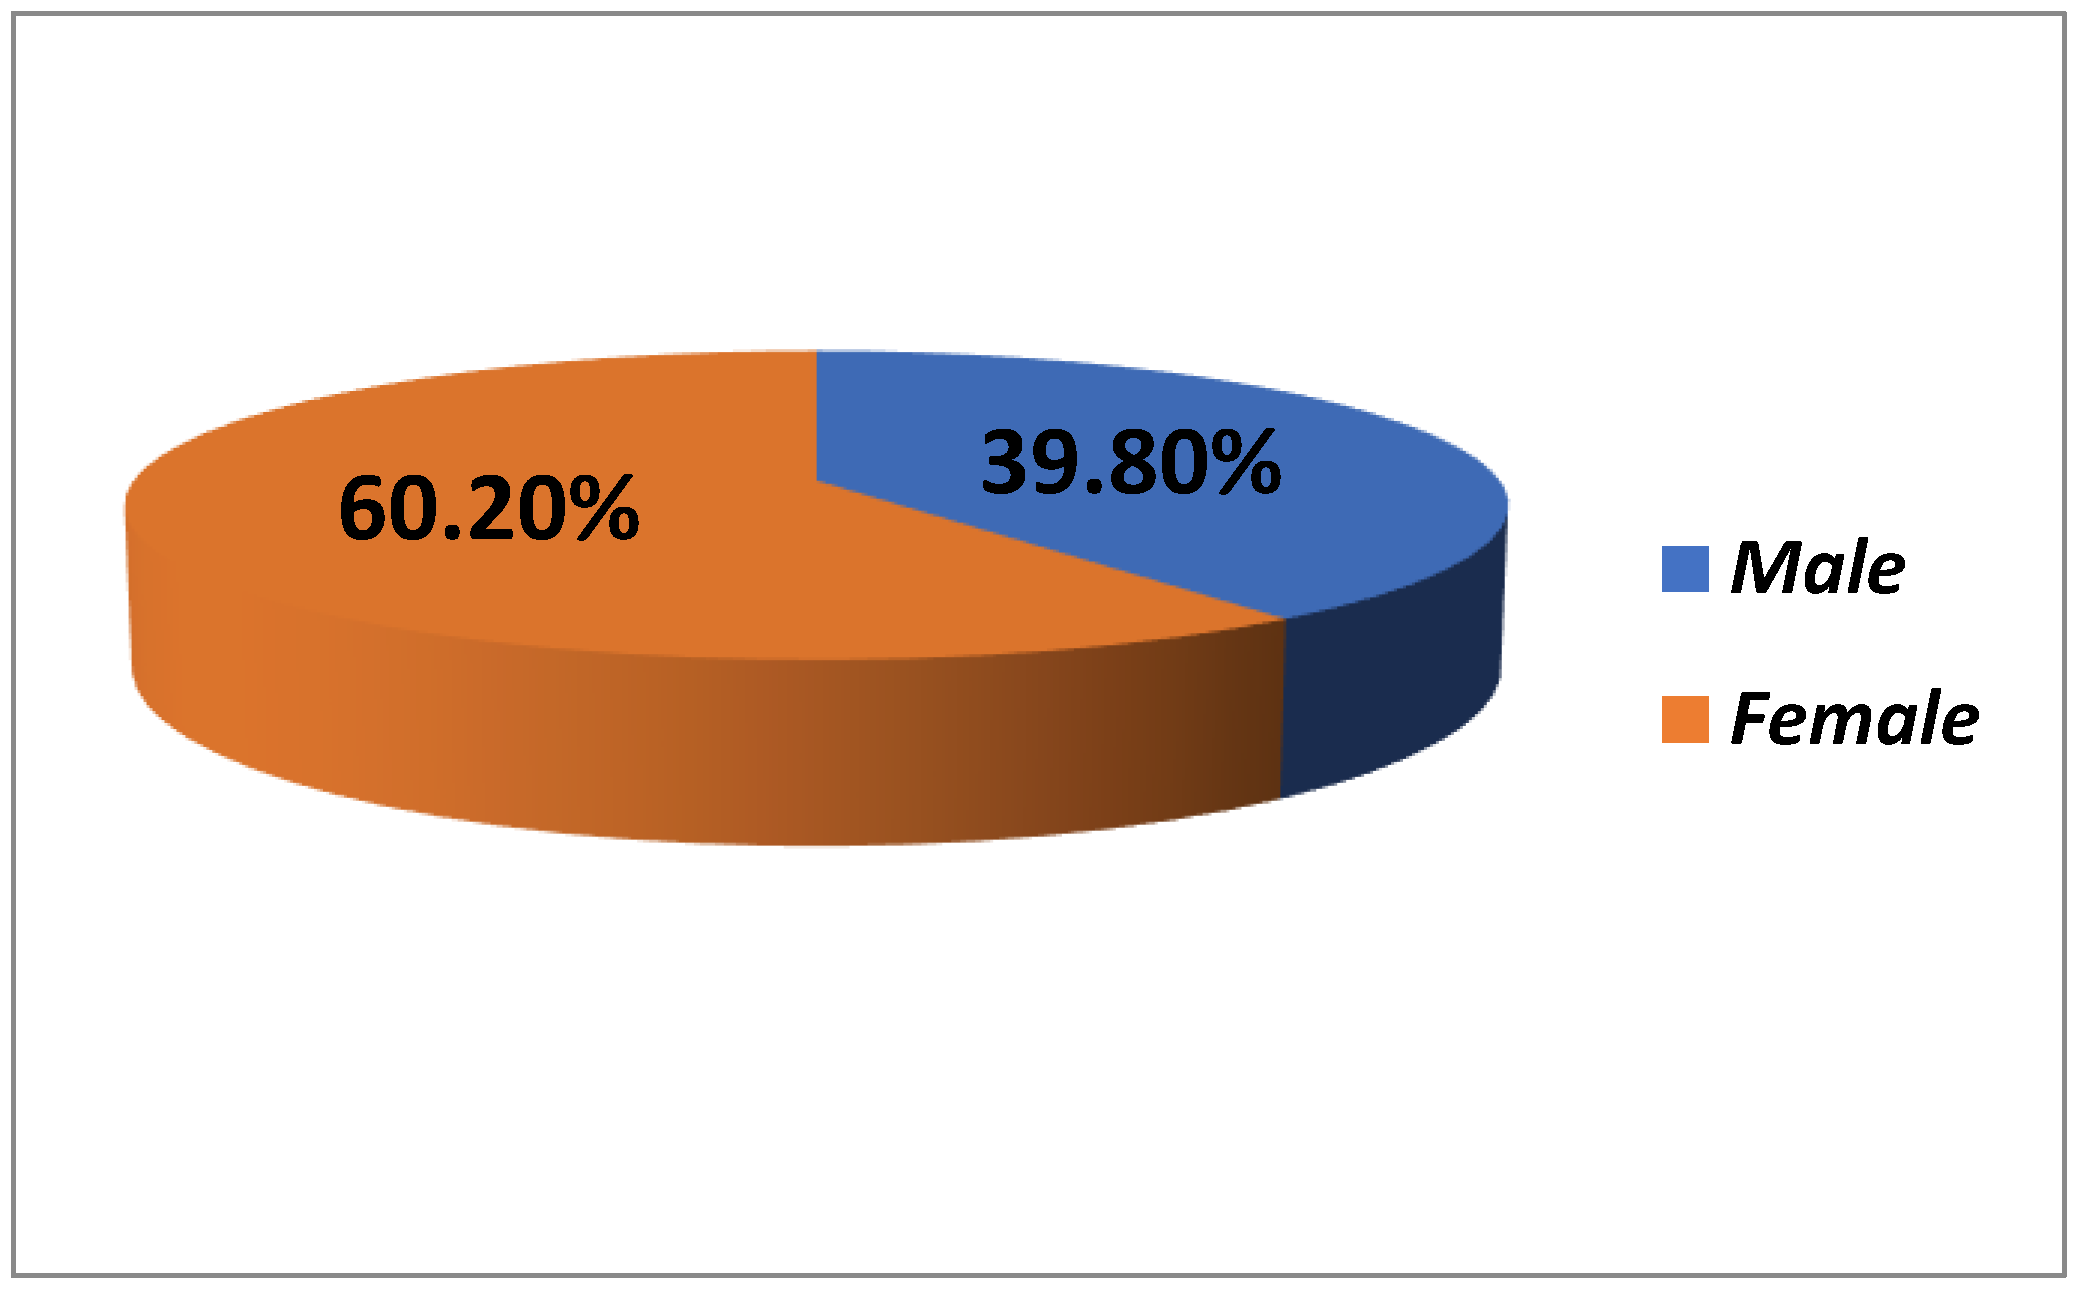
The demographic characteristics of the study participants (N = 118) provide a comprehensive view of the sample composition. The gender distribution shows that 39.8% of the participants (47 individuals) were male, while 60.2% (71 individuals) were female, indicating a majority of female representation [
Figure 1].
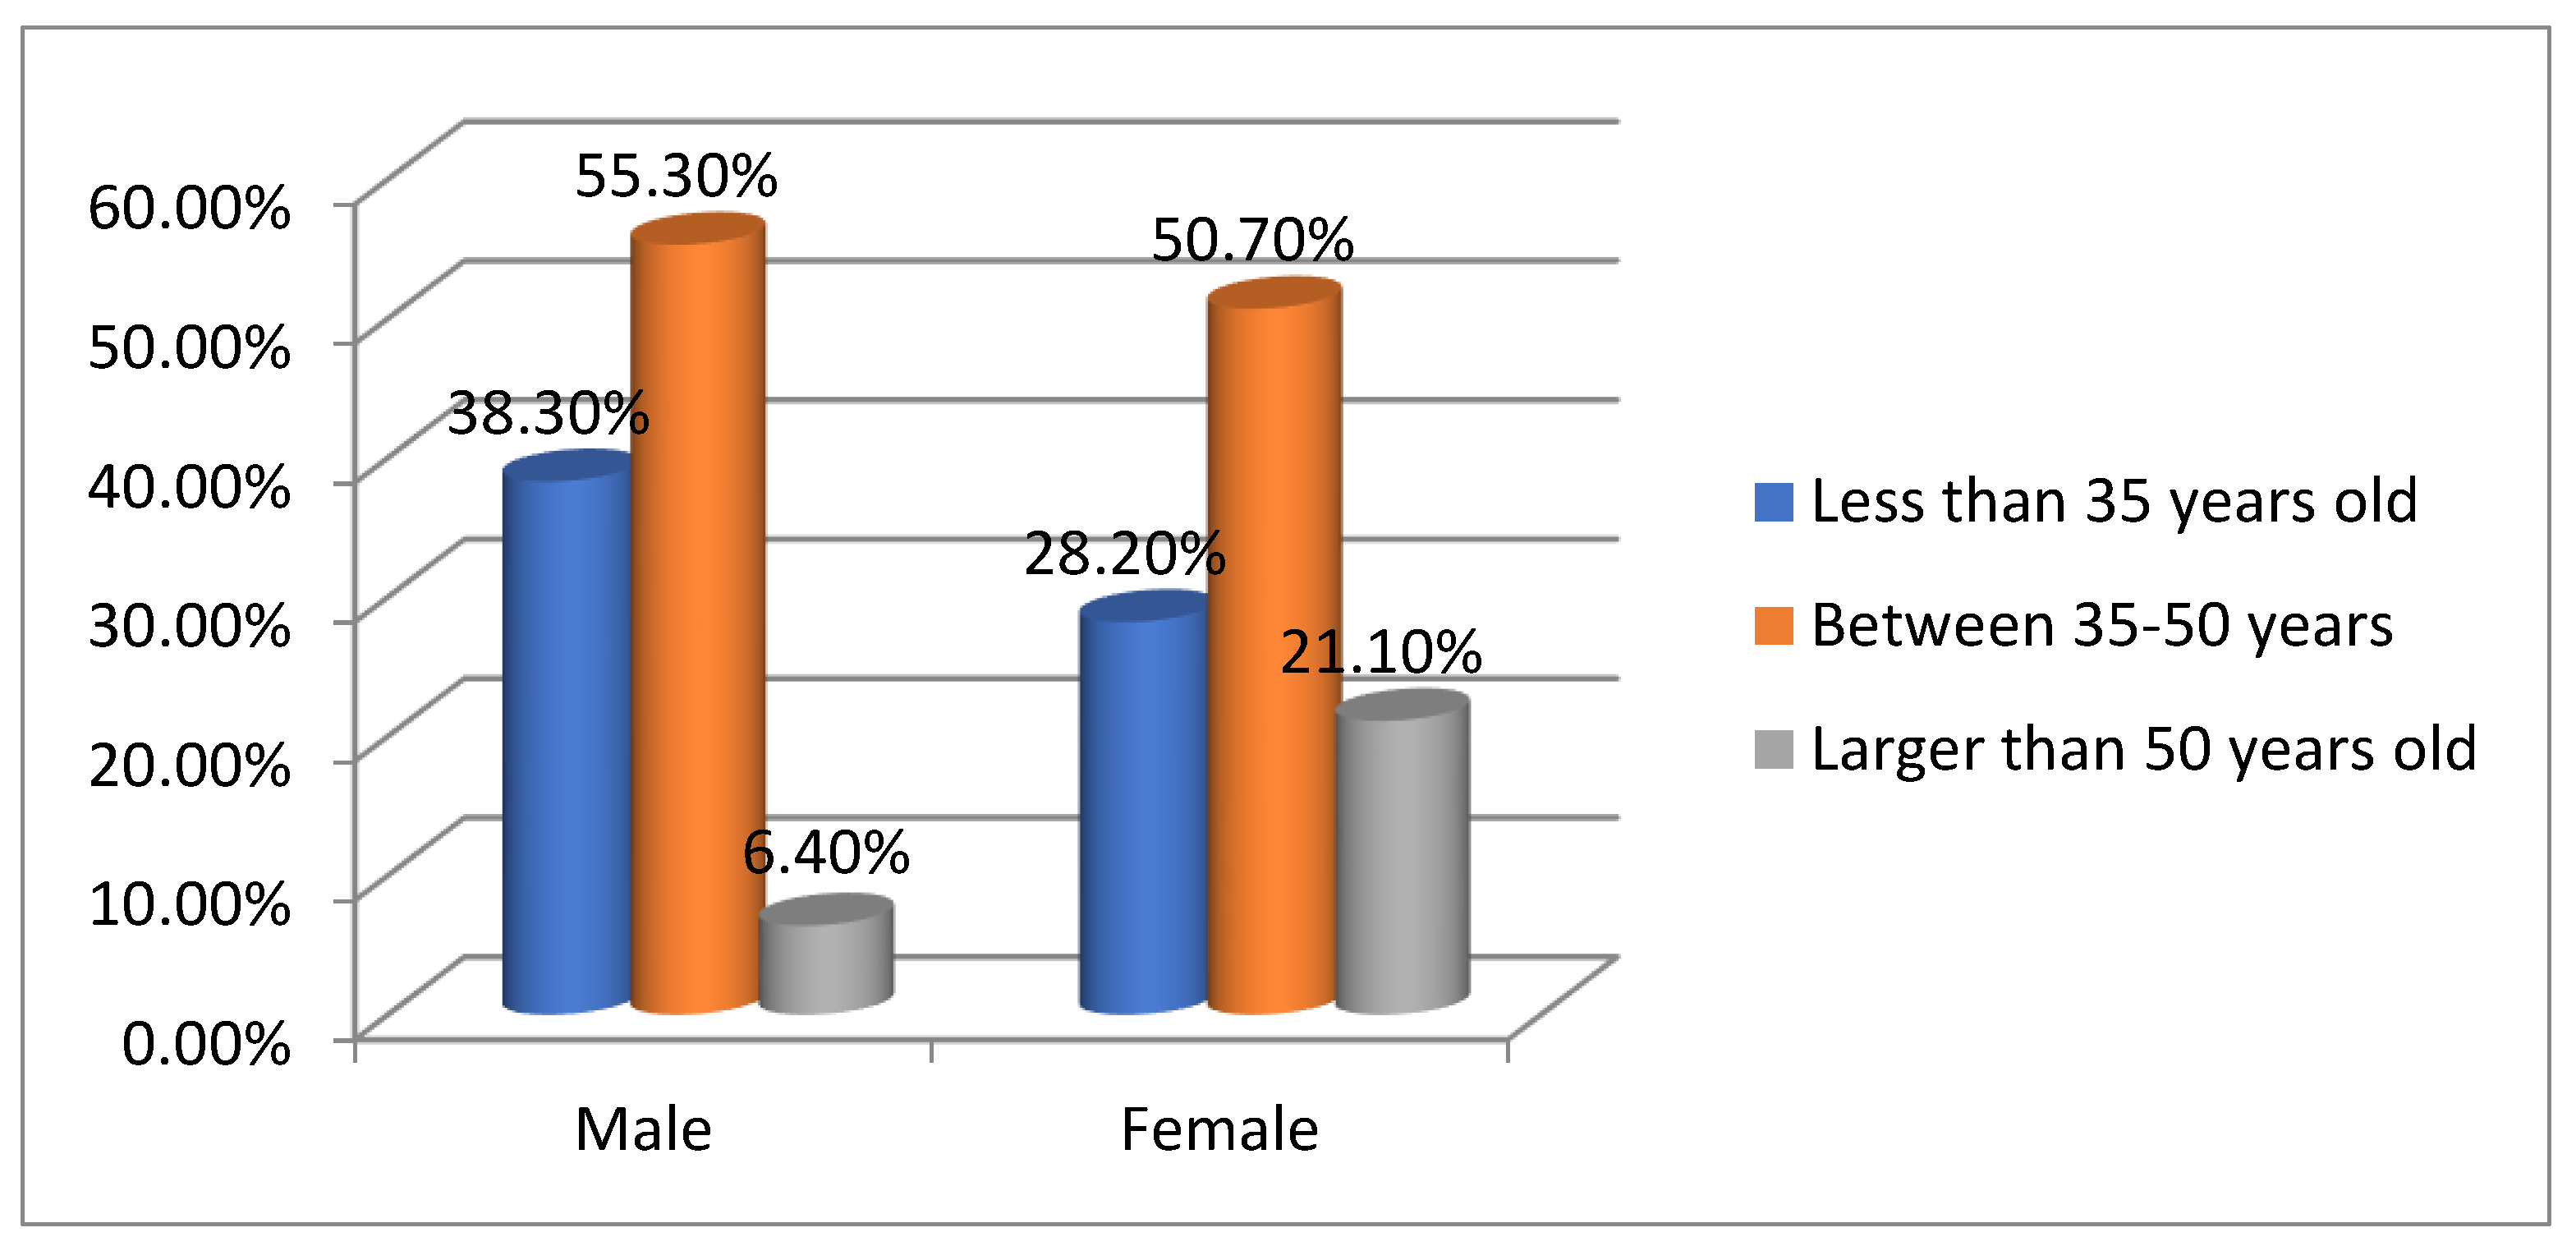
Figure 2 shows that the largest group of participants (52.5%) was aged 35–50, followed by 32.2% under 35 and 15.3% over 50, indicating a middle-aged demographic likely relevant to the study's focus. Gender comparisons reveal differences in age distribution: 55.3% of males are 35–50, 38.3% under 35, and 6.4% over 50. Among females, 50.7% are 35–50, 28.2% are under 35, and 21.1% are over 50. Overall, the 35–50 age group makes up 52.5% of the sample, with 32.2% under 35 and 15.3% over 50. A chi-square value of 5.046 and a p-value of 0.080 suggest no significant association between gender and age group distribution (p > 0.05), indicating observed differences are not statistically significant. [
Table 2].
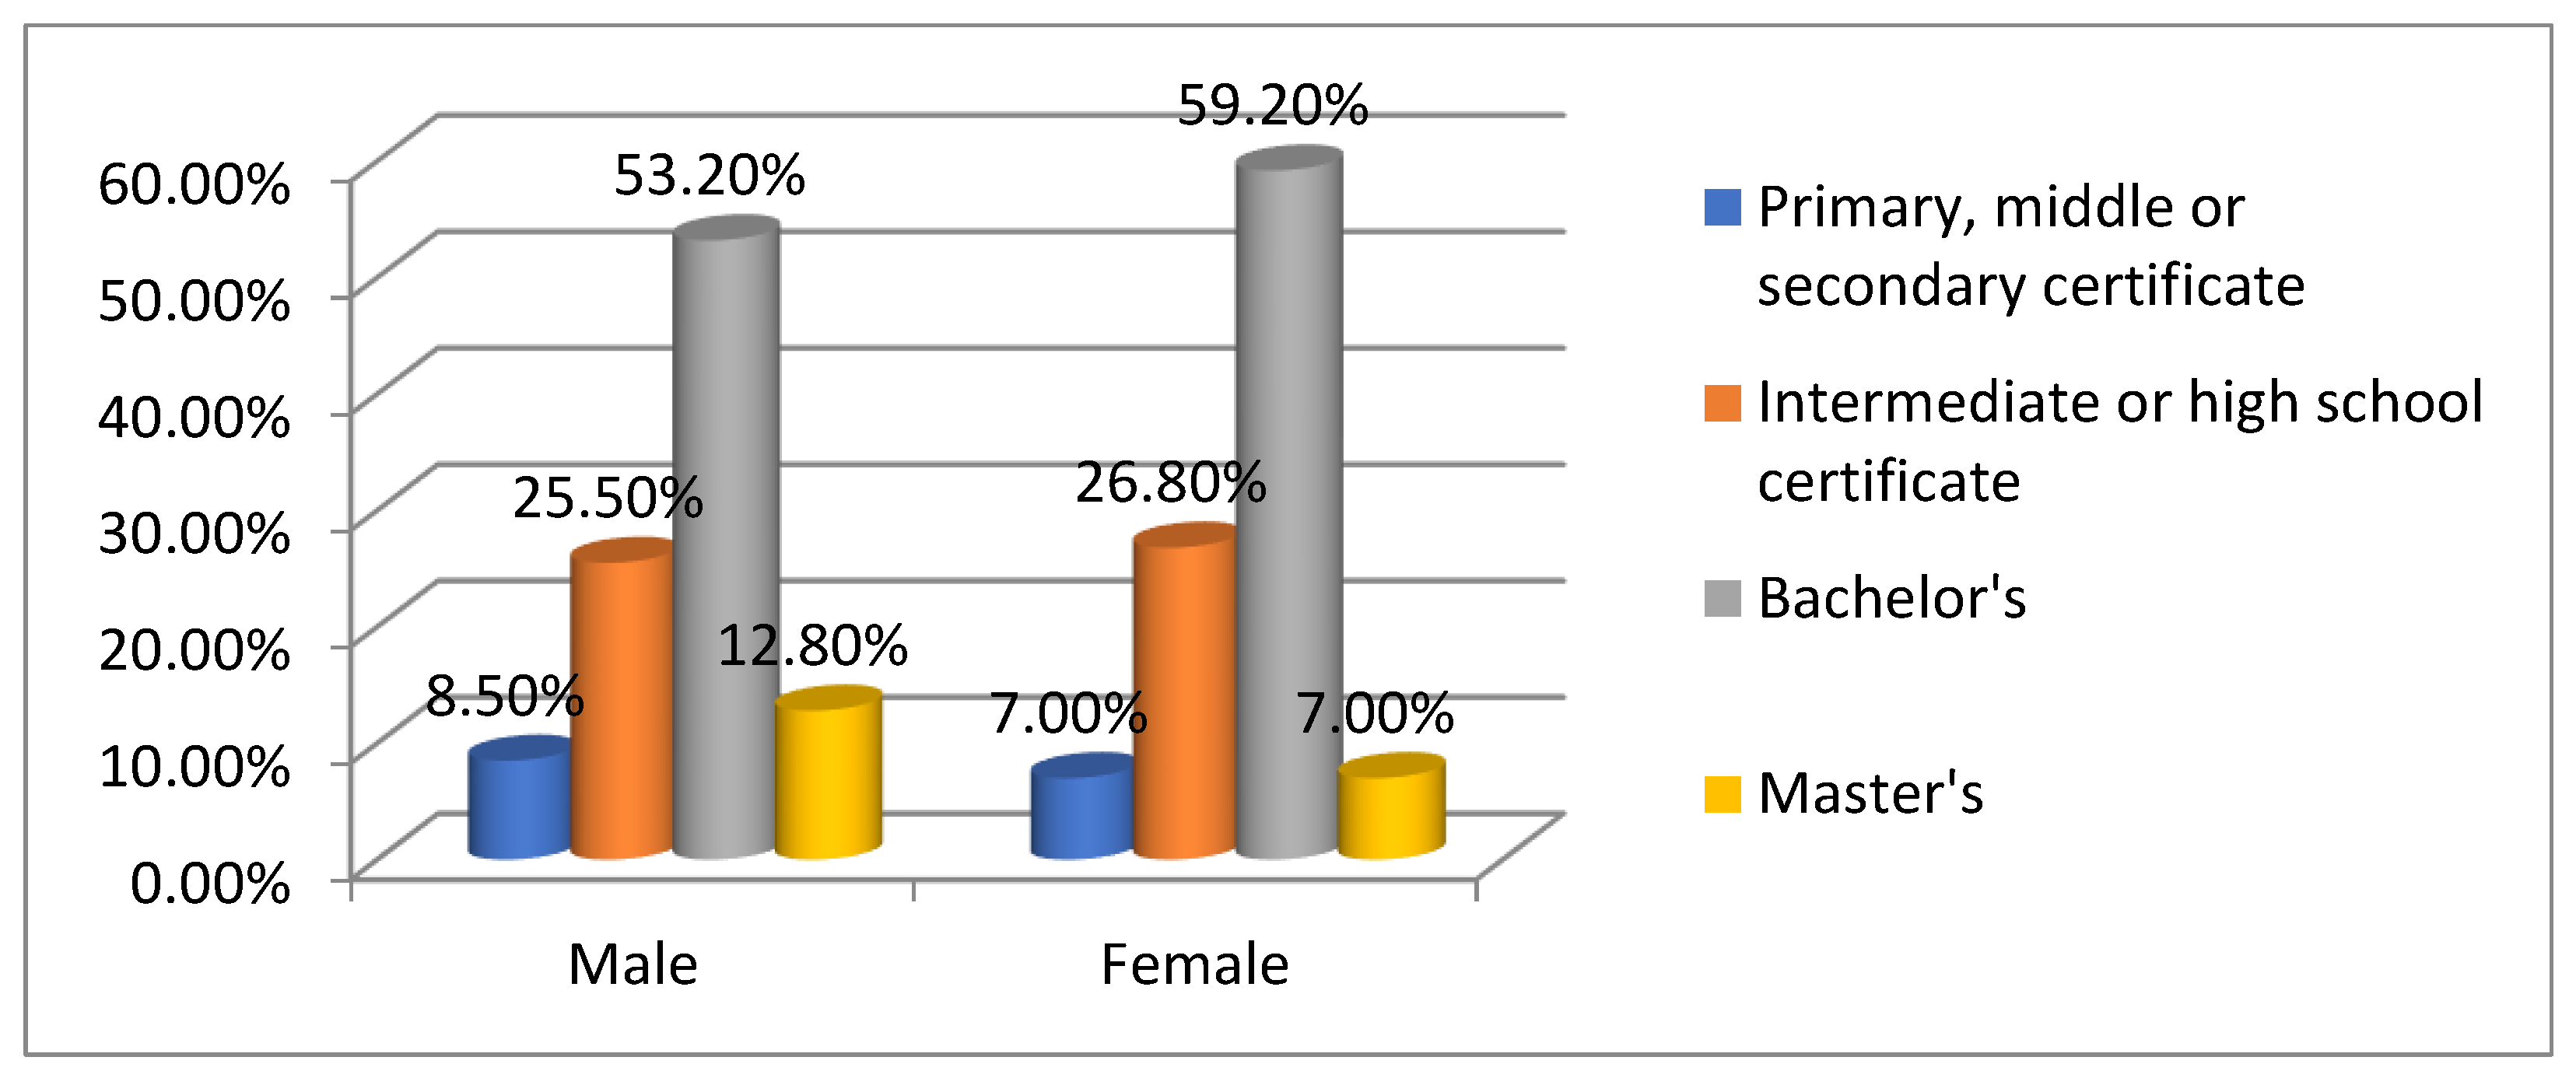
Figure 3 depicts that most participants (56.8%) held a Bachelor’s degree, while 26.3% completed an intermediate or high school certificate. Fewer participants attained a Master’s degree (9.3%), and only 7.6% had primary, middle, or secondary certification. This indicates a predominantly educated participant pool, potentially influencing familiarity with study-related tools. The demographic profile suggests a diverse sample leaning towards educated, middle-aged females, affecting the study's findings. Comparing education levels between genders shows notable patterns: 53.2% of males hold a Bachelor's degree, followed by 25.5% with an intermediate or high school certificate, 12.8% with a Master’s, and 8.5% with a lower certification. Among females, 59.2% hold a Bachelor's degree, 26.8% have an intermediate high school certificate, 7.0% have a Master’s degree, and 7.0% have a lower certification. Overall, females hold slightly more Bachelor's degrees than males, whereas males have a higher representation in Master's degrees. This distribution reflects a well-educated sample with minor variations in higher education attainment. [
Table 3].
The study's participants (N=118) provide insights into their familiarity with QR codes. All participants (100%) knew about QR codes, indicating widespread awareness. However, only 44.1% had used them, while 55.9% had not, revealing a gap between familiarity and usage [
Figure 4].
Table 4 shows that while 100% of the participants reported familiarity with QR codes, only 44.1% had actually used them, with 100% familiarity among male (47) and female (71) participants, totaling 118. The chi-square and p-values are NA, indicating uniform responses, making statistical testing unnecessary. This consistent awareness supports further analysis of QR code usage preferences.
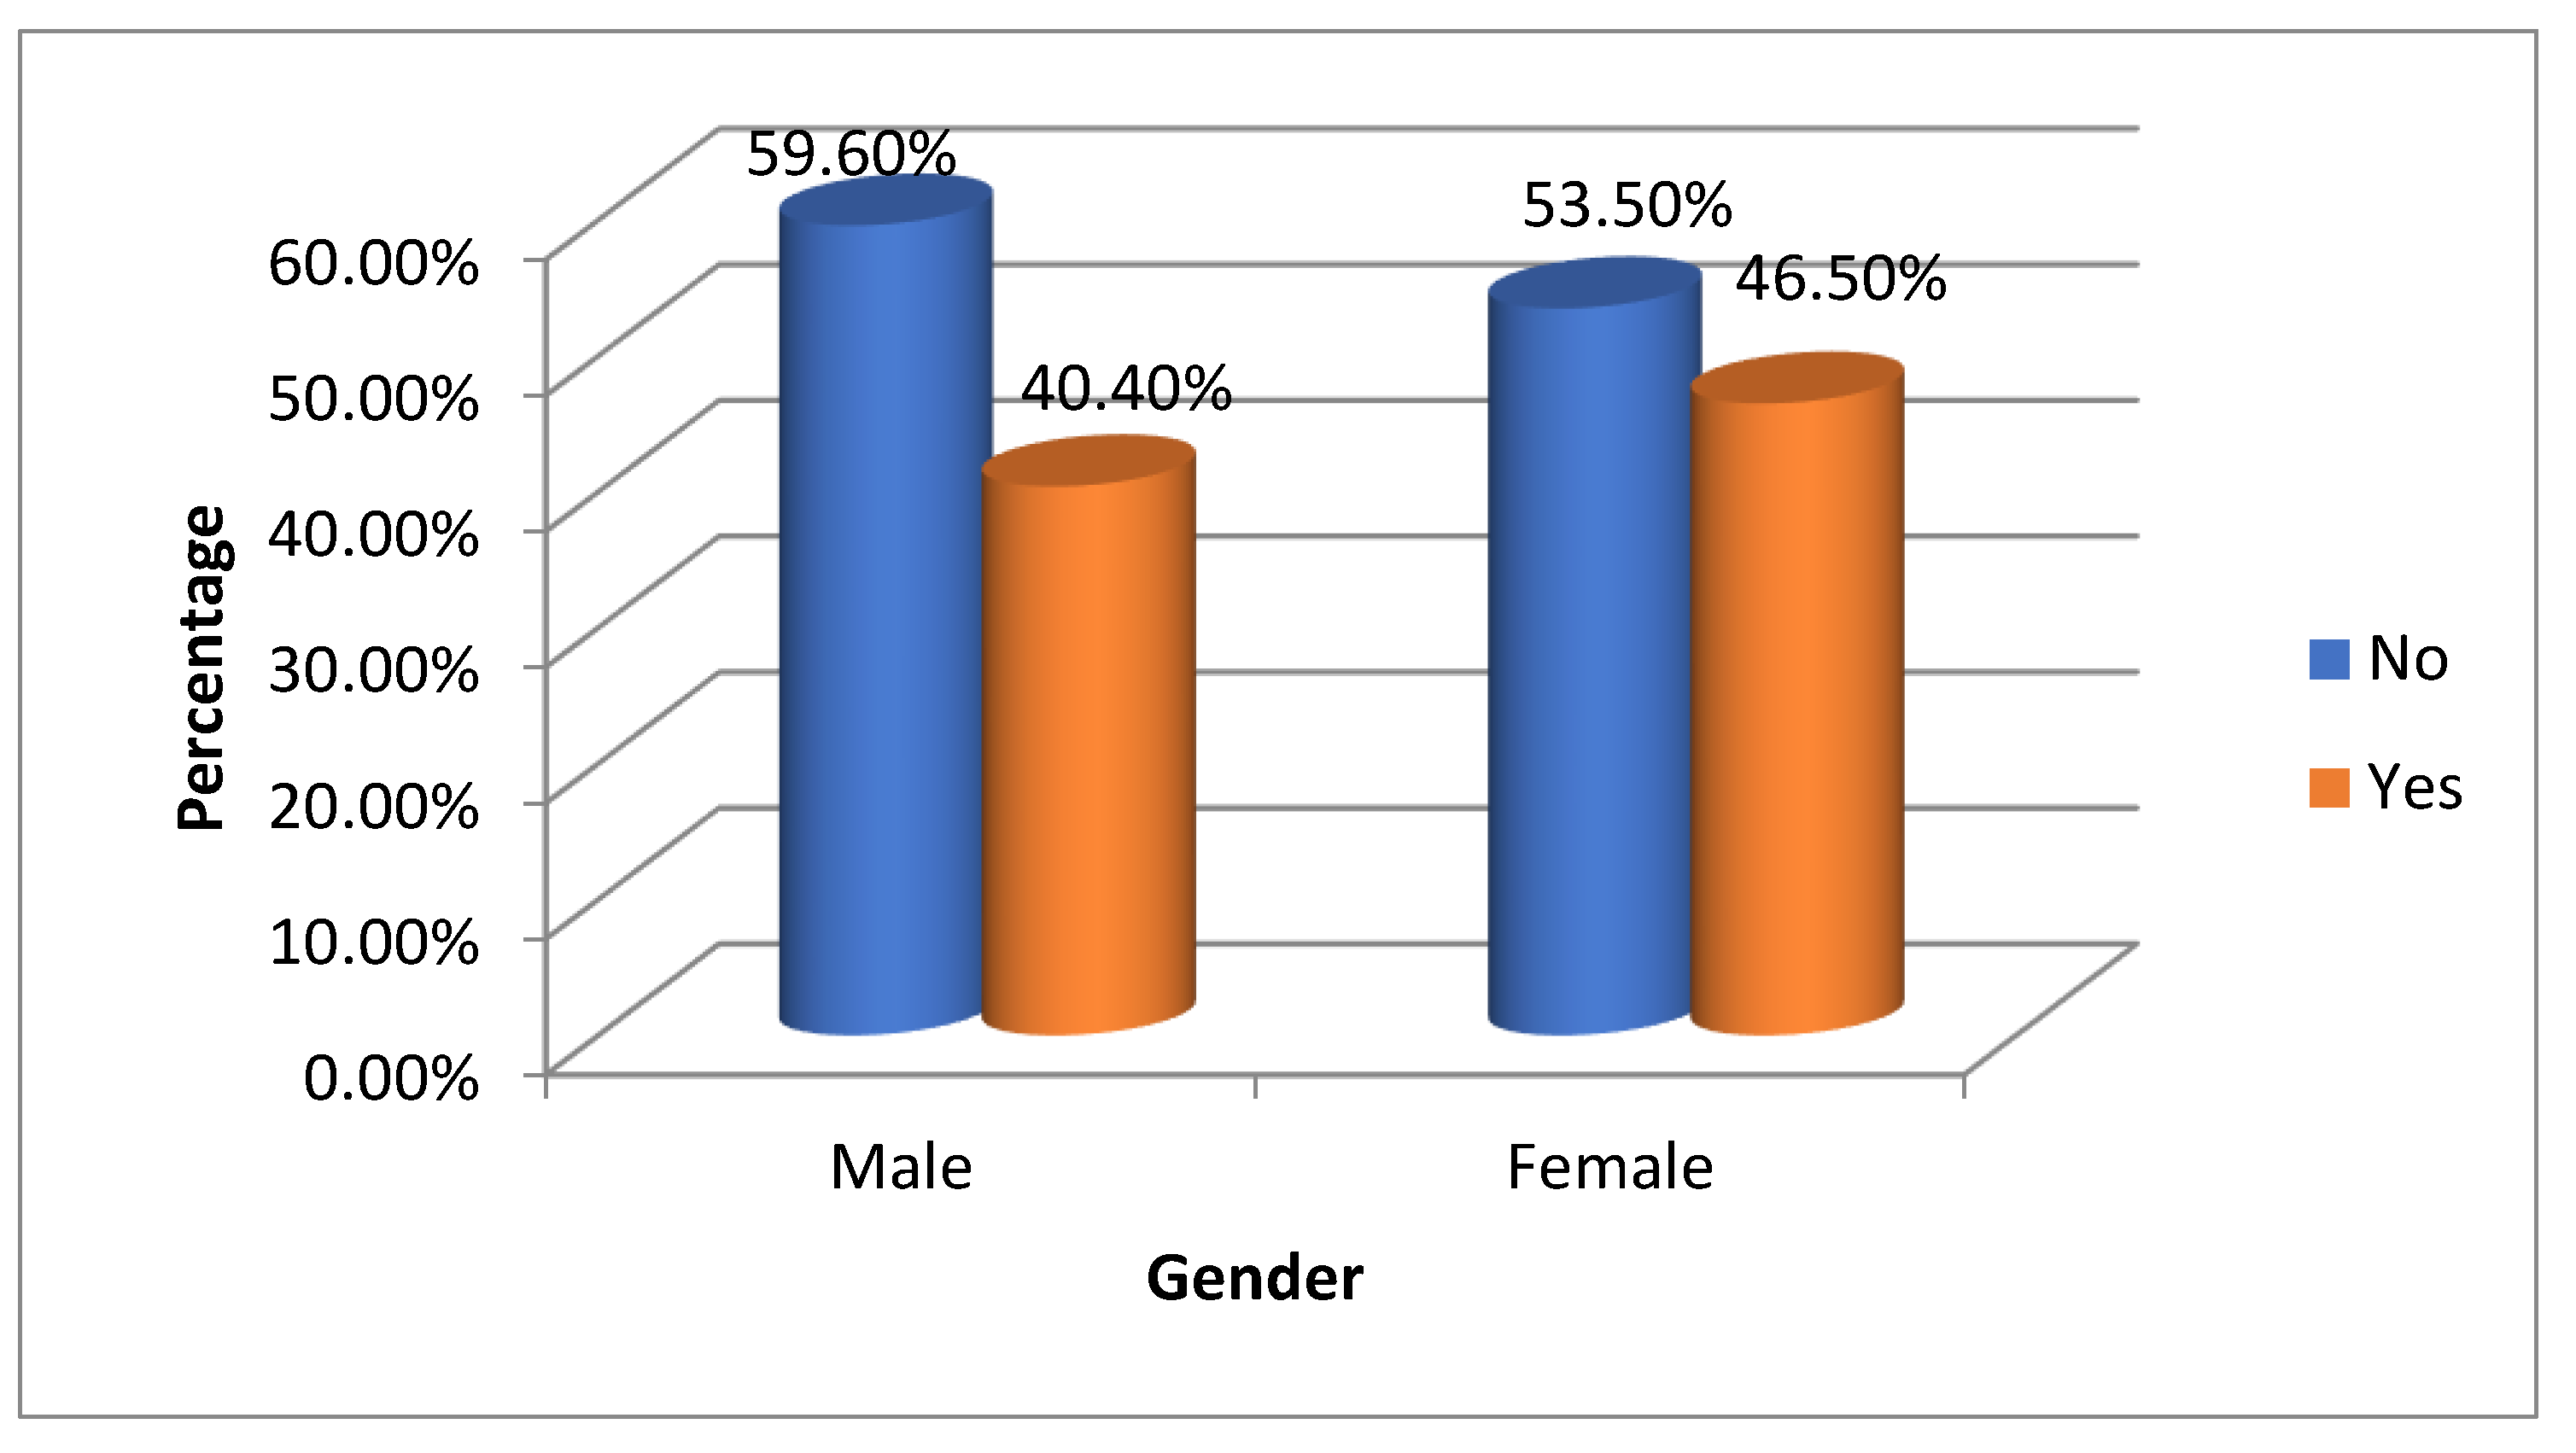
Table 5 and
Figure 5 analyze QR code usage by gender. Among males, 59.6% (28) reported never using a QR code, while 40.4% (19) did. For females, 53.5% (38) had not used one, whereas 46.5% (33) had. Overall, 55.9% (66) of participants never used QR codes, compared to 44.1% (52) who had [
Figure 4].
The chi-square value is 0.420 with a p-value of 0.517, signaling no significant association between gender and QR code usage (p > 0.05). This indicates a slight difference in usage between genders but no substantial variation within this sample.
Have you ever used a QR code?
Table 6 and
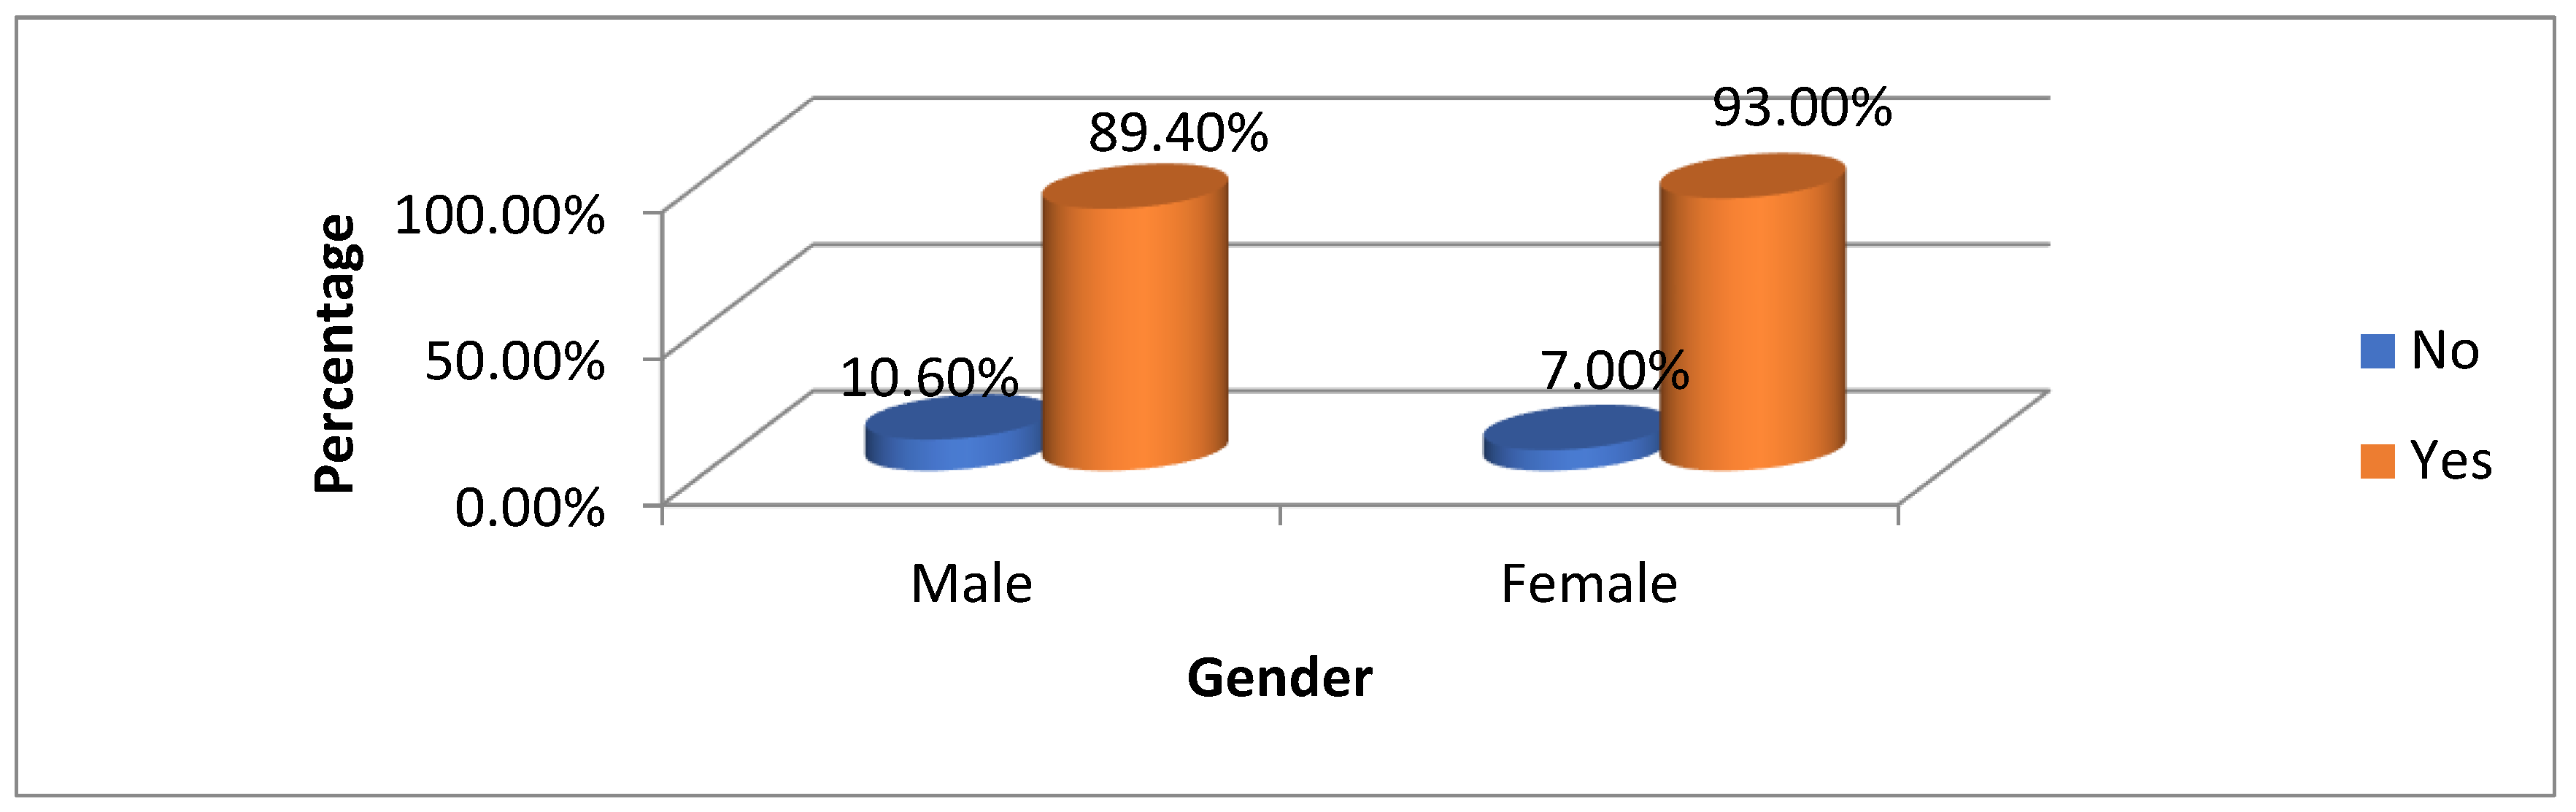
Figure 6 illustrate gender preferences for mobile technology use. Among males, 89.4% (42) preferred mobile, while 10.6% (5) did not. For females, 93.0% (66) preferred mobile, with 7.0% (5) having no preference. Overall, 91.5% of participants (108) favored mobile access, with 8.5% (10) preferring otherwise. The chi-square value of 0.471 and p-value of 0.492 indicate no significant association between gender and mobile preference (p > 0.05), suggesting both genders strongly favor mobile access with minor differences between them.
Do you prefer to have access to helpful information via mobile technology?
Table 7 and
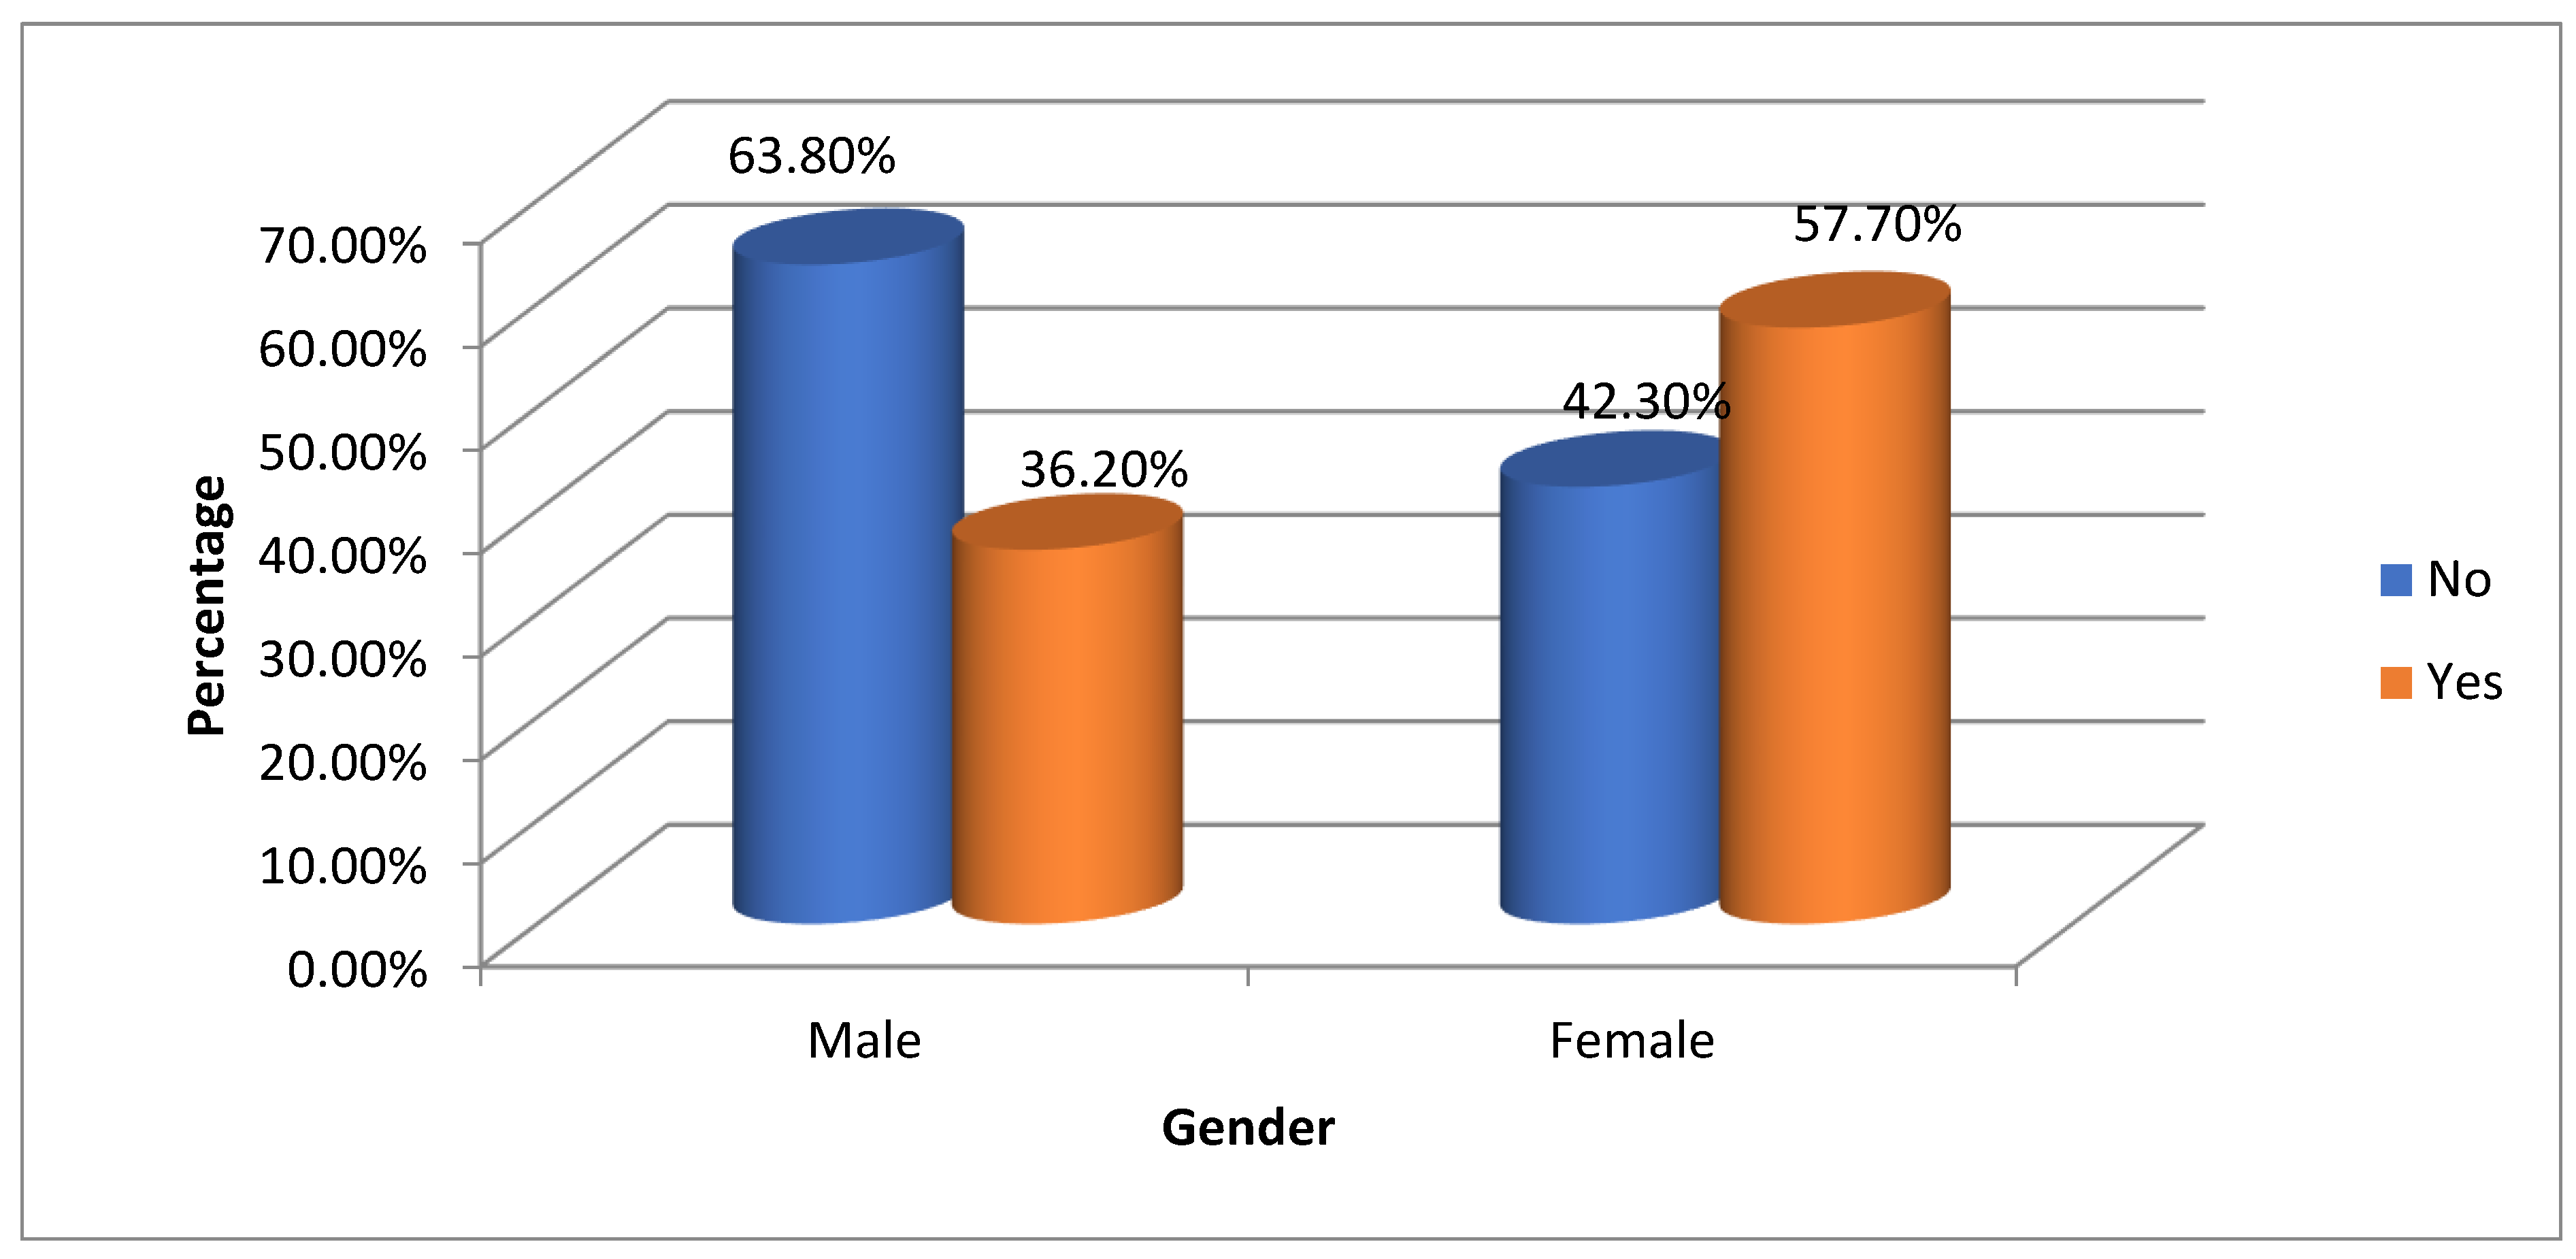
Figure 7 analyze QR code assistance needs by gender. Among males, 63.8% (30) reported no need for help, while 36.2% (17) required assistance. In contrast, 42.3% (30 women) did not need help, compared to 57.7% (41) who did. Overall, 50.8% of participants (60) felt no assistance was necessary, whereas 49.2% (58) needed help. The chi-square test showed a value of 5.268 and a p-value of 0.022*, indicating a significant association between gender and QR code assistance needs (p < 0.05). This indicates that females are more likely than males to need help, highlighting a potential gender disparity in comfort with this technology.
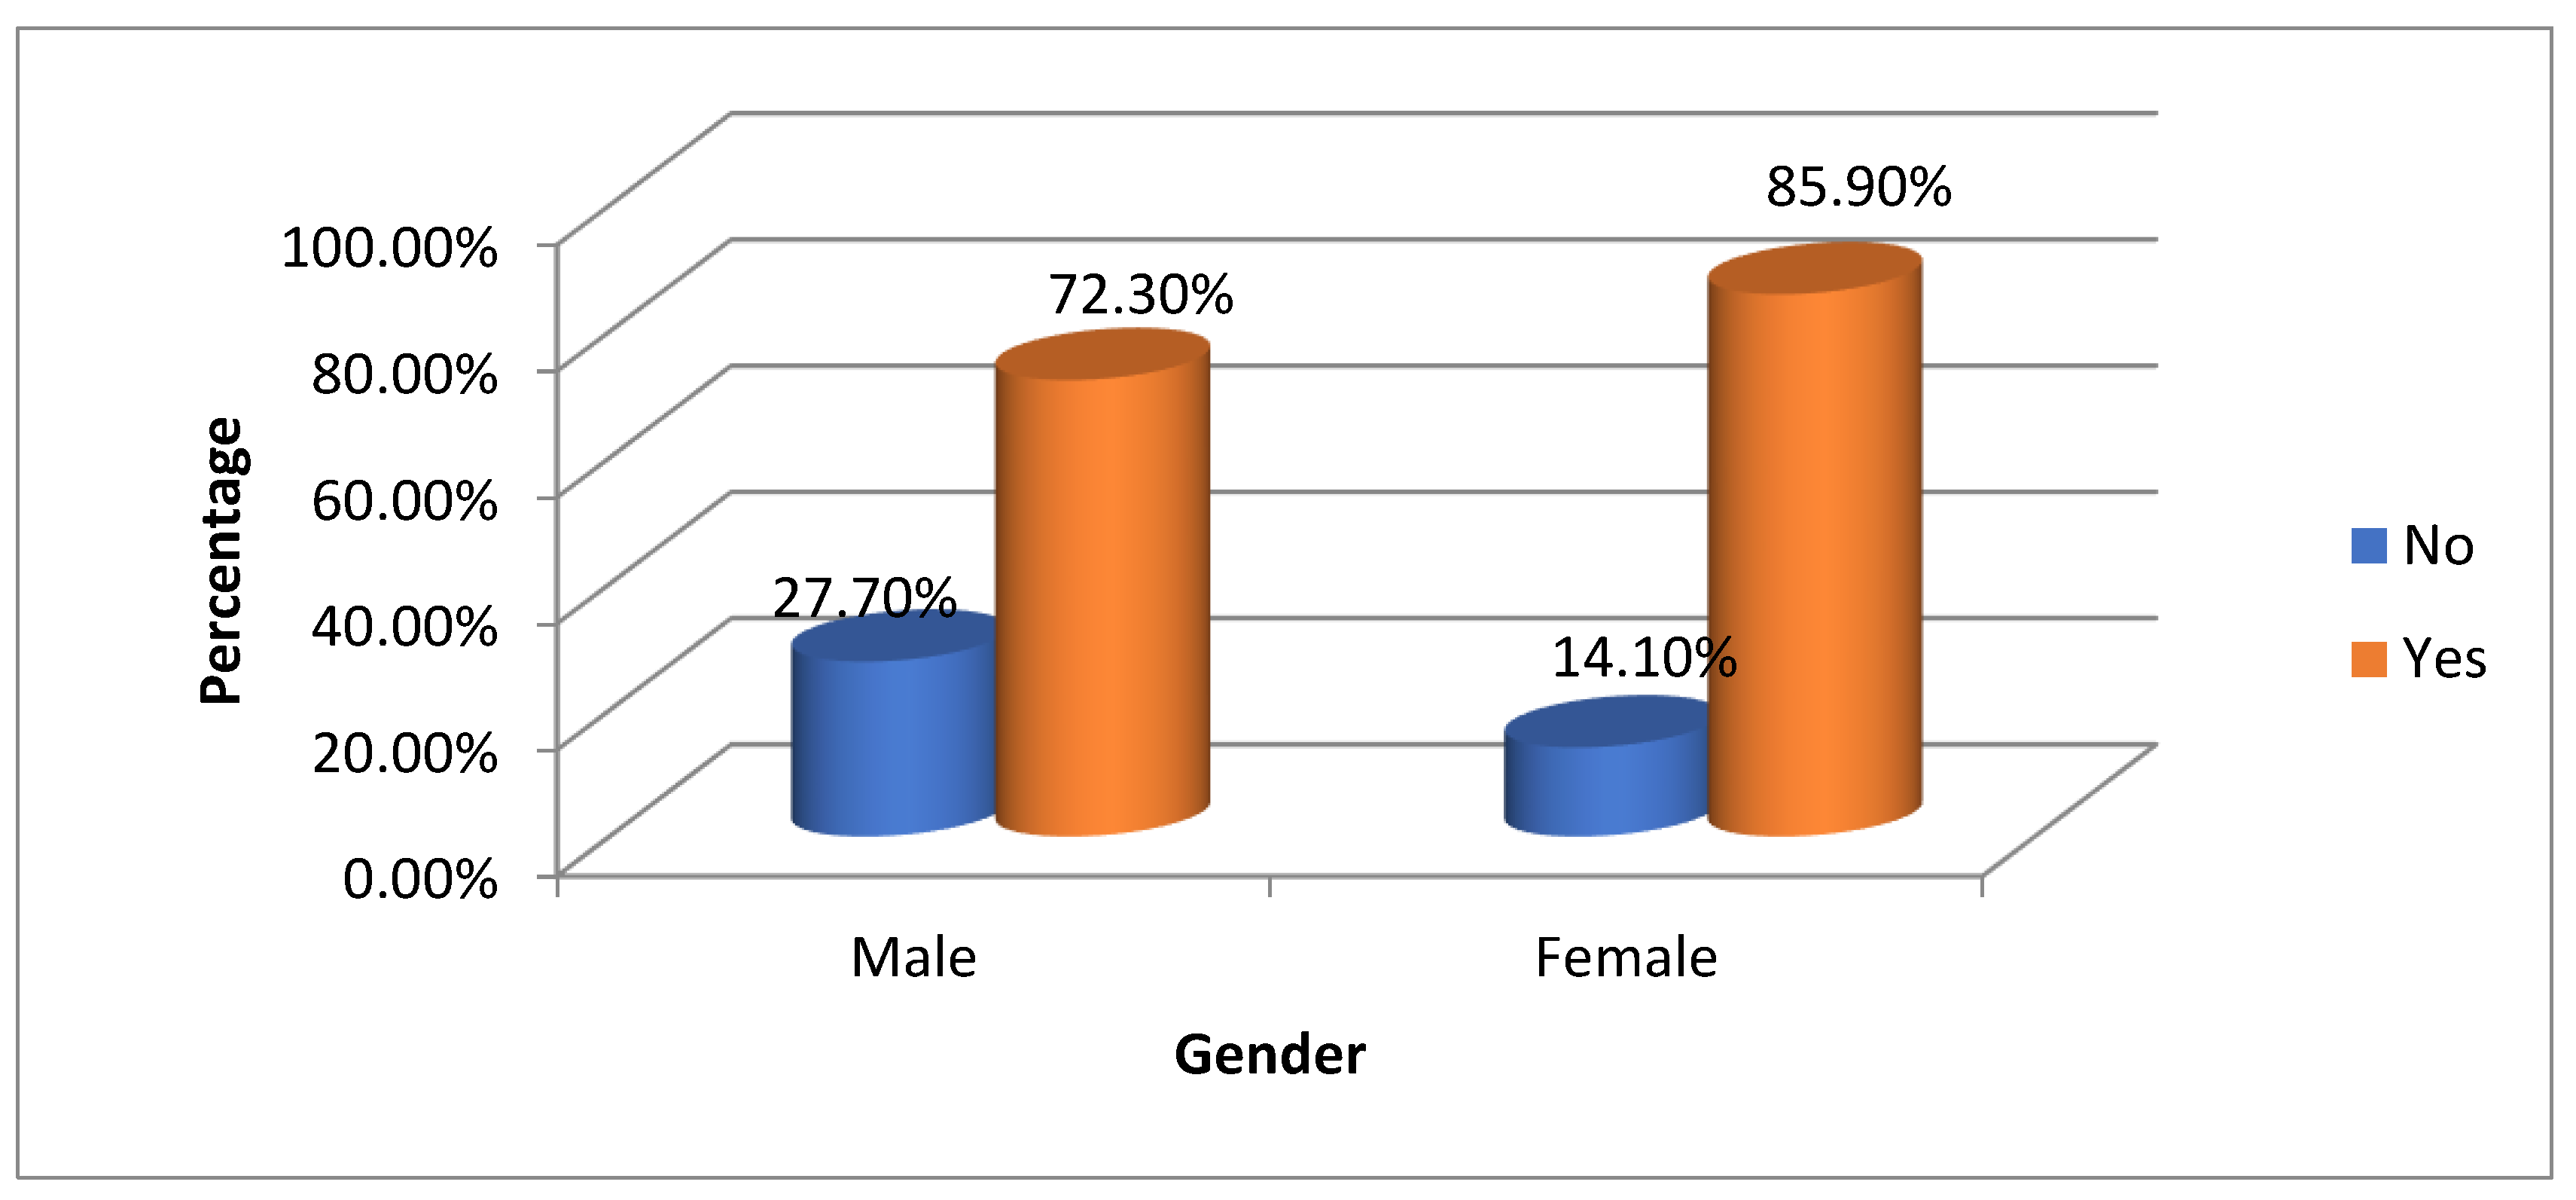
Table 8 and
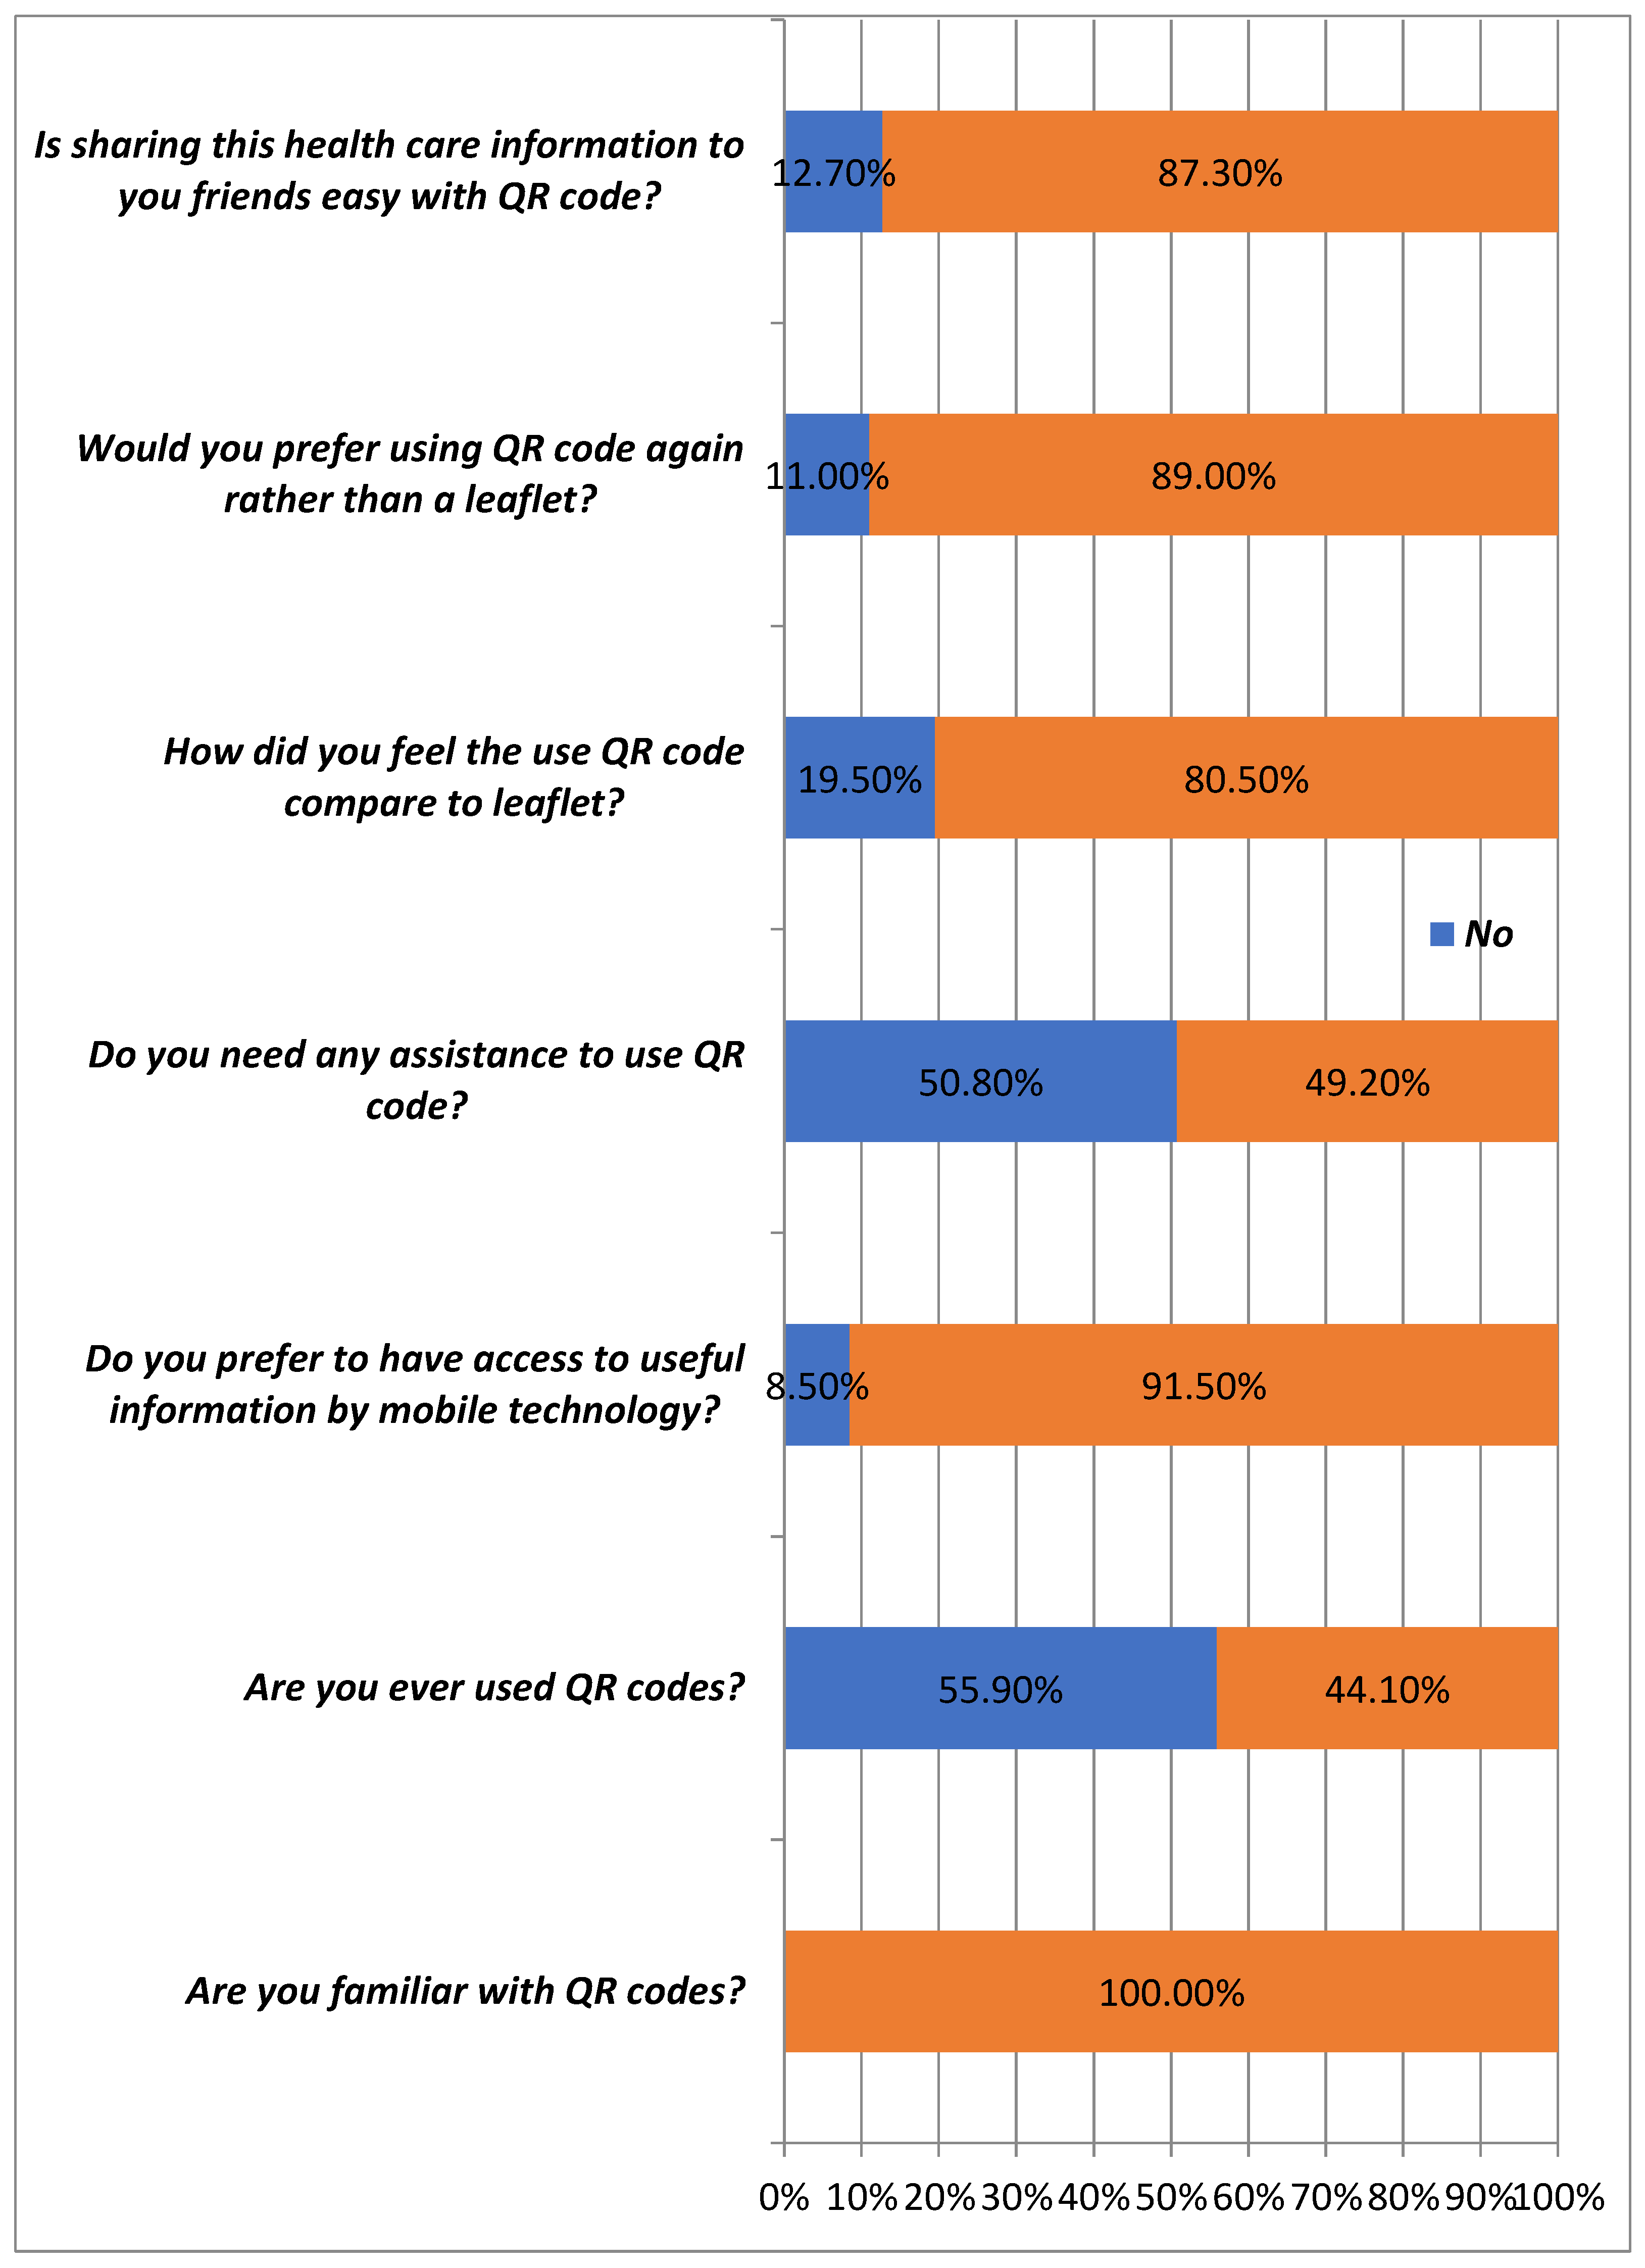
Figure 8 examine perceptions of QR codes versus leaflets by gender. Among males, 72.3% (34) preferred QR codes, while 27.7% (13) did not. In contrast, 85.9% of females (61) preferred QR codes, with 14.1% (10) favoring leaflets. Overall, 80.5% of participants (95) preferred QR codes, while 19.5% (23) did not. The chi-square value is 3.321 with a p-value of 0.068, indicating no significant association between gender and preference (p > 0.05). Although females show a stronger preference for QR codes, the difference is not statistically meaningful. This suggests a general trend toward QR codes without significant gender context distinction.
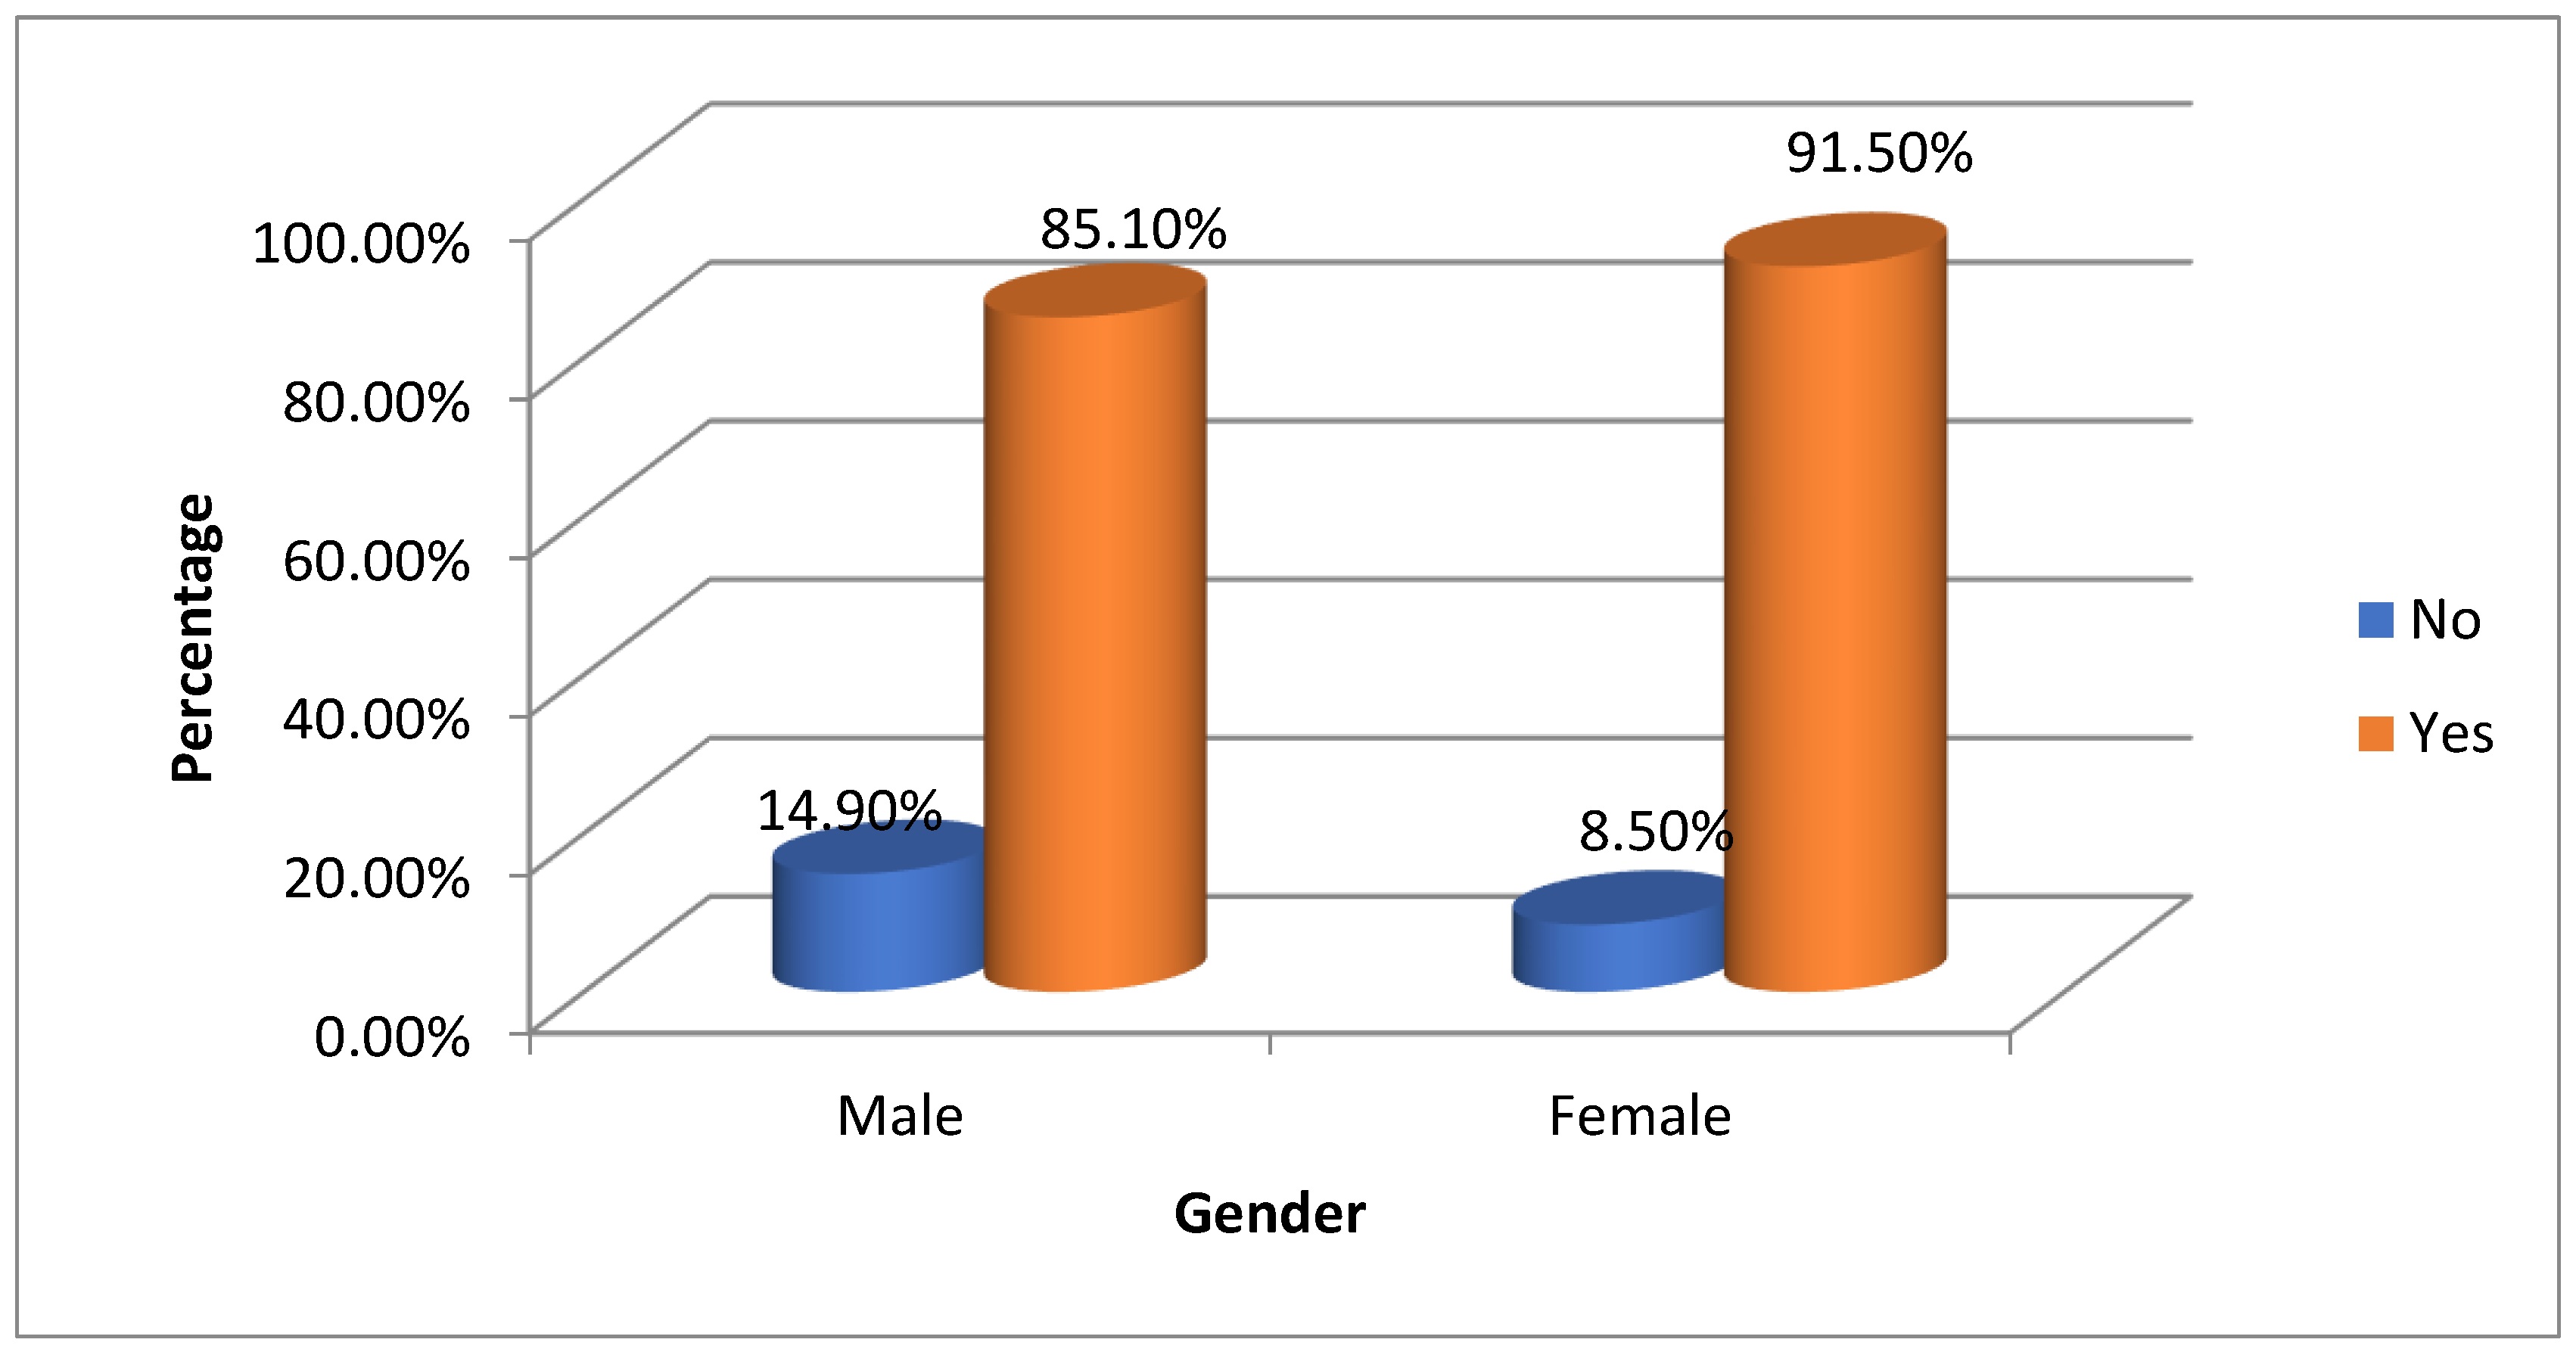
Table 9 and
Figure 9 show participants' preferences for QR codes versus leaflets by gender. Among males, 85.1% (40) preferred QR codes, while 14.9% (7) did not. For females, 91.5% (65) favored QR codes, and 8.5% (6) chose not to. Overall, 89.0% (105) preferred QR codes, compared to 11.0% (13) for leaflets [
Figure 10]. A chi-square test found no significant association between gender and QR code preference (p = 0.274), indicating both genders favor QR codes with minor differences. This highlights QR codes as preferred over traditional leaflets (
Figure 10)
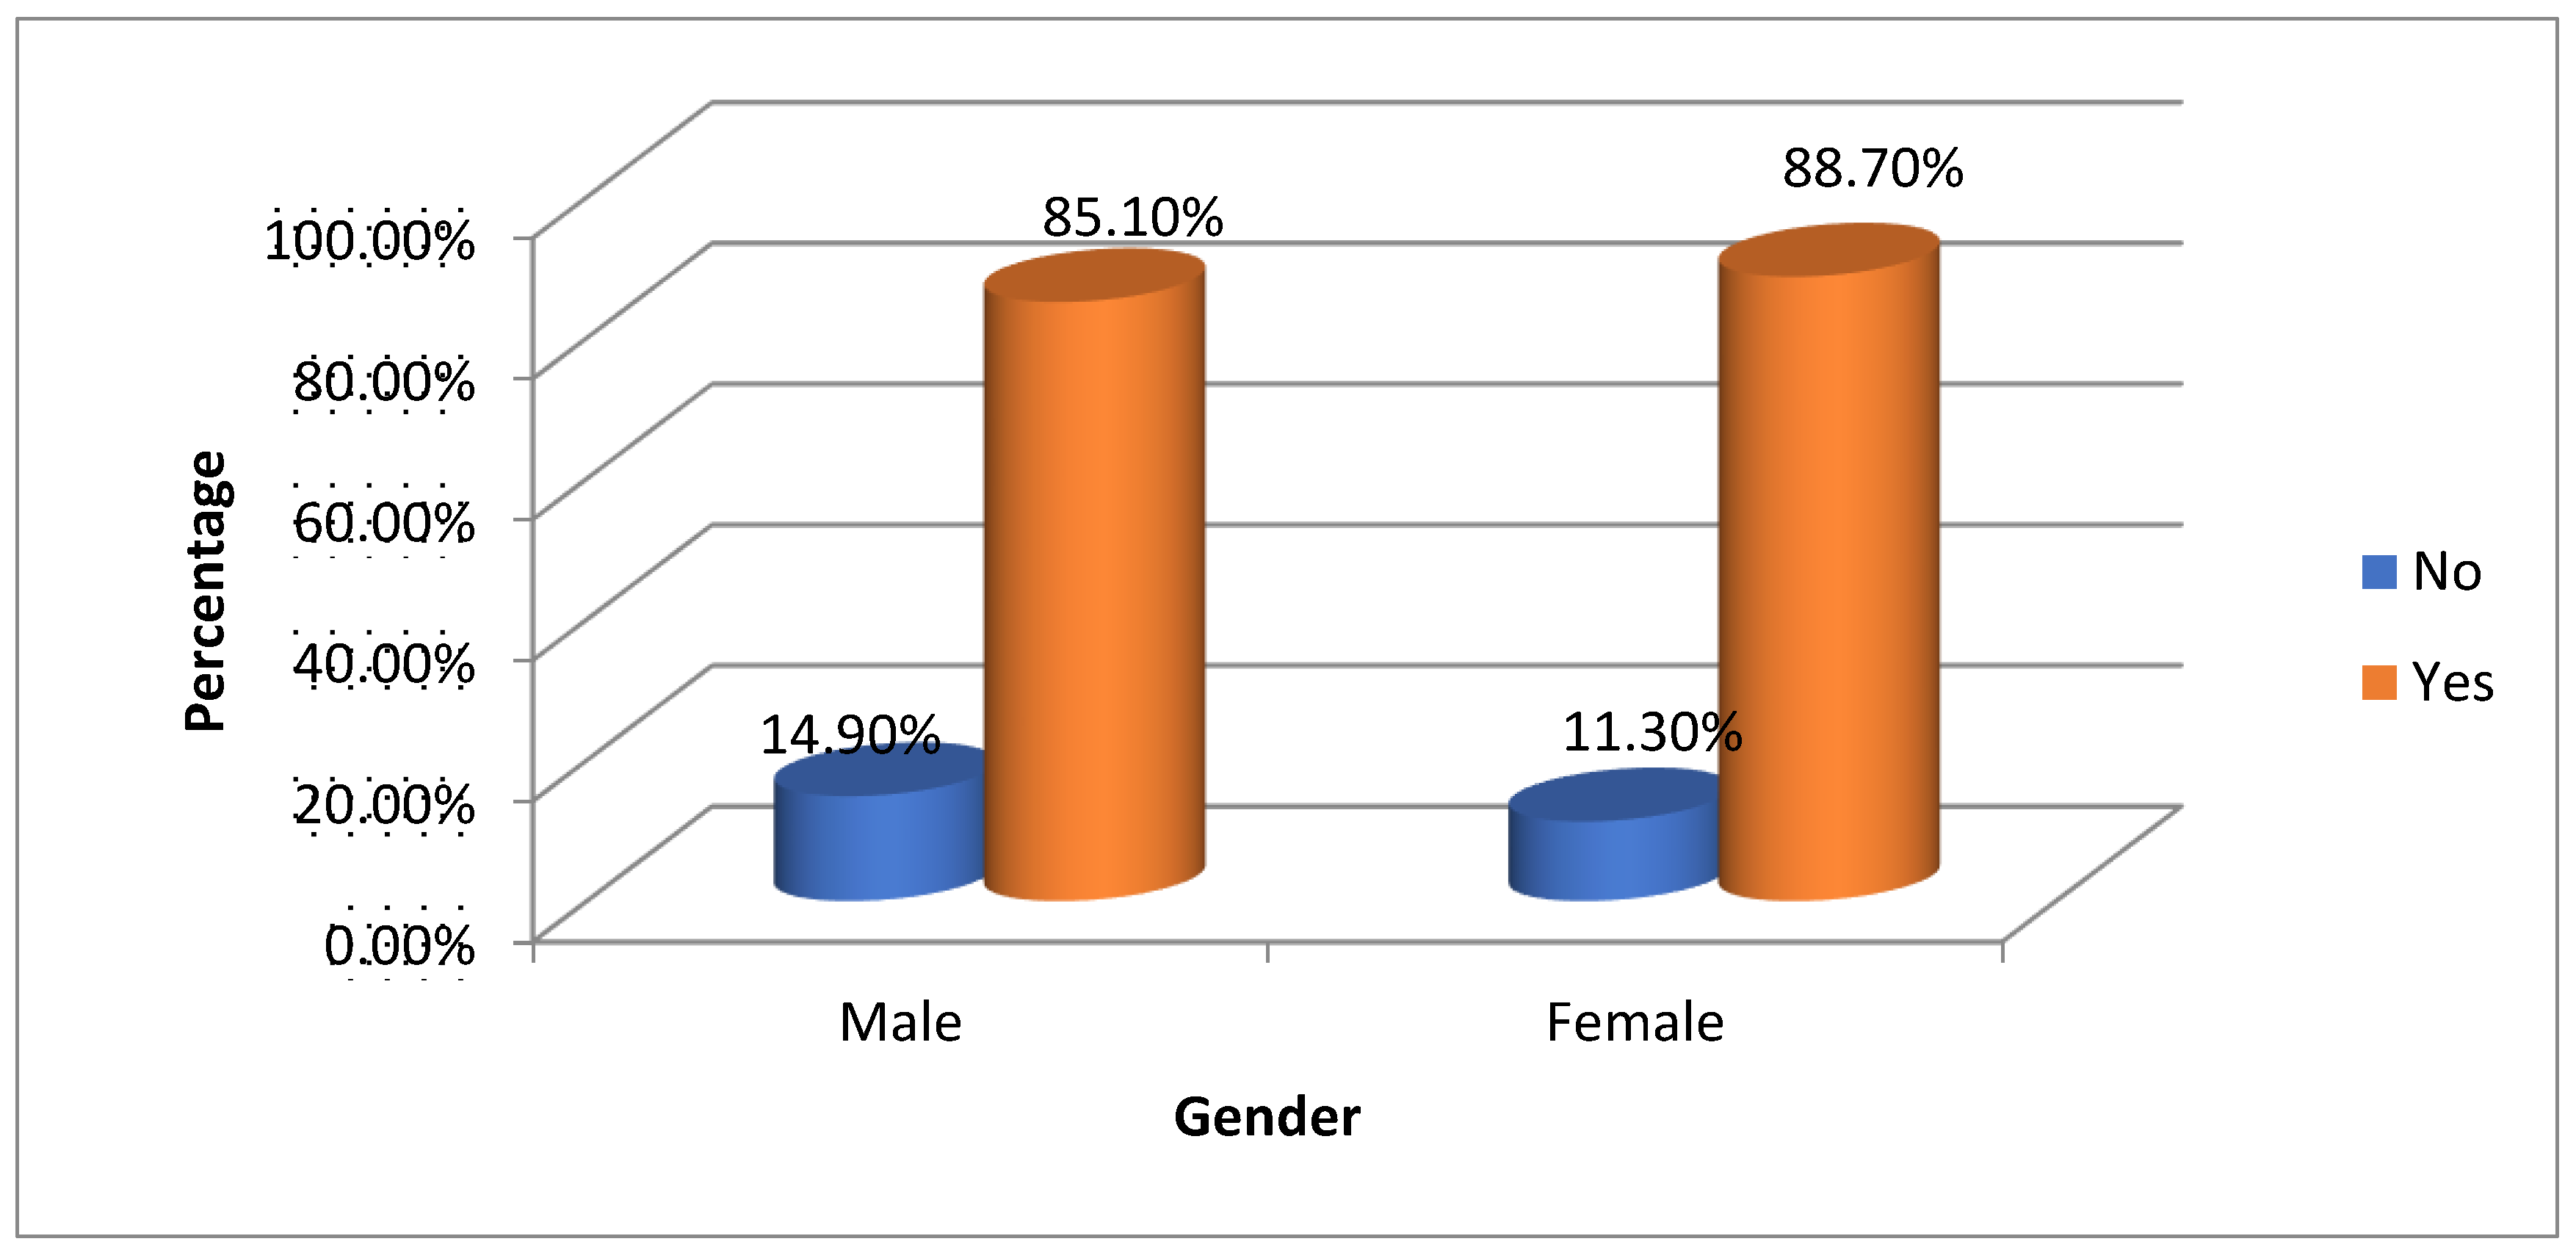
Table 10 and
Figure 10 evaluate the ease of sharing healthcare information via QR codes by gender. Among males, 85.1% (40) found it easy, while 14.9% (7) did not. For females, 88.7% (63) reported ease, with 11.3% (8) finding it challenging. Overall, 87.3% (103) found sharing easy, compared to 12.7% (15) who did not [
Figure 11]. The chi-square test value of 0.335 and p-value of 0.563 show no significant association between gender and the perceived ease of sharing (p > 0.05). This indicates both genders largely agree on QR code convenience for sharing healthcare information, with minor response variations, demonstrating QR codes' effectiveness for information dissemination.
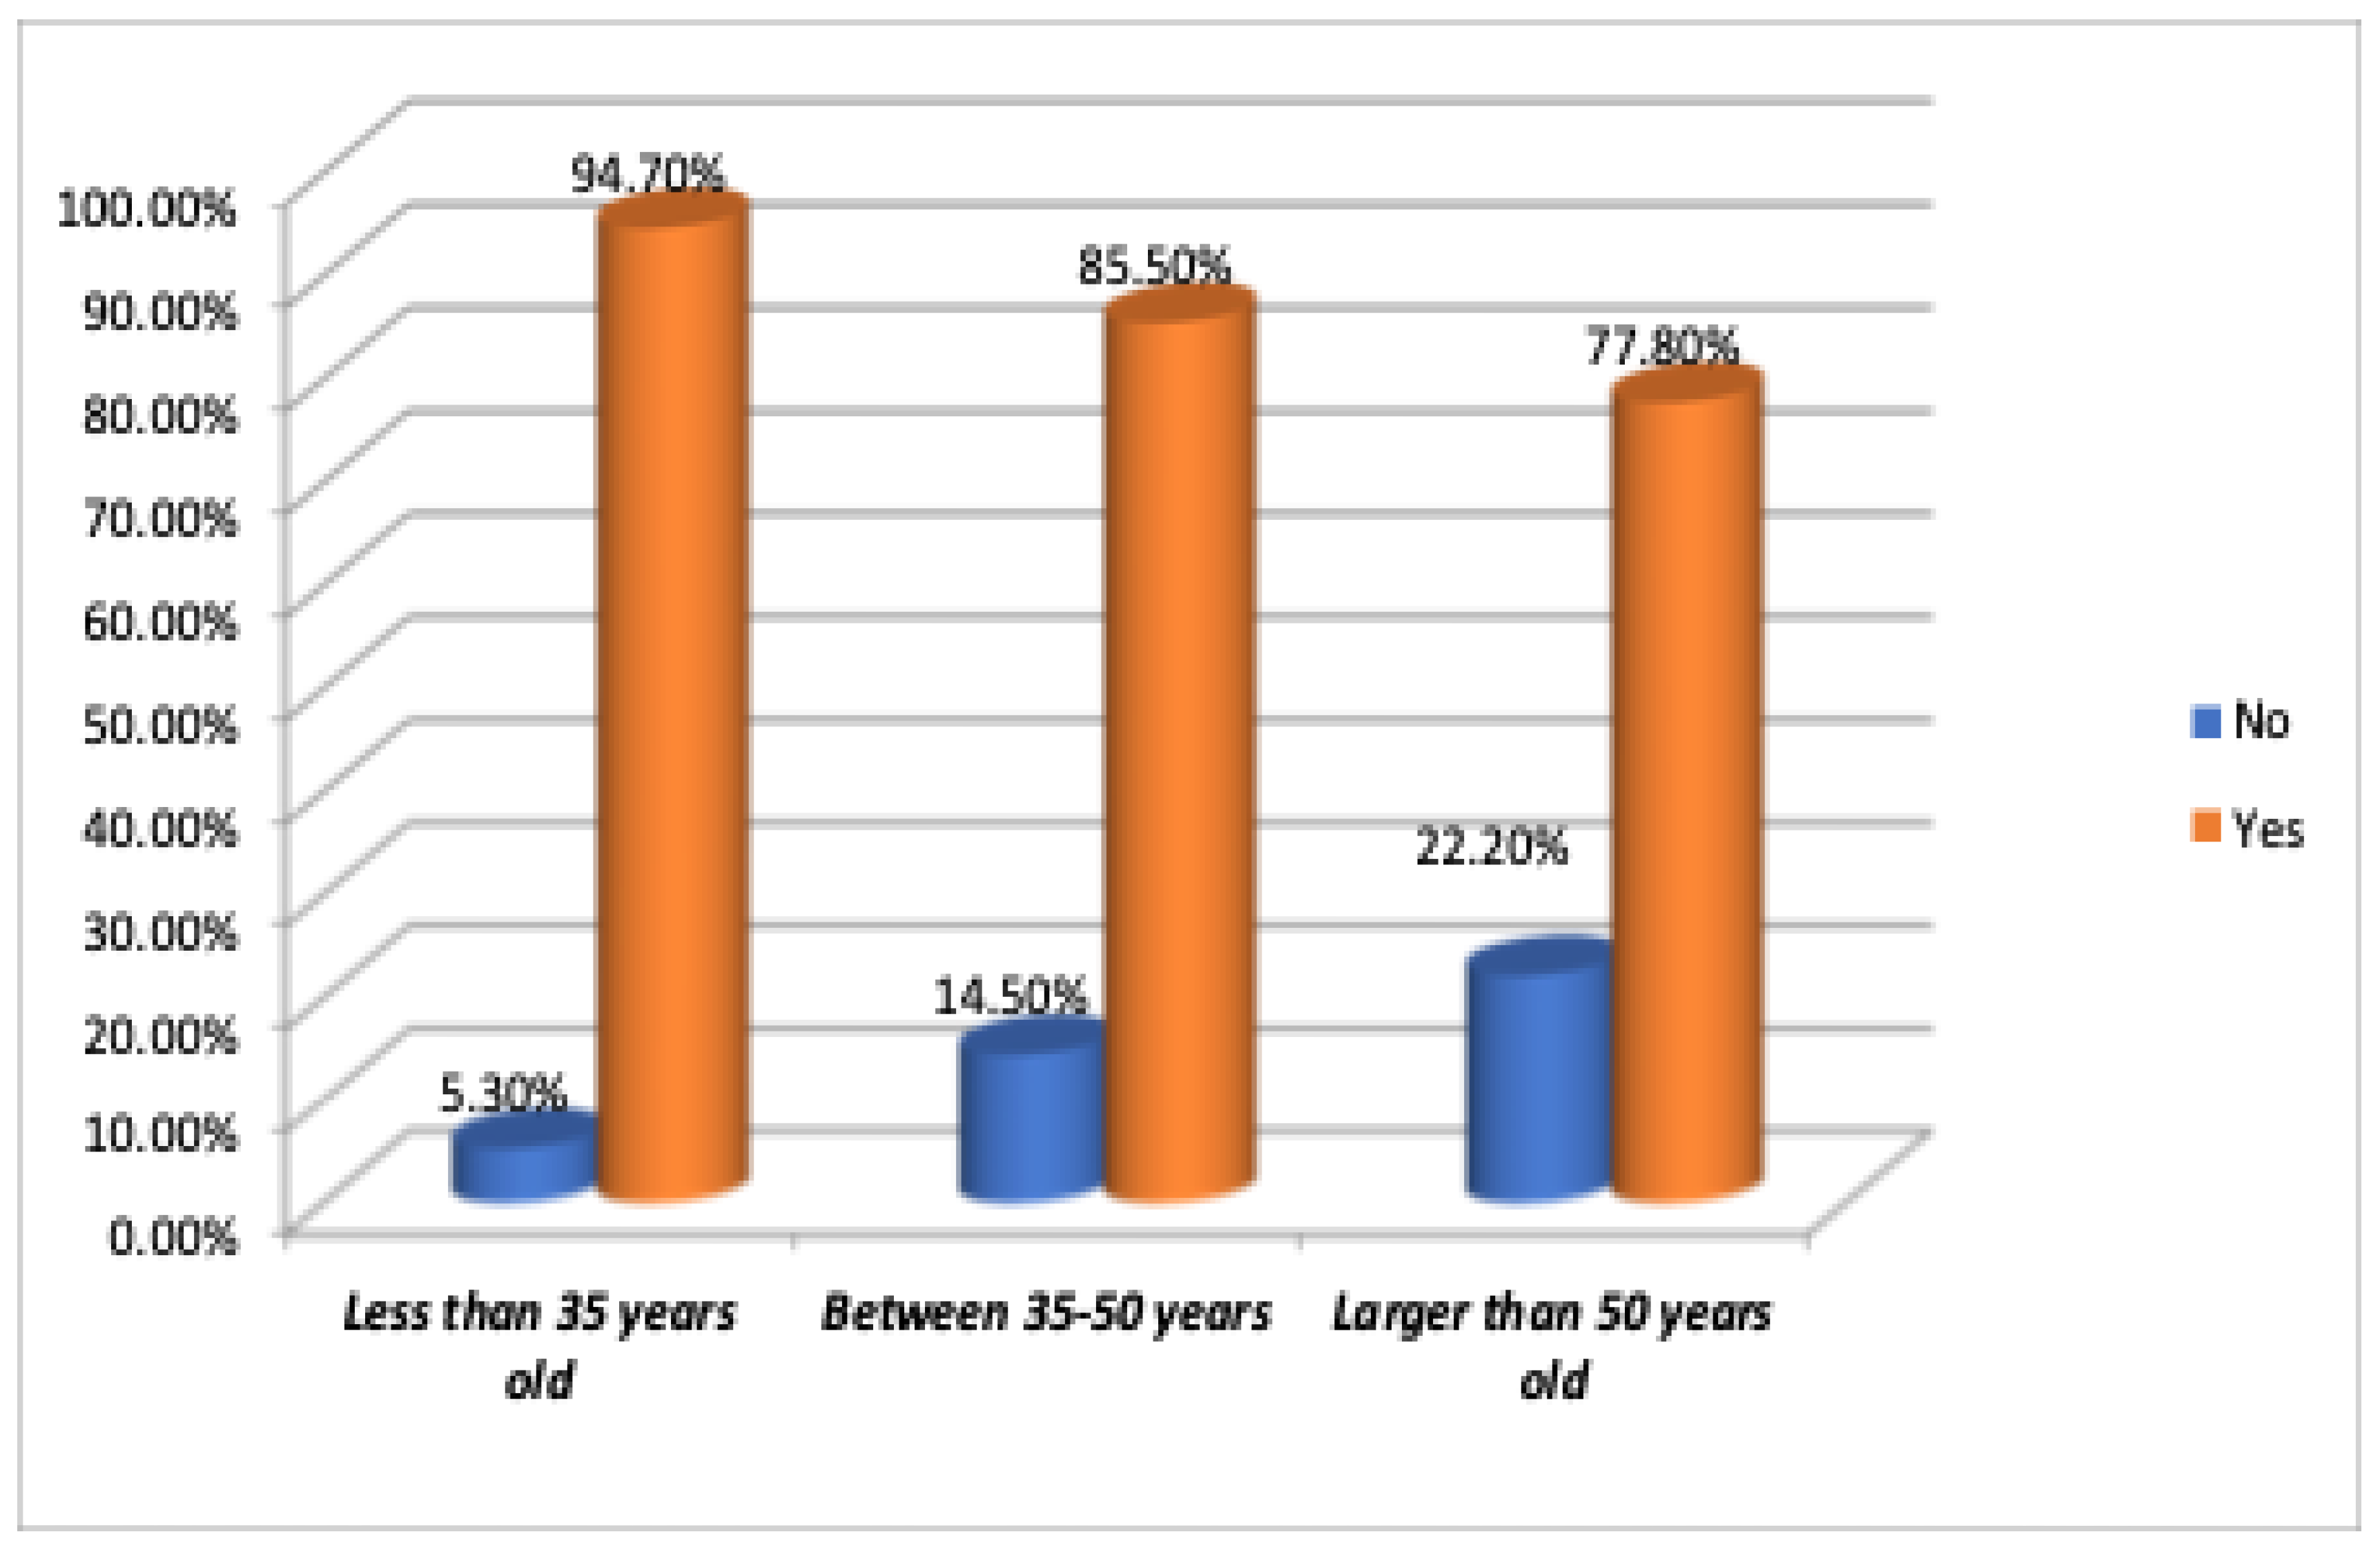
Table 11 and
Figure 11 show that most respondents across all age groups find sharing healthcare information via QR codes easy. Among 118 participants, 87.3% answered "Yes" and 12.7% "No." Specifically, 94.7% of those under 35, 85.5% aged 35-50, and 77.8% over 50 find QR codes easy to use. A chi-square value of 3.549 and a p-value of 0.170 indicate no significant age difference in perceptions of QR code ease. Overall, participants strongly agree that QR codes effectively share healthcare information, regardless of age.
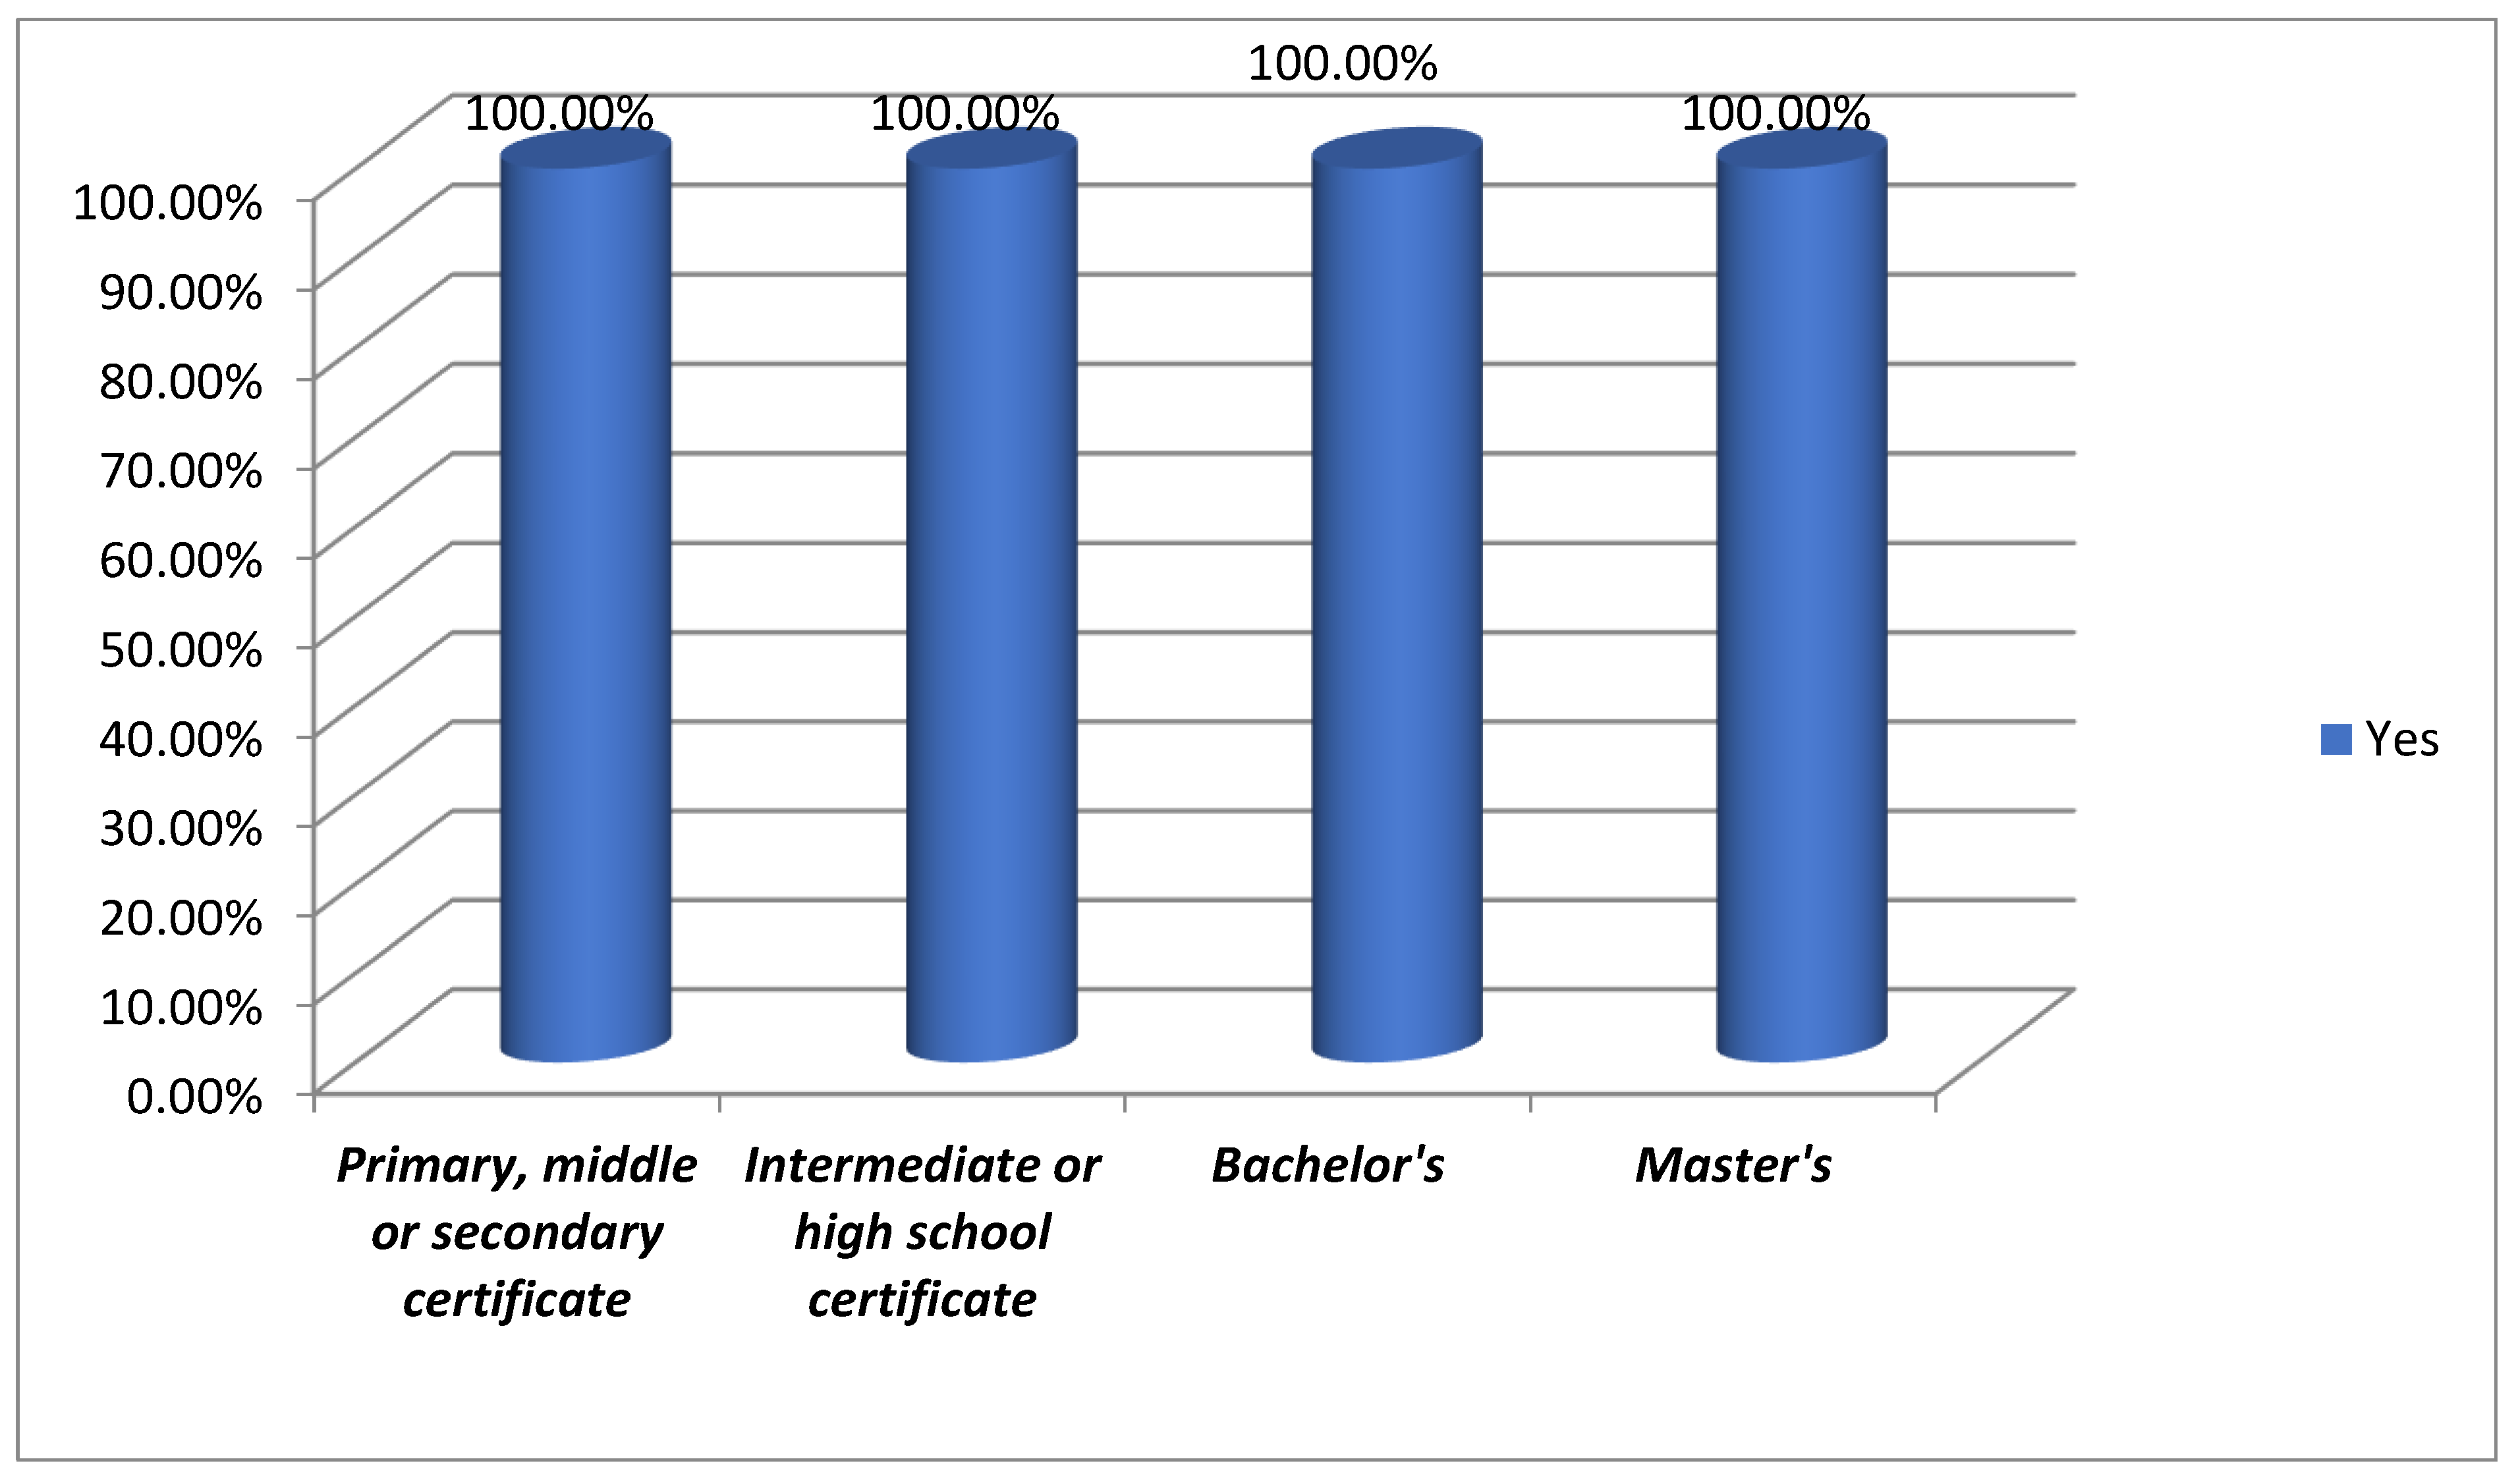
3.1. Familiarity with QR Codes
QR codes are familiar across all education levels. From primary to higher education, individuals recognize QR codes, highlighting their presence in modern life. Notably, respondents with Master’s, Bachelor’s, and intermediate degrees show equal familiarity, indicating that QR codes are a mainstream technology understood across diverse demographics. [
Figure 12 and
Table 12].
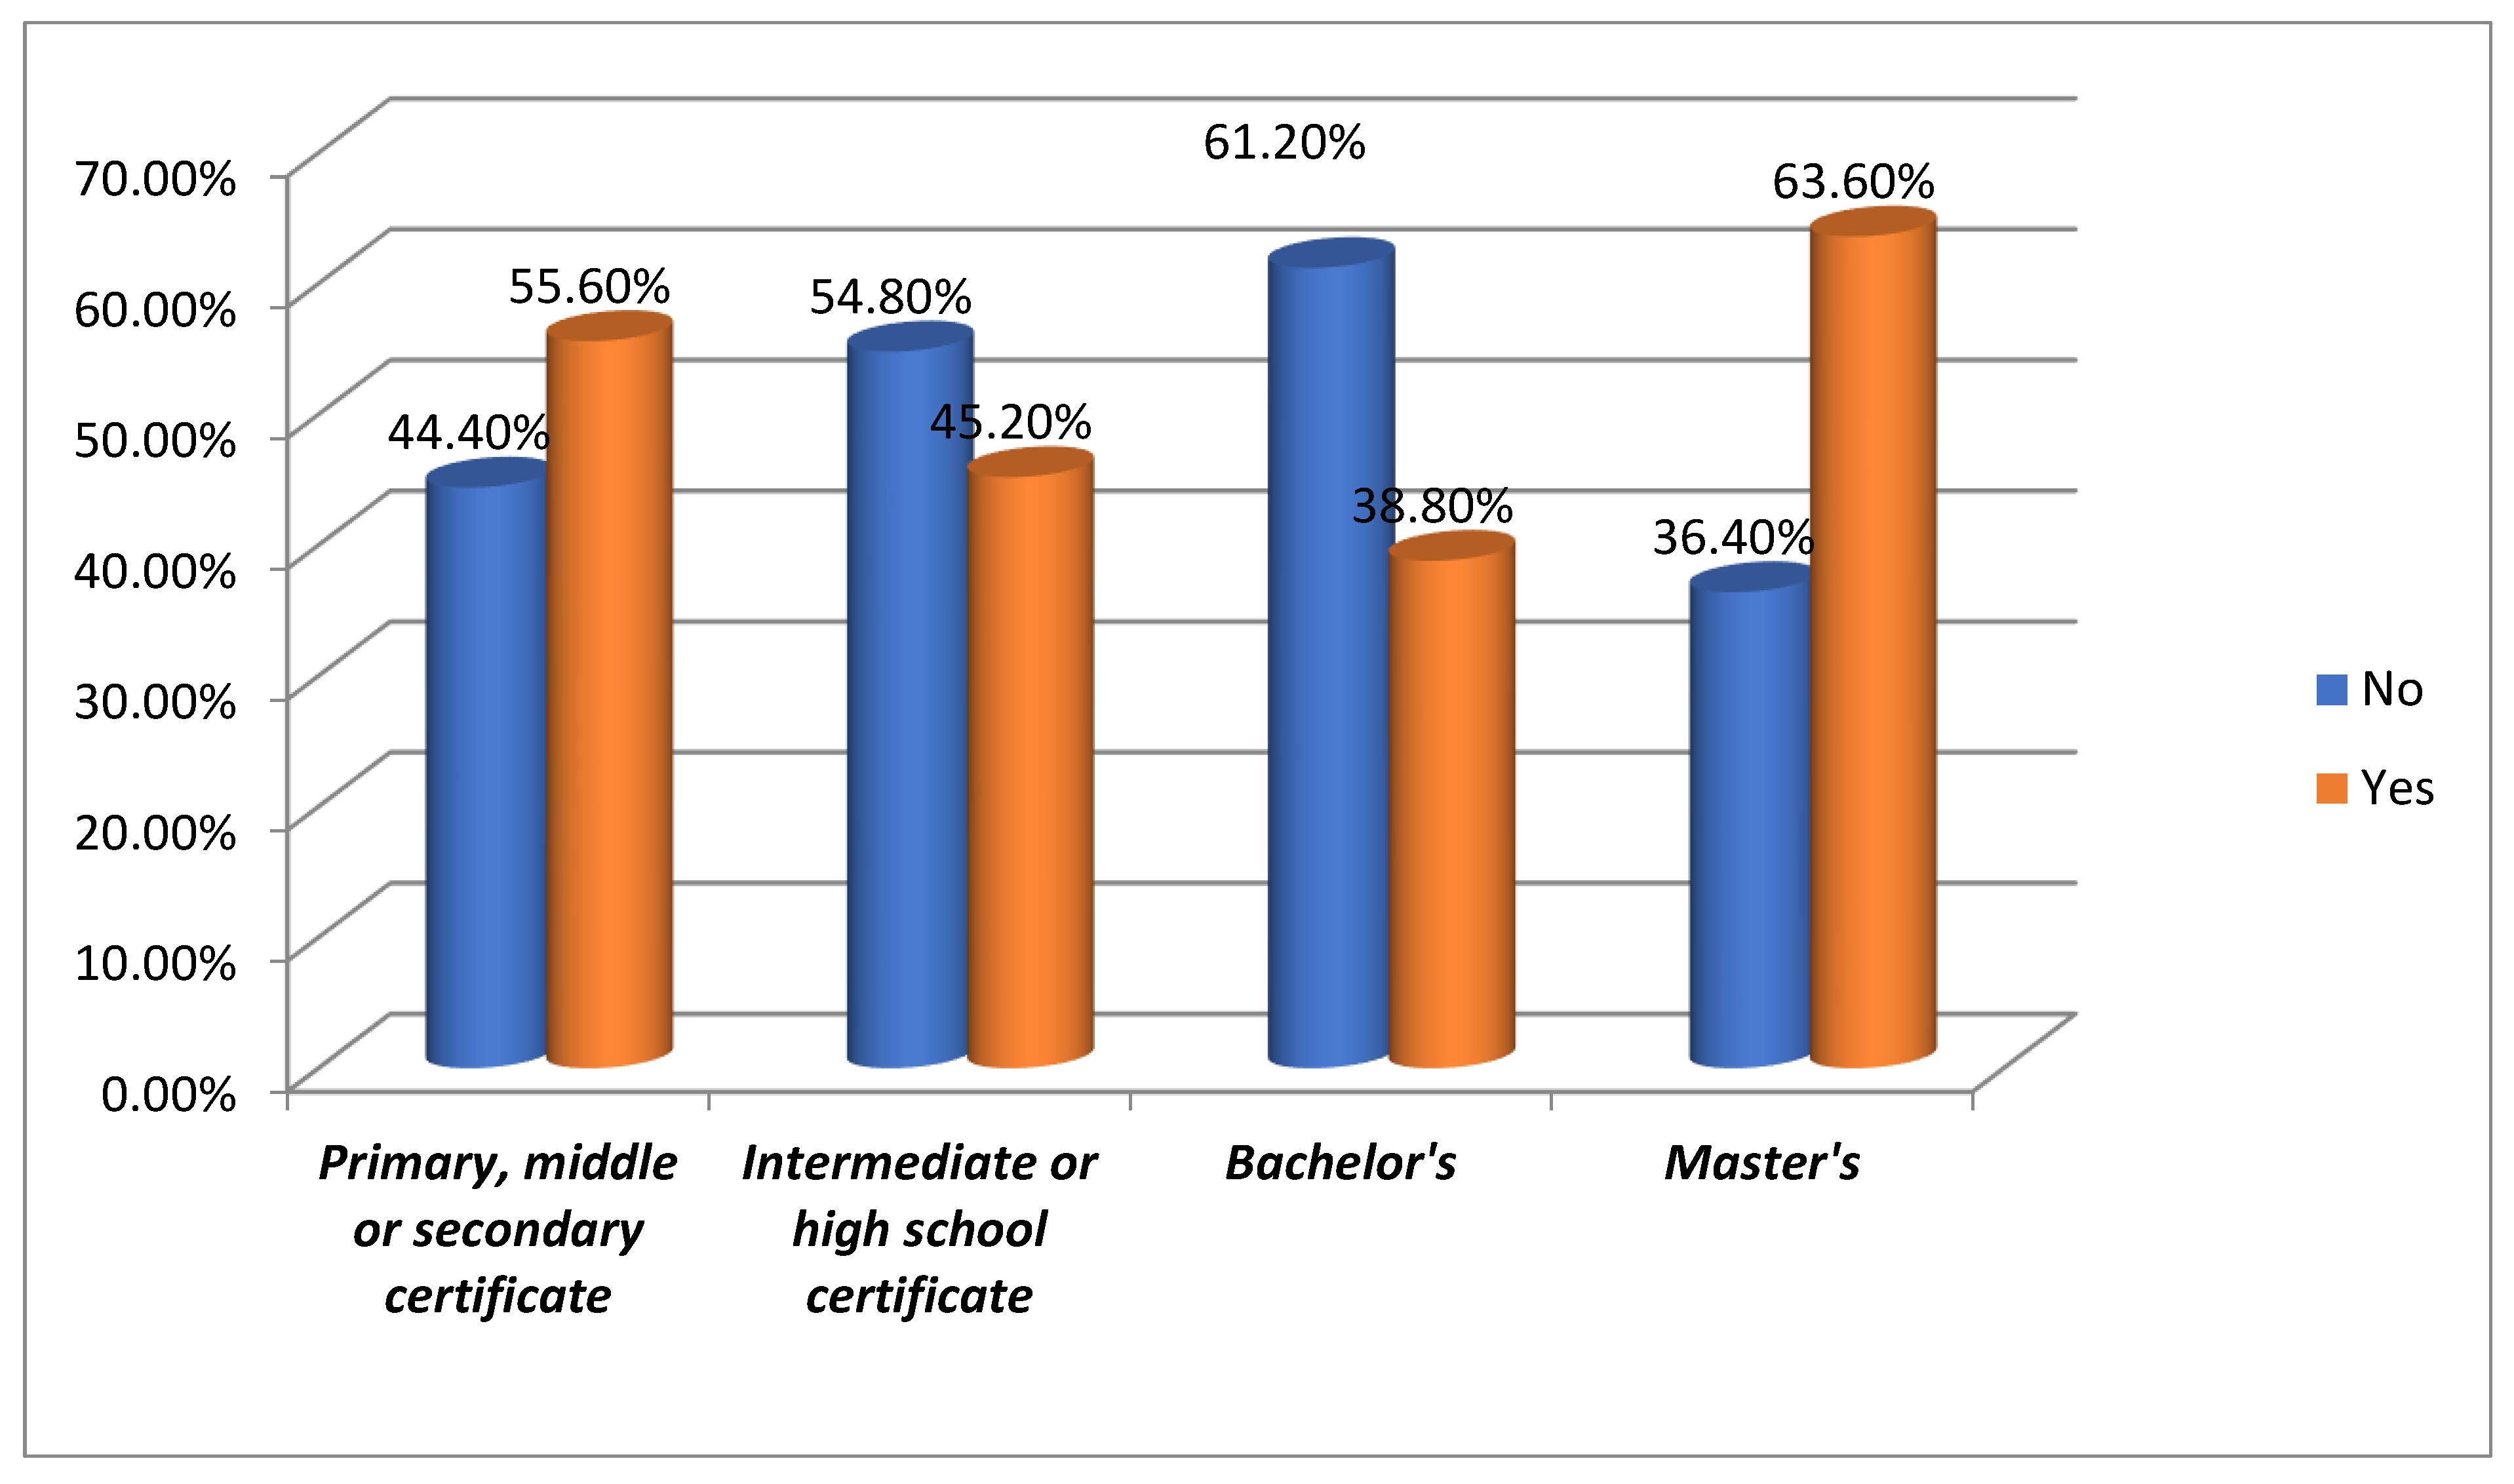
3.1. Usage of QR Codes
The usage of QR codes varies by educational level. In the group with a primary, middle, or secondary certificate, 55.6% used QR codes, but 44.4% did not. This indicates that while QR codes are recognized, actual usage is less prevalent in this group. Among those with an intermediate or high school certificate, 45.2% have used QR codes, with 54.8% not using them. In contrast, respondents with a Bachelor’s degree show a higher rate of non-usage (61.2%), though 38.8% still engage with QR codes. This trend is even more pronounced in the Master’s degree group, where 63.6% have used QR codes, showcasing a higher usage rate in individuals with advanced education. 44.1% of the respondents have used QR codes, and 55.9% have not, indicating a notable gap between familiarity and active usage [
Figure 13 and
Table 12].
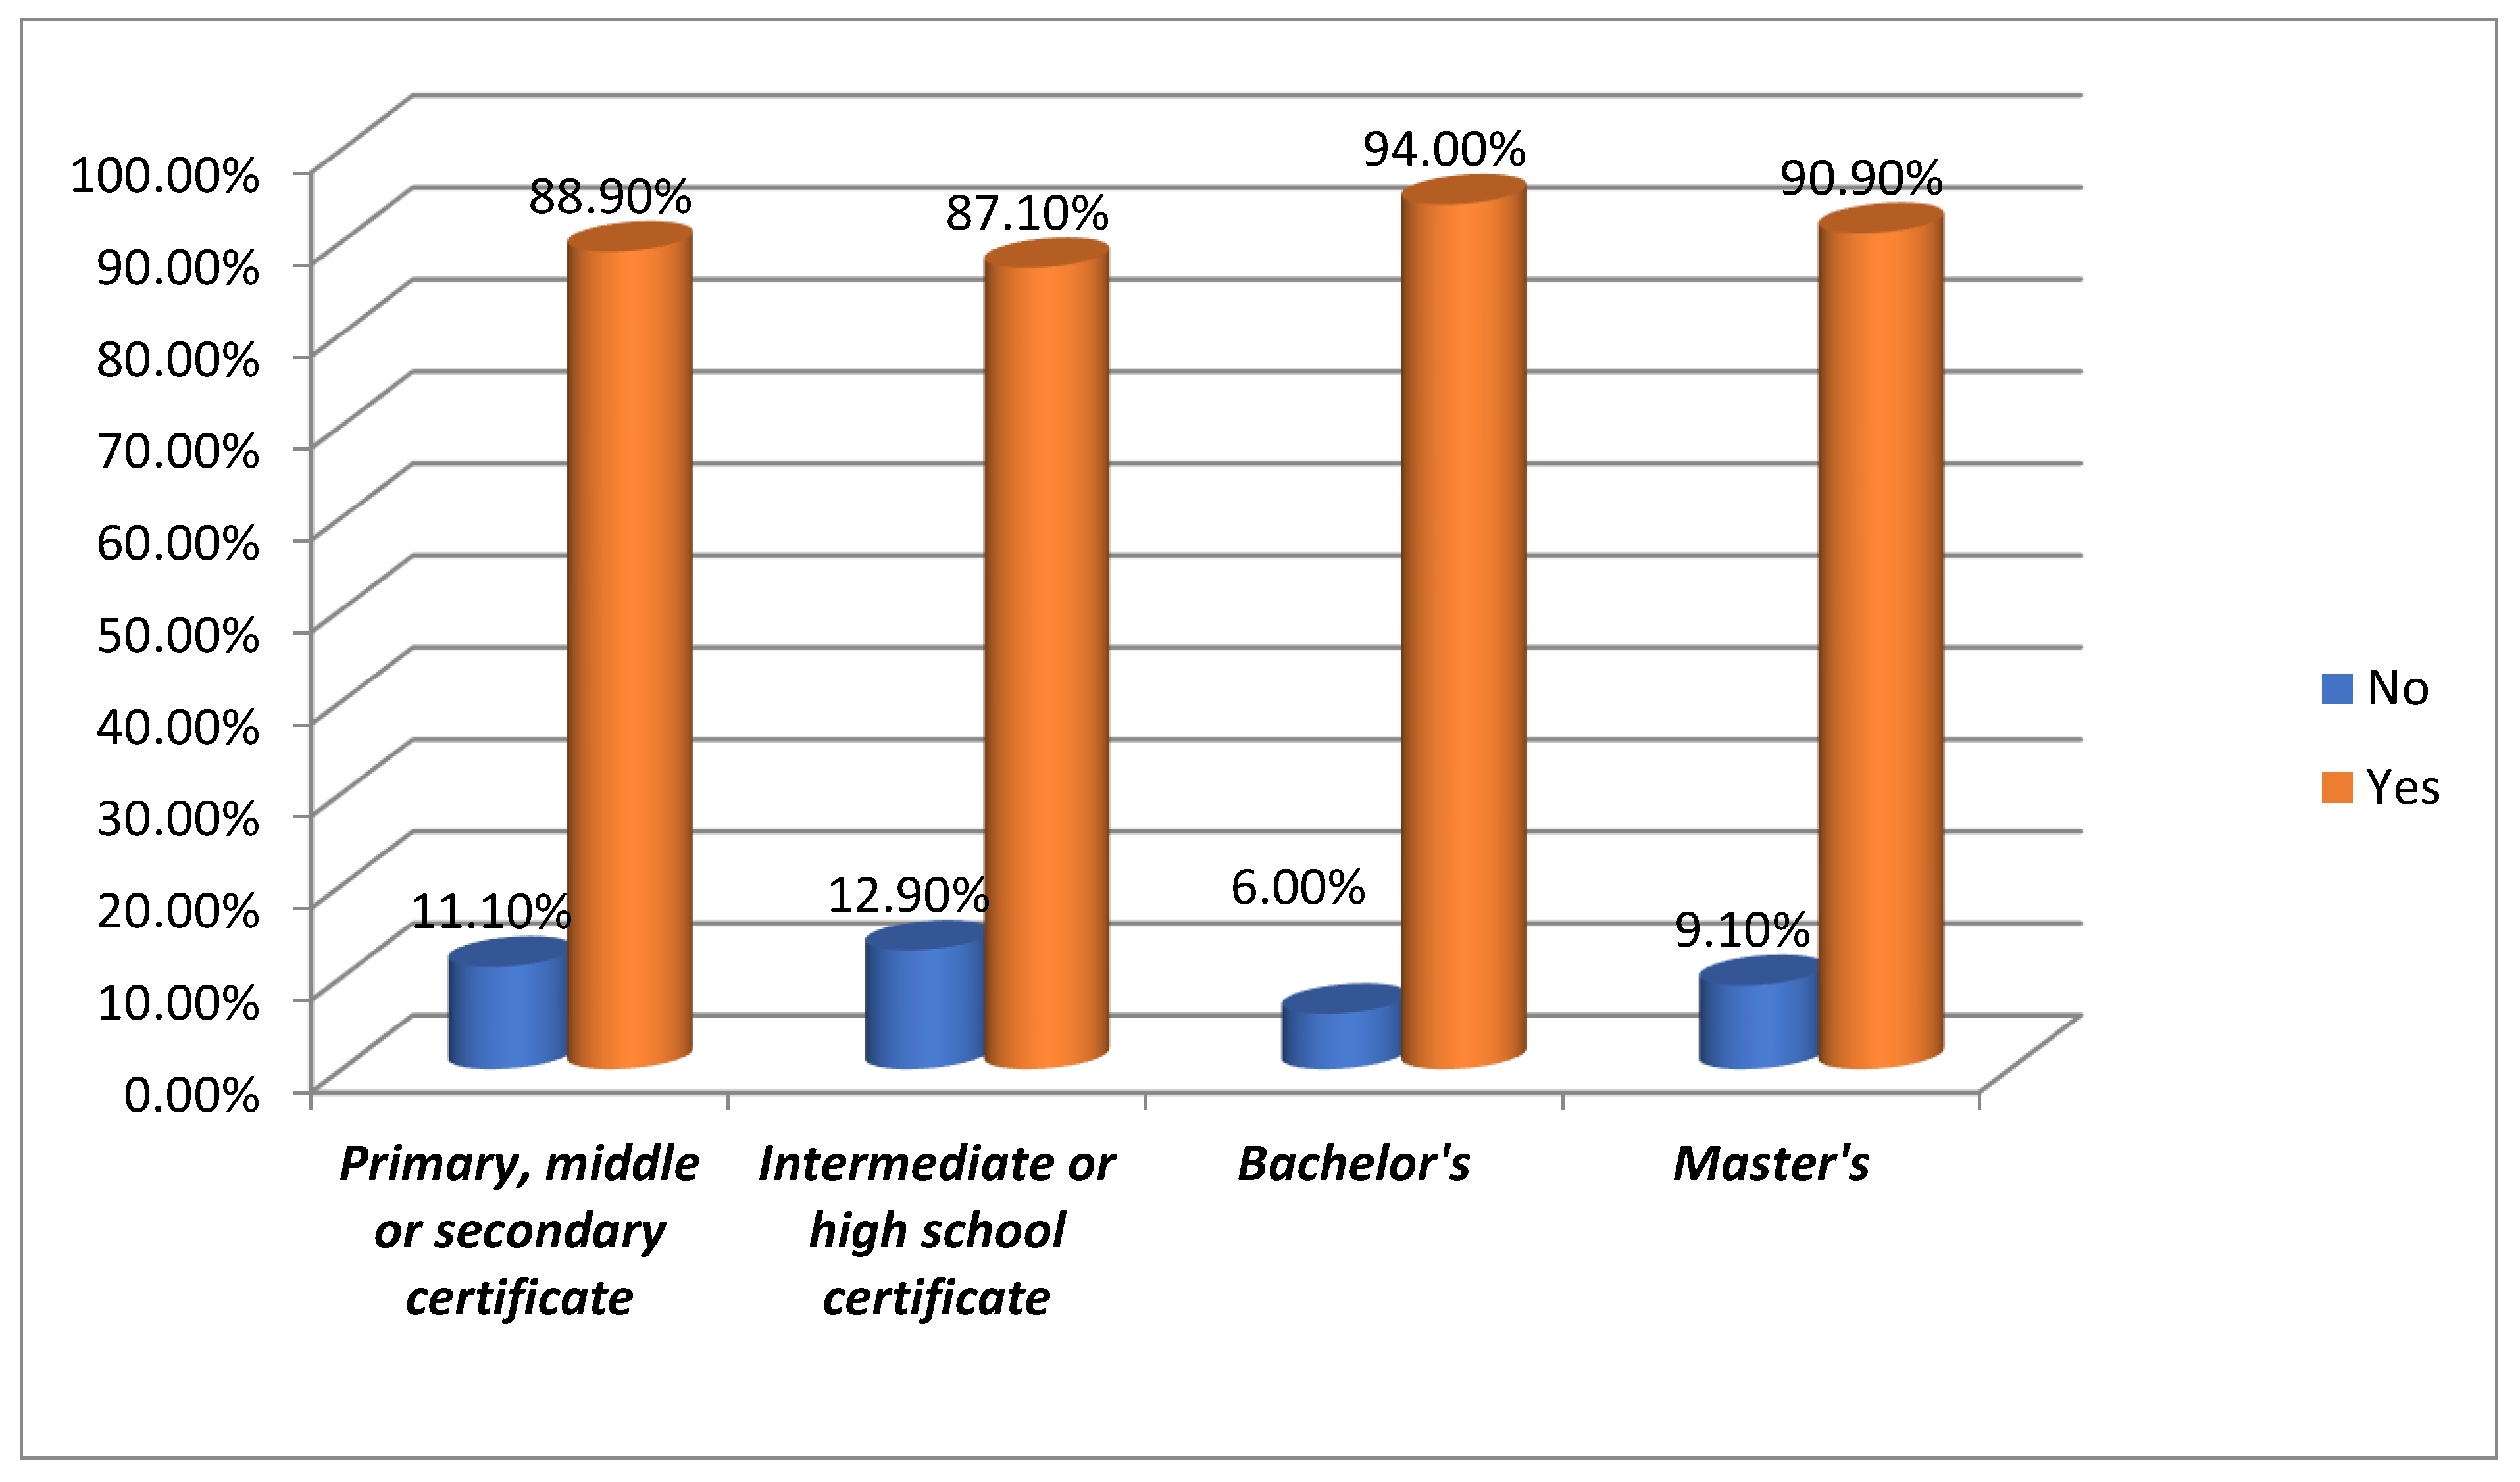
3.3. Preference for Mobile Technology
Mobile technology is highly preferred for accessing information across all education levels. Among those with primary, middle, or secondary certificates, 88.9% favor it. This trend continues with 87.1% of intermediate or high school graduates, 94% of Bachelor’s degree holders, and 90.9% of Master’s alumni. This showcases mobile devices as the top choice for information access in today’s digital age, irrespective of education level. [
Figure 14 and
Table 12 ]
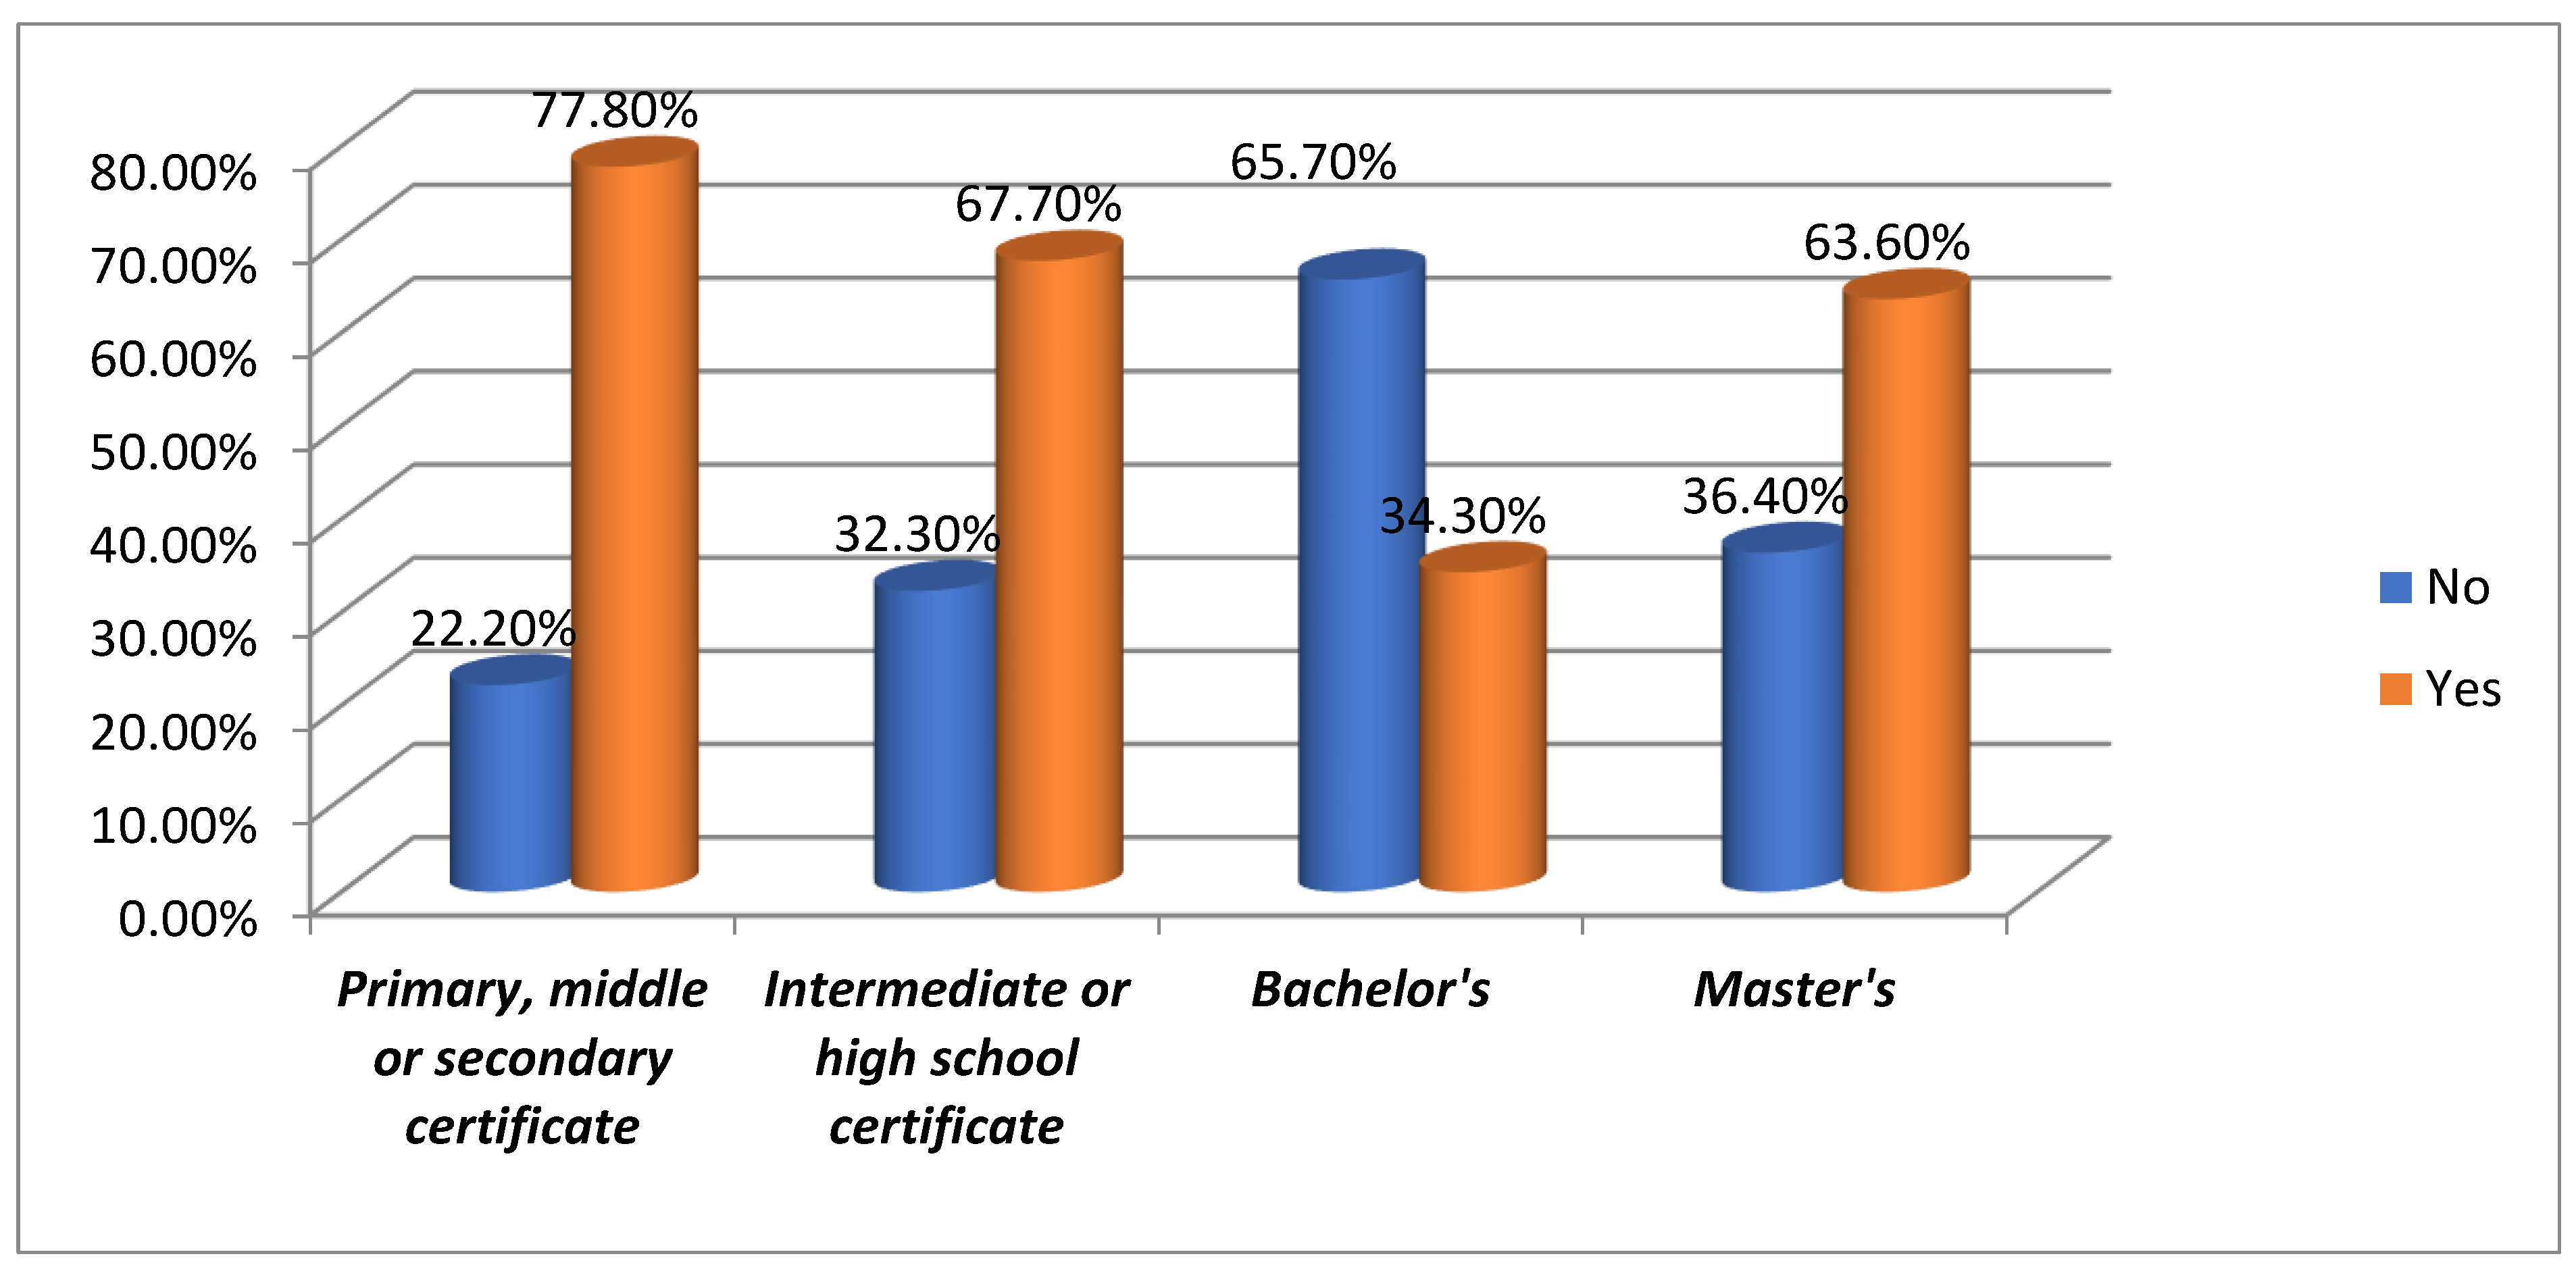
3.4. Need for Assistance to Use QR Codes
Most respondents reported not needing assistance with QR codes. In the primary, middle, and secondary certificate groups, 77.8% are comfortable using them. The intermediate or high school group is close behind at 67.7%. Among Bachelor’s degree holders, 65.7% can use QR codes independently, while 63.6% of Master’s degree holders show similar autonomy. Overall, 49.2% of participants can use QR codes without help, indicating they have become intuitive for many. [
Figure 15 and
Table 12].
(Responses: 'Yes' = assistance required, 'No' = no assistance required)".
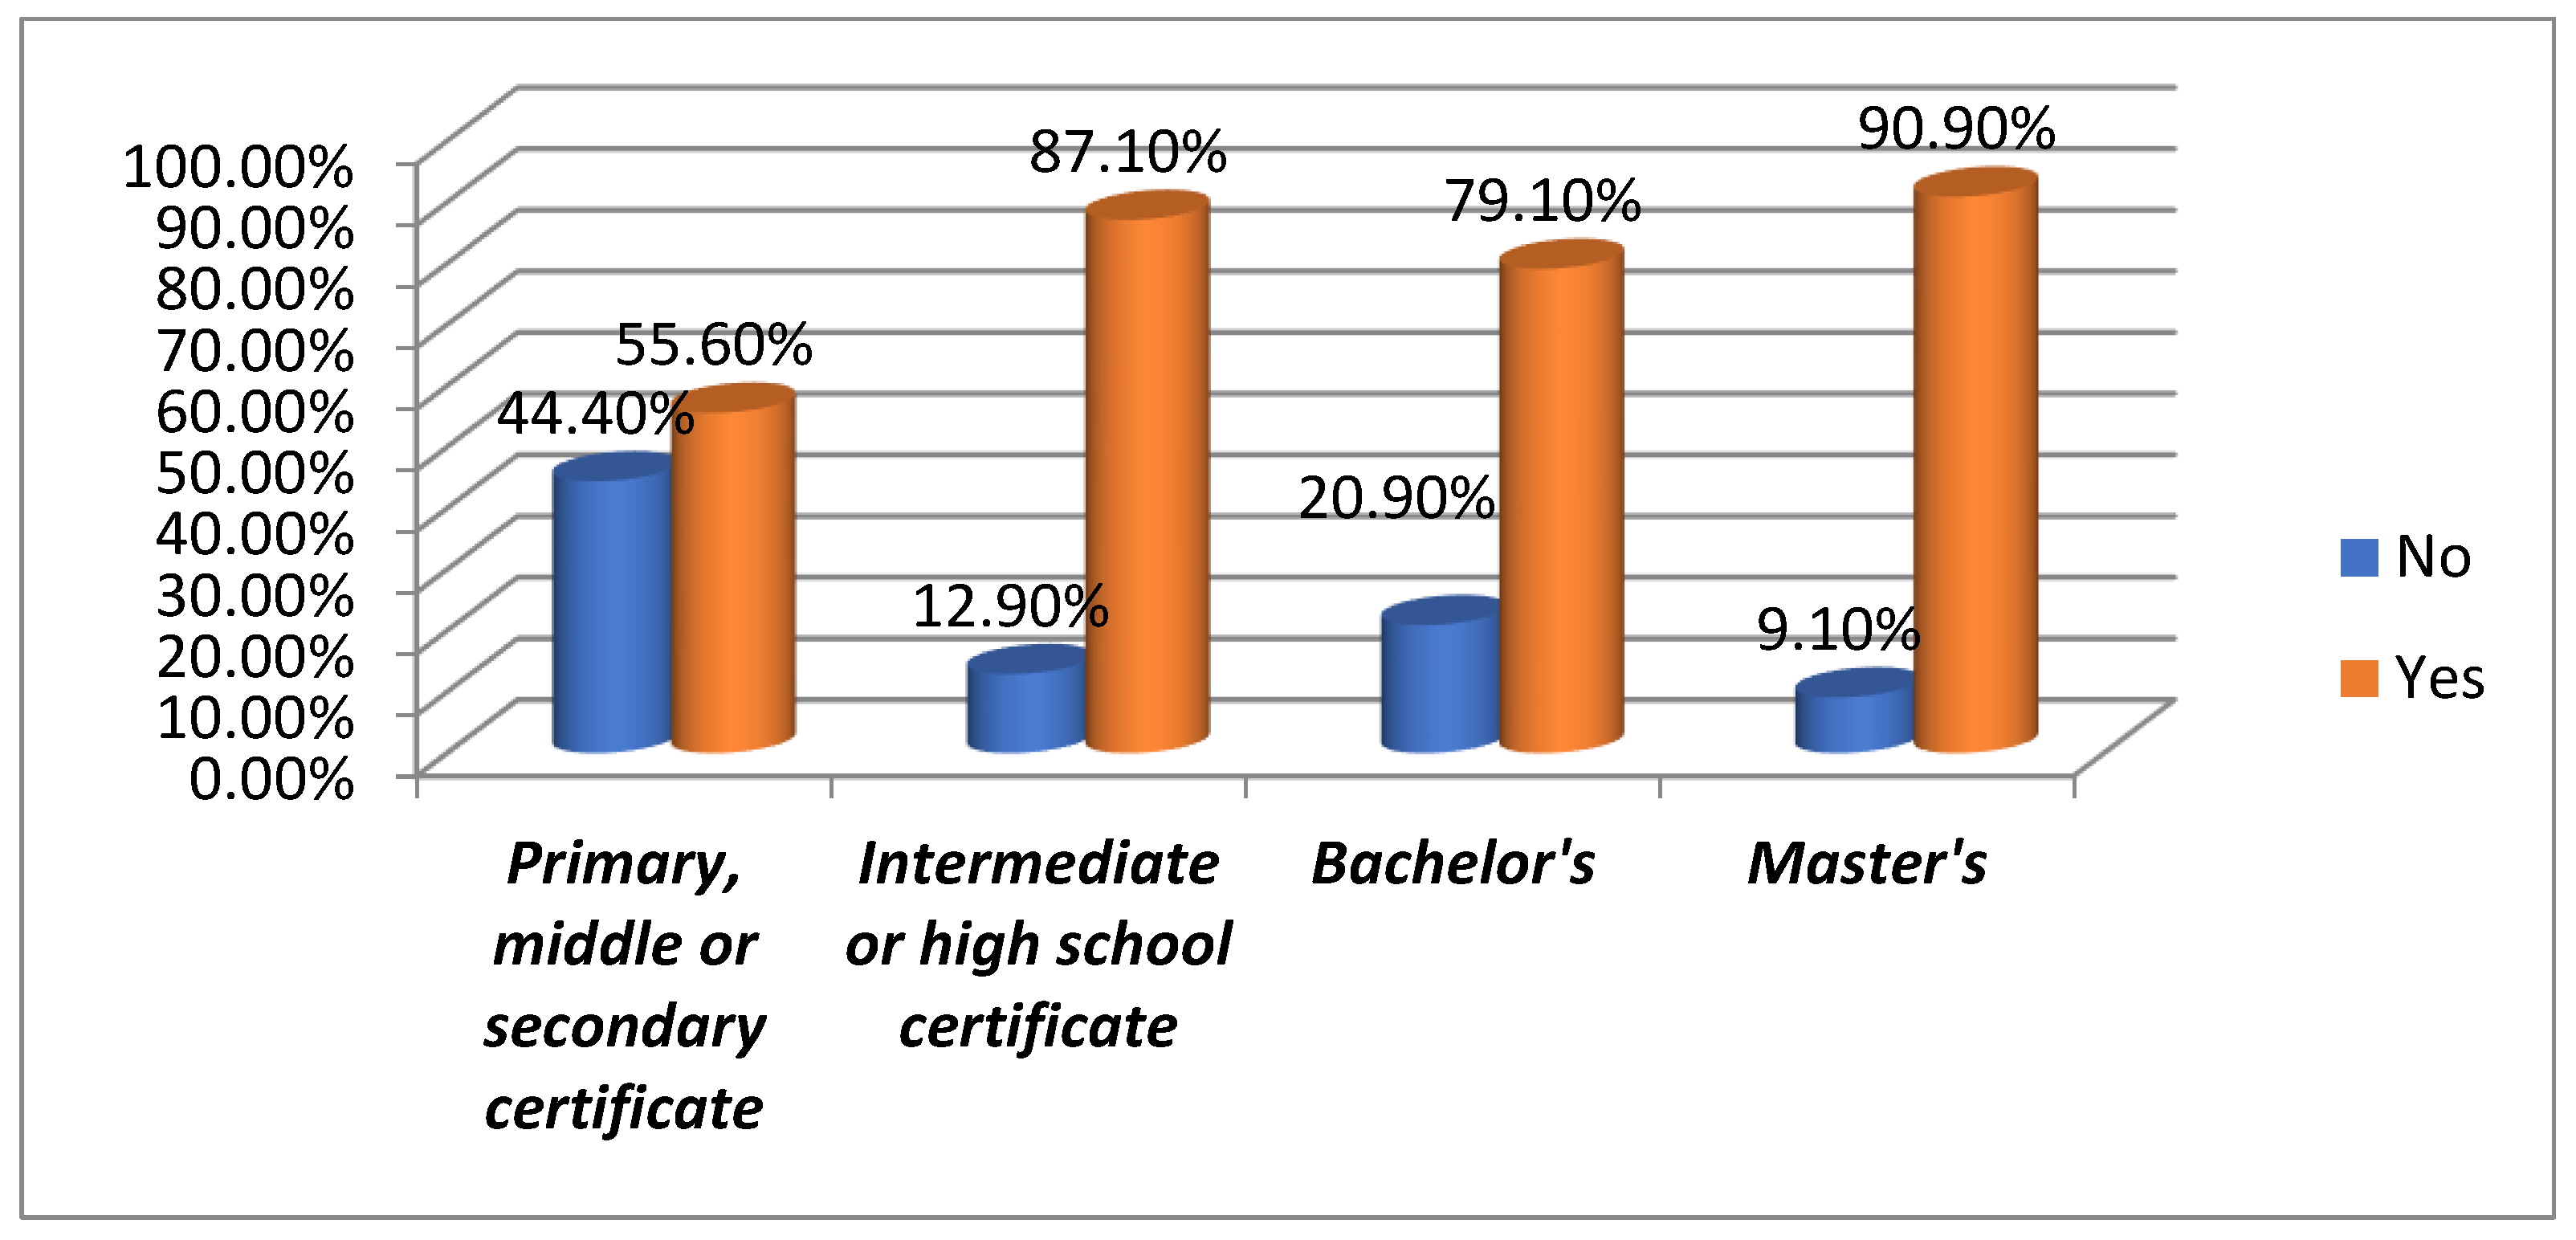
3.5. Comparison to Leaflets
When comparing QR codes to traditional leaflets, a noticeable preference is observed for QR codes, especially among the intermediate or high school certificate group, where 87.1% prefer QR codes over leaflets. Bachelor’s degree holders also strongly preferred QR codes at 79.1%, and Master’s degree holders showed a higher preference at 90.9%. Even in the primary, middle, or secondary certificate group, 55.6% favor QR codes, although a smaller proportion (44.4%) still prefer leaflets. Overall, 80.5% of all participants prefer QR codes over leaflets, indicating that QR codes are increasingly more efficient, accessible, and convenient for accessing information than traditional printed materials. [
Figure 16 and
Table 12].
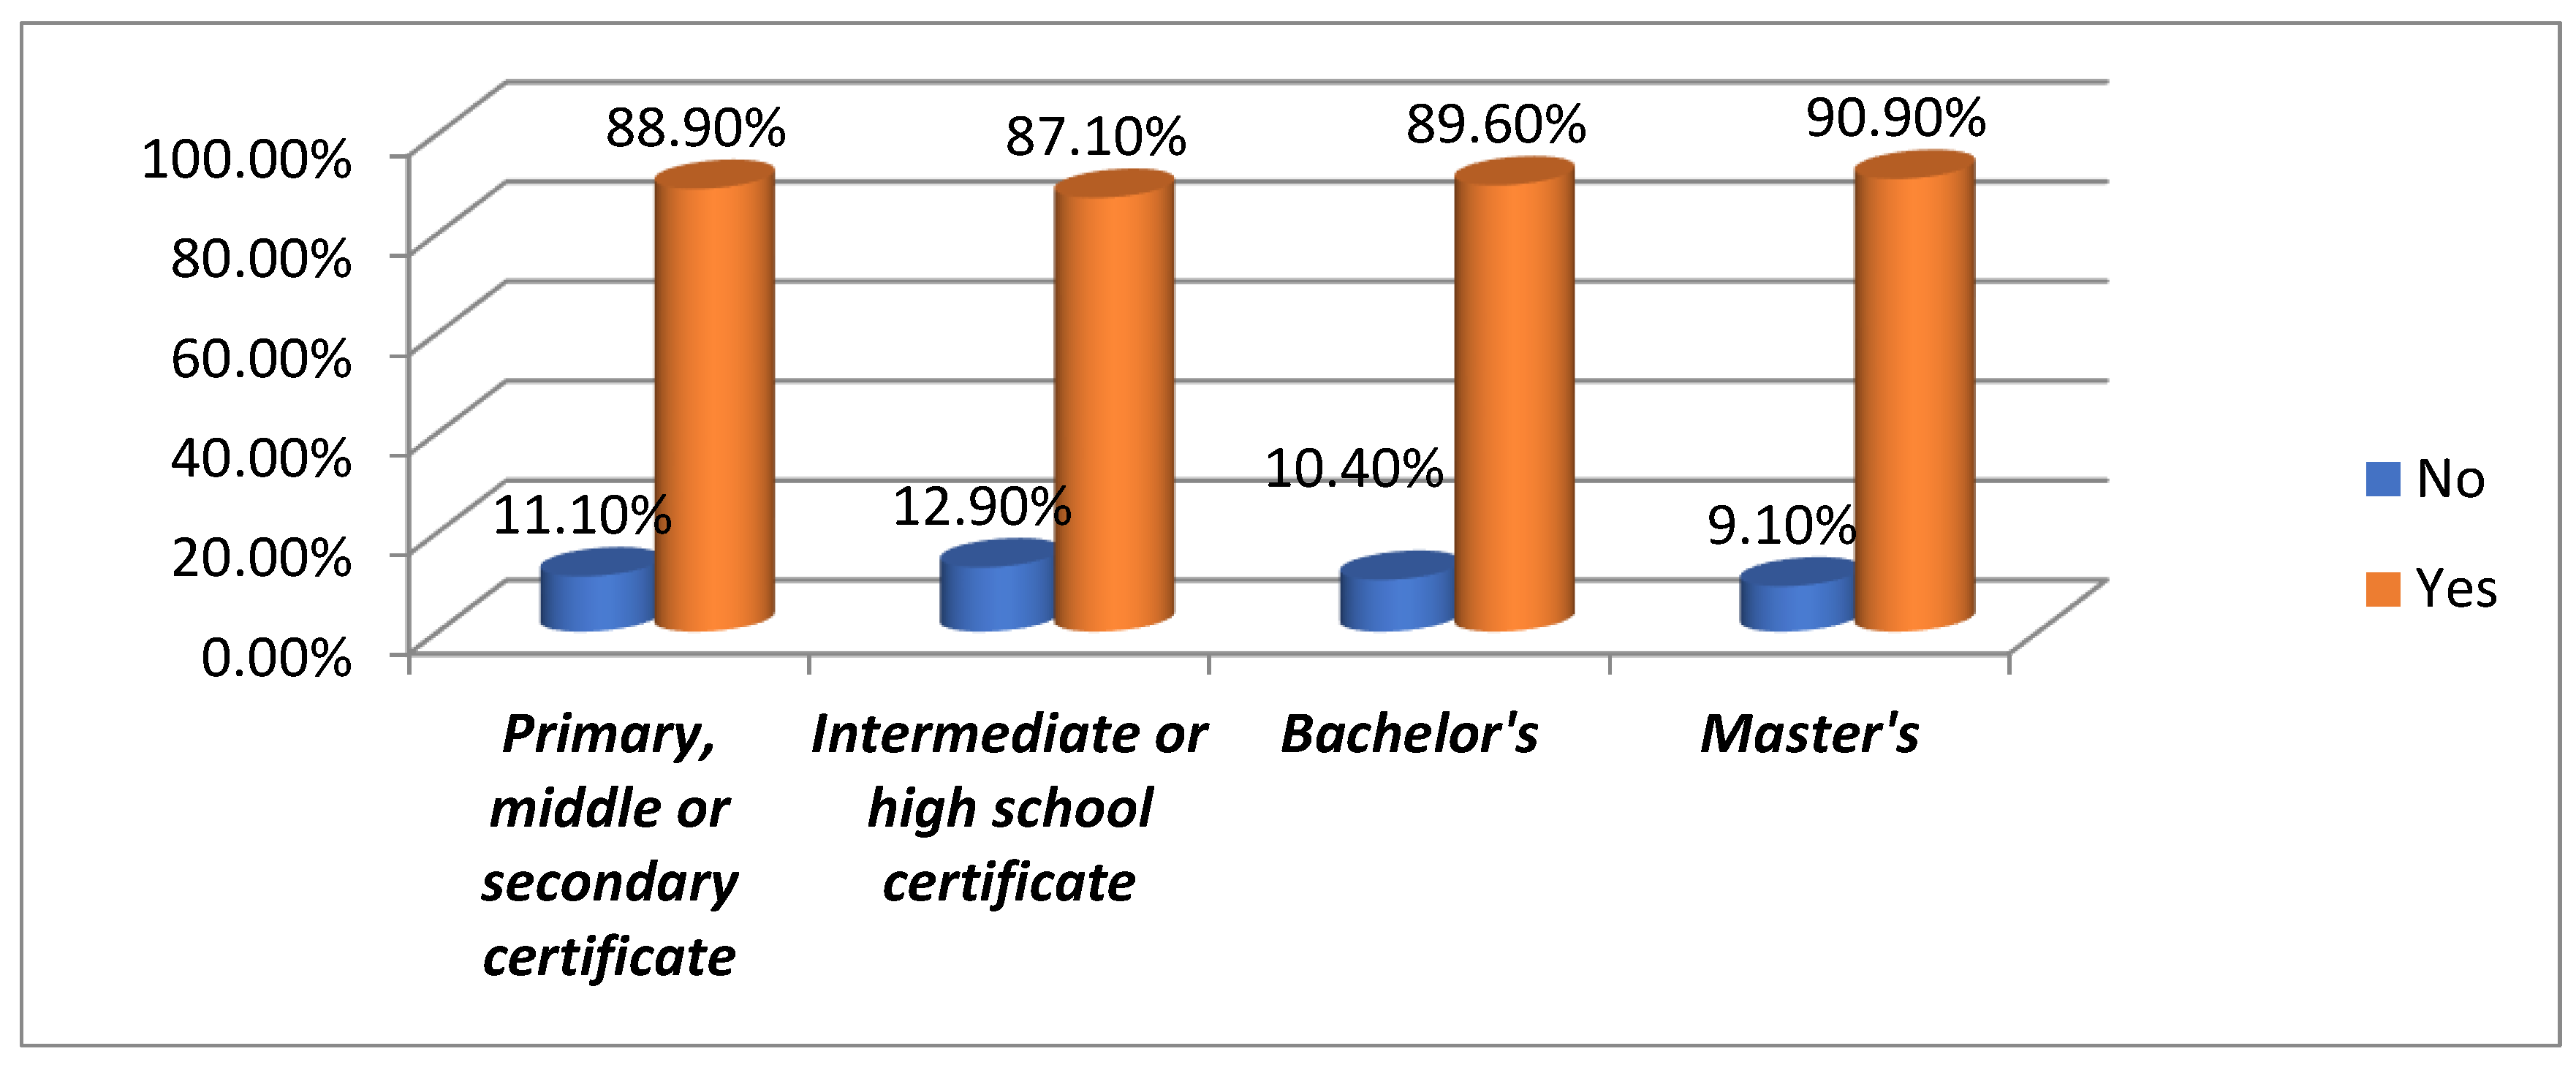
3.6. Preference for QR Codes Over Leaflets
Most participants preferred QR codes over leaflets. In the primary, middle, or secondary certificate group, 88.9% favored QR codes despite some preference for leaflets. Similarly, 87.1% in the intermediate or high school group and 89.6% in the Bachelor’s group also chose QR codes, rising to 90.9% in the Master’s group. This trend highlights the shift to digital, as QR codes offer convenience and accessibility that leaflets often lack. [
Figure 17 and
Table 12].
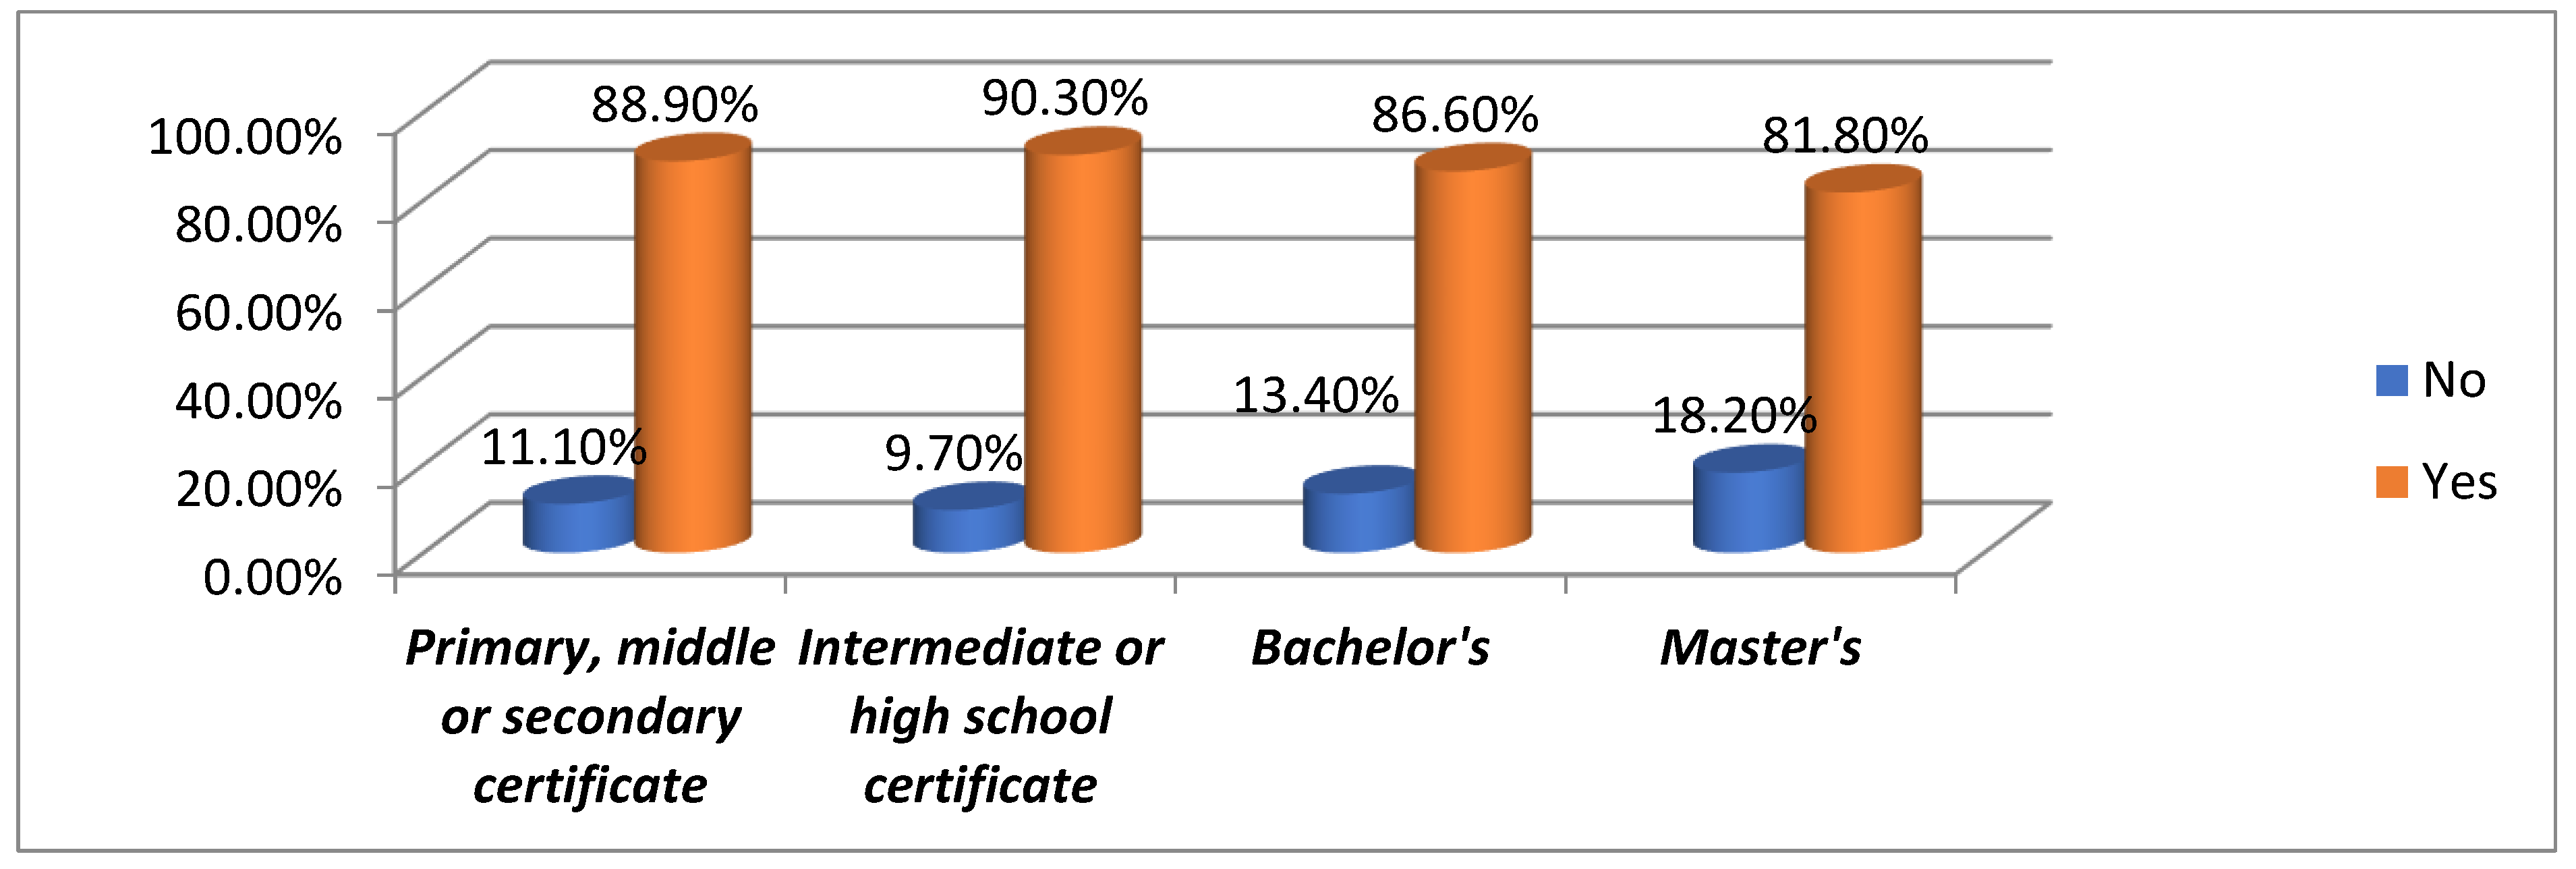
3.7. Ease of Sharing Healthcare Information Using QR Codes
QR codes for sharing healthcare information are positively received across all education levels. Among primary and secondary certificate holders, 88.9% find it easy to use QR codes, similar to 90.3% in the intermediate and high school group. For Bachelor’s degree holders, 86.6% agree, and 81.8% of Master’s degree holders share this view. Overall, 87.3% of participants seek QR codes for easy healthcare information sharing, highlighting their role in efficient dissemination in healthcare contexts. [
Figure 18 and
Table 12].
4. Discussion
The survey conducted across various educational levels reveals that individuals from diverse backgrounds widely recognize and use QR codes. Regardless of education level, most respondents are familiar with QR codes, with 100% familiarity observed across all groups. While 44.1% of the respondents have used QR codes, a majority, 91.5%, prefer mobile technology for accessing information, indicating a shift away from traditional methods. The survey also shows that most participants do not need assistance using QR codes, suggesting general proficiency. Regarding preference, 80.5% of respondents favor QR codes over leaflets, highlighting their efficiency and convenience, especially in sharing healthcare information, which 87.3% find easy to do using QR codes. The Chi-Square tests show no significant differences in responses across educational levels, indicating that the acceptance and use of QR codes are consistent across all groups. Overall, QR codes are increasingly seen as a valuable tool for information dissemination, particularly in mobile and healthcare contexts, with no significant variations based on educational background.
A strong preference for accessing helpful information via mobile technology was evident, with 91.5% of participants favoring this method. Despite this, a nearly equal split was observed in the need for assistance to use QR codes, with 50.8% not requiring help and 49.2% indicating they needed guidance. When comparing QR codes to traditional leaflets, 80.5% of participants preferred QR codes, reflecting an apparent inclination towards digital solutions. Similarly, 89% expressed a willingness to use QR codes again rather than leaflets in the future.
Previous studies have highlighted the versatile applications of QR codes in various domains, particularly in healthcare and education, reinforcing the current study's findings. Karia et al. (2019) emphasized QR codes’ ability to facilitate quick access to learning materials, supporting the observed preference (80.5%) for QR codes over traditional methods in this study [
28]. Similarly, Chien and Lin (2016) demonstrated their effectiveness in improving patient feedback through web-based surveys, aligning with the current findings of ease in information sharing (87.3%) and a preference for digital solutions across educational levels [
29]. Jamu et al. (2016) highlighted QR codes’ flexibility and accessibility in multi-professional learning, resonating with the current observation of widespread recognition and usage across educational backgrounds [
30]. Lai et al. (2023) showcased their utility in hands-on forensic training for medical students, complementing this study’s evidence of QR codes bridging knowledge gaps [
31]. However, Walcott-Bedeau et al. (2020) noted limitations in QR code adoption without adequate training, paralleling the nearly equal split in this study between those needing assistance (49.2%) and those proficient (50.8%) [
32]. Alshehri et al. (2022) and Sharara and Radia (2022) explored QR codes’ practical applications in dental care and patient information delivery during the COVID-19 pandemic, respectively, which aligns with this study’s findings of their utility in healthcare [
33,
34]. Bartnicka and Lara (2019) further emphasized the role of QR codes in streamlining dental clinic processes, reflecting their efficiency and reduced reliance on traditional methods, as observed in the current study [
35].
This study's limitations include a small, homogeneous sample mainly from a single university hospital, limiting generalizability across age, education, and location. Its cross-sectional design prevents causal or long-term impact analysis of QR code use on patient education. Selection bias may exist since participants were already familiar with healthcare tech, possibly affecting their preferences. Although most knew QR codes, many needed help, highlighting adoption barriers for future research.
Future research should include larger, diverse samples and longitudinal studies to understand QR codes' lasting effects on patient behavior and health outcomes. Researchers should also explore obstacles to adoption, especially among older adults or less tech-savvy individuals, and compare QR codes with other digital tools like health apps or SMS interventions. Studying QR codes' direct impact on health, such as improving adherence and health literacy, can deepen understanding of their role in healthcare communication.
5. Conclusions
In conclusion, the survey highlights that QR codes are universally familiar and highly preferred across all educational levels. Mobile technology is preferred for accessing useful information, and most respondents find QR codes easy to use and preferable over leaflets, especially for sharing healthcare information. While the overall familiarity and ease of use with QR codes are consistent across different educational backgrounds, the preference for QR codes over traditional leaflets and their role in facilitating the sharing of healthcare information stand out. The Chi-Square analysis confirms that these patterns are primarily uniform across educational levels, indicating widespread acceptance of QR codes as a modern, convenient tool.
Author Contributions
Conceptualization, O.A. and A.A.( AlWaleed Abushanan); methodology, K.A.; software, R.B.S.; validation, M.A. (Maram Alagla), F.B. and K.A.; formal analysis, A.A. ( AlWaleed Abushanan); investigation, R.B.S.; resources, D.V.; data curation, M.A. (Maram Alagla); writing—original draft preparation, H.G. and A.A(Abdulfatah AlAzmah); writing—review and editing, A.A.; visualization, R.B.S.and D.V.; supervision, O.A. and M.A (Mazin Algahtani).; project administration, F.B. and H.G.; funding acquisition, R.B.S. All authors have read and agreed to the published version of the manuscript.
Funding
This study is supported by the Prince Sattam bin Abdulaziz University project number (2025/03/33724).
Institutional Review Board Statement
The study was conducted in accordance with the Declaration of Helsinki and approved by the Standing Committee of Bioethics Research (SCBR),at Prince Sattam bin Abdulaziz University (PSAU), with approval number SCBR-172/2023 dated 22-10-2023.
Informed Consent Statement
Informed consent was obtained from all subjects involved in the study.
Data Availability Statement
Available upon suitable request.
Acknowledgments
The authors thank the Deanship of Scientific Research, Prince Sattam bin Abdulaziz University, Al-Kharj, Saudi Arabia, for funding the study via project number (PSAU/2025/R/1446 )& (2025/03/33724).
Conflicts of Interest
The authors declare no conflict of interest.
Abbreviations
QR - Quick Response; PILs - Patient Information Leaflets; KSA - Kingdom of Saudi Arabia; SCBR - Standing Committee of Bioethics Research; PSAU - Prince Sattam Bin Abdulaziz University; SPSS - Statistical Package for the Social Sciences; Stata - Statistical Software; SPS; Inc - SPSS Inc. (Software company); Chi-square - Statistical Test used in the study; GEE - Generalized Estimating Equations
References
- Lopez-Fernandez, O.; Kuss, D.J.; Romo, L.; Morvan, Y.; Kern, L.; Graziani, P.; et al. Self-reported dependence on mobile phones in young adults: A European cross-cultural empirical survey. J. Behav. Addict. 2017, 6(2), 168–177. [CrossRef]
- Pandey, A.; Hasan, S.; Dubey, D.; Sarangi, S. Smartphone apps as a source of cancer information: Changing trends in health information-seeking behavior. J. Cancer Educ. 2013, 28(1), 138–142.
- Payne, K.F.; Wharrad, H.; Watts, K. Smartphone and medical related app use among medical students and junior doctors in the United Kingdom (UK): A regional survey. BMC Med. Inform. Decis. Mak. 2012, 12(1), 121.
- DENSO WAVE. QR Code development story. Available from: https://www.denso-wave.com/en/technology/vol1.html. Accessed 2019 Jun 21.
- QRStuff.com. QR Code Generator. Available from: https://www.qrstuff.com/. Accessed 2019 Jun 21.
- Okazaki, S.; Li, H.; Hirose, M. Benchmarking the use of QR code in mobile promotion. J. Advert. Res. 2012, 52, 102–117. [CrossRef]
- Soon, T.J. QR Code. 2008. Available from: https://foxdesignsstudio.com/uploads/pdf/Three_QR_Code.pdf. Accessed 2019 Jun 21.
- Constine, J. How Snapchat Made QR Codes Cool Again. TechCrunch 2015. Available from: https://techcrunch.com/2015/05/04/snapcode/?guccounter=1. Accessed 2024 Jun 21.
- Karteek, D.; Spoorti, K.; Jose, M.; Shakil, M. Quick response code in oral and maxillofacial radiology. J. Oral Maxillofac. Radiol. 2014, 2, 95. [CrossRef]
- Mira, J.J.; Guilabert, M.; Carrillo, I.; Fernández, C.; Vicente, M.A.; Orozco-Beltrán, D.; et al. Use of QR and EAN-13 codes by older patients taking multiple medications for safer use of medication. Int. J. Med. Inform. 2015, 84, 406–412. [CrossRef]
- Gough, A.; Fieraru, G.; Gaffney, P.; Butler, M.; Kincaid, R.; Middleton, R. A novel use of QR code stickers after orthopaedic cast application. Ann. R. Coll. Surg. Engl. 2017, 99, 476–478. [CrossRef]
- Mao, H.; Chi, C.; Yu, J.; Yang, P.; Qian, C.; Zhao, D. QRStream: A secure and convenient method for text healthcare data transferring. Annu. Int. Conf. IEEE Eng. Med. Biol. Soc. 2019, 2019, 3458–3462.
- Information Capacity and Versions of QR Code. 2021. Available from: https://www.qrcode.com/en/about/version.html. Accessed 2024 Aug 1.
- Uzun, V.; Bilgin, S. Evaluation and implementation of QR code identity tag system for healthcare in Turkey. Springerplus 2016, 5, 1454.
- Kafadarova, N.; Stoyanova-Petrova, S.; Mileva, N.; Stoyanova, D. Using QR Codes in Dental Practice. EDULEARN19 Proceedings 2019, 1, 434–439.
- Avhad, S.K.; Sachdev, S.S.; Jaiswal, P.A.; Jadhav, P.; Watharkar, R.B.; Save, S.S. Survey on knowledge, attitude, and practice of Indian oral health-care professionals regarding QR codes in dental practice and academics. J. Glob. Oral Health 2022, 5(1), 3.
- Kashwani, R.; Jose, A.T.; Gambhir, S.; Virk, S.; Roy, S. The role of the metaverse in revolutionizing dental practice: Implications across all departments. Int. Dent. J. Stud. Res. 2024, 12(3), 157–160.
- Sachdev, S.S.; Avhad, S.; Chettiankandy, T.J.; Gaikwad, R.; Jadhav, P. Utility of QR codes in dental practice and academics: The era of digital revolution. JIDA: J. Indian Dent. Assoc. 2022 May, 16(5).
- Poovannan, S.; Jain, A.R.; Krishnan, C.J.; Chandran, C.R. An in vitro evaluation of the reliability of QR code denture labeling technique. J. Forensic Dent. Sci. 2016 Sep, 8(3), 218–223.
- Winarno, S.; Sitam, S.; Sukriani, Y.F.; Subiyakto, Y.; Amaliya, A. Utilization of quick response codes technology in forensic odontology procedures. J. Int. Dent. Med. Res. 2022, 15(4), 1560–1566.
- CODE Q. Evaluating knowledge, awareness and behaviour among dental interns regarding ergonomics in dentistry: A cross-sectional survey. Trauma 2015, 5, 6.
- Sawhney, H.; Salam, S.; Singh, S. KAP assessment for exploring quick response code integration in tele-radiography, diagnosis, and digital imaging. Commun. Pract. J. Commun. Pract. Health Visitors' Assoc. 2024, 21(4), 1450–1457.
- Ali, M.M.; Colvenkar, S.; Omer, N.S.; Mysolla, S.R.; Noureen, F. Prosthodontic management with a metal denture engraved with laser QR code. Cureus 2023 Feb, 15(2).
- Syed, S.; Alshahrani, I.; Alshahrani, A.; Togoo, R.A.; Luqman, M.; Dawasaz, A.A. Conversion of palatal rugae pattern to scanable quick response code in an Arabian population. J. Dent. Sci. 2016 Sep, 11(3), 253–260. [CrossRef]
- Alshehri, M.; Alamri, A.; Alghamdi, M.; Nazer, R.; Kujan, O. Smart-card technology for the dental management of medically complex patients. Healthcare (Basel) 2022 Nov, 10(11), 2314. [CrossRef]
- Rojas-Torres, J.; Cea, M.; Zhu, Y.J.; Fonseca, G.M. Behavior of 4 types of paper with printed QR codes for evaluating denture marking in conditions of extreme heat. J. Prosthet. Dent. 2022 Apr, 127(4), 645–650. [CrossRef]
- Ozkaya, E.; Ozkaya, H.; Roxas, J.; et al. Factors affecting consumer usage of QR codes. J. Direct Data Digit. Mark. Pract. 2015, 16, 209–224. [CrossRef]
- Karia, C.T.; Hughes, A.; Carr, S. Uses of quick response codes in healthcare education: A scoping review. BMC Med. Educ. 2019 Dec, 19(1), 456. [CrossRef]
- Chien, T.W.; Lin, W.S. Improving inpatient surveys: Web-based computer adaptive testing accessed via mobile phone QR codes. JMIR Med. Inform. 2016 Mar, 4(1), e8. [CrossRef]
- Jamu, J.T.; Lowi-Jones, H.; Mitchell, C. Just in time? Using QR codes for multi-professional learning in clinical practice. Nurse Educ. Pract. 2016 Jul, 19, 107–112. [CrossRef]
- Lai, L.; Liu, L.; Wang, Y.; Liu, S.; Zhang, J.; Zheng, X. QR code technology in individual identification training provides an introduction in hands-on forensic DNA genotyping to medical students. BMC Med. Educ. 2023 May, 23(1), 314. [CrossRef]
- Walcott-Bedeau, G.; Raeburn, K.; Burkhardt, D.; Clunes, M. When quick response codes didn't do the trick. Perspect. Med. Educ. 2020 Jun, 9(3), 191–194. [CrossRef]
- Alshehri, M.; Alamri, A.; Alghamdi, M.; Nazer, R.; Kujan, O. Smart-Card Technology for the Dental Management of Medically Complex Patients. Healthcare (Basel) 2022, 10(11), 2314. [CrossRef]
- Sharara, S.; Radia, S. Quick Response (QR) Codes for Patient Information Delivery: A Digital Innovation During the Coronavirus Pandemic. J. Orthod. 2022. [CrossRef]
- Bartnicka, J.; Lara, J. Smart Solutions for Improving Working Processes: A Research Experience from Dental Clinics. Multidisciplinary Aspects of Production Engineering 2019.
Figure 1.
Demographic characteristics of the study participants.
Figure 1.
Demographic characteristics of the study participants.
Figure 3.
Education level.
Figure 3.
Education level.
Figure 4.
Familiarity with QR codes.
Figure 4.
Familiarity with QR codes.
Figure 5.
Use of QR codes by gender.
Figure 5.
Use of QR codes by gender.
Figure 6.
Participants' preferences for accessing useful information through mobile technology.
Figure 6.
Participants' preferences for accessing useful information through mobile technology.
Figure 7.
Do you need any assistance to use the QR code?
Figure 7.
Do you need any assistance to use the QR code?
Figure 8.
: How did you feel about the use of the QR code compared to the leaflet?
Figure 8.
: How did you feel about the use of the QR code compared to the leaflet?
Figure 9.
Would you prefer to use a QR code rather than a leaflet again?
Figure 9.
Would you prefer to use a QR code rather than a leaflet again?
Figure 10.
Is sharing this health care information to you friends easy with QR code categorized by gender?
Figure 10.
Is sharing this health care information to you friends easy with QR code categorized by gender?
Figure 11.
:Is sharing this health care information with your friends easy with a QR code categorized by Age group?
Figure 11.
:Is sharing this health care information with your friends easy with a QR code categorized by Age group?
Figure 12.
Are you familiar with QR codes?
Figure 12.
Are you familiar with QR codes?
Figure 13.
Have you ever used QR codes?
Figure 13.
Have you ever used QR codes?
Figure 14.
Do you prefer to have access to helpful information via mobile technology?
Figure 14.
Do you prefer to have access to helpful information via mobile technology?
Figure 15.
"Do you need assistance to use QR codes?
Figure 15.
"Do you need assistance to use QR codes?
Figure 16.
How did you feel about the use of the QR code compared to the leaflet?
Figure 16.
How did you feel about the use of the QR code compared to the leaflet?
Figure 17.
Would you prefer to use a QR code rather than a leaflet again?
Figure 17.
Would you prefer to use a QR code rather than a leaflet again?
Figure 18.
Is sharing this healthcare information with your friends easy with a QR code?
Figure 18.
Is sharing this healthcare information with your friends easy with a QR code?
Table 1.
Questionnaire of the Study.
Table 1.
Questionnaire of the Study.
| Question No. |
Question |
Options |
| 1 |
Age |
|
| 2 |
Gender |
|
| 3 |
Education level |
|
| 4 |
Are you familiar with QR codes? |
A. Yes; B. No |
| 5 |
Have you ever used QR codes? |
A. Yes; B. No |
| 6 |
Do you prefer to have access to useful information by mobile technology? |
A. Yes; B. No |
| 7 |
Do you need any assistance to use QR code? |
A. Yes; B. No |
| 8 |
How did you feel the use of QR code compared to leaflet? |
A. Yes; B. No |
| 9 |
Would you prefer using QR code again rather than a leaflet? |
A. Yes; B. No |
| 10 |
Is sharing this healthcare information with your friends easy using QR codes? |
A. Yes; B. No |
Table 2.
Comparison of gender with different variables using the chi-square test.
Table 2.
Comparison of gender with different variables using the chi-square test.
| |
Age group |
Total |
| Less than 35 years old |
Between 35-50 years |
Larger than 50 years old |
| Gender |
Male |
Count |
18 |
26 |
3 |
47 |
| % within Gender |
38.3% |
55.3% |
6.4% |
100.0% |
| Female |
Count |
20 |
36 |
15 |
71 |
| % within Gender |
28.2% |
50.7% |
21.1% |
100.0% |
| Total |
Count |
38 |
62 |
18 |
118 |
| % within Gender |
32.2% |
52.5% |
15.3% |
100.0% |
| Chi square value: 5.046 p value: 0.080 |
Table 3.
Education Level Comparison Table.
Table 3.
Education Level Comparison Table.
| |
Education level |
Total |
| Primary, middle or secondary certificate |
Intermediate or high school certificate |
Bachelor's |
Master's |
| Gender |
Male |
Count |
4 |
12 |
25 |
6 |
47 |
| % within Gender |
8.5% |
25.5% |
53.2% |
12.8% |
100.0% |
| Female |
Count |
5 |
19 |
42 |
5 |
71 |
| % within Gender |
7.0% |
26.8% |
59.2% |
7.0% |
100.0% |
| Total |
Count |
9 |
31 |
67 |
11 |
118 |
| % within Gender |
7.6% |
26.3% |
56.8% |
9.3% |
100.0% |
| Chi square value: 1.267 p value: 0.737 |
Table 4.
Comparison of gender with different variables using chi-square test.
Table 4.
Comparison of gender with different variables using chi-square test.
| |
Are you familiar with QR codes? |
Total |
| Yes |
|---|
| Gender |
Male |
Count |
47 |
47 |
| % within Gender |
100.0% |
100.0% |
| Female |
Count |
71 |
71 |
| % within Gender |
100.0% |
100.0% |
| Total |
Count |
118 |
118 |
| % within Gender |
100.0% |
100.0% |
| Chi square value: NA p value: NA |
Table 5.
Comparison of Gender and Prior QR Code Usage.
Table 5.
Comparison of Gender and Prior QR Code Usage.
| |
Have you ever used QR code? |
Total |
| No |
Yes |
| Gender |
Male |
Count |
28 |
19 |
47 |
| % within Gender |
59.6% |
40.4% |
100.0% |
| Female |
Count |
38 |
33 |
71 |
| % within Gender |
53.5% |
46.5% |
100.0% |
| Total |
Count |
66 |
52 |
118 |
| % within Gender |
55.9% |
44.1% |
100.0% |
| Chi square value: 0.420 p value: 0.517 |
Table 6.
Access to helpful information by mobile technology?
Table 6.
Access to helpful information by mobile technology?
| |
Do you prefer to have access to useful information by mobile technology? |
Total |
| No |
Yes |
| Gender |
Male |
Count |
5 |
42 |
47 |
| % within Gender |
10.6% |
89.4% |
100.0% |
| Female |
Count |
5 |
66 |
71 |
| % within Gender |
7.0% |
93.0% |
100.0% |
| Total |
Count |
10 |
108 |
118 |
| % within Gender |
8.5% |
91.5% |
100.0% |
| Chi square value: 0.471 p value: 0.492 |
Table 7.
Do you need any assistance to use QR code?
Table 7.
Do you need any assistance to use QR code?
| |
Do you need any assistance to use QR code? |
Total |
| No |
Yes |
| Gender |
Male |
Count |
30 |
17 |
47 |
| % within Gender |
63.8% |
36.2% |
100.0% |
| Female |
Count |
30 |
41 |
71 |
| % within Gender |
42.3% |
57.7% |
100.0% |
| Total |
Count |
60 |
58 |
118 |
| % within Gender |
50.8% |
49.2% |
100.0% |
| Chi square value: 5.268 p value: 0.022* |
Table 8.
Participants' perceptions of using QR codes.
Table 8.
Participants' perceptions of using QR codes.
| |
How did you feel the use QR code compare to leaflet? |
Total |
| No |
Yes |
| Gender |
Male |
Count |
13 |
34 |
47 |
| % within Gender |
27.7% |
72.3% |
100.0% |
| Female |
Count |
10 |
61 |
71 |
| % within Gender |
14.1% |
85.9% |
100.0% |
| Total |
Count |
23 |
95 |
118 |
| % within Gender |
19.5% |
80.5% |
100.0% |
| Chi square value: 3.321 p value: 0.068 |
Table 9.
Participants' preferences for using QR codes again instead of traditional leaflets, analyzed by gender.
Table 9.
Participants' preferences for using QR codes again instead of traditional leaflets, analyzed by gender.
| |
Would you prefer using QR code again rather than a leaflet? |
Total |
| No |
Yes |
| Gender |
Male |
Count |
7 |
40 |
47 |
| % within Gender |
14.9% |
85.1% |
100.0% |
| Female |
Count |
6 |
65 |
71 |
| % within Gender |
8.5% |
91.5% |
100.0% |
| Total |
Count |
13 |
105 |
118 |
| % within Gender |
11.0% |
89.0% |
100.0% |
| Chi square value: 1.197 p value: 0.274 |
Table 10.
Ease of sharing healthcare information with friends using QR codes, categorized by gender.
Table 10.
Ease of sharing healthcare information with friends using QR codes, categorized by gender.
| |
Is sharing this health care information to you friends easy with QR code? |
Total |
| No |
Yes |
| Gender |
Male |
Count |
7 |
40 |
47 |
| % within Gender |
14.9% |
85.1% |
100.0% |
| Female |
Count |
8 |
63 |
71 |
| % within Gender |
11.3% |
88.7% |
100.0% |
| Total |
Count |
15 |
103 |
118 |
| % within Gender |
12.7% |
87.3% |
100.0% |
| Chi square value: 0.335 p value: 0.563 |
Table 11.
Is sharing this health care information with your friends easy with a QR code, categorized by Age group?
Table 11.
Is sharing this health care information with your friends easy with a QR code, categorized by Age group?
| |
Is sharing this health care information to you friends easy with QR code? |
Total |
| No |
Yes |
| Age group |
Less than 35 years old |
Count |
2 |
36 |
38 |
| % within Age group |
5.3% |
94.7% |
100.0% |
| Between 35-50 years |
Count |
9 |
53 |
62 |
| % within Age group |
14.5% |
85.5% |
100.0% |
| Larger than 50 years old |
Count |
4 |
14 |
18 |
| % within Age group |
22.2% |
77.8% |
100.0% |
| Total |
Count |
15 |
103 |
118 |
| % within Age group |
12.7% |
87.3% |
100.0% |
| Chi square value: 3.549 p value: 0.170 |
Table 12.
QR CODE Survey Results.
Table 12.
QR CODE Survey Results.
| Education Level |
Are you familiar with QR codes? |
Have you ever used QR codes? |
Do you prefer to have access to useful information by mobile technology? |
Do you need any assistance to use QR code? |
How did you feel the use of QR codes compare to leaflets? |
Would you prefer using QR code again rather than a leaflet? |
Is sharing healthcare information with friends easy using QR codes? |
Chi-Square Value & p-Value |
| Primary, middle or secondary certificate |
Yes (9, 100%) |
No (4, 44.4%)/Yes (5, 55.6%) |
No (1, 11.1%)/Yes (8, 88.9%) |
No (2, 22.2%)/Yes (7, 77.8%) |
No (4, 44.4%)/Yes (5, 55.6%) |
No (1, 11.1%)/Yes (8, 88.9%) |
No (1, 11.1%)/Yes (8, 88.9%) |
p-value: NA |
| Intermediate or high school certificate |
Yes (31, 100%) |
No (17, 54.8%)/Yes (14, 45.2%) |
No (4, 12.9%)/Yes (27, 87.1%) |
No (10, 32.3%)/Yes (21, 67.7%) |
No (4, 12.9%)/Yes (27, 87.1%) |
No (4, 12.9%)/Yes (27, 87.1%) |
No (3, 9.7%)/Yes (28, 90.3%) |
p-value: 0.398 |
| Bachelor's |
Yes (67, 100%) |
No (41, 61.2%)/Yes (26, 38.8%) |
No (4, 6%)/Yes (63, 94%) |
No (44, 65.7%)/Yes (23, 34.3%) |
No (14, 20.9%)/Yes (53, 79.1%) |
No (7, 10.4%)/Yes (60, 89.6%) |
No (9, 13.4%)/Yes (58, 86.6%) |
p-value: 0.153 |
| Master's |
Yes (11, 100%) |
No (4, 36.4%)/Yes (7, 63.6%) |
No (1, 9.1%)/Yes (10, 90.9%) |
No (4, 36.4%)/Yes (7, 63.6%) |
No (1, 9.1%)/Yes (10, 90.9%) |
No (1, 9.1%)/Yes (10, 90.9%) |
No (2, 18.2%)/Yes (9, 81.8%) |
p-value: 0.981 |
| Total |
Yes (118, 100%) |
No (66, 55.9%)/Yes (52, 44.1%) |
No (10, 8.5%)/Yes (108, 91.5%) |
No (60, 50.8%)/Yes (58, 49.2%) |
No (23, 19.5%)/Yes (95, 80.5%) |
No (13, 11%)/Yes (105, 89%) |
No (15, 12.7%)/Yes (103, 87.3%) |
p-value: 0.170 (Not significant) |
|
Disclaimer/Publisher’s Note: The statements, opinions and data contained in all publications are solely those of the individual author(s) and contributor(s) and not of MDPI and/or the editor(s). MDPI and/or the editor(s) disclaim responsibility for any injury to people or property resulting from any ideas, methods, instructions or products referred to in the content. |
© 2025 by the authors. Licensee MDPI, Basel, Switzerland. This article is an open access article distributed under the terms and conditions of the Creative Commons Attribution (CC BY) license (https://creativecommons.org/licenses/by/4.0/).