Submitted:
14 October 2025
Posted:
15 October 2025
You are already at the latest version
Abstract
The risks within the palm oil supply chain (SC) are influenced by conflicts of interest across ecological, economic, and social dimensions worldwide. Despite the significance of these risks, research on their propagation within palm oil SCs remains limited. This study aims to understand how risks spread among stakeholders and affect overall performance, focusing on three regions in West Papua as a case study. Quantitative data was collected through a questionnaire survey with 178 valid responses, and social network analysis (SNA) was conducted using UCINET 6.0 software to visualize risk propagation. The findings reveal that low work ethics and motivation, disruptions in plantation operations, and low fresh fruit bunch (FFB) production are critical risk nodes with high eigenvector, betweenness, and degree centrality, indicating their pivotal role in risk dissemination. Addressing these risks requires proactive measures such as stakeholder coordination, good governance, strengthening ecological and economic sustainability, human rights, and capacity building through training and information transfer. The study's scope was limited to three regencies in West Papua; thus, further research across other regions and countries is necessary to deepen understanding and improve risk management strategies in palm oil supply chains globally. This research offers valuable insights into agribusiness supply chain risks, particularly within the Indonesian palm oil industry.
Keywords:
risk propagation
; resilience strategies
; palm oil supply chain
; social network analysis
; West Papua
; Indonesia
1. Introduction
Supply chain risk propagation and complex adaptive systems are essential topics that are continuously being developed by researchers around the world [1,2,3,4]. Supply chains (SCs) are becoming complex due to market uncertainty, shortening product life cycles, the rapid pace of new technological development, global geopolitical risk, growing customization [5], and driven by interrelationships and feedback between SCs, nature, society, and the economy [6].
According to Chaudhuri et al. (2016) [7], risk propagation is defined as the way that risks originate in one node of an SC and create further risks across the SC. Risk-propagation process is known as the ripple effect [8,9] or domino or snowball effect, which occurs when an SC risk cascades downstream, rather than remained localized, and affects the performance of the SC [10]. The ripple effect is defined as a phenomenon of risk propagation in the SC that affects changes in the system, structures, parameters and output SC performance, such as sales, on-time delivery, and total profit [10]. Risk propagation in the agribusiness supply chain (ASC) is defined as a phenomenon of disruption propagations in the ASC that affects changes in the system, structures, parameters, and output of ASC performance [11].
As SCs play an important role in agribusiness which is the backbone of global commerce [1,12], it is crucial to advance the practice, theory and construct of risk propagation in the ASC that represents a multidimensional phenomenon such as conducting empirical studies to determine the current risk propagation in the ASC from the perspectives of key stakeholders [11,13]. Understanding and anticipating stakeholder risk perceptions is necessary for understanding community attitudes to risks [14]. Stakeholder perspectives have been studied by employing different methods, namely literature reviews, surveys, and interviews [13,15], qualitative and quantitative analyses [16,17], newspapers, interviews, and other archive data, such as press releases, petitions, blog posts, and official documents [18], SWOT analysis [19,20], mixed-method research [21], and social network analysis [22,23].
Palm oil industry is part of agribusiness activities because agribusiness includes any business related to agriculture, such as farming, animal husbandry, and aqua- or marine-related activities. Failure to manage risks in palm oil SCs can result in significant losses for the organisation [24]. However, extant literature related to risk propagation in the context of palm oil SCs is limited as the results of systematic literature studies which state that there has been a lack of research on risk propagation in the ASC for more than two decades [11]. Therefore, this study adds fresh insight into agribusiness SC risks by drawing on the case of the Indonesian palm oil industry in West Papua.
Risks in the palm oil SC are posed by various conflicts of interest between ecological, economic and social aspects worldwide [25,26] including Indonesia and West Papua province [27,28,29,30]. Therefore, this study conducts an empirical study of the Indonesian palm oil industry in West Papua that considers risk propagation that involves various stakeholders in the supply chain [11,13] that never been studied before. In doing so, the main research questions addressed in this paper are: How does risk propagation occurs and impacts on stakeholders in palm oil SCs in West Papua?
To answer this research question, this study draws on risk propagation and its impact associated with key stakeholders in palm oil SCs in West Papua. As the entire region relies heavily on agribusiness as a livelihood, the results of this study are expected to contribute significantly to the development of palm oil SCs in West Papua to improve the welfare of the community and the regional economy. In addition, it can be adopted and used in other regions of Indonesia and other developing countries with similar socioeconomic and geographical characteristics.
The remainder of this paper is organized as follows. Section 2 provides a review of the literature on risk propagation in the palm oil SCs. Section 3 discusses the methodology adopted in this study, which leads to justification for the research. Section 4 and 5 presents the results and discussion of the risk propagation and their impact in palm oil SCs in West Papua. Finally, Section 6 presents the conclusions of this study.
2. Literature Review
2.1. Risks Propagation in the Palm Oil Supply Chain
According to Imbiri et al. (2023b) [24], there are 32 different risks in palm oil SCs in West Papua, comprising 21 internal, nine external, and two network-related risks. However, risks in palm oil SCs can propagate and affect their performance. In line with the existing constructs of risk propagation in the ASC [11], risk propagation in the palm oil SC could have both positive and negative effects on each member of the chain and on the performance of the entire SC. Therefore, these constructs enable an understanding of risk propagation in palm oil SCs, leading to more efficient palm oil SC management, and providing new and more effective ways to manage risks in the palm oil SC. For instance, palm oil production is expanding to fulfil the growing worldwide need for cooking oil, food ingredients, biofuels, soaps, detergents, and cosmetics; however, the growth of palm oil plantations contributes to environmental and social problems, such as the destruction of tropical forests, climate change, and threats to smallholder livelihoods [32,33,34]. Mareeh et al. (2022) [35] also pointed out that deforestation and transportation are the main contributors to greenhouse gas (GHG) emissions caused by increasing global and domestic Crude Palm Oil (CPO) demand.
In addition, Qaim et al. (2020) [36] stated that oil palm expansion has contributed to tropical deforestation and the associated losses in biodiversity and ecosystem functions. Simultaneously, it has increased incomes, generated employment, and reduced poverty among farm and nonfarm households [36]. In this overview, risks in the palm oil SC are not solely caused by vulnerabilities in the supply chain itself, but more importantly the threats posed by various conflicts of interest between ecological, economic and social aspects [26,27]. Therefore, Anugerah et al. (2021) [37] emphasize that palm oil industries should not only focus on the economic aspects but also the environmental and social aspects to maintain their existence and be more sustainable. In addition, Monzon et al. (2023) [38] pointed out that improved agronomic management such as nutrient management, harvest interval, weed control, and pruning, can help smallholders increase yield and profit on existing plantations, generating a positive economic impact at local to national levels, while reducing pressure to clear new land for cultivation.
2.2. Risks Propagation Using Social Network Analysis (SNA)
Risk propagation has been the subject of much research interest over the past two decades [1], and there has been a notable lack of research on risk propagation in the ASC [11]. Therefore, further investigation to advance practice, theory and construct of risk propagation in ASC is critical.
Studies related to risk propagation using SNA are also very limited although the use of social network analysis (SNA) based stakeholder-associated risk analysis method is recommended as a ‘suitable tool for assessing risk interactions and risk mitigation actions in green building projects and other types of complex systems’ [41] p. 208. Besides, previous studies that consider risk analysis using SNA from a stakeholder perspective [42,43,44,45]. Therefore, research related to risk propagation in palm oil supply chains using SNA adds fresh insight into risk propagation in the ASC to fill the gap of knowledge.
2. Methodology
2.1. Research Design
This research used a quantitative research design, a questionnaire survey [46,47,48,49] to investigate risk propagation in palm oil SCs in West Papua.
This questionnaire consists of three parts: general demographics, including primary place of residence, organisation, and agribusiness activities (part 1), type and source of risks that are applicable to the palm oil SC in West Papua, and the probability and impact of risks (part 2), and interrelationship among risk factors in the palm oil SC in West Papua (part 3).
In this study, the interrelationships among risk factors applicable to the palm oil SC in West Papua were rated by respondents on a scale of 0 to 3 where 0-No (N), 1-Low (L), 2-Medium (M), and 3-High (H). These four-point Likert scales were considered reliable to ensure a good response rate and data validity and take into account respondent characteristics, such as a low level of education.
Although the five-point Likert scale has been used by several scholars [48,50,51,52], determining the points is essential. The results of studies conducted by Weathers, Sharma and Niedrich (2005) [53] show that differences in the reliability and accuracy of responses at various points on the scale are largely due to respondent characteristics. Respondents are more likely to use the status quo decision heuristic as the number of scale points increases and their processing capacity decreases. Greater use of the status quo heuristic, increases the reliability of the scale. But, reduces response accuracy—an indication of construct validity.
This research was conducted in three study areas in West Papua, namely Manokwari, Sorong and Teluk Bintuni regencies. The reasons for selecting these regencies are as follows: (1) these regencies have become target areas for the development of palm oil plantations and other superior commodities in West Papua since 1980 until now [27,28]; (2) each regency has specific characteristics in terms of socioeconomic and geographical characteristics; (3) these regencies represent urban and rural areas that can be reached by using cars and boats; (4) there are local communities and migrants who are involved as smallholder plasma farmers and independent plasma farmers; and (5) there are various crucial issues in the regencies that affect the development of palm oil plantations in West Papua. Moreover, the selection of these three regencies was considered appropriate according to the results of consultations and recommendations from the head of the plantation division West Papua Province (S2).
To ensure that the questionnaire was designed appropriately in terms of length, number of questions [54], appropriateness of language, assumptions, and research instruments [55], a pilot survey was conducted. The results from a pilot survey help to improve response rates and data quality [56], and ultimately to address the research questions.
3.2. Data Collection
The questionnaire was distributed online and offline so that it could reach all potential stakeholders in West Papua mainly (e.g. particularly those living in remote areas. To this end, contact persons were employed to reach those areas. All up, 24 participants took part in the pilot survey in West Papua.
Based on the response rate and results obtained from the pilot survey, it was concluded that paper-based questionnaires, rather than online surveys, were more appropriate to use to reach participants in West Papua. This is because participants lacked experience in filling out questionnaire surveys online, and had issues with internet access and literacy, particularly those living in remote areas. Accordingly, a combination of both methods was used in the complete survey questionnaire. In this regard, eight enumerators were involved in collecting data in the field in addition to the online survey. In total, 178 participants took part in the questionnaire survey in West Papua.
3.3. Data Analysis and Coding
Social Network Analysis (SNA) was used for assessing risk propagation in the ASC. In this method, there are essential steps that must be carried out [41] p. 211: (1) identifying the boundary of the network, (2) assessing meaningful and actionable relationships, (3) visualising the network, (4) analysing the network data, and (5) presenting the analysis results. In line with those steps, this research was carried out as follows:
- Mapping the ASC network and identifying key stakeholders.
Mapping the ASC network and identifying key stakeholders ensured that the network represents agribusiness operations in West Papua, such as embodying estate crops and horticultural crops and the key stakeholders involved. Yang and Zou (2014, p. 11) [41] state that every network consist of two components, nodes and links. Similarly, Tabassum et al. (2018, p. 1) [57] define a network as ‘the relation/link between its nodes’. Hence, this stage identified the nodes. The nodes in this research were the identified stakeholders, and the links were the relationships between the stakeholders. To complete this step, the literature review and expert interviews were used.
- b.
- Establish risks and their significance in the ASC from a stakeholders’ perspective.
In this step, the risks in the ASC were established based on stakeholder perspectives. The risks in the ASC exposed to were identified by using risk categories and risk factors. Hence, to establish risks in the ASC, the literature review and expert interviews were used. The collected data and information from identified stakeholders were processed to obtain a risk profile which consisting of risk ID, risk description, associated stakeholder, stakeholder category, and risk category (see Table 1).
All risks link to stakeholders were coded numerically as SiRj, where I is the number of associated stakeholders and j is the risk number linked to the stakeholder. For example, S1R1 is the first risk associated with the primary stakeholder [41] p. 212. At this stage, the nodes in the risk network were identified.
- c.
- Conduct risk analysis for identified risks.
After identifying the risks, the next step was risk analysis. There are various software available to conduct risk analysis, including UCINET, NetMiner, NetDraw, and Pajek [41] p. 212. In this study, UCINET 6.0 was employed to obtain the degree and risk propagation in the palm oil SC in West Papua. The result of this analysis is a visualisation of the risk network. The risk networks are represented by graph G (N, K), where the identified risks were mapped into N nodes connected by unbalanced K arrows [58] p. 7; 41 p. 212. The risk network is a directed network, while each arrow from SiRi to SjRj shows a potential causal relationship directed between risk networks (see Figure 1). Risk networks are distinguished by shapes, colours, and thickness; for instance, the use of node shapes to indicate stakeholder groups, colours to represent risk types and the thickness of the links to signify impact levels.
- d.
- Establish interrelationships among risks and study how each risk affects the others in the network.
This phase seeks to establish the interrelationships among identified risks and the degrees of influence of the interrelations, namely the impact between risks and likelihoods of the impact. Hence, this step involves the visualisation and decipherment of the risk network. Yang and Zou (2014, p. 212) [41] state that within the organisational structure, there are three basic types of relationships between each pair of risk: independent, in which risks are not related to each other; a direct impact between two risks; and interdependent risks involved in interdependent relationships, directly or in a larger circle.
The risk structure matrix (RSM) was used to complete this step [59] p. 73, [41] p. 212. There are two methods to develop an RSM: workshops and a Delphi survey. Both of these methods were carried out to achieve a consensus among identified stakeholders. The outcomes were defined links in the risk network. Examples of an RSM is provided in Table 2 and a risk network is shown in Figure 1.
Figure 1.
Example of risk network (Adapted from: Fang et al. 2012, p. 7; Yang & Zou 2014, p. 212) [58,41].
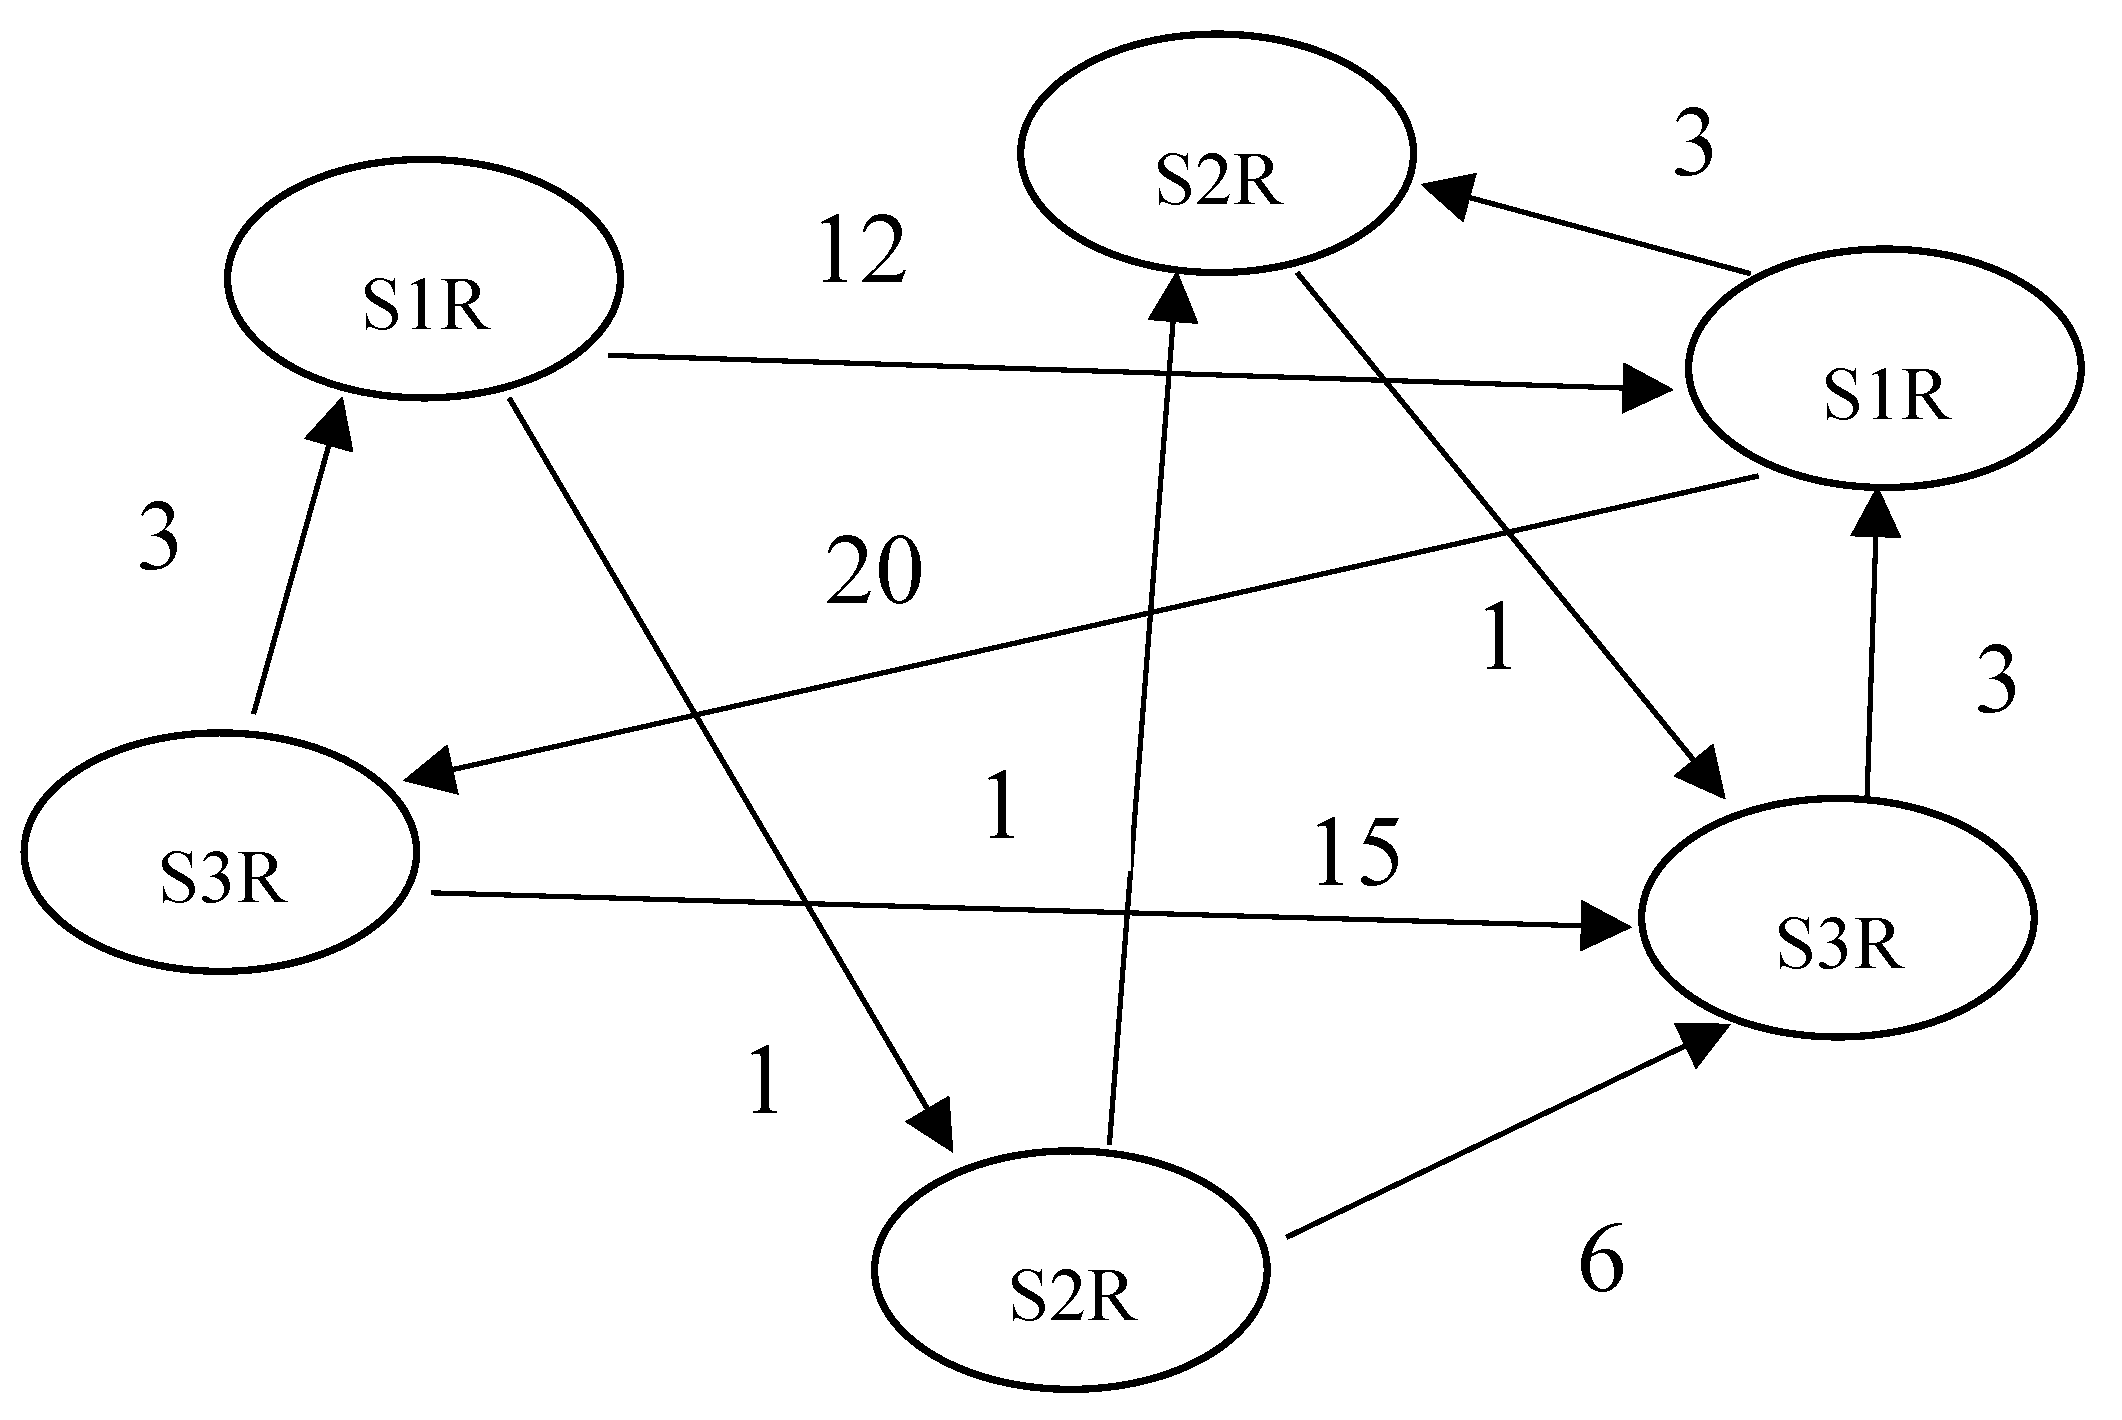
The two digits in brackets in Table 2 indicate impact and likelihood. The left digit is the impact between the risks, and the right digit is the likelihood of the impact. Both are measured using the same five-point scale, whereas ‘5’ is extremely high, and ‘1’ is extremely low. For example, in Table 2, the number (5,4) indicates the first risk associated with Stakeholder 2 (S1R2) has an extremely high level (i.e., 5) of impact on the third risk associated with Stakeholder 2 (S3R2), and the likelihood of the impact is high (i.e., 4). The interrelations among the risks or the degrees of influence of the interrelations (impact*likelihoods) can be seen in Figure 1. For example, there is an arrow from S1R2 to S3R2 with the digit 20 obtained from (5*4). In short, Figure 1 illustrates the complexity of interactions among risks to provide information regarding their position in the network, including their impact among others and the likelihood of their impact.
Once the degree of the risk network and the interrelationships among risks were established, risk mitigation strategies for the ASC were established. The degree of nodes, betweenness centrality, centrality status, brokerage and partition [41] p. 214 were assessed, as follow:
- -
- The degree of nodes, to identify risks that have a higher immediate impact on others, and especially to screen the risks of ‘isolate’, ‘transmitter’ and ‘receiver’ types.
- -
- Betweenness centrality, to identify risks and interrelations that have control over higher impacts passing through.
- -
- Status centrality, to identify risks that have a higher overall impact in the whole network.
- -
- Brokerage, to identify risks that play critical roles between different stakeholder/risk categories.
- -
- Partition, to indicate the coordination and communication strategies between different stakeholder/risk groups.
2. Results and Findings
4.1. Results of Social Network Analysis
Stakeholder-associated risks in palm oil supply chains in West Papua can be seen in Figure 2.
There are four ways to determine centrality in a network, namely eigenvector centrality, degree centrality, closeness centrality, and betweenness centrality.
4.1.1. Eigenvector Centrality
Eigenvector centrality is a measure of the importance of a node in a network, and based on the assignment of a relative score to each node and measures how well a given actor is connected to other well-connected actors [57]. Eigenvector centrality is used to give higher weight to actors who are connected to other actors. So which actor has a higher weight connected to other actors or is the highest central connected to other actors. In determining the eigenvector value, the highest eigenvector value is taken. The key risks according to eigenvector centrality can be seen in Table 3.
Table 3 shows that the top five risks with the highest eigenvector values such as SFR10 (low work ethics and motivation), PCR14 (disruption of the plantation company’s operation), SFR4 (low FFB production), SFR19 (unstable farmers’ income), and PCR 18 (inadequate road facilities and infrastructures). These risks become the highest central connected to other actors.
4.1.2. Degree Centrality
According to Yang and Zou (2014) [41], degree of nodes provides an indication of the immediate connectivity characteristic of a risk. The authors further explain that ‘In-degree’ refers to incoming relations (impacted by) and ‘out-degree’ to outcoming relations (impact to). Nodes can be categorised into 5 types according to the degree. The first type, ‘isolate’ node means that it does not have any links. The second type, ‘transmitter’ means that the node has only out links and no in links. The third type, ‘receiver’ node has only in links and no out links. The fourth type, ‘carrier’ node requires that both in-degree and out-degree are equal to 1. The last, ‘ordinary’ type means the node which does not fall in above-mentioned categories [41]. Table 4 provides the key risks according to degree centrality.
Table 4 shows that there are three types of nodes according to the degree centrality, namely carrier, transmitter, and receiver. The risks included in the ‘carrier’ category are SF (R1, R2, R4, R5, R8, R10, R15, R20), and PC (R14, R18, R25, R31). Then, the risks included in the ‘receiver’ category are SF (R3, R17, R19, R21, R24), PC (R2, R3, R17) and LCR13. Meanwhile, the risks included in the ‘transmitter’ category are SF (R6, R7, R9, R12, R22, R26, R30), PC (R12, R16, R23, R27, R28, R32), LCR11, and GAR29.
Understanding the degree of between-group connectivity (along with the nature of the work task) thus informs the design of effective and efficient work practices [60].
4.1.3. Closeness Centrality
Closeness is a rough measure of the overall position of an actor in the network, giving an idea about how long it will take to reach other nodes from a given starting node. Formally, it is the mean length of all shortest paths from one node to all other nodes in the network [57]. Table 5 provides the key risks according to the closeness centrality.
Table 5 shows that the majority of risks (21 risks) have higher outclose values than inclose values, namely SF (R1, R6, R7, R9, R12, R15, R20, R22, R26, R30), LCR11, PC (R12, R16, R18, R23, R25, R27, R28, R31, R32), and GAR29. This means that there are more risks have length node to reach other nodes in the network than the shortest paths. Meanwhile, only one risk (SFR2) who has the same value of outclose and inclose, and there are 14 risks which have higher inclose values than outclose values, such as SF (R3, R4, R5, R8, R10, R17, R19, R21, R24), PC (R2, R3, R14, R17), and LCR13.
4.1.4. Betweenness Centrality
Betweenness centrality indicates the incidence with which a given node/link falls between two other nodes/links [61]. Betweenness centrality helps to identify risks and interrelations which have control over higher impact passing through it [41]. Table 6 displays the key risks according to betweenness centrality.
Table 6 shows that risks with the highest betweenness centrality such as SFR10 (low work ethics and motivation), PCR14 (disruption of the plantation company’s operation), SFR4 (low FFB production), SFR1 (fluctuation of FFB price), and SFR15 (delay in transporting FFB after harvesting). These risks nodes/links have crucial roles in propagating risks among actors in the palm oil supply chain in West Papua
5. Discussion
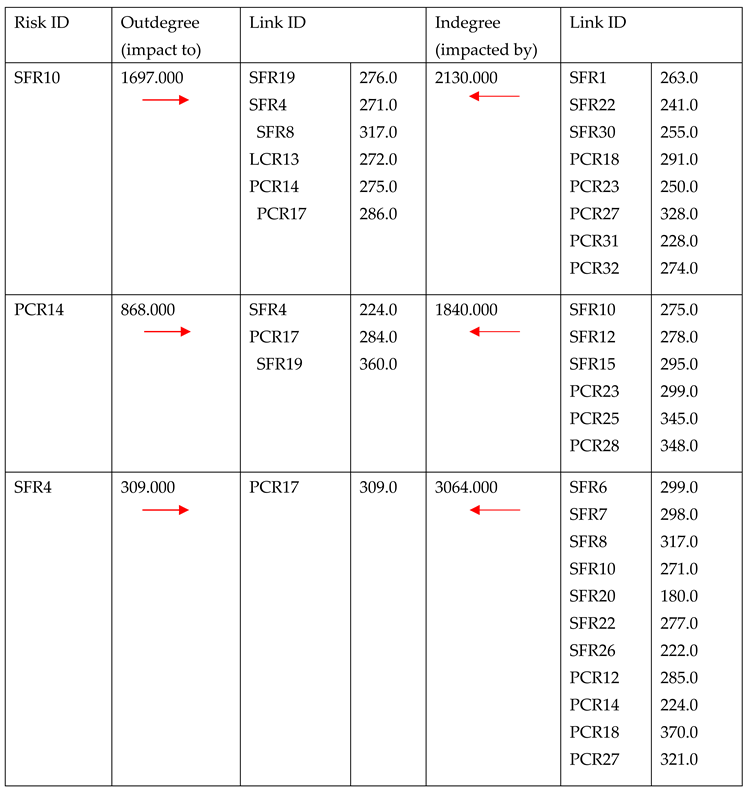
According to these results of network analysis, SFR10, PCR14, and SFR4 are the top three risks nodes/links that have the highest eigenvector values and betweenness centrality that become the highest central who connected to other actors and have crucial roles in propagating risks among actors in the palm oil supply chain in West Papua. Moreover, this result is in line with the result of degree centrality in Table 4 that these three risks, SFR10, PCR14, and SFR4, included in the carrier node category. A summary of degree centrality of the top three risks nodes/links in palm oil supply chains in West Papua can be seen in Table 7.
Table 7 illustrates that the values of indegree (impacted by) of three risks are higher than the values of outdegree (impact to) which means that there are more incoming relations (impacted by other risks) than outcoming relations (impact to other risks). For instance, SFR10 (low work ethics and motivation of the farmers) is impacted by eight risks, such as fluctuation of FFB price (SFR1), pests and diseases (SFR22), uncertainty of land policies and tenure (SFR30), inadequate road facilities and infrastructure (PCR18), conflict between the customary right owner and the plantation company (PCR23), high rainfall density (PCR27), lack of transparency in terms of instalments of debt payments (PCR31), and lack of transparency in terms of sorting and weighing FFB (PCR32). On the other hand, SFR10 has an impact to six risks, namely unstable farmers’ income (SFR19), low FFB production (SFR4), low human resource capacity to maintenance farm (SFR8), cooperative sustainability risks (LCR13), disruption of the plantation company’s operation (PCR14), and plantation company does not reach CPO production target (PCR17).
Meanwhile, PCR14 (disruption of the plantation company’s operation) is impacted by six risks, such as low work ethics and motivation (SFR10), lack of skilled workers (SFR12), delay in transporting FFB after harvesting (SFR15), conflict between the customary right owner and the plantation company (PCR23), conflict between the plantation company and the local government (PCR25), and revoking business license (PCR28). Likewise, PCR14 has an impact to three risks, such as low FFB production (SFR4), plantation company does not reach CPO production target (PCR17), and unstable farmers’ income (SFR19).
Then, SFR4 (low FFB production) is impacted by eleven risks, namely low human resource capacity to access input (SFR6), low human resource capacity to operate equipment (SFR7), low human resource capacity to maintenance farm (SFR8), low of work ethics and motivation of the farmers (SFR10), high labour costs (SFR20), pests and diseases (SFR22), work accidents (SFR26), lack of skilled workers (PCR12), disruption of the plantation company’s operations (PCR14), inadequate road facilities and infrastructure (PCR18), and high rainfall density (PCR27). In contrast, SFR4 has an impact to only one risk, namely plantation company does not reach CPO production target (PCR17).
The results of degree centrality in Table 4 of the top three risks nodes/links in palm oil supply chains in West Papua are in line with the results of closeness centrality in Table 5. For instance, SFR10 (low work ethics and motivation of the farmers) is impacted by eight risks that part of the majority of risks that have higher outclose value (length node to reach other nodes in the network). On the other hand, SFR10 has an impact to six risks that have higher inclose values. The same explanation also applies to PCR14 (disruption of the plantation company’s operation) and SFR4 (low FFB production).
Based on these results, the top three risks should be treated with caution, such as preventive actions or confinement actions. Fang et al. (2012) state that confinement actions are quite new in the project management field, where the actions are focused on risk nodes only. The results obtained in the SNA application demonstrate the usefulness of network-based analysis for risk management in the palm oil supply chain. The proposed indicators provide useful information for key stakeholders to understand risks and their relationships in the palm oil supply chain in West Papua. Moreover, this information allows key stakeholders, such as project managers to plan appropriate mitigation actions for specific type of risks. These actions are included in the risk response plan, as part of the project plan, to adequately manage the required resources, budget, and time. Without this analysis, the key stakeholders would not have decided to plan actions against these specific risks. Therefore, paying attention to 29 risks out of the top risks especially at the beginning of the project or activity, can help avoid many problems that arise at a later stage in the supply chain. In this sense, several approaches are likely more effective for risks in palm oil supply chain in West Papua, such as preventive measures or containment, corrective or protective actions that are often designed to accumulate risks and to reduce losses, and avoidance or a combination of strategies that can be applied to transition risks to mitigate risk spread. Without this approach, the supply chain actors, such as project manager would not have decided to take action on this specific risk [58]. For instance, managing risks in the palm oil supply chain in West Papua can be done through four essential strategies (see Figure 3), namely, First, improving coordination, partnership, and collaborative work among key stakeholders to meet ISPO (Indonesian Sustainable Palm Oil) standard. Second, overhauling and improving good governance of licensing to guarantee palm oil business sustainability. Third, strengthening economic and preserving ecological based on indigenous knowledge. Fourth, conducting research and development to provide recent data and information related to palm oil.
6. Conclusions
This is one of the first studies on risk propagation in palm oil SCs in the Indonesian palm oil industry in West Papua. The result of network analysis displays that only the top three risks nodes/links are having crucial roles in propagating risks among actors in the palm oil supply chain in West Papua, namely R10 (low work ethics and motivation), R14 (disruption of the plantation company’s operation), and R4 (low FFB production).
In West Papua, the risks in palm oil SCs are predominantly caused by competing of interest between multiple stakeholders. Hence, this study contributes significantly to providing recent data and information regarding risk propagation in palm oil SCs in West Papua. In addition, it is expected that the results of this study will have a significant impact in assisting the planning, implementation, and evaluation of palm oil SCs, to overcome several crucial issues in West Papua such as deforestation, poverty, food insecurity, unemployment, and economic growth.
Despite the important findings, this research does contain a limitation that should be addressed, namely this study is limited to only three regencies in the West Papua province. Accordingly, future studies replicating this research across multiple regencies and provinces either in Indonesia or other developing countries would increase the understanding of risk propagation and its impacts on palm oil SCs worldwide.
Author Contributions
Conceptualisation, S.I., R.R., N.C. and L.S.; methodology, S.I., R.R., N.C. and L.S.; validation, R.R., N.C. and L.S.; resources, S.I., R.R., N.C. and L.S.; investigation: S.I.; writing—original draft preparation, S.I.; writing—review and editing, R.R., N.C. and L.S.; visualisation, S.I.; supervision, R.R., N.C. and L.S. All authors have read and agreed to the published version of the manuscript.
Funding
This research received no external funding
Institutional Review Board Statement
Not applicable
Informed Consent Statement
Not applicable
Data Availability Statement
Data generated or analysed during the study are available from the corresponding author by request.
Acknowledgments
The authors would like to acknowledge the Australian government’s financial support through an Australian Award Scholarship for PhD studies and support from the University of South Australia. The authors would like to thank anonymous reviewers for their constructive feedback to improve the quality of the paper.
Conflicts of Interest
The authors declare no conflict of interest with respect to the research, authorship and/or publication of this article.
References
- Dolgui, Ivanov, D & Sokolov, B 2022, Supply Network Dynamics and Control, Springer, Cham, Switzerland.
- Helbing, D 2013, 'Globally networked risks and how to respond', Nature, vol. 497, May 2, pp. 51-59. [CrossRef]
- Novak, DC, Wu, Z & Dooley, KJ 2021, 'Whose resilience matters? Addressing issues of scale in supply chain resilience', Journal of Business Logistics, vol. 42, no. 3, pp. 323-335. [CrossRef]
- Wieland, A & Durach, CF 2021, 'Two perspectives on supply chain resilience', Journal of Business Logistics, vol. 42, no. 3, pp. 315-322. [CrossRef]
- Chand, P, Kumar, A, Thakkar, J & Ghosh, KK 2022, 'Direct and mediation effect of supply chain complexity drivers on supply chain performance: An empirical evidence of organizational complexity theory', International Journal of Operations & Production Management, vol. 42, no. 6, pp. 797-825. [CrossRef]
- Ivanov 2020, 'Viable supply chain model: Integrating agility, resilience and sustainability perspectives-lessons from and thinking beyond the COVID-19 pandemic', Annals of Operations Research, May 22, pp. 1-21.
- Chaudhuri, A, Srivastava, SK, Srivastava, RK & Parveen, Z 2016, 'Risk propagation and its impact on performance in food processing supply chain', Journal of Modelling in Management, vol. 11, no. 2, pp. 660-693. [CrossRef]
- Dolgui, A, Ivanov, D & Sokolov, B 2018, 'Ripple effect in the supply chain: An analysis and recent literature', International Journal of Production Research, vol. 56, no. 1-2, pp. 414-430. [CrossRef]
- Li, Y, Zobel, CW, Seref, O & Chatfield, D 2020, 'Network characteristics and supply chain resilience under conditions of risk propagation', International Journal of Production Economics, vol. 223, 107529, pp. 1-13. [CrossRef]
- Ivanov, Dolgui, A & Sokolov, B (eds) 2019, Handbook of ripple effects in the supply chain, Springer Nature, Switzerland.
- Imbiri, S, Rameezdeen, R, Chileshe, N & Statsenko, L 2023b, 'Risk propagation and resilience in the agribusiness supply chain: A systematic literature review', Journal of Agribusiness in Developing and Emerging Economies, vol. 14, no. 4, pp. 712-732. [CrossRef]
- Dza, M. (2024). "Agribusiness Supply Chain Collaboration: Role of Innovation Capacity and Business Process Agility as Antecedents of Supply Chain Performance." Journal of Operations and Strategic Planning, vol. 7, no. 1, pp. 27-47. [CrossRef]
- Banach, JL, Koch, SJI, Hoffmans, Y & van den Burg, SWK 2022, 'Seaweed Value Chain Stakeholder Perspectives for Food and Environmental Safety Hazards', Foods, vol. 11, no. 10, May 23. [CrossRef]
- Aven, T & Renn, O 2019, 'Some foundational issues related to risk governance and different types of risks', Journal of Risk Research, vol. 23, no. 9, pp. 1121-1134. [CrossRef]
- Eijrond, V, Claassen, L, van der Giessen, J & Timmermans, D 2019, 'Intensive Livestock Farming and Residential Health: Experts' Views', International Journal of Environmental Research and Public Health, vol. 16, no. 19, Sep 27. [CrossRef]
- Eijrond, V, Claassen, L & Timmermans, D 2022, 'Residents’ and farmers’ perspectives on risks and benefits of intensive livestock farming', NJAS: Impact in Agricultural and Life Sciences, vol. 94, no. 1, pp. 24-46.
- Eijrond, V, Claassen, L & Timmermans, D 2023, 'Contrasting perspectives on the risks of intensive livestock farming in The Netherlands: A survey study', Journal of Risk Research, pp. 1-20. [CrossRef]
- Nguyen, THD, Chileshe, N, Rameezdeen, R & Wood, A 2019, 'Stakeholder influence pathways in construction projects: Multicase study', Journal of Construction Engineering and Management, vol. 145, no. 9. [CrossRef]
- Dandage, RV, Mantha, SS & Rane, SB 2019, 'Strategy development using TOWS matrix for international project risk management based on prioritization of risk categories', International Journal of Managing Projects in Business, vol. 12, no. 4, pp. 1003-1029. [CrossRef]
- Devitt, C, Boyle, L, Teixeira, DL, O'Connell, NE, Hawe, M & Hanlon, A 2016, 'Stakeholder perspectives on the use of pig meat inspection as a health and welfare diagnostic tool in the Republic of Ireland and Northern Ireland; a SWOT analysis', Irish Veterinary Journal, vol. 69, p. 17. [CrossRef]
- Finney, S 2011, 'Stakeholder perspective on internal marketing communication', Business Process Management Journal, vol. 17, no. 2, pp. 311-331. [CrossRef]
- Ongkowijoyo, C & Doloi, H 2017, 'Determining critical infrastructure risks using social network analysis', International Journal of Disaster Resilience in the Built Environment, vol. 8, no. 1, pp. 5-26. [CrossRef]
- Yang, RJ, Zou, PXW & Wang, J 2016, 'Modelling stakeholder-associated risk networks in green building projects', International Journal of Project Management, vol. 34, pp. 66-81. [CrossRef]
- Imbiri, S, Rameezdeen, R, Chileshe, N & Statsenko, L 2023a, 'Risk propagation and resilience in the agribusiness supply chain: A systematic literature review', Journal of Agribusiness in Developing and Emerging Economies, vol. 14, no. 4, pp. 712-732. [CrossRef]
- Hadiguna, RA & Tjahjono, B 2017, 'A framework for managing sustainable palm oil supply chain operations: a case of Indonesia', Production Planning & Control, vol. 28, no. 13, pp. 1093-1106. [CrossRef]
- Obidzinski, K, Dermawan, A & Hadianto, A 2014, 'Oil palm plantation investments in Indonesia’s forest frontiers: Limited economic multipliers and uncertain benefits for local communities', Environment, Development and Sustainability, vol. 16, no. 6, pp. 1177-1196. [CrossRef]
- Kesaulija, FF, Sadsoeitoebeon, BMG, Peday, HFZ, Tokede, MJ, H., K, Andriani, R & Obidzinski, K 2014, Oil palm estate development and its impact on forests and local communities in west papua: a case study on the prafi plain, CIFOR.
- Matualage, A, Hariadi, SS & Wiryono, P 2019, 'Management of plam oil in the core plasma PTPN II Prafi partnership pattern with Arfak Farmers in Manokwari, Papua Barat', suppl. 1, JSEP, vol. 12, no. Maret 2019, p. 28.
- Sumule, A 1994, 'Chapter four selected aspects of Irian Jaya province and the Arfak land', University of Queensland.
- Unipa & CI 2017a, Keadaan sosial ekonomi dan implikasinya dalam pelaksanaan provinsi konservasi di Provinsi Papua Barat 2017, Universitas Papua, Conservation International.
- Safriyana, Marimin, E., A & Sailah, I 2019, 'Operational risk evaluation and mitigation for palm oil supply chain: a case study at x co.', IOP Conf. Series: Earth and Environmental Science, IOP Publishing, pp. 1-14.
- Gilbert, N 2012, 'Palm-oil boom raises conservation concerns', N A T U R E, vol. 487, no. 15 July, p. 2.
- Lai, JY, Mardiyaningsih, DI, Rahmadian, F & Hamzah, N 2022, 'What evidence exists on the impact of sustainability initiatives on smallholder engagement in sustainable palm oil practices in Southeast Asia: a systematic map protocol', Environmental Evidence, vol. 11, no. 1. [CrossRef]
- Obidzinski, K, Andriani, R, Komarudin, H & Andrianto, A 2012, 'Environmental and Social Impacts of Oil Palm Plantations and their Implications for Biofuel Production in Indonesia', Ecology and Society, vol. 17, no. 1. [CrossRef]
- Mareeh, HYS, Prabakusuma, AS, Hussain, MD, Patwary, AK, Dedahujaev, A & Aleryani, RA 2022, 'Sustainability and profitability of Malaysia crude palm oil supply chain management: system dynamics modelling approach', Nankai Business Review International. [CrossRef]
- Qaim, M, Sibhatu, KT, Siregar, H & Grass, I 2020, 'Environmental, economic, and social consequences of the oil palm boom', Annual Review of Resource Economics, vol. 12, no. 1, pp. 321-344. [CrossRef]
- Anugerah, AR, Ahmad, SA, Samin, R, Samdin, Z & Kamaruddin, N 2021, 'Modified failure mode and effect analysis to mitigate sustainable related risk in the palm oil supply chain', Advances in Materials and Processing Technologies, pp. 1-15. [CrossRef]
- Monzon, JP, Lim, YL, Tenorio, FA, Farrasati, R, Pradiko, I, Sugianto, H, … Grassini, P 2023, 'Agronomy explains large yield gaps in smallholder oil palm fields', Agricultural Systems, vol. 210. [CrossRef]
- Agustina, Vanany, I & Siswanto, N 2023, 'Vulnerability and capability factors for the indonesian biodiesel supply chain resilience', International Conference on Biomass and Bioenergy, IOP Publishing: IOP Conference Series: Earth and Environmental Science, p. 10.
- de Vos, RE, Nurfalah, L, Tenorio, FA, Lim, YL, Monzon, JP, Donough, CR, … Slingerland, M 2023, 'Shortening harvest interval, reaping benefits? A study on harvest practices in oil palm smallholder farming systems in Indonesia', Agricultural Systems, vol. 211. [CrossRef]
- Yang, RJ & Zou, PXW 2014, 'Stakeholder-associated risks and their interactions in complex green building projects: A social network model', Building and Environment, vol. 73, pp. 208-222. [CrossRef]
- He, Z, Huang, D, Zhang, C & Fang, J 2018, 'Toward a Stakeholder Perspective on Social Stability Risk of Large Hydraulic Engineering Projects in China: A Social Network Analysis', Sustainability, vol. 10, 1223, no. 4, pp. 1-15. [CrossRef]
- Li, Hong, J, Xue, F, Shen, GQ, Xu, X & Mok, MK 2016, 'Schedule risks in prefabrication housing production in Hong Kong: a social network analysis', Journal of Cleaner Production, vol. 134, pp. 482-494.
- Yang, RJ, Zou, PXW & Wang, J 2016, 'Modelling stakeholder-associated risk networks in green building projects', International Journal of Project Management, vol. 34, pp. 66-81. [CrossRef]
- Yu, T, Shen, GQ, Shi, Q, Lai, X, Li, CZ & Xu, K 2017, 'Managing social risks at the housing demolition stage of urban redevelopment projects: A stakeholder-oriented study using social network analysis', International Journal of Project Management, vol. 35, pp. 925-941. [CrossRef]
- Forza, C 2002, 'Survey research in operations management: a process-based perspective', International Journal of Operations & Production Management, vol. 22, no. 2, pp. 152-194. [CrossRef]
- Hwang, B-G, Zhao, X & Gay, MJS 2013, 'Public private partnership projects in Singapore: Factors, critical risks and preferred risk allocation from the perspective of contractors', International Journal of Project Management, vol. 31, no. 3, pp. 424-433. [CrossRef]
- Le, PT, Chileshe, N, Kirytopoulos, K & Rameezdeen, R 2020, 'Investigating the significance of risks in BOT transportation projects in Vietnam', Engineering, Construction and Architectural Management, vol. 27, no. 6, pp. 1401-1425. [CrossRef]
- Osei-Kyei, R & Chan, APC 2017, 'Factors attracting private sector investments in public–private partnerships in developing countries', Journal of Financial Management of Property and Construction, vol. 22, no. 1, pp. 92-111. [CrossRef]
- Adnan, N, Nordin, SM & bin Abu Bakar, Z 2017, 'Understanding and facilitating sustainable agricultural practice: A comprehensive analysis of adoption behaviour among Malaysian paddy farmers', Land Use Policy, vol. 68, pp. 372-382. [CrossRef]
- Carbonara, N, Costantino, N, Gunnigan, L & Pellegrino, R 2015, 'Risk Management in Motorway PPP Projects: Empirical-based Guidelines', Transport Reviews, vol. 35, no. 2, pp. 162-182. [CrossRef]
- Koo, M. and S.-W. Yang (2025). "Likert-Type Scale." Encyclopedia Vol 5, no 1, pp. 1-11. [CrossRef]
- Weathers, D, Sharma, S & Niedrich, RW 2005, 'The impact of the number of scale points, dispositional factors, and the status quo decision heuristic on scale reliability and response accuracy', Journal of Business Research, vol. 58, no. 11, pp. 1516-1524. [CrossRef]
- Sharma, H 2022, 'How short or long should be a questionnaire for any research? Researchers dilemma in deciding the appropriate questionnaire length', Saudi J Anaesth, vol. 16, no. 1, Jan-Mar, pp. 65-68. [CrossRef]
- Leavy, P 2017, Research design: Quantitative, qualitative, mixed methods, arts-based, and community-based participatory research approaches, The Guilford Press, New York London.
- Rolstad, S, Adler, J & Ryden, A 2011, 'Response burden and questionnaire length: is shorter better? A review and meta-analysis', Value Health, vol. 14, no. 8, Dec, pp. 1101-1108. [CrossRef]
- Tabassum, S, Pereira, FSF, Fernandes, S & Gama, J 2018, 'Social network analysis: An overview', WIREs Data Mining and Knowledge Discovery, vol. 8, no. 5, pp. 1-21.
- Fang, C, Marle, F, Zio, E & Bocquet, J-C 2012, 'Network theory-based analysis of risk interactions in large engineering projects', Reliability Engineering & System Safety, vol. 106, pp. 1-10. [CrossRef]
- Steward, DV 1981, 'The design structure system: A method for managing the design of complex system', IEEE Transactions On Engineering Management, vol. 28, no. 3, pp. 71-74. [CrossRef]
- Parise, S 2007, 'Knowledge Management and Human Resource Development: An Application in Social Network Analysis Methods', Advances in Developing Human Resources, vol. 9, no. 3, pp. 359-383. [CrossRef]
- Pryke, S 2012, Social network analysis in construction, Wiley-Blackwell, Oxford, UK.
Figure 2.
Stakeholder-associated risks and their interactions in palm oil supply chains in West Papua. Note(s): SFR(smallholder farmers risk), PCR (plantation company risk), LCR (local cooperative risk), GAR (government agency risk).
Figure 2.
Stakeholder-associated risks and their interactions in palm oil supply chains in West Papua. Note(s): SFR(smallholder farmers risk), PCR (plantation company risk), LCR (local cooperative risk), GAR (government agency risk).
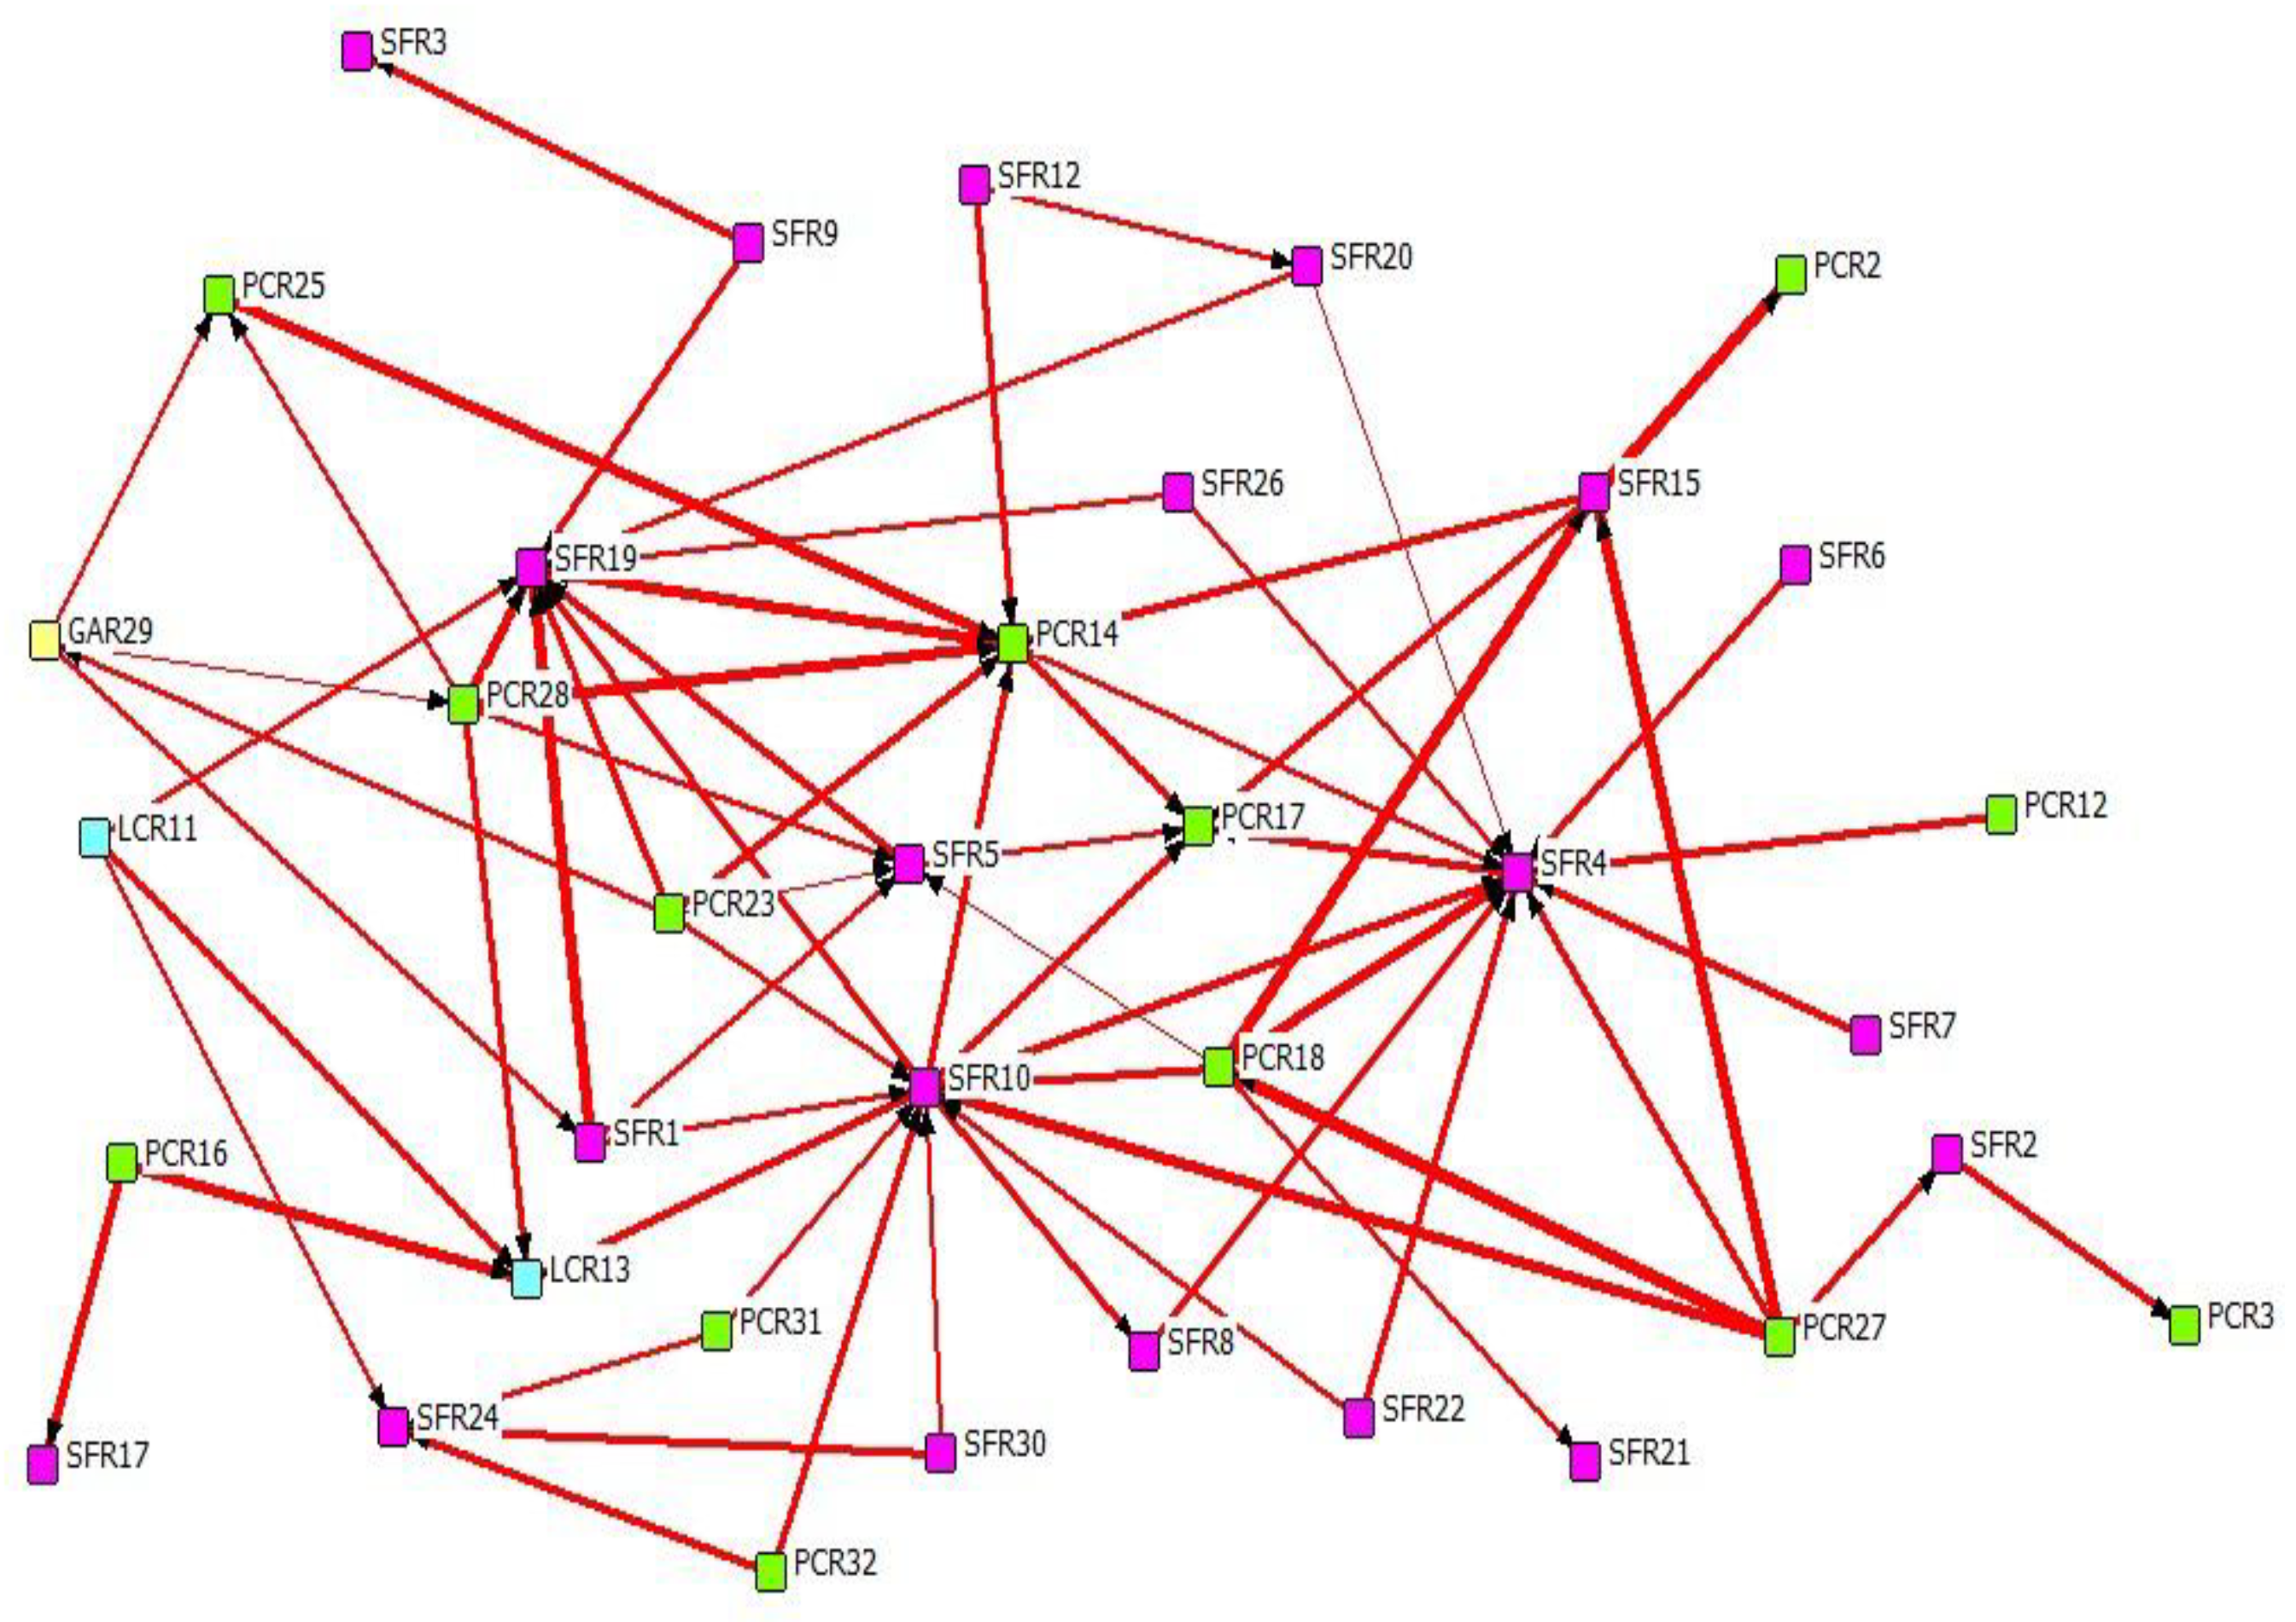
Figure 3.
Risk Resilience Framework For Palm Oil Supply Chain in West Papua.
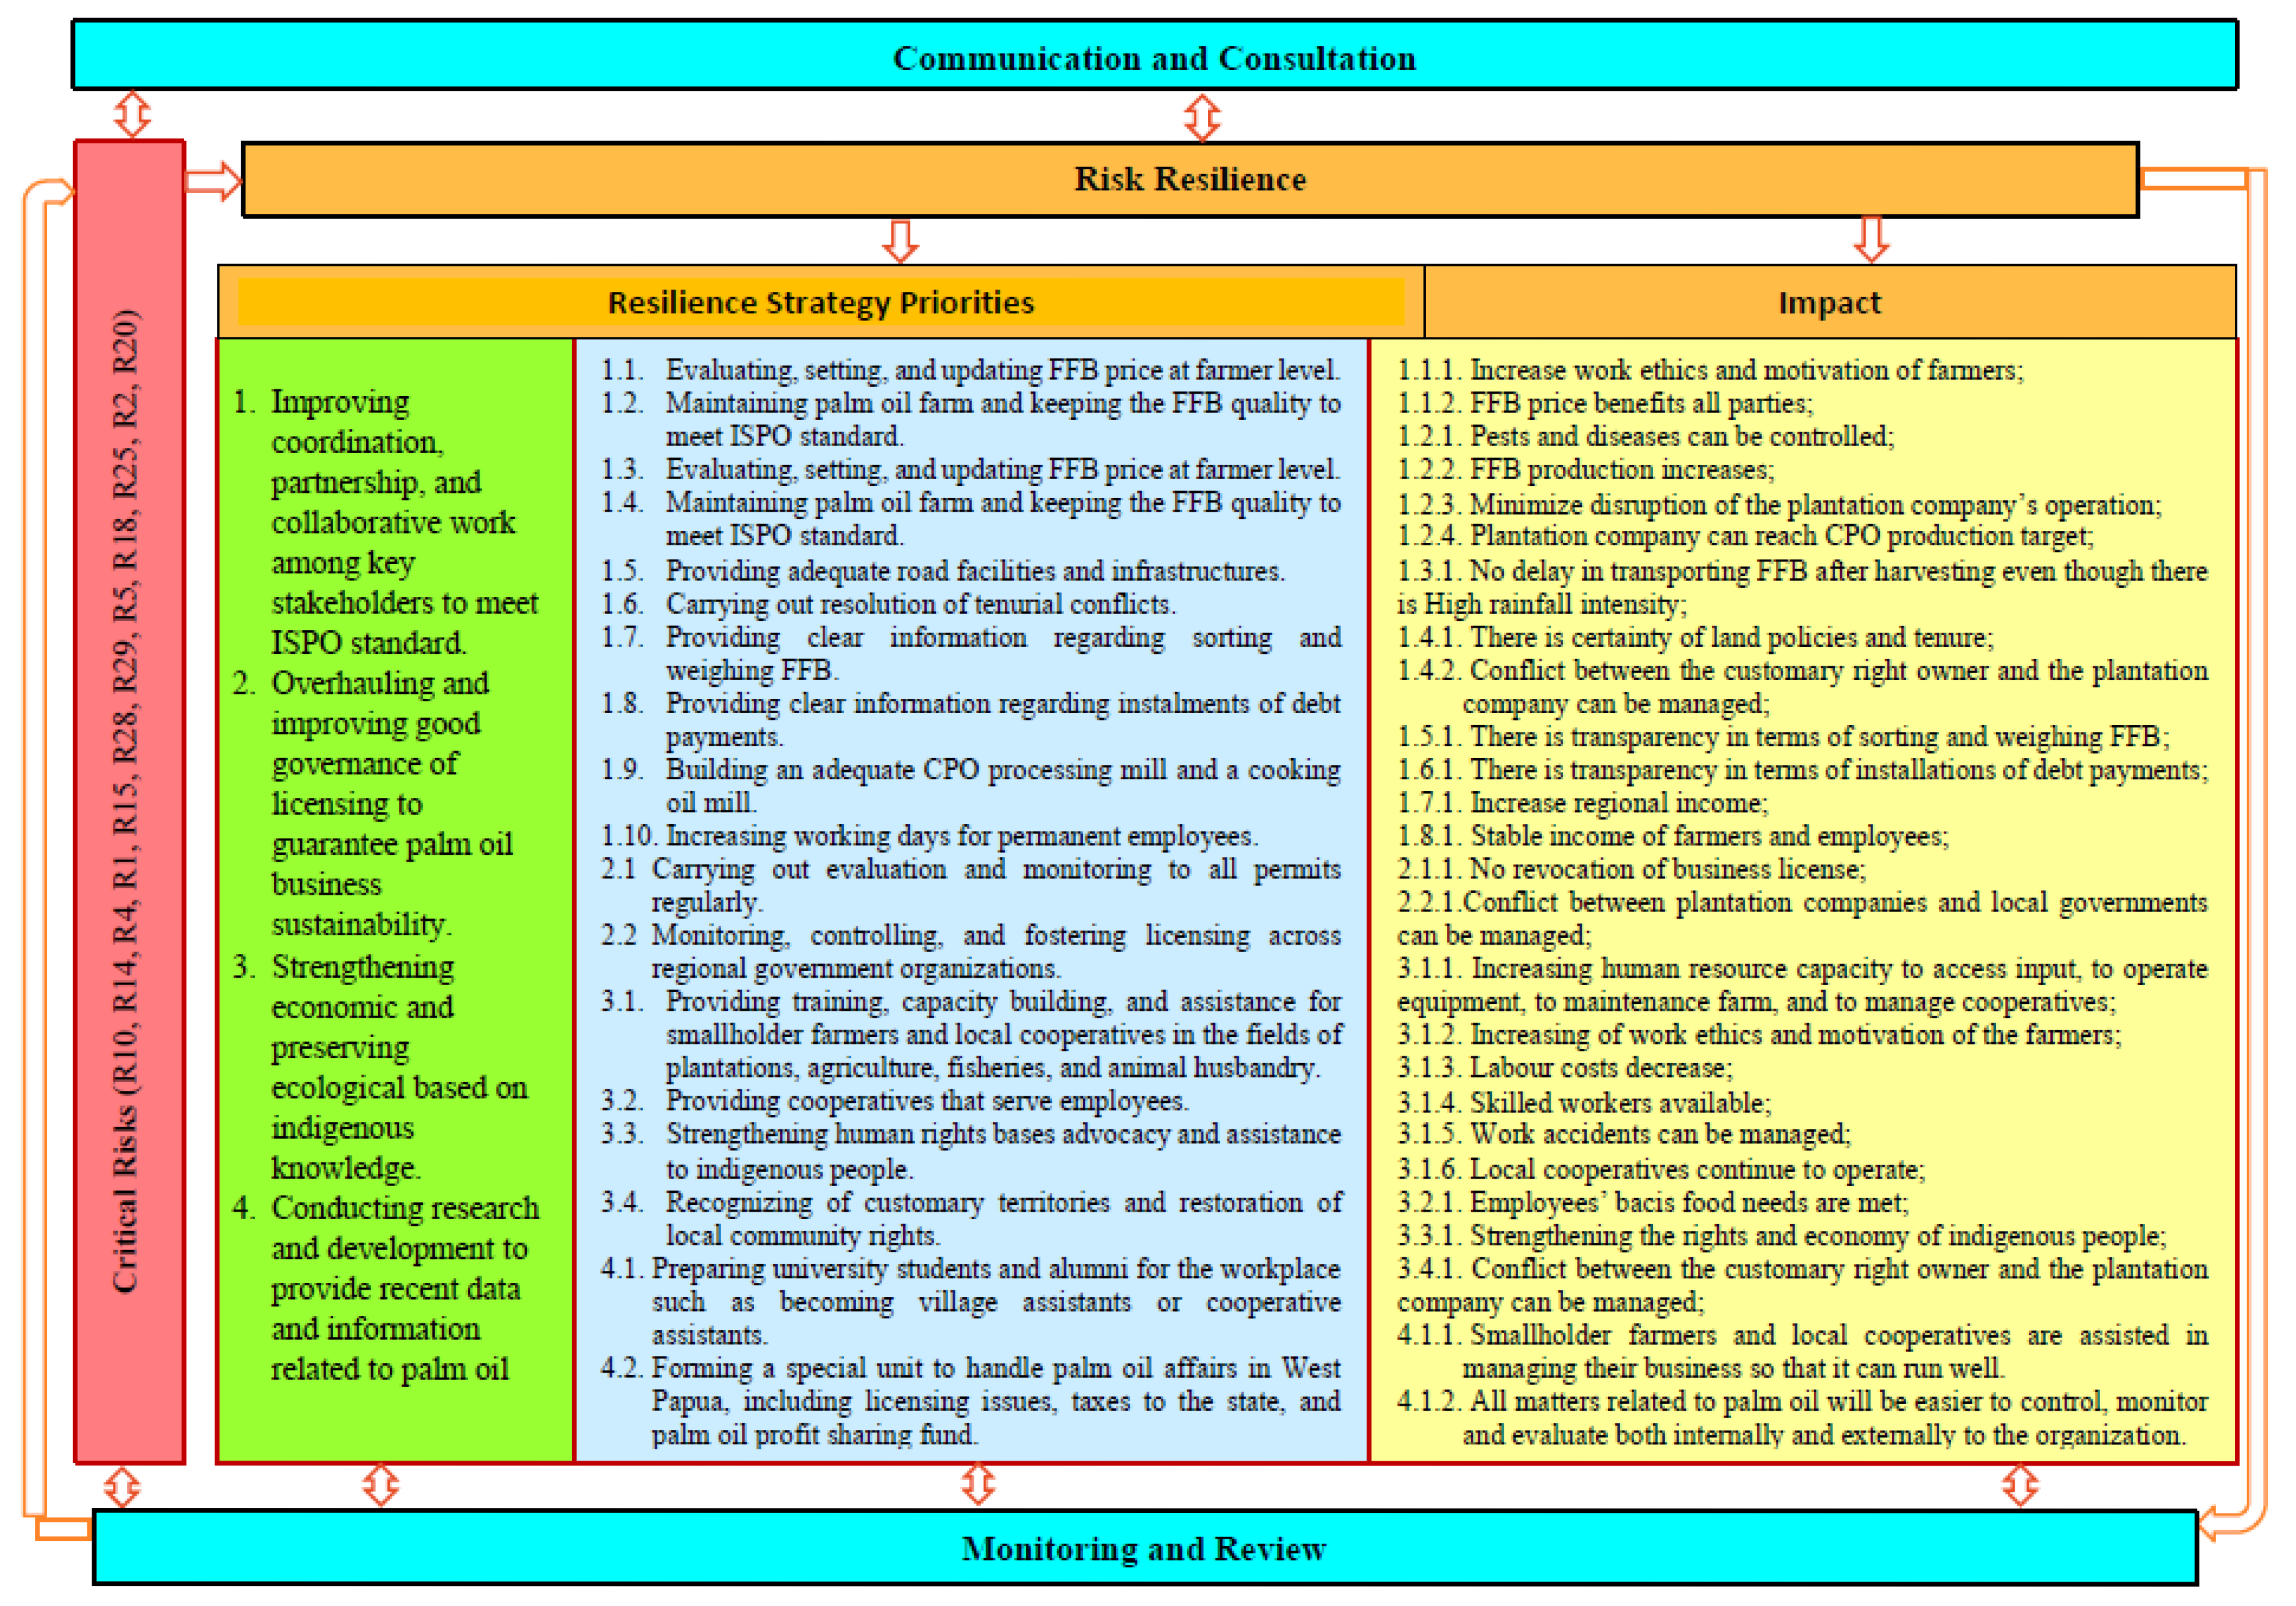

Table 1.
Illustration of risk profile.
| Risk ID | Risk description |
Associated stakeholder | Stakeholder category | Risk category |
| S1R1 |
(Source: Yang & Zou 2014, p. 212) [41].
Table 2.
An example of a risk structure matrix (RSM).
| S1R1 | S1R2 | S2R1 | S2R2 | S3R1 | S3R2 | |
|---|---|---|---|---|---|---|
| S1R1 | (3,4) | (4,3) | ||||
| S1R2 | (3,1) | (5,4) | ||||
| S2R1 | (3,4) | |||||
| S2R2 | (4,3) | (3,2) | ||||
| S3R1 | (1,3) | |||||
| S3R2 | (3,1) | (3,5) |
Table 3.
The key risks according to Eigenvector Centrality.
| Rank | Risk ID | Eigenvector Centrality |
|---|---|---|
| 1 | SFR10 | 0.417 |
| 2 | PCR14 | 0.344 |
| 3 | SFR4 | 0.340 |
| 4 | SFR19 | 0.306 |
| 5 | PCR18 | 0.272 |
Table 4.
The key risks according to degree centrality.
| Risk ID | Outdegree (impact to) |
Indegree (impacted by) |
Types of nodes based on the degree |
|---|---|---|---|
| SFR1 | 892.000 | 232.000 | Carrier |
| SFR2 | 325.000 | 268.000 | Carrier |
| SFR3 | 0.000 | 284.000 | Receiver |
| SFR4 | 309.000 | 3064.000 | Carrier |
| SFR5 | 543.000 | 849.000 | Carrier |
| SFR6 | 299.000 | 0.000 | Transmitter |
| SFR7 | 298.000 | 0.000 | Transmitter |
| SFR8 | 317.000 | 317.000 | Carrier |
| SFR9 | 585.000 | 0.000 | Transmitter |
| SFR10 | 1697.000 | 2130.000 | Carrier |
| SFR12 | 514.000 | 0.000 | Transmitter |
| SFR15 | 1002.000 | 780.000 | Carrier |
| SFR17 | 0.000 | 372.000 | Receiver |
| SFR19 | 0.000 | 2971.000 | Receiver |
| SFR20 | 414.000 | 236.000 | Carrier |
| SFR21 | 0.000 | 262.000 | Receiver |
| SFR22 | 518.000 | 0.000 | Transmitter |
| SFR24 | 0.000 | 1080.000 | Receiver |
| SFR26 | 479.000 | 0.000 | Transmitter |
| SFR30 | 542.000 | 0.000 | Transmitter |
| LCR11 | 766.000 | 0.000 | Transmitter |
| LCR13 | 0.000 | 1194.000 | Receiver |
| PCR2 | 0.000 | 388.000 | Receiver |
| PCR3 | 0.000 | 325.000 | Receiver |
| PCR12 | 285.000 | 0.000 | Transmitter |
| PCR14 | 868.000 | 1840.000 | Carrier |
| PCR16 | 716.000 | 0.000 | Transmitter |
| PCR17 | 0.000 | 1452.000 | Receiver |
| PCR18 | 1497.000 | 413.000 | Carrier |
| PCR23 | 1245.000 | 0.000 | Transmitter |
| PCR25 | 345.000 | 188.000 | Carrier |
| PCR27 | 1723.000 | 0.000 | Transmitter |
| PCR28 | 1425.000 | 0.000 | Transmitter |
| PCR31 | 495.000 | 222.000 | Carrier |
| PCR32 | 587.000 | 0.000 | Transmitter |
| GAR29 | 677.000 | 0.000 | Transmitter |
Table 5.
The key risks according to closeness centrality.
| Risk ID | OutClose | InClose | Risk ID | OutClose | InClose |
|---|---|---|---|---|---|
| SFR1 | 0.289 | 0.259 | SFR26 | 0.265 | 0.250 |
| SFR2 | 0.255 | 0.255 | SFR30 | 0.287 | 0.250 |
| SFR3 | 0.250 | 0.255 | LCR11 | 0.267 | 0.250 |
| SFR4 | 0.255 | 0.398 | LCR13 | 0.250 | 0.318 |
| SFR5 | 0.261 | 0.282 | PCR2 | 0.250 | 0.263 |
| SFR6 | 0.259 | 0.250 | PCR3 | 0.250 | 0.259 |
| SFR7 | 0.259 | 0.250 | PCR12 | 0.259 | 0.250 |
| SFR8 | 0.259 | 0.292 | PCR14 | 0.267 | 0.330 |
| SFR9 | 0.261 | 0.250 | PCR16 | 0.261 | 0.250 |
| SFR10 | 0.287 | 0.307 | PCR17 | 0.250 | 0.389 |
| SFR12 | 0.273 | 0.250 | PCR18 | 0.310 | 0.255 |
| SFR15 | 0.276 | 0.261 | PCR23 | 0.315 | 0.250 |
| SFR17 | 0.250 | 0.255 | PCR25 | 0.267 | 0.265 |
| SFR19 | 0.250 | 0.389 | PCR27 | 0.327 | 0.250 |
| SFR20 | 0.265 | 0.255 | PCR28 | 0.289 | 0.259 |
| SFR21 | 0.250 | 0.259 | PCR31 | 0.287 | 0.250 |
| SFR22 | 0.282 | 0.250 | PCR32 | 0.287 | 0.250 |
| SFR24 | 0.250 | 0.273 | GAR29 | 0.297 | 0.250 |
Table 6.
The key risks according to betweenness centrality.
| Rank | Risk ID | Betweenness centrality |
|---|---|---|
| 1 | SFR10 | 38.450 |
| 2 | PCR14 | 10.400 |
| 3 | SFR4 | 7.083 |
| 4 | SFR1 | 3.733 |
| 5 | SFR15 | 3.583 |
Table 7.
A summary of degree centrality of the top three risks nodes/links in palm oil supply chains in West Papua.
Table 7.
A summary of degree centrality of the top three risks nodes/links in palm oil supply chains in West Papua.
 |
Disclaimer/Publisher’s Note: The statements, opinions and data contained in all publications are solely those of the individual author(s) and contributor(s) and not of MDPI and/or the editor(s). MDPI and/or the editor(s) disclaim responsibility for any injury to people or property resulting from any ideas, methods, instructions or products referred to in the content. |
© 2025 by the authors. Licensee MDPI, Basel, Switzerland. This article is an open access article distributed under the terms and conditions of the Creative Commons Attribution (CC BY) license (https://creativecommons.org/licenses/by/4.0/).
Copyright: This open access article is published under a Creative Commons CC BY 4.0 license, which permit the free download, distribution, and reuse, provided that the author and preprint are cited in any reuse.


