
Submitted:
12 October 2025
Posted:
13 October 2025
You are already at the latest version
Abstract
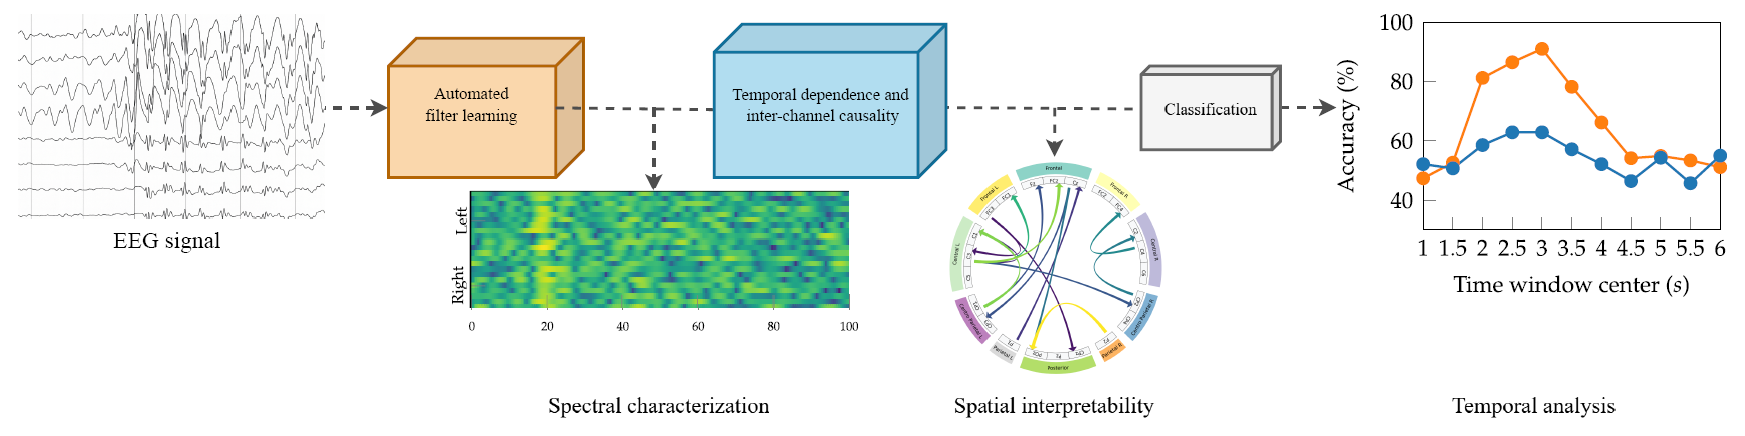
Reliable decoding of motor imagery (MI) from electroencephalographic signals remains a challenging problem due to their nonlinear, noisy, and non-stationary nature. To address this issue, this work proposes an end-to-end deep learning model, termed TEKTE-Net, that integrates time embeddings with a kernelized Transfer Entropy estimator to infer directed functional connectivity in MI-based brain–computer interface (BCI) systems. The proposed model incorporates a customized convolutional module that performs Takens' embedding, enabling the decoding of the underlying EEG activity without requiring explicit preprocessing. Further, the architecture estimates nonlinear and time-delayed interactions between cortical regions using Rational Quadratic kernels within a differentiable framework. Evaluation of TEKTE-Net on semi-synthetic causal benchmarks and the BCI Competition IV 2a dataset demonstrates robustness to low signal-to-noise conditions and interpretability through temporal, spatial, and spectral analyses of learned connectivity patterns. In particular, the model automatically highlights contralateral activations during MI and promotes spectral selectivity for the beta and gamma bands. Overall, TEKTE-Net offers a fully trainable estimator of functional brain connectivity for decoding EEG activity, supporting MI-BCI applications, and promoting interpretability of deep learning models.
Keywords:
brain–computer interface
; electroencephalography
; transfer entropy
; functional connectivity
; causal inference
1. Introduction
Brain–computer interfaces (BCIs) establish a direct connection between the human brain and a computer, thereby enabling the capture of neural activity associated with external stimuli or mental tasks without requiring the involvement of peripheral nerves and muscles [1]. The broad potential of BCI has attracted significant attention from applications such as video game control [1], cognitive and emotional state analysis [2], mental disorder diagnosis, and neuromarketing [3]. BCI has been proven helpful in improving concentration and attentional focus [4] and supporting the diagnosis of Attention Deficit Hyperactivity Disorder [5]. Such improvements promoted the integration of BCI technology into educational contexts, resulting in the enhancement of language comprehension in children and older adults [6]. Hence, these interfaces offer opportunities to enhance individuals’ quality of life, contribute to sustainable development by promoting inclusive, equitable, and quality education, and foster lifelong learning opportunities, as recommended by the United Nations [7].
To extend the capabilities of BCI, motor imagery (MI) techniques enable users to control the movement of an agent in either the physical or virtual world by detecting and decoding brain patterns associated with both actual and imagined movements. MI has been the subject of extensive research due to its significant impact on medical applications, including motor assistance, neurorehabilitation, and functional rehabilitation [8]. In fact, MI-based BCIs have proven effective in neuroprosthetic systems, thereby enhancing the quality of life for patients suffering from motor impairments, such as those resulting from spinal cord injuries, amyotrophic lateral sclerosis, or stroke [9]. Additionally, this kind of BCI has demonstrated its efficacy in various clinical applications, such as neurofeedback training therapies for individuals with Parkinson’s disease [10] and the reduction of behavioral manifestations associated with epilepsy [11].
MI-based BCI relies on the analysis of brain activity recorded using either invasive or non-invasive techniques [12]. The former—such as electrocorticography (ECoG) and intracranial electroencephalography (EEG)—offer high spatial resolution, contributing to their effectiveness. However, invasive techniques suffer from surgery risks and gradual degradation of the electrodes. In contrast, non-invasive approaches, including functional magnetic resonance imaging, magnetoencephalography, near-infrared spectroscopy, and superficial EEG, are more commonly used [13]. In particular, EEG signals and MI-based BCI systems suitably match thanks to high temporal resolution, relatively low cost, portability, minimal risks to users, and ease of brain signal acquisition [14]. However, superficial EEG analysis becomes difficult due to the non-stationarity, low signal-to-noise ratio (SNR), and pulsatile movement artifacts [15]. Besides, gaining spatial resolution demands non-user-friendly electrode setups, relegating their use to controlled laboratory conditions [16] and biasing subjects’ posture and mood [1].
Several works have mitigated the above EEG challenges by utilizing traditional machine learning approaches, which include preprocessing, feature extraction, and classification stages. The preprocessing stage aims to overcome issues related to signal quality, easing the identification of BCI-related patterns. The second stage looks for highly interpretable EEG features supporting the signal discrimination, e.g., common spatial patterns [17], its spectral [18] and nonlinear [19] variants, which profit from interchannel relationships. Brain connectivity, a more interpretable set of features, estimates relationships between brain areas or channels, which are either functional or effective. The functional features provide information about temporal correlations between neurophysiological events occurring at spatially distributed locations within the brain network [20]. In contrast, effective features focus on the causal interactions between neuronal units within the same brain network [21]. Despite being widely informative, the independent tuning of features yields suboptimal discriminative machines.
More recent works have applied deep learning (DL) algorithms as a complete BCI processing system, achieving faster and more accurate classifications of sensory input [22]. Nonetheless, conventional DL models lack the interpretability provided by feature engineering, hampering their use in medical and clinical applications that require understanding and explaining machine responses [23]. Advances in the interpretability of DL have enabled the integration of explicit feature extractors into DL architectures through connectivity features such as the phase-locking value [24] or the cross-spectrum [25]. Nonetheless, they are either plugged at the beginning as a precomputation or in the middle as a rigid calculation, reducing the natural flexibility and adaptability of deep models.
This work aims at bridging the gap between connectivity features and deep learning for MI-based BCI applications through a novel end-to-end network for EEG signal classification, termed TEKTE-Net (Takens-based Kernel Transfer Entropy Connectivity Network). Unlike conventional feature-based approaches, TEKTE-Net integrates signal embeddings with a kernelized Transfer Entropy estimator to decode the underlying EEG activity and quantify directed functional connectivity among cortical regions. The architecture employs one-dimensional convolutional layers to highlight spectral discriminative spectral content from each channel, while the Transfer Entropy module models nonlinear and time-delayed pairwise channel interactions within a differentiable learning pipeline. This design enhances both discriminative power and interpretability by linking classification decisions to physiologically meaningful connectivity patterns. The proposed method was validated on a publicly available MI dataset (BCI Competition IV 2a), achieving competitive performance and demonstrating robustness across diverse experimental conditions and inter-subject variability. Overall, the results confirm that TEKTE-Net provides an interpretable, noise-tolerant, and dynamically informed solution for EEG-based motor imagery classification in brain–computer interface (BCI) applications.
The remainder of the work is organized as follows: Section 2 introduces the mathematical framework. Section 3 describes the considered dataset and the experimental setup. Section 4 presents and discusses the results. Finally, Section 5 provides the conclusions and outlines directions for future work.
2. Mathematical Framework
This work introduces TEKTE-Net, a novel end-to-end deep learning architecture designed to model nonlinear spatiotemporal dynamics and directed causal interactions directly from raw EEG signals. The model incorporates a customized convolutional module that performs Takens’ embedding, enabling the reconstruction of the underlying dynamical system without requiring explicit preprocessing. This mechanism facilitates the extraction of subject-specific, task-relevant temporal and spectral features. A central contribution of TEKTE-Net is the integration of a fully differentiable Transfer Entropy (TE) estimator, formulated via Rényi’s -order entropy and positive-definite kernels, allowing for the estimation of nonlinear, directed information flow between EEG channels within a trainable framework. The following sections describe the dataset and mathematical foundations in detail.
2.1. Channel-Wise Nonlinear Time Series Embedding from Takens’ Convolutional Layer
Let be a discrete multichannel input signal of temporal length T and C channels. The channel-wise nonlinear filtering of the c-th channel is denoted as , being its corresponding input time series, the filtered output of length . A deep learning strategy nonlinearly filters each channel using L sequential layers parameterized by , that is, . The usual layers considered in the nonlinear filtering are convolutions, poolings, and dropouts that support extracting complex channel-wise temporal structures and nonlinear dependencies to learn more informative and discriminative representations.
Aiming to take advantage of the EEG latent dynamics through the Markovian property, a delay-coordinate Takens’ embedding reconstructs the channel-wise state space by stacking time-delayed versions of the nonlinearly-filtered channel into fixed-length vectors, resulting in a delay-embedded representation , where denotes the embedding order (i.e., number of delay coordinates), the delay offset , and . A set of fixed, non-trainable convolutional filters implements the embedding replicating delayed copies of the input without altering the learned parameters as
where the convolution kernel , with , depends on three predefined hyperparameters, namely, the delay stride , the embedding order D, and the delay offset . Such Takens’ convolution kernel elements holds elements , with as the discrete delta Dirac function. Thus, the full Takens-embedded nonlinearly-filtered signal enables the subsequent processing layers to access the temporal structure and to capture directed inter-channel interactions through the reconstructed dynamical states rather than raw observations.
2.2. Transfer Entropy from Kernel Matrices
This work assesses the inter-channel interactions through the Transfer entropy (TE) which has been proposed as an effective tool for distinguishing between driving and responding elements, as well as for detecting asymmetries in subsystem interactions [26]. Originally introduced by Schreiber [27] and related to the concept of Granger causality [28], TE operates under the premise that the c-th channel can be considered to causally influence -th channel if incorporating the past of the channel c, together with the past of channel , better predicts the present of than using past alone, for all discrete time instants . According to Section 2.1, the present of the responding channel can be computed from the Takens’ delayed-embedding by setting and , while its past by setting and to be tuned, as shown in Equations (2) and (3), respectively. In turn, the past of the driving channel c accounts for D time-delayed interactions, thanks to , as in Equation (4).
Note that the t-th row of the Takens’ embeddings in Equations (2)–(4) correspond to the current state of the responding channel , the past state of the responding channel , and the past of the driving channel , respectively, aligned at every time instant . Using those three time-aligned embeddings, Equation (5) formally defines the transfer entropy as the expected information gain about the current state of the responding channel given its own past, i.e., , when the past of the driving channel is also known, i.e., .
Equivalently, it can be written in expectation form as:
where the expectation operator is defined as
Thanks to Bayes’ rule and logarithm properties, the conditional probabilities in Equation (5) are split into four terms depending on the joint and marginals as follows:
Since the arguments of the logarithm are marginalizations of , the expectations are constant on the remaining variables and reduce to:
Noting that each term in Equation (9) matches the Shannon entropy definition of the information gain of the transfer entropy is finally rewritten in terms of joint and marginal entropies as in Equation (10). For the sake of visual understanding, Figure 1 illustrates the relationship between the random variables and its entropies in the estimation of the transfer entropy.
To calculate TE from discrete data, the Shannon entropies in Equation(10) require the estimation of joint and marginal probability distributions, which are often intractable. For avoiding the explicit estimation of these distributions, this work adopts a kernel-based approximation of Shannon joint and marginal entropies from discrete observations over finite state spaces, as defined in Equations (11) and (12) respectively, being and are two random vectors [29]. The Gram matrices and capture the covariance structure of the vector-valued random variables and in a Reproducing Kernel Hilbert Space (RKHS), and ∘ denote the Hadamard product operator.
Above estimators approximate the Transfer Entropy in Equation (10) as:
where the kernel matrices hold the covariances of the responding channel present, its past, and the driving channel past, respectively.
All the three kernel matrices are computed by a positively defined kernel function reproducing a Hilbert space which holds the parameter set ℓ. Particularly, this work proposes to compute the similarities between time series using the Rational Quadratic (RQ) kernel as it generalizes the Gaussian by accommodating multi-scale variation. Equation (17) defines the RQ kernel for a scale mixture parameter and for the Mahalanobis distance parameterized by the projection matrix .
Therefore, the kernel parameters in Equations (14)–(16) become , , and , and are implemented as dense layers projecting the delay-embedded vectors into new feature spaces tailored to the kernel computation. This interpretation implies that each kernel matrix entry measures distance in an ellipsoidal geometry, where the shape and orientation of the ellipsoids are governed by the trainable matrices . As a consequence, the dense layers not only learn feature transformations but also define the intrinsic geometry used to compute nonlinear similarity via the Rational Quadratic kernel, while automatically determining the relevance of each embedding axis in the assessment of the TE from c to .
2.3. Transfer Entropy-Based EEG Classification Model
The above embedded representations and transfer entropy estimation hold information about the channel interactions. In the case of EEG signals, such interactions are due to a stimuli, response, or brain state to be identified, hereafter denoted as y. Therefore, the nonlinear filtering, Takens’ embedding, transfer entropy estimation are gathered into the following single sequential model to be trained for predicting y:
Firstly, the tensor in Equation (18a) holds the nonlinearly-filtered channels as with parameter set . Secondly, the non-trainable convolution kernel in Equation (18b) stacks the three delayed embeddings in Equations (2)–(4) from each channel into a single tensor . Then, the function in Equation (18c) computes the kernel matrices, and the joint, marginal, and transfer entropies as in Equation (13) with trainable parameter set , returning a single matrix holding every pairwise TE from the nonlinearly-filtered Takens’ embeddings. Lastly, Equation (18d) removes the diagonal entries of the TE matrix (representing self-transfers) to avoid informational redundancy, and feeds its flattened version into the -parameterized fully-connected dense block , followed by approximating the posterior class probability. corresponds to either the sigmoid (in binary classification) or the softmax function (in multiclass problems).
3. Experimental Setup
To address the inherent complexity of brain activity, we propose the TEKTE-Net, a deep model integrating phase space reconstruction through Takens’ embeddings, transfer entropy analysis using kernel-based techniques, and an end-to-end trainable architecture. This approach enables the precise extraction of directed connectivity patterns among various brain regions, capturing both dominant and subtle dynamic interactions without constraining the analysis to predefined frequency bands. This section describes the dataset considered to evidence above benefits, which consists on a widely known dataset for EEG-based discrimination of two motor imagery tasks. The section also details the practical considerations for implementing, training, and testing the proposed TEKTE-Net on such dataset.
3.1. Dataset and Preprocessing
To validate our TE-based EEG classification approach, this work considers the BCI Competition IV dataset 2a (BCICIV2a), a publicly available resource composed of EEG recordings from nine healthy participants. These recordings were obtained during multiple trials of a motor imagery (MI) experiment with the protocol illustrated in Figure 2. In each trial, participants first see a fixation cross on a computer screen, accompanied by an auditory cue. Two seconds later, a directional arrow appears for 1.25 seconds, signaling the start () of one of four possible MI tasks: left-hand, right-hand, both feet, or tongue movement. One second after the MI signal, subjects begin performing the instructed task during three seconds (i.e., until the 4-seconds mark after the instruction), at which point the cross disappears. A brief 1.5-second pause follows, during which the screen remains blank. For validation purposes, this study excludes feet and tongue movement tasks and focuses solely on binary classification of trials instructed to move the left () and right () hands. For each subject, the BCI Competition IV provides two subsets with the same experimental protocol: the training subset holds between 113 and 138 trials per subject, and the testing subset holds between 108 and 142 per subject [30].
The EEG data were recorded using Ag/AgCl electrodes, placed according to the international 10/20 system as shown in Figure 3. The data preprocessing applies a 50 Hz notch filter and a bandpass filter between 0.5 and 100 Hz and resamples to 250 Hz. Therefore, each participant comprises a subset of 22 channels and N samples, and classification is based solely on labels 1 and 2, which distinguish between right-hand and left-hand motor imagery, respectively. Trials are split into two-seconds windows with 0.5 seconds overlap, that is , from which the segments from 2.0 to 4.0 seconds after cue onset are selected to train the model as they are expected to hold the most relevant information to the MI task. Lastly, the spherical splines method applies the surface Laplacian transform to each segment to reduce the influence of low spatial frequency activity, minimize the occurrence of spurious channel connectivities, and mitigate the volume conduction effect [31,32,33,34].
3.2. Semi-Synthetic Causal EEG Benchmarks
The evaluation of TEKTE-Net’s ability to infer directed functional connectivity from EEG signals relies on a causality classification benchmark with semi-synthetic data. Two simulated connectivity models generated the surrogate data holding different causality flow interactions [35,36]. Similar to the work of Kus et al. [37], the two causal configurations, hereinafter referred to as G1 and G2, were designed by introducing directional interactions among five virtual EEG channels. Figure 4 illustrates both configurations, evidencing different dominant causal flows while shared parameters for the time-delayed interactions and a common channel with Gaussian noise. Unlike a straightforward simulated scenario, the channel C1 in both generators was directly initialized with EEG recordings from the BCICIV2a dataset, ensuring semi-synthetic trials that preserve realistic, non-stationary neural dynamics. Each model configuration generated the remaining four channels according to the predefined causal interactions, plus Gaussian noise with power varying from -6dB to +3dB with respect to the base EEG variance. Sampling random channels from BCICIV2a and running each model yielded a surrogate supervised EEG dataset with 1000 trials labeled according to their interaction structure (500 from G1 and 500 from G2).
3.3. Model Setup and Hyperparameter Tuning
The proposed TEKTE-Net follows a sequential deep learning architecture, implemented as a three-block end-to-end model, as detailed in Table 1.
The first block applies the nonlinear Takens’ embedding described in Section 2.1, beginning with a channel-wise convolution of CK-length trainable convolution kernels, , which the model then feeds into an average pooling layer for temporal aggregation and noise robustness. Non-trainable embedding matrices split each channel in the pooling output as responding present, responding past, and driving past signals for the estimation of transfer entropy. The second block estimates the pairwise TE by computing the kernel matrix for each nonlinear Takens’ embedding parameterized by three trainable projection matrices. The last block acts as a nonlinear classifier, with complexity controlled by the number of hidden units H, where TE connectivities serve as input features and represents the estimated posterior for O classes. This work considers only one output unit due to the binary classification tasks at hand (G1 vs. G2 in the semi-synthetic benchmark and left vs. right in the BCICIV2a dataset). Therefore, the implemented model depends on five hyperparameters to be tuned (, , and ), and three sets of trainable parameters: the convolutional filters, the projection matrices in the RQ kernel, and the weighting matrices in the head block.
To mitigate inter-subject variability, a Bayesian optimization stage identified the hyperparameters of the model in Table 1 that maximize validation accuracy on a participant-specific basis. The search space for the key hyperparameters controlling the model architecture included the convolutional kernel size , the time stride , the time delay for the interaction , and the embedding order for the responding and the driving channels . During the search, the optimizer filtered out hyperparameter configurations with size issues due to the kernel size, pooling size, and embedding dimensions. Each valid configuration was trained for a maximum of 1000 epochs with a batch size of 32, using the binary cross-entropy loss function and the Adam optimizer. An early stopping mechanism, monitoring of the validation loss with a patience of 5 epochs, prevented overfitting and reduced unnecessary training time.
Regarding Bayesian optimization, the following setup controlled the search behavior and efficiency: Up to ten search trials and a kernel regularization of for promoting numerical stability and robustness to noisy objective evaluations, a trade-off of for a moderate balance between exploration and exploitation, and a stratified 5-fold cross-validation data splitting for mitigating model overfitting during the search. Along with the Bayesian optimization setup, the resulting hyperparameters aim not only to achieve better performance metrics but also to relate the subject’s performance to its optimal architecture, thereby improving the model’s interpretability.
Performance metrics, including accuracy, sensitivity (true positive rate), specificity (true negative rate), and F1-score, assess the quality of the resulting optimal hyperparameters on both the training and testing subsets in terms of. The fold-wise computation of metrics enables the reporting of mean and standard deviation statistics subject-dependently, for a better understanding of the model’s performance.
4. Results and Discussion
4.1. Semi-Synthetic Causal EEG Benchmarks
For the semi-synthetic dataset, the tuning procedure in Section 3.3 yielded the following configuration: . Such a configuration achieved the performance metrics on the five-fold cross-validation: Accuracy = , Sensitivity = , Specificity = , F1-score = . The average class-wise TE matrices in Figure 5 illustrate the effectiveness of TEKTE-Net in decoding the simulated interactions. For either configuration, TEKTE-Net highlighted the dominant connections (, , and in G1; and , in G2), validating the model’s ability to infer directed causal relationships even in the presence of Gaussian noise and temporal delays, consistent with previous studies on TE applied to neural signals [27,35,38]. However, the pathway, intended to be a key causal link in G2, was not clearly detected, suggesting a possible limitation of the model in capturing weak or highly noise-sensitive pathways. Interestingly, unexpected connections in G1 and in G2 emerged. Indirect interactions can explain the former through non-causal statistical dependencies or implicit feedback effects induced by the model’s nonlinearity and the mixture of real EEG signals (in C1) with structured noise in C2. The latter, likely mediated by C3, evidences the model’s sensitivity to multi-step interactions. Previous works discuss such effects on directed connectivity, where the asymmetry of measures like TE can still reflect spurious correlations or undesired symmetries [39,40]. Lastly, low TE values appeared flowing to C5, even though it only holds noise. These weak activations may arise from residual statistical dependencies or shared variance leakage, phenomena frequently reported in the literature on directed connectivity using information-theoretic metrics and observed in other causal inference approaches using synthetic data [41].
For the sake of a noise robustness study, Figure 6 compares the proposed TEKTE-Net with the RQ kernel against the connectivity, another kernel-based transfer entropy estimator, [42] and the TEKTE-Net with a Gaussian kernel at varying noise levels. Firstly, note that the baseline model achieved perfect classification accuracy under low-noise conditions (-6.0 dB). However, its performance sharply degrades beyond 0 dB, reaching nearly at the highest noise level (+3.0 dB). The TEKTE-Net with a Gaussian kernel, while more robust than , consistently underperformed the RQ kernel. A closer look reveals that the TEKTE-Net with the RQ kernel reduced classification accuracy by , followed by the Gaussian kernel with a reduction, and with the most severe performance drop of . Such results confirm the superior robustness of the proposed model under noisy conditions, thanks to the designed end-to-end training framework, in contrast to , which lacks a learning scheme beyond the classification stage. PARA LA DISC: This robustness is critical in EEG-based systems, which are often affected by low signal-to-noise ratio (SNR), artifacts, and non-stationarity stemming from subject variability, electrode displacement, and physiological noise [43,44]. A robust model ensures reliable classification performance in real-world Brain-Computer Interface (BCI) scenarios [45,46,47].
4.2. Hyperparameter Tuning
For a deeper understanding of the influence of hyperparameters on the performance, a quadratic regression from the configurations explored by the Bayesian optimization described in Section 3.3 offers a structured yet expressive strategy to uncover nonlinear effects, hyperparameter interactions, and tuning complexity in the hyperparameter-performance relationship. Figure 7a illustrates the relative influence of the hyperparameters, their second-order, and cross-interaction factors in terms of the regression coefficients resulting from the Bayesian optimization. In turn, Figure 7b compares the score, a performance metric for regression fitting, with the achieved validation accuracy and the resulting hyperparameters. Subjects are sorted from highest to lowest validation accuracy, allowing the analysis of the alignment between parameter sensitivity and decoding performance.
Firstly, note that the convolution kernel size K and its cross-interaction terms dominate the regression for the Subjects 9, 8, and 3, implying that wide convolutional receptive fields are required to increase the discriminative power of the time-delayed embeddings. These same subjects yield the largest accuracies at an score over , indicating that the optimizer was able to learn and exploit a structured, curved response surface. For instance, the largest and most varying coefficients of Subject 3 indicate a well-defined and sensitive optimization landscape, where hyperparameters exert a measurable and structured influence on the model outcome. The large quadratic and interaction terms, , , , and , imply a heavy convex dependency on kernel size, a concave relationship with stride, and performance guided by temporal features. Hence, the Bayesian optimizer uncovers a well-defined response surface that guides the optimization process toward an optimal outcome, making the model inherently more tunable on highly-performing subjects [48,49].
In contrast, the small regression coefficients for Subjects 6, 4, and 2 result in a flat regression model, accompanied by scores below and the lowest accuracy values. Such a flat response profile in Subject 2 tells a limited response to performance changes in hyperparameters. Such a finding indicates poor signal quality, reduced discriminative neural patterns, or BCI illiteracy [50,51]. Hence, the Bayesian optimization deals with a more diffuse, noisy, and uninformative landscape, resulting in a scarce performance gain.
Lastly, Subjects 7, 1, and 5 present moderate and more dispersed coefficient patterns, hinting at partial but varying dependencies between hyperparameter settings and model performance, confirmed by their corresponding performance in Figure 7b. These profiles indicate that, while the TEKTE-Net leverages some meaningful hyperparameters, the optimization surface is less coherent or more susceptible to within-subject variability. Therefore, the surrogate hyperparameter fit constitutes a suitable indicator of expected performance marked by curvature and coherent interaction terms, highlighting the value of quadratic modeling as an explanatory and diagnostic tool in EEG-based Bayesian hyperparameter optimization. Following the above findings, Table 2 summarizes the optimal hyperparameters for each subject, and stratifies them into three groups according their validation accuracy.
4.3. Interpretability Analysis
For assessing model interpretability, a subject-specific analysis was conducted across temporal, spatial, and spectral axes. The temporal analysis employs a sliding-window approach for understanding time engagement and training/testing variations. On the spatial axis, the activated TE aims at interpreting functional connectivity patterns. The spectral analysis of channel-wise learned filters focuses on understanding frequency specialization. All analyses were performed under the optimized hyperparameters summarized in Table 2.
Sliding window analysis enables the exploration of MI engagement variability by examining the temporal evolution of classification accuracy. Figure 8 presents the attained accuracy as a two-second window is slid along the trials (from 0 to 7 seconds), with subjects sorted according to their performance in Figure 7b. At first glance, consistent peak classification accuracies appear within the time window between 2 and 4 seconds after the task onset. Previous studies have demonstrated that this window range suitably captures the most discriminative MI-related patterns by effectively reflecting the evolution of sensorimotor rhythms during the active phase of cognitive processing [52].
Furthermore, the temporal performance profiles cluster subjects into three groups. In the group of high-performing subjects (Subjects 9, 8, and 3), TEKTE-Net exhibited a marked and consistent increase in accuracy of over within the 2–4 second window. Despite the slight decline towards the trial end, the proposed model maintained relatively high test accuracy levels (above ), suggesting the presence of stable and task-relevant neural activity in these subjects. On subjects 7, 1, and 5 (mid-performing), the proposed model performed moderately, with test accuracy peaking between and within the 2- and 4-second windows. The temporal profile of this group exhibits a clear training-to-test accuracy gap, followed by a gradual decline in training accuracy. Such a profile indicates existing MI-related neural patterns, but these are less consistent and more susceptible to cognitive variability than those in the high-performing group [53]. For the group of low-performing subjects (SIubjects 6, 4, and 2), the accuracy evolved flatly or with high variability around the chance level (between and ). Particularly, Subject 6 presented severe overfitting characterized by an abrupt difference between training and test subsets in the window centered at three seconds. Such an accuracy gap is a symptom of inconsistent or weak MI-related neural patterns, which limit the reliability of classification. Therefore, the temporal performance profiles revealed differences in the quality and steadiness of the neural patterns among subjects, proving the need for subject-dependent MI models.
For spatial interpretability, the well-established activation maximization technique optimizes the model’s output for each motor imagery class with respect to the TE layer. This interpretability technique enables the identification of TEKTE-NET connectivities that strongly contribute to class-specific activations. It also allows for the analysis of the spatial distribution and intensity of interactions between brain regions, providing a clear depiction of the functional dynamics underlying motor imagery tasks.
Figure 9 highlights the directionality and magnitude of the largest interactions between cortical regions for left- and right-hand motor imagery across the nine subjects grouped according to their performance in Figure 7b. In the high-performing group, activation maximization exhibited contralateral connections involving frontal, central, and parietal areas, emphasizing the directionality and magnitude of these connections. For instance, Subject 9 revealed strong paths including , , and , while Subject 8 highlighted the and connections for left and right hand MI, respectively. In the mid-performing subjects, highlighted connections are more widespread and less contralateralized than in the previous group, hence partially aligning with MI-related patterns. Remarkably, connections and , in Subject 1, and , in Subject 5, suggest compensatory recruitment of posterior regions. Conversely, the activations in the low-performing group lack contralateral organization, with underscored inter-hemisphere connections. For instance, the connections between the left-frontal and left-central channels in Subject 6 are atypical in the MI task [54]. Additionally, the right hemisphere is responsible for most of the highlighted connections in Subjects 2 and 4. Therefore, the spatial interpretation of TEKTE-Net elucidates the relationship between functional connectivity and motor imagery decoding performance, demonstrating efficient sensorimotor integration for the task at hand in the first group [55,56] and the compensatory recruitment of posterior regions in the second group [57].
The characterization of the spectral behavior of the TEKTE-Net relies on the frequency response of the channel-wise learned filters for each subject. The frequency response results from the fold-averaged magnitude of the Fast Fourier Transform computed for each convolution kernel. Figure 10 presents the resulting magnitude response (in dB) along the frequency (0 to 100Hz) and the channels (from left to right), thereby visually assessing variability among the subject groups and the selectivity of the learned filters across the frequency spectrum.
According to Figure 10, the proposed model yields a more structured spectral pattern in the high-performing subjects (first column) than in the rest of the cohort. In particular, the filters exhibited a band-pass-like structure in Subjects 3 and 8 around 20Hz, with a slight rightward predominance in Subject 8. From a neurophysiological perspective, the beta band (20 Hz) is associated with sensorimotor coordination and exhibits contralateral lateralization to movement, particularly within the left hemisphere during motor or spatial-orienting tasks [58]. In the case of Subject 9, the filters displayed an unattenuated response around the gamma band (40 Hz), primarily concentrated in the right hemisphere, frequently linked to sustained attention, perceptual integration, and executive control processes [59]. Hence, the structured frequency response suggests that the depthwise convolutional filters adapt to preserve the oscillatory components, relevant for the classification task, effectively acting as spectral selectors that maintain frequency regions containing discriminative neural information.
Regarding the second group and third groups (center and right columns), the spectral behavior was less defined compared to the first group. Only the learned filters for Subject 1 partially selected frequencies around 25 Hz over the left hemisphere, similar to the best-performing subjects, albeit with lower clarity and spatial extent. For Subjects 7 and 5, the filters develop a spurious magnitude response, lacking spectral or spatial alignment. Contrarily, the depthwise convolutional filters for the latter group yield an elongated and flat spectral response, reflecting the absence of frequency selectivity. Therefore, the TEKTE-Net’s spectral specialization positively relates to classification performance, as the low power of MI-related rhythms, particularly beta and gamma, is associated with lower cognitive performance and reduced classification accuracy [60,61].
4.4. Performance Assessment
This work evaluates TEKTE-Net’s performance on the official testing set from the BCI Competition IV Dataset 2a. Table 3 presents the per-subject performance metrics on this subset, sorted by validation accuracy. In general, note that the testing accuracy naturally decreased by approximately 15% compared to the validation one, due to the intrinsic within-subject variability. However, the average F1 score of over 70% indicates that TEKTE-Net successfully identified individual motor imagery patterns, demonstrating a reasonable generalization capability. For the high-performing group, the model consistently reached scores of over 85%. Such a result indicates that TEKTE-Net finds well-structured neurophysiological patterns with both precision and generalizability. For the mid-performing group, TEKTE-Net yields F1 scores between 60% and 80%, followed by the most significant accuracy drops compared to the validation set. Such a finding indicates transitional signal regimes or moderate generalization characteristics, due to accentuated between-session variability. The low-performing group remains just above the chance levels, suggesting highly intrinsic neurophysiological noise or BCI illiteracy. It is also worth mentioning that Subjects 5, 4, and 2 present the most difference between Sensitivity and Specificity, with F1 scores over 60%, despite the class balance provided by the competition. Hence, the heterogeneity in class distributions emerges as the most reasonable explanation for uneven metrics on such subjects, which facilitates the labeling of the positive class while hindering the negative. Therefore, the stratification and subject-wise analysis highlight the necessity of adaptive or personalized strategies in BCI decoding frameworks, while providing a deeper understanding of the inner workings of TEKTE-Net across individuals.
Table 4 contrasts the proposed TEKTE-Net against state-of-the-art methods on the official test set from the BCI Competition IV Dataset IIa, covering both traditional feature engineering techniques and deep learning models. The former techniques include time-frequency, dynamic nonlinear [62,63], and entropy-based connectivity features [42], which achieved accuracies ranging from to . While these methods benefit from high interpretability, they rely heavily on handcrafted statistical features and traditional classifiers. This reliance limits their ability to model the complex spatiotemporal characteristics inherent to EEG signals, which in turn constrains their generalization capacity and scalability to diverse experimental conditions. The latter models, explicitly designed for EEG decoding [64,65], introduce automated feature extraction pipelines that reach accuracies up to . Hence, the between-session variability hampers their performance due to overfitting and a lack of inherent regularization through parameterized features. In turn, proposed TEKTE-Net and GAT+PLV approaches introduce hybrid frameworks that integrate functional connectivity measures and deep learning architectures. Particularly, GAT+PLV feeds a Graph Attention Network with the Phase-Locking Value connectivity [24]. Despite GAT+PLV reaching the highest accuracy, the difference with TEKTE-Net is less than 1% and demands the explicit precomputation of phase coupling. As a result, hybrid models that combine known-to-work features with flexible classification machines outperform approaches relying solely on feature engineering or deep learning. As an advantage, the fully end-to-end architecture of TEKTE-Net preprocesses the channels to favor the discriminative capacity of TE and learns a classification head to maximize class separability, while preserving interpretability through the integrated connectivity representation.
5. Concluding Remarks and Future Work
This work introduces TEKTE-Net, an end-to-end deep learning model integrating directed EEG functional connectivity for EEG discrimination. TEKTE-Net develops an information-theoretic kernelization of Transfer Entropy within a channel-wise convolutional architecture, enabling the joint modeling of nonlinear delayed and directional neural dependencies. The proposed approach combines five key components. Firstly, a channel-wise convolutional block specializes spectral filters to keep discriminative frequency components. Secondly, a kernelized Transfer Entropy captures time-delayed signal interactions while preserving causal structure. Third, a Bayesian optimization strategy tunes the architectural hyperparameters to maximize decoding accuracy and to support model interpretability. Fourth, a quadratic kernel formulation enhances robustness to low signal-to-noise ratios, a key characteristic of real-world EEG data. Finally, unlike conventional feature engineering or other hybrid approaches, TEKTE-Net operates in a fully differentiable and end-to-end fashion, without requiring handcrafted features, explicit causality priors, or manual preprocessing steps.
Experimental results across both semi-synthetic causal benchmarks and real MI-EEG datasets demonstrated that TEKTE-Net accurately recovered the intended causal structures and achieved competitive decoding performance. On semi-synthetic EEG data, the model successfully inferred predefined directed interactions, achieving an average validation accuracy above . The resulting Transfer Entropy matrices reproduced the imposed topologies even under Gaussian noise, confirming the framework’s ability to identify true directed interactions. The noise analysis revealed that the quadratic kernel variant degrades more slowly as noise levels increase, validating its robustness under varying SNR. In real EEG experiments (BCI Competition IV, Dataset 2a), TEKTE-Net achieved an average testing accuracy over , outperforming deep architectures such as DeepConvNet and EEGNet, and comparable to other hybrid models. The Bayesian hyperparameter analysis revealed structured optimization surfaces, where kernel size and temporal stride dominated performance, particularly on high-performing subjects. This structured dependency highlights the tunability and adaptability of the proposed model to subject-specific EEG characteristics.
The temporal, spatial, and spectral analyses provided critical insights into both decoding dynamics and underlying neurophysiological processes. Sliding-window experiments confirmed that the 2-4 s post-cue interval consistently yielded the highest decoding performance, aligning with known sensorimotor activation phases during MI. Connectivity visualizations demonstrated clear distinctions between high, medium, and low performers: high-performing subjects exhibited contralaterally organized, sensorimotor-coherent networks, whereas low-performing users showed diffuse, vertically distributed connections lacking lateralization. Spectral analysis of the learned filters further revealed that filters for high-performing subjects preserved power in the (≈20 Hz) and (≈40 Hz) bands, associated with motor coordination and cognitive engagement, respectively. Conversely, widespread attenuation in low performers reflected diminished task-related activity. These findings provide a direct neurophysiological rationale for the observed decoding variability, validates the extraction of neurophysiologically meaningful patterns, and demonstrates the model’s interpretability at the network level.
From an implementation standpoint, TEKTE-Net maintains a modular and interpretable structure, allowing seamless integration into existing BCI pipelines. Its information-theoretic regularization enhances robustness to noise, while its kernelized architecture ensures flexibility across subjects and recording conditions. Moreover, the model’s differentiable formulation enables direct gradient-based optimization, facilitating explainability and traceability—two features often absent in black-box EEG decoders.
The devised future work points to three research directions. Firstly, incorporating attention-guided causal alignment and dynamic kernel adaptation could further enhance the model’s capacity to generalize across heterogeneous subjects while maintaining interpretability. Secondly, applying TEKTE-Net to clinical and longitudinal EEG datasets will support understanding of connectivity evolution across training, pathology, or cognitive load. Finally, extending the proposed framework to real-time causal inference and source-space connectivity could enable its integration into adaptive and neurofeedback systems. Addressing these directions will not only strengthen the robustness and interpretability of TEKTE-Net but also expand its applicability to broader cognitive and clinical neuroscience domains.
Author Contributions
Conceptualization, Gomez-Rivera and Cárdenas-Peña; methodology, Álvarez-Meza and Orozco-Gutiérrez; validation, Gomez-Rivera; formal analysis, Gomez-Rivera, Cárdenas-Peña, and Álvarez-Meza; investigation, Gomez-Rivera and Cárdenas-Peña; resources, Orozco-Gutiérrez and Cárdenas-Peña; writing—original draft preparation, Gomez-Rivera; writing—review and editing, Cárdenas-Peña and Álvarez-Meza; visualization, Cárdenas-Peña; supervision, Álvarez-Meza; project administration, Orozco-Gutiérrez; funding acquisition, Orozco-Gutiérrez, Álvarez-Meza, and Cárdenas-Peña. All authors have read and agreed to the published version of the manuscript.
Funding
The authors acknowledge the financial support provided by the “ALIANZA CIENTÍFICA CON ENFOQUE COMUNITARIO PARA MITIGAR BRECHAS DE ATENCIÓN Y MANEJO DE TRASTORNOS MENTALES RELACIONADOS CON IMPULSIVIDAD EN COLOMBIA - ACEMATE" research program through grant No.91908.
Data Availability Statement
The dataset 2a from the BCI Competition IV, used in the validation of the current study, is publicly available at https://bbci.de/competition/iv/download/.
Acknowledgments
During the preparation of this manuscript, the authors used Grammarly for English spelling and grammar checking. The authors have reviewed and edited the output and take full responsibility for the content of this publication.
Conflicts of Interest
The authors declare no conflicts of interest. The funding institution had no role in the design of the study; in the collection, analyses, or interpretation of data; in the writing of the manuscript; or in the decision to publish the results.
References
- Padfield, N.; Zabalza, J.; Zhao, H.; Masero, V.; Ren, J. EEG-Based Brain-Computer Interfaces Using Motor-Imagery: Techniques and Challenges. Sensors 2019, 19. [Google Scholar] [CrossRef]
- Fraiwan, M.; Alafeef, M.; Almomani, F. Gauging human visual interest using multiscale entropy analysis of EEG signals. Journal of Ambient Intelligence and Humanized Computing 2021. [Google Scholar] [CrossRef]
- Kavsaoğlu, A.; Polat, K.; Aygun, A. EEG based brain-computer interface control applications: A comprehensive review. Journal of Bionic Memory 2021, 1, 20–33. [Google Scholar] [CrossRef]
- Djamal, C.; Putra, R. Brain-computer interface of focus and motor imagery using wavelet and recurrent neural networks. TELKOMNIKA (Telecommunication Computing Electronics and Control) 2020, 18, 2748. [Google Scholar] [CrossRef]
- Maya-Piedrahita, M.C.; Herrera-Gomez, P.M.; Berrío-Mesa, L.; Cárdenas-Peña, D.A.; Orozco-Gutierrez. Supported Diagnosis of Attention Deficit and Hyperactivity Disorder from EEG Based on Interpretable Kernels for Hidden Markov Models. International Journal of Neural Systems 2022, 32, 2250008. [Google Scholar] [CrossRef] [PubMed]
- Bonnet, C.; Bayram, M.; El Bouzaïdi Tiali, S.; Lebon, F.; Harquel, S.; Palluel-Germain, R.; Perrone-Bertolotti, M. Kinesthetic motor-imagery training improves performance on lexical-semantic access. PloS one 2022, 17, e0270352. [Google Scholar] [CrossRef]
- de Bogotá, C.d.C.; et al. La Agenda 2030 y los Objetivos de Desarrollo Sostenible Una oportunidad para América Latina y el Caribe 2018.
- Miao, M.; Hu, W.; Yin, H.; Zhang, K. Spatial-Frequency Feature Learning and Classification of Motor Imagery EEG Based on Deep Convolution Neural Network. Computational and Mathematical Methods in Medicine 2020, 2020, 1–13. [Google Scholar] [CrossRef]
- He, H.; Wu, D. Transfer Learning for Brain-Computer Interfaces: A Euclidean Space Data Alignment Approach. IEEE Trans. Biomed. Eng. 2019, PP, 1–1. [Google Scholar] [CrossRef]
- Marcos-Martínez, D.; Martínez-Cagigal, V.; Santamaría-Vázquez, E.; Pérez-Velasco, S.; Hornero, R. Neurofeedback Training Based on Motor Imagery Strategies Increases EEG Complexity in Elderly Population. Entropy 2021, 23. [Google Scholar] [CrossRef]
- Arns, M.; Conners, C.; Kraemer, H. A Decade of EEG Theta/Beta Ratio Research in ADHD. Journal of Attention Disorders 2013, 17, 374–383. [Google Scholar] [CrossRef]
- Nicolas-Alonso, L.F.; Gomez-Gil, J. Brain Computer Interfaces, a Review. Sensors 2012, 12, 1211–1279. [Google Scholar] [CrossRef]
- Abiri, R.; Borhani, S.; Sellers, E.; Jiang, Y.; Zhao, X. A comprehensive review of EEG-based brain–computer interface paradigms. Journal of Neural Engineering 2019, 16. [Google Scholar] [CrossRef]
- Becker, S.; Dhindsa, K.; Mousapour, L.; Dabagh, Y. BCI Illiteracy: It’s Us, Not Them. Optimizing BCIs for Individual Brains. 02 2022, pp. 1–3. [CrossRef]
- Shoka, A.; Dessouky, M.; el sherbeny, A.; El-Sayed, A. Literature Review on EEG Preprocessing, Feature Extraction, and Classifications Techniques. Menoufia Journal of Electronic Engineering Research 2019, 28, 292–299. [Google Scholar] [CrossRef]
- Cardona-Álvarez, Y.N.; Álvarez Meza, A.M.; Cárdenas-Peña, D.A.; Castaño-Duque, G.A.; Castellanos-Dominguez, G. A Novel OpenBCI Framework for EEG-Based Neurophysiological Experiments. Sensors 2023, 23. [Google Scholar] [CrossRef] [PubMed]
- Blankertz, B.; Tomioka, R.; Lemm, S.; Kawanabe, M.; Müller, K.R. Optimizing spatial filters for robust EEG single-trial analysis. IEEE Signal Processing Magazine 2007, 25, 41–56. [Google Scholar] [CrossRef]
- Luo, T.; Lv, J.; Chao, F.; Zhou, C. Effect of different movement speed modes on human action observation: an EEG study. Frontiers in Neuroscience 2018, 12, 219. [Google Scholar] [CrossRef]
- Galindo-Noreña, S.; Cárdenas-Peña, D.; Orozco-Gutierrez, A. Multiple Kernel Stein Spatial Patterns for the Multiclass Discrimination of Motor Imagery Tasks. Appl. Sci. 2020, 10. [Google Scholar] [CrossRef]
- Zhang, L.; Guindani, M.; Vannucci, M. Bayesian models for functional magnetic resonance imaging data analysis. Wiley Interdisciplinary Reviews: Computational Statistics 2015, 7. [Google Scholar] [CrossRef]
- Rolls, E.; Deco, G.; Huang, C.C.; Feng, J. The Effective Connectivity of the Human Hippocampal Memory System. Cerebral cortex (New York, N.Y. : 1991) 2022, 32. [Google Scholar] [CrossRef]
- Martini, M.; Oermann, E.; Opie, N.; Panov, F.; Oxley, T.; Yaeger, K. Sensor Modalities for Brain-Computer Interface Technology: A Comprehensive Literature Review. Neurosurgery 2019, 86. [Google Scholar] [CrossRef]
- Kundu, S. AI in medicine must be explainable. Nature Medicine 2021, 27, 1328–1328. [Google Scholar] [CrossRef] [PubMed]
- Patel, R.; Zhu, Z.; Bryson, B.; Carlson, T.; Jiang, D.; Demosthenous, A. Advancing EEG classification for neurodegenerative conditions using BCI: a graph attention approach with phase synchrony. Neuroelectronics 2025, 1, 0001. [Google Scholar] [CrossRef]
- García-Murillo, D.G.; Álvarez Meza, A.M.; Castellanos-Dominguez, C.G. KCS-FCnet: Kernel Cross-Spectral Functional Connectivity Network for EEG-Based Motor Imagery Classification. Diagnostics 2023, 13. [Google Scholar] [CrossRef] [PubMed]
- Staniek, M.; Lehnertz, K. Symbolic Transfer Entropy. Physical review letters 2008, 100, 158101. [Google Scholar] [CrossRef]
- Schreiber, T. Measuring Information Transfer. Physical review letters 2000, 85, 461–4. [Google Scholar] [CrossRef]
- Seth, A.; Barrett, A.; Barnett, L. Granger Causality Analysis in Neuroscience and Neuroimaging. The Journal of neuroscience : the official journal of the Society for Neuroscience 2015, 35, 3293–7. [Google Scholar] [CrossRef]
- Sanchez Giraldo, L.G.; Rao, M.; Principe, J.C. Measures of Entropy From Data Using Infinitely Divisible Kernels. IEEE Trans. Inf. Theory 2015, 61, 535–548. [Google Scholar] [CrossRef]
- Tangermann, M.; Müller, K.R.; Aertsen, A.; Birbaumer, N.; Braun, C.; Brunner, C.; Leeb, R.; Mehring, C.; Miller, K.J.; Müller-Putz, G.R.; Review of the BCI competition, IV.; et al. Frontiers in neuroscience2012, 6, 55. Frontiers in neuroscience 2012, 6, 55. [Google Scholar] [CrossRef]
- Tenke, C.E.; Kayser, J. Surface Laplacians (SL) and phase properties of EEG rhythms: Simulated generators in a volume-conduction model. International Journal of Psychophysiology 2015, 97, 285–298. [Google Scholar] [CrossRef]
- Hua, H.; Feng, B.; Yuan, Z.; Xiong, Q.; Shu, L.; Wang, T.; Xu, X. Scalp Surface Laplacian Potential Monitoring System Based on Novel Hydrogel Active Tri-Polar Concentric Ring Electrodes. Sensors and Actuators A: Physical 2024, 379, 116003. [Google Scholar] [CrossRef]
- Lu, J.; Mcfarland, D.; Wolpaw, J. Adaptive Laplacian filtering for sensorimotor rhythm-based brain–computer interfaces. Journal of Neural Engineering 2012, 10, 016002. [Google Scholar] [CrossRef] [PubMed]
- Kapralov, N.; Jamshidi, M.; Stephani, T.; Studenova, A.; Vidaurre, C.; Ros, T.; Villringer, A.; Nikulin, V. Sensorimotor brain–computer interface performance depends on signal-to-noise ratio but not connectivity of the mu rhythm in a multiverse analysis of longitudinal data. Journal of Neural Engineering 2024, 21. [Google Scholar] [CrossRef] [PubMed]
- Faes, L.; Nollo, G.; Porta, A. Information-based detection of nonlinear Granger causality in multivariate processes via a nonuniform embedding technique. Physical Review E 2011, 83, 051112. [Google Scholar] [CrossRef] [PubMed]
- Weber, I.; Ramirez, J.; Schölkopf, B.; Grosse-Wentrup, M. Causal model evaluation in the context of brain-behavior mediation analysis. NeuroImage 2017, 151, 69–83. [Google Scholar] [CrossRef]
- Kus, R.; Kaminski, M.; Blinowska, K. Determination of EEG activity propagation: pair-wise versus multichannel estimate. IEEE Transactions on Biomedical Engineering 2004, 51, 1501–1510. [Google Scholar] [CrossRef]
- Vicente, R.; Wibral, M.; Lindner, M.; Pipa, G. Transfer entropy—a model-free measure of effective connectivity for the neurosciences. Journal of computational neuroscience 2011, 30, 45–67. [Google Scholar] [CrossRef]
- Bossomaier, T.; Barnett, L.; Harré, M.; Lizier, J. An Introduction to Transfer Entropy; 2016. [CrossRef]
- Stramaglia, S.; Faes, L.; Cortes, J.M.; Marinazzo, D. Disentangling high-order effects in the transfer entropy. Phys. Rev. Res. 2024, 6, L032007. [Google Scholar] [CrossRef]
- Barnett, L.; Barrett, A.; Seth, A. Granger Causality and Transfer Entropy Are Equivalent for Gaussian Variables. Physical review letters 2009, 103, 238701. [Google Scholar] [CrossRef]
- De La Pava Panche, I.; Alvarez-Meza, A.M.; Orozco-Gutierrez, A. A Data-Driven Measure of Effective Connectivity Based on Renyi’s α-Entropy. Frontiers in Neuroscience, 2019. [Google Scholar] [CrossRef]
- Shin, Y.; Lee, S.; Ahn, M.; Cho, H.; Jun, S.; Lee, H.N. Noise robustness analysis of sparse representation based classification method for non-stationary EEG signal classification. Biomedical Signal Processing and Control 2015, 21. [Google Scholar] [CrossRef]
- Urigüen, J.; Zapirain, B. EEG artifact removal—state-of-the-art and guidelines. Journal of Neural Engineering 2015, 12, 031001. [Google Scholar] [CrossRef]
- Philip, B.S.; Prasad, G.; Hemanth, D.J. Non-stationarity removal techniques in MEG data: A review. Procedia Computer Science 2022, 198, 182–191. [Google Scholar] [CrossRef]
- Miladinović, A.; Ajčević, M.; Jarmolowska, J.; Marusic, U.; Colussi, M.; Silveri, G.; Battaglini, P.; Accardo, A. Effect of power feature covariance shift on BCI spatial-filtering techniques: A comparative study. Computer Methods and Programs in Biomedicine 2020, 198. [Google Scholar] [CrossRef] [PubMed]
- Islam, M.K.; Rastegarnia, A.; Sanei, S. , Signal Artifacts and Techniques for Artifacts and Noise Removal; 2020. [CrossRef]
- Martineau, T.; He, S.; Vaidyanathan, R. Hyper-parameter tuning and feature extraction for asynchronous action detection from sub-thalamic nucleus local field potentials. Frontiers in Human Neuroscience 2023. [Google Scholar] [CrossRef]
- Cooney, C.; Korik, A.; Folli, R.; Coyle, D. Evaluation of Hyperparameter Optimization in Machine and Deep Learning Methods for Decoding Imagined Speech EEG. Sensors 2020, 20. [Google Scholar] [CrossRef] [PubMed]
- Roy, S.; Chowdhury, A.; McCreadie, K.; Prasad, G. Deep learning based inter-subject continuous decoding of motor imagery for practical brain-computer interfaces. Frontiers in Neuroscience 2020, 14, 918. [Google Scholar] [CrossRef]
- Ashburner, J.; Klöppel, S. Multivariate models of inter-subject anatomical variability. NeuroImage 2011. [Google Scholar] [CrossRef]
- Gaur, P.; Gupta, H.; Chowdhury, A.; McCreadie, K.; Pachori, R.; Wang, H. A Sliding Window Common Spatial Pattern for Enhancing Motor Imagery Classification in EEG-BCI. IEEE Transactions on Instrumentation and Measurement 2021, 70. [Google Scholar] [CrossRef]
- Huang, G.; Zhao, Z.; Zhang, S.; Hu, Z.; Fan, J.; Fu, M.; Chen, J.; Xiao, Y.; Wang, J.; Dan, G. Discrepancy between inter- and intra-subject variability in EEG-based motor imagery brain-computer interface: Evidence from multiple perspectives. Front. Neurosci. 2023, 17, 1122661. [Google Scholar] [CrossRef]
- Abdullah Almohammadi, Y.K.W. Revealing brain connectivity: graph embeddings for EEG representation learning and comparative analysis of structural and functional connectivity. Frontiers in Neuroscience 2024, 17. [Google Scholar] [CrossRef]
- Leeuwis, N.; Yoon, S.; Alimardani, M. Functional connectivity analysis in motor-imagery brain computer interfaces. Frontiers in Human Neuroscience 2021, 15. [Google Scholar] [CrossRef]
- Vidaurre, C.; Haufe, S.; Jorajuría, T.; Müller, K.R.; Nikulin, V.V. Sensorimotor functional connectivity: a neurophysiological factor related to BCI performance. Frontiers in Neuroscience 2020, 14, 575081. [Google Scholar] [CrossRef] [PubMed]
- Angulo-Sherman, I.N.; León-Domínguez, U.; Martinez-Torteya, A.; Fragoso-González, G.A.; Martínez-Pérez, M.V. Proficiency in motor imagery is linked to the lateralization of focused ERD patterns and beta PDC. Journal of NeuroEngineering and Rehabilitation 2025, 22, 30. [Google Scholar] [CrossRef] [PubMed]
- Lasaponara, S.; Pinto, M.; Scozia, G.; Pellegrino, M.; D’Onofrio, M.; Doricchi, F. Pre-motor deficits in left spatial neglect: An EEG study on Contingent Negative Variation (CNV) and response-related beta oscillatory activity. Neuropsychologia 2020, 147, 107572. [Google Scholar] [CrossRef] [PubMed]
- Capotosto, P.; Babiloni, C.; Romani, G.L.; Corbetta, M. Differential Contribution of Right and Left Parietal Cortex to the Control of Spatial Attention: A Simultaneous EEG–rTMS Study. Cerebral cortex (New York, N.Y. : 1991) 2011, 22, 446–54. [Google Scholar] [CrossRef]
- Bakhtiari, A.; Petersen, J.; Urdanibia Centelles, O.; Mehdipour Ghazi, M.; Fagerlund, B.; Mortensen, E.; Osler, M.; Lauritzen, M.; Benedek, K. Power and distribution of evoked gamma oscillations in brain aging and cognitive performance. GeroScience 2023, 45. [Google Scholar] [CrossRef]
- Avital, N.; Nahum, E.; Levi, G.; Malka, D. Cognitive State Classification Using Convolutional Neural Networks on Gamma-Band EEG Signals. Applied Sciences 2024, 14, 8380. [Google Scholar] [CrossRef]
- Degirmenci, M.; Yuce, Y.K.; Perc, M.; Isler, Y. EEG channel and feature investigation in binary and multiple motor imagery task predictions. Frontiers in Human Neuroscience 2024, 17, 1525139. [Google Scholar] [CrossRef]
- Degirmenci, M.; Yuce, Y.K.; Perc, M.; Isler, Y. Statistically significant features improve binary and multiple Motor Imagery task predictions from EEGs. Frontiers in Human Neuroscience 2023, 17, 1223307. [Google Scholar] [CrossRef]
- Schirrmeister, R.; Springenberg, J.; Fiederer, L.; Glasstetter, M.; Eggensperger, K.; Tangermann, M.; Hutter, F.; Burgard, W.; Ball, T. Deep learning with convolutional neural networks for EEG decoding and visualization: Convolutional Neural Networks in EEG Analysis. Human Brain Mapping 2017, 38. [Google Scholar] [CrossRef]
- Lawhern, V.; Solon, A.; Waytowich, N.; Gordon, S.; Hung, C.; Lance, B. EEGNet: a compact convolutional neural network for EEG-based brain–computer interfaces. Journal of Neural Engineering 2018, 15. [Google Scholar] [CrossRef]
Figure 1.
Venn diagrams illustrating the definition of transfer entropy from joint and marginal Shannon entropies. Circles correspond to the responding channel present , the Takens-embedded responding’s past , and the Takens-embedded driving’s past . The transfer entropy identifies the unique predictive information from the driving’s past to the responding’s present beyond the responding’s own history.
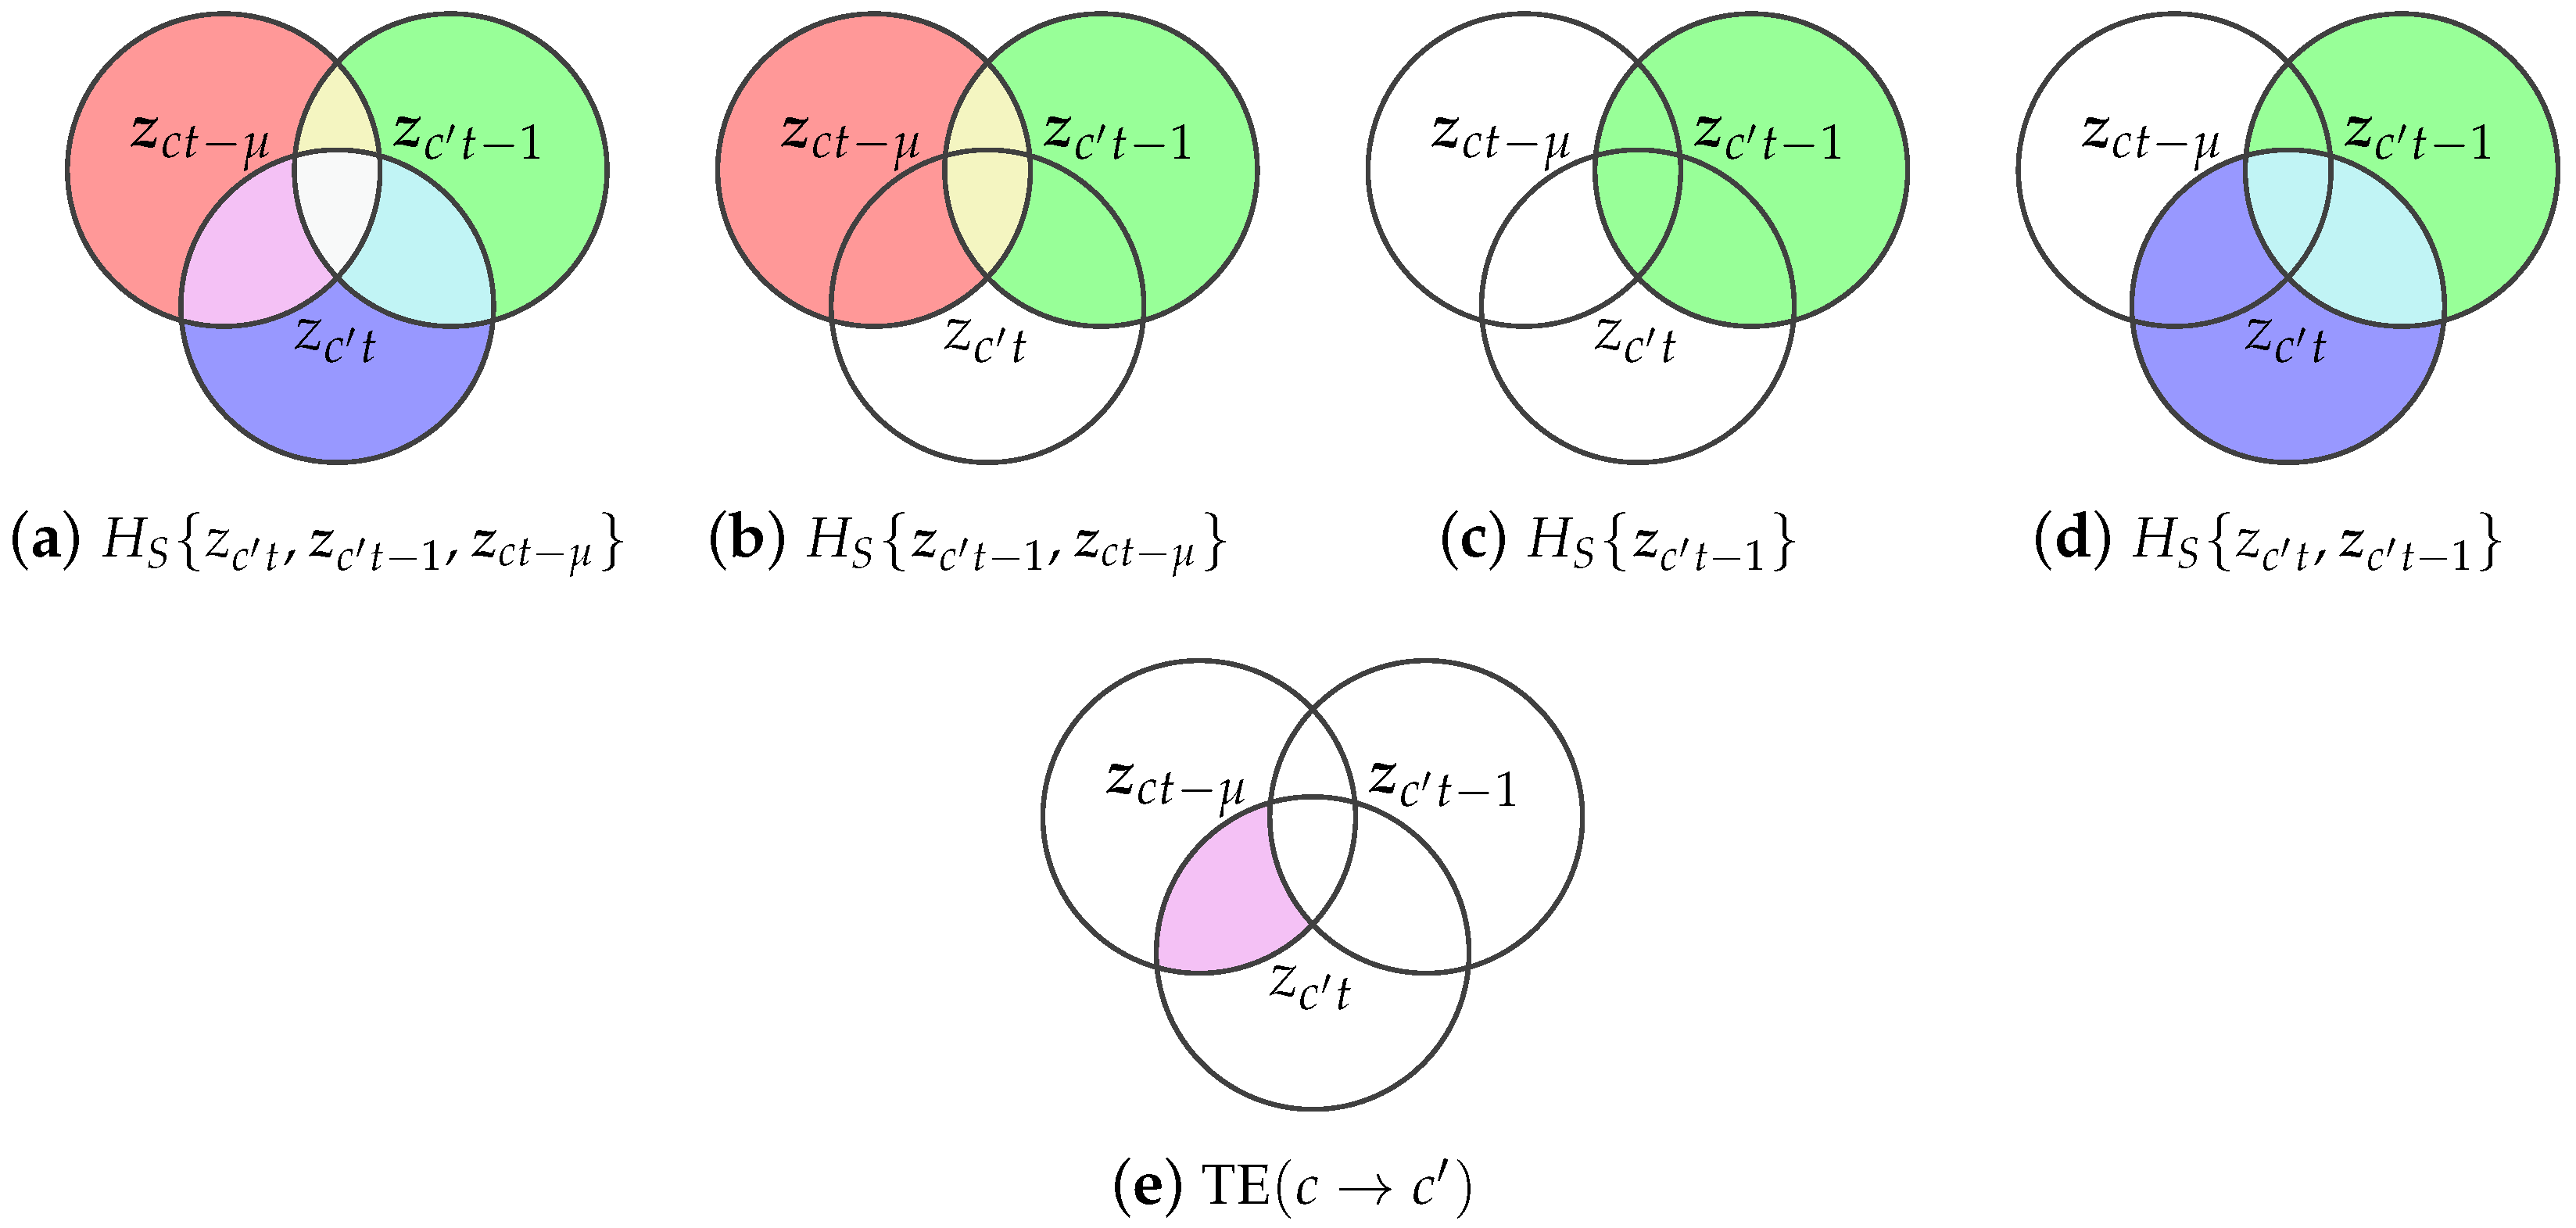
Figure 2.
Schematic description of the Motor Imagery (MI) paradigms.
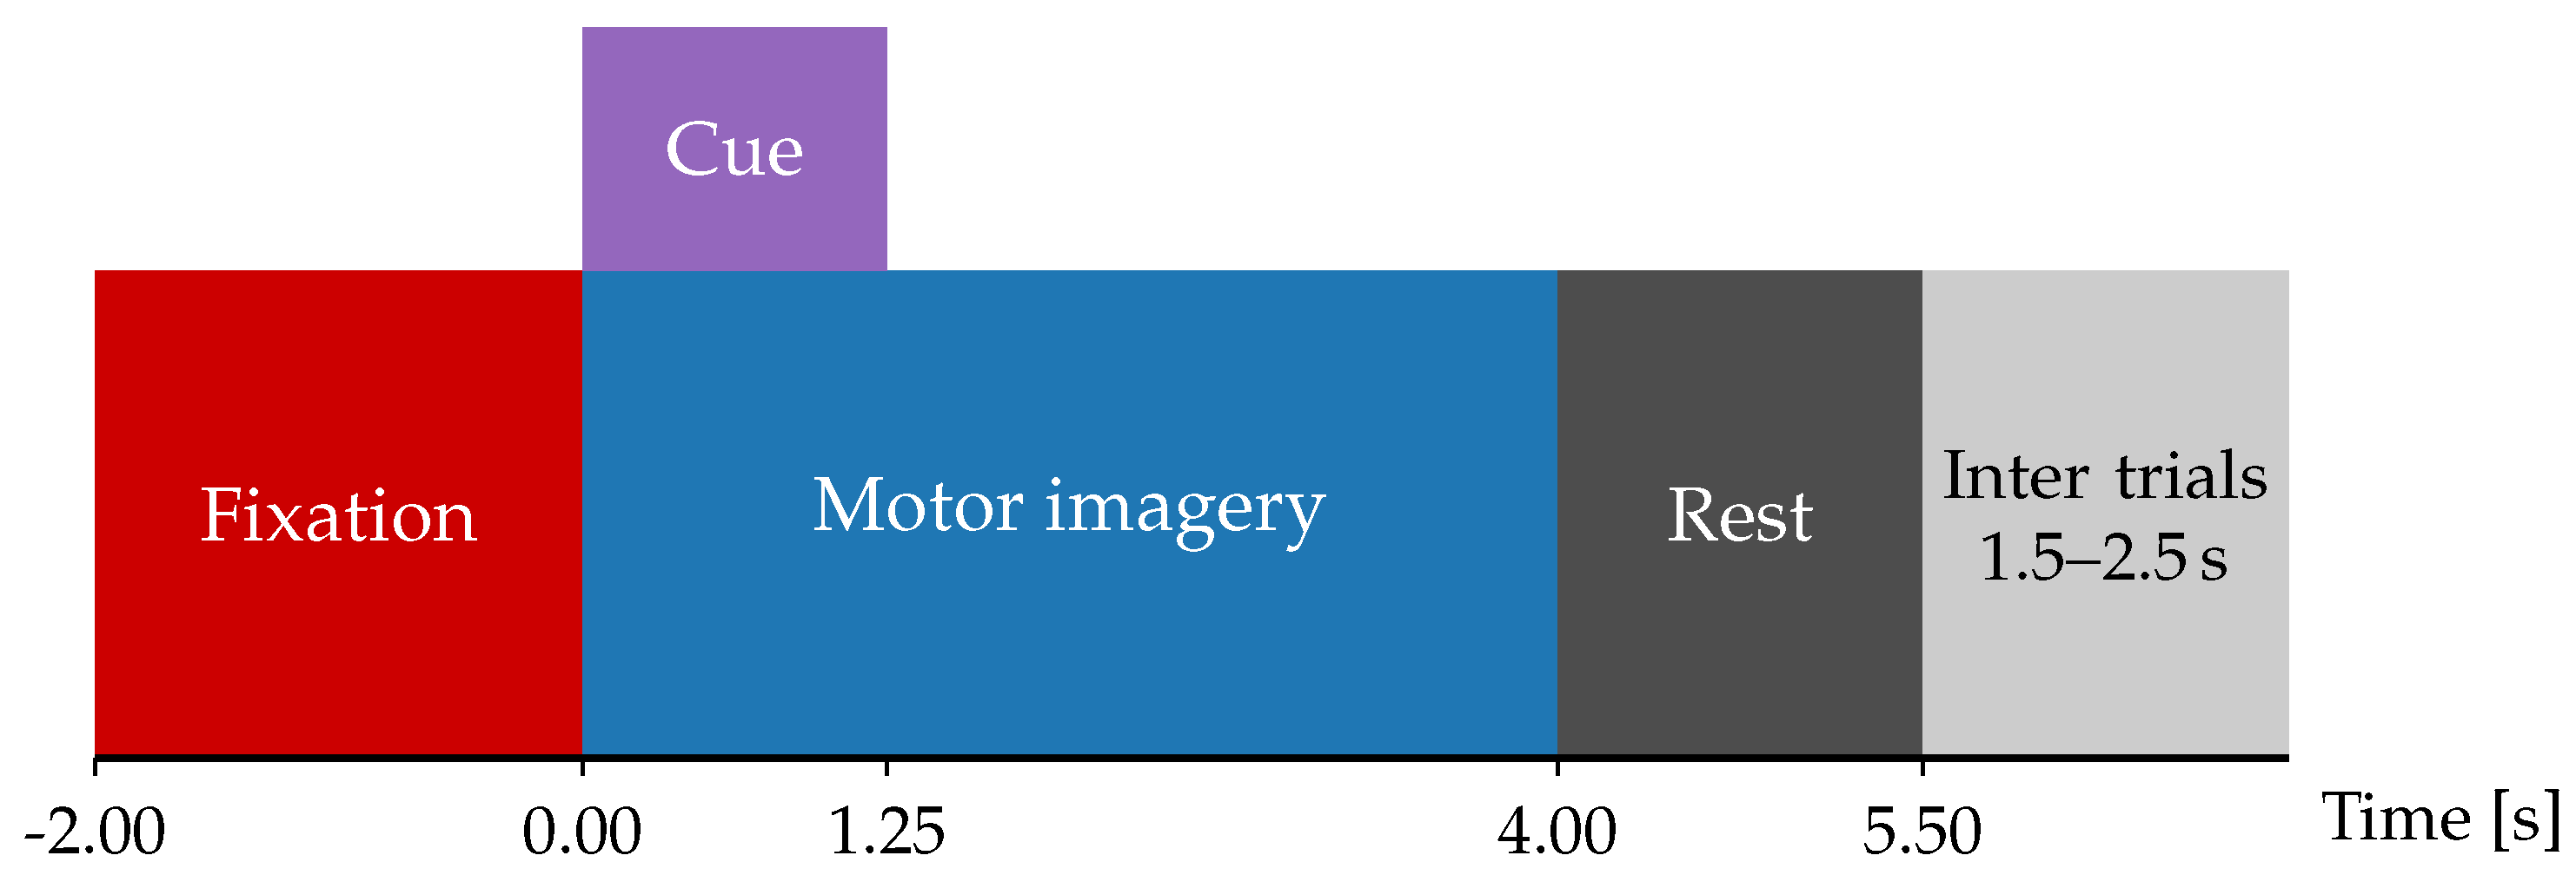
Figure 3.
Sensor positions according the 10-20 electrode placement system for the BCI Competition IV 2a dataset. 22 channels are distributed over ten main brain regions:  Frontal left,
  Frontal,
  Frontal right,
  Central left,
  Central right,
  Centro-parietal left,
  Centro-parietal right,
  Parietal left,
  Parietal right,
  Posterior.
Frontal left, Frontal, Frontal right, Central left, Central right, Centro-parietal left, Centro-parietal right, Parietal left, Parietal right, Posterior.
Figure 3.
Sensor positions according the 10-20 electrode placement system for the BCI Competition IV 2a dataset. 22 channels are distributed over ten main brain regions: Frontal left, Frontal, Frontal right, Central left, Central right, Centro-parietal left, Centro-parietal right, Parietal left, Parietal right, Posterior.
Frontal left, Frontal, Frontal right, Central left, Central right, Centro-parietal left, Centro-parietal right, Parietal left, Parietal right, Posterior.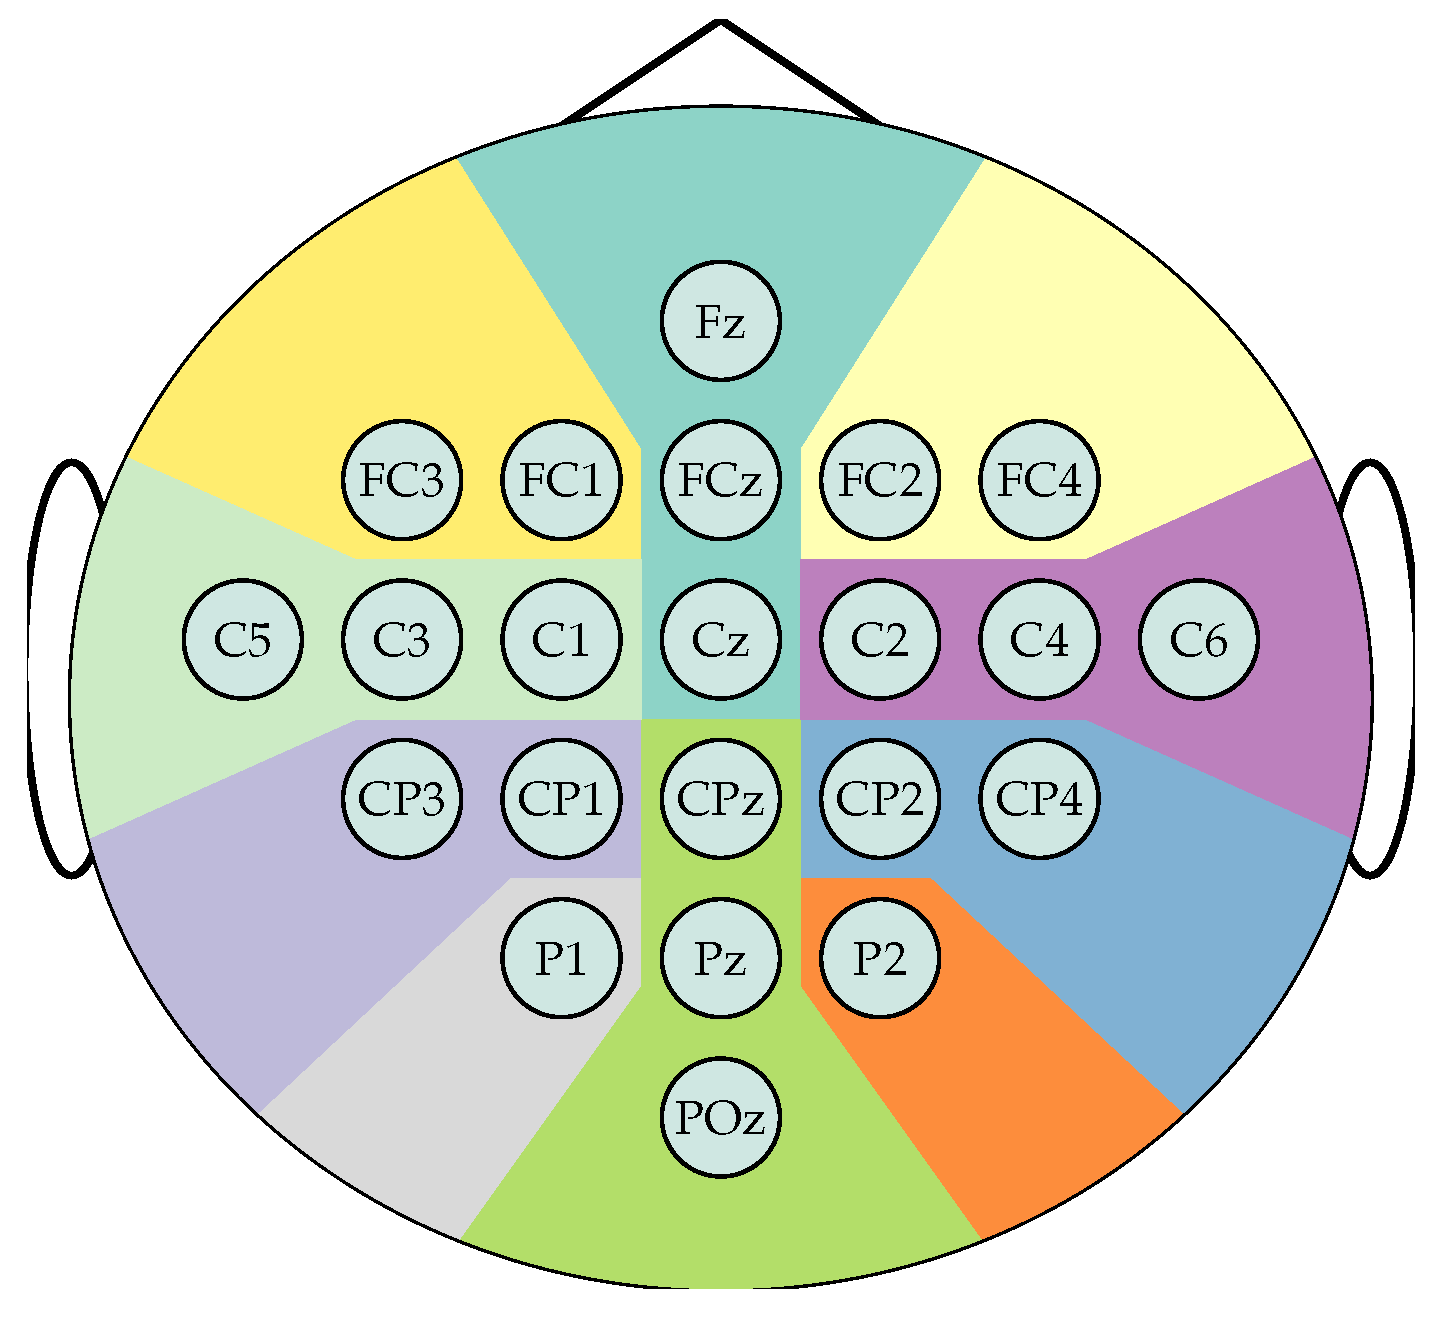
Figure 4.
Causal structures of the synthetic benchmarks used for validation. Each configuration consists of one real EEG, three synthetic, and one noise channels. Causal interactions are different bewteen the two structures.
Figure 4.
Causal structures of the synthetic benchmarks used for validation. Each configuration consists of one real EEG, three synthetic, and one noise channels. Causal interactions are different bewteen the two structures.
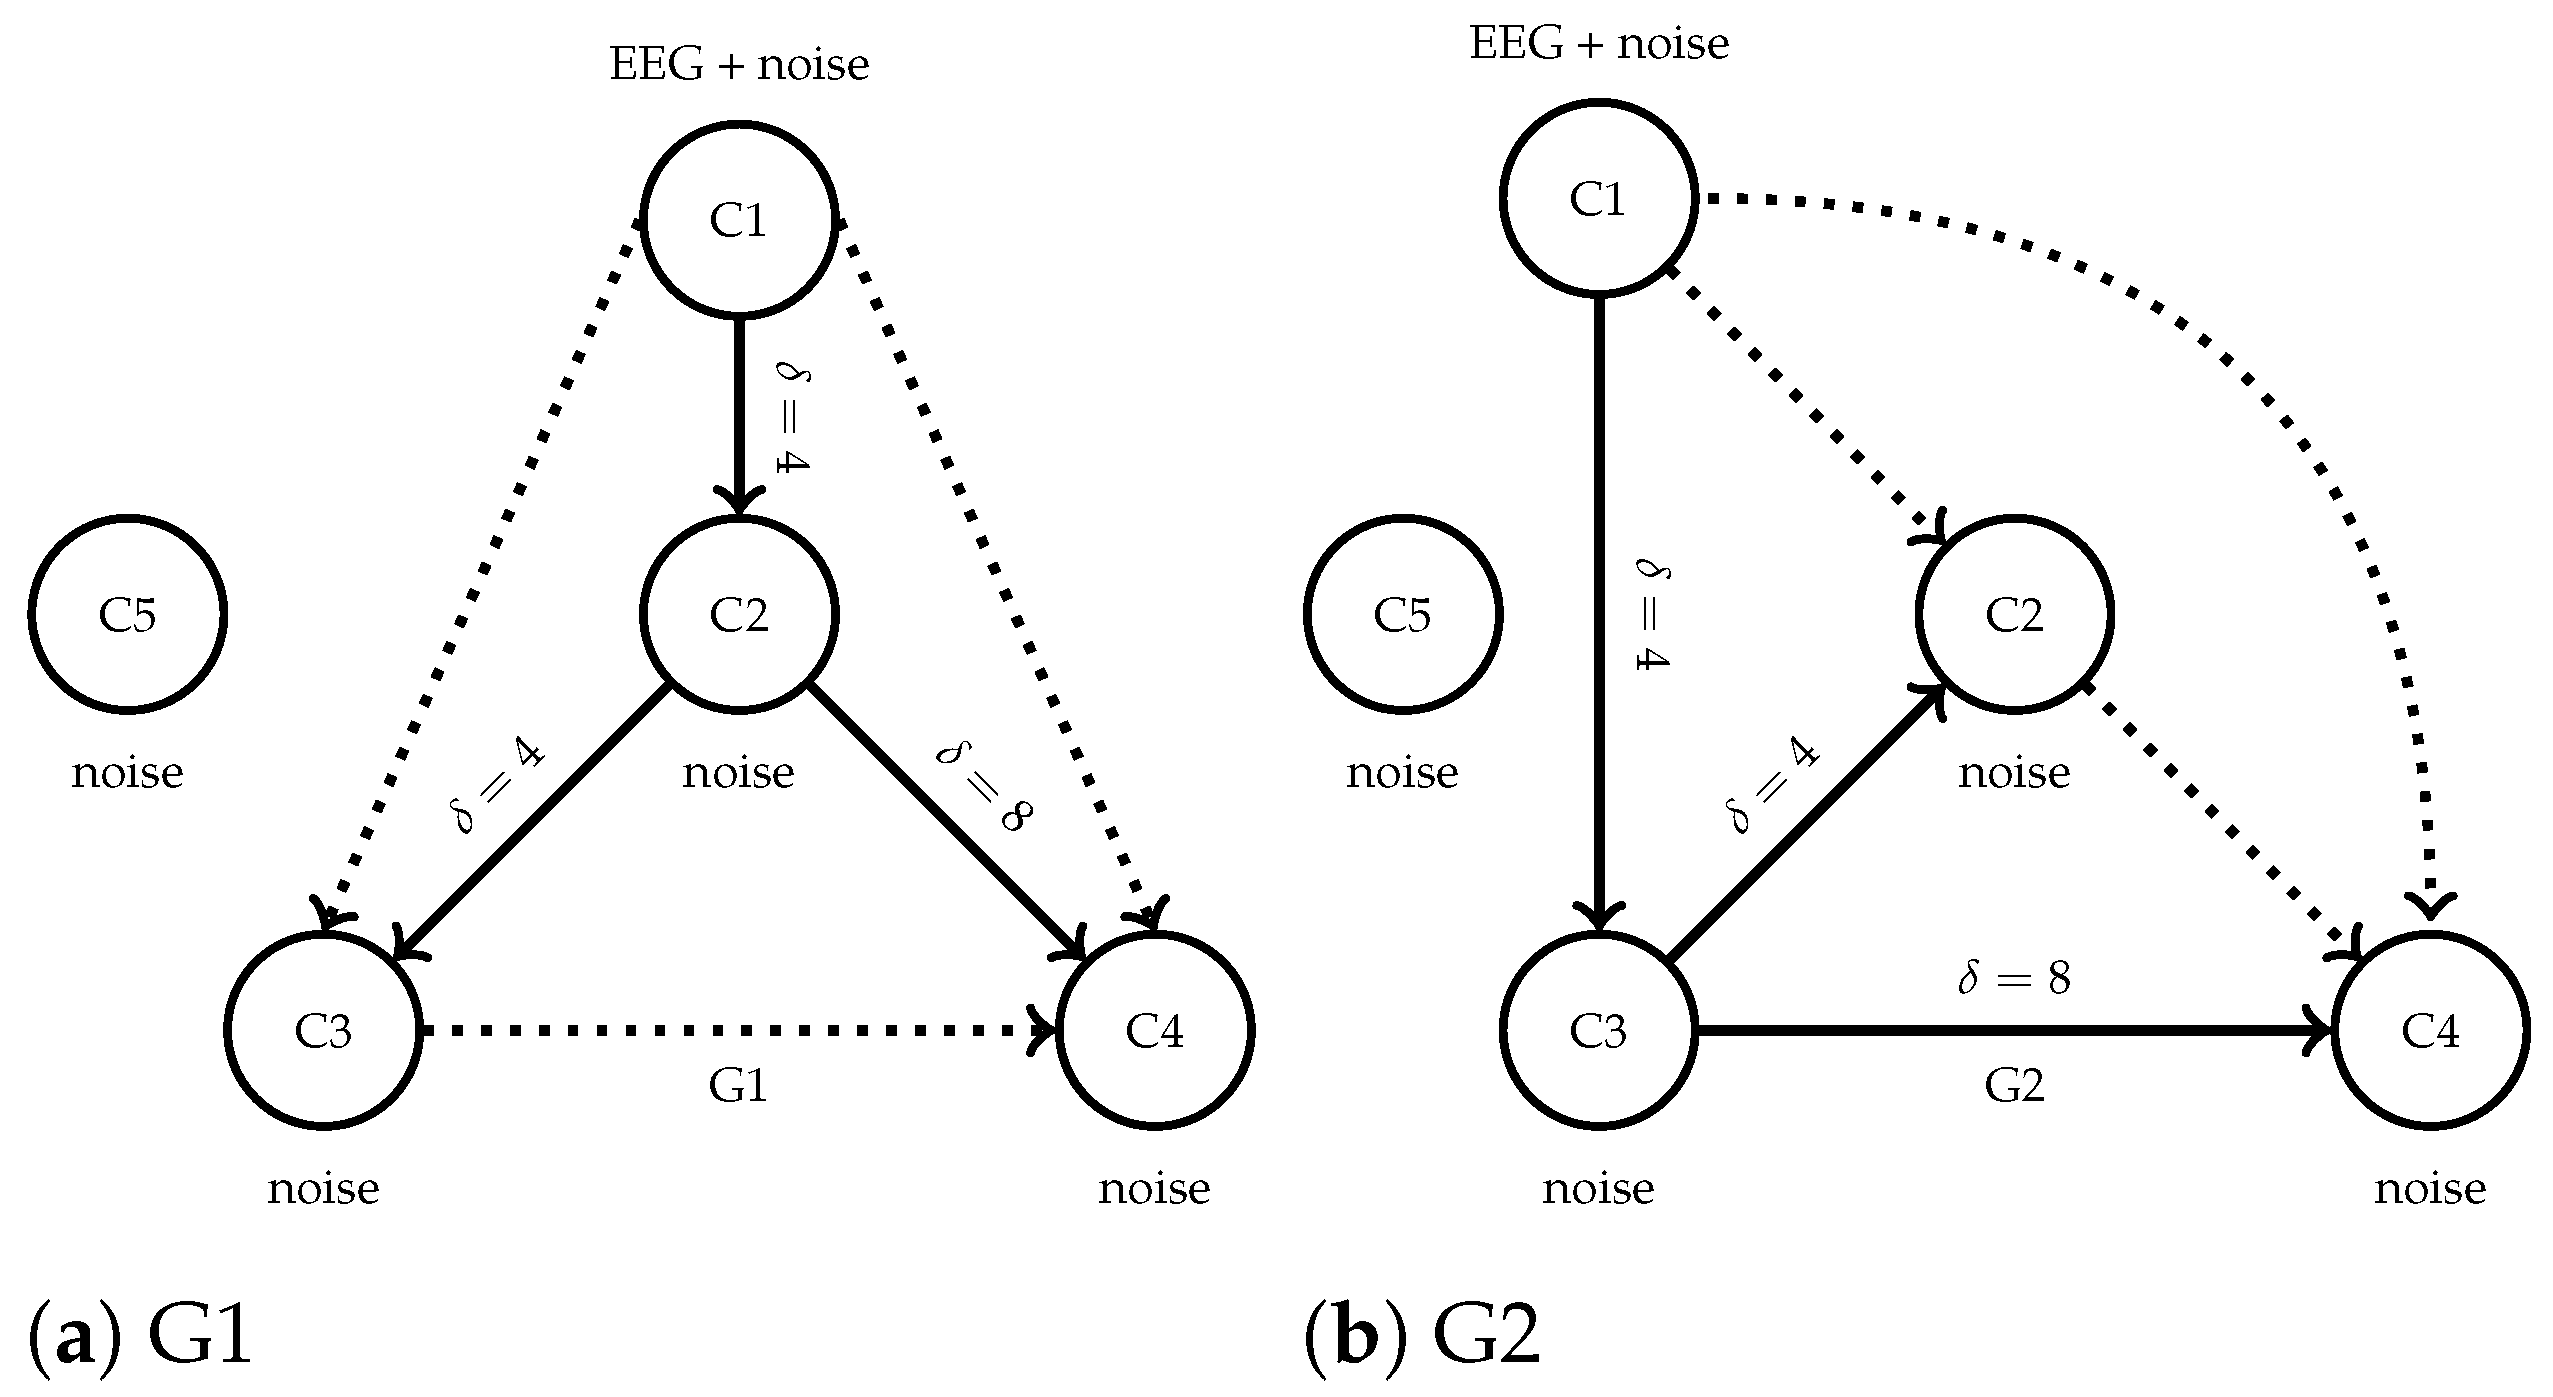
Figure 5.
Average TE matrices for the semi-synthetic causal structures G1 and G2. Each matrix captures the dominant directed interactions estimated by the TEKTE-Net.
Figure 5.
Average TE matrices for the semi-synthetic causal structures G1 and G2. Each matrix captures the dominant directed interactions estimated by the TEKTE-Net.
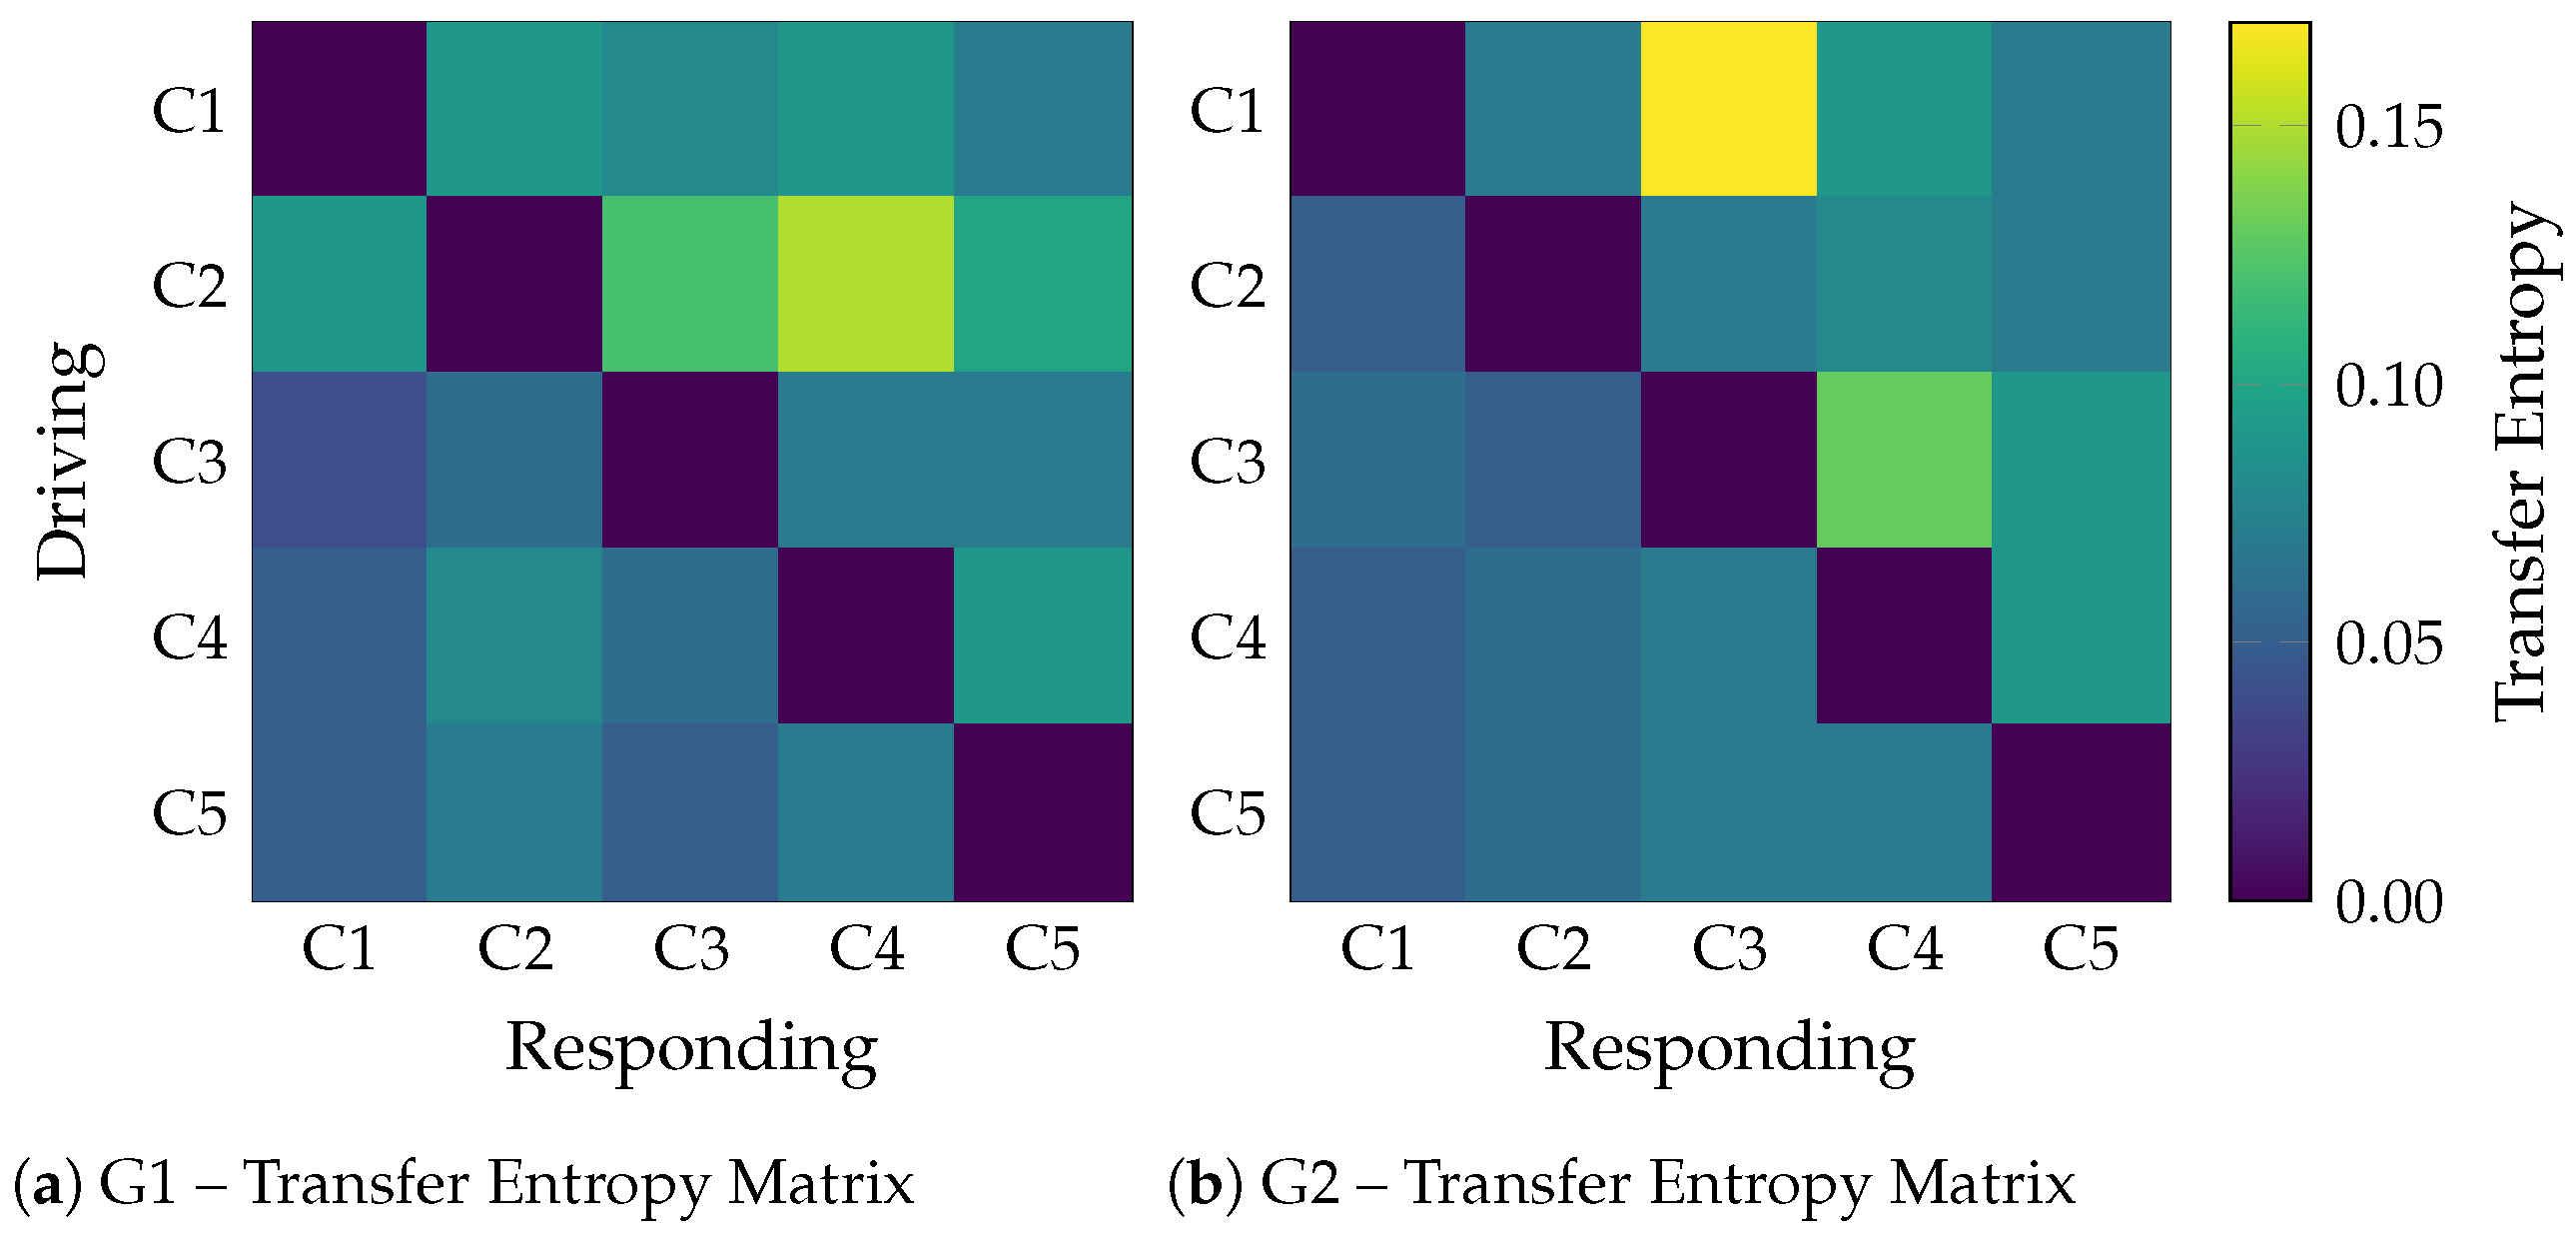
Figure 6.
Classification accuracy of the TE, Gaussian, and Quadratic kernel models under increasing Gaussian noise levels. Noise is expressed in decibels (dB), where lower values correspond to cleaner signals. The Quadratic model shows the most stable performance across the noise range.
Figure 6.
Classification accuracy of the TE, Gaussian, and Quadratic kernel models under increasing Gaussian noise levels. Noise is expressed in decibels (dB), where lower values correspond to cleaner signals. The Quadratic model shows the most stable performance across the noise range.
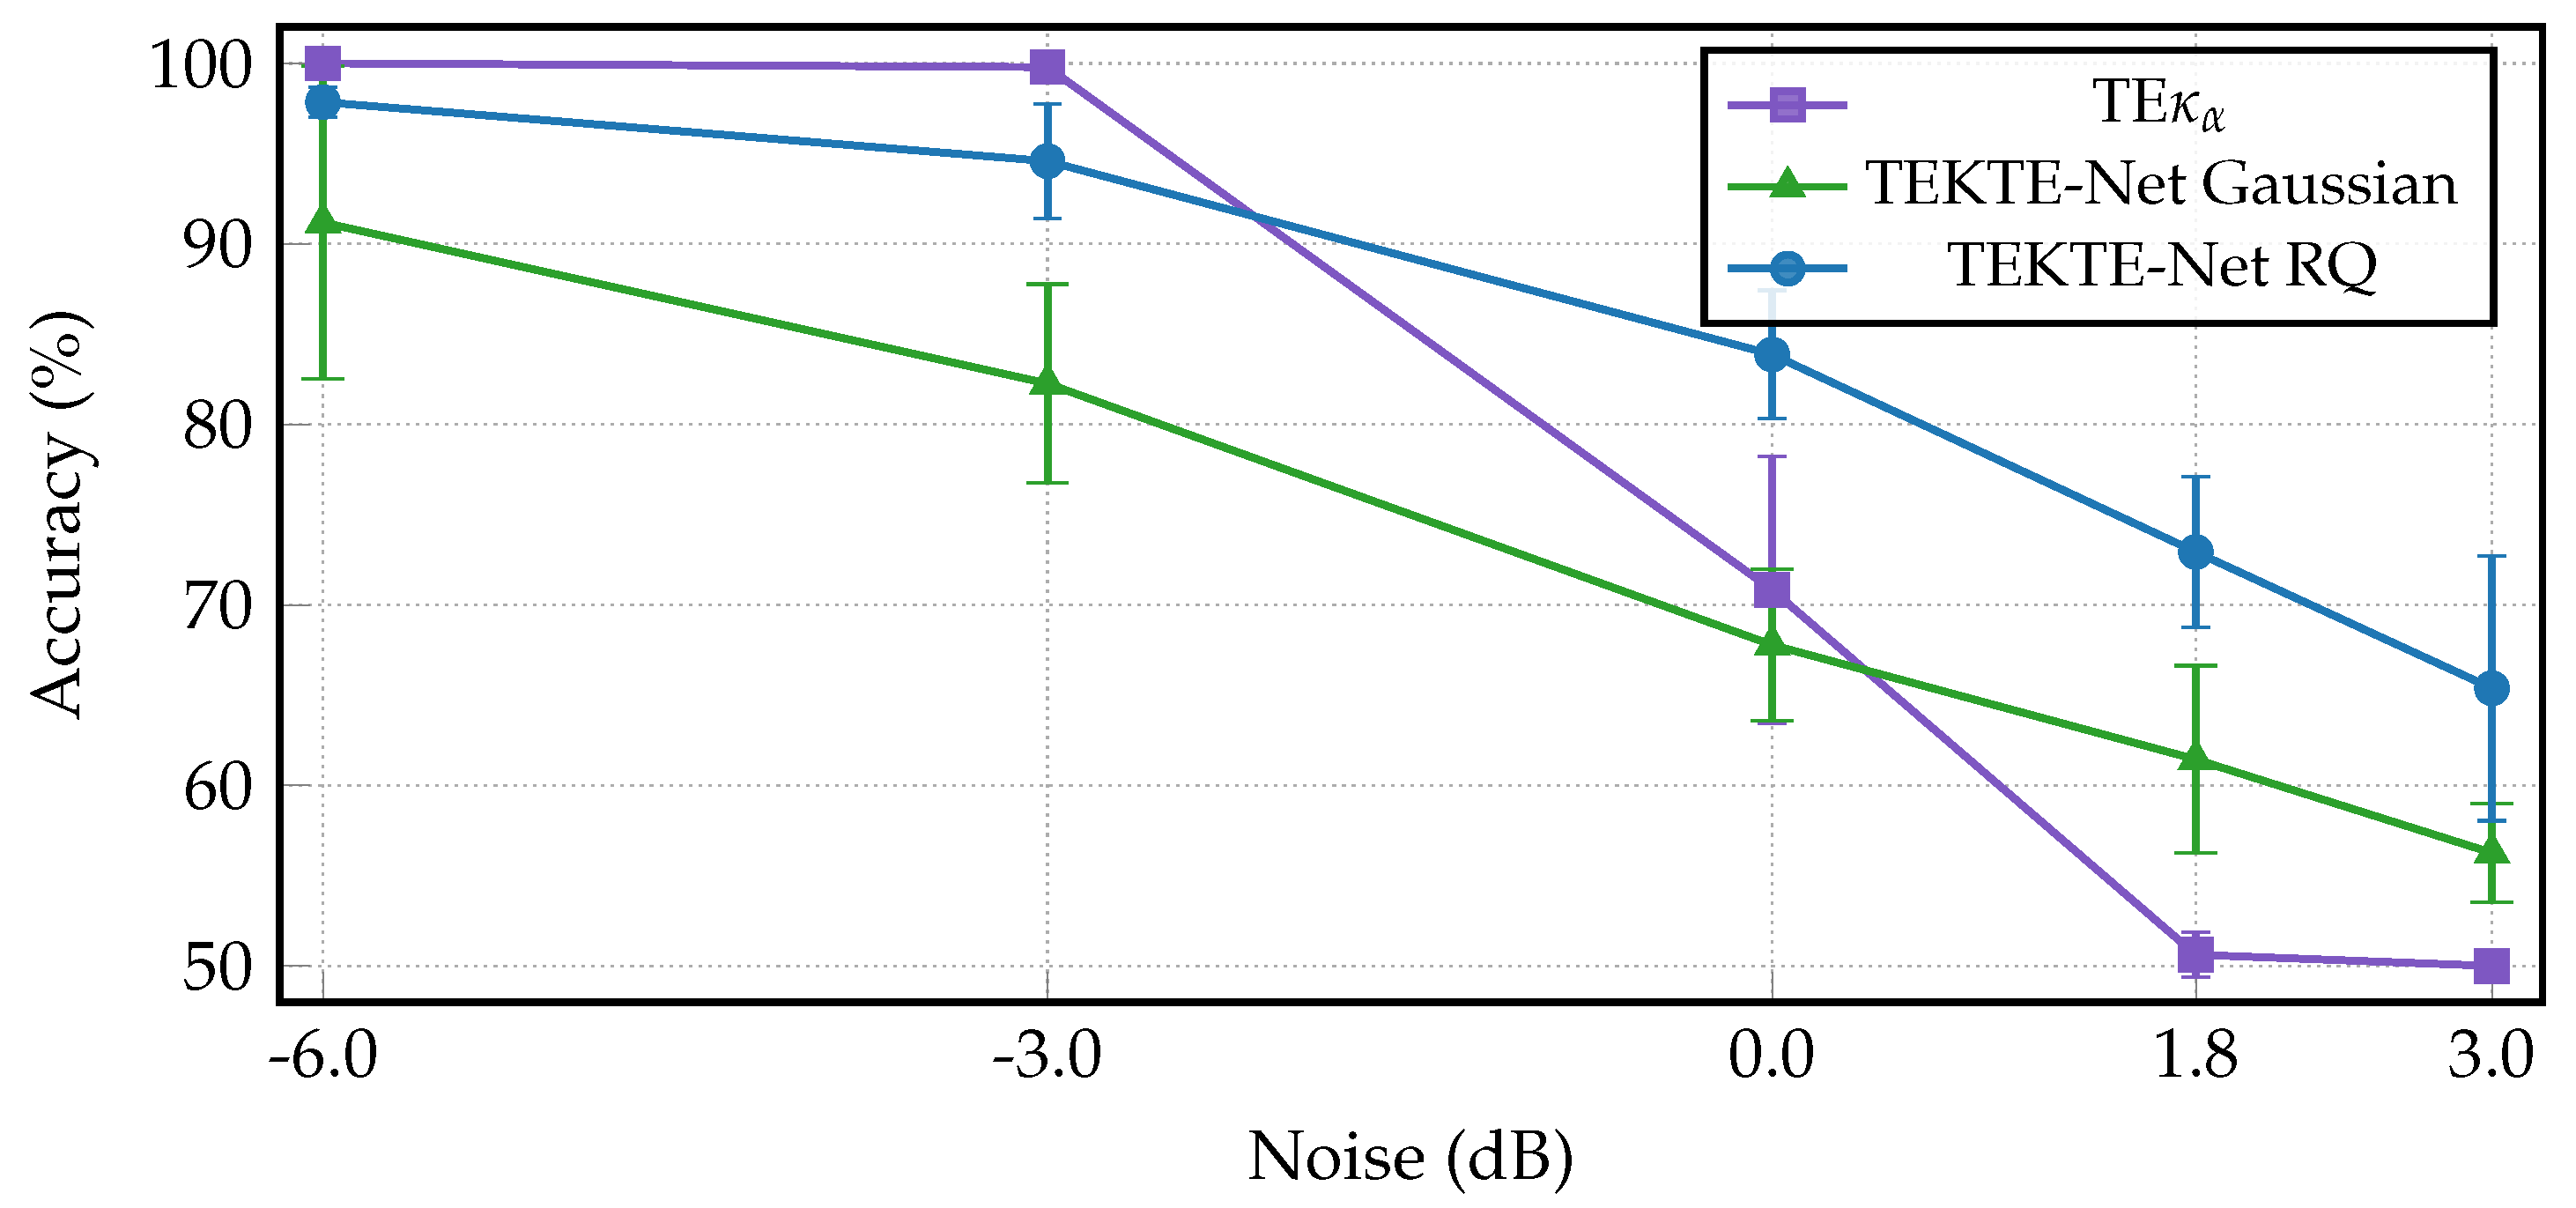
Figure 7.
Results of the Bayesian hyperparameter optimization for subjects descending-sorted according their validation accuracy.
Figure 7.
Results of the Bayesian hyperparameter optimization for subjects descending-sorted according their validation accuracy.
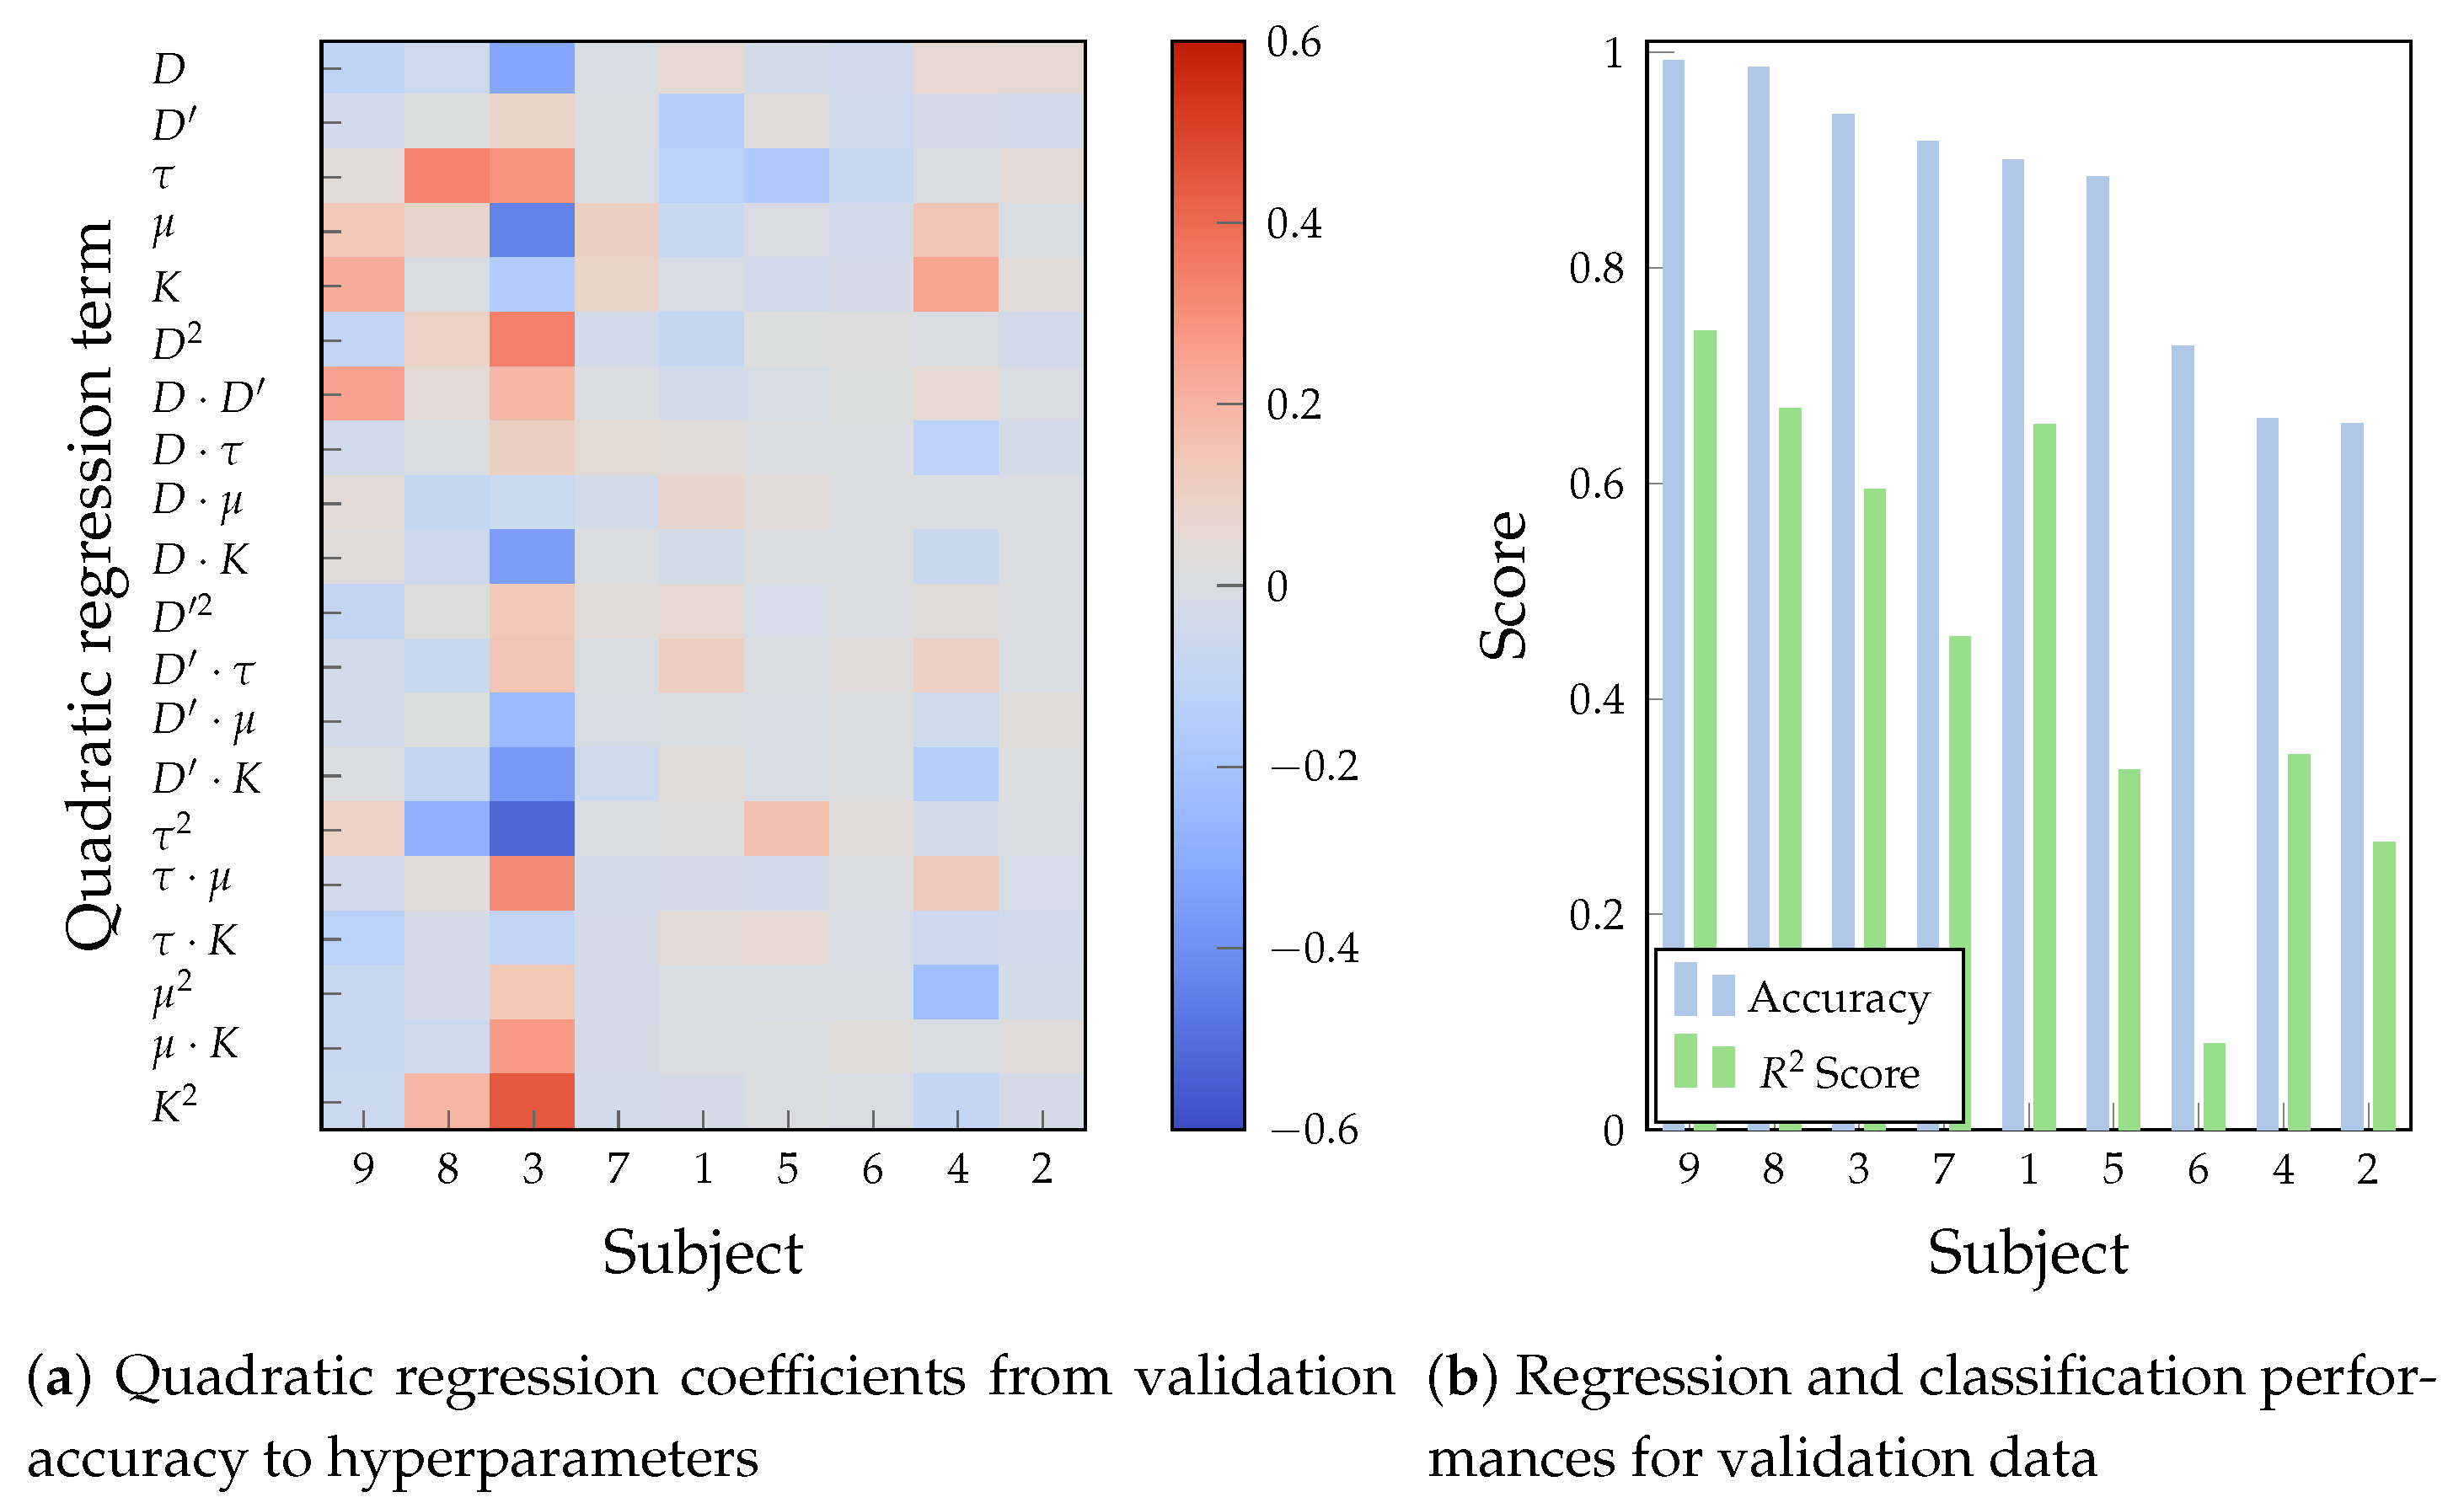
Figure 8.
Classification accuracy for each subject across overlapping time windows during the 7-second motor imagery task. A total of 11 time windows were used, each with a 0.5-second overlap. The x-axis represents the center of each time window, and the y-axis shows the classification accuracy (%). This analysis reveals temporal dynamics in classification performance throughout the motor imagery period.
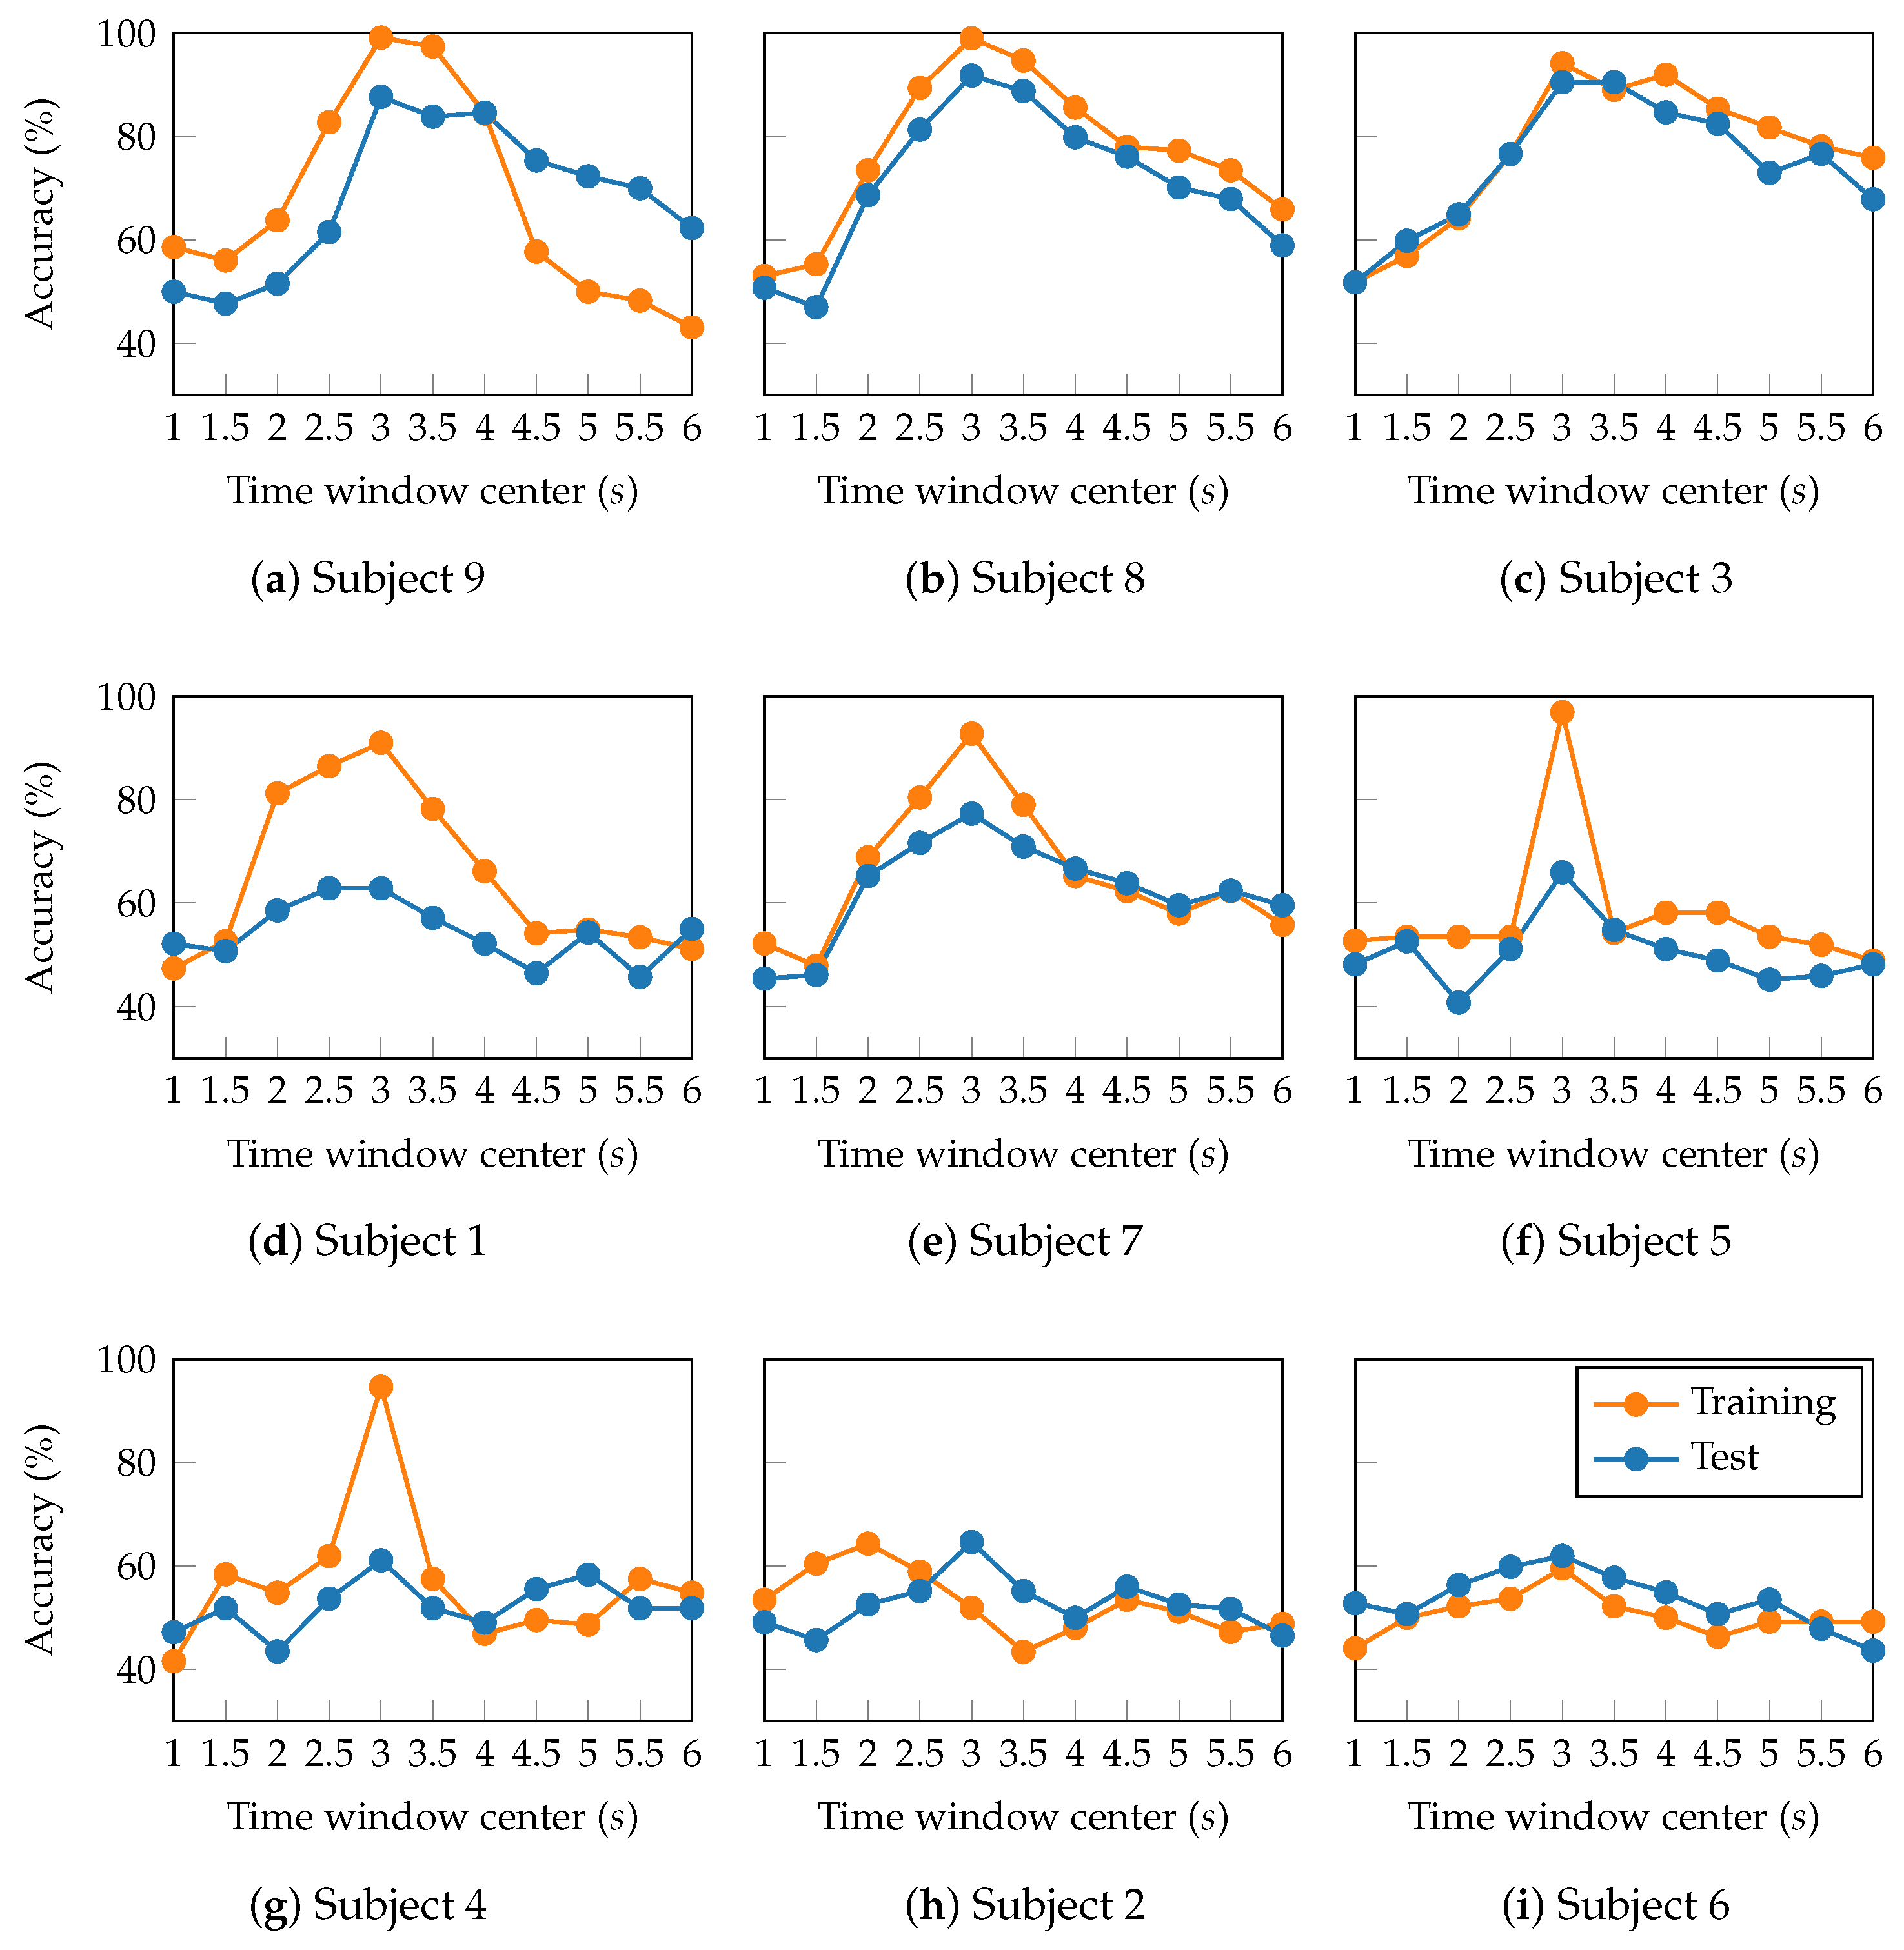
Figure 9.
Brain connectivity patterns during left- and right-hand motor imagery tasks across models grouped by test accuracy. High performers (accuracy > 85%), mid performers (accuracy between 60% and 80%), and low performers (accuracy < 60%) display distinct activation distributions. Each row corresponds to a representative model within each performance group.
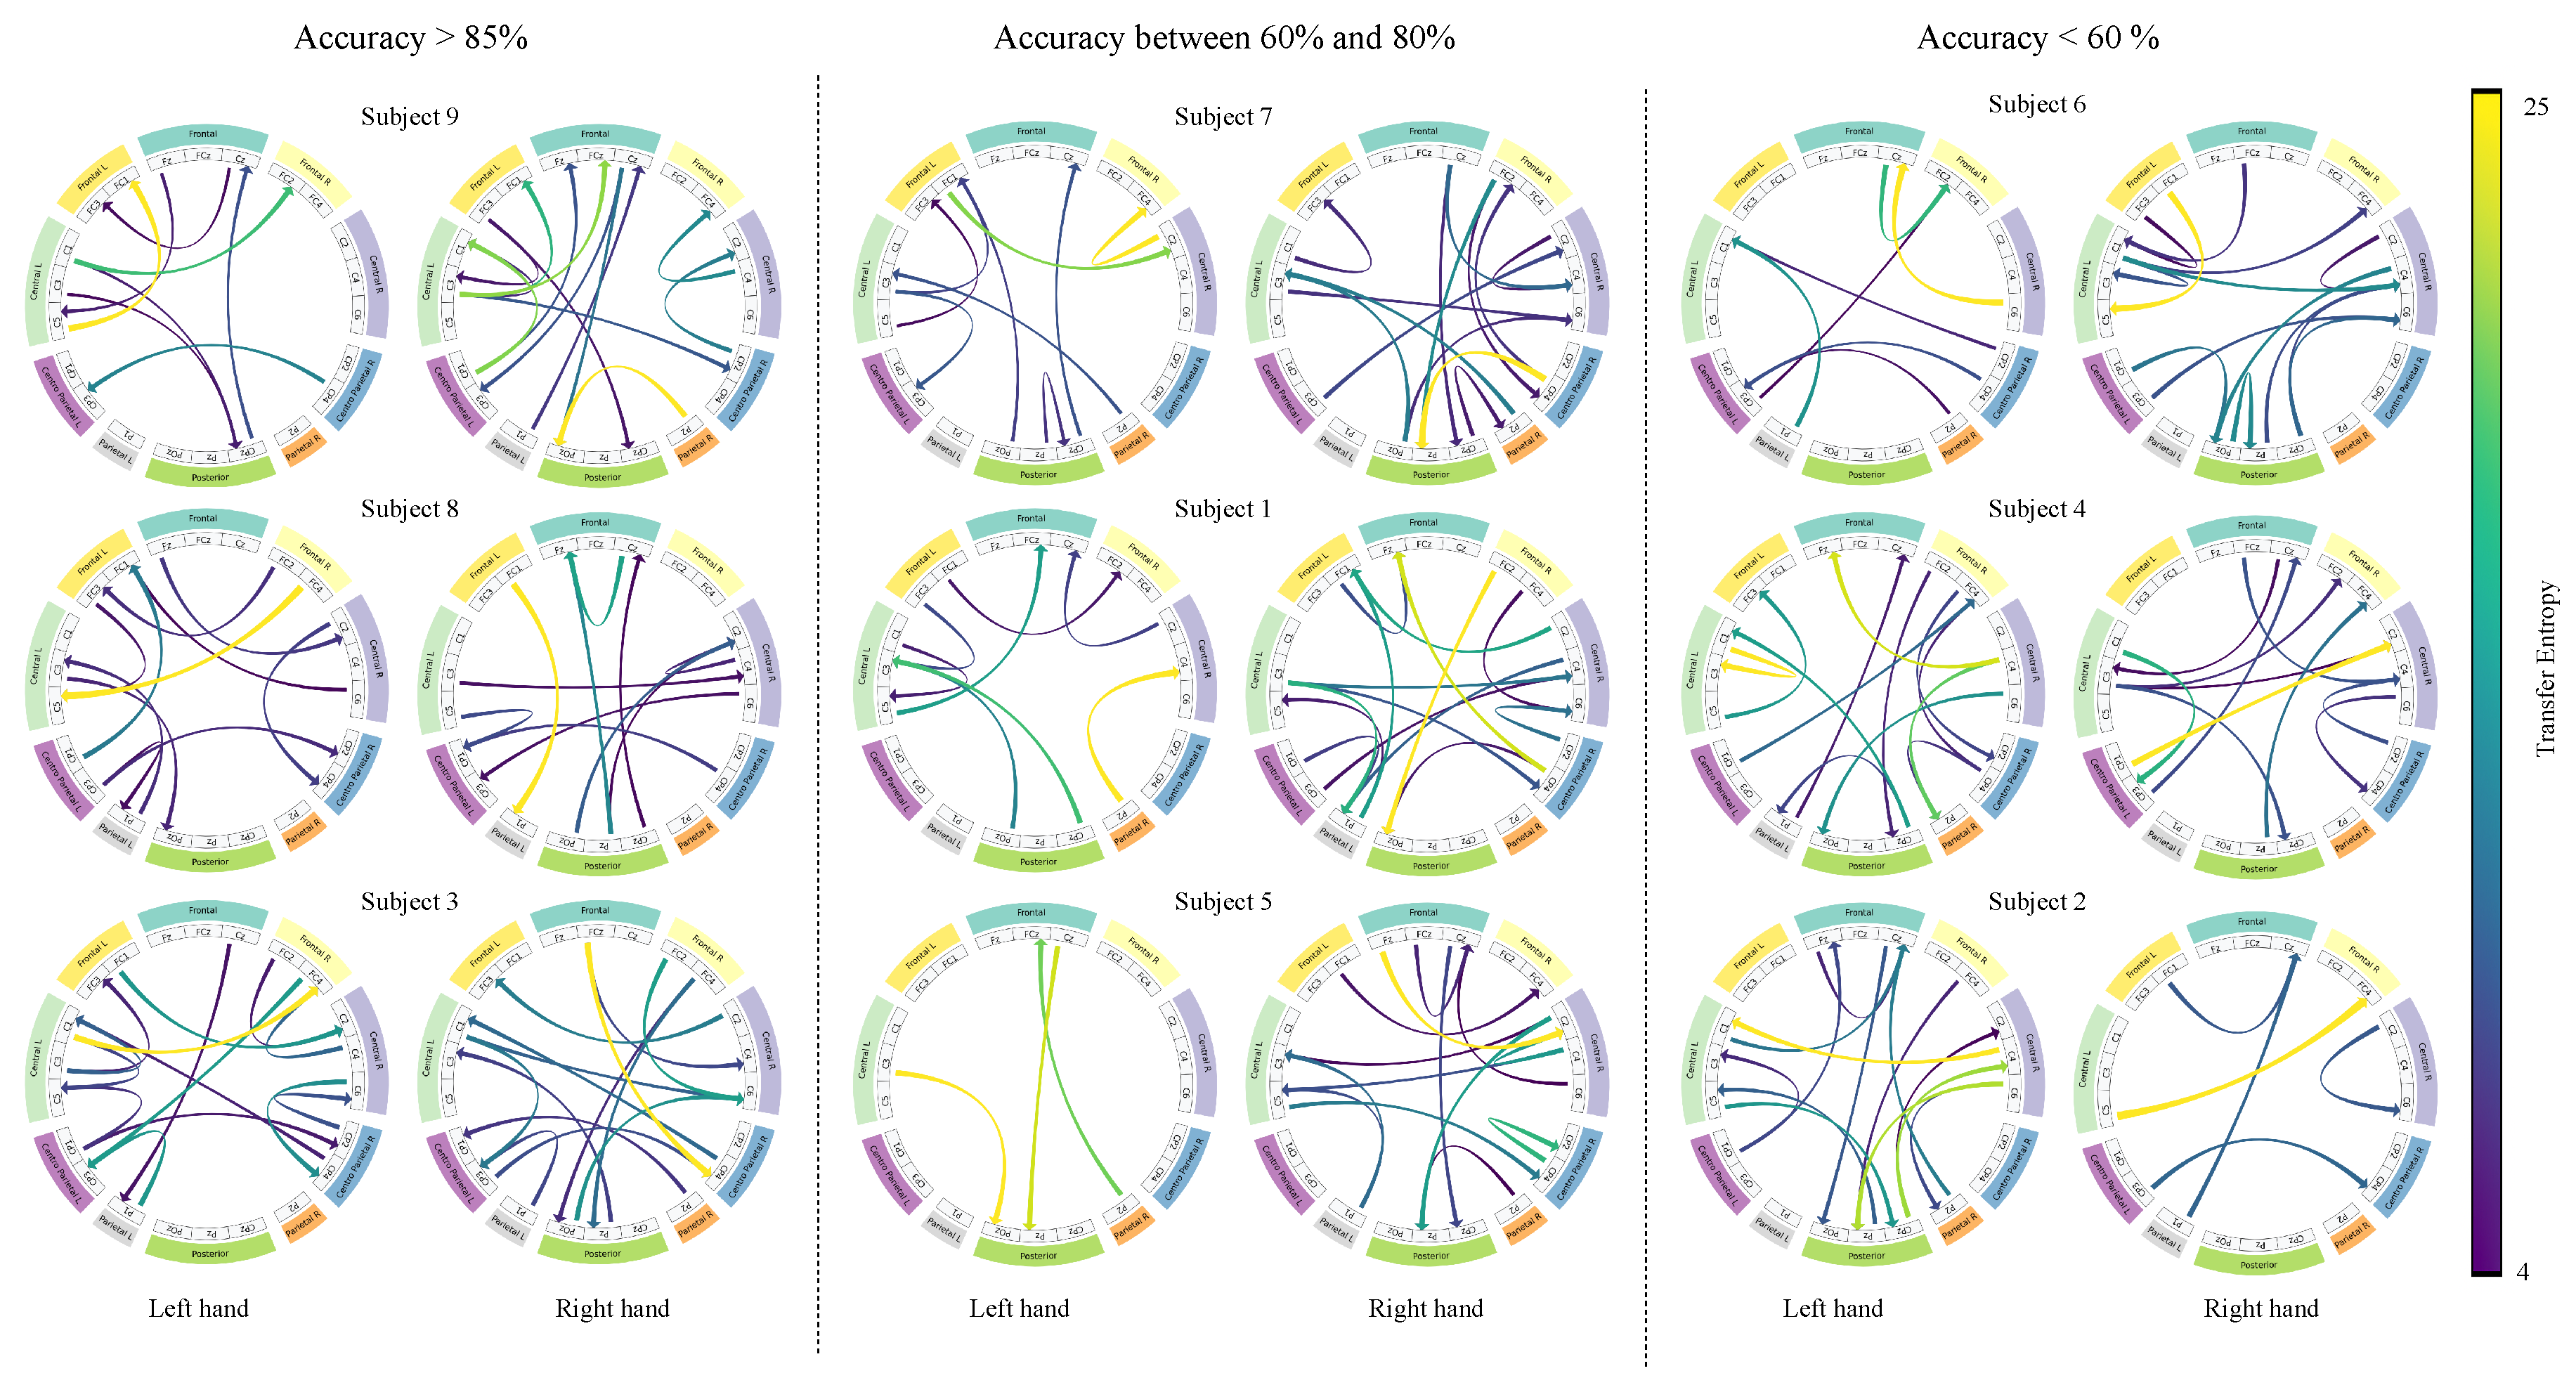
Figure 10.
Frequency responses (dB) of the filters learned by the depthwise layer. In each panel, the x-axis shows frequency (Hz) and the y-axis shows the 22 EEG channels; the color indicates the average magnitude in dB.
Figure 10.
Frequency responses (dB) of the filters learned by the depthwise layer. In each panel, the x-axis shows frequency (Hz) and the y-axis shows the 22 EEG channels; the color indicates the average magnitude in dB.
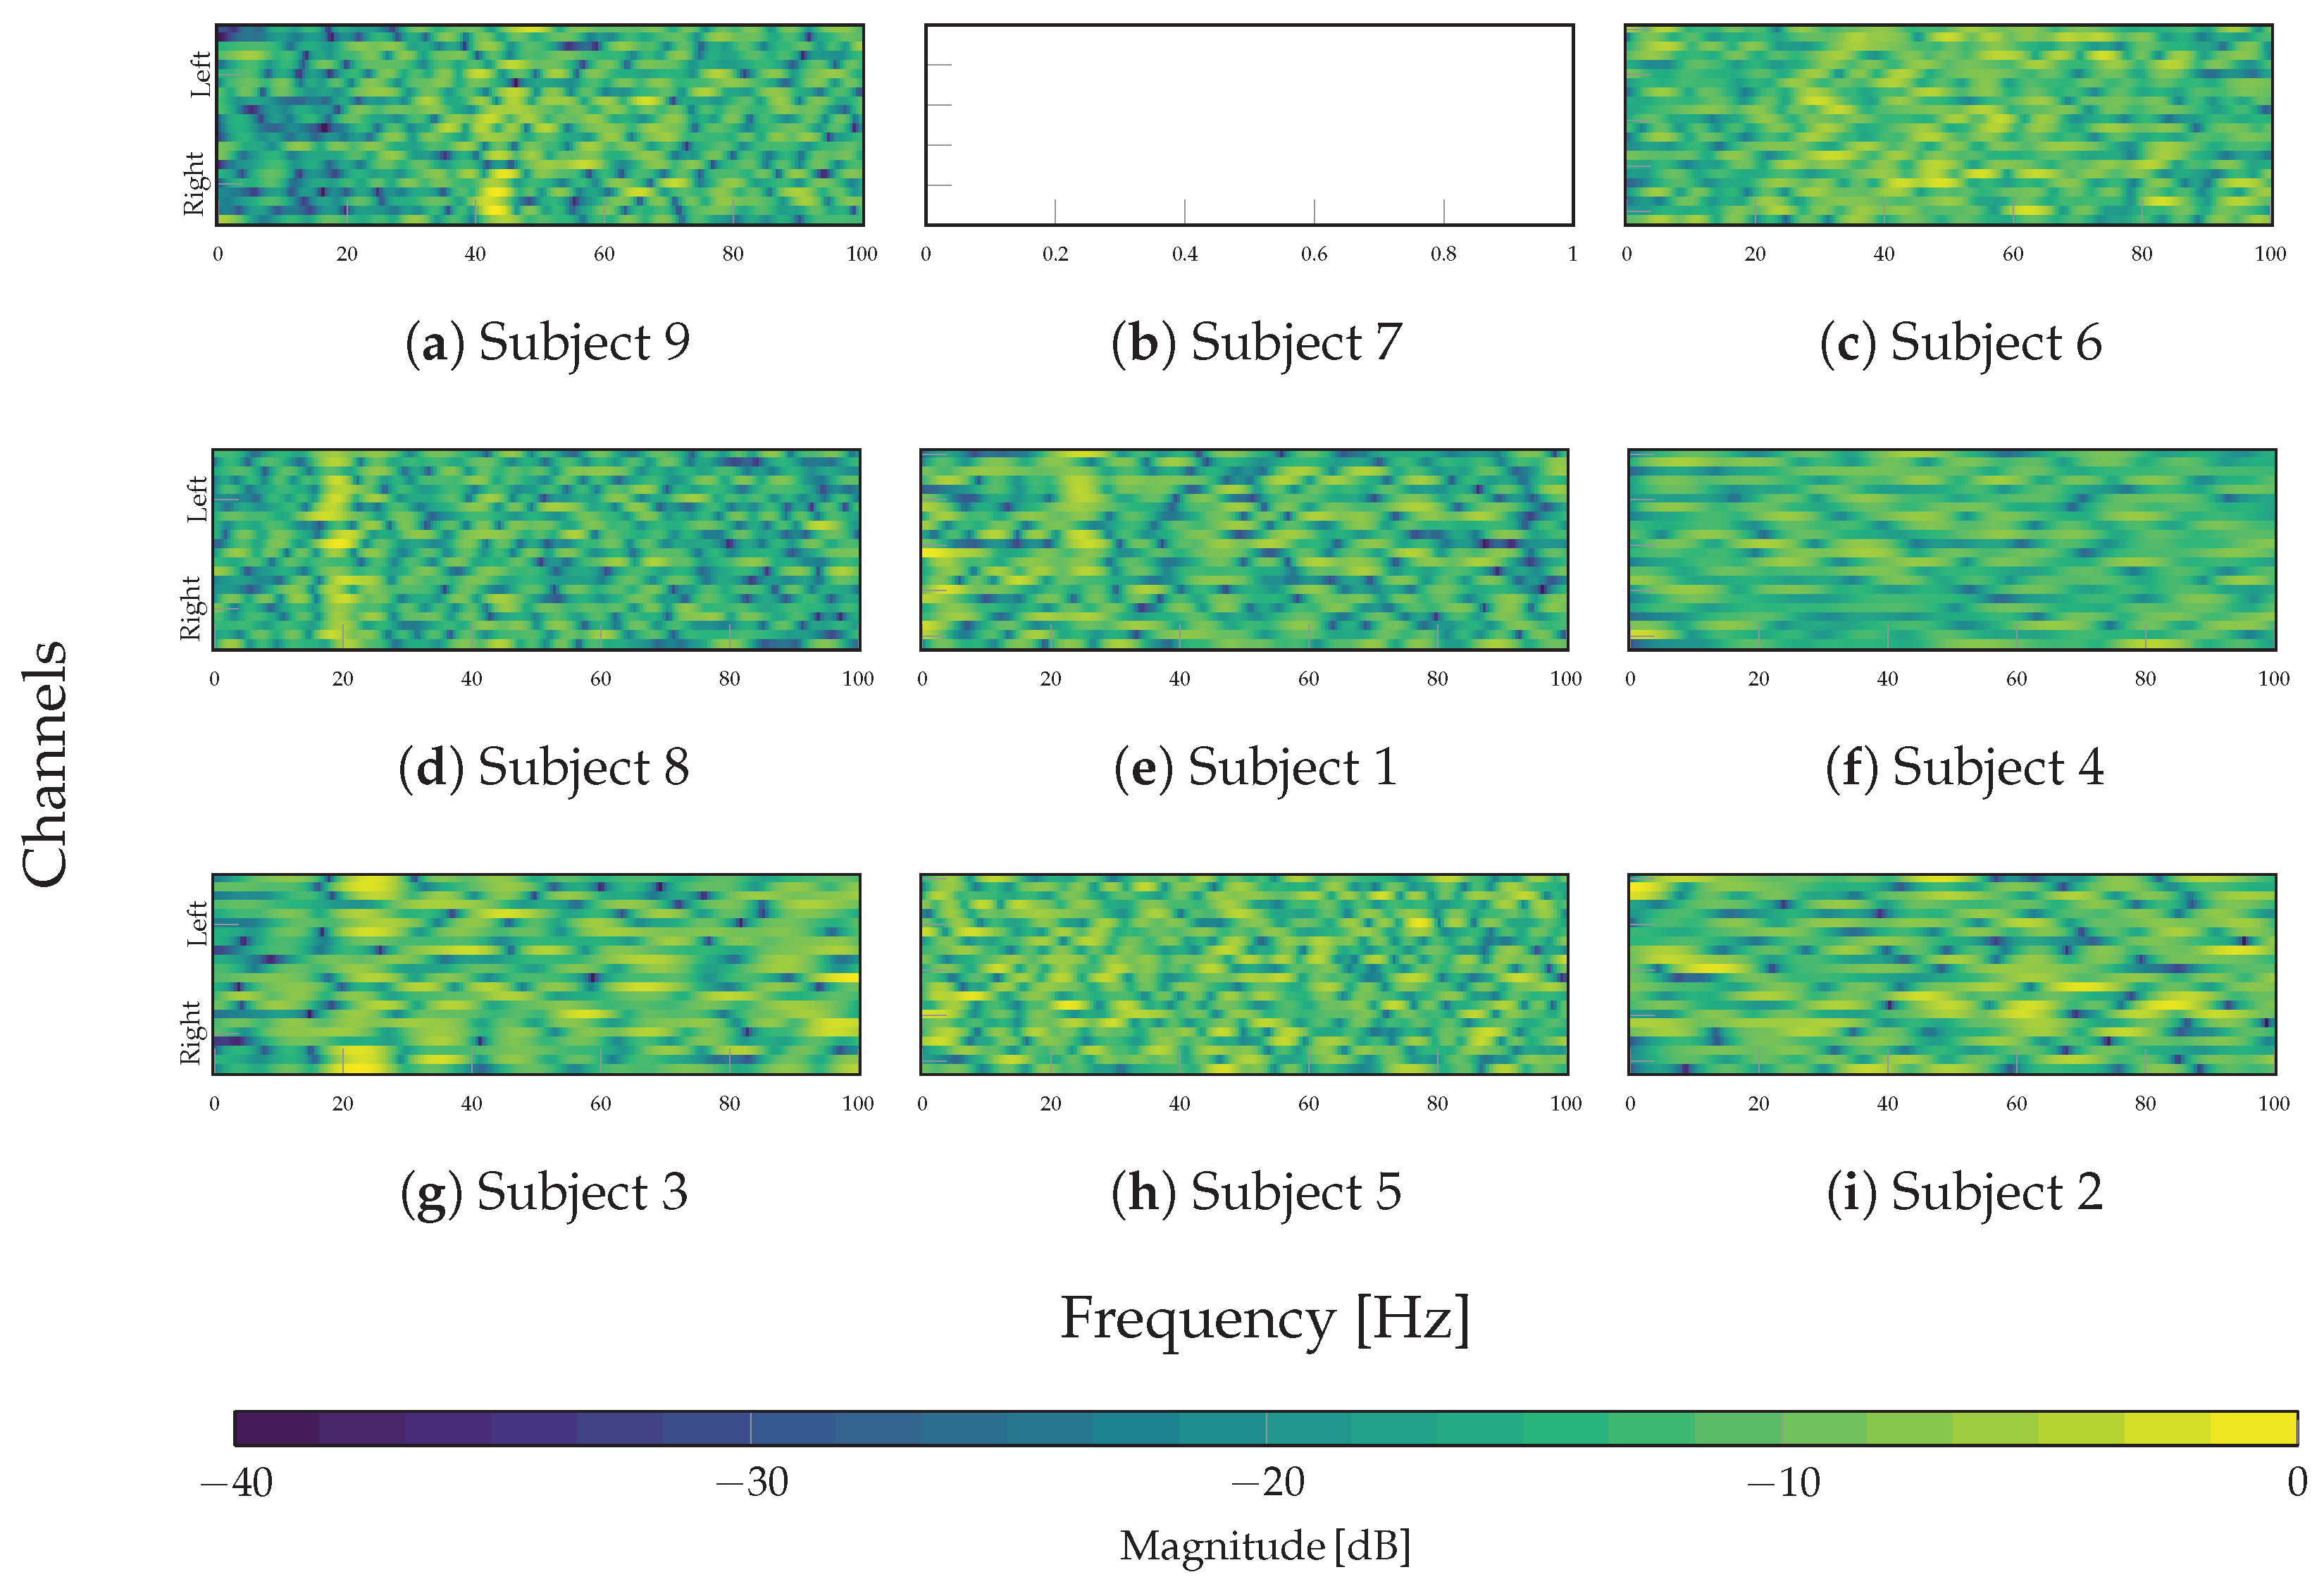

Table 1.
Detailed TEKTE-Net architecture for MI classification.
| Layer | Variable | Dimension | Hyperparameters |
|---|---|---|---|
| Input | – | ||
| DepthwiseConv1D | Kernel size K Stride = 1 ReLU activation |
||
| AveragePooling1D | Pool size = 4 Stride = 4 |
||
| TakensConv1D | – | ||
| Order | |||
| Order D Stride Delayed interaction |
|||
| RationalQuadratic Kernel | Scale mixture rate |
||
| TransferEntropy | – | ||
| Flatten | – | ||
| Dense | H | Hidden units ReLU activation |
|
| Dense | O | Output units Sigmoid activation |
Table 2.
TEKTE-Net hyperparameters tuned through the Bayesian optimization sorted by descending validation accuracy.
Table 2.
TEKTE-Net hyperparameters tuned through the Bayesian optimization sorted by descending validation accuracy.
| Group | Subject | D | K | |||
|---|---|---|---|---|---|---|
| 9 | 3 | 2 | 1 | 5 | 125 | |
| High | 8 | 1 | 3 | 1 | 3 | 123 |
| 3 | 3 | 8 | 2 | 0 | 63 | |
| 7 | 5 | 1 | 1 | 3 | 81 | |
| Mid | 1 | 1 | 1 | 1 | 8 | 91 |
| 5 | 6 | 6 | 5 | 9 | 121 | |
| 6 | 5 | 5 | 4 | 10 | 99 | |
| Low | 4 | 4 | 3 | 2 | 8 | 51 |
| 2 | 10 | 2 | 1 | 0 | 57 |
Table 3.
Performance metrics achieved by TEKTE-Net on the validation and official testing sets. Subjects are sorted in descending order of validation accuracy. Mean and standard deviation for each metric are computed from a five-fold cross-validation.
Table 3.
Performance metrics achieved by TEKTE-Net on the validation and official testing sets. Subjects are sorted in descending order of validation accuracy. Mean and standard deviation for each metric are computed from a five-fold cross-validation.
| Subject | Val. Acc (%) | Acc. (%) | F1 (%) | Sens. (%) | Spec. (%) |
|---|---|---|---|---|---|
| 9 | |||||
| 8 | |||||
| 3 | |||||
| 7 | |||||
| 1 | |||||
| 5 | |||||
| 6 | |||||
| 4 | |||||
| 2 | |||||
| Avg |
Table 4.
Average classification accuracy of state-of-the-art methods for binary MI-EEG decoding (left vs. right hand) on the BCI Competition IV Dataset IIa.
Table 4.
Average classification accuracy of state-of-the-art methods for binary MI-EEG decoding (left vs. right hand) on the BCI Competition IV Dataset IIa.
| Model | Accuracy |
|---|---|
| DeepConvNet (2017) [64] | |
| ShallowConvNet (2017) [64] | |
| EEGNet (2018) [65] | |
| TE (2019) [42] | |
| StatFeat-Ensemble v1 (2023) [63] | |
| StatFeat-Ensemble v2 (2024) [62] | |
| GAT+PLV (2025) [24] | |
| TEKTE-Net (Ours) |
Disclaimer/Publisher’s Note: The statements, opinions and data contained in all publications are solely those of the individual author(s) and contributor(s) and not of MDPI and/or the editor(s). MDPI and/or the editor(s) disclaim responsibility for any injury to people or property resulting from any ideas, methods, instructions or products referred to in the content. |
© 2025 by the authors. Licensee MDPI, Basel, Switzerland. This article is an open access article distributed under the terms and conditions of the Creative Commons Attribution (CC BY) license (http://creativecommons.org/licenses/by/4.0/).
Copyright: This open access article is published under a Creative Commons CC BY 4.0 license, which permit the free download, distribution, and reuse, provided that the author and preprint are cited in any reuse.


