Submitted:
13 October 2025
Posted:
14 October 2025
You are already at the latest version
Abstract
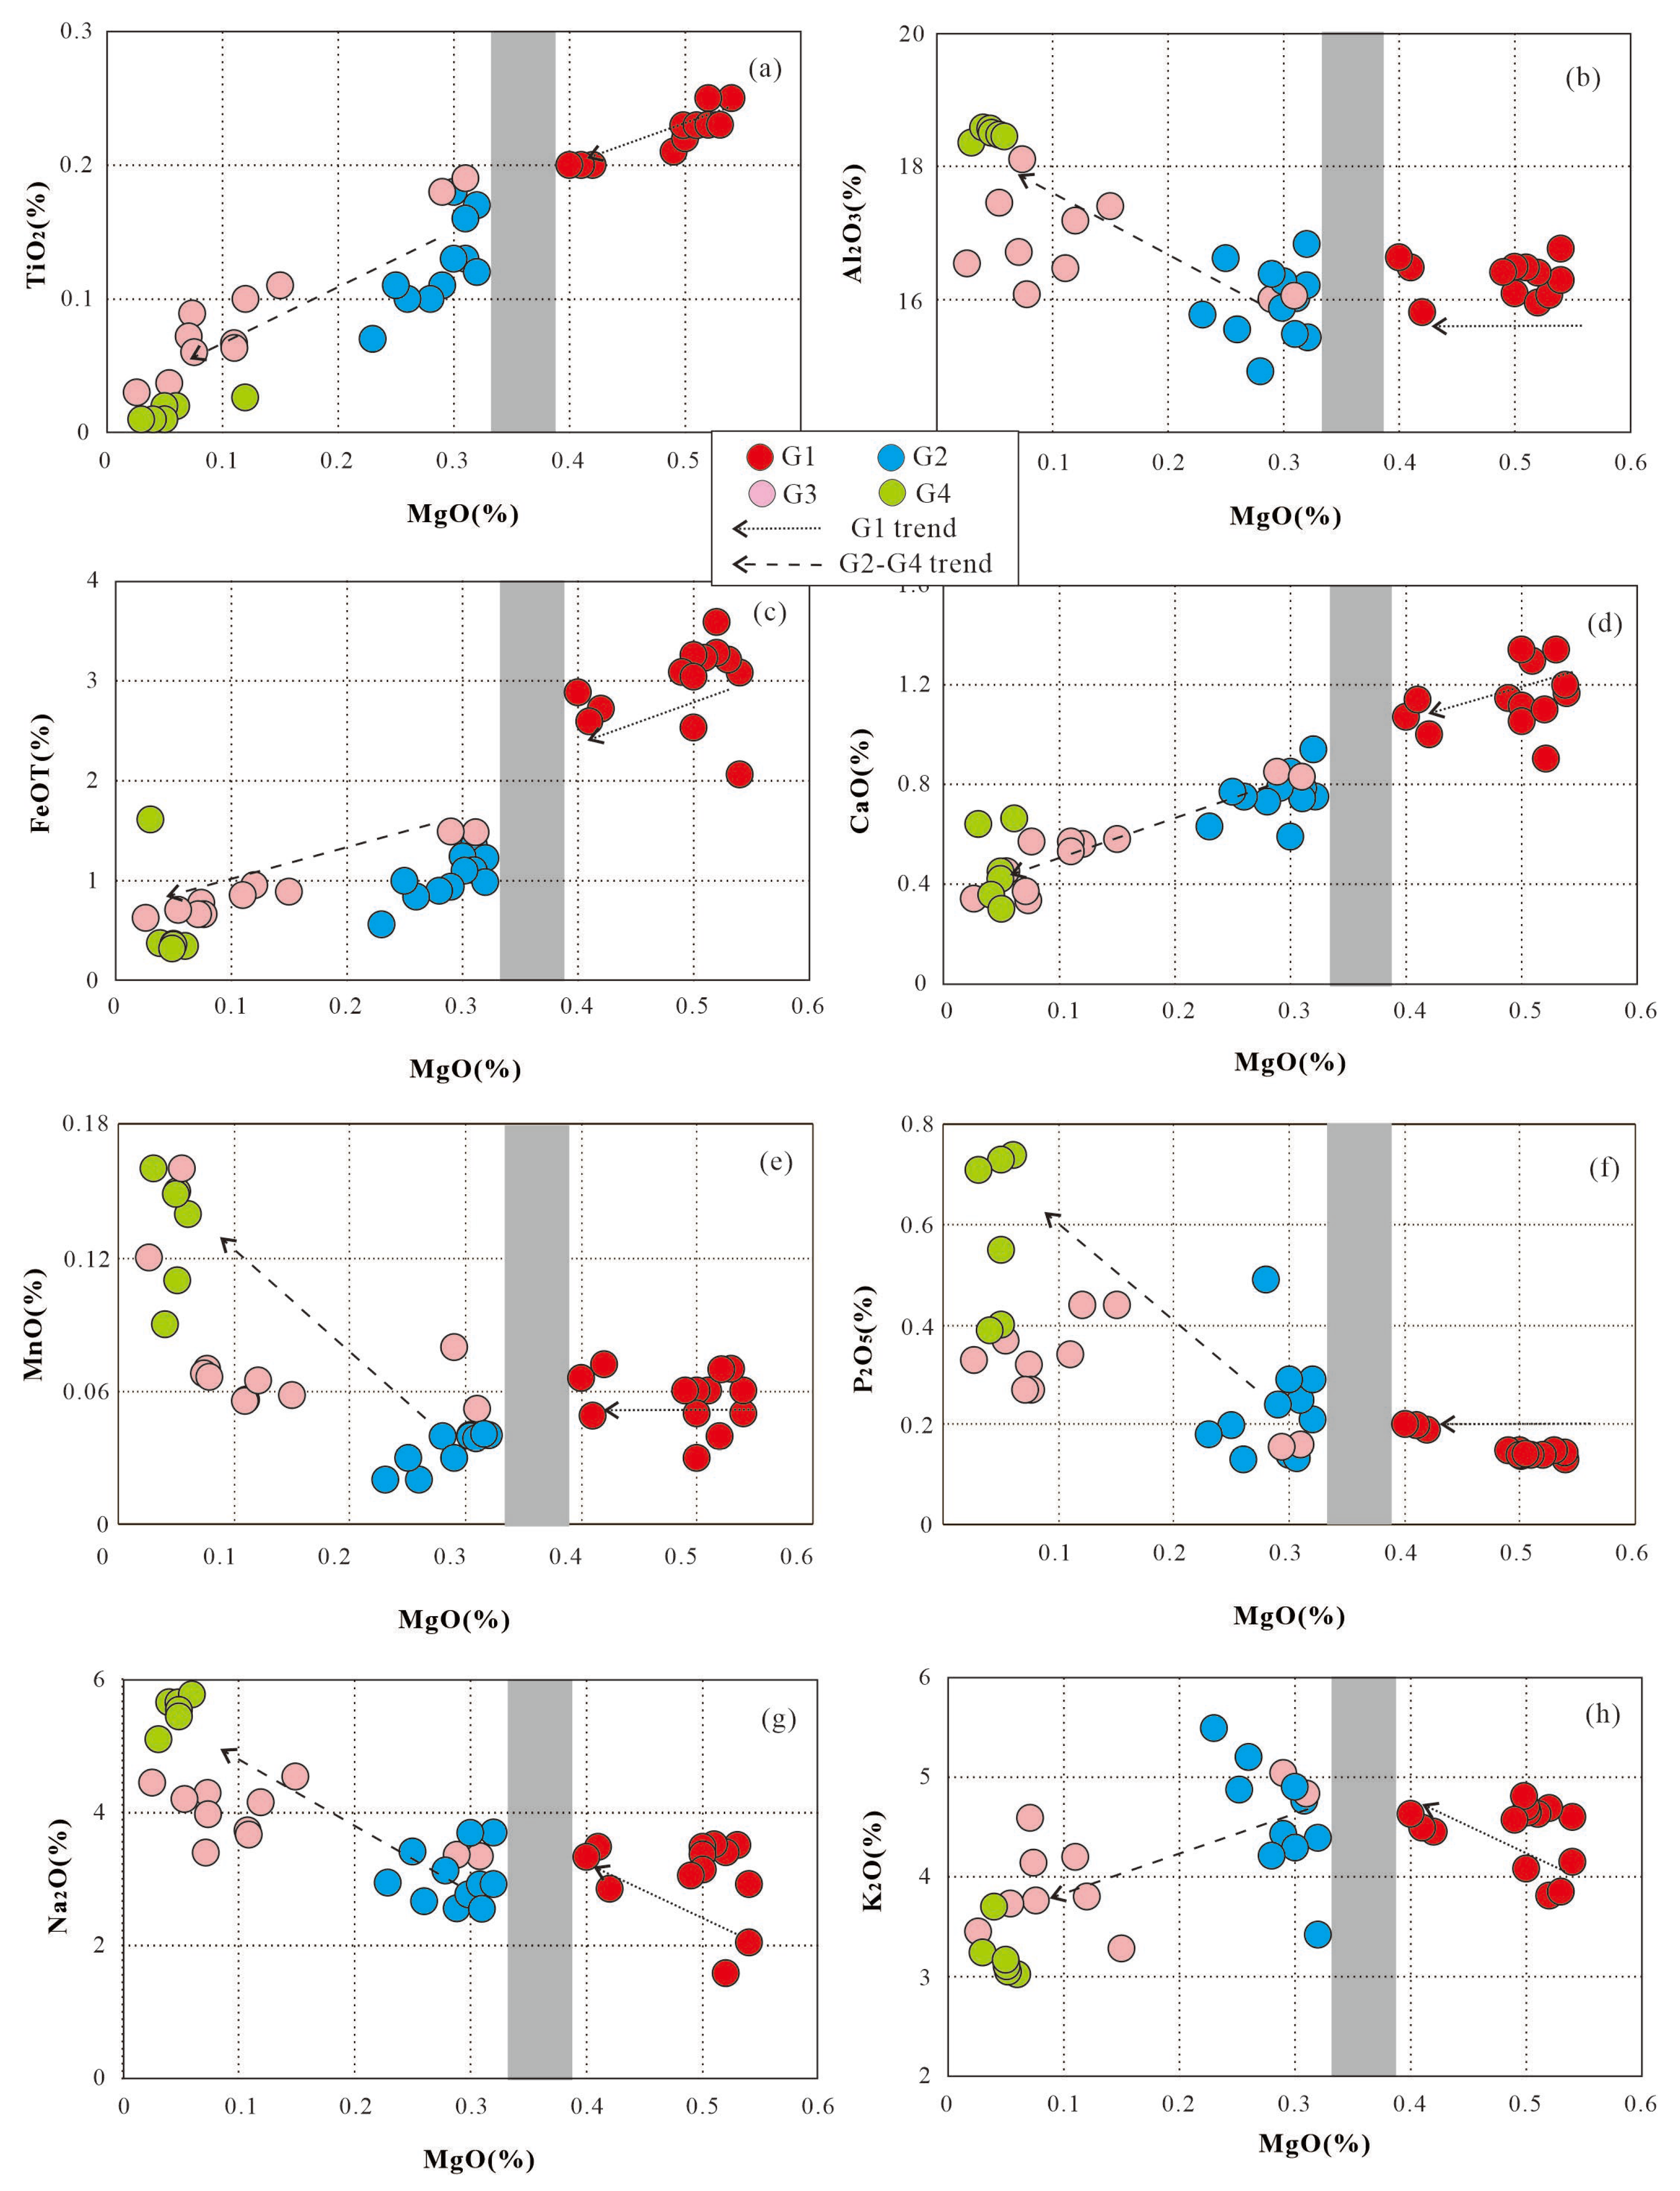
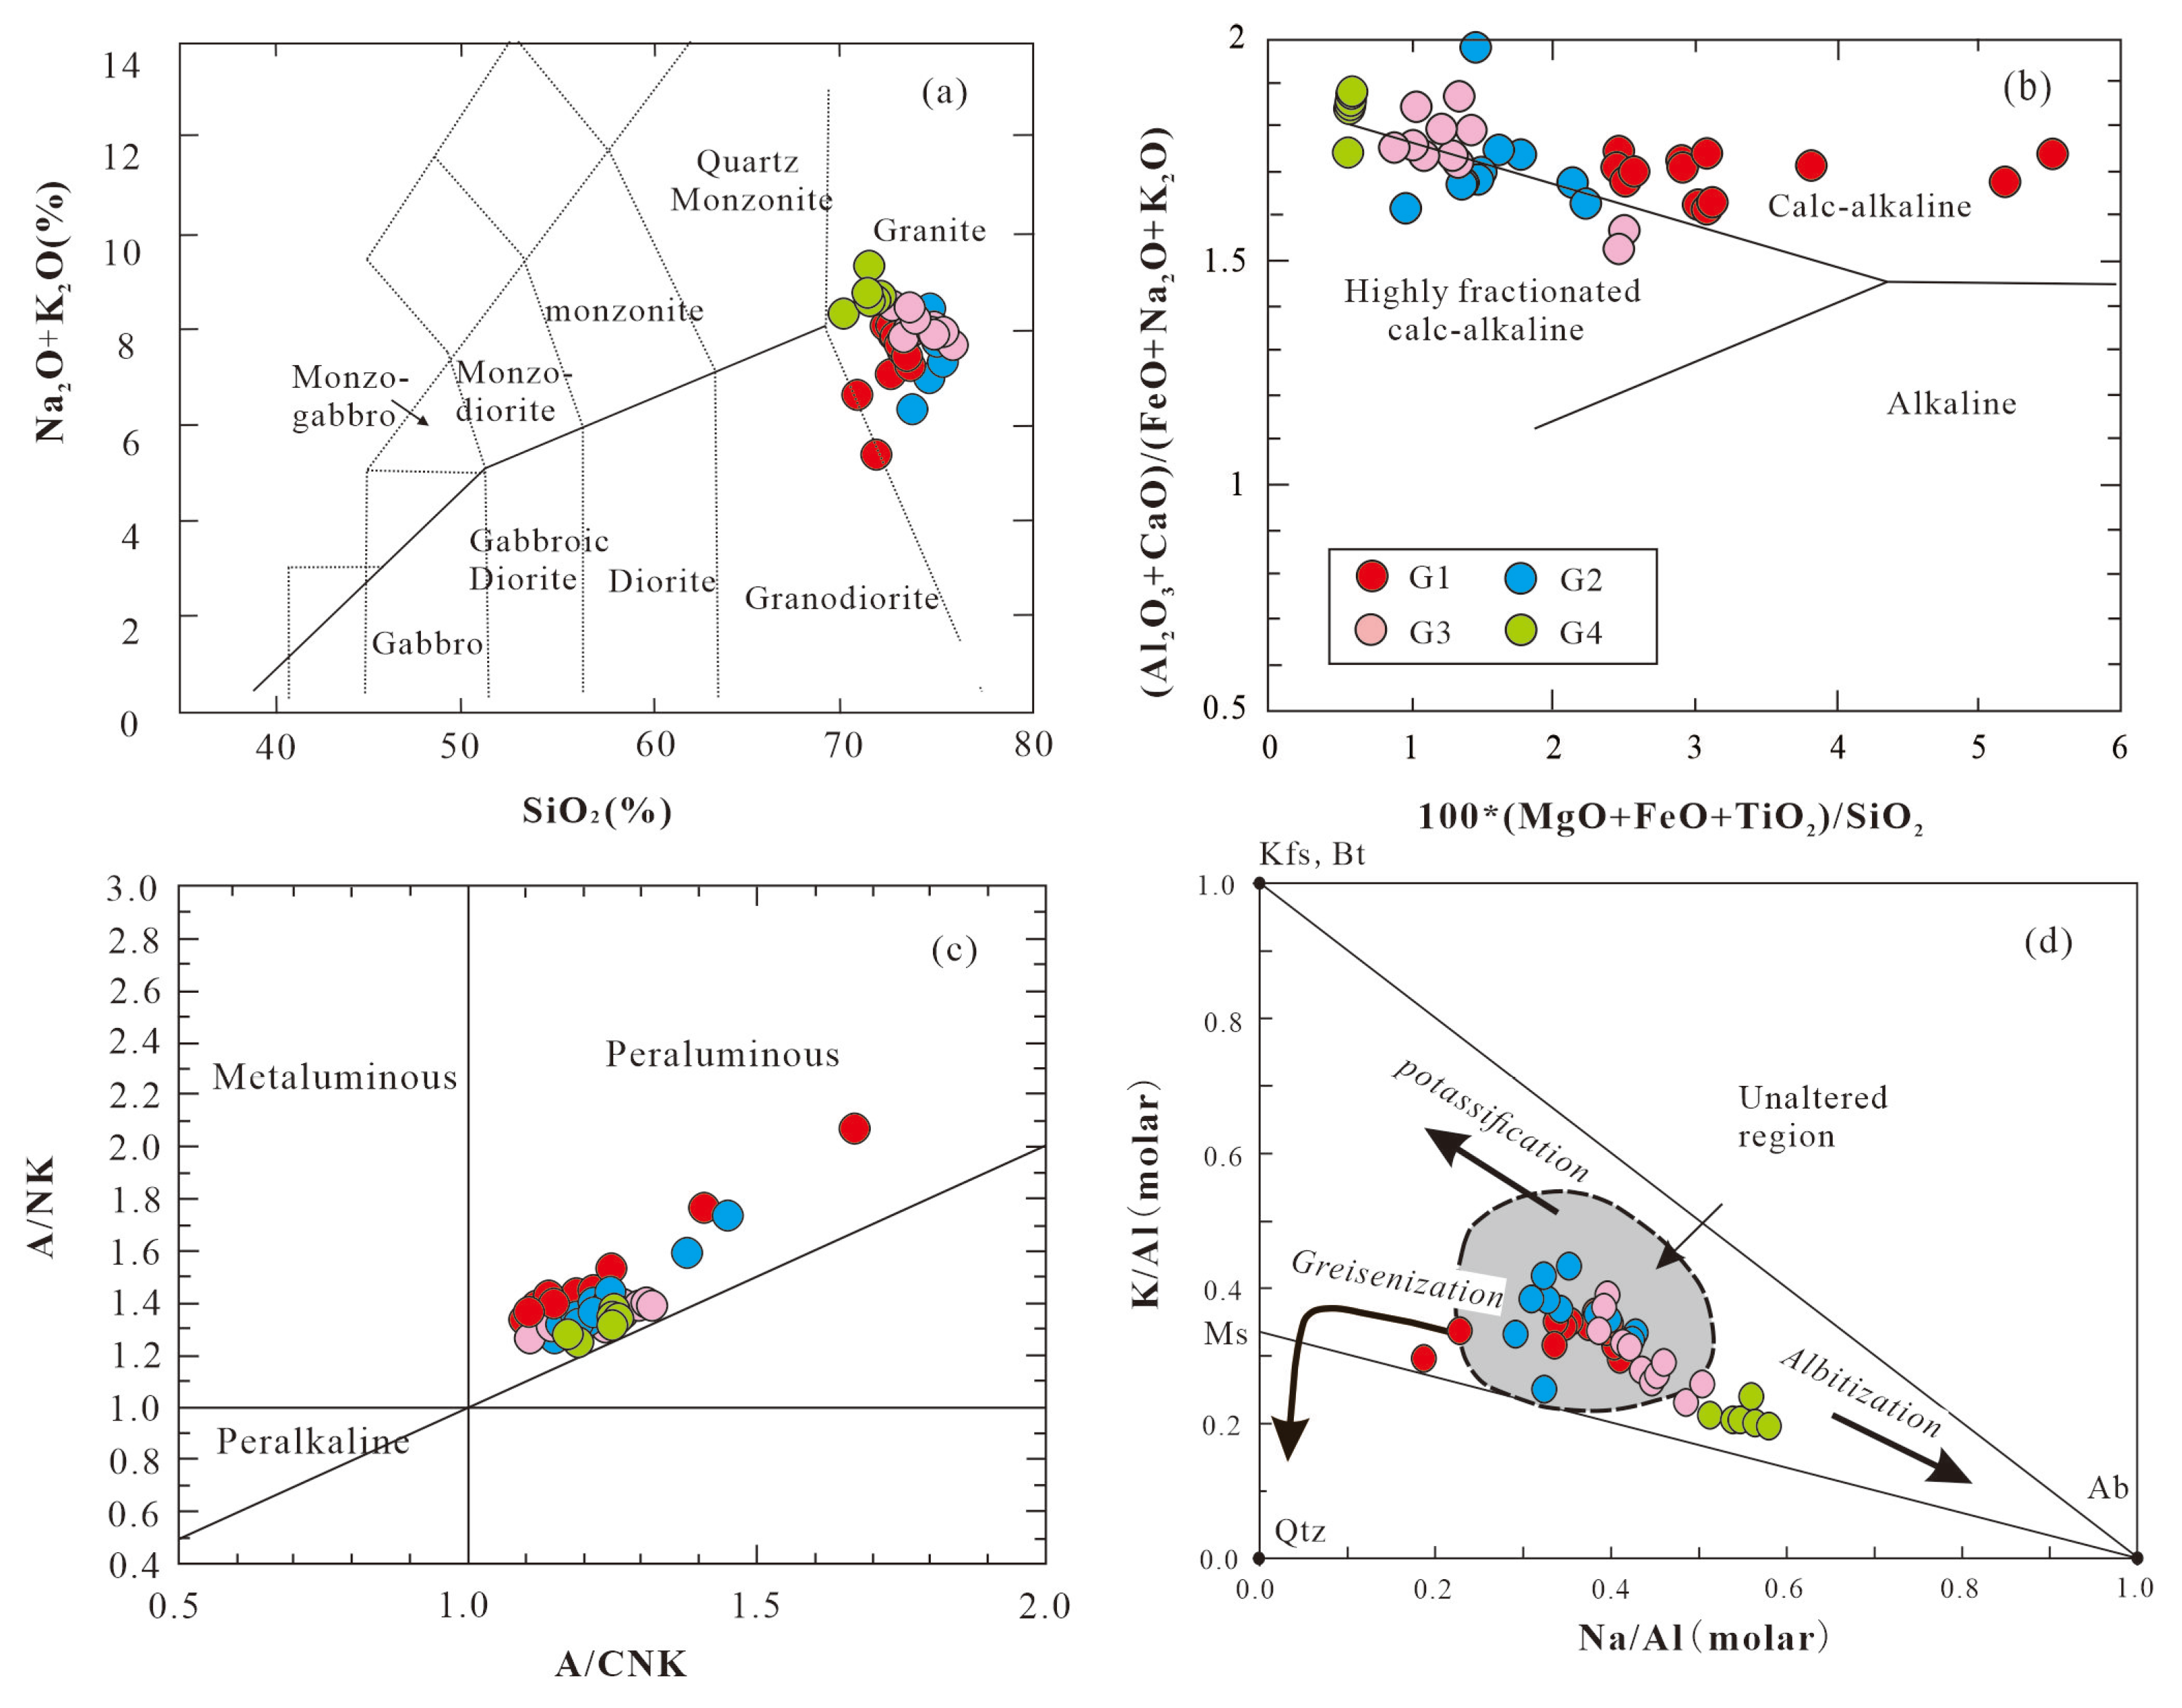
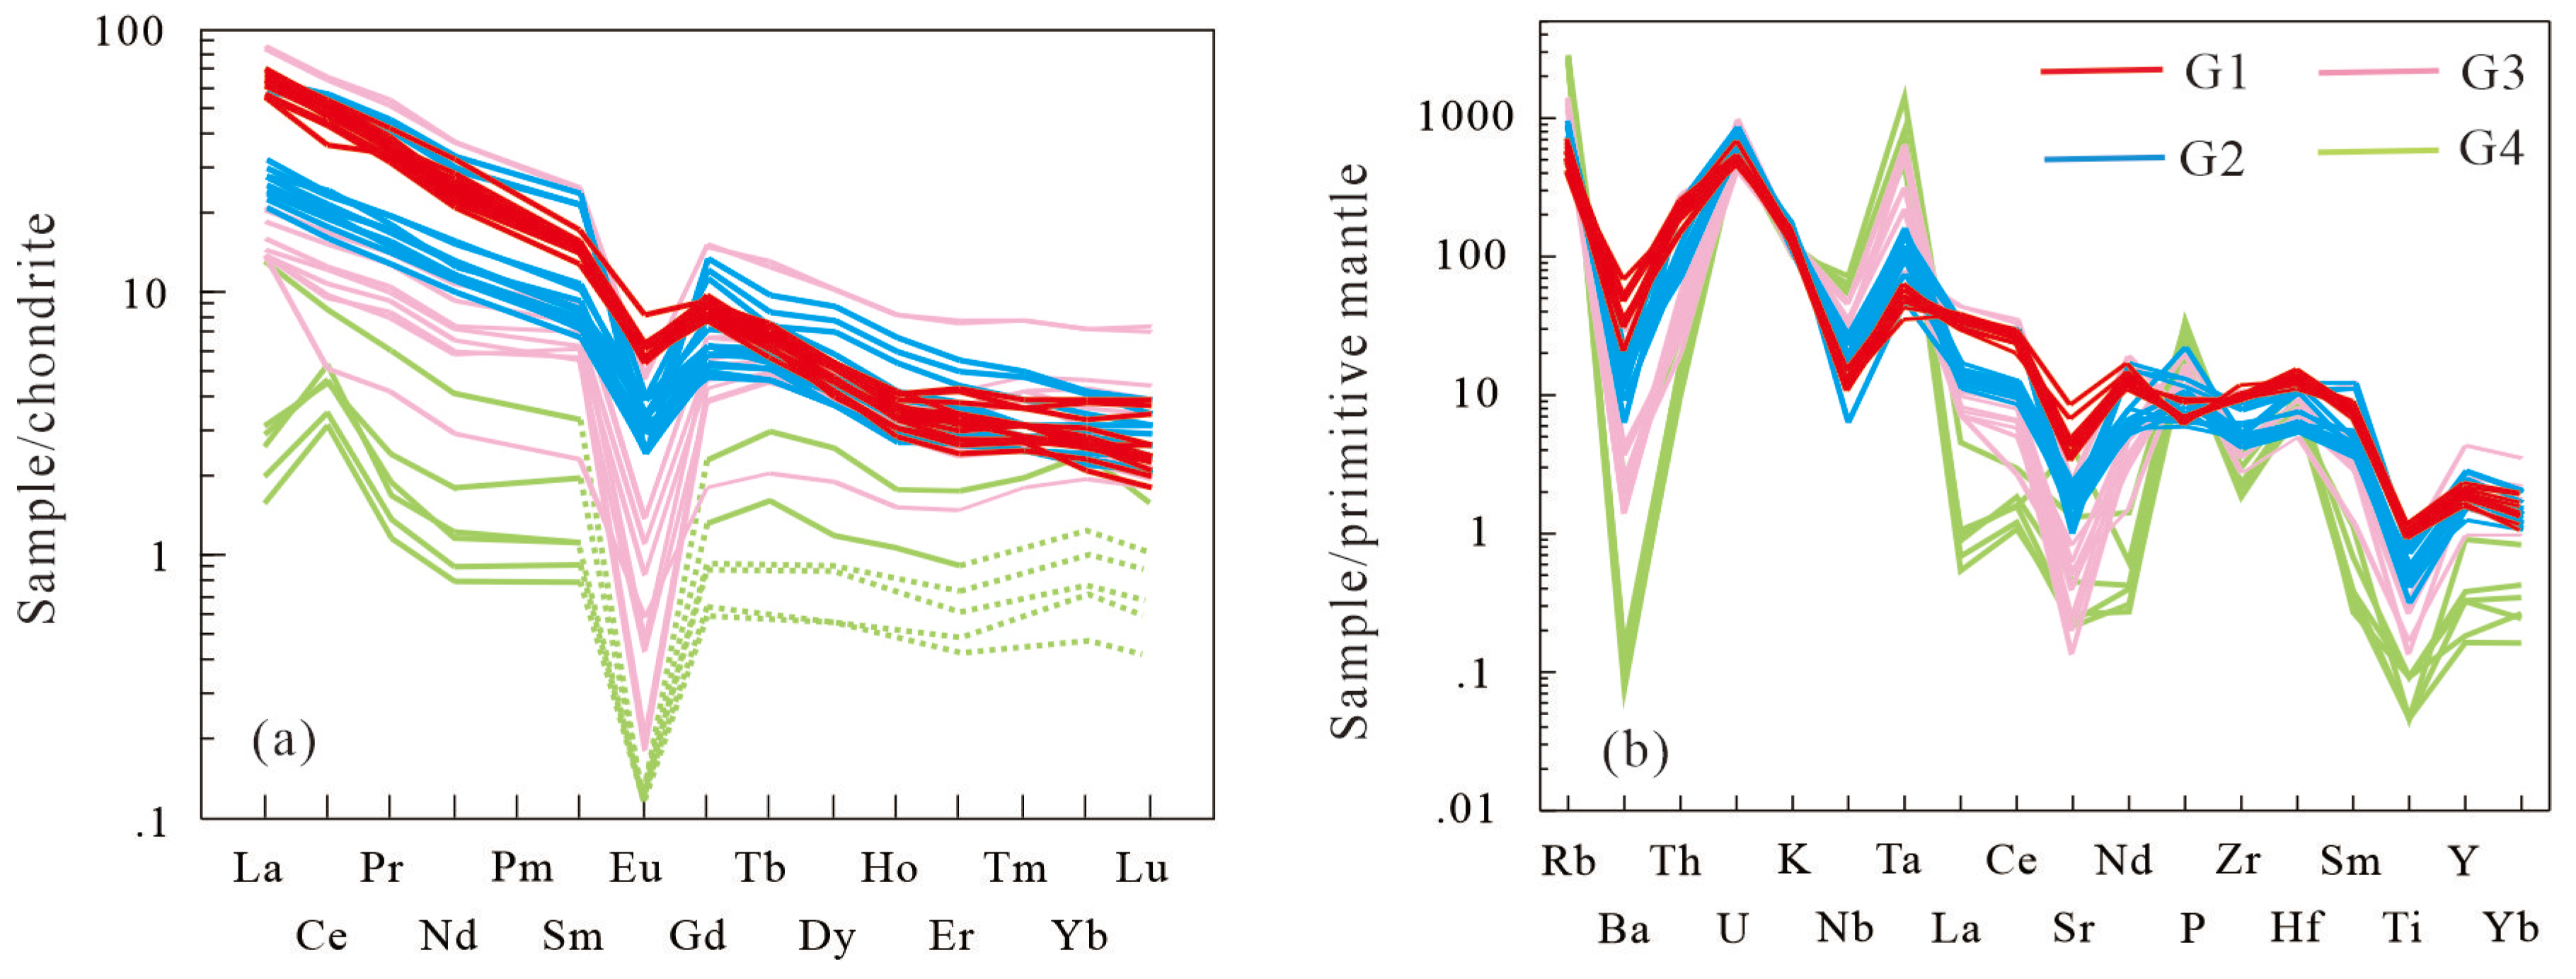
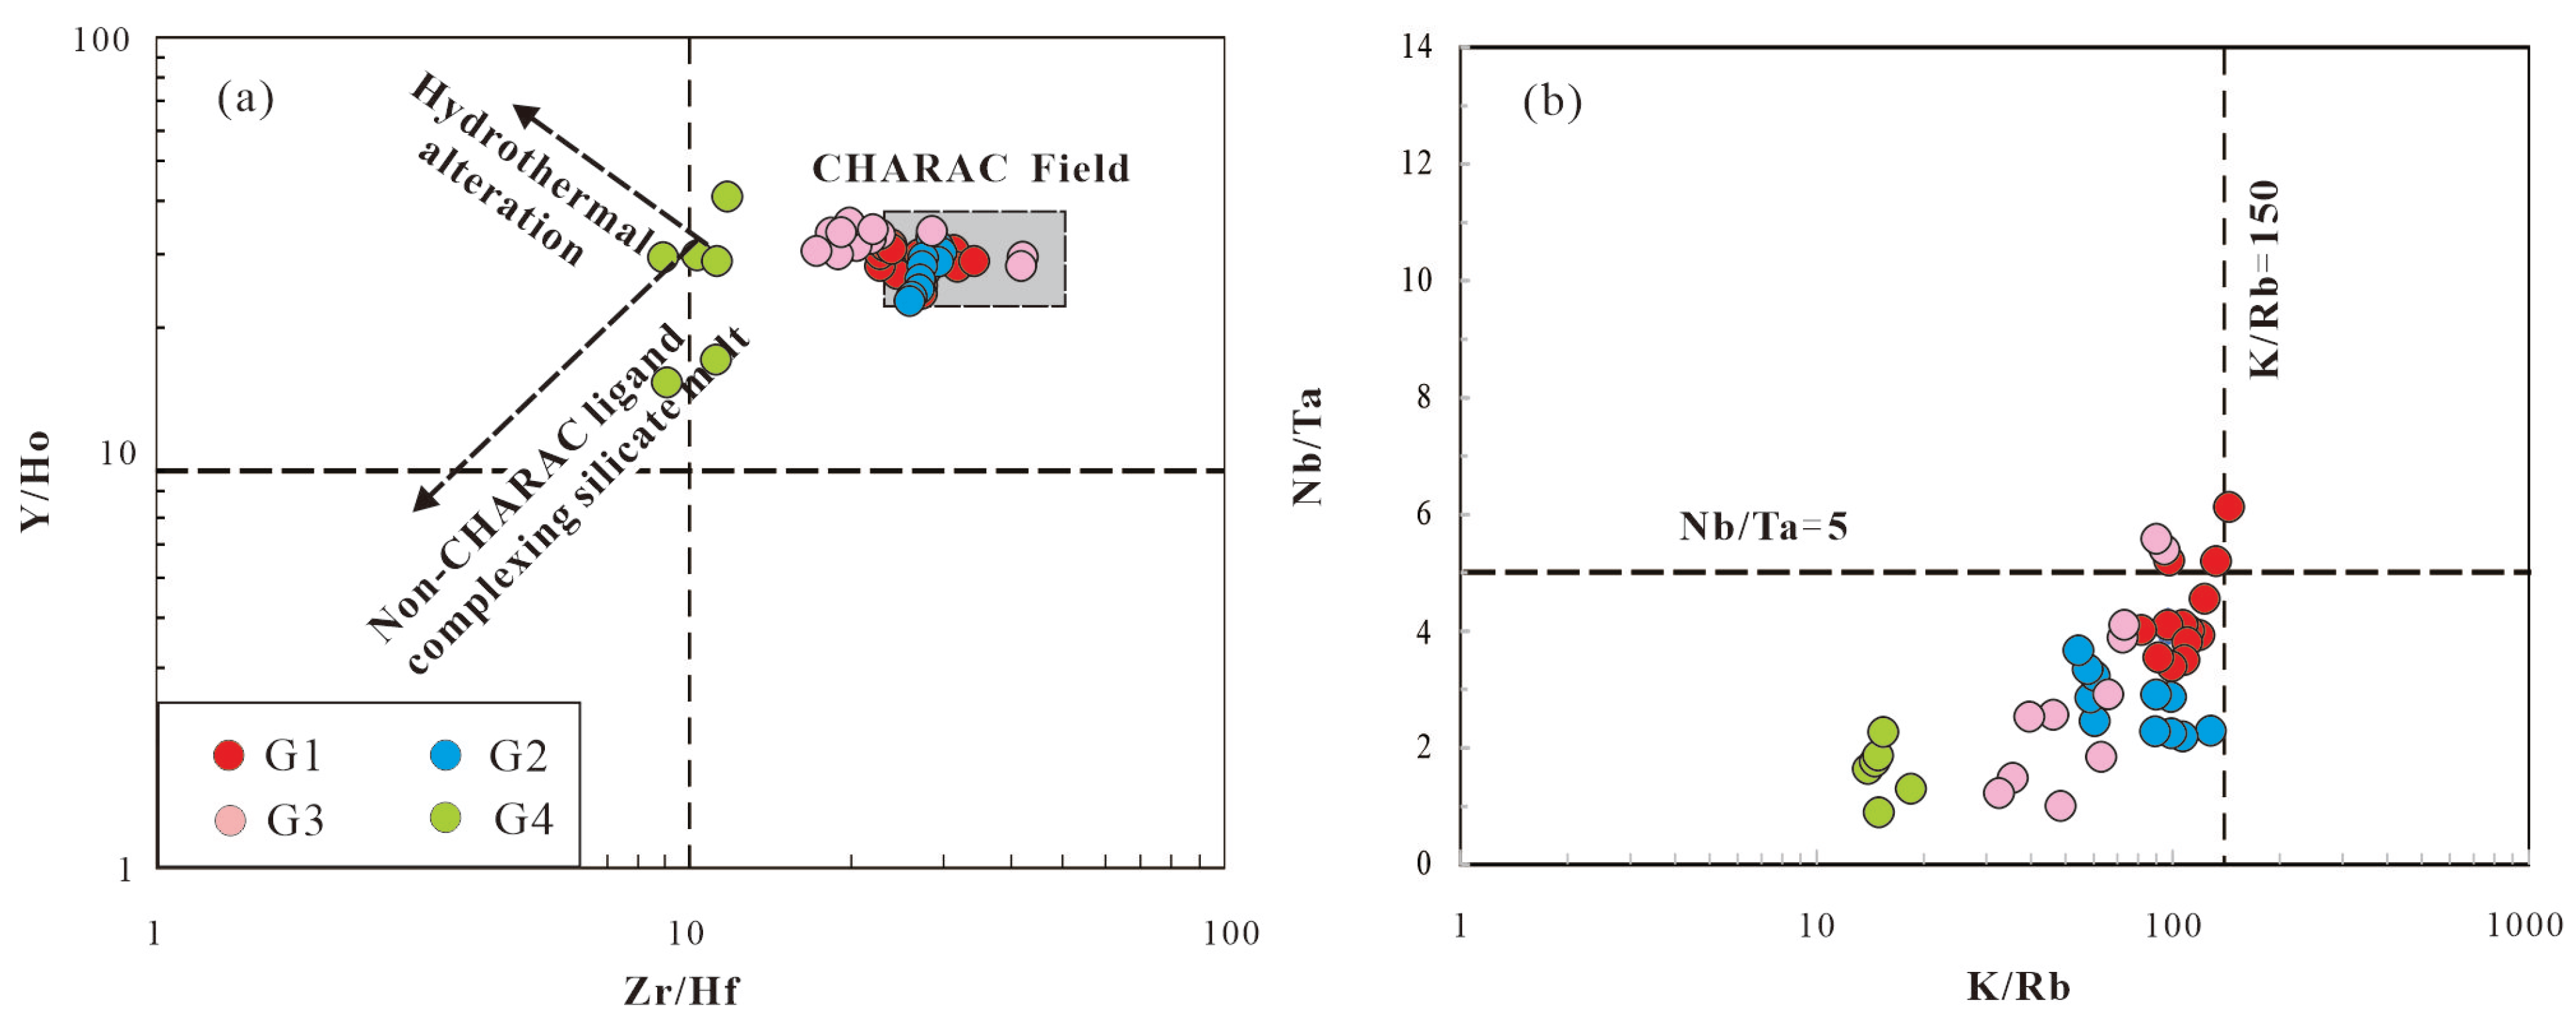
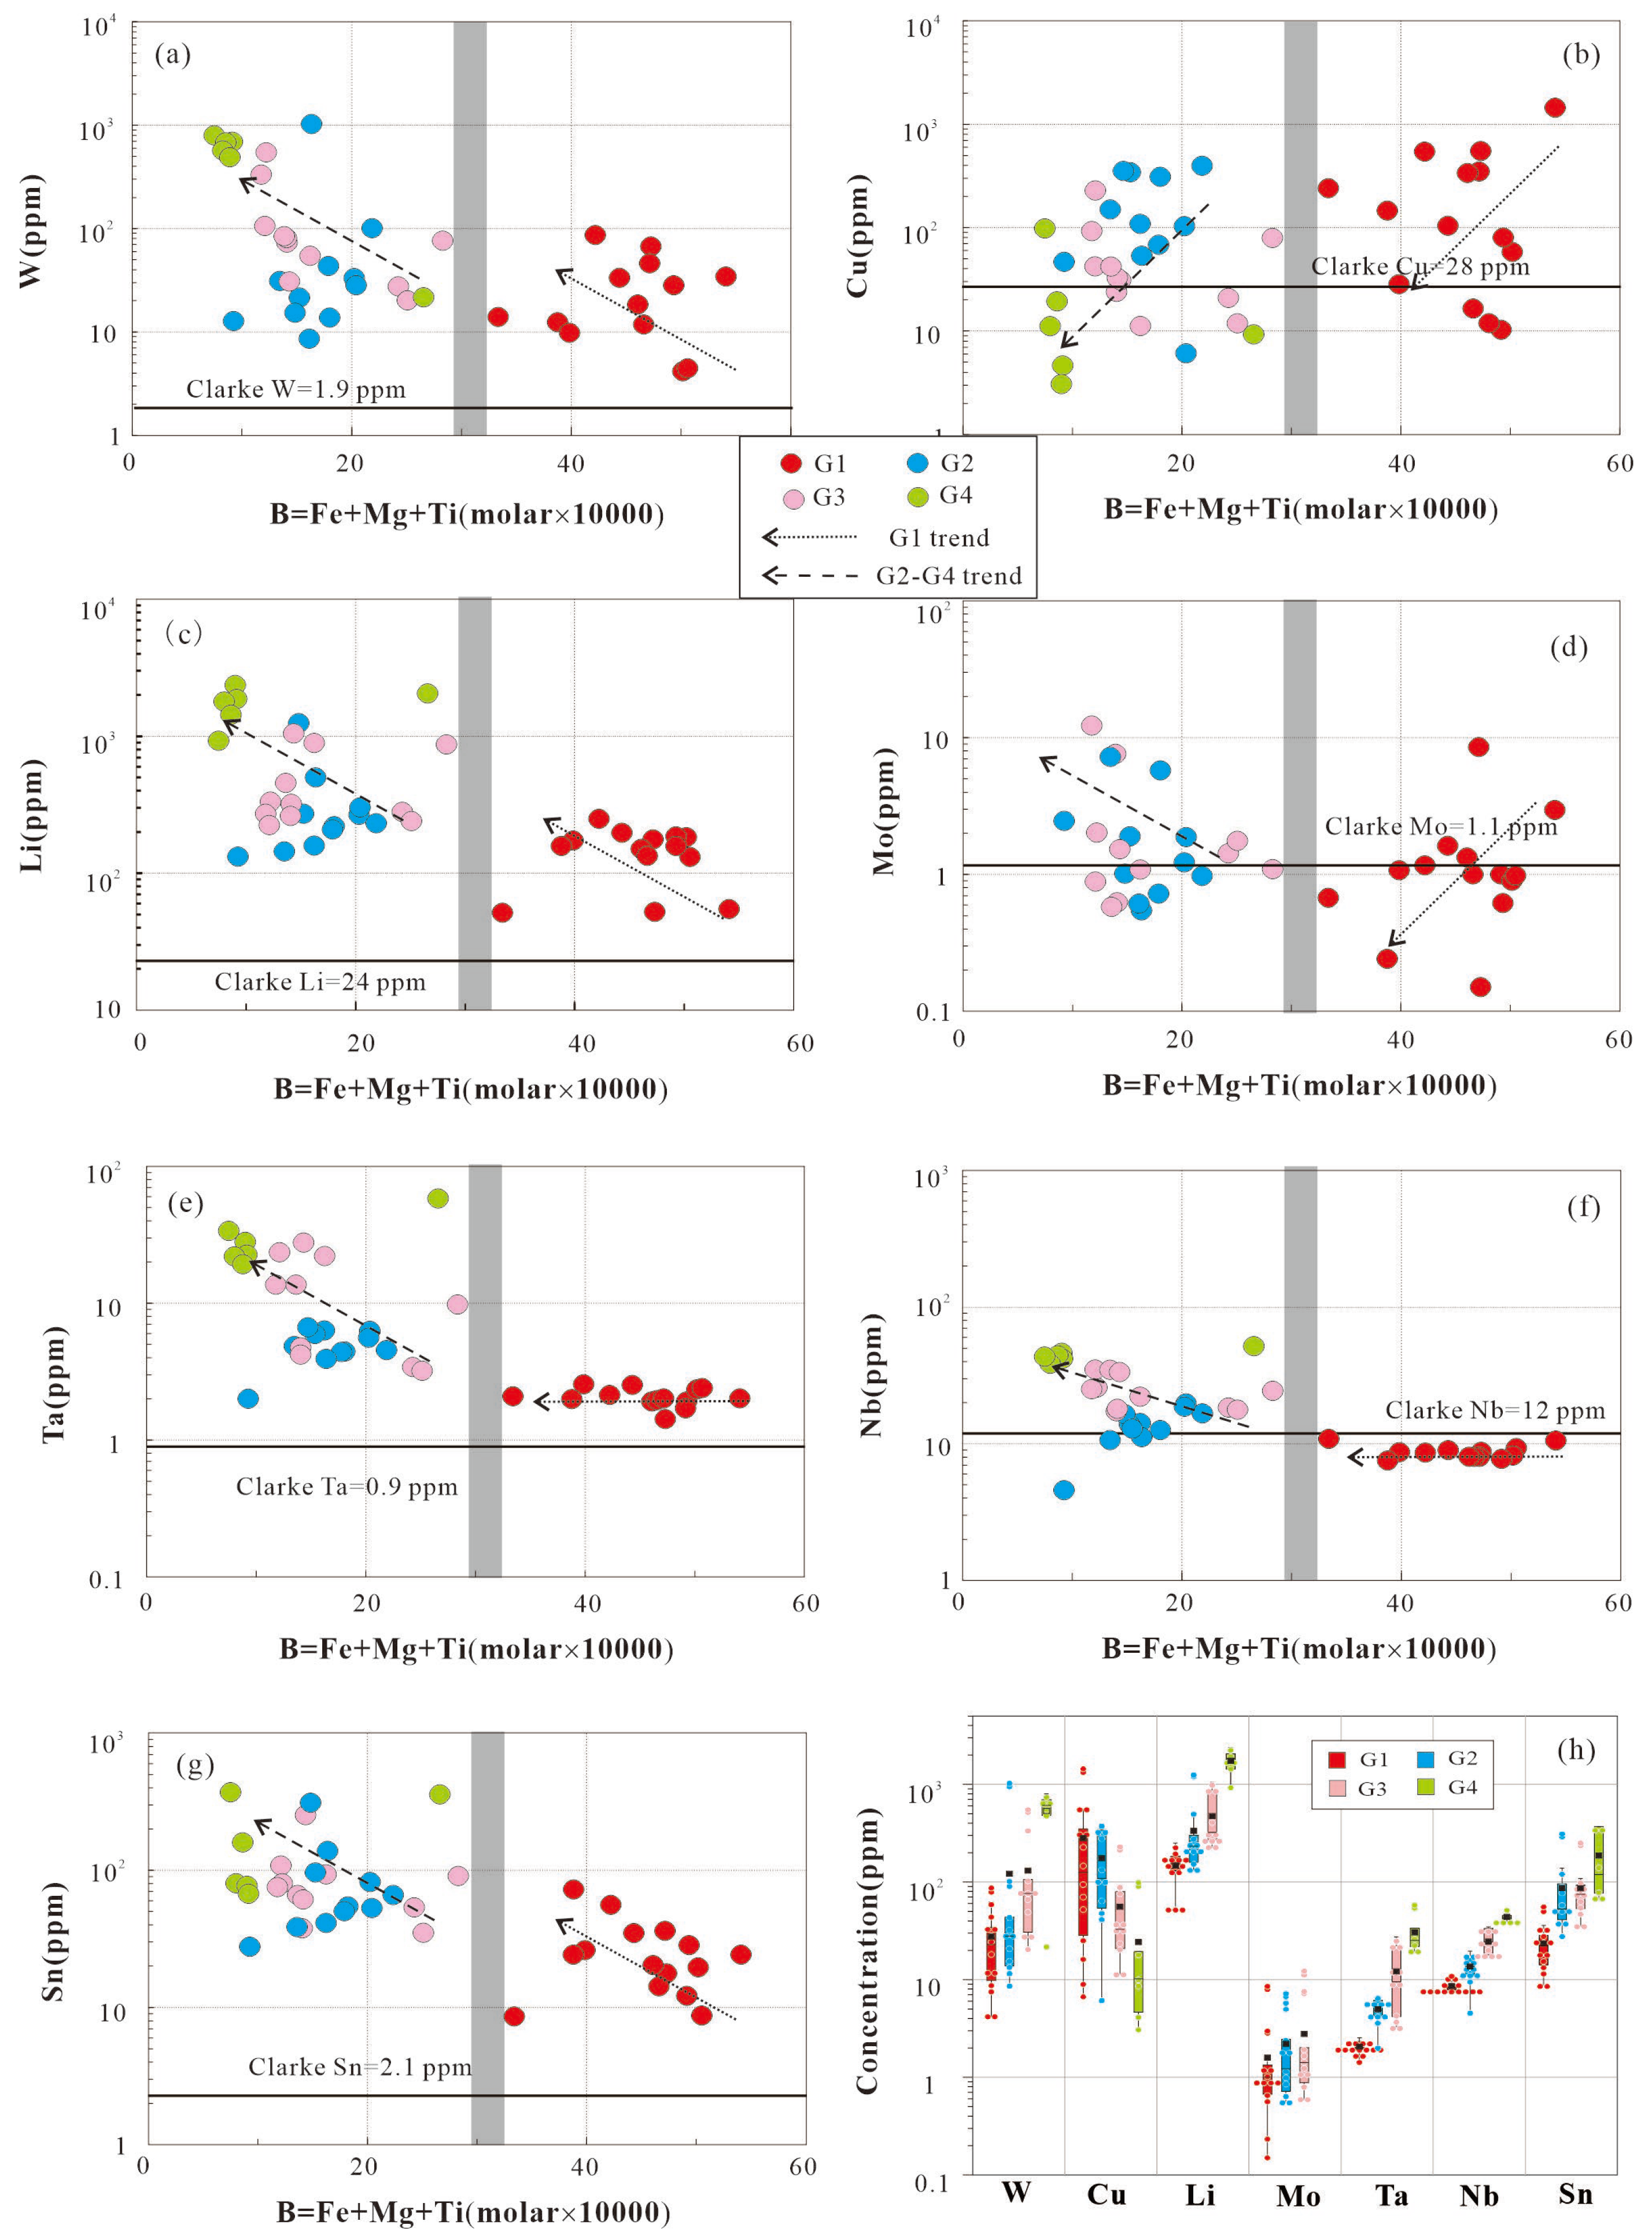
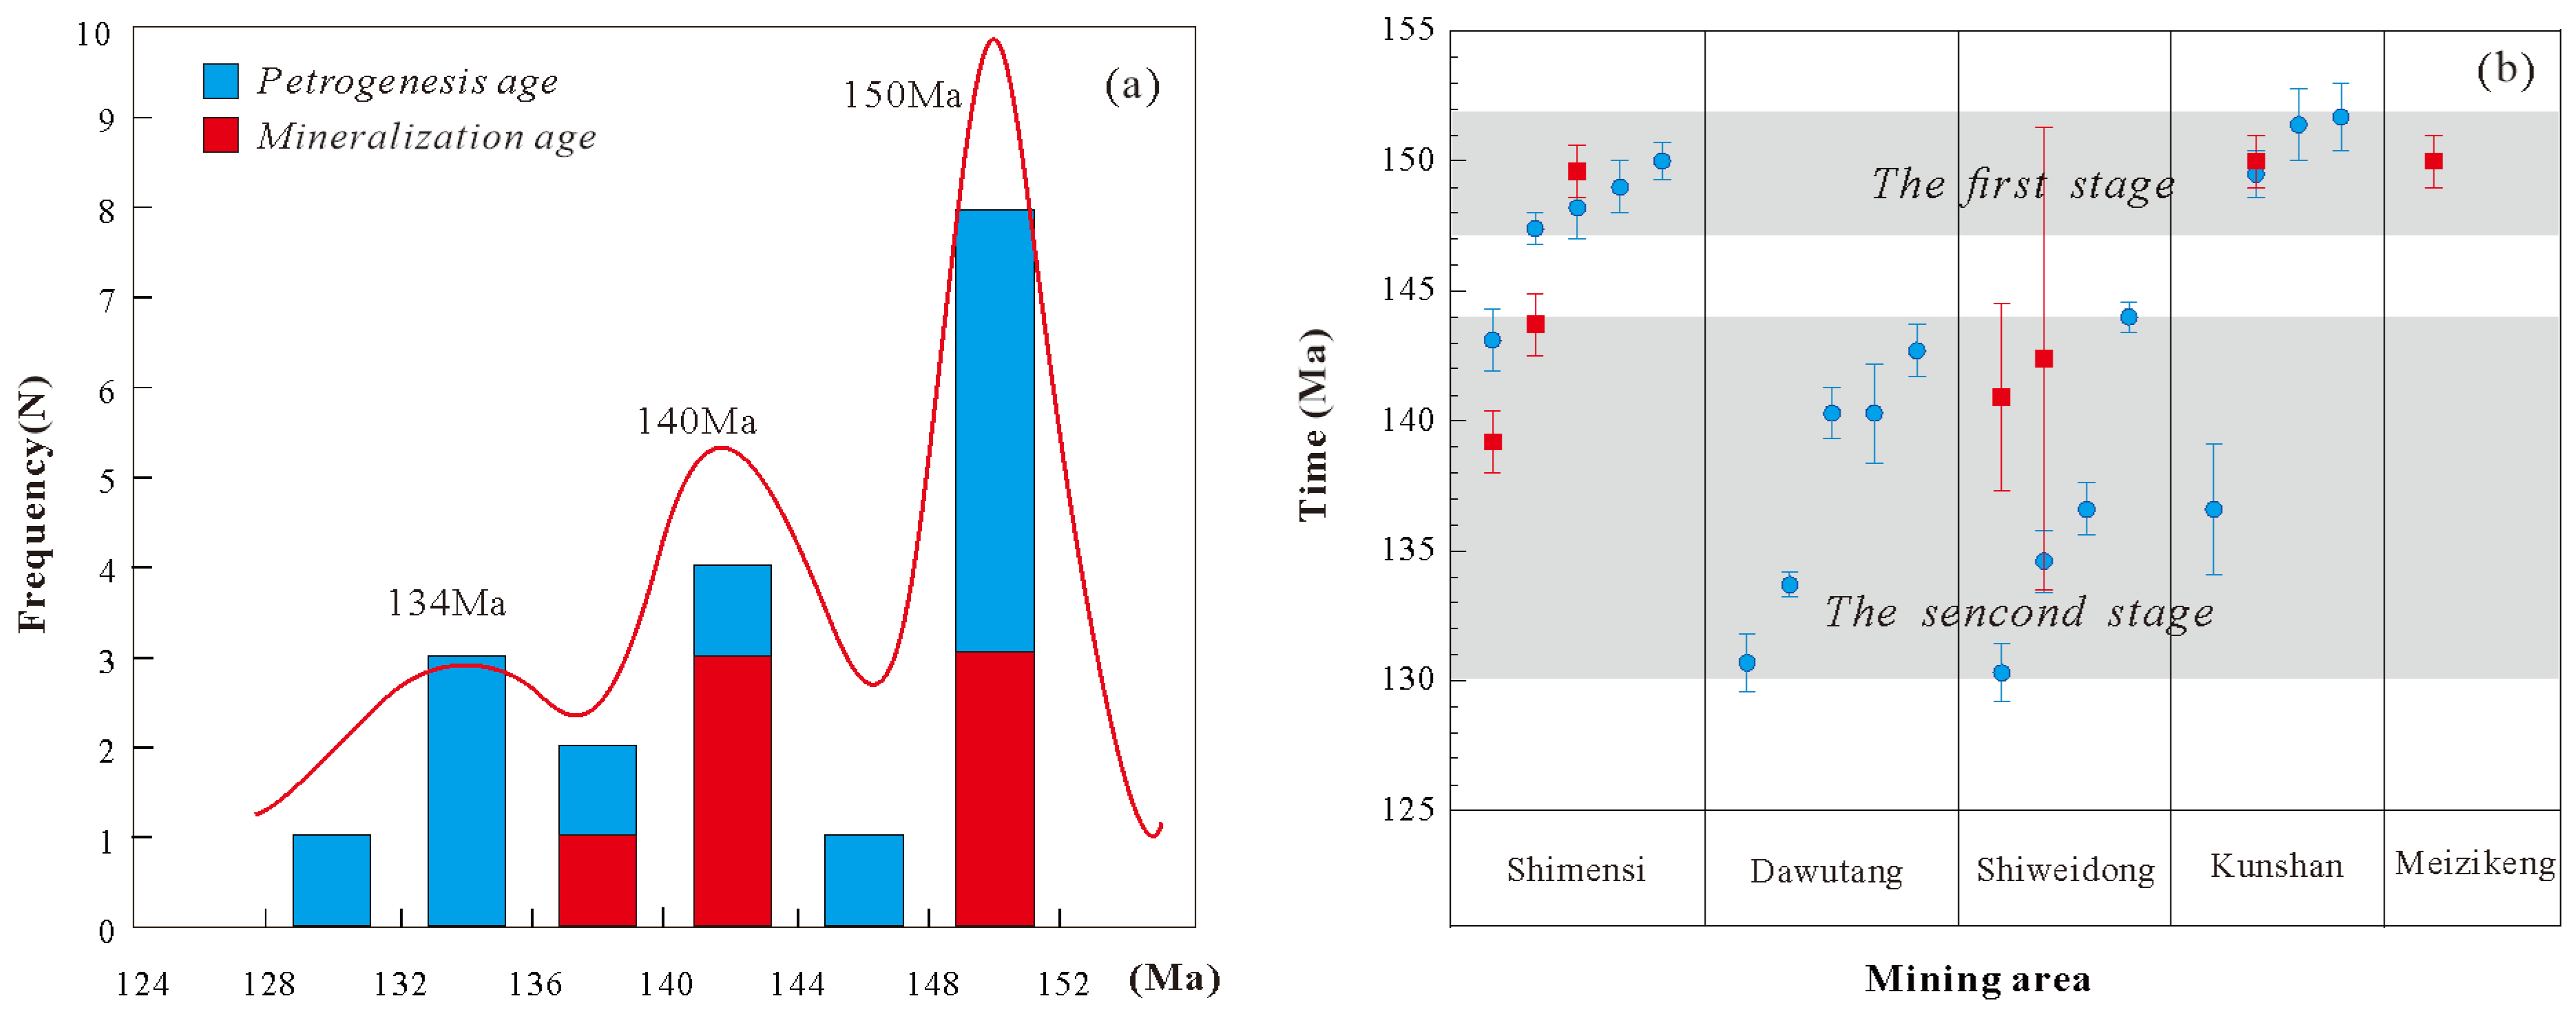
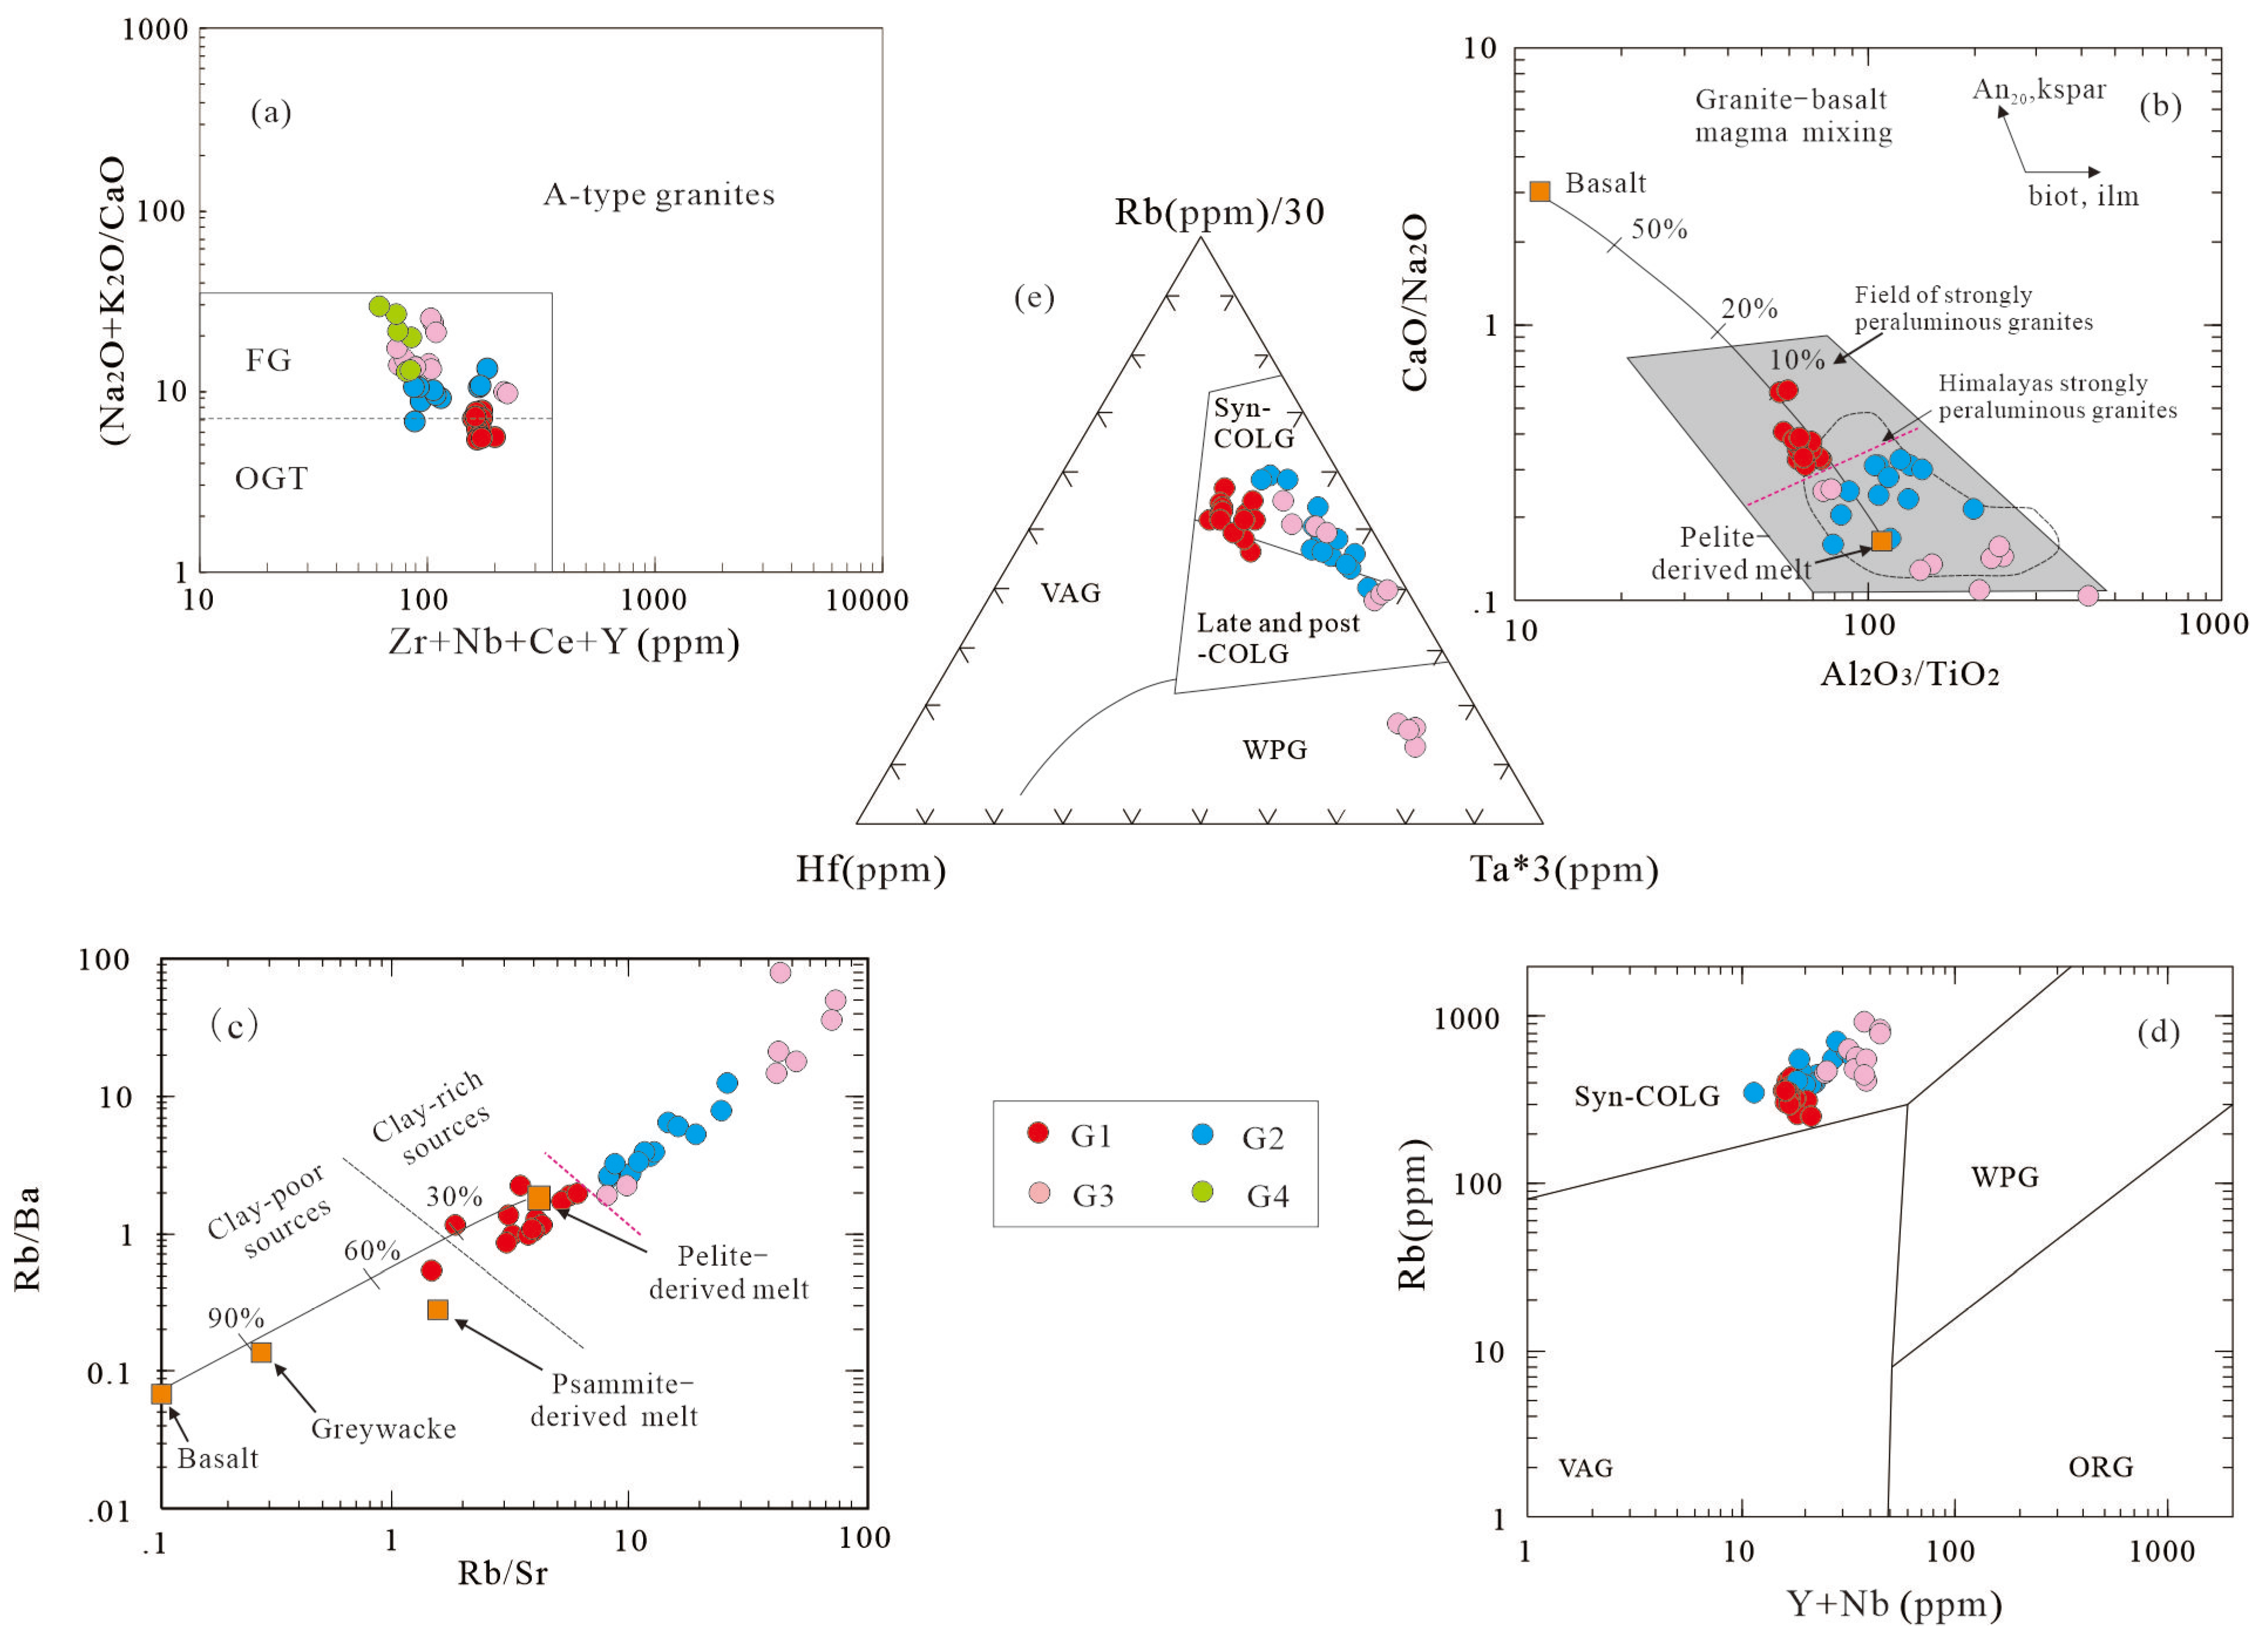
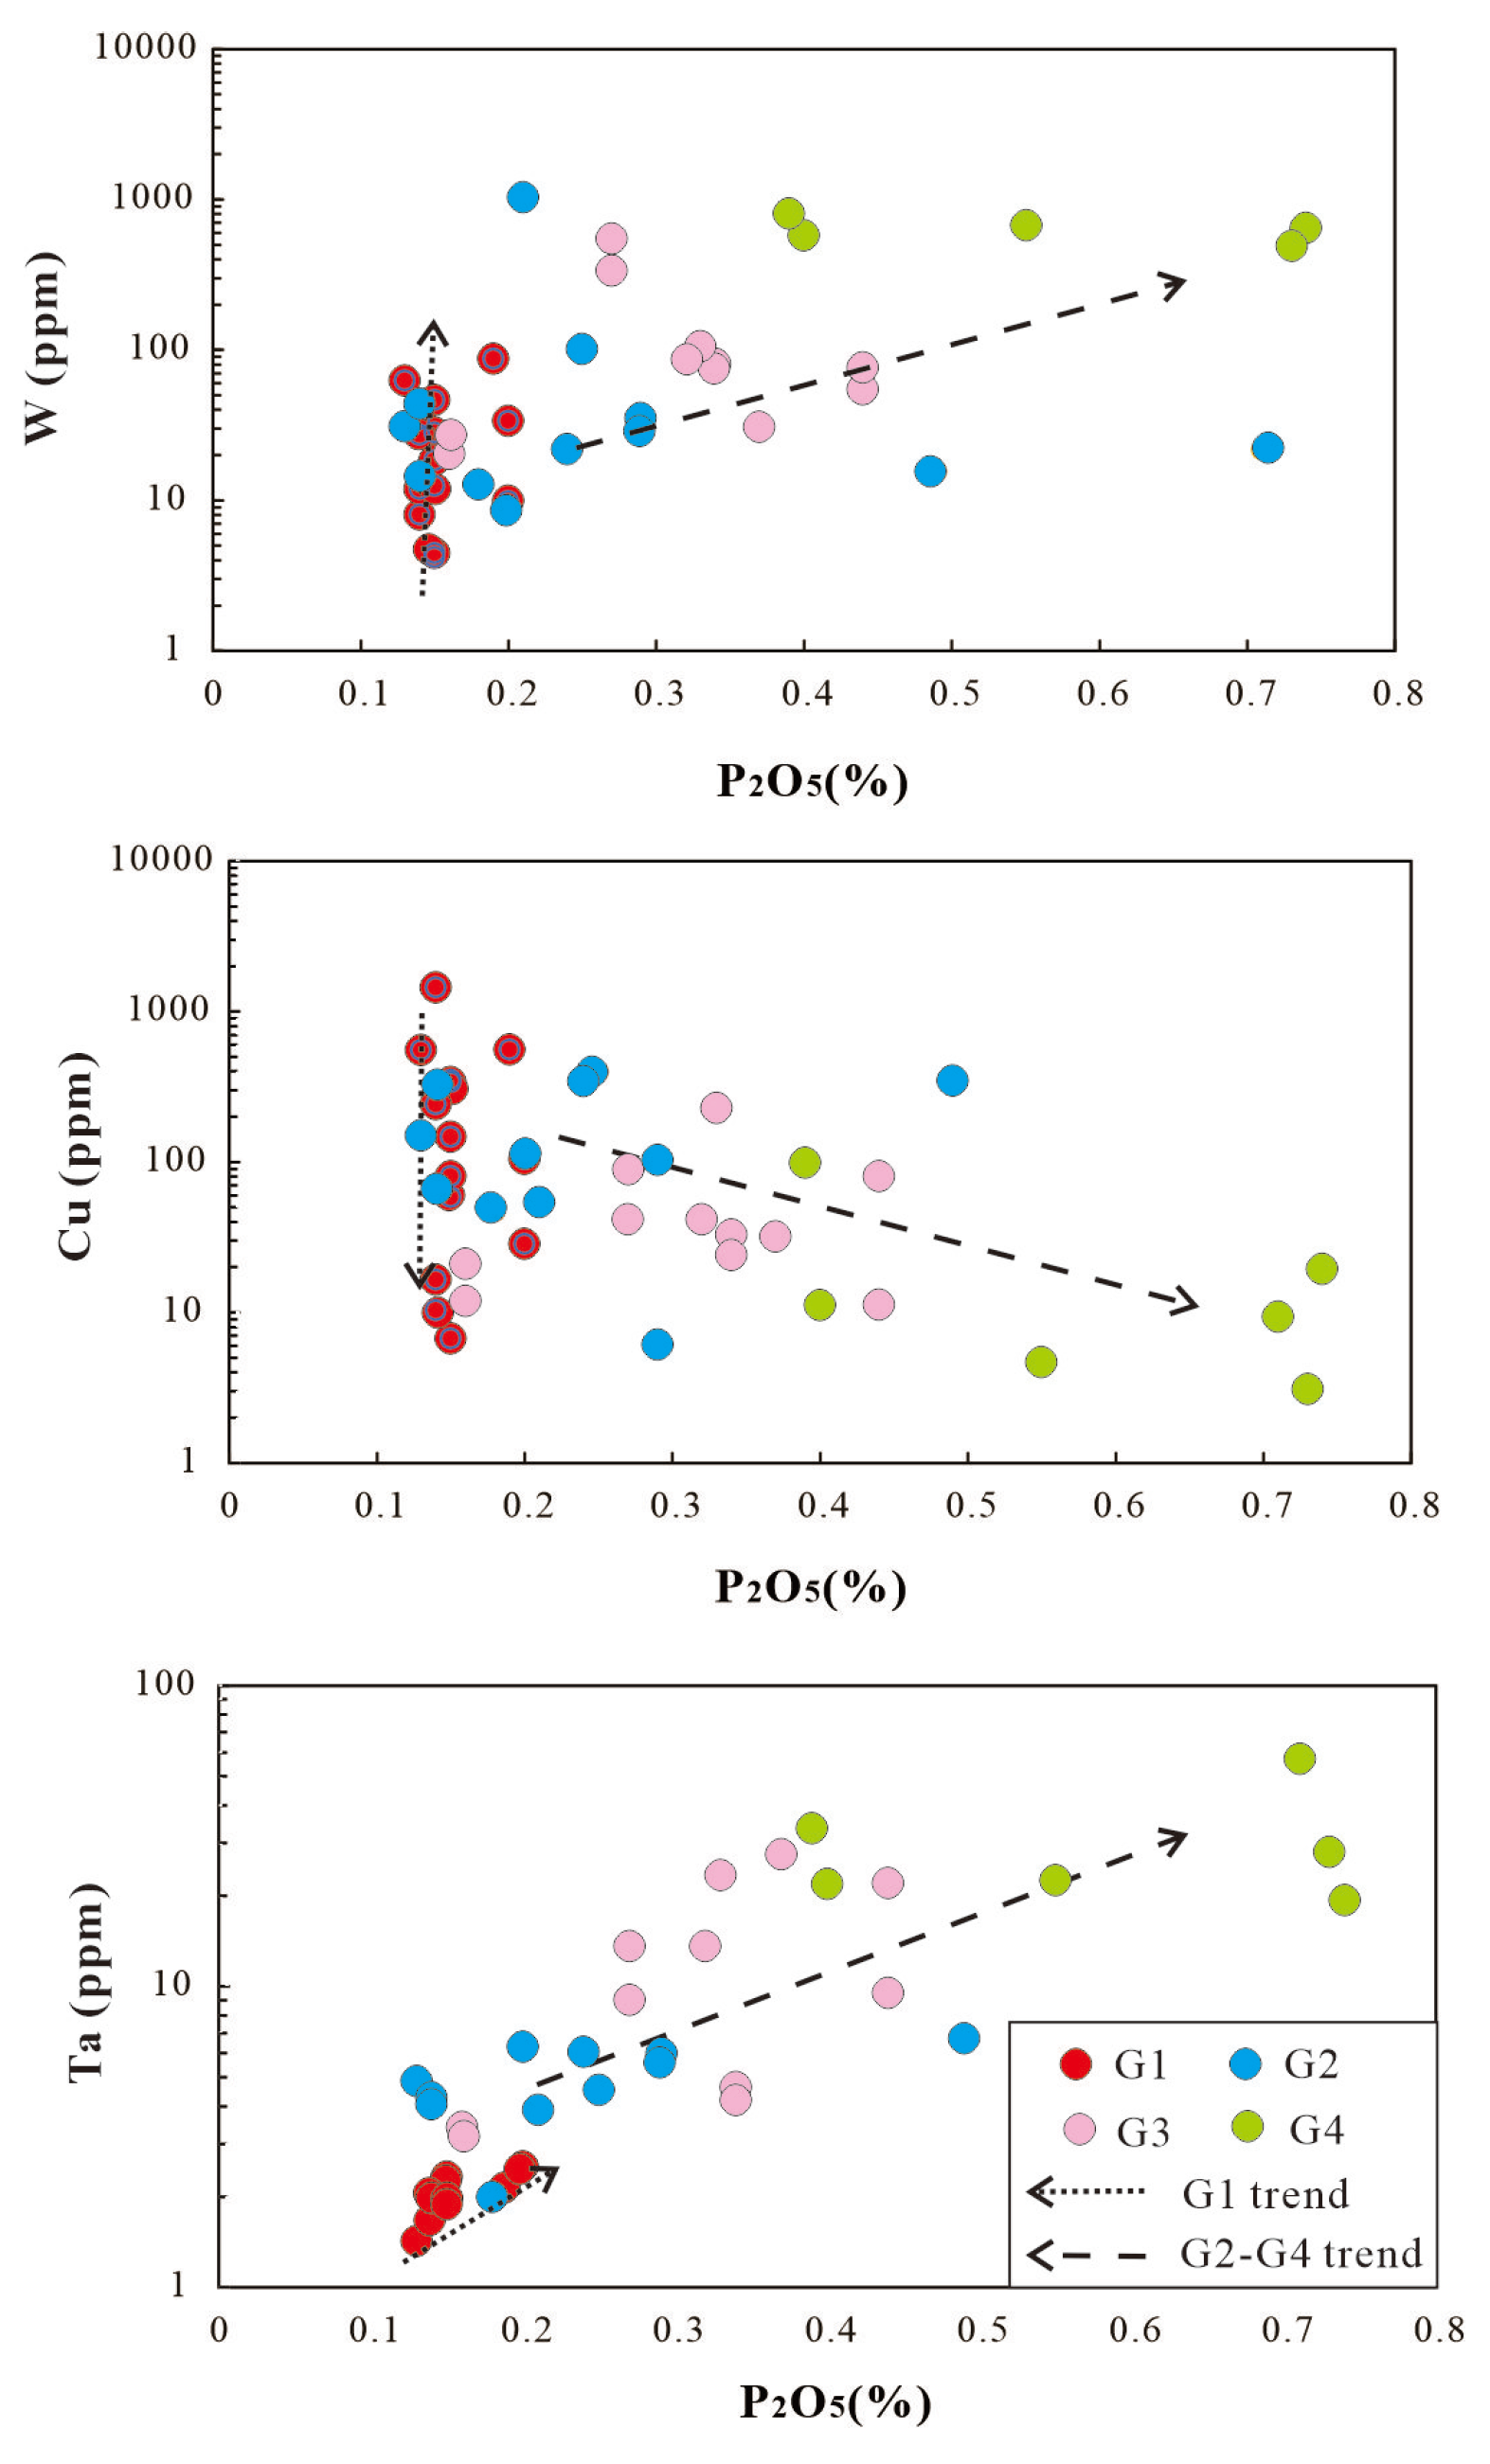
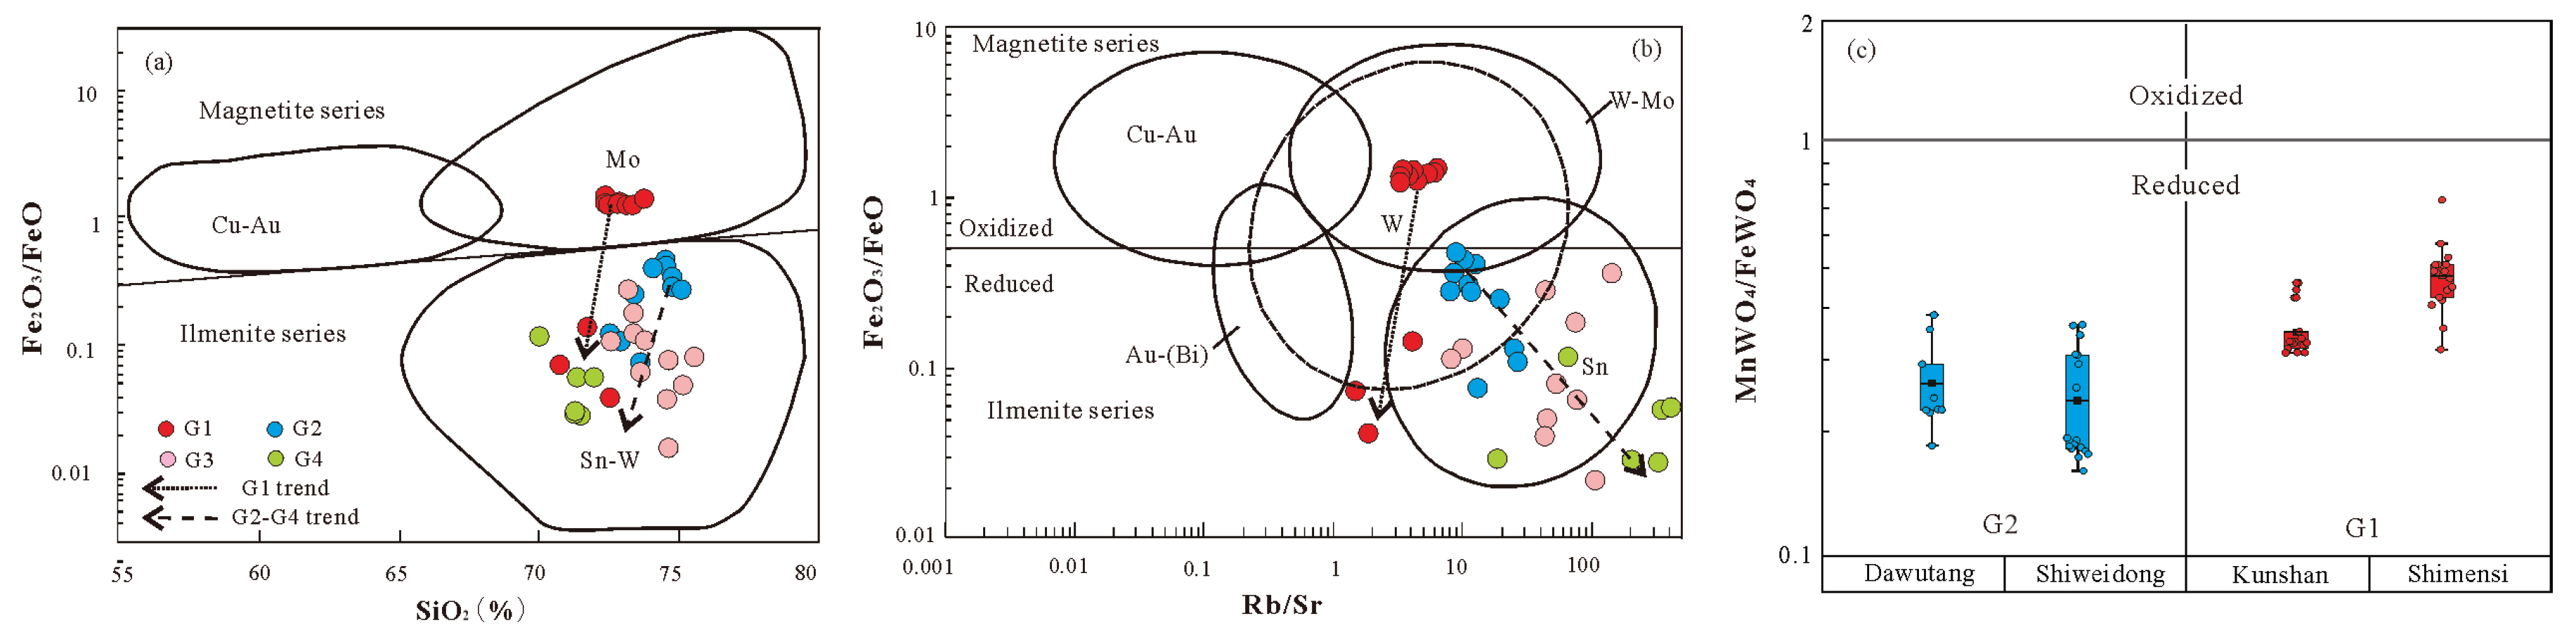
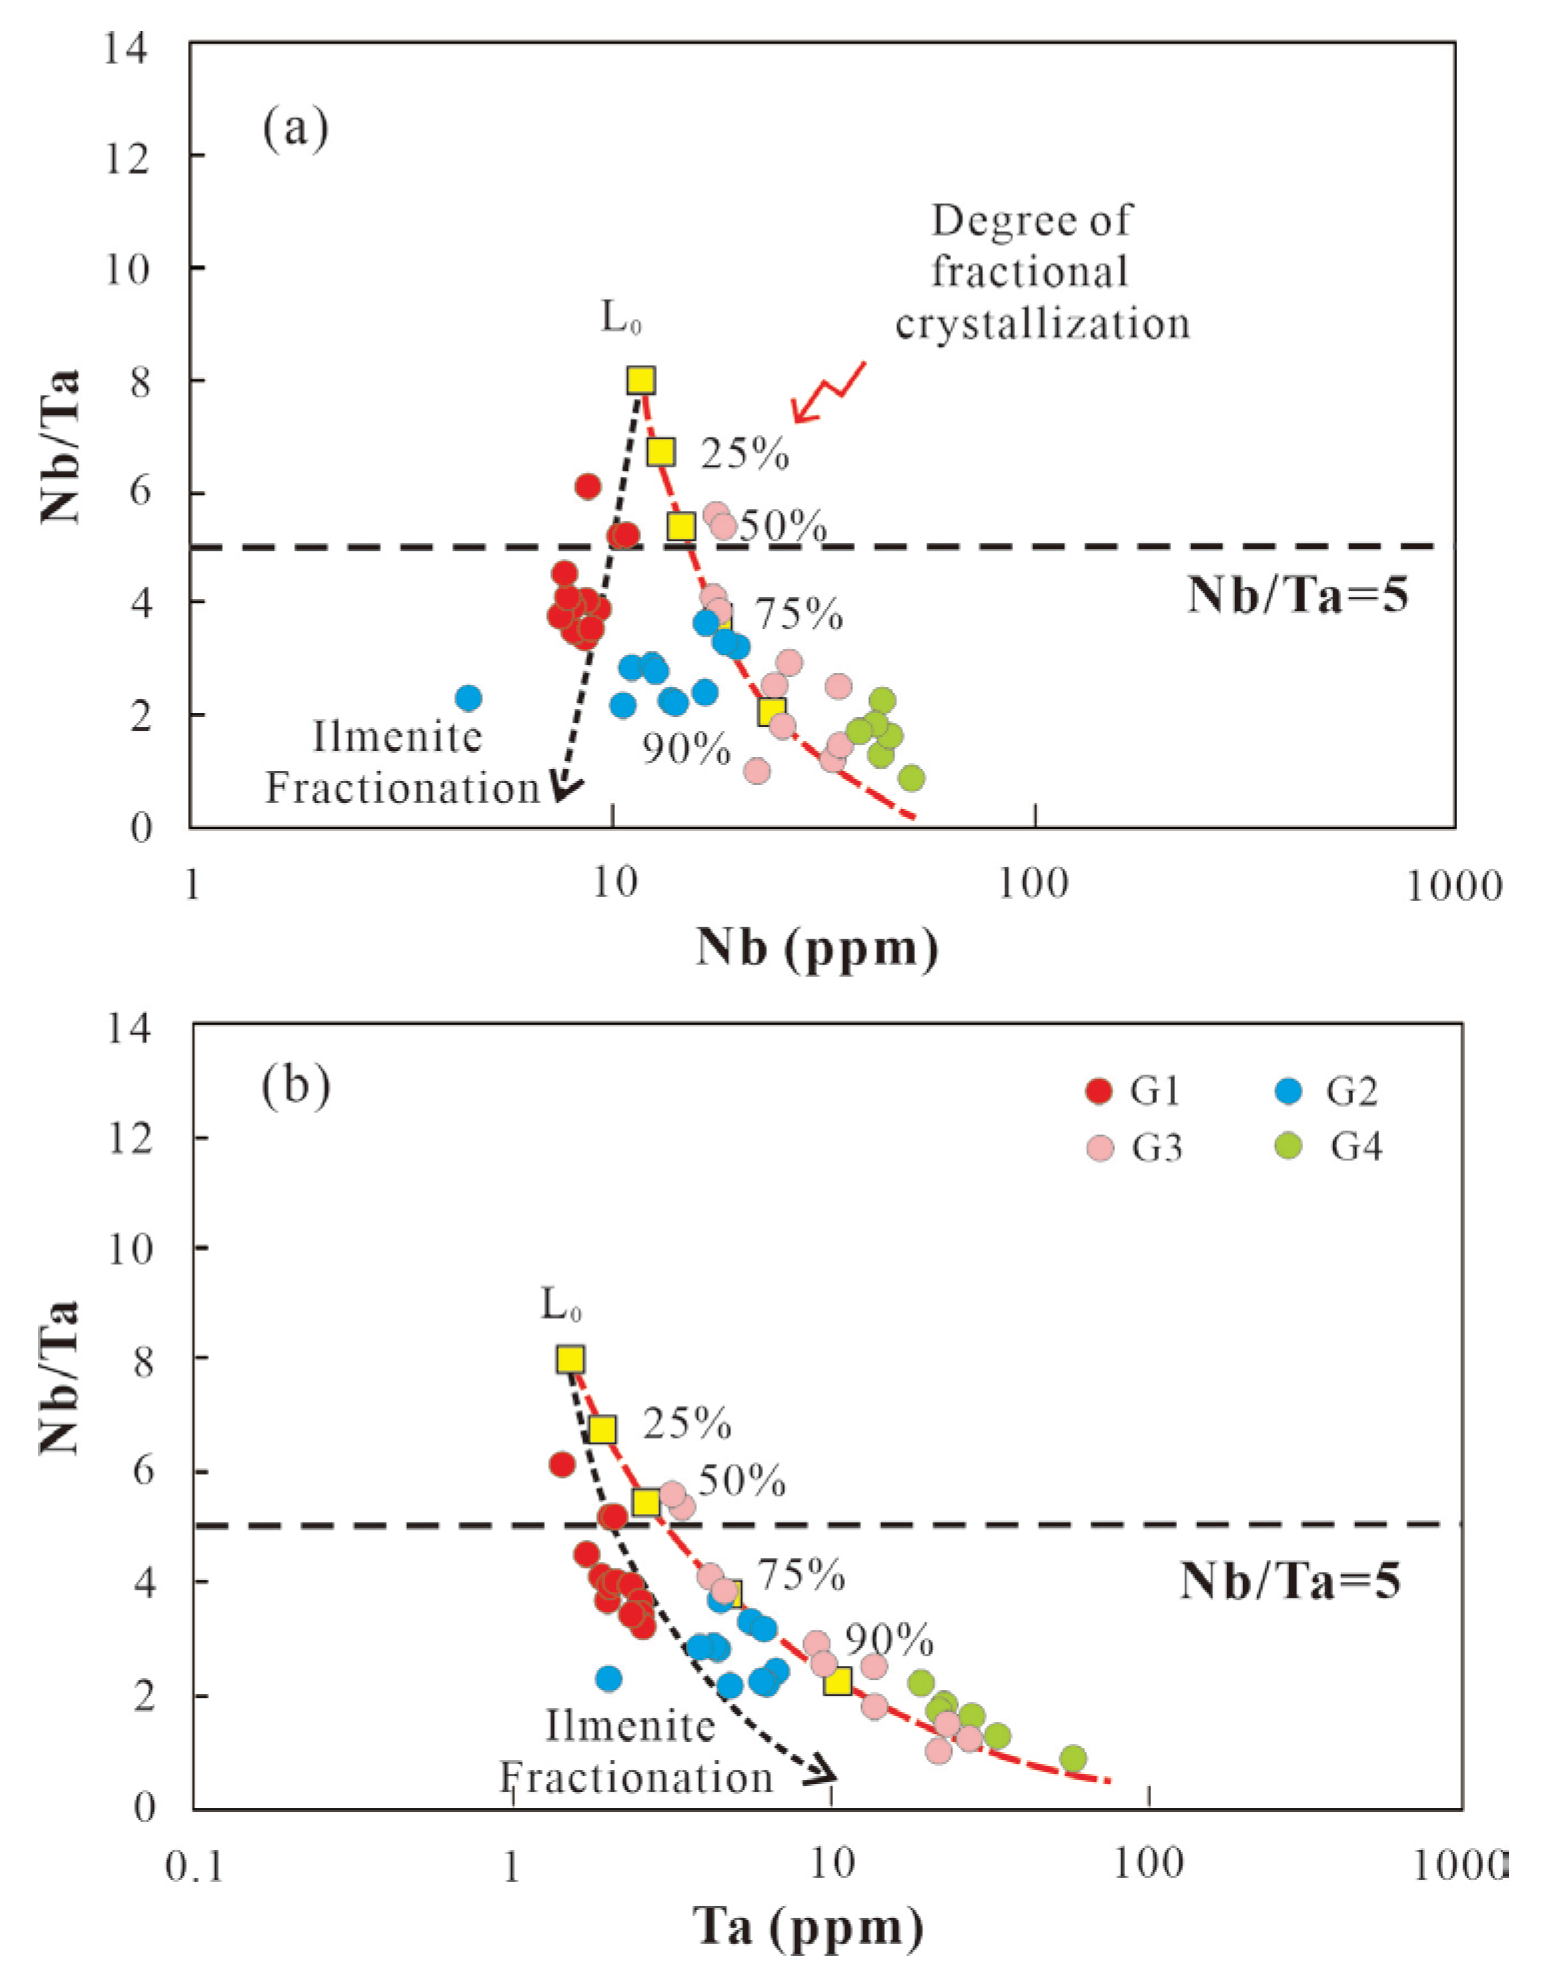
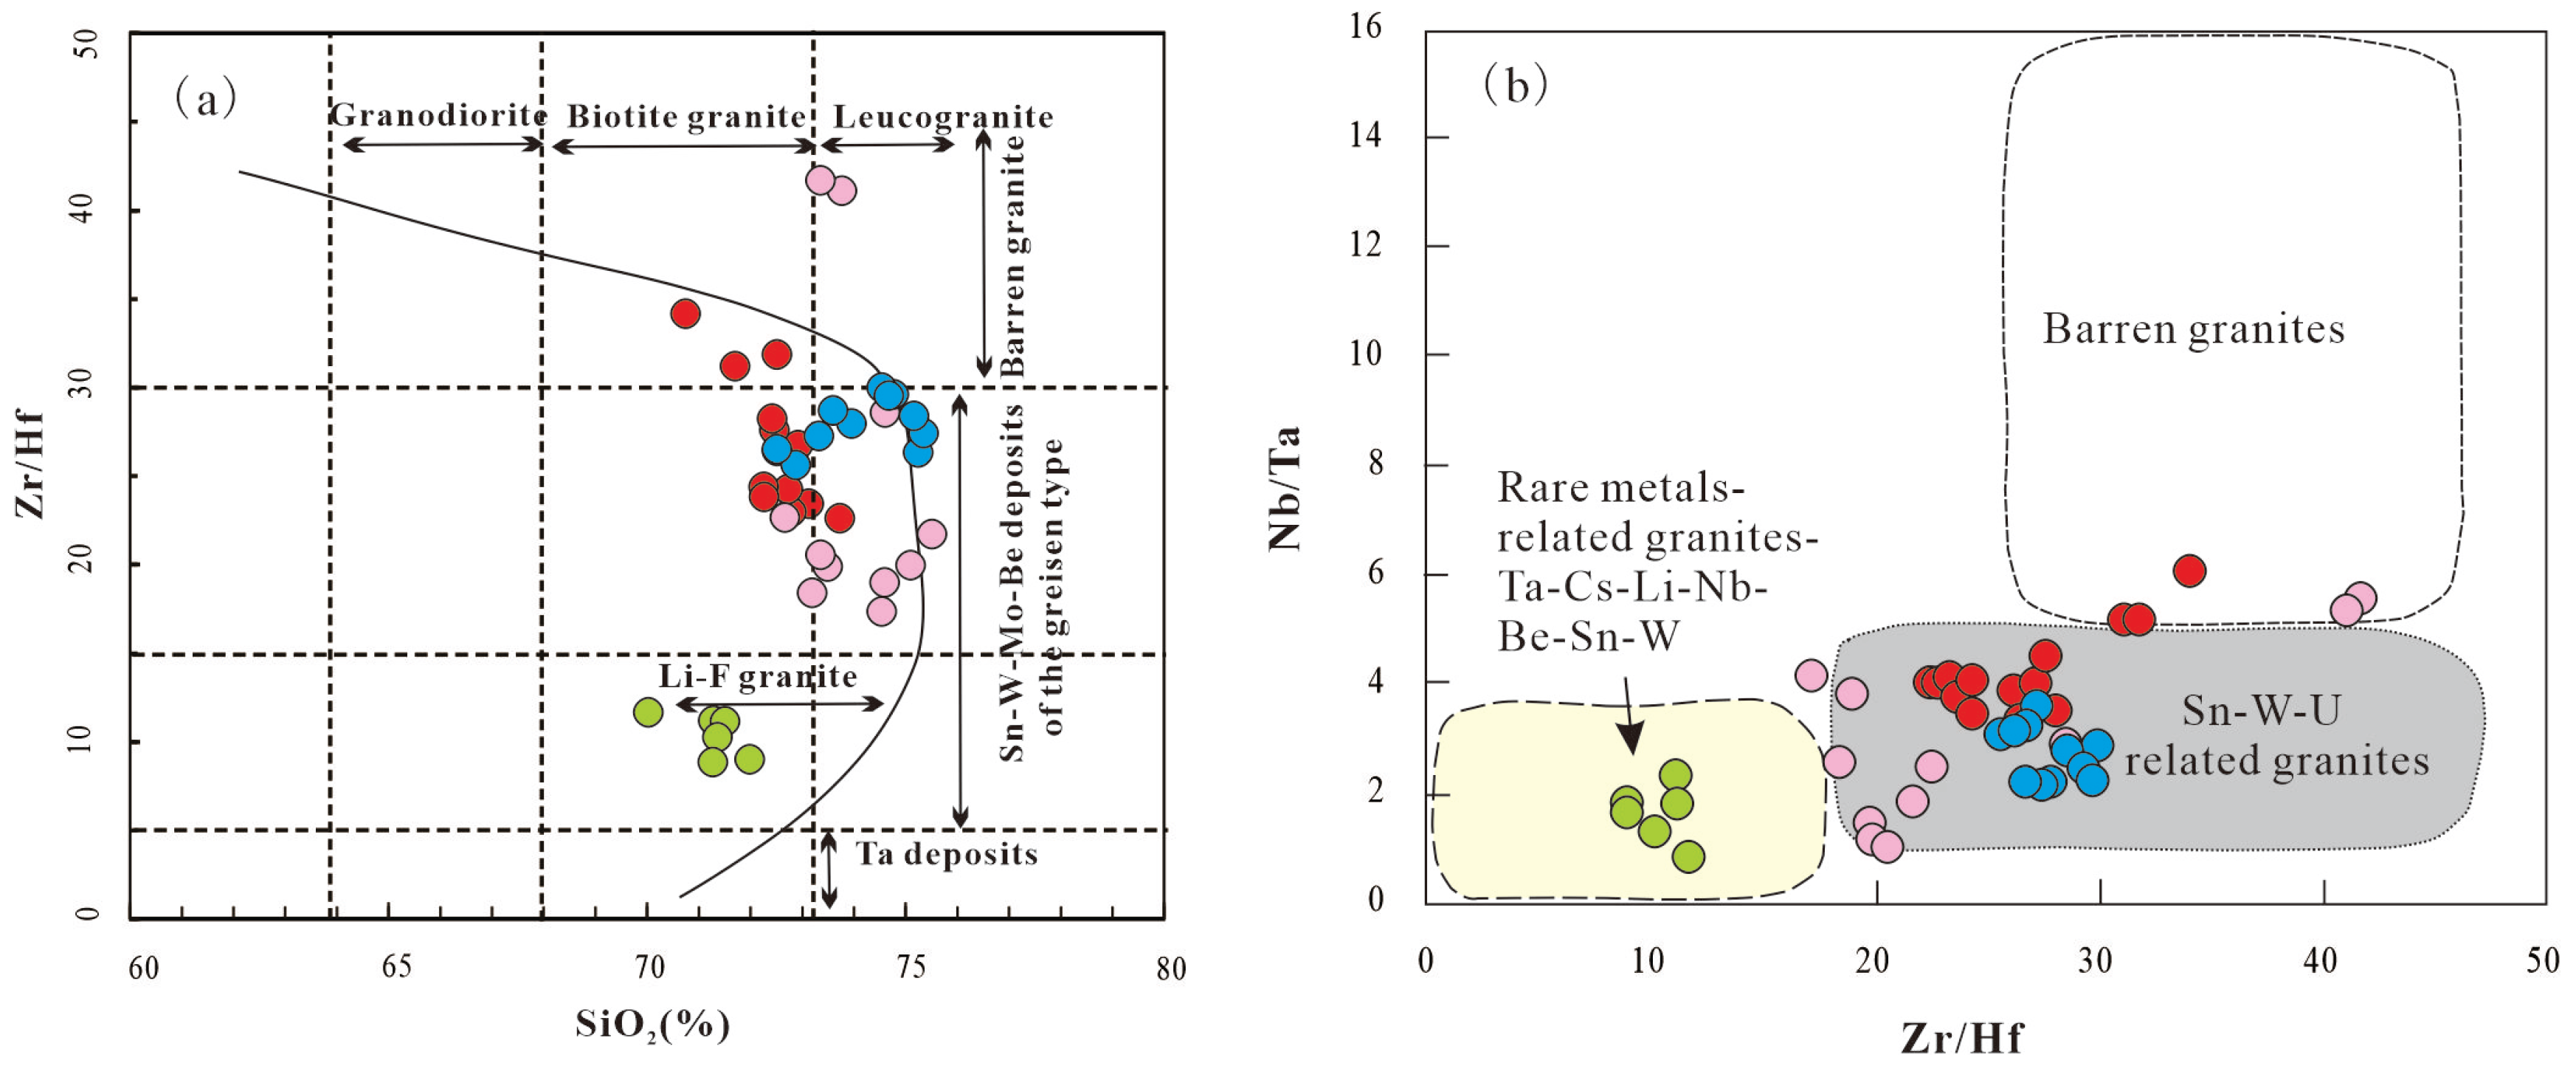
The origin of Mesozoic granites associated with the Dahutang W-Cu-Mo orefield in north Jiangxi, which host the world’s second largest tungsten deposit, remains a compelling subject despite extensive geochemical and geochronological studies. In this contribution we present new wolframite mineral and bulk-rock geochemistry and monazite U-Pb ages for the Mesozoic granites in aiming to enhance our understanding the petrogenesis of these granites and its coupling relationship with the mineralization. Two magmatic phases and four types of rocks in study area are identified, i.e., the early stage (152-147 Ma) biotite (G1) granite and the late stage (144-130 Ma) two-mica (G2)+muscovite (G3)+albite (G4) granite series. These two magmatic phases are temporally coincident with two mineralization stages (~150 Ma and 139-144 Ma). All the Mesozoic granites share the characteristics of high silica content, peraluminosity (A/CNK > 1.1), and low Zr+Nb+Ce+Y values (< 200 ppm), and they are derived from the partial melting of a Proterozoic crustal source. Specifically, the G1 granite, characterized by relatively high MgO (~0.5%), CaO (~1%), and low P2O5(0.13%-0.20%), is classified as an I-type granite. It formed via a relatively higher degree of partial melting at ~766°C (Zr saturation temperatures) driven by biotite breakdown reactions, with minor contributions from mantle-derived materials. In contrast, the G2–G4 granites series exhibits typical peraluminous S-type granite features, such as high Al2O3, Na2O, and P2O5 (mostly >0.2%) contents, and low Sr and Ba contents. They are products of low-degree partial melting that occurred under conditions close to muscovite breakdown at ~735°C. Additionally, both granites show clear geochemical evidence of fluid interaction, as reflected by their elevated trace element and volatile contents: Sn>30 ppm, Cs >35 ppm, F >0.4%, Li >250 ppm, W 10–1000 ppm, Rb >500 ppm, K/Rb values <150, and Nb/Ta<5. The G1 granite represents a moderately fractionated melt relative to chondrites, as evidenced by its near-chondritic Zr/Hf (22.6-34.1) and Y/Ho (24.5-31.5) ratios, indicating a weaker influence of magmatic fluid-melt interaction. For the G2-G4 granites, however, intense crystal fractionation and late-stage fluid-melt interaction are well-documented by their highly variable and low ratios of Y/Ho (14.8-41.4), Nb/Ta (0.89-5.57), Zr/Hf (8.84-41.67), and K/Rb (13.96-128.29). In the long-lived, reduced, and volatile-rich aqueous environment of the G2–G4 magmas, fractional crystallization and albitization collectively enhanced the solubility and hydrothermal transport capacity of W, Sn, Li, Nb, and Ta by multiple orders of magnitude. In contrast, in the earlier, more oxidized G1 magma (which incorporated mantle materials), the exsolution and hydrothermal transport of Cu and Mo were associated with localized greisenization, but their capacity diminished with fractional crystallization. Historically, mineral exploration in the Dalutang mining area has focused primarily on W, Cu, and Mo. Based on this research, we conclude that there is significant mineral potential for rare metals (particularly Sn, Li, and Ta), and future surveys should prioritize areas adjacent to the evolved G2–G4 peraluminous leucogranites to search for new concealed mineral occurrences.
Keywords:
1. Introduction
2. Geologic setting
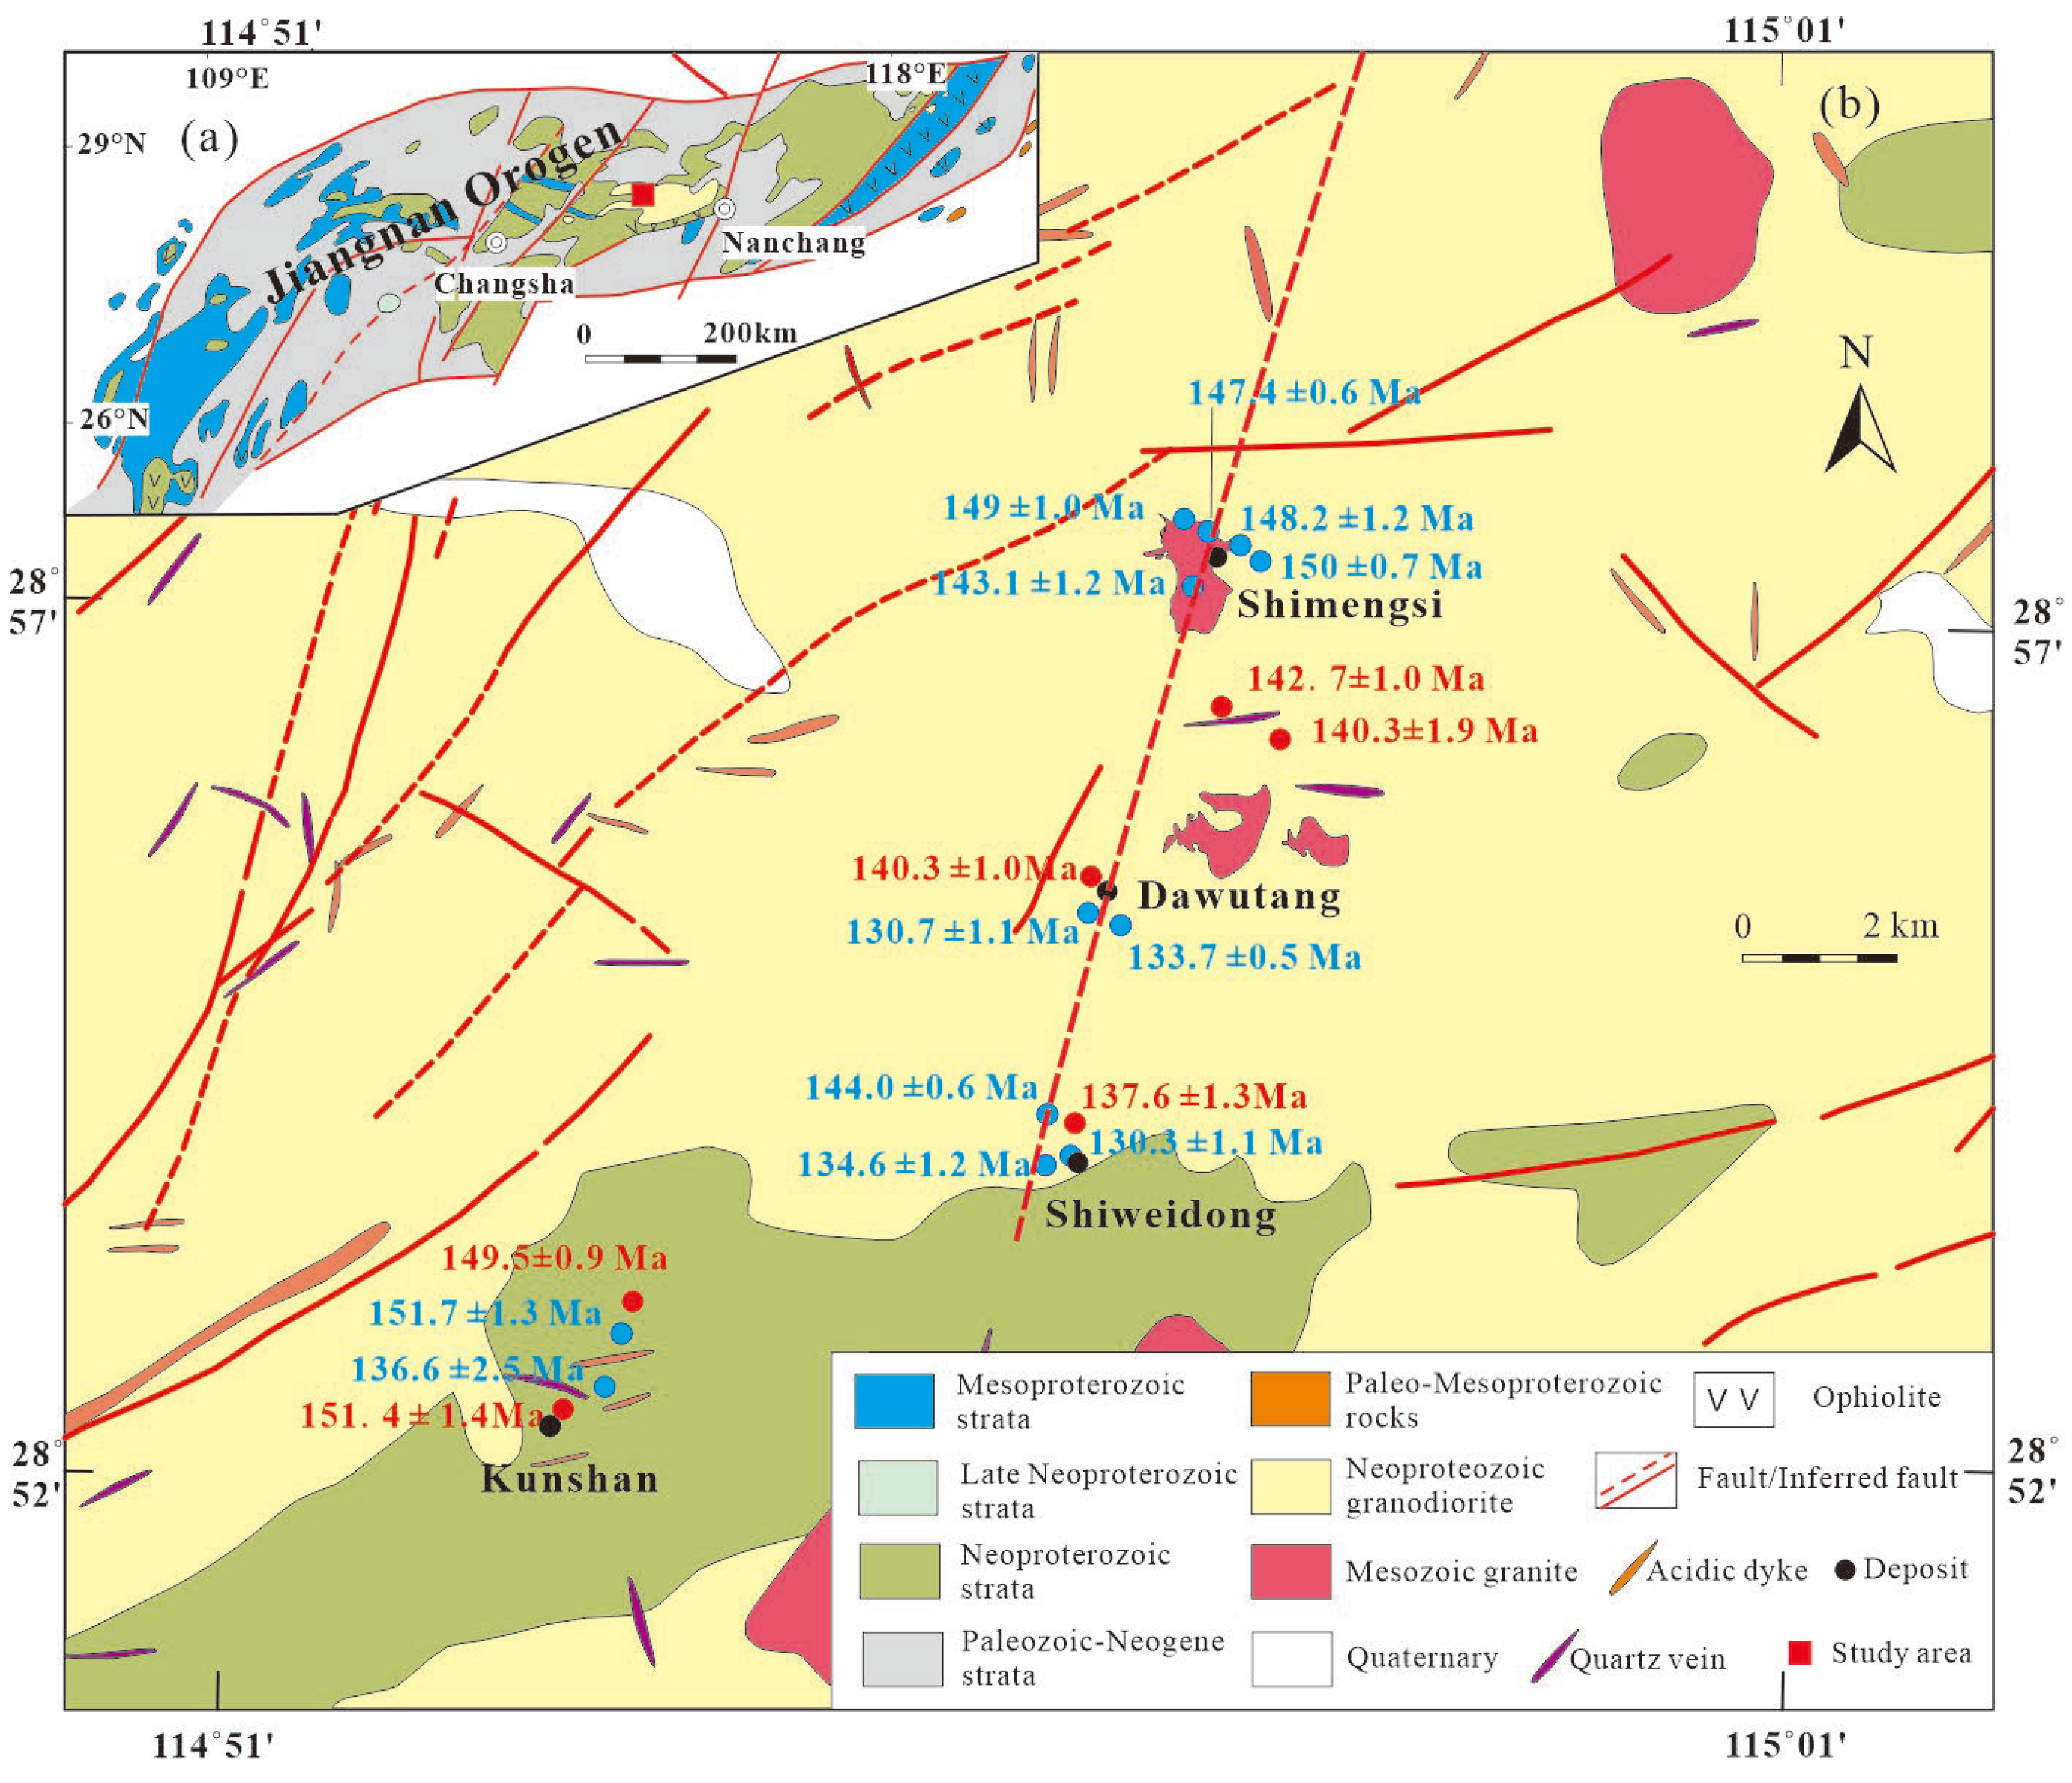
2.1. Regional geology
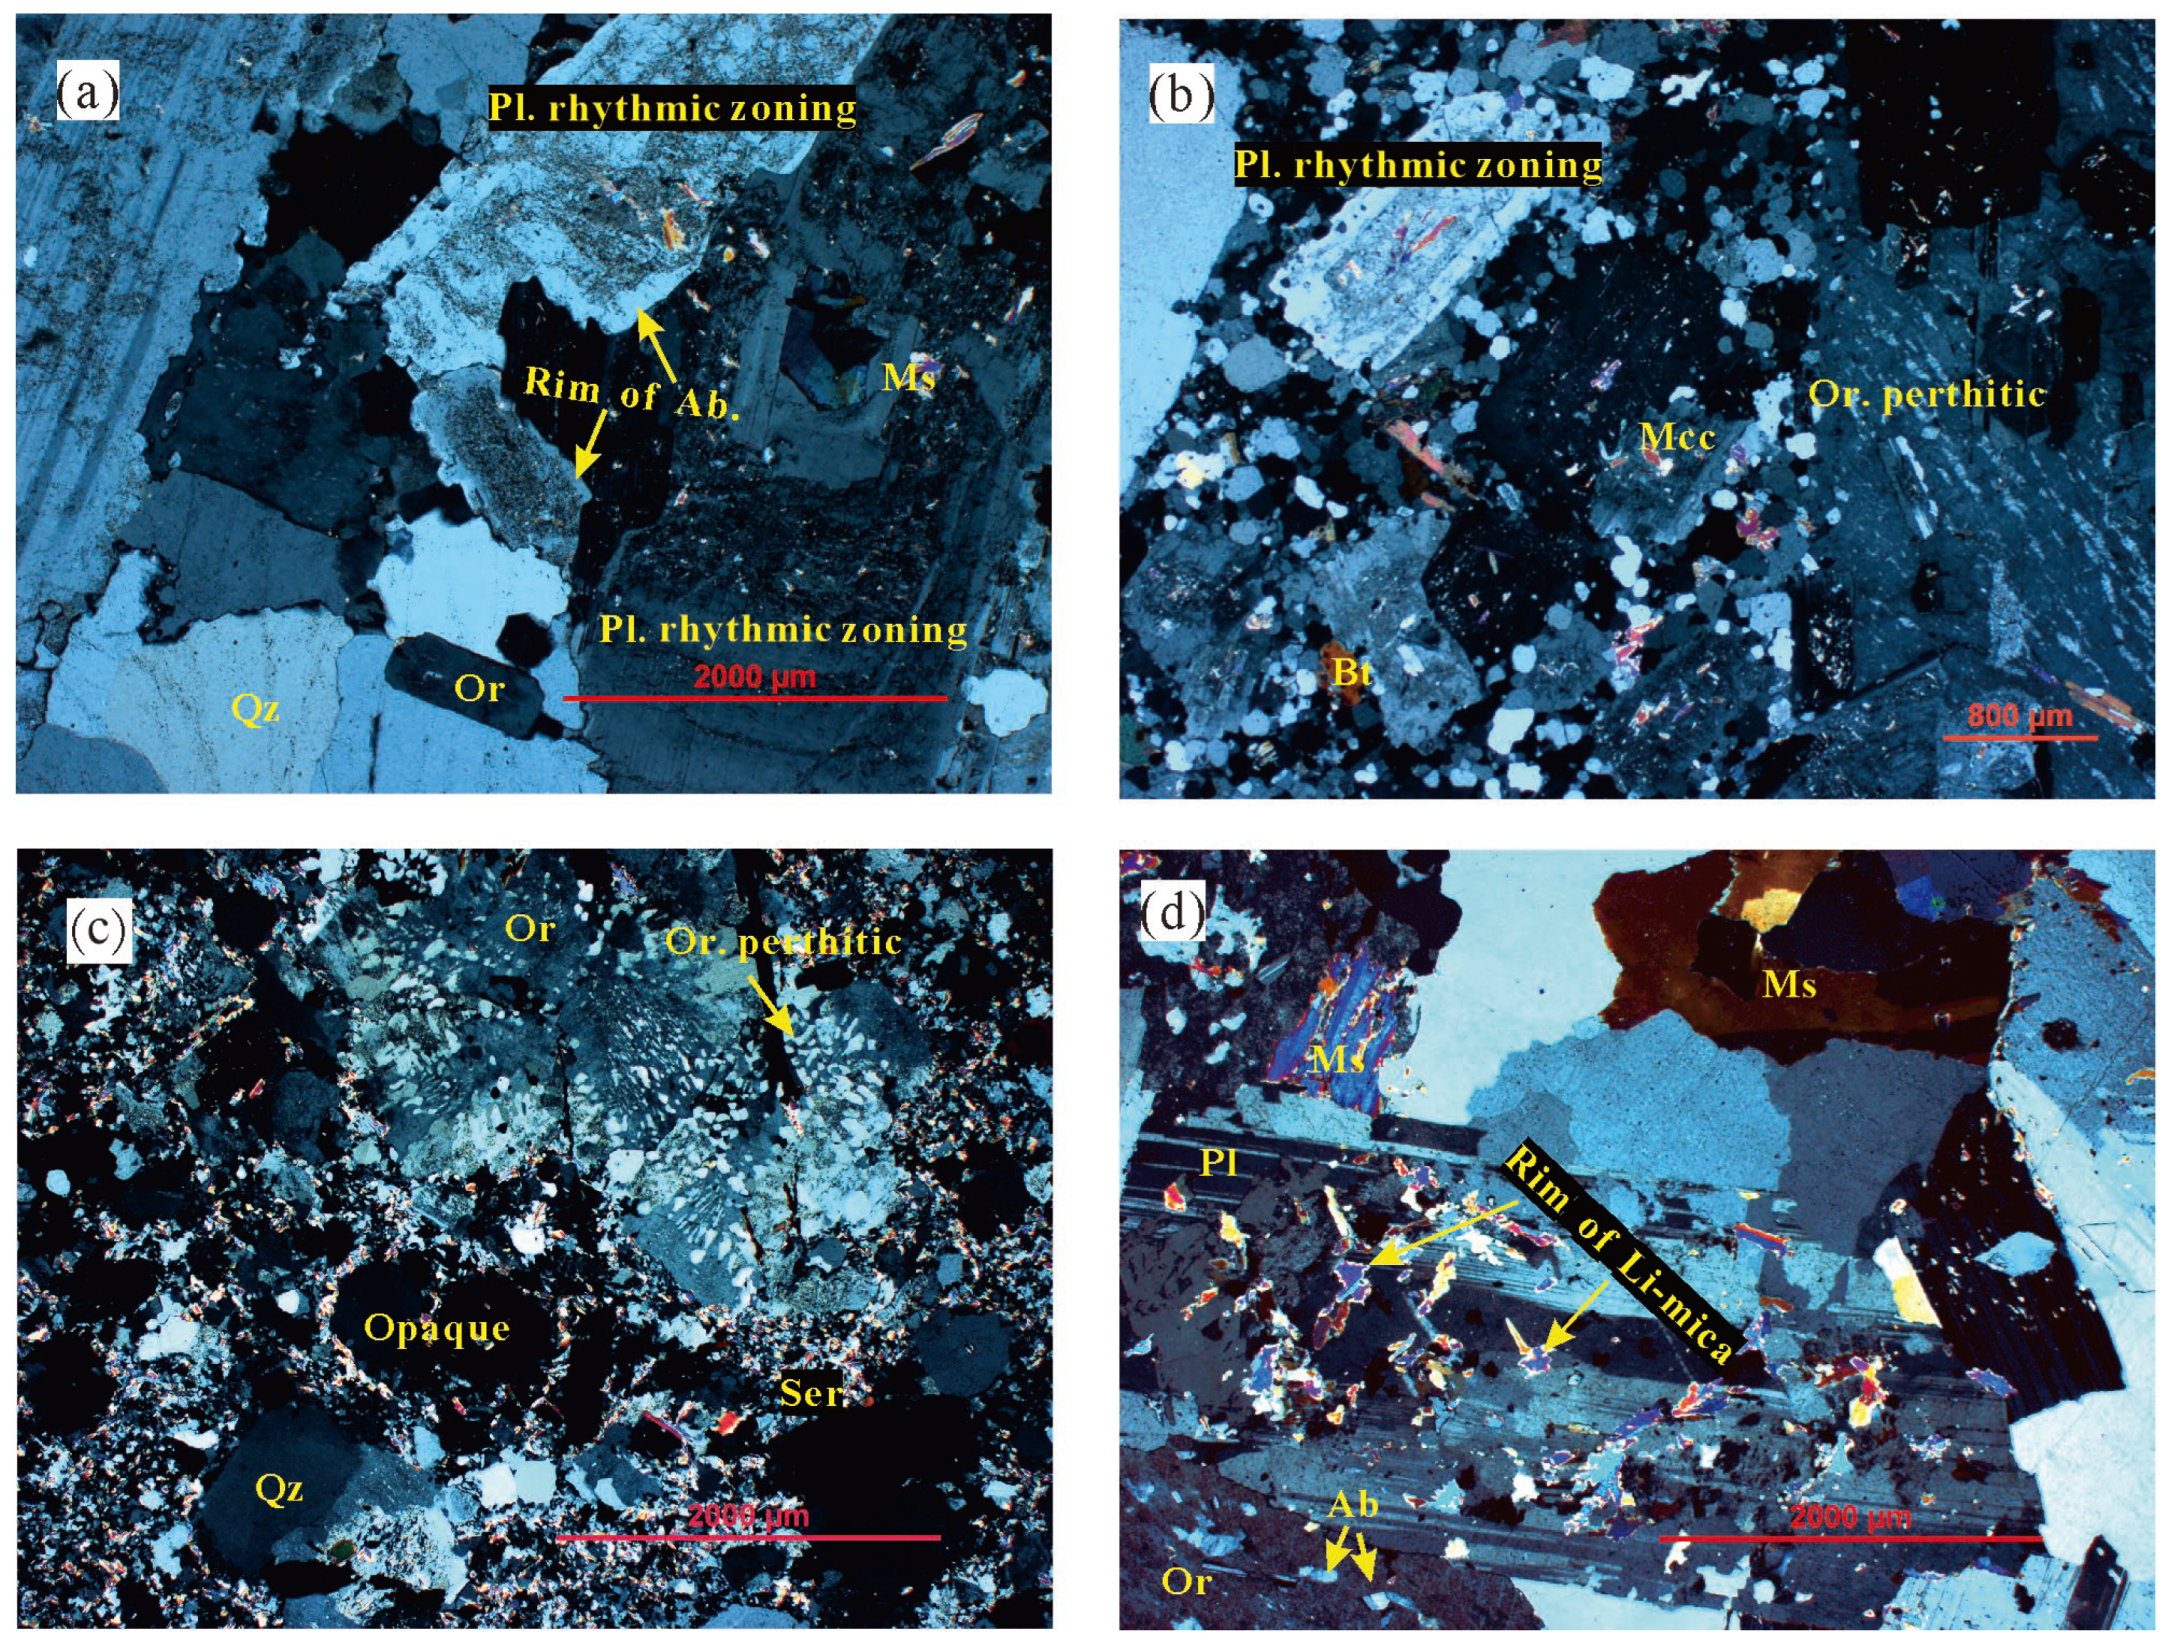
2.2. Petrography of Mesozoic granites
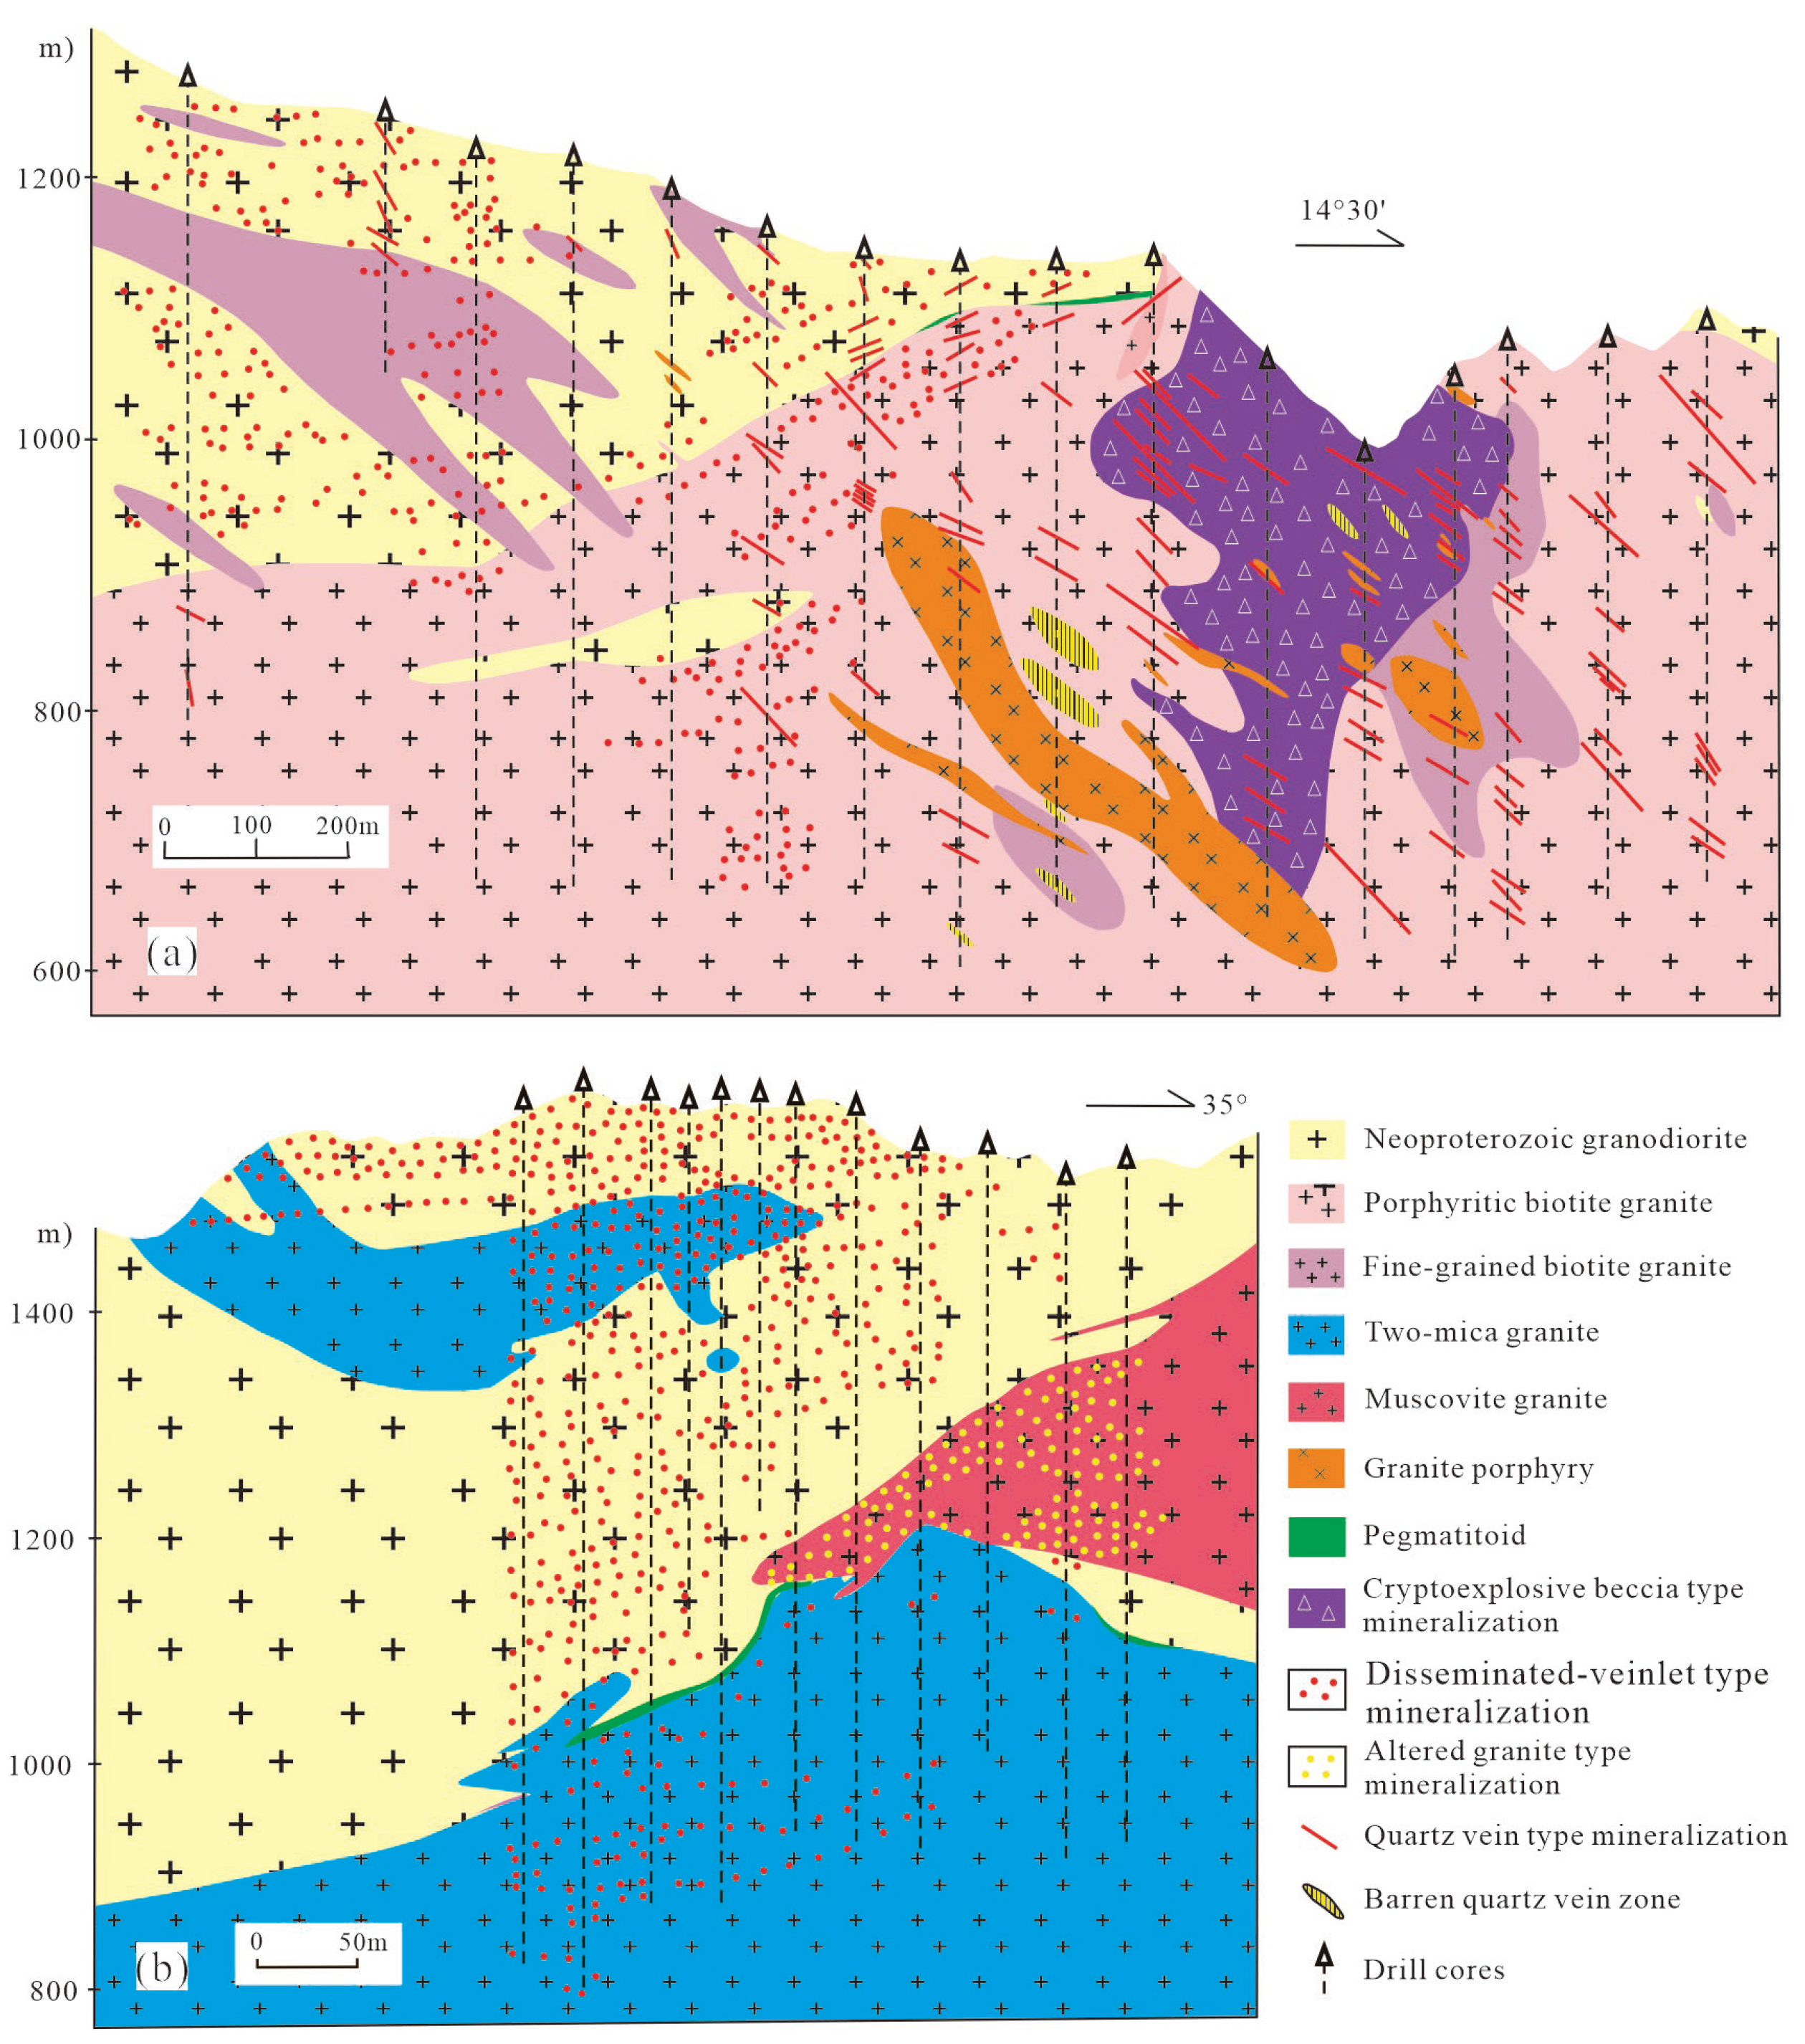
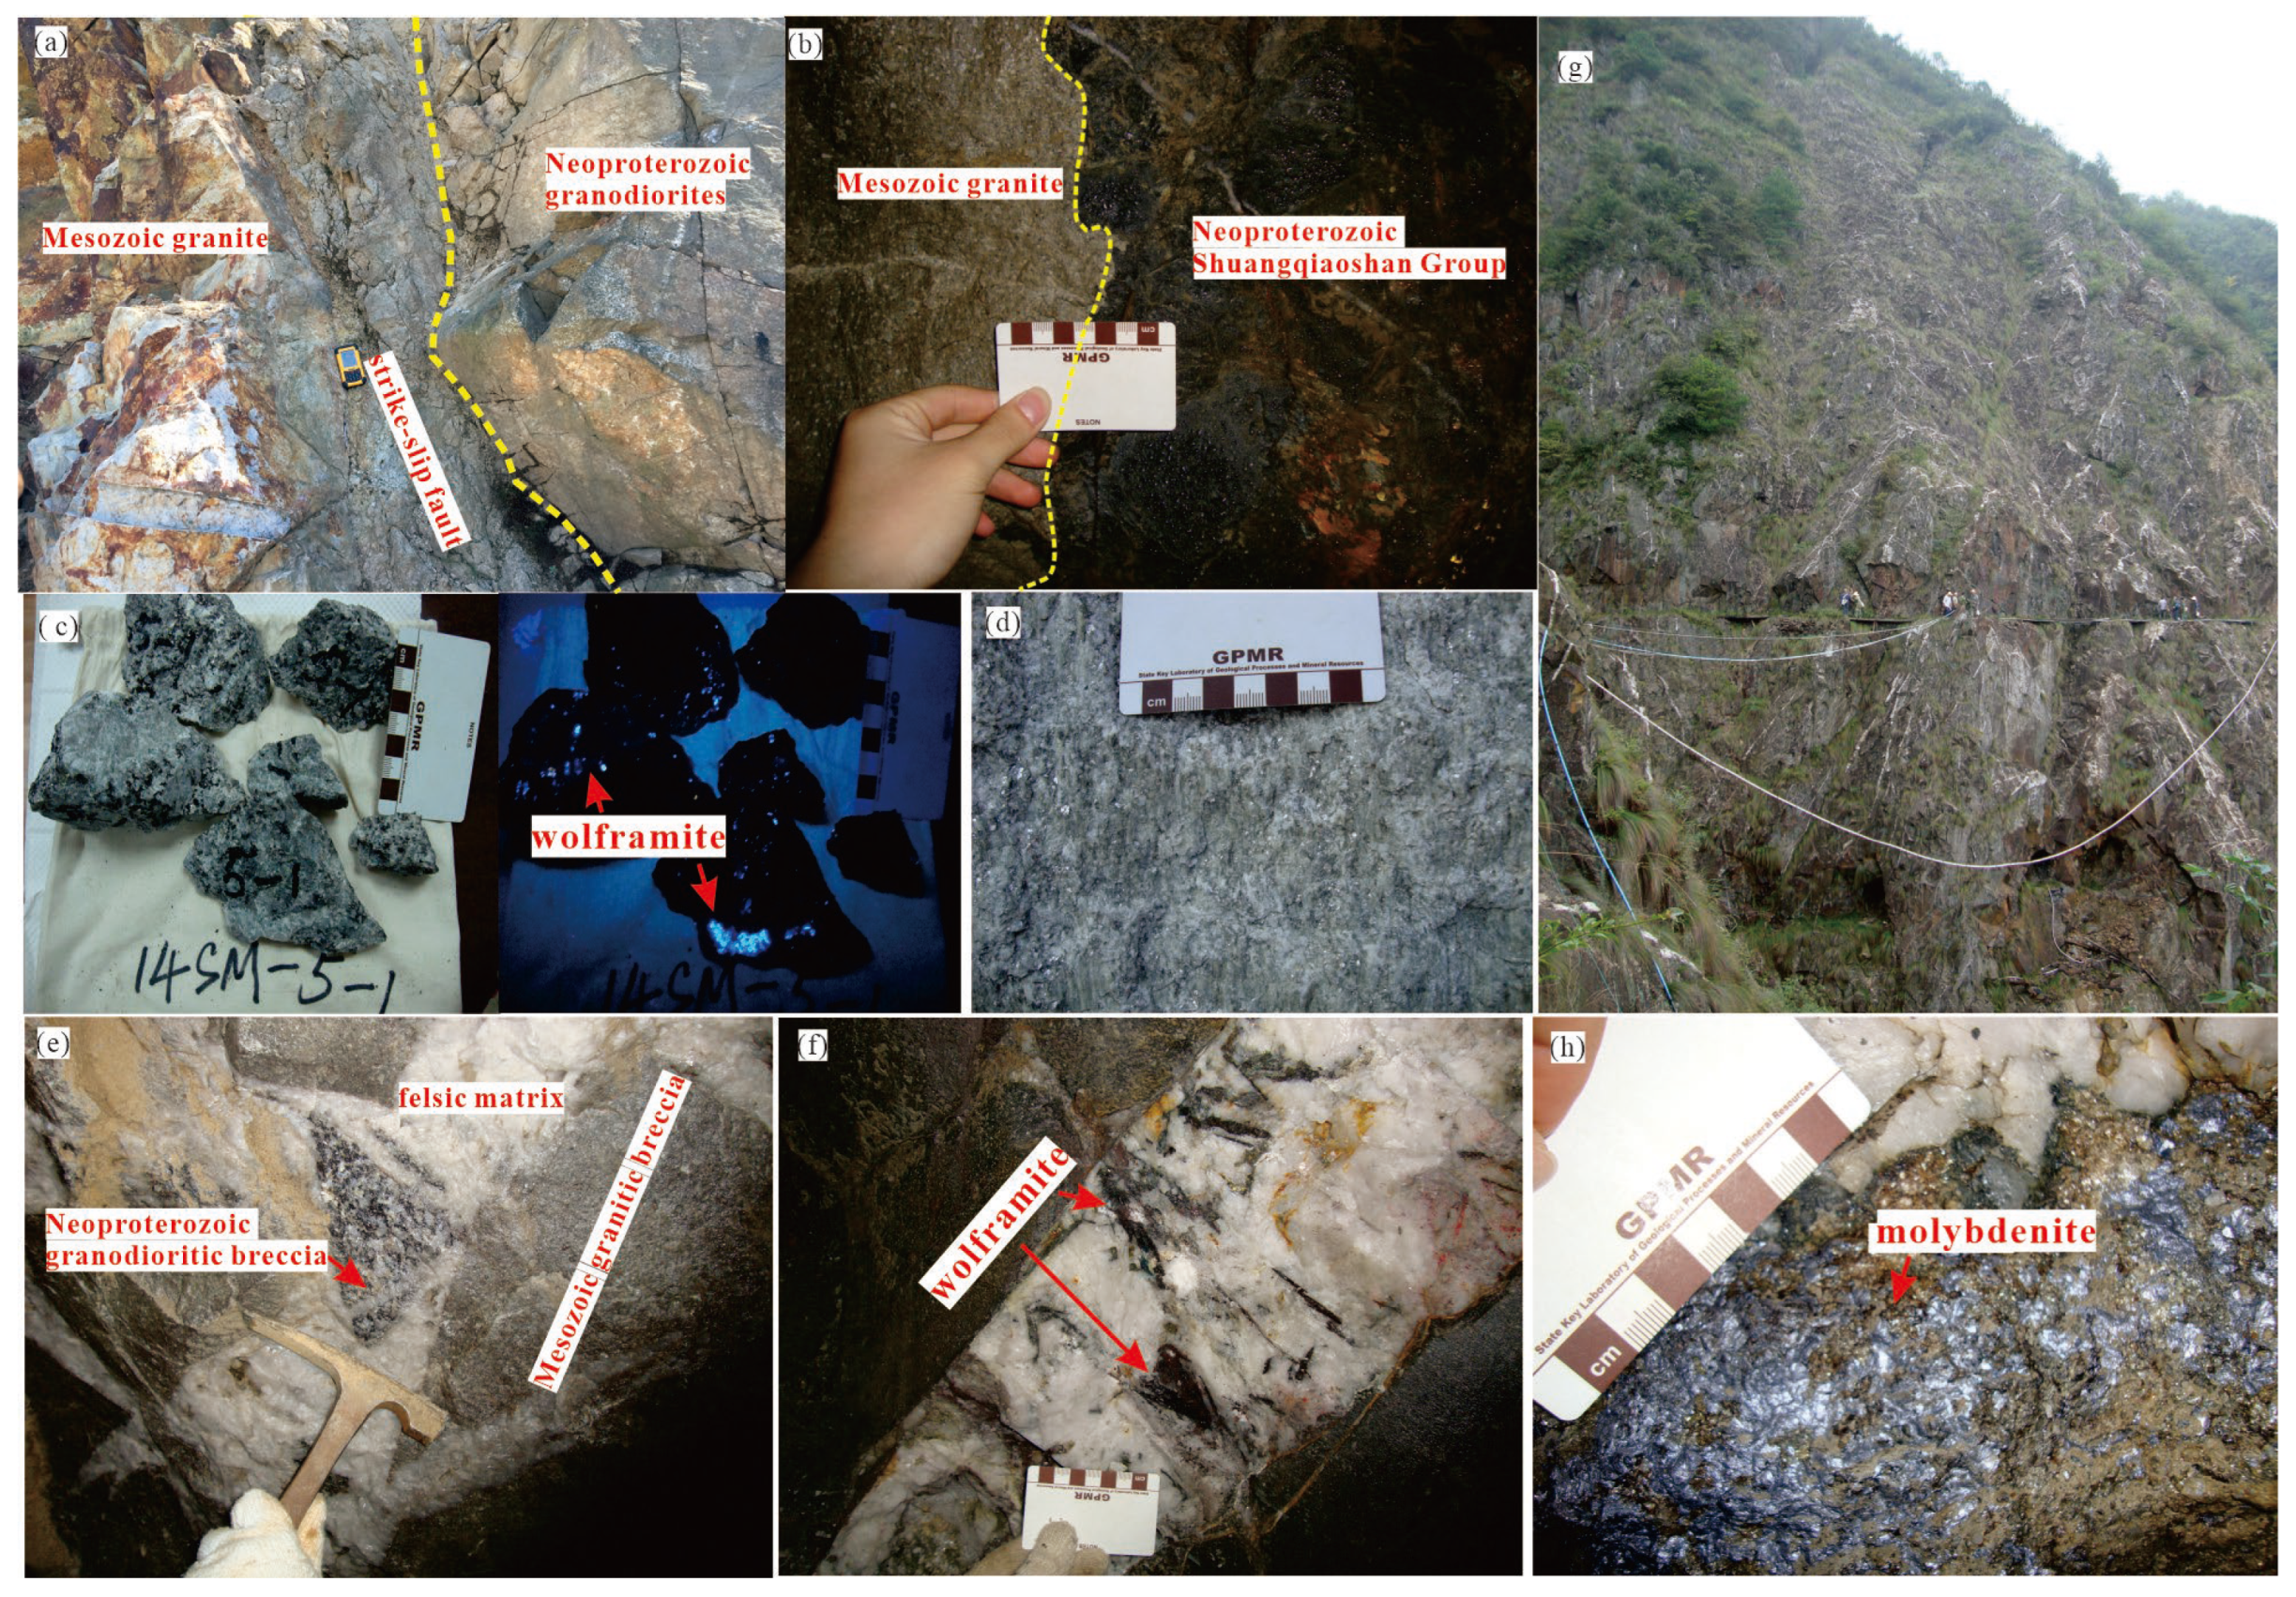
3. Ore characteristics
4. Materials and Methods
4.2. Back-Scaterred Electron of wolframite
4.3. Laser ablation ICP-MS of monazite and zircon
5. Results
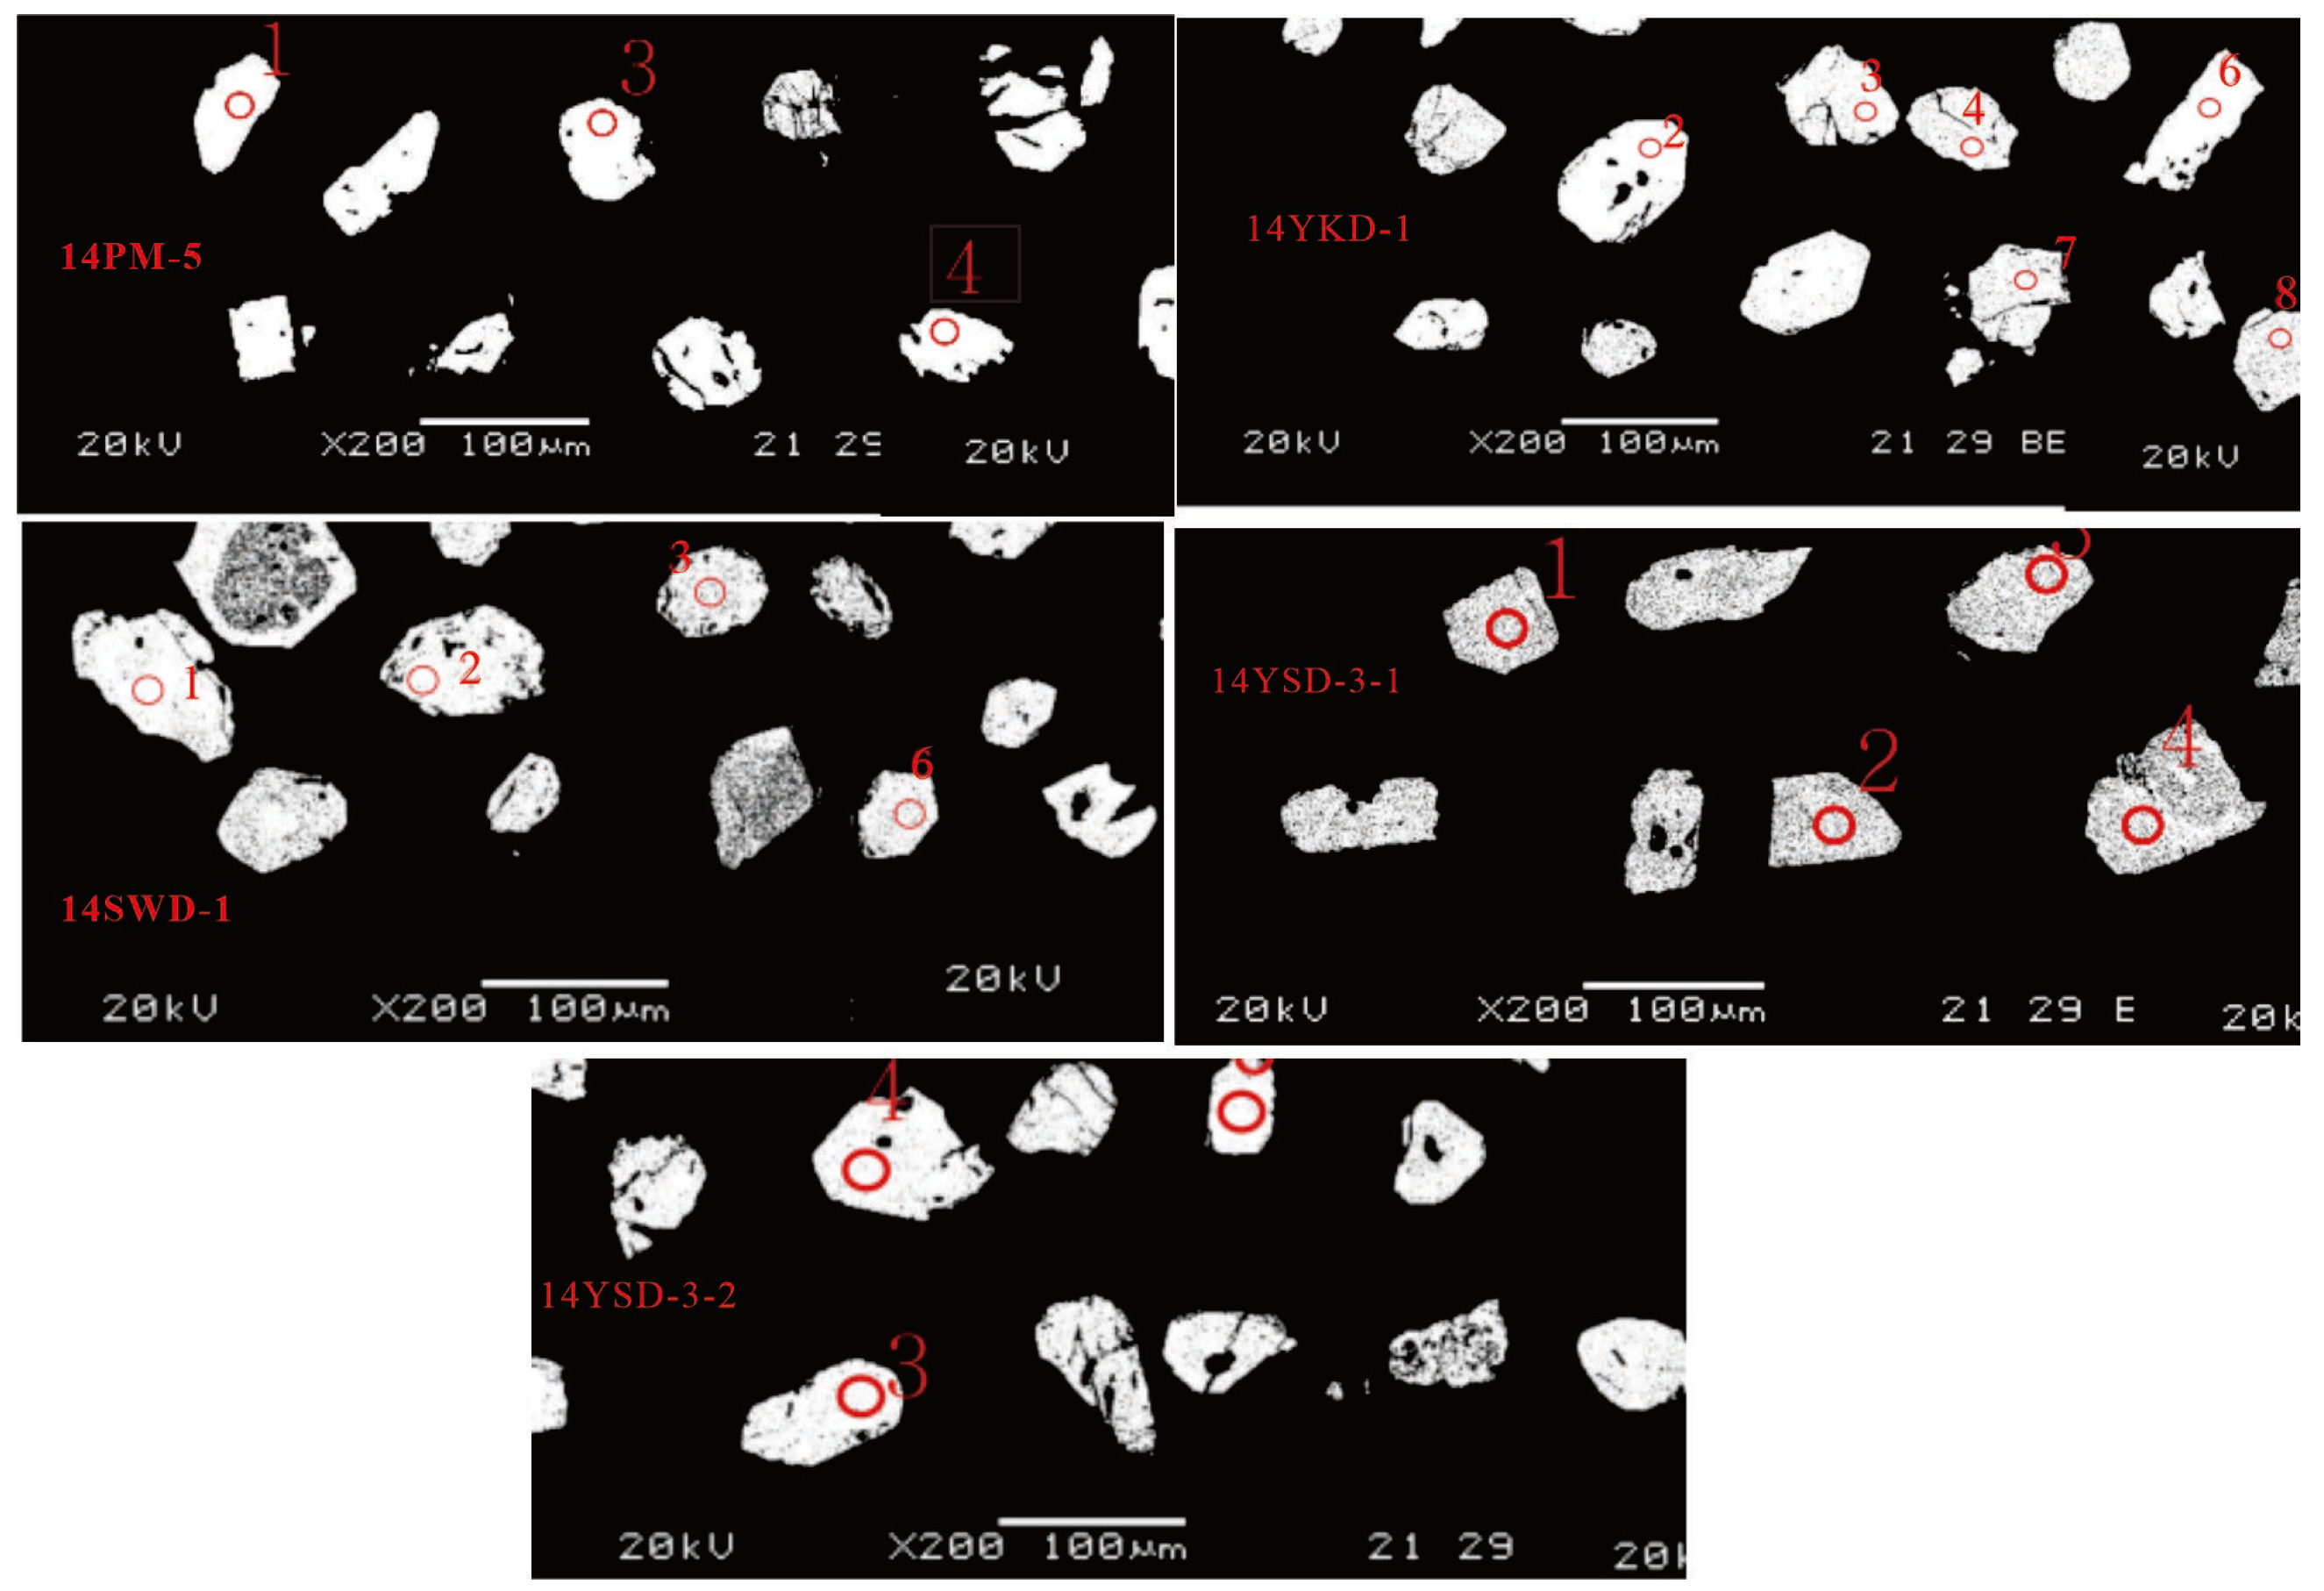
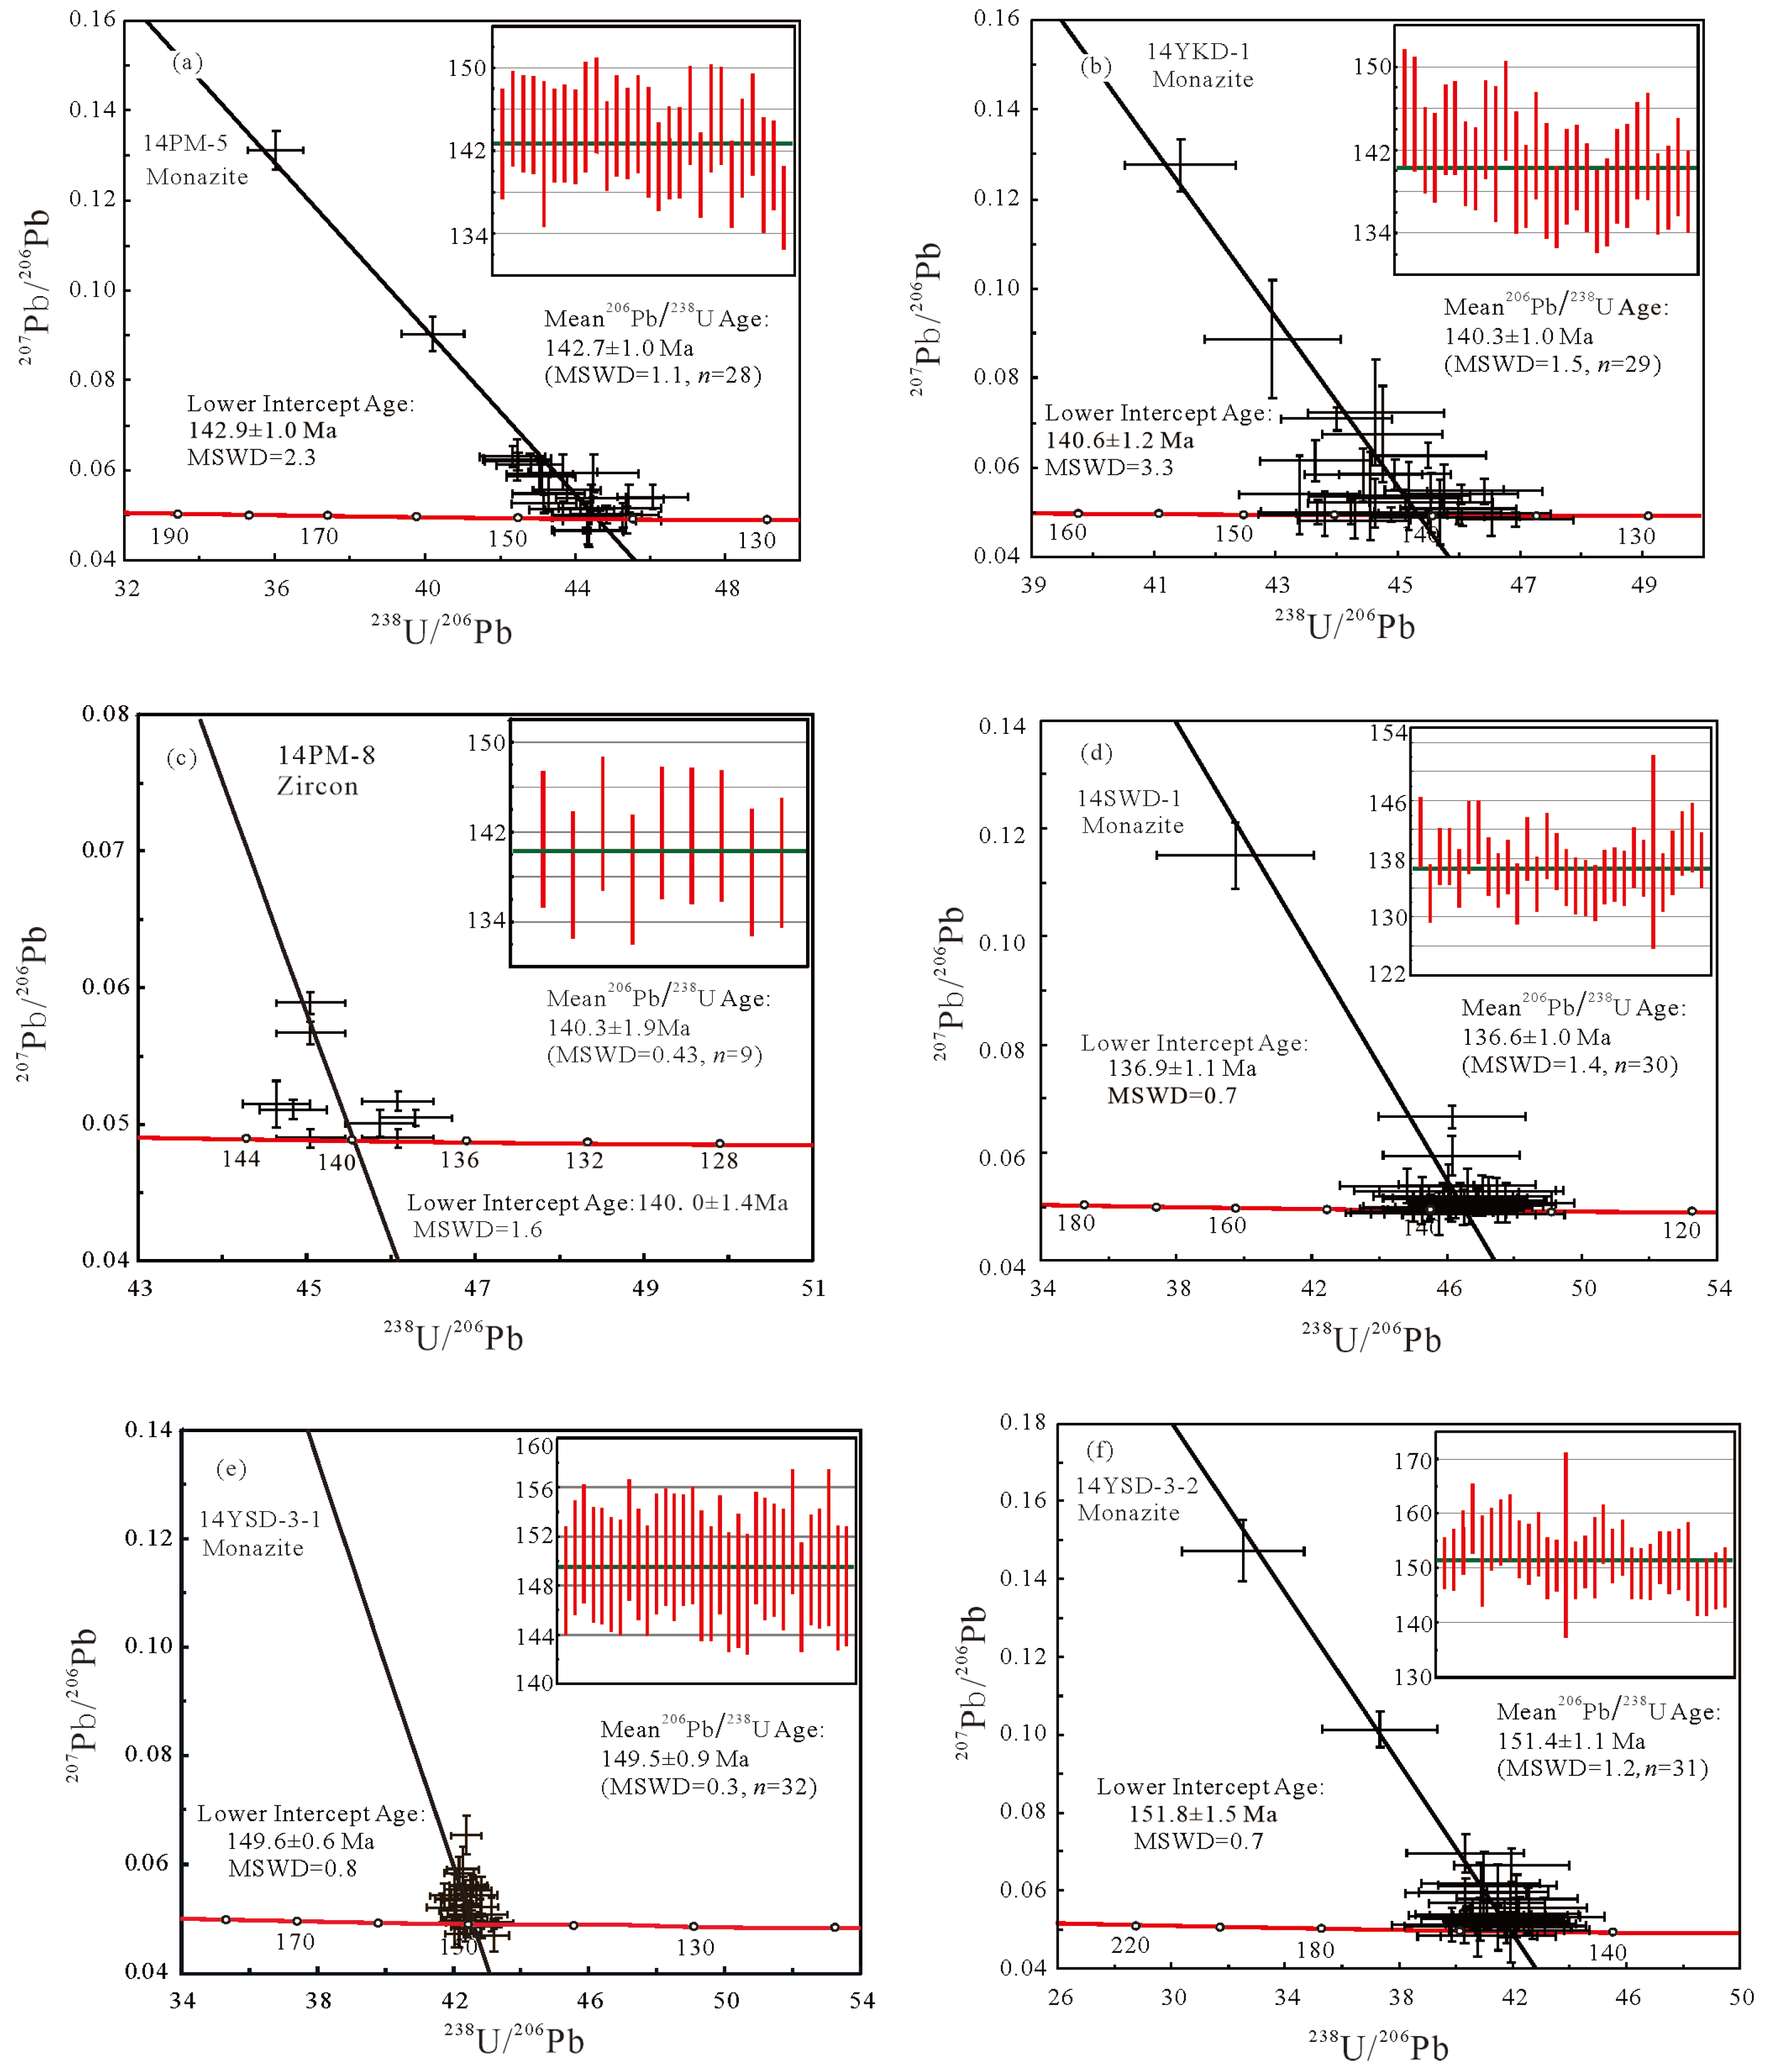
5.1. Geochronology
5.1.1. Dawutang mining area
5.1.2. Shiweidong mining area
5.1.3. Kunshan mining area
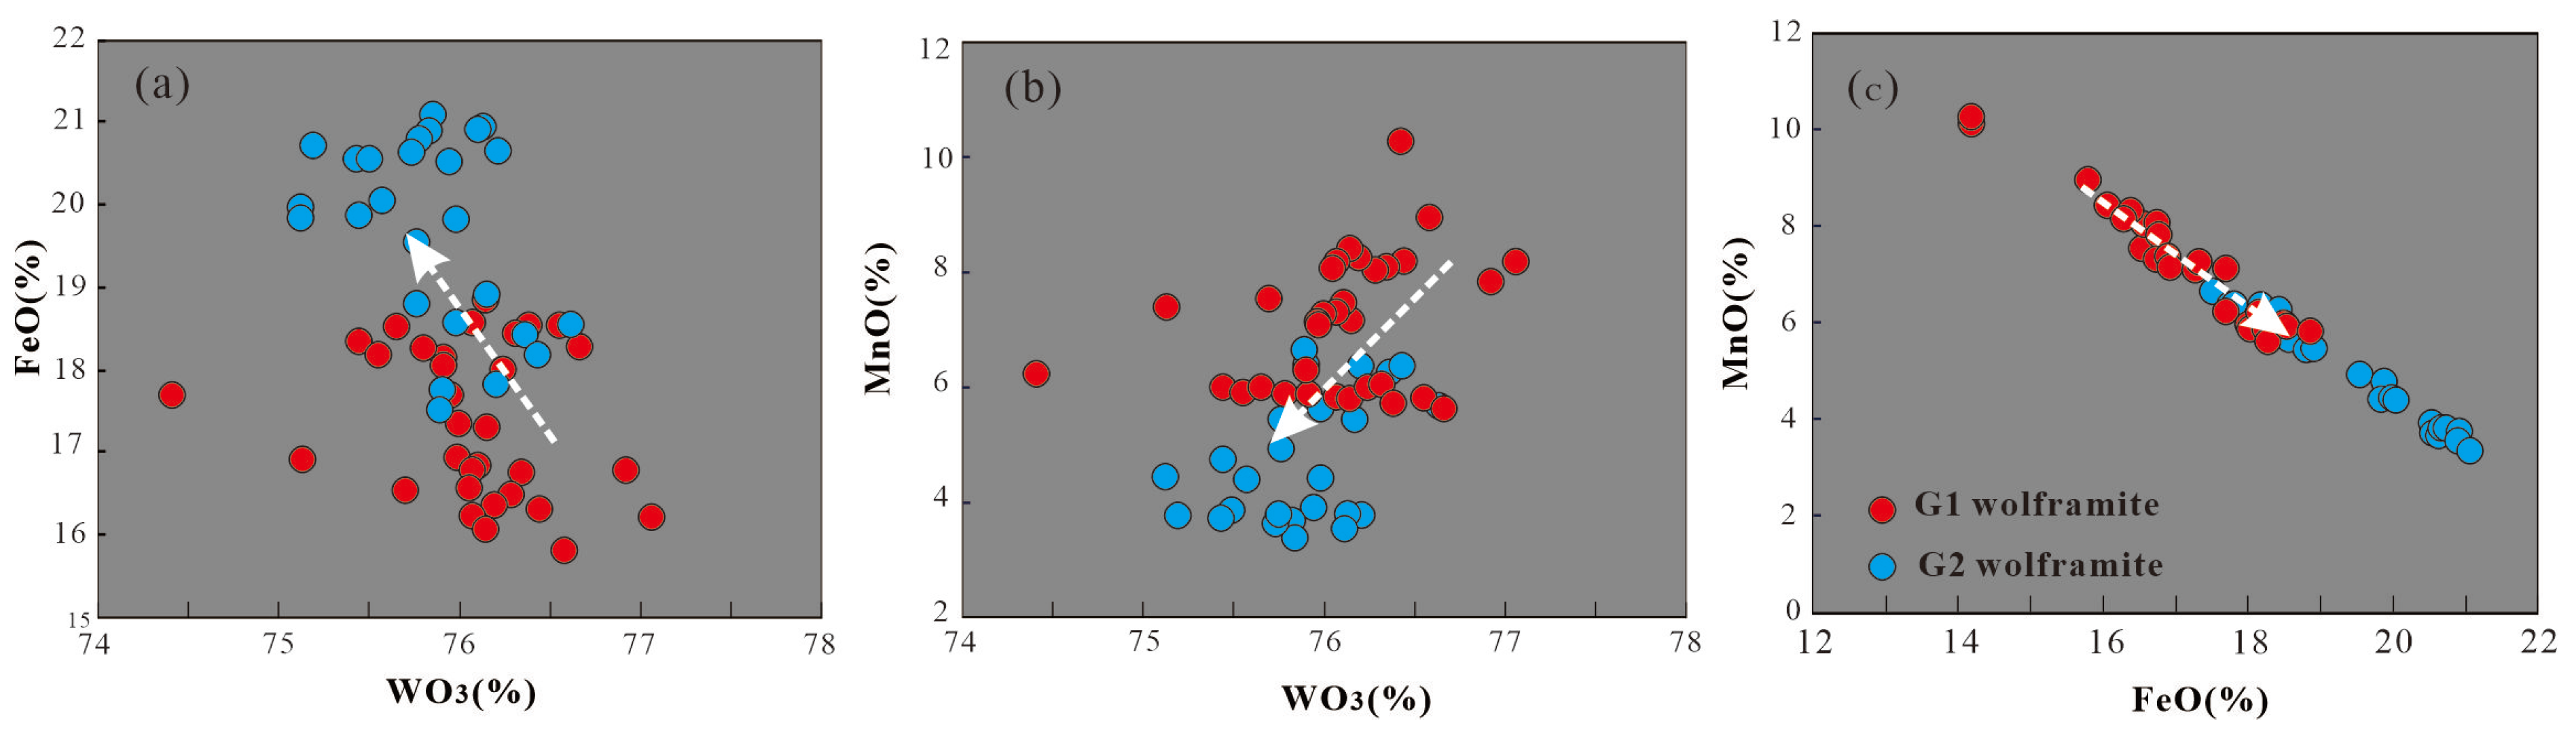
5.2. Geochemistry of wolframite
5.3. Whole-rock chemistry of Mesozoic granites
5.4. Characteristics of Zr/Hf, Y/Ho, Nb/Ta, and K/Rb isovalent ratios
5.5. Characteristics of ore-forming elements
6. Discussion
6.1. Spatio-temporal distribution of the Mesozoic peraluminous granites
6.2. Implications for magma temperature
6.3. Tectonic setting and metallogenic materials
6.4. The role of fluorine and phosphorus
6.5. PH, Eh conditions as indicators of mineralisation
6.6. Magmatic evolution, hydrothermal alteration and mineralization
7. Conclusions
Author Contributions
Funding
Data Availability Statement
Acknowledgments
Conflicts of Interest
References
- Bonin, B. Do coeval mafic and felsic magmas in post-collisional to within-plate regimes necessarily imply two contrasting, mantle and crustal, sources? A review. Lithos 2004, 78, 1–4. [Google Scholar] [CrossRef]
- Bonin, B. A-type granites and related rocks: evolution of a concept, problems and prospects. Lithos 2007, 97, 1–29. [Google Scholar] [CrossRef]
- Xiang, X. K, Chen, M.S., Zhan, G.N., Qian, Z.Y.i, Li, H., Xu, J.H. Metallogenic geological conditions of Shimensi tungsten-polymetallic deposit in north Jiangxi province. Contrib. Geol. Miner. Resour. Res. 2012, 27, 143–155. [Google Scholar]
- Xiang, X.K. , Wang, P., Sun, D.M., Zhong, B. Re-Os isotopic age of molybdeinte from the Shimensi tungsten polymetallic deposit in northern Jiangxi province and its geological implications. Geol. Bull. China 2013, 32, 1824–1831. [Google Scholar]
- Huang, L.C. , Jiang, S.Y. Geochronology, geochemistry and petrogenesis of the tungsten-bearing porphyritic granite in the Dahutang tungsten deposit, Jiangxi Province. Acta Petrol. Sin. 2013, 29, 4323–4335. [Google Scholar]
- Huang, L. C, Jiang, S.Y. Highly fractionated S-type granites from the giant Dahutang tungsten deposit in Jiangnan Orogen, Southeast China: Geochronology, petrogenesis and their relationship with W-mineralization. Lithos 2014, 202–203, 207–226. [Google Scholar] [CrossRef]
- Mao, Z.H. , Liu, J.J, Mao, J.W., Deng, J., Zhang, F., Meng, X.Y., Xiong, B.K., Xiang, X.K., Luo, X.H. Geochronology and geochemistry of granitoids related to the giant Dahutang tungsten deposit, middle Yangtze River region, China: Implications for petrogenesis, geodynamic setting, and mineralization. Gondwana Res. 2015, 28, 816–836. [Google Scholar]
- Jiang, S.Y. , Peng, N.J., Huang, L.C., Xu, Y.M.g, Zhan, G.L., Dan, X.H. Geological characteristic and ore genesis of the giant tungsten deposits from the Dahutang ore-concentrated district in northern Jiangxi Province. Acta Petrol. Sin. 2015, 31, 639–655. [Google Scholar]
- Ye, H.M. , Zhang, X., Zhu, Y.H. In-situ Monazite U-Pb Geochronology of Granites in Shimensi Tungsten Polymetallic Deposit, Jiangxi Province and its Geological Significance. Geotect. Metallo. 2016, 40, 58–70. [Google Scholar]
- Sun, K.K. , Chen, B., Deng, J. Biotite in highly evolved granites from the Shimensi W-Cu-Mo polymetallic ore deposit, China: Insights into magma source and evolution. Lithos 2019, 350-351, 105245. [Google Scholar]
- Fan, X.K. , Hou, Z.Q., Zhang, Z.Y., Mavrogenes, J., Pan, X.F., Zhang, X, Xiang X.K. Metallogenic ages and sulfur sources of the giantDahutang W-Cu-Mo ore field, South China: Constraints frommuscovite 40Ar/39Ar dating and in situ sulfur isotope analyses. Ore Geol. Rev. 2021, 134, 104141. [Google Scholar] [CrossRef]
- Zhang, Z.H. , Zhang, D., Xiang, X.K., Zhu, X.Y., He, X.L. Geology and mineralization of the supergiant Shimensi granitic-type W-Cu-Mo deposit (1.168 Mt) in northern Jiangxi, South China: A Review. China Geol. 2022, 5, 510–527. [Google Scholar] [CrossRef]
- Yang, Y.S. , Pan, X.F., Hou, Z.Q., Deng, Y., Zhang, Z.Y., Fan, X.K., Li, X., Liu, D.W. Petrogenesis and redox state of late Mesozoic granites in the Pingmiao deposit: Implications for the W–Cu–Mo mineralization in the Dahutang district. Ore Geol. Rev. 2022, 145, 104898. [Google Scholar] [CrossRef]
- Li, X.H. , Li, Z.X., Ge, W.C., Zhou, H.W., Li, W.X., Liu, Y., Wingate, M.T.D. Neoproterozoic granitoids in South China: crustal melting above a mantle plume atnca. 825 Ma? Precambian Res. 2003, 122, 45–83. [Google Scholar] [CrossRef]
- Sun, K.K. , Chen, B., Chen, J.S., Xiang, X.K. The petrogenesis of the Jiuling granodiorite from the Dahutang deposit, Jiangxi Province and its tectonic implications. Acta Petrol. Sin. 2017, 33, 907–924. [Google Scholar]
- Zhang, M. Y, Feng, C.Y., Li, D.X., Wang, H., Zhou, J.H., Ye, S.Z., Wang, G.H. Geochronological study of the Kunshan W-Mo-Cu Deposit in the Dahu-tang Area, Northern Jiangxi Province and its geological significance. Geotect. Metallo. 2016, 40, 503–516. [Google Scholar]
- Xiang, X.K. , Yin, Q.Q., Zhan, G.N., Qu, K., Liu, X., Tan, R., Zhong, B. Metallogenic conditions and ore-prospecting of Shimensi tungsten ore-section in the North of Dahutang Area in Jiangxi Province. J. Jilin Univ. (Earth Sci. Edi.) 2017, 47, 645–658. [Google Scholar] [CrossRef]
- Zhong, H. , Yu, N.B., Lu, G.S., Chen, D.K., Dan, X.H. Discovery and Exploration Enlightenment of the Dawutang Extra Large Tungsten Deposit in the Jiangnan Tungsten Mine Belt. South China Geol. 2024, 40, 343–352. [Google Scholar]
- Ludwig, K.R. User's manual for Isoplot/Ex (rev. 2.49): a geochronological toolkit for Microsoft excel. Berkeley Geochronology Centre: Special Publication 2001; No. 1a, pp. 55.
- Ивoйлoв, A.C. , Qiu, Y.Z. Supplementary information of the form of niobium tantalum in the black tungsten deposit. Geol. Geochem. 1974, 7, 20–21. [Google Scholar]
- Zhang, C.Z. Variation in Nb-Ta contents of wolframite and its significance as an indicator. Miner. Deposi. 1984, 3, 59–67. [Google Scholar]
- Huang, L.C. , Jiang, S.Y. Highly fractionated S-type granites from the giant Dahutang tungsten deposit in Jiangnan Orogen, Southeast China: geochronology, petrogenesis and their relationship with W-mineralization. Lithos 2014, 202–203, 207–226. [Google Scholar] [CrossRef]
- Jiangxi Bureau of Geology and Mineral Exploration and Development northwest Jiangxi Brigade. Verification report of tungsten ore resources and reserves in Dawutang mining area, Jing'an County, Jiangxi Province, China, 2016; No published.
- Yang, Y.S. , Pan, X.F., Hou, Z.Q., Deng, Y., Zhang, Z.Y., Fan X.K., Lia, X, Liu, D.W. Petrogenesis and redox state of late Mesozoic granites in the Pingmiao deposit: Implications for the W–Cu–Mo mineralization in the Dahutang district. Ore Geol. Rev. 2022, 145, 104898. [Google Scholar] [CrossRef]
- Le Maitre, R.W. , Bateman, P., Dudek, A., Keller, J., Lameyre, J., Le Bas, M.J., Sabine, P.A., Schmid, R., Sorensen, H., Streckeisen, A., Wooley, A.R., Zanettin, B. In A classification of igneous rocks and glossary of terms; Blackwell, Oxford, 1989; pp. 193.
- Sylvester, P.J. Post-collisional alkaline granites. J. Geol. 1989, 97, 261–280. [Google Scholar] [CrossRef]
- Maniar, P.D. , Piccoli, P.M.. Tectonic discrimination of granitoids. Geol. Soc. Amer. Bull. 1989, 101, 635–643. [Google Scholar] [CrossRef]
- Stanley, C.R. Molar element ratio analysis of lithogeochemical data: a toolbox for use in mineral exploration and mining. Geochemistry: Exploration, Environment, Analysis 2020, 20, 233–256.
- Harlaux, M. , Blein, O., Ballouard, C., Kontak, D.J., Thi´eblemont, D., Dabosville, A., Gourcerol, B. Geochemical footprints of peraluminous rare-metal granites and pegmatites in the northern French Massif Central and implications for exploration targeting. Ore Geol. Rev. 2025, 176, 106409. [Google Scholar] [CrossRef]
- Sun, S.S. , McDonough, W.F. Chemical and isotopic systematics of oceanicbasalts: Implications for mantle composition and processes. Geol. Soc. Lond. Spec. Publ. 1989, 42, 313–345. [Google Scholar] [CrossRef]
- Bau, M. Controls on the fractionation of isovalent trace elements in magmatic and aqueous systems: evidence from Y/Ho, Zr/Hf, and lanthanide tetrad effect. Contrib. Mineral. Petrol. 1996, 123, 323–333. [Google Scholar] [CrossRef]
- Irber, W. The lanthanide tetrad effect and its correlation with K/Rb, Eu/Eu*, Sr/Eu, Y/Ho, and Zr/Hf of evolving peraluminous granite suites. Geochem. Cosmochim. Acta 1999, 63, 489–508. [Google Scholar] [CrossRef]
- Anders, E. , Grevesse, N. Abundances of the elements: meteoritic and solar. Geochem. Cosmochim. Acta 1989, 53, 197–214. [Google Scholar] [CrossRef]
- Breiter, K. , Skoda, R., Uher, P. Nb-Ta-Ti-W-Sn oxide minerals as indicators of a peraluminous P- and F-rich granitic systems evolution: Podlesi, Czech Republic. Mineral. Petrol. 2007, 91, 225–248. [Google Scholar] [CrossRef]
- Ballouard, C. , Poujol, M., Boulvais, P., Branquet, Y., Tart`ese, R., Vigneresse, J. Nb-Ta fractionation in peraluminous granites: a marker of the magmatic-hydrothermal transition. Geology 2016, 44, 231–234. [Google Scholar] [CrossRef]
- Taylor, S. The application of trace element data to problems in petrology. Phys. Chem. Earth 1965, 6, 133–213. [Google Scholar] [CrossRef]
- Rudnick, R.L. , Gao, S. Composition of the Continental Crust. Treatise on Geochemistry, 2014, 2Nd Edition 4, 1–51. [CrossRef]
- Debon, F. , Le Fort, P. A chemical–mineralogical classification of common plutonic rocks and associations. Trans. R. Soc. Edinburgh: Earth Sci. 1983, 73, 135–149. [Google Scholar] [CrossRef]
- Mao, Z.H. , Cheng, Y.B., Liu, J.J., Yuan, S.D., Wu, S.H., Xiang, X.K., Luo, X.H. Geology and molybdenite Re–Os age of the Dahutang granite-related veinlets-disseminated tungsten ore field in the Jiangxin Province, China. Ore Geol. Rev. 2013, 53, 422–433. [Google Scholar] [CrossRef]
- Feng, C. Y, Zhang, D.Q., Xiang, X.K., Li, D.X., Qu, H.Y., Liu, J.N., Xiao, Y. Re-Os isotopic dating of molybdenite from the Dahutang tungsten deposit in northwestern Jiangxi Province and its geological implication. Acta Petrol. Sin. 2012, 28, 3858–3868. [Google Scholar]
- Zhang, Z.H. , Zhang, D., Wu, G.G., Luo, P., Chen, X.H., Di, Y.J., Lü, L.J. Re-Os isotopic age of molybdenite from the Meizikeng molybdenite deposit in Northern Jiangxi Province and its geological significance. J. Jilin Univ. (Earth Sci. Edit.) 2013, 43, 1851–1863. [Google Scholar]
- Li, Q.L. “High-U effect” during SIMS zircon U-Pb dating. Bull. Miner. Petrol. Geochem. 2016, 35, 405–412. [Google Scholar]
- Watson, E.B. , Harrison, T.M. Zircon saturation revisited: Temperature and composition effects in a variety of crustal magma types. Earth Planet. Sci. Lett. 1983, 64, 295–304. [Google Scholar] [CrossRef]
- Miller, C.F. , McDowell, S.M., Mapes, R.W. Hot and cold granites? Implications of zircon saturation temperatures and preservation of inheritance. Geology 2003, 31, 529–532. [Google Scholar] [CrossRef]
- Thompson, A.B. Partial melting of metavolcanics in amphibolite facies regional metamorphism. J. Earth Sys. Sci. 2001, 110, 287–291. [Google Scholar] [CrossRef]
- Patin˜o Douce, A.E. What do experiments tell us about the relative contributions of crust and mantle to the origin of granitic magmas? In Understanding granities: Integrating new and classical techniques; Castro, A., et al., Eds.; Geological Society of London Special Publication: London, 1999; Volume 168, pp. 55–75. [Google Scholar]
- Spear, F.S. Metamorphic phase equilibria and pressure-temperature-time paths. Mineralogical Society of America: Washington, DC, USA, 1995; pp.799.
- Whalen, J. , Currie, K., Chappell, B. A-type granites: geochemical characteristics, discrimination and petrogenesis. Contrib. Mineral. Petrol. 1987, 95, 407–419. [Google Scholar] [CrossRef]
- Taylor, R.P. , Fallick, A.E. The evolution of fluorine-rich felsic magmas: source dichotomy, magmatic convergence and the origins of topaz granite. Terra Nova 1997, 9, 105–108. [Google Scholar] [CrossRef]
- Li, X.H. , Li, Z.X., Li, W.X., Liu, Y., Yuan, C., Wei, G.J., Qi, C.S. U-Pb zircon, geochemical and Sr–Nd–Hf isotopic constraints on age and origin of Jurassic I- andA-type granites from central Guangdong, SE China: A major igneous event in response to foundering of a subducted flat-slab? Lithos 2007, 96, 186–204. [Google Scholar]
- Sylvester, P.J. , Liegeois, J.P. Post-collisional strongly peraluminous granites. Lithos 1998, 45, 29–44. [Google Scholar] [CrossRef]
- Simon, L. , L´ecuyer, C. Continental recycling: the oxygen isotope point of view. Geochem. Geophys. Geosys. 2005, 6, 1–10. [Google Scholar]
- Wei, W.F. , Shen, N.P., Yan, B., Lai, C., Yang, J.H., Gao, W., Liang, F. Petrogenesis of ore-forming granites with implications for W–mineralization in the super-large Shimensi tungsten-dominated polymetallic deposit in northern Jiangxi Province, South China. Ore Geol. Rev. 2018, 95, 1123–1139. [Google Scholar]
- Pearce, J.A. Source and settings of granitic rocks. Episodes 1996, 19, 120–125. [Google Scholar] [CrossRef]
- Wang, X.L. , Zhou, J.C., Griffin, W.L., Zhao, G.C., Yu, J.H., Qiu, J.S., Zhang, Y.J., Xing, G. F. Geochemical zonation across a Neoproterozoic orogenic belt: Isotopic evidence from granitoids and metasedimentary rocks of the Jiangnan orogen, China. Precambram Res. 2014, 242, 154–171.
- Harris, N. , Ayres,M., Massey, J. Geochemistry of graniticmelts produced during the incongruent melting of muscovite: implications for extraction of Himalayan leucogranite magmas. J. Geophys. Res. 1995, 100, 15767–15777. [Google Scholar] [CrossRef]
- Harris, N.B.W. , Inger, S. Trace element modelling of pelite-derived granites. Contrib. Mineral. Petrol. 1992, 110, 46–56. [Google Scholar] [CrossRef]
- Liu, Y.J. , Ma, D.S. The geochemical studies of tungsten built in South China. Sci.China B 1982, 10, 939–950. [Google Scholar]
- Lin, D.S. Tantalum-rich Granite Type Deposits in South China. Geological Publishing House: Beijing, China, 1996; pp. 147.
- Xu, J. W-bearing sedimentary formations and stratabound W-deposits in Jiangxi Province. Geol. Prospect. 1988, 10, 12–18. [Google Scholar]
- Stepanov, A.S. , Hermann, J. Fractionation of Nb and Ta by biotite and phengite: implications for the “missing Nb paradox”. Geology 2013, 41, 303–306. [Google Scholar] [CrossRef]
- Černŷ, P. , Belvin, P.L., Cuney, M., London, D. Granite-related ore deposits. Economic Geology 2005, 100th Anniversary Volume, 337–370. [Google Scholar]
- Bea, F. , Fershtater, G., Corretgé, L.G. The geochemistry of phosphorus in granite rocks and the effect of aluminium. Lithos 1992, 29, 43–56. [Google Scholar] [CrossRef]
- Candela, P.A. , Bouton, S.L. The influence of oxygen fugacity on tungsten and molybdenum partitioning between silicate melts and ilmenite. Econ. Geol. 1990, 85, 633–640. [Google Scholar] [CrossRef]
- Blevin, P.L. Redox and compositional parameters for interpreting the granitoid metallogeny of eastern Australia: implications for gold-rich ore systems. Resour. Geol. 2004, 54, 241–252. [Google Scholar] [CrossRef]
- Ishihara, S. The granitoids series and mineralization. Econ. Geol. 1981, 75th Anniversary Volume, 458–484. [Google Scholar]
- Chen, T.H. On various features of the chemical composition of wolframites in a tungsten-tin deposit in Jiangxi Province. J. Nanjing Univ. (Natural Sci.) 1982, 1, 133–145. [Google Scholar]
- Tan, Y.J. Geochemical types of the vein wolframite deposits in the Nanling region. Geochimica 1982, 2, 155–161. [Google Scholar] [CrossRef]
- Zhao, B. , Li, W.X., Cai, Y.J. Conditions of formation of wolframite, cassiterite, columbite, microlite and tapiolite and experimental studies on the variation of Nb and Ta in wolframite and cassiterite. Geochimica 1977, 2, 123–135. [Google Scholar]
- Baker, T. , Pollard, P.J., Mustard, R., Mark, G., Graham, J.L. A comparison of granite-related tin, tungsten, and gold-bismuth deposits: implications for exploration. SEG Newsletter 2005, 61, 5–17. [Google Scholar]
- Blevin, P.L. , Chappell, B.W. The role of magma sources, oxidation states and fractionation in determining the granite metallogeny of eastern Australia. Trans. Royal Soc. Edinburgh 1992, 83, 305–316. [Google Scholar] [CrossRef]
- Sillitoe, R.H. Porphyry Copper Systems. Econ. Geol. 2010, 105, 3–41. [Google Scholar] [CrossRef]
- Sun, W.D. , Huang, R.F., Li H., Hu, Y.B., Zhang, C.C., Sun, S.J., Zhang, L.P., Ding, X., Li, C.Y., Zartman, R.E., Ling, M.X. Porphyry deposits and oxidized magmas. Ore Geol. Rev. 2015, 65, 97–131. [Google Scholar] [CrossRef]
- Linnen, R.L., Cuney, M. Granite-related rare-element deposits and experimental constraints on Ta-Nb-W- Sn-Zr-Hf mineralization. In Rare-Element Geochemistry and Mineral Deposits; Linnen, R.L., Samson, I.M., Eds.; Geological Association: Canada, 2008; Short Course Notes 17, pp. 45–67. [Google Scholar]
- Zaraisky, G.P. , Korzhinskaya, V., and Kotova, N. Experimental studies of Ta2O5 and columbite–tantalite solubility in fluoride solutions from 300 to 550°C and 50 to100 Mpa. Mineral. Petrol. 2010, 99, 287–300. [Google Scholar] [CrossRef]
- Che, X.D. , Linnen, R.L., Wang, R.C., Aseri, A., Thibault, Y. Tungsten solubility in evolved granitic melts: An evaluation of magmatic wolframite. Geochim. Cosmochim. Acta 2013, 106, 84–98. [Google Scholar] [CrossRef]
- Bali, E. , Keppler, H., Audetat, A. The mobility of W and Mo in subduction zone fluids and the Mo–W–Th–U systematics of island arc magmas. Earth Planet. Sci. Lett. 2012, 351, 195–207. [Google Scholar] [CrossRef]
- Candela, P.A. , Bouton, S.L. The influence of oxygen fugacity on tungsten and molybdenum partitioning between silicate melts and ilmenite. Econ. Geol. 1990, 85, 633–640. [Google Scholar] [CrossRef]
- Pollard, P.J. Geologic characteristics and genetic problems associated with the development of granite-hosted deposits of tantalum and niobium. In Lanthanides, Tantalum and Niobium; Möller, P., Cerny, P., Saupe, F., Eds.; Springer New York: Berlin Heidelberg, 1989; pp. 240–256. [Google Scholar]
- Schwartz, M.O. Geochemical criteria for distinguishing magmatic and metasomatic albite-enrichment in granitoids: examples from the Ta–Li granite Yichun (China) and the Sn–W deposit Tikus (Indonesia). Mineral. Deposita 1992, 27, 101–108. [Google Scholar] [CrossRef]
- Helba, H. , Trumbull, R.B., Morteani, G., Khalil, S.O., Arslan, A. Geochemical and petrographic studies of Ta mineralization in the Nuweibi albite granite complex, Eastern Desert, Egypt. Miner. Deposita 1997, 32, 164–179. [Google Scholar] [CrossRef]
- Wu, F. , Sun, D., Huimin, L., Jahn, B., Wilds, S. A-type granites in northeastern China: age and geochemical constraints on their petrogenesis. Chem. Geol. 2002, 187, 143–173. [Google Scholar] [CrossRef]
- Clarke, D.B. The mineralogy of peraluminous granites: a review. Can. Mineral. 1992, 19, 3–17. [Google Scholar]
- Shearer, C. , Papike, J., Laul, J. Chemistry of potassium feldspars from three zoned pegmatites, Black Hills, South Dakota: implications concerning pegmatite evolution. Geochem. Cosmochim. Acta 1985, 49, 663–673. [Google Scholar] [CrossRef]
- Zaraisky, G.P. , Aksyuk, A.M., Devyatova, V.N., Udoratina, O.V., Chevychelov, V.Y. The Zr/Hf ratio as a fractionation indicator of rare-metal granites. Petrology 2009, 17, 25–45. [Google Scholar] [CrossRef]

| Sample | mining section | lithology | mineral | analysis |
|---|---|---|---|---|
| SM-34 | Shimengsi mining area | Biotite granite (G1) | wolframite | EMPA major element analysis |
| 14SWD-1 | Shiweidong mining area | Two-mica granite (G2) | wolframite | EMPA major element analysis |
| monazite | LA-ICP-MS U-Pb dating | |||
| 14PM-5 | Dawutang mining area | Moscovite granite (G3) | monazite | LA-ICP-MS U-Pb dating |
| 14PM-8 | Dawutang mining area | Porphyry two-mica granite(G2) | zircon | LA-ICP-MS U-Pb dating |
| 14YKD-1 | Dawutang mining area | Two-mica granite(G2) | wolframite | EMPA major element analysis |
| monazite | LA-ICP-MS U-Pb dating | |||
| 14YSD-3-1 | Kunshan mining area | Biotite granite (G1) | wolframite | EMPA major element analysis |
| monazite | LA-ICP-MS U-Pb dating | |||
| 14YSD-3-2 | Kunshan mining area | Biotite granite (G1) | monazite | LA-ICP-MS U-Pb dating |
| Mineral/sample | Isotope ratios (207Pb/206Pb =0.461±0.02) | Age, Ma | ||||||||||||||||||||||
|---|---|---|---|---|---|---|---|---|---|---|---|---|---|---|---|---|---|---|---|---|---|---|---|---|
| monazite/14PM-5 (Dawutang mining area) |
206Pb/238U | 1σ | 207Pb/235U | 1σ | 207Pb/206Pb | 1σ | 206Pb/238U | 1σ | ||||||||||||||||
| 1 | 0.0249 | 0.0003 | 0.3097 | 0.0081 | 0.0903 | 0.0018 | 143 | 2 | ||||||||||||||||
| 3 | 0.0229 | 0.0002 | 0.1617 | 0.0037 | 0.0512 | 0.0008 | 145 | 2 | ||||||||||||||||
| 5 | 0.0226 | 0.0002 | 0.1452 | 0.0052 | 0.0467 | 0.0015 | 145 | 2 | ||||||||||||||||
| 6 | 0.0234 | 0.0002 | 0.1970 | 0.0049 | 0.0612 | 0.0012 | 144 | 2 | ||||||||||||||||
| 7 | 0.0278 | 0.0003 | 0.5021 | 0.0111 | 0.1312 | 0.0021 | 142 | 2 | ||||||||||||||||
| 8 | 0.0226 | 0.0002 | 0.1554 | 0.0048 | 0.0500 | 0.0013 | 143 | 2 | ||||||||||||||||
| 9 | 0.0226 | 0.0002 | 0.1540 | 0.0061 | 0.0495 | 0.0018 | 144 | 2 | ||||||||||||||||
| 10 | 0.0228 | 0.0002 | 0.1752 | 0.0055 | 0.0556 | 0.0015 | 143 | 2 | ||||||||||||||||
| 11 | 0.0236 | 0.0003 | 0.2027 | 0.0084 | 0.0624 | 0.0023 | 145 | 2 | ||||||||||||||||
| 12 | 0.0232 | 0.0002 | 0.1680 | 0.0040 | 0.0526 | 0.0010 | 146 | 2 | ||||||||||||||||
| 14 | 0.0225 | 0.0002 | 0.1600 | 0.0043 | 0.0516 | 0.0012 | 142 | 2 | ||||||||||||||||
| 16 | 0.0232 | 0.0002 | 0.1894 | 0.0067 | 0.0592 | 0.0019 | 144 | 2 | ||||||||||||||||
| 17 | 0.0227 | 0.0002 | 0.1601 | 0.0041 | 0.0512 | 0.0011 | 144 | 2 | ||||||||||||||||
| 18 | 0.0225 | 0.0002 | 0.1443 | 0.0057 | 0.0464 | 0.0017 | 145 | 2 | ||||||||||||||||
| 19 | 0.0224 | 0.0002 | 0.1509 | 0.0042 | 0.0489 | 0.0011 | 143 | 2 | ||||||||||||||||
| 20 | 0.0221 | 0.0002 | 0.1522 | 0.0047 | 0.0500 | 0.0014 | 140 | 2 | ||||||||||||||||
| 21 | 0.0225 | 0.0002 | 0.1670 | 0.0050 | 0.0538 | 0.0014 | 142 | 2 | ||||||||||||||||
| 22 | 0.0223 | 0.0002 | 0.1543 | 0.0039 | 0.0502 | 0.0010 | 142 | 2 | ||||||||||||||||
| 23 | 0.0236 | 0.0002 | 0.2053 | 0.0049 | 0.0630 | 0.0012 | 145 | 2 | ||||||||||||||||
| 24 | 0.0220 | 0.0002 | 0.1569 | 0.0044 | 0.0516 | 0.0012 | 140 | 1 | ||||||||||||||||
| 25 | 0.0231 | 0.0003 | 0.1746 | 0.0071 | 0.0548 | 0.0021 | 145 | 2 | ||||||||||||||||
| 26 | 0.0235 | 0.0002 | 0.2011 | 0.0044 | 0.0620 | 0.0010 | 145 | 2 | ||||||||||||||||
| 27 | 0.0220 | 0.0002 | 0.1629 | 0.0053 | 0.0537 | 0.0015 | 139 | 2 | ||||||||||||||||
| 28 | 0.0229 | 0.0002 | 0.1877 | 0.0067 | 0.0595 | 0.0019 | 142 | 2 | ||||||||||||||||
| 29 | 0.0232 | 0.0002 | 0.1871 | 0.0063 | 0.0585 | 0.0017 | 144 | 2 | ||||||||||||||||
| 30 | 0.0225 | 0.0003 | 0.1838 | 0.0082 | 0.0593 | 0.0021 | 140 | 2 | ||||||||||||||||
| 31 | 0.0220 | 0.0002 | 0.1486 | 0.0049 | 0.0489 | 0.0014 | 141 | 2 | ||||||||||||||||
| 32 | 0.0217 | 0.0002 | 0.1618 | 0.0048 | 0.0541 | 0.0014 | 136 | 1 | ||||||||||||||||
| Mineral/sample | Isotope ratios (207Pb/206Pb =0.91±0.09) | Age, Ma | ||||||||||||||||||||||
|
monazite/14YKD-1 (Dawutang mining area) |
206Pb/238U | 1σ | 207Pb/235U | 1σ | 207Pb/206Pb | 1σ | 206Pb/238U | 1σ | ||||||||||||||||
| 1 | 0.0230 | 0.0003 | 0.1713 | 0.0141 | 0.0539 | 0.0044 | 146 | 2 | ||||||||||||||||
| 2 | 0.0228 | 0.0003 | 0.1558 | 0.0085 | 0.0495 | 0.0025 | 145 | 2 | ||||||||||||||||
| 3 | 0.0223 | 0.0002 | 0.1518 | 0.0034 | 0.0494 | 0.0008 | 142 | 1 | ||||||||||||||||
| 4 | 0.0227 | 0.0002 | 0.2220 | 0.0052 | 0.0709 | 0.0013 | 141 | 2 | ||||||||||||||||
| 5 | 0.0226 | 0.0002 | 0.1556 | 0.0048 | 0.0499 | 0.0014 | 144 | 2 | ||||||||||||||||
| 6 | 0.0226 | 0.0002 | 0.1497 | 0.0069 | 0.0481 | 0.0021 | 144 | 2 | ||||||||||||||||
| 7 | 0.0222 | 0.0002 | 0.1622 | 0.0038 | 0.0531 | 0.0010 | 141 | 1 | ||||||||||||||||
| 8 | 0.0220 | 0.0002 | 0.1484 | 0.0033 | 0.0490 | 0.0008 | 140 | 1 | ||||||||||||||||
| 9 | 0.0229 | 0.0002 | 0.1943 | 0.0078 | 0.0615 | 0.0023 | 144 | 2 | ||||||||||||||||
| 10 | 0.0233 | 0.0003 | 0.2844 | 0.0219 | 0.0886 | 0.0066 | 142 | 2 | ||||||||||||||||
| 11 | 0.0229 | 0.0002 | 0.1579 | 0.0048 | 0.0500 | 0.0013 | 146 | 2 | ||||||||||||||||
| 12 | 0.0241 | 0.0003 | 0.4246 | 0.0115 | 0.1276 | 0.0029 | 140 | 2 | ||||||||||||||||
| 13 | 0.0217 | 0.0002 | 0.1467 | 0.0036 | 0.0490 | 0.0010 | 138 | 1 | ||||||||||||||||
| 15 | 0.0224 | 0.0003 | 0.1607 | 0.0088 | 0.0520 | 0.0027 | 142 | 2 | ||||||||||||||||
| 16 | 0.0224 | 0.0003 | 0.2231 | 0.0182 | 0.0722 | 0.0059 | 139 | 2 | ||||||||||||||||
| 17 | 0.0215 | 0.0002 | 0.1627 | 0.0049 | 0.0548 | 0.0014 | 136 | 1 | ||||||||||||||||
| 18 | 0.0219 | 0.0002 | 0.1510 | 0.0112 | 0.0500 | 0.0036 | 139 | 2 | ||||||||||||||||
| 19 | 0.0222 | 0.0002 | 0.1794 | 0.0059 | 0.0585 | 0.0017 | 140 | 1 | ||||||||||||||||
| 20 | 0.0219 | 0.0002 | 0.1654 | 0.0091 | 0.0549 | 0.0029 | 138 | 2 | ||||||||||||||||
| 21 | 0.0213 | 0.0002 | 0.1420 | 0.0032 | 0.0483 | 0.0008 | 136 | 1 | ||||||||||||||||
| 22 | 0.0215 | 0.0002 | 0.1474 | 0.0080 | 0.0497 | 0.0026 | 137 | 2 | ||||||||||||||||
| 23 | 0.0220 | 0.0002 | 0.1580 | 0.0104 | 0.0522 | 0.0033 | 139 | 2 | ||||||||||||||||
| 24 | 0.0223 | 0.0002 | 0.2078 | 0.0171 | 0.0674 | 0.0054 | 139 | 2 | ||||||||||||||||
| 25 | 0.0225 | 0.0002 | 0.1811 | 0.0096 | 0.0584 | 0.0030 | 142 | 2 | ||||||||||||||||
| 27 | 0.0224 | 0.0003 | 0.1659 | 0.0155 | 0.0536 | 0.0049 | 142 | 2 | ||||||||||||||||
| 28 | 0.0217 | 0.0002 | 0.1619 | 0.0039 | 0.0541 | 0.0010 | 138 | 1 | ||||||||||||||||
| 30 | 0.0217 | 0.0002 | 0.1522 | 0.0055 | 0.0507 | 0.0017 | 138 | 1 | ||||||||||||||||
| 31 | 0.0221 | 0.0002 | 0.1638 | 0.0121 | 0.0537 | 0.0038 | 140 | 2 | ||||||||||||||||
| 32 | 0.0220 | 0.0002 | 0.1899 | 0.0052 | 0.0627 | 0.0014 | 138 | 1 | ||||||||||||||||
| Mineral/sample | Content(ppm) | Isotope ratios | Age, Ma | |||||||||||||||||||||
|
zircon/14PM-8 (Dawutang mining area) |
Th | U | 206Pb/238U | 1σ | 207Pb/235U | 1σ | 207Pb/206Pb | 1σ | 206Pb/238U | 1σ | ||||||||||||||
| 1 | 141 | 2190 | 0.0222 | 0.0002 | 0.1497 | 0.0023 | 0.0490 | 0.0007 | 141 | 2 | ||||||||||||||
| 6 | 191 | 2734 | 0.0217 | 0.0002 | 0.1546 | 0.0022 | 0.0517 | 0.0007 | 138 | 1 | ||||||||||||||
| 7 | 393 | 574 | 0.0224 | 0.0002 | 0.1589 | 0.0054 | 0.0515 | 0.0017 | 143 | 1 | ||||||||||||||
| 8 | 113 | 5484 | 0.0216 | 0.0002 | 0.1503 | 0.0022 | 0.0505 | 0.0006 | 138 | 1 | ||||||||||||||
| 9 | 236 | 4014 | 0.0223 | 0.0002 | 0.1569 | 0.0023 | 0.0511 | 0.0007 | 142 | 1 | ||||||||||||||
| 10 | 1061 | 6327 | 0.0222 | 0.0002 | 0.1738 | 0.0026 | 0.0567 | 0.0008 | 142 | 2 | ||||||||||||||
| 11 | 99 | 5639 | 0.0222 | 0.0002 | 0.1805 | 0.0028 | 0.0589 | 0.0008 | 142 | 1 | ||||||||||||||
| 15 | 33 | 1722 | 0.0217 | 0.0002 | 0.1466 | 0.0023 | 0.0490 | 0.0007 | 138 | 1 | ||||||||||||||
| 16 | 81 | 1276 | 0.0218 | 0.0002 | 0.1510 | 0.0032 | 0.0501 | 0.0010 | 139 | 1 | ||||||||||||||
| Mineral/sample | Isotope ratios(207Pb/206Pb =0.542±0.093) | Age, Ma | ||||||||||||||||||||||
|
monazite/14SWD-1 (Shiweidong mining area) |
206Pb/238U | 1σ | 207Pb/235U | 1σ | 207Pb/206Pb | 1σ | 206Pb/238U | 1σ | ||||||||||||||||
| 1 | 0.0222 | 0.0002 | 0.1494 | 0.0032 | 0.0488 | 0.0008 | 142 | 2 | ||||||||||||||||
| 2 | 0.0217 | 0.0002 | 0.1990 | 0.0045 | 0.0666 | 0.0010 | 133 | 1 | ||||||||||||||||
| 3 | 0.0217 | 0.0002 | 0.1475 | 0.0032 | 0.0493 | 0.0008 | 138 | 1 | ||||||||||||||||
| 4 | 0.0217 | 0.0002 | 0.1456 | 0.0031 | 0.0487 | 0.0007 | 138 | 1 | ||||||||||||||||
| 6 | 0.0217 | 0.0002 | 0.1773 | 0.0061 | 0.0593 | 0.0018 | 135 | 1 | ||||||||||||||||
| 7 | 0.0223 | 0.0002 | 0.1655 | 0.0056 | 0.0538 | 0.0016 | 141 | 2 | ||||||||||||||||
| 8 | 0.0220 | 0.0002 | 0.1513 | 0.0041 | 0.0499 | 0.0011 | 140 | 2 | ||||||||||||||||
| 9 | 0.0215 | 0.0002 | 0.1474 | 0.0053 | 0.0497 | 0.0016 | 137 | 1 | ||||||||||||||||
| 10 | 0.0212 | 0.0002 | 0.1470 | 0.0032 | 0.0502 | 0.0008 | 135 | 1 | ||||||||||||||||
| 11 | 0.0214 | 0.0002 | 0.1431 | 0.0032 | 0.0484 | 0.0008 | 137 | 1 | ||||||||||||||||
| 12 | 0.0209 | 0.0002 | 0.1463 | 0.0057 | 0.0507 | 0.0018 | 133 | 2 | ||||||||||||||||
| 13 | 0.0218 | 0.0002 | 0.1467 | 0.0062 | 0.0487 | 0.0019 | 139 | 2 | ||||||||||||||||
| 14 | 0.0212 | 0.0002 | 0.1471 | 0.0031 | 0.0504 | 0.0008 | 134 | 1 | ||||||||||||||||
| 15 | 0.0221 | 0.0002 | 0.1609 | 0.0046 | 0.0528 | 0.0013 | 140 | 2 | ||||||||||||||||
| 16 | 0.0217 | 0.0002 | 0.1541 | 0.0036 | 0.0515 | 0.0009 | 138 | 1 | ||||||||||||||||
| 17 | 0.0215 | 0.0002 | 0.1598 | 0.0051 | 0.0540 | 0.0015 | 135 | 1 | ||||||||||||||||
| 18 | 0.0210 | 0.0002 | 0.1407 | 0.0031 | 0.0485 | 0.0008 | 134 | 1 | ||||||||||||||||
| 19 | 0.0212 | 0.0002 | 0.1544 | 0.0044 | 0.0529 | 0.0013 | 134 | 1 | ||||||||||||||||
| 20 | 0.0211 | 0.0002 | 0.1535 | 0.0041 | 0.0529 | 0.0012 | 133 | 1 | ||||||||||||||||
| 21 | 0.0213 | 0.0002 | 0.1496 | 0.0039 | 0.0509 | 0.0011 | 135 | 1 | ||||||||||||||||
| 22 | 0.0213 | 0.0002 | 0.1474 | 0.0034 | 0.0501 | 0.0009 | 136 | 1 | ||||||||||||||||
| 23 | 0.0213 | 0.0002 | 0.1496 | 0.0043 | 0.0510 | 0.0013 | 135 | 1 | ||||||||||||||||
| 24 | 0.0218 | 0.0002 | 0.1558 | 0.0045 | 0.0519 | 0.0013 | 138 | 1 | ||||||||||||||||
| 25 | 0.0216 | 0.0002 | 0.1531 | 0.0047 | 0.0515 | 0.0014 | 137 | 1 | ||||||||||||||||
| 26 | 0.0252 | 0.0003 | 0.3988 | 0.0139 | 0.1150 | 0.0031 | 139 | 5 | ||||||||||||||||
| 27 | 0.0213 | 0.0002 | 0.1524 | 0.0059 | 0.0520 | 0.0018 | 135 | 1 | ||||||||||||||||
| 28 | 0.0217 | 0.0002 | 0.1577 | 0.0082 | 0.0527 | 0.0026 | 137 | 2 | ||||||||||||||||
| 29 | 0.0220 | 0.0002 | 0.1504 | 0.0043 | 0.0496 | 0.0012 | 140 | 2 | ||||||||||||||||
| 31 | 0.0221 | 0.0002 | 0.1492 | 0.0043 | 0.0490 | 0.0012 | 141 | 2 | ||||||||||||||||
| 32 | 0.0216 | 0.0002 | 0.1470 | 0.0032 | 0.0493 | 0.0008 | 138 | 1 | ||||||||||||||||
| Mineral/sample | Isotope ratios(207Pb/206Pb =0.84±0.12) | Age, Ma | ||||||||||||||||||||||
|
monazite/14YSD-3-1 (Kunshan mining area) |
206Pb/238U | 1σ | 207Pb/235U | 1σ | 207Pb/206Pb | 1σ | 206Pb/238U | 1σ | ||||||||||||||||
| 1 | 0.0235 | 0.0002 | 0.1803 | 0.0062 | 0.0557 | 0.0017 | 148 | 1 | ||||||||||||||||
| 2 | 0.0236 | 0.0002 | 0.1605 | 0.0073 | 0.0493 | 0.0021 | 150 | 2 | ||||||||||||||||
| 3 | 0.0237 | 0.0002 | 0.1544 | 0.0082 | 0.0472 | 0.0024 | 151 | 2 | ||||||||||||||||
| 4 | 0.0236 | 0.0002 | 0.1705 | 0.0079 | 0.0524 | 0.0023 | 150 | 2 | ||||||||||||||||
| 5 | 0.0235 | 0.0002 | 0.1636 | 0.0044 | 0.0505 | 0.0011 | 150 | 2 | ||||||||||||||||
| 6 | 0.0234 | 0.0002 | 0.1570 | 0.0078 | 0.0487 | 0.0023 | 149 | 2 | ||||||||||||||||
| 7 | 0.0235 | 0.0002 | 0.1814 | 0.0089 | 0.0559 | 0.0026 | 149 | 2 | ||||||||||||||||
| 8 | 0.0240 | 0.0002 | 0.1796 | 0.0079 | 0.0544 | 0.0023 | 152 | 2 | ||||||||||||||||
| 9 | 0.0235 | 0.0002 | 0.1595 | 0.0067 | 0.0492 | 0.0019 | 150 | 2 | ||||||||||||||||
| 10 | 0.0235 | 0.0002 | 0.1820 | 0.0068 | 0.0562 | 0.0019 | 148 | 2 | ||||||||||||||||
| 11 | 0.0238 | 0.0002 | 0.1750 | 0.0091 | 0.0534 | 0.0027 | 151 | 2 | ||||||||||||||||
| 12 | 0.0238 | 0.0002 | 0.1649 | 0.0068 | 0.0503 | 0.0019 | 151 | 2 | ||||||||||||||||
| 13 | 0.0236 | 0.0003 | 0.1654 | 0.0112 | 0.0508 | 0.0033 | 150 | 2 | ||||||||||||||||
| 14 | 0.0237 | 0.0002 | 0.1616 | 0.0049 | 0.0495 | 0.0013 | 151 | 2 | ||||||||||||||||
| 15 | 0.0239 | 0.0002 | 0.1765 | 0.0066 | 0.0536 | 0.0018 | 151 | 2 | ||||||||||||||||
| 16 | 0.0236 | 0.0003 | 0.1926 | 0.0143 | 0.0591 | 0.0042 | 149 | 2 | ||||||||||||||||
| 17 | 0.0234 | 0.0002 | 0.1787 | 0.0085 | 0.0553 | 0.0025 | 148 | 2 | ||||||||||||||||
| 18 | 0.0236 | 0.0002 | 0.1582 | 0.0091 | 0.0486 | 0.0027 | 151 | 2 | ||||||||||||||||
| 19 | 0.0232 | 0.0002 | 0.1624 | 0.0101 | 0.0508 | 0.0031 | 147 | 2 | ||||||||||||||||
| 20 | 0.0234 | 0.0003 | 0.1681 | 0.0057 | 0.0522 | 0.0016 | 148 | 2 | ||||||||||||||||
| 21 | 0.0236 | 0.0002 | 0.2125 | 0.0119 | 0.0653 | 0.0035 | 147 | 2 | ||||||||||||||||
| 22 | 0.0237 | 0.0002 | 0.1629 | 0.0044 | 0.0498 | 0.0011 | 151 | 2 | ||||||||||||||||
| 23 | 0.0236 | 0.0002 | 0.1617 | 0.0102 | 0.0497 | 0.0030 | 150 | 2 | ||||||||||||||||
| 24 | 0.0235 | 0.0002 | 0.1578 | 0.0049 | 0.0486 | 0.0013 | 150 | 2 | ||||||||||||||||
| 25 | 0.0237 | 0.0003 | 0.1912 | 0.0097 | 0.0585 | 0.0028 | 149 | 2 | ||||||||||||||||
| 26 | 0.0240 | 0.0002 | 0.1726 | 0.0092 | 0.0522 | 0.0026 | 152 | 2 | ||||||||||||||||
| 27 | 0.0231 | 0.0002 | 0.1571 | 0.0035 | 0.0494 | 0.0008 | 147 | 2 | ||||||||||||||||
| 28 | 0.0236 | 0.0002 | 0.1832 | 0.0059 | 0.0562 | 0.0016 | 149 | 2 | ||||||||||||||||
| 29 | 0.0236 | 0.0002 | 0.1772 | 0.0098 | 0.0544 | 0.0029 | 149 | 2 | ||||||||||||||||
| 30 | 0.0238 | 0.0003 | 0.1690 | 0.0216 | 0.0515 | 0.0067 | 151 | 2 | ||||||||||||||||
| 31 | 0.0233 | 0.0003 | 0.1751 | 0.0114 | 0.0544 | 0.0034 | 148 | 2 | ||||||||||||||||
| 32 | 0.0231 | 0.0002 | 0.1499 | 0.0099 | 0.0470 | 0.0030 | 148 | 2 | ||||||||||||||||
| Mineral/sample | Isotope ratios(207Pb/206Pb =0.509±0.052) | Age, Ma | ||||||||||||||||||||||
|
monazite/14YSD-3-2 (Kunshan mining area) |
206Pb/238U | 1σ | 207Pb/235U | 1σ | 207Pb/206Pb | 1σ | 206Pb/238U | 1σ | ||||||||||||||||
| 1 | 0.0238 | 0.0002 | 0.1716 | 0.0048 | 0.0522 | 0.0012 | 151 | 2 | ||||||||||||||||
| 2 | 0.0245 | 0.0003 | 0.2090 | 0.0093 | 0.0620 | 0.0025 | 151 | 2 | ||||||||||||||||
| 3 | 0.0245 | 0.0003 | 0.1784 | 0.0096 | 0.0529 | 0.0027 | 155 | 2 | ||||||||||||||||
| 4 | 0.0251 | 0.0003 | 0.1774 | 0.0081 | 0.0513 | 0.0022 | 159 | 2 | ||||||||||||||||
| 5 | 0.0268 | 0.0003 | 0.3739 | 0.0103 | 0.1013 | 0.0022 | 151 | 3 | ||||||||||||||||
| 6 | 0.0246 | 0.0003 | 0.1832 | 0.0073 | 0.0540 | 0.0020 | 155 | 2 | ||||||||||||||||
| 7 | 0.0245 | 0.0003 | 0.1638 | 0.0093 | 0.0485 | 0.0026 | 156 | 2 | ||||||||||||||||
| 8 | 0.0248 | 0.0003 | 0.1743 | 0.0077 | 0.0509 | 0.0021 | 157 | 2 | ||||||||||||||||
| 9 | 0.0243 | 0.0002 | 0.1798 | 0.0066 | 0.0536 | 0.0018 | 153 | 2 | ||||||||||||||||
| 10 | 0.0243 | 0.0003 | 0.1908 | 0.0093 | 0.0569 | 0.0026 | 152 | 2 | ||||||||||||||||
| 11 | 0.0248 | 0.0003 | 0.2032 | 0.0076 | 0.0595 | 0.0020 | 154 | 2 | ||||||||||||||||
| 12 | 0.0237 | 0.0003 | 0.1745 | 0.0088 | 0.0533 | 0.0025 | 150 | 2 | ||||||||||||||||
| 13 | 0.0238 | 0.0002 | 0.1766 | 0.0055 | 0.0537 | 0.0015 | 150 | 2 | ||||||||||||||||
| 14 | 0.0308 | 0.0003 | 0.6241 | 0.0196 | 0.1472 | 0.0039 | 154 | 5 | ||||||||||||||||
| 15 | 0.0241 | 0.0003 | 0.2045 | 0.0091 | 0.0615 | 0.0025 | 149 | 2 | ||||||||||||||||
| 16 | 0.0238 | 0.0002 | 0.1659 | 0.0049 | 0.0506 | 0.0012 | 151 | 2 | ||||||||||||||||
| 17 | 0.0244 | 0.0003 | 0.2012 | 0.0168 | 0.0598 | 0.0050 | 152 | 2 | ||||||||||||||||
| 18 | 0.0248 | 0.0002 | 0.1833 | 0.0050 | 0.0537 | 0.0012 | 156 | 2 | ||||||||||||||||
| 19 | 0.0239 | 0.0002 | 0.1647 | 0.0061 | 0.0499 | 0.0017 | 152 | 2 | ||||||||||||||||
| 20 | 0.0241 | 0.0002 | 0.1611 | 0.0066 | 0.0485 | 0.0018 | 154 | 2 | ||||||||||||||||
| 21 | 0.0235 | 0.0002 | 0.1657 | 0.0041 | 0.0512 | 0.0010 | 149 | 2 | ||||||||||||||||
| 22 | 0.0234 | 0.0002 | 0.1611 | 0.0043 | 0.0499 | 0.0011 | 149 | 2 | ||||||||||||||||
| 23 | 0.0237 | 0.0002 | 0.1766 | 0.0078 | 0.0541 | 0.0022 | 149 | 2 | ||||||||||||||||
| 24 | 0.0240 | 0.0002 | 0.1735 | 0.0044 | 0.0524 | 0.0010 | 152 | 2 | ||||||||||||||||
| 25 | 0.0248 | 0.0003 | 0.2378 | 0.0091 | 0.0696 | 0.0024 | 151 | 2 | ||||||||||||||||
| 26 | 0.0240 | 0.0003 | 0.1753 | 0.0087 | 0.0530 | 0.0025 | 152 | 2 | ||||||||||||||||
| 28 | 0.0238 | 0.0003 | 0.1696 | 0.0165 | 0.0516 | 0.0050 | 151 | 2 | ||||||||||||||||
| 29 | 0.0238 | 0.0002 | 0.2186 | 0.0079 | 0.0665 | 0.0022 | 146 | 2 | ||||||||||||||||
| 30 | 0.0232 | 0.0002 | 0.1705 | 0.0083 | 0.0533 | 0.0024 | 146 | 2 | ||||||||||||||||
| 31 | 0.0235 | 0.0002 | 0.1806 | 0.0089 | 0.0557 | 0.0026 | 148 | 2 | ||||||||||||||||
| 32 | 0.0237 | 0.0003 | 0.1899 | 0.0106 | 0.0581 | 0.0031 | 148 | 2 | ||||||||||||||||
| sample | WO3 | FeO | MnO | CaO | MgO | Ta2O5 | Nb2O5 | MoO3 | PbO | Total | Crystal chemical formula | |
|---|---|---|---|---|---|---|---|---|---|---|---|---|
| Shimengsi mining area G1 (~150 Ma) |
SM-34@1-1 | 76.44 | 16.32 | 8.22 | 0.03 | 0.09 | 0.47 | 0 | 0.14 | 0.11 | 101.83 | (Fe0. 69,Mn0.35)1.04W1.01O4 |
| SM-34@1-3 | 76.42 | 14.19 | 10.31 | 0.03 | 0.01 | 0.61 | 0 | 0.09 | 0.17 | 101.84 | (Fe0.60,Mn0.44)1.04W1.01O4 | |
| SM-34@1-4 | 74.41 | 17.70 | 6.26 | 0.03 | 0.14 | 0.54 | 0.05 | 0.15 | 0.13 | 99.42 | (Fe0.75,Mn0.27)1.02W0.98O4 | |
| SM-34@1-6 | 76.58 | 15.80 | 8.98 | 0.03 | 0.03 | 0.38 | 0.02 | 0.06 | 0.15 | 102.04 | (Fe0.67,Mn0.38)1.05W1.01O4 | |
| SM-34@1-7 | 77.06 | 16.22 | 8.20 | 0.03 | 0.07 | 0.55 | 0 | 0.17 | 0.04 | 102.35 | (Fe0.69,Mn0.35)1.04W1.01O4 | |
| SM-34@1-8 | 76.15 | 17.30 | 7.17 | 0.03 | 0.14 | 0.51 | 0 | 0.23 | 0.18 | 101.70 | (Fe0.73,Mn0.31)1.04W1.00O4 | |
| SM-34@1-9 | 76.19 | 16.37 | 8.27 | 0.04 | 0.08 | 0.50 | 0.07 | 0.19 | 0.12 | 101.82 | (Fe0.69,Mn0.35)1.04W1.01O4 | |
| SM-34@1-10 | 76.14 | 16.07 | 8.45 | 0.03 | 0 | 0.51 | 0.05 | 0.19 | 0.07 | 101.51 | (Fe0.68,Mn0.36)1.04W1.00O4 | |
| SM-34@1-11 | 75.99 | 17.33 | 7.29 | 0.02 | 0.06 | 0.64 | 0.08 | 0.16 | 0.13 | 101.69 | (Fe0.73,Mn0.31)1.04W1.00O4 | |
| SM-34@1-12 | 76.05 | 16.56 | 8.06 | 0.02 | 0.16 | 0.50 | 0.02 | 0.03 | 0.12 | 101.53 | (Fe0.70,Mn0.34)1.04W1.00O4 | |
| SM-34@1-13 | 76.34 | 16.75 | 8.10 | 0.02 | 0 | 0.54 | 0.05 | 0.08 | 0.24 | 102.12 | (Fe0.71,Mn0.35)1.05W1.01O4 | |
| SM-34@1-14 | 76.07 | 16.23 | 8.20 | 0.03 | 0 | 0.54 | 0.03 | 0.11 | 0.14 | 101.38 | (Fe0.69,Mn0.35)1.04W1.00O4 | |
| SM-34@1-15 | 75.13 | 16.92 | 7.41 | 0.07 | 0.11 | 0.52 | 0.02 | 0.30 | 0.10 | 100.56 | (Fe0.72,Mn0.32)1.04W0.99O4 | |
| SM-34@1-16 | 76.28 | 16.50 | 8.04 | 0.03 | 0.05 | 0.50 | 0.05 | 0.22 | 0.10 | 101.76 | (Fe0.70,Mn0.34)1.04W1.01O4 | |
| SM-34@1-17 | 76.92 | 16.78 | 7.85 | 0.01 | 0.07 | 0.55 | 0.04 | 0.18 | 0.11 | 102.52 | (Fe0.71,Mn0.34)1.05W1.01O4 | |
| SM-34@1-18 | 76.55 | 18.54 | 5.83 | 0.08 | 0.04 | 0.51 | 0 | 0.01 | 0.14 | 101.71 | (Fe0.78,Mn0.25)1.03W1.01O4 | |
| SM-34@1-19 | 75.95 | 17.70 | 7.14 | 0.03 | 0.10 | 0.43 | 0 | 0.19 | 0.21 | 101.74 | (Fe0.75,Mn0.30)1.05W1.00O4 | |
| SM-34@1-20 | 76.10 | 16.83 | 7.51 | 0.03 | 0.09 | 0.44 | 0.06 | 0.12 | 0.19 | 101.36 | (Fe0.71,Mn0.32)1.03W1.00O4 | |
| Kunshan mining area G1 (~150 Ma) |
14YSD-3-1@0-1 | 76.66 | 18.28 | 5.65 | 0.01 | 0.23 | 0.51 | 0 | 0.20 | 0.20 | 101.75 | (Fe0.77,Mn0.24)1.01W1.01O4 |
| 14YSD-3-1@0-2 | 75.91 | 18.06 | 5.92 | 0.04 | 0.24 | 0.42 | 0 | 0.15 | 0.14 | 100.87 | (Fe0.76,Mn0.25)1.01W1.00O4 | |
| 14YSD-3-1@0-3 | 76.06 | 16.74 | 7.35 | 0.03 | 0.22 | 0.37 | 0.03 | 0.14 | 0.15 | 101.09 | (Fe0.71,Mn0.31)1.02W1.00O4 | |
| 14YSD-3-1@0-4 | 75.91 | 18.16 | 6.31 | 0.01 | 0.170 | 0.40 | 0.01 | 0.18 | 0.28 | 101.43 | (Fe0.77,Mn0.27)1.04W1.00O4 | |
| 14YSD-3-1@0-5 | 75.98 | 16.94 | 7.11 | 0.02 | 0.28 | 0.42 | 0.04 | 0.25 | 0.16 | 101.22 | (Fe0.72,Mn0.30)1.02W1.00O4 | |
| 14YSD-3-1@1-1 | 75.65 | 18.53 | 6.02 | 0.06 | 0.20 | 0.51 | 0.08 | 0.11 | 0.16 | 101.40 | (Fe0.78,Mn0.26)1.04W1.00O4 | |
| 14YSD-5-1@1-2 | 76.24 | 18.01 | 6.02 | 0.04 | 0.14 | 0.50 | 0.02 | 0.14 | 0.23 | 101.34 | (Fe0.76,Mn0.26)1.02W1.00O4 | |
| 14YSD-3-1@1-3 | 75.44 | 18.34 | 6.03 | 0.04 | 0.24 | 0.46 | 0.03 | 0.22 | 0.12 | 100.92 | (Fe0.78,Mn0.26)1.04W0.99O4 | |
| 14YSD-3-1@1-4 | 75.80 | 18.27 | 5.88 | 0.10 | 0.20 | 0.43 | 0 | 0.19 | 0.12 | 100.99 | (Fe0.77,Mn0.25)1.02W1.00O4 | |
| 14YSD-3-1@1-5 | 76.31 | 18.45 | 6.07 | 0.01 | 0.20 | 0.51 | 0 | 0.14 | 0.09 | 101.78 | (Fe0.78,Mn0.26)1.04W1.01O4 | |
| 14YSD-3-1@1-6 | 76.38 | 18.55 | 5.73 | 0.04 | 0.19 | 0.55 | 0.14 | 0.08 | 0.09 | 101.74 | (Fe0.78,Mn0.24)1.02W1.01O4 | |
| 14YSD-3-1@3-5 | 76.07 | 18.57 | 5.86 | 0.02 | 0.17 | 0.43 | 0.01 | 0.14 | 0.18 | 101.46 | (Fe0.78,Mn0.25)1.03W1.00O4 | |
| 14YSD-3-1@3-6 | 75.70 | 16.54 | 7.55 | 0.03 | 0.29 | 0.44 | 0.06 | 0.16 | 0.17 | 100.92 | (Fe0.70,Mn0.32)1.02W0.99O4 | |
| 14YSD-3-1@3-7 | 75.55 | 18.19 | 5.93 | 0.04 | 0.21 | 0.50 | 0.04 | 0.138 | 0.14 | 100.74 | (Fe0.77,Mn0.25)1.04W0.99O4 | |
| 14YSD-3-1@3-8 | 76.14 | 18.85 | 5.81 | 0.02 | 0.15 | 0.57 | 0 | 0.23 | 0.12 | 101.88 | (Fe0.80,Mn0.25)1.05W1.00O4 | |
| Shiweidong mining area G2(~140 Ma) |
14SWD-10@1-1 | 76.10 | 20.91 | 3.59 | 0.02 | 0.17 | 0.49 | 0.02 | 0.20 | 0.18 | 101.68 | (Fe0.88,Mn0.15)1.03W1.00O4 |
| 14SWD-10@1-2 | 75.98 | 18.58 | 5.66 | 0 | 0.24 | 0.47 | 0 | 0.21 | 0.16 | 101.28 | (Fe0.79,Mn0.24)1.03W1.00O4 | |
| 14SWD-10@1-3 | 76.63 | 18.55 | 5.67 | 0.04 | 0.20 | 0.48 | 0.01 | 0.01 | 0.18 | 101.77 | (Fe0.78,Mn0.24)1.02W1.01O4 | |
| 14SWD-10@1-5 | 76.36 | 18.43 | 6.28 | 0.01 | 0.17 | 0.56 | 0 | 0.06 | 0.16 | 102.03 | (Fe0.78,Mn0.27)1.04W1.01O4 | |
| 14SWD-10@1-6 | 76.20 | 17.83 | 6.40 | 0.04 | 0.23 | 0.64 | 0 | 0.17 | 0.24 | 101.74 | (Fe0.75,Mn0.27)1.02W1.00O4 | |
| 14SWD-10@1-7 | 75.76 | 18.81 | 5.45 | 0 | 0.12 | 0.48 | 0 | 0.27 | 0.15 | 101.03 | (Fe0.80,Mn0.23)1.03W1.00O4 | |
| 14SWD-10@1-8 | 75.90 | 17.75 | 6.41 | 0.02 | 0.26 | 0.52 | 0.02 | 0.22 | 0.17 | 101.27 | (Fe0.75,Mn0.27)1.02W1.00O4 | |
| 14SWD-10@2-1 | 75.49 | 20.54 | 3.88 | 0.02 | 0.16 | 0.53 | 0.05 | 0.16 | 0.10 | 100.92 | (Fe0.87,Mn0.17)1.04W0.99O4 | |
| 14SWD-10@2-2 | 75.43 | 20.55 | 3.73 | 0.02 | 0.20 | 0.49 | 0 | 0.17 | 0.22 | 100.81 | (Fe0.87,Mn0.16)1.03W0.99O4 | |
| 14SWD-10@2-3 | 76.21 | 20.66 | 3.81 | 0.01 | 0.19 | 0.47 | 0.07 | 0.22 | 0.12 | 101.76 | (Fe0.87,Mn0.16)1.03W1.00O4 | |
| 14SWD-10@2-4 | 75.85 | 21.09 | 3.36 | 0.01 | 0.13 | 0.52 | 0.02 | 0.18 | 0.11 | 101.27 | (Fe0.89,Mn0.14)1.03W1.00O4 | |
| 14SWD-10@2-5 | 75.76 | 19.55 | 4.96 | 0.03 | 0.05 | 0.51 | 0.05 | 0.11 | 0.25 | 101.26 | (Fe0.83,Mn0.21)1.04W1.00O4 | |
| 14SWD-10@3-1 | 76.13 | 20.93 | 3.78 | 0 | 0.24 | 0.48 | 0.04 | 0.09 | 0.14 | 101.82 | (Fe0.88,Mn0.16)1.04W1.01O4 | |
| 14SWD-10@3-2 | 75.73 | 20.65 | 3.67 | 0.01 | 0.14 | 0.51 | 0.03 | 0.17 | 0.20 | 101.11 | (Fe0.87,Mn0.16)1.03W1.00O4 | |
| 14SWD-10@3-3 | 75.75 | 20.76 | 3.80 | 0.02 | 0.17 | 0.51 | 0 | 0.16 | 0.18 | 101.34 | (Fe0.88,Mn0.16)1.04W1.00O4 | |
| 14SWD-10@3-4 | 75.83 | 20.90 | 3.65 | 0.02 | 0.18 | 0.56 | 0 | 0.12 | 0.21 | 101.46 | (Fe0.88,Mn0.16)1.04W1.00O4 | |
| 14SWD-10@3-5 | 75.94 | 20.53 | 3.93 | 0.02 | 0.20 | 0.48 | 0 | 0.16 | 0.17 | 101.43 | (Fe0.87,Mn0.17)1.04W1.00O4 | |
| Dawutang mining area G2(~140 Ma) |
14YKD-1@1-1 | 75.44 | 19.87 | 4.76 | 0.05 | 0.01 | 0.48 | 0.09 | 0.11 | 0.21 | 101.03 | (Fe0.84,Mn0.20)1.04W1.00O4 |
| 14YKD-1@1-2 | 75.57 | 20.05 | 4.42 | 0.03 | 0 | 0.60 | 0.08 | 0.09 | 0.10 | 100.95 | (Fe0.85,Mn0.19)1.04W1.00O4 | |
| 14YKD-1@1-3 | 75.19 | 20.72 | 3.80 | 0 | 0.01 | 0.49 | 0.12 | 0.10 | 0.08 | 100.51 | (Fe0.88,Mn0.16)1.04W0.99O4 | |
| 14YKD-1@1-4 | 75.89 | 17.52 | 6.68 | 0.05 | 0.02 | 0.47 | 0.01 | 0.10 | 0.14 | 100.89 | (Fe0.74,Mn0.29)1.03W1.00O4 | |
| 14YKD-1@1-5 | 76.43 | 18.18 | 6.39 | 0.03 | 0.02 | 0.63 | 0.10 | 0.09 | 0.18 | 102.04 | (Fe0.77,Mn0.27)1.04W1.01O4 | |
| 14YKD-1@1-6 | 75.12 | 19.85 | 4.46 | 0.08 | 0.08 | 0.45 | 0.09 | 0.17 | 0.11 | 100.45 | (Fe0.84,Mn0.19)1.03W0.99O4 | |
| 14YKD-1@1-7 | 75.98 | 19.82 | 4.43 | 0.07 | 0.06 | 0.51 | 0.05 | 0.10 | 0.06 | 101.07 | (Fe0.84,Mn0.19)1.03W1.00O4 | |
| 14YKD-1@1-8 | 75.12 | 19.98 | 4.48 | 0.16 | 0.01 | 0.46 | 0.17 | 0.23 | 0.08 | 100.70 | (Fe0.84,Mn0.19)1.03W0.99O4 | |
| 14YKD-1@1-10 | 76.15 | 18.91 | 5.48 | 0.05 | 0.07 | 0.44 | 0.13 | 0.21 | 0.02 | 101.45 | (Fe0.80,Mn0.23)1.03W1.00O4 |
| Deposit | Shimengsi mining area | Kunshan mining area | Dawutan mining area | ||||||||||||||||||||||||||||||||
|---|---|---|---|---|---|---|---|---|---|---|---|---|---|---|---|---|---|---|---|---|---|---|---|---|---|---|---|---|---|---|---|---|---|---|---|
| Rock | Biotite granite (G1,~150 Ma) | Two-mica granite(G2,~140 Ma) | |||||||||||||||||||||||||||||||||
| Sample | SM-4 | SM-6 | SM-18 | SM-19 | SM-20 | SM-29 | SM-48 | SM-50 | SM-51 | SM-52 | SM-53 | 12YSD-22 | 12YSD-23 | 12YSD-24 | 1281-1 | 1281-5 | 1281-6 | 1281-9 | |||||||||||||||||
| SiO2 | 72.54 | 72.33 | 72.44 | 72.86 | 73.73 | 72.85 | 72.32 | 72.72 | 72.46 | 73.13 | 73.33 | 71.71 | 70.75 | 72.52 | 74.7 | 73.6 | 75.17 | 75.35 | |||||||||||||||||
| TiO2 | 0.23 | 0.22 | 0.2 | 0.2 | 0.2 | 0.21 | 0.22 | 0.23 | 0.23 | 0.23 | 0.22 | 0.25 | 0.25 | 0.25 | 0.1 | 0.12 | 0.13 | 0.1 | |||||||||||||||||
| Al2O3 | 14.4 | 14.44 | 14.63 | 14.48 | 13.81 | 14.41 | 14.47 | 14.49 | 14.48 | 14.07 | 14.09 | 13.95 | 14.76 | 14.29 | 12.92 | 14.83 | 13.48 | 13.55 | |||||||||||||||||
| Fe2O3 | 2.04 | 1.94 | 1.79 | 1.58 | 1.7 | 1.83 | 1.6 | 1.81 | 1.88 | 1.91 | 1.81 | 0.45 | 0.21 | 0.08 | 0.2 | 0.07 | 0.25 | 0.2 | |||||||||||||||||
| FeO | 1.44 | 1.51 | 1.27 | 1.17 | 1.19 | 1.44 | 1.09 | 1.38 | 1.52 | 1.49 | 1.41 | 3.18 | 2.89 | 1.99 | 0.72 | 0.93 | 0.88 | 0.66 | |||||||||||||||||
| MnO | 0.079 | 0.082 | 0.066 | 0.049 | 0.072 | 0.06 | 0.03 | 0.05 | 0.06 | 0.07 | 0.06 | 0.04 | 0.05 | 0.06 | 0.04 | 0.04 | 0.04 | 0.02 | |||||||||||||||||
| MgO | 0.52 | 0.5 | 0.4 | 0.41 | 0.42 | 0.49 | 0.5 | 0.5 | 0.51 | 0.53 | 0.5 | 0.52 | 0.54 | 0.54 | 0.28 | 0.32 | 0.31 | 0.26 | |||||||||||||||||
| CaO | 1.1 | 1.11 | 1.07 | 1.14 | 1 | 1.15 | 1.04 | 1.1 | 1.29 | 1.34 | 1.34 | 0.9 | 1.17 | 1.19 | 0.73 | 0.94 | 0.79 | 0.75 | |||||||||||||||||
| Na2O | 3.4 | 3.37 | 3.33 | 3.48 | 2.85 | 3.05 | 3.36 | 3.11 | 3.52 | 3.51 | 3.46 | 1.58 | 2.04 | 2.92 | 3.13 | 2.92 | 2.55 | 2.66 | |||||||||||||||||
| K2O | 4.69 | 4.75 | 4.63 | 4.49 | 4.45 | 4.57 | 4.81 | 4.65 | 4.63 | 3.85 | 4.08 | 3.81 | 4.6 | 4.15 | 4.21 | 3.42 | 4.77 | 5.2 | |||||||||||||||||
| P2O5 | 0.15 | 0.15 | 0.2 | 0.2 | 0.19 | 0.15 | 0.15 | 0.15 | 0.14 | 0.15 | 0.14 | 0.14 | 0.13 | 0.14 | 0.49 | 0.21 | 0.14 | 0.13 | |||||||||||||||||
| LOI | 0.86 | 1.07 | 1.15 | 1.01 | 1.35 | 1.18 | 1.28 | 1.15 | 0.73 | 1.21 | 0.97 | 2.35 | 1.78 | 1.49 | 1.14 | 1.72 | 1.02 | 0.82 | |||||||||||||||||
| Total | 101.45 | 101.47 | 101.18 | 101.07 | 100.96 | 101.39 | 100.87 | 101.34 | 101.45 | 101.49 | 101.41 | 98.88 | 99.17 | 99.62 | 98.66 | 99.12 | 99.53 | 99.7 | |||||||||||||||||
| A/CNK | 1.14 | 1.14 | 1.17 | 1.14 | 1.22 | 1.19 | 1.14 | 1.19 | 1.10 | 1.14 | 1.12 | 1.67 | 1.41 | 1.25 | 1.17 | 1.45 | 1.25 | 1.19 | |||||||||||||||||
| W | 4.45 | 4.17 | 33.5 | 9.84 | 86.8 | 46.1 | 12.4 | 18.4 | 27.2 | 28.2 | 11.8 | 34.33 | 62.40 | 8.01 | 15.5 | 1026 | 13.8 | 31.50 | |||||||||||||||||
| Ba | 328 | 331 | 217 | 213 | 227 | 326 | 336 | 353 | 352 | 142 | 211 | 243 | 471 | 216 | 129 | 120 | 149 | 116 | |||||||||||||||||
| Rb | 318 | 355 | 410 | 364 | 440 | 384 | 352 | 347 | 304 | 320 | 293 | 314 | 258 | 253 | 562 | 469 | 389 | 393 | |||||||||||||||||
| Sr | 98.4 | 90.2 | 72.9 | 70 | 72.1 | 90.1 | 87.9 | 92.1 | 100 | 91.2 | 93.7 | 77.4 | 177 | 138 | 48.7 | 36.3 | 47.1 | 35.3 | |||||||||||||||||
| Y | 8.55 | 8.07 | 7.52 | 7.02 | 8.48 | 8.69 | 9.16 | 8.81 | 8.25 | 9.14 | 8.81 | 9.92 | 9.46 | 10.5 | 10.5 | 8.08 | 8.54 | 9.17 | |||||||||||||||||
| Zr | 111 | 100 | 104 | 101 | 104 | 105 | 109 | 105 | 108 | 103 | 109 | 105 | 129 | 114 | 57.3 | 50.2 | 67.5 | 55.6 | |||||||||||||||||
| Nb | 9.22 | 8.15 | 8.92 | 8.6 | 8.54 | 7.99 | 7.49 | 7.81 | 7.72 | 7.77 | 7.94 | 10.5 | 8.68 | 10.8 | 16.4 | 11.1 | 12.5 | 10.6 | |||||||||||||||||
| Th | 19.4 | 16.4 | 15.9 | 16.1 | 17 | 17.7 | 20.9 | 18 | 19.6 | 18.9 | 18.4 | 12.4 | 15.1 | 12 | 8.15 | 7.18 | 7.92 | 6.55 | |||||||||||||||||
| Hf | 4.2 | 4.1 | 3.7 | 3.8 | 4.6 | 4.6 | 4.6 | 4.3 | 3.9 | 4.4 | 4 | 3.37 | 3.78 | 3.58 | 1.95 | 1.75 | 2.38 | 2.03 | |||||||||||||||||
| Ta | 2.35 | 2.33 | 2.52 | 2.54 | 2.13 | 2 | 1.98 | 1.9 | 1.7 | 1.88 | 1.98 | 2.01 | 1.42 | 2.08 | 6.71 | 3.88 | 4.37 | 4.84 | |||||||||||||||||
| U | 10.4 | 9.35 | 11.3 | 10.6 | 10 | 14.3 | 11.2 | 9.37 | 9.72 | 10.5 | 10.2 | 10.7 | 9.41 | 10.3 | 14 | 15.9 | 11.6 | 14.1 | |||||||||||||||||
| Li | 131 | 183 | 197 | 173 | 250 | 177 | 158 | 150 | 155 | 186 | 134 | 54.6 | 51.8 | 51.5 | 1243 | 500 | 221 | 145 | |||||||||||||||||
| Mo | 0.98 | 0.9 | 1.62 | 1.07 | 1.17 | 8.52 | 0.24 | 1.33 | 1 | 0.62 | 1 | 2.97 | 0.15 | 0.67 | 1.01 | 0.55 | 5.71 | 7.19 | |||||||||||||||||
| Sn | 8.71 | 19.5 | 34.7 | 26 | 55.6 | 36 | 24.1 | 20.3 | 12.1 | 28.3 | 14.2 | 24.2 | 17.6 | 8.55 | 310 | 138 | 52.6 | 38.2 | |||||||||||||||||
| Cu | 6.69 | 58.1 | 104 | 28.4 | 555 | 350 | 146 | 338 | 10.3 | 80.2 | 16.5 | 1443 | 551 | 240 | 345 | 53.7 | 310 | 150 | |||||||||||||||||
| La | 24.3 | 20.9 | 20.4 | 20.5 | 23.1 | 23.2 | 25.7 | 25.9 | 24.6 | 22.6 | 23.6 | 22.1 | 25.3 | 20.3 | 10.8 | 9.35 | 10.2 | 8.37 | |||||||||||||||||
| Ce | 50.3 | 41.5 | 41 | 41.7 | 47.4 | 44.4 | 49.6 | 50.7 | 49 | 44.9 | 46 | 45.4 | 51.5 | 35 | 22.1 | 19.2 | 19.7 | 16.8 | |||||||||||||||||
| Pr | 5.31 | 4.29 | 4.43 | 4.53 | 5.04 | 4.78 | 5.25 | 5.33 | 5.19 | 4.73 | 4.84 | 4.96 | 5.71 | 4.64 | 2.65 | 2.02 | 2.34 | 1.96 | |||||||||||||||||
| Nd | 18.4 | 14.9 | 15.6 | 15.7 | 17.4 | 16.3 | 18.2 | 17.5 | 17.4 | 15.8 | 16.4 | 20.1 | 22.6 | 18.9 | 10.8 | 8.22 | 9.19 | 7.77 | |||||||||||||||||
| Sm | 3.56 | 2.99 | 3.27 | 3.26 | 3.64 | 3.24 | 3.62 | 3.52 | 3.45 | 3.31 | 3.33 | 3.58 | 3.97 | 3.42 | 2.48 | 1.66 | 1.98 | 1.72 | |||||||||||||||||
| Eu | 0.55 | 0.49 | 0.47 | 0.49 | 0.49 | 0.53 | 0.55 | 0.55 | 0.53 | 0.49 | 0.47 | 0.56 | 0.72 | 0.55 | 0.3 | 0.27 | 0.34 | 0.26 | |||||||||||||||||
| Gd | 2.84 | 2.4 | 2.56 | 2.51 | 2.72 | 2.58 | 2.93 | 2.82 | 2.86 | 2.46 | 2.97 | 2.75 | 2.82 | 2.69 | 2.43 | 1.46 | 1.92 | 1.77 | |||||||||||||||||
| Tb | 0.4 | 0.33 | 0.36 | 0.36 | 0.38 | 0.35 | 0.41 | 0.39 | 0.38 | 0.35 | 0.4 | 0.44 | 0.43 | 0.43 | 0.44 | 0.27 | 0.34 | 0.34 | |||||||||||||||||
| Dy | 1.79 | 1.61 | 1.52 | 1.6 | 1.81 | 1.75 | 1.95 | 1.99 | 1.95 | 1.71 | 2.06 | 2.06 | 2.04 | 2.04 | 2.22 | 1.42 | 1.8 | 1.83 | |||||||||||||||||
| Ho | 0.29 | 0.26 | 0.26 | 0.24 | 0.28 | 0.3 | 0.31 | 0.32 | 0.32 | 0.29 | 0.36 | 0.35 | 0.33 | 0.35 | 0.36 | 0.25 | 0.29 | 0.31 | |||||||||||||||||
| Er | 0.79 | 0.66 | 0.69 | 0.61 | 0.69 | 0.8 | 0.85 | 0.78 | 0.82 | 0.74 | 0.86 | 1.05 | 0.96 | 1.07 | 0.94 | 0.72 | 0.81 | 0.86 | |||||||||||||||||
| Tm | 0.1 | 0.097 | 0.095 | 0.09 | 0.099 | 0.1 | 0.11 | 0.11 | 0.11 | 0.11 | 0.11 | 0.13 | 0.13 | 0.14 | 0.11 | 0.1 | 0.1 | 0.11 | |||||||||||||||||
| Yb | 0.65 | 0.65 | 0.52 | 0.57 | 0.64 | 0.65 | 0.67 | 0.7 | 0.68 | 0.64 | 0.76 | 0.94 | 0.82 | 0.98 | 0.7 | 0.69 | 0.69 | 0.73 | |||||||||||||||||
| Lu | 0.09 | 0.08 | 0.07 | 0.077 | 0.086 | 0.1 | 0.09 | 0.09 | 0.09 | 0.09 | 0.1 | 0.14 | 0.13 | 0.15 | 0.1 | 0.1 | 0.1 | 0.11 | |||||||||||||||||
| Eu/Eu* | 0.51 | 0.54 | 0.48 | 0.5 | 0.46 | 0.54 | 0.5 | 0.52 | 0.5 | 0.5 | 0.45 | 0.53 | 0.63 | 0.54 | 0.37 | 0.52 | 0.53 | 0.45 | |||||||||||||||||
| (La/Yb)N | 26.82 | 23.06 | 28.14 | 25.8 | 25.89 | 25.6 | 27.51 | 26.54 | 25.95 | 25.33 | 22.27 | 16.86 | 22.13 | 14.86 | 11.07 | 9.72 | 10.6 | 8.22 | |||||||||||||||||
| ΣREE | 109.37 | 91.16 | 91.24 | 92.24 | 103.78 | 99.08 | 110.24 | 110.7 | 107.38 | 98.22 | 102.26 | 104.56 | 117.46 | 90.66 | 56.43 | 45.73 | 49.8 | 42.94 | |||||||||||||||||
| TZr(℃) | 762 | 754 | 760 | 756 | 766 | 763 | 762 | 763 | 757 | 757 | 761 | 790 | 795 | 775 | 717 | 721 | 735 | 716 | |||||||||||||||||
| Deposit | Dawutan mining area | Shiweidong mining area(Cited from [23]) | Dawutang mining area (Cited from [24]) | ||||||||||||||||||||||||||||||||
| Rock | Two-mica granite(G2,~140 Ma) | Muscovite granite(G3,~140 Ma) | |||||||||||||||||||||||||||||||||
| Sample | 1281-10 | 1281-11 | 1281-12 | 1281-21 | Zk0-26-1 | Zk0-26-2 | Zk0-26-3 | 白1 | 白2 | 白3 | 白4 | 白5 | 白6 | 白7 | |||||||||||||||||||||
| SiO2 | 74.54 | 73.96 | 74.53 | 74.75 | 72.52 | 72.88 | 73.33 | 73.5 | 75.52 | 74.61 | 72.67 | 74.54 | 75.1 | 74.6 | |||||||||||||||||||||
| TiO2 | 0.13 | 0.11 | 0.11 | 0.07 | 0.17 | 0.18 | 0.16 | 0.037 | 0.059 | 0.072 | 0.089 | 0.065 | 0.03 | 0.062 | |||||||||||||||||||||
| Al2O3 | 13.91 | 14.62 | 14.38 | 13.77 | 14.21 | 14.27 | 14.02 | 15.45 | 14.08 | 14.71 | 16.1 | 14.46 | 14.54 | 14.46 | |||||||||||||||||||||
| Fe2O3 | 0.36 | 0.3 | 0.29 | 0.15 | 0.14 | 0.12 | 0.28 | 0.043 | 0.052 | 0.011 | 0.076 | 0.032 | 0.03 | 0.063 | |||||||||||||||||||||
| FeO | 0.77 | 0.74 | 0.68 | 0.43 | 1.1 | 1.12 | 1.1 | 0.67 | 0.62 | 0.68 | 0.71 | 0.82 | 0.6 | 0.8 | |||||||||||||||||||||
| MnO | 0.04 | 0.03 | 0.03 | 0.02 | 0.04 | 0.04 | 0.04 | 0.16 | 0.07 | 0.068 | 0.066 | 0.056 | 0.12 | 0.056 | |||||||||||||||||||||
| MgO | 0.3 | 0.25 | 0.29 | 0.23 | 0.32 | 0.3 | 0.31 | 0.054 | 0.076 | 0.071 | 0.074 | 0.11 | 0.026 | 0.11 | |||||||||||||||||||||
| CaO | 0.85 | 0.77 | 0.79 | 0.63 | 0.75 | 0.59 | 0.73 | 0.44 | 0.57 | 0.37 | 0.34 | 0.53 | 0.34 | 0.57 | |||||||||||||||||||||
| Na2O | 2.77 | 3.41 | 2.56 | 2.95 | 3.7 | 3.69 | 2.92 | 4.21 | 3.94 | 3.42 | 4.3 | 3.71 | 4.46 | 3.66 | |||||||||||||||||||||
| K2O | 4.9 | 4.88 | 4.43 | 5.49 | 4.39 | 4.27 | 4.77 | 3.73 | 3.76 | 4.59 | 4.14 | 4.2 | 3.45 | 4.2 | |||||||||||||||||||||
| P2O5 | 0.14 | 0.2 | 0.24 | 0.18 | 0.29 | 0.29 | 0.25 | 0.37 | 0.27 | 0.27 | 0.32 | 0.34 | 0.33 | 0.34 | |||||||||||||||||||||
| LOI | 0.95 | 0.77 | 1.2 | 0.94 | 1.5 | 1.56 | 1.59 | 1.26 | 0.96 | 1.04 | 1.04 | 1.04 | 0.88 | 0.97 | |||||||||||||||||||||
| Total | 99.66 | 100.04 | 99.53 | 99.61 | 99.13 | 99.31 | 99.5 | 99.92 | 99.98 | 99.91 | 99.93 | 99.9 | 99.91 | 99.89 | |||||||||||||||||||||
| A/CNK | 1.22 | 1.19 | 1.38 | 1.15 | 1.16 | 1.21 | 1.24 | 1.31 | 1.21 | 1.30 | 1.32 | 1.24 | 1.24 | 1.24 | |||||||||||||||||||||
| W | 43.60 | 8.57 | 21.80 | 12.70 | 33.1 | 27.9 | 101 | 30.7 | 334 | 548 | 84.1 | 80.4 | 106 | 73.1 | |||||||||||||||||||||
| Ba | 155 | 109 | 148 | 137 | 79.6 | 45.2 | 135 | 18.4 | 11.3 | 13.7 | 10 | 31.5 | 10 | 25.8 | |||||||||||||||||||||
| Rb | 445 | 397 | 400 | 346 | 616 | 571 | 707 | 922 | 482 | 562 | 844 | 458 | 782 | 468 | |||||||||||||||||||||
| Sr | 50.7 | 32.2 | 39.3 | 41.5 | 24.9 | 21.7 | 36.7 | 12.1 | 4.38 | 5.36 | 2.94 | 10.7 | 17.6 | 8.95 | |||||||||||||||||||||
| Y | 10.1 | 7.95 | 8.06 | 6.99 | 12.6 | 13.3 | 11.5 | 4.64 | 9.14 | 11.8 | 10.3 | 7.66 | 9.75 | 7.2 | |||||||||||||||||||||
| Zr | 71 | 49.7 | 51.7 | 58.2 | 91.1 | 98.3 | 88.5 | 31.2 | 46.4 | 60 | 48.4 | 41.2 | 52.6 | 41.5 | |||||||||||||||||||||
| Nb | 12.4 | 14.1 | 13.7 | 4.55 | 18.5 | 19.6 | 16.6 | 33.3 | 25 | 26.3 | 34.3 | 17.2 | 34.6 | 17.9 | |||||||||||||||||||||
| Th | 8.6 | 6.8 | 8.1 | 7.33 | 19.42 | 21.1 | 20.3 | 1.72 | 3.18 | 4.94 | 3.7 | 2.27 | 4.02 | 2.24 | |||||||||||||||||||||
| Hf | 2.37 | 1.78 | 1.93 | 1.97 | 3.44 | 3.84 | 3.25 | 1.57 | 2.14 | 2.1 | 2.14 | 2.38 | 2.64 | 2.19 | |||||||||||||||||||||
| Ta | 4.28 | 6.29 | 6.04 | 1.99 | 5.58 | 6.11 | 4.53 | 27.4 | 13.6 | 9.01 | 13.6 | 4.18 | 23.4 | 4.62 | |||||||||||||||||||||
| U | 13.1 | 13.7 | 14.4 | 11.5 | 17.6 | 18.11 | 15.9 | 11.7 | 17.8 | 21.4 | 20 | 9.04 | 16.4 | 10.7 | |||||||||||||||||||||
| Li | 209 | 159 | 272 | 132 | 269 | 301 | 232 | 1050 | 272 | 334 | 455 | 262 | 225 | 321 | |||||||||||||||||||||
| Mo | 0.72 | 0.62 | 1.89 | 2.45 | 1.22 | 1.86 | 0.97 | 1.52 | 12.2 | 2.01 | 0.59 | 0.61 | 0.88 | 7.52 | |||||||||||||||||||||
| Sn | 50.1 | 41.1 | 96 | 27.6 | 81.6 | 52.7 | 65.8 | 251 | 75.0 | 80.0 | 65.8 | 37.5 | 108 | 61.1 | |||||||||||||||||||||
| Cu | 68.3 | 109 | 344 | 46.7 | 103 | 6.07 | 395 | 31.8 | 92.6 | 41.3 | 41.4 | 23.9 | 228 | 32.7 | |||||||||||||||||||||
| La | 11.8 | 8.83 | 10.1 | 9.02 | 21.3 | 23.3 | 22.5 | 5 | 5 | 6.88 | 5.38 | 5.8 | 5 | 5 | |||||||||||||||||||||
| Ce | 22.8 | 18 | 20.5 | 18.2 | 50.4 | 54 | 53.4 | 4.92 | 10.4 | 14.6 | 11.8 | 12 | 9.06 | 9.3 | |||||||||||||||||||||
| Pr | 2.69 | 2.08 | 2.29 | 2.13 | 5.61 | 6.26 | 5.89 | 0.57 | 1.26 | 1.74 | 1.38 | 1.43 | 1.14 | 1.09 | |||||||||||||||||||||
| Nd | 11 | 8.25 | 9.2 | 8.31 | 20.6 | 23.5 | 20.9 | 2.07 | 4.72 | 6.61 | 5.15 | 5.34 | 4.18 | 4.15 | |||||||||||||||||||||
| Sm | 2.36 | 1.76 | 1.94 | 1.85 | 4.94 | 5.46 | 5 | 0.54 | 1.29 | 1.78 | 1.44 | 1.63 | 1.3 | 1.4 | |||||||||||||||||||||
| Eu | 0.34 | 0.21 | 0.29 | 0.25 | 0.28 | 0.21 | 0.35 | 0.051 | 0.038 | 0.042 | 0.018 | 0.096 | 0.016 | 0.073 | |||||||||||||||||||||
| Gd | 2.23 | 1.61 | 1.76 | 1.64 | 3.72 | 4.15 | 3.46 | 0.55 | 1.18 | 1.67 | 1.32 | 1.6 | 1.2 | 1.42 | |||||||||||||||||||||
| Tb | 0.4 | 0.3 | 0.33 | 0.3 | 0.49 | 0.57 | 0.43 | 0.12 | 0.26 | 0.35 | 0.29 | 0.32 | 0.27 | 0.28 | |||||||||||||||||||||
| Dy | 2.07 | 1.58 | 1.69 | 1.4 | 2.94 | 3.36 | 2.71 | 0.72 | 1.52 | 2.02 | 1.68 | 1.64 | 1.78 | 1.5 | |||||||||||||||||||||
| Ho | 0.33 | 0.26 | 0.28 | 0.23 | 0.51 | 0.57 | 0.46 | 0.13 | 0.27 | 0.35 | 0.31 | 0.25 | 0.28 | 0.24 | |||||||||||||||||||||
| Er | 0.91 | 0.72 | 0.77 | 0.67 | 1.26 | 1.39 | 1.1 | 0.37 | 0.82 | 1.04 | 0.92 | 0.64 | 0.88 | 0.6 | |||||||||||||||||||||
| Tm | 0.11 | 0.09 | 0.1 | 0.09 | 0.17 | 0.18 | 0.14 | 0.064 | 0.15 | 0.17 | 0.15 | 0.091 | 0.15 | 0.089 | |||||||||||||||||||||
| Yb | 0.77 | 0.61 | 0.65 | 0.58 | 1.01 | 1.04 | 0.85 | 0.49 | 0.9 | 1.14 | 1.06 | 0.59 | 1.07 | 0.56 | |||||||||||||||||||||
| Lu | 0.12 | 0.09 | 0.09 | 0.08 | 0.13 | 0.15 | 0.12 | 0.069 | 0.13 | 0.17 | 0.15 | 0.082 | 0.15 | 0.075 | |||||||||||||||||||||
| Eu/Eu* | 0.45 | 0.37 | 0.47 | 0.43 | 0.19 | 0.13 | 0.24 | 0.28 | 0.09 | 0.07 | 0.04 | 0.18 | 0.04 | 0.16 | |||||||||||||||||||||
| (La/Yb)N | 10.99 | 10.38 | 11.15 | 11.16 | 15.13 | 16.07 | 18.99 | 7.32 | 3.98 | 4.33 | 3.64 | 7.05 | 3.35 | 6.4 | |||||||||||||||||||||
| ΣREE | 57.93 | 44.39 | 49.99 | 44.75 | 113.36 | 124.14 | 117.31 | 15.66 | 27.94 | 38.56 | 31.05 | 31.51 | 26.48 | 25.78 | |||||||||||||||||||||
| TZr(℃) | 736 | 705 | 720 | 716 | 750 | 760 | 754 | 678 | 703 | 727 | 709 | 696 | 714 | 696 | |||||||||||||||||||||
| Deposit | Dawutang mining area(Cited from [24]) | Dawutan mining area (Cited from [19]) | |||||||||||||||||||||||||||||||||
| Rock | Muscovite granite(G3,~140 Ma) | Albite granite(G4, ~140 Ma) | |||||||||||||||||||||||||||||||||
| Sample | 白8 | 白9 | 白10 | 白11 | PM-06 | PM-07 | PM-08 | PM-09 | PM-10 | PM-11 | |||||||||||||||||||||||||
| SiO2 | 73.77 | 73.36 | 73.36 | 73.2 | 71.29 | 71.37 | 71.51 | 71.28 | 70.03 | 71.99 | |||||||||||||||||||||||||
| TiO2 | 0.19 | 0.18 | 0.1 | 0.11 | 0.02 | 0.01 | 0.02 | 0.02 | 0.01 | 0.01 | |||||||||||||||||||||||||
| Al2O3 | 14.05 | 14 | 15.18 | 15.4 | 16.41 | 16.58 | 16.51 | 16.52 | 16.35 | 16.42 | |||||||||||||||||||||||||
| Fe2O3 | 0.15 | 0.17 | 0.15 | 0.2 | 0.01 | 0.02 | 0.01 | 0.01 | 0.17 | 0.02 | |||||||||||||||||||||||||
| FeO | 1.34 | 1.34 | 0.82 | 0.71 | 0.34 | 0.35 | 0.36 | 0.35 | 1.46 | 0.35 | |||||||||||||||||||||||||
| MnO | 0.052 | 0.08 | 0.066 | 0.58 | 0.14 | 0.09 | 0.15 | 0.15 | 0.16 | 0.11 | |||||||||||||||||||||||||
| MgO | 0.31 | 0.29 | 0.12 | 0.15 | 0.06 | 0.04 | 0.05 | 0.05 | 0.03 | 0.05 | |||||||||||||||||||||||||
| CaO | 0.83 | 0.85 | 0.56 | 0.58 | 0.67 | 0.35 | 0.44 | 0.4 | 0.64 | 0.3 | |||||||||||||||||||||||||
| Na2O | 3.35 | 3.37 | 4.16 | 4.55 | 5.78 | 5.64 | 5.41 | 5.48 | 5.09 | 5.63 | |||||||||||||||||||||||||
| K2O | 4.82 | 5.04 | 3.8 | 3.28 | 3.02 | 3.7 | 3.2 | 3.15 | 3.24 | 3.08 | |||||||||||||||||||||||||
| P2O5 | 0.16 | 0.16 | 0.44 | 0.44 | 0.74 | 0.39 | 0.55 | 0.73 | 0.71 | 0.4 | |||||||||||||||||||||||||
| LOI | 0.83 | 1.01 | 1.15 | 1.24 | 1.01 | 0.94 | 1.24 | 1.19 | 1.26 | 1.09 | |||||||||||||||||||||||||
| Total | 99.85 | 99.85 | 99.91 | 100.44 | 99.53 | 99.52 | 99.49 | 99.37 | 99.31 | 99.49 | |||||||||||||||||||||||||
| A/CNK | 1.15 | 1.11 | 1.27 | 1.27 | 1.17 | 1.19 | 1.25 | 1.26 | 1.25 | 1.25 | |||||||||||||||||||||||||
| W | 27.7 | 20.3 | 54.6 | 76.1 | 644 | 801 | 694 | 481 | 21.6 | 576 | |||||||||||||||||||||||||
| Ba | 216 | 202 | 17.7 | 26.8 | 1.01 | 0.9 | 0.64 | 0.87 | 17.2 | 0.53 | |||||||||||||||||||||||||
| Rb | 410 | 452 | 632 | 572 | 1581 | 1622 | 1733 | 1825 | 1750 | 1716 | |||||||||||||||||||||||||
| Sr | 50.8 | 45.8 | 8.54 | 13.2 | 88.4 | 4.93 | 5.54 | 9.44 | 27.8 | 4.49 | |||||||||||||||||||||||||
| Y | 20.1 | 20.1 | 9.77 | 10.5 | 1.73 | 1.49 | 0.83 | 1.47 | 4.14 | 0.74 | |||||||||||||||||||||||||
| Zr | 124 | 120 | 54.2 | 53.8 | 33.7 | 25.9 | 41.4 | 24.4 | 24.1 | 20.6 | |||||||||||||||||||||||||
| Nb | 18.3 | 17.6 | 22 | 24.3 | 43.6 | 43.1 | 41.8 | 45.4 | 51.3 | 38.2 | |||||||||||||||||||||||||
| Th | 24.6 | 24.3 | 2.98 | 2.68 | 1.43 | 1.44 | 0.84 | 1.37 | 2.2 | 0.97 | |||||||||||||||||||||||||
| Hf | 3.02 | 2.88 | 2.64 | 2.93 | 3.02 | 2.53 | 3.72 | 2.76 | 2.07 | 2.29 | |||||||||||||||||||||||||
| Ta | 3.4 | 3.16 | 22 | 9.5 | 19.3 | 33.5 | 22.5 | 27.9 | 57.9 | 21.9 | |||||||||||||||||||||||||
| U | 11.3 | 12.2 | 14.9 | 14.8 | 13.8 | 12 | 11.9 | 11.4 | 14.1 | 12 | |||||||||||||||||||||||||
| Li | 280 | 241 | 892 | 873 | 1434 | 924 | 1866 | 2367 | 2053 | 1792 | |||||||||||||||||||||||||
| Mo | 1.42 | 1.75 | 1.08 | 1.09 | - | - | - | - | - | - | |||||||||||||||||||||||||
| Sn | 53.4 | 34.9 | 92.8 | 90.6 | 159 | 368 | 67 | 76.8 | 369 | 79.9 | |||||||||||||||||||||||||
| Cu | 20.9 | 11.9 | 11.2 | 79.9 | 19.4 | 98.6 | 4.65 | 3.07 | 9.3 | 11.1 | |||||||||||||||||||||||||
| La | 31.3 | 30.5 | 7.63 | 7.54 | 0.73 | 0.68 | 0.37 | 0.61 | 3.12 | 0.47 | |||||||||||||||||||||||||
| Ce | 63.4 | 61 | 16.2 | 15.9 | 2.77 | 2.83 | 1.91 | 3.25 | 5.25 | 2.13 | |||||||||||||||||||||||||
| Pr | 7.38 | 7.04 | 1.96 | 1.96 | 0.23 | 0.18 | 0.11 | 0.16 | 0.57 | 0.13 | |||||||||||||||||||||||||
| Nd | 26.7 | 26.4 | 7.57 | 7.7 | 0.84 | 0.54 | 0.37 | 0.57 | 1.92 | 0.42 | |||||||||||||||||||||||||
| Sm | 5.7 | 5.64 | 2.08 | 2.04 | 0.3 | 0.17 | 0.12 | 0.17 | 0.5 | 0.14 | |||||||||||||||||||||||||
| Eu | 0.42 | 0.4 | 0.12 | 0.12 | <0.05 | <0.05 | <0.05 | <0.05 | <0.05 | <0.05 | |||||||||||||||||||||||||
| Gd | 4.57 | 4.71 | 2.04 | 2.04 | 0.27 | 0.18 | 0.12 | 0.19 | 0.47 | 0.13 | |||||||||||||||||||||||||
| Tb | 0.76 | 0.73 | 0.4 | 0.37 | 0.06 | <0.05 | <0.05 | <0.05 | 0.11 | <0.05 | |||||||||||||||||||||||||
| Dy | 3.9 | 3.95 | 2.02 | 1.9 | 0.3 | 0.23 | 0.14 | 0.22 | 0.65 | 0.14 | |||||||||||||||||||||||||
| Ho | 0.7 | 0.7 | 0.31 | 0.31 | 0.06 | <0.05 | <0.05 | <0.05 | 0.1 | <0.05 | |||||||||||||||||||||||||
| Er | 1.96 | 1.91 | 0.82 | 0.82 | 0.15 | 0.12 | 0.08 | 0.1 | 0.29 | 0.07 | |||||||||||||||||||||||||
| Tm | 0.28 | 0.28 | 0.14 | 0.11 | <0.05 | <0.05 | <0.05 | <0.05 | 0.05 | <0.05 | |||||||||||||||||||||||||
| Yb | 1.78 | 1.79 | 0.76 | 0.74 | 0.21 | 0.17 | 0.13 | 0.12 | 0.41 | 0.08 | |||||||||||||||||||||||||
| Lu | 0.28 | 0.27 | 0.1 | 0.11 | <0.05 | <0.05 | <0.05 | <0.05 | 0.04 | <0.05 | |||||||||||||||||||||||||
| Eu/Eu* | 0.24 | 0.23 | 0.18 | 0.18 | - | - | - | - | - | - | |||||||||||||||||||||||||
| (La/Yb)N | 12.61 | 12.22 | 7.2 | 7.31 | 2.49 | 2.87 | 2.04 | 3.65 | 5.53 | 4.21 | |||||||||||||||||||||||||
| ΣREE | 149.13 | 145.32 | 42.15 | 41.66 | - | - | - | - | - | - | |||||||||||||||||||||||||
| TZr(℃) | 775 | 769 | 716 | 715 | 673 | 656 | 693 | 656 | 654 | 645 | |||||||||||||||||||||||||
| Nb/Ta | Zr/Hf | Y/Ho | K/Rb | W(ppm) | Cu (ppm) | Li (ppm) | Mo (ppm) | Nb (ppm) | Ta (ppm) | Sn (ppm) | |
|---|---|---|---|---|---|---|---|---|---|---|---|
| G1 granite (n=14) | |||||||||||
| Min | 3.39 | 22.61 | 24.47 | 81.77 | 4.17 | 6.69 | 51.5 | 0.15 | 7.49 | 1.7 | 8.55 |
| Max | 6.11 | 34.13 | 31.52 | 144.15 | 86.8 | 1443 | 250 | 8.52 | 10.8 | 2.54 | 55.6 |
| Mean | 4.25 | 26.75 | 28.84 | 108.8 | 27.7 | 280.5 | 146.6 | 1.59 | 8.58 | 2.06 | 23.6 |
| Median | 4.01 | 26.50 | 29.10 | 108.26 | 27.2 | 146 | 155 | 1.00 | 8.54 | 2.01 | 23.6 |
| G2 granite (n=11) | |||||||||||
| Min | 2.19 | 25.60 | 23.33 | 54.55 | 8.57 | 6.07 | 132 | 0.55 | 4.55 | 1.99 | 27.6 |
| Max | 3.66 | 29.96 | 32.32 | 128.29 | 1026 | 395 | 1243 | 7.19 | 19.6 | 6.71 | 310 |
| Mean | 2.75 | 27.94 | 28.54 | 82.23 | 121.4 | 175.5 | 334.8 | 2.20 | 13.6 | 4.97 | 86.7 |
| Median | 2.86 | 27.92 | 29.45 | 89.03 | 27.9 | 109 | 232 | 1.22 | 13.7 | 4.84 | 52.7 |
| G3 granite (n=11) | |||||||||||
| Min | 1.00 | 17.31 | 28.71 | 32.71 | 20.3 | 11.2 | 225 | 0.59 | 17.2 | 3.16 | 34.9 |
| Max | 5.57 | 41.67 | 35.69 | 95.09 | 548 | 228 | 1050 | 12.2 | 34.6 | 27.4 | 251 |
| Mean | 2.95 | 24.60 | 32.25 | 60.37 | 130.5 | 56.0 | 473.2 | 2.8 | 24.6 | 12.2 | 86.4 |
| Median | 2.56 | 20.53 | 33.23 | 63.07 | 76.1 | 32.7 | 321 | 1.4 | 24.3 | 9.5 | 75 |
| G4 granite (n=6) | |||||||||||
| Min | 0.89 | 8.84 | 14.8 | 13.96 | 21.6 | 3.07 | 924 | - | 38.2 | 19.3 | 67 |
| Max | 2.26 | 11.64 | 41.4 | 18.44 | 801 | 98.6 | 2367 | - | 51.3 | 57.9 | 369 |
| Mean | 1.61 | 10.33 | 26.81 | 15.38 | 536 | 24.4 | 1739 | - | 43.9 | 30.5 | 186.6 |
| Median | 1.69 | 10.68 | 29.11 | 14.95 | 610 | 10.2 | 1829 | - | 43.4 | 25.2 | 119.5 |
| Deposit | Lithology or ore body | Age | MSWD | Mineral and method | Reference | |
|---|---|---|---|---|---|---|
| Shimensi mining area | petrogenesis age | Porphyritic biotite granite | 147.4±0.6 | 1.3 | Zircon U-Pb | [7] |
| Porphyritic biotite granite | 149±1 | 1.7 | Monazite U-Pb | [9] | ||
| Biotite granite | 150±0.7 | 1.6 | Monazite U-Pb | [9] | ||
| Porphyritic granite | 143.1±1.2 | 0.4 | Zircon U-Pb | [7] | ||
| Porphyritic biotite granite | 148.2±1.2 | 2.2 | Monazite U-Pb | [9] | ||
| mineralization age | Quartz vein type | 139.2±1.0 | 2.9 | Molybdenite Re-Os | [39] | |
| Quartz vein type | 143.7±1.2 | 0.8 | Molybdenite Re-Os | [40] | ||
| Quartz vein type | 149.6±1.2 | 1.6 | Molybdenite Re-Os | [4] | ||
| Dawutang mining area | petrogenesis age | Granite porphyry | 130.7±1.1 | 0.5 | Zircon U-Pb | [6] |
| Muscovite granite | 133.7±0.5 | 0.5 | Zircon U-Pb | [6] | ||
| Muscovite granite | 142.7±1.0 | 1.1 | Monazite U-Pb | This paper | ||
| Two-mica granite | 140.3±1.0 | 1.5 | Monazite U-Pb | This paper | ||
| Granite porphyry | 140.3±1.9 | 0.4 | Zircon U-Pb | This paper | ||
| Shiweidong mining area | petrogenesis age | Granite porphyry | 130.3±1.1 | 2 | Zircon U-Pb | [6] |
| Granite porphyry | 134.6±1.2 | 1.8 | Zircon U-Pb | [5] | ||
| Porphyritic two-mica granite | 144±0.6 | 0.2 | Zircon U-Pb | [6] | ||
| Porphyritic two-mica granite | 136.6±1.0 | 1.4 | Monazite U-Pb | This paper | ||
| mineralization age | Quartz vein type | 140.9±3.6 | 2.3 | Molybdenite Re-Os | [40] | |
| Fine vein immersion type | 142.4±8.9 | 1.7 | Scheelite Sm-Nd | [8] | ||
| Kunshan mining section | petrogenesis age | Porphyritic biotite granite | 149.5±0.9 | 0.3 | Monazite U-Pb | This paper |
| Porphyritic biotite granite | 151.4±1.4 | 1.2 | Monazite U-Pb | This paper | ||
| Porphyritic granite | 151.7±1.3 | 1.6 | Zircon U-Pb | [16] | ||
| Granite porphyry | 136.6±2.5 | 3.8 | Zircon U-Pb | [16] | ||
| mineralization age | Quartz vein type | 150.0±1.0 | 0.3 | Molybdenite Re-Os | [16] | |
| Meizikeng mine spot | mineralization age | Quartz vein type | 150.0±1.0 | 0.7 | Molybdenite Re-Os | [41] |
Disclaimer/Publisher’s Note: The statements, opinions and data contained in all publications are solely those of the individual author(s) and contributor(s) and not of MDPI and/or the editor(s). MDPI and/or the editor(s) disclaim responsibility for any injury to people or property resulting from any ideas, methods, instructions or products referred to in the content. |
© 2025 by the authors. Licensee MDPI, Basel, Switzerland. This article is an open access article distributed under the terms and conditions of the Creative Commons Attribution (CC BY) license (http://creativecommons.org/licenses/by/4.0/).


