Submitted:
12 October 2025
Posted:
14 October 2025
You are already at the latest version
Abstract
Background and Objectives: Heart failure (HF) causes systemic and regional hemodynamic alterations that extend beyond the heart, profoundly affecting splanchnic circulation. Venous congestion in the hepatic and portal systems is a key but often underrecognized determinant of organ dysfunction and symptom burden. Conventional ultrasound and Doppler techniques offer a non-invasive, dynamic evaluation of these changes, potentially complementing standard echocardiographic and biomarker assessments.
Materials and Methods: A systematic review was performed in PubMed, Embase, and the Cochrane Library up to July 2025, following PRISMA 2020 guidelines. Eligible studies included adult human investigations evaluating splanchnic vascular changes in HF using B-mode, color Doppler, or pulsed Doppler ultrasonography. Exclusion criteria were pediatric, animal, or non-English studies and non-standard imaging methods. Data on ultrasonographic parameters, hemodynamic correlations, and prognostic value were extracted and qualitatively synthesized; sympathetic nervous system; heart failure with preserved ejection fraction; ultrasound; b-mode, colordoppler, pulsed doppler.
Results: A total of 148 eligible studies (n ≈ 7,000 patients) demonstrated consistent associations between HF severity and alterations in splanchnic flow. Findings included increased bowel wall thickness, portal vein dilation with elevated pulsatility, and monophasic or reversed hepatic vein waveforms, all correlating with higher right atrial pressure and adverse clinical outcomes. The integration of these parameters into the Venous Excess Ultrasound (VExUS) framework enhanced detection of systemic venous congestion.
Conclusions: Conventional ultrasound assessment of splanchnic vasculature provides valuable, reproducible insight into systemic congestion in HF. Incorporating hepatic and portal Doppler indices into standard evaluation protocols may improve risk stratification, optimize decongestion therapy, and guide management. Further prospective validation is warranted to standardize cutoff values and define prognostic thresholds.
Keywords:
heart failure
; splanchnic circulation
; venous congestion
; ultrasound
; point-of-care ultrasound (POCUS) Doppler imaging
; hepatic veins
; portal vein
; VExUS
; congestion assessment
1. Introduction
Cardiovascular physiology involves the heart and the arterial system. Heart pumps blood [1] and adapts via extrinsic (autonomic [2] and neuroendocrine control [3]) and intrinsic (autoregulation of contractile force according to preload - Starling's law[4] - and/or according to afterload - Anrep effect[5]-) mechanisms to maintain cardiac output and stroke volume without changing heart rate [6].
The arteries function as a conduit and pressure reservoir through the Windkessel effect [7]. Its effect in large elastic arteries functions through two distinct phases to ensure continuous blood flow. During ventricular systole, the arterial walls expand to absorb a portion of the stroke volume, temporarily storing pressure energy as potential energy within stretched elastin fibers [7]. This passive distension acts as a hydraulic buffer, smoothing the pulsatile pressure waveform and reducing pulse pressure. In the subsequent diastolic phase, the elastic recoil of the arterial wall converts this stored potential energy back into kinetic energy [8]. This release propels blood forward through the vasculature, maintaining a critical perfusion pressure to the tissues even when the heart is not actively ejecting blood. The arterial system regulates blood pressure through dynamic physiological adaptations that operate over both short and long timescales[9]. Acutely, endothelial mediators such as nitric oxide, endothelins, and endothelium-derived hyperpolarizing factors interact with myogenic responses and autonomic baroreflexes to fine-tune vascular tone and thus control resistance and pulse wave reflection[10]. Over time, persistent hemodynamic and neurohormonal stress induces structural remodeling characterized by vascular smooth muscle hypertrophy, collagen deposition, and elastin fragmentation, which together increase arterial stiffness and pulse wave velocity [9,11]. These changes impair baroreflex buffering capacity and enhance wave reflection, thereby sustaining hypertension and propagating target-organ damage[12,13]. Based on Guyton’s theory return [14], cardiac output is primarily determined by venous return, which is driven by the pressure gradient between the mean systemic filling pressure (MsfP) and the right atrial pressure (RAP) [15,16]. MsfP represents the systemic pressure during circulatory arrest and is determined by blood volume and venous compliance, conceptualized as "stressed" and "unstressed" volumes [17,18]. Venous return can be augmented by increasing stressed volume or reducing venous compliance, effectively mobilizing unstressed volume without altering total blood volume [18].
The splanchnic circulation is the principal reservoir of unstressed volume [19]. It is supplied by the celiac trunk and mesenteric arteries, drained via the portal system [20], and can mobilize 600–700 mL of blood centrally through its extensive venous capacitance in the spleen, mesentery, and hepatic sinusoids [21,22]. This compartment is regulated by extrinsic (autonomic, neurohumoral) and intrinsic (metabolic, paracrine) mechanisms [23]. The splanchnic circulation is uniquely sensitive to heart failure–related congestion because its high compliance and extensive venous reservoir capacity make it particularly prone to volume shifts and increased venous pressures, amplifying the hemodynamic impact of elevated cardiac filling pressures [21].
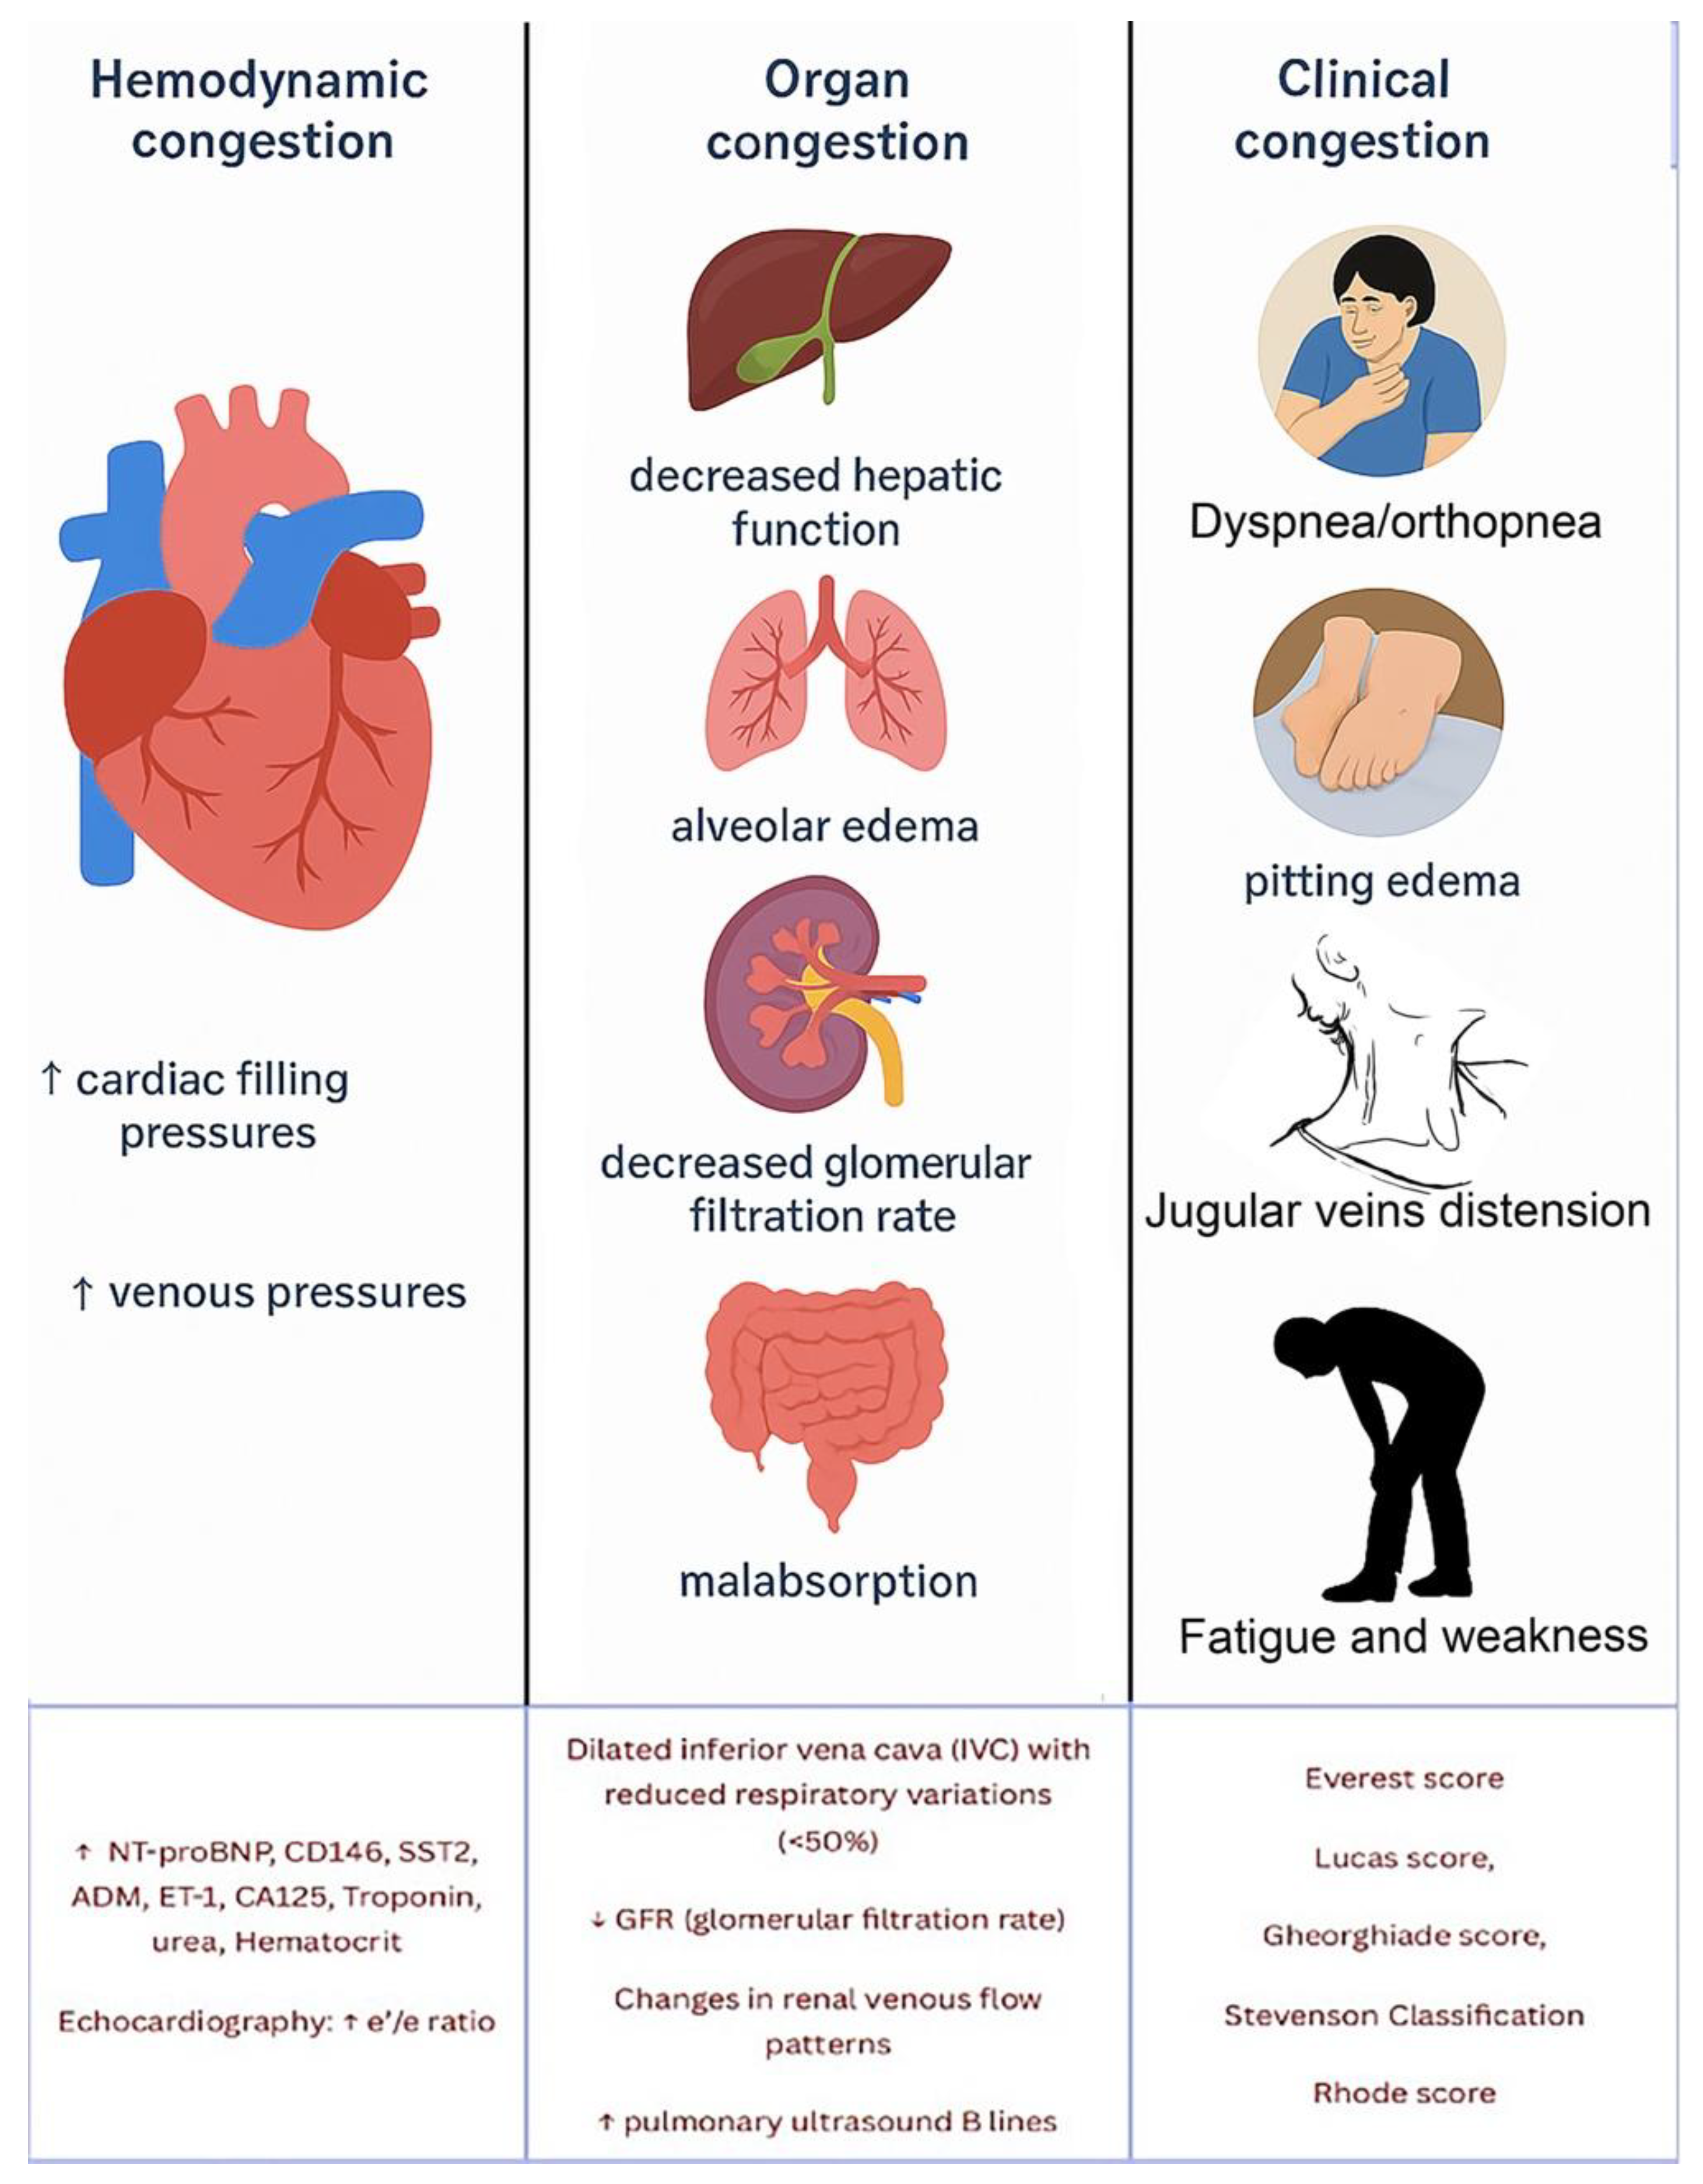
In heart failure, venous congestion evolves through stages: initial fluid volume expansion, followed by hemodynamic congestion with elevated pressures, often subclinical [24], and finally clinical congestion with overt organ edema and symptoms due to fluid retention and redistribution [25]. (Figure )
Figure 1.
Aspects of fluid overload and their complex interplay typically seen in heart failure. Diagnosis is achieved integrating multiple diagnostic modalities, with the use of various diagnostic tools, such as biomarkers (e.g., NT-proBNP, CD146, SST2, ADM, ET-1, CA125), echocardiography, lung ultrasound, and congestion assessment scores, to evaluate congestion comprehensively.
Clinical congestion is a key factor in hospitalizations and re-hospitalizations for patients with HF [25]. However, many patients are discharged with persistent signs of congestion, sometimes without significant weight loss despite diuretic treatment[26]. A post hoc analysis by Lala et al.[27] found that only 52% of patients were free of clinical congestion (defined as orthoedema) at discharge, and 38% of those developed recurrent congestion within 60 days. These findings suggest that resolving physical signs of congestion is a temporary measure and that clinical or hemodynamic indicators of decongestion may not reliably correlate with sustained symptom relief or improved outcomes. Discordant findings in studies show that while physical signs such as elevated jugular venous pressure and a third heart sound may have prognostic value, they do not always correlate with invasive hemodynamic measurements, which are considered the gold standard for assessing volume overload [28]. Furthermore, studies have shown that changes in symptoms, functional status, or exercise tolerance after treatment have limited association with changes in cardiac hemodynamics [29]. This highlights a lack of sensitivity and reliability in using physical signs to identify congestion or its relief in relation to cardiac pressures. Consequently, it raises the question of whether we should focus on physical signs and symptoms or hemodynamic data to define and manage congestion in HF management.
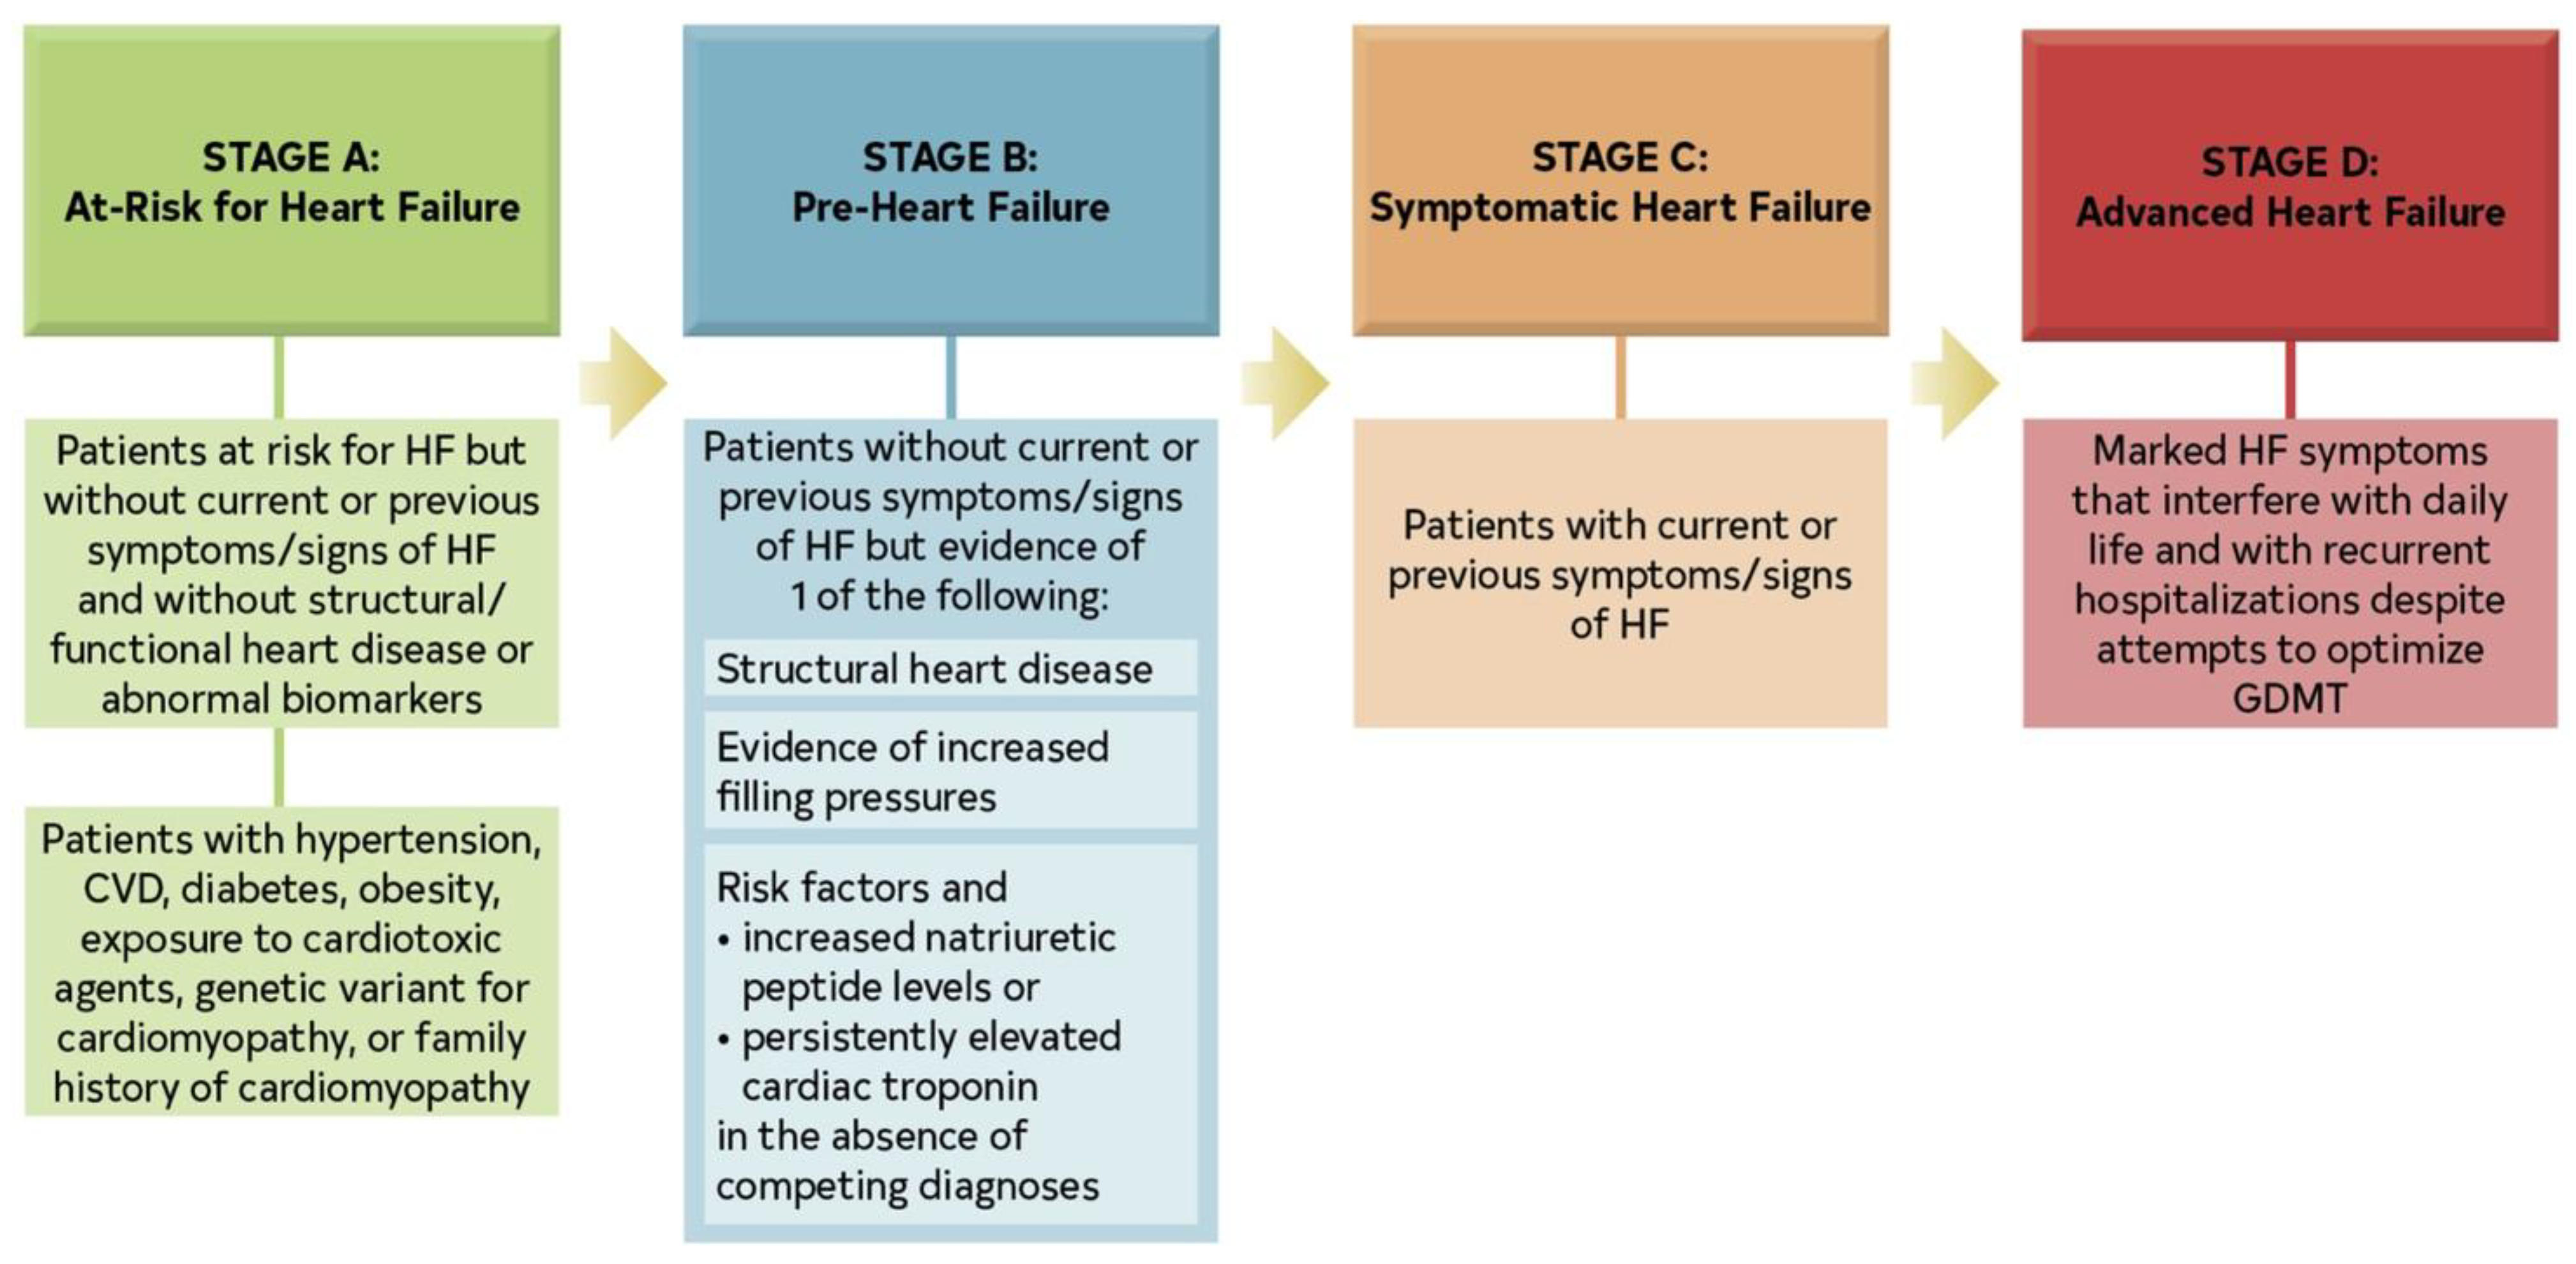
HF affects approximately 6.3 million Americans (According to the CDC [30]) and it is more prevalent in men but often more fatal in women when untreated[31]. The revised stages of HF are: At risk for HF (Stage A); Pre-HF (Stage B); Symptomatic HF (Stage C); Advanced HF (Stage D) [32]. HF may involve predominantly the left ventricle, the right ventricle, or both. In predominantly left-sided HF (LHF), impaired systolic and/or diastolic function of the left ventricle leads to reduced cardiac output and increased left atrial and pulmonary venous pressures, resulting in pulmonary congestion. In predominantly right-sided HF (RHF), dysfunction of the right ventricle causes elevated systemic venous pressure with peripheral fluid accumulation, manifesting as edema of the lower extremities, ascites, and hepatic congestion.
Chronic hepatic congestion is a major concern: elevated central venous pressure is transmitted retrogradely to the hepatic veins, while reduced cardiac output limits hepatic arterial perfusion. The combination of venous stasis and decreased oxygen delivery produces centrilobular hypoxia, hepatocellular necrosis, and perivenular fibrosis. Over time, these changes may progress to so-called cardiac (congestive) cirrhosis in patients with long-standing HF [33].
In the context of HF, the splanchnic circulation also plays a role in both left-sided and right-sided HF. In LHF, blood volume is redistributed, and venoconstriction can increase left ventricular pressure. In RHF, venous congestion, particularly in the splanchnic circulation, worsens outcomes by impairing gut function, increasing systemic inflammation, and disrupting the gut microbiome. Visceral congestion may contribute to disease progression and is associated with worsened kidney function, systemic inflammation, and infections. (Figure ).
Figure 2.
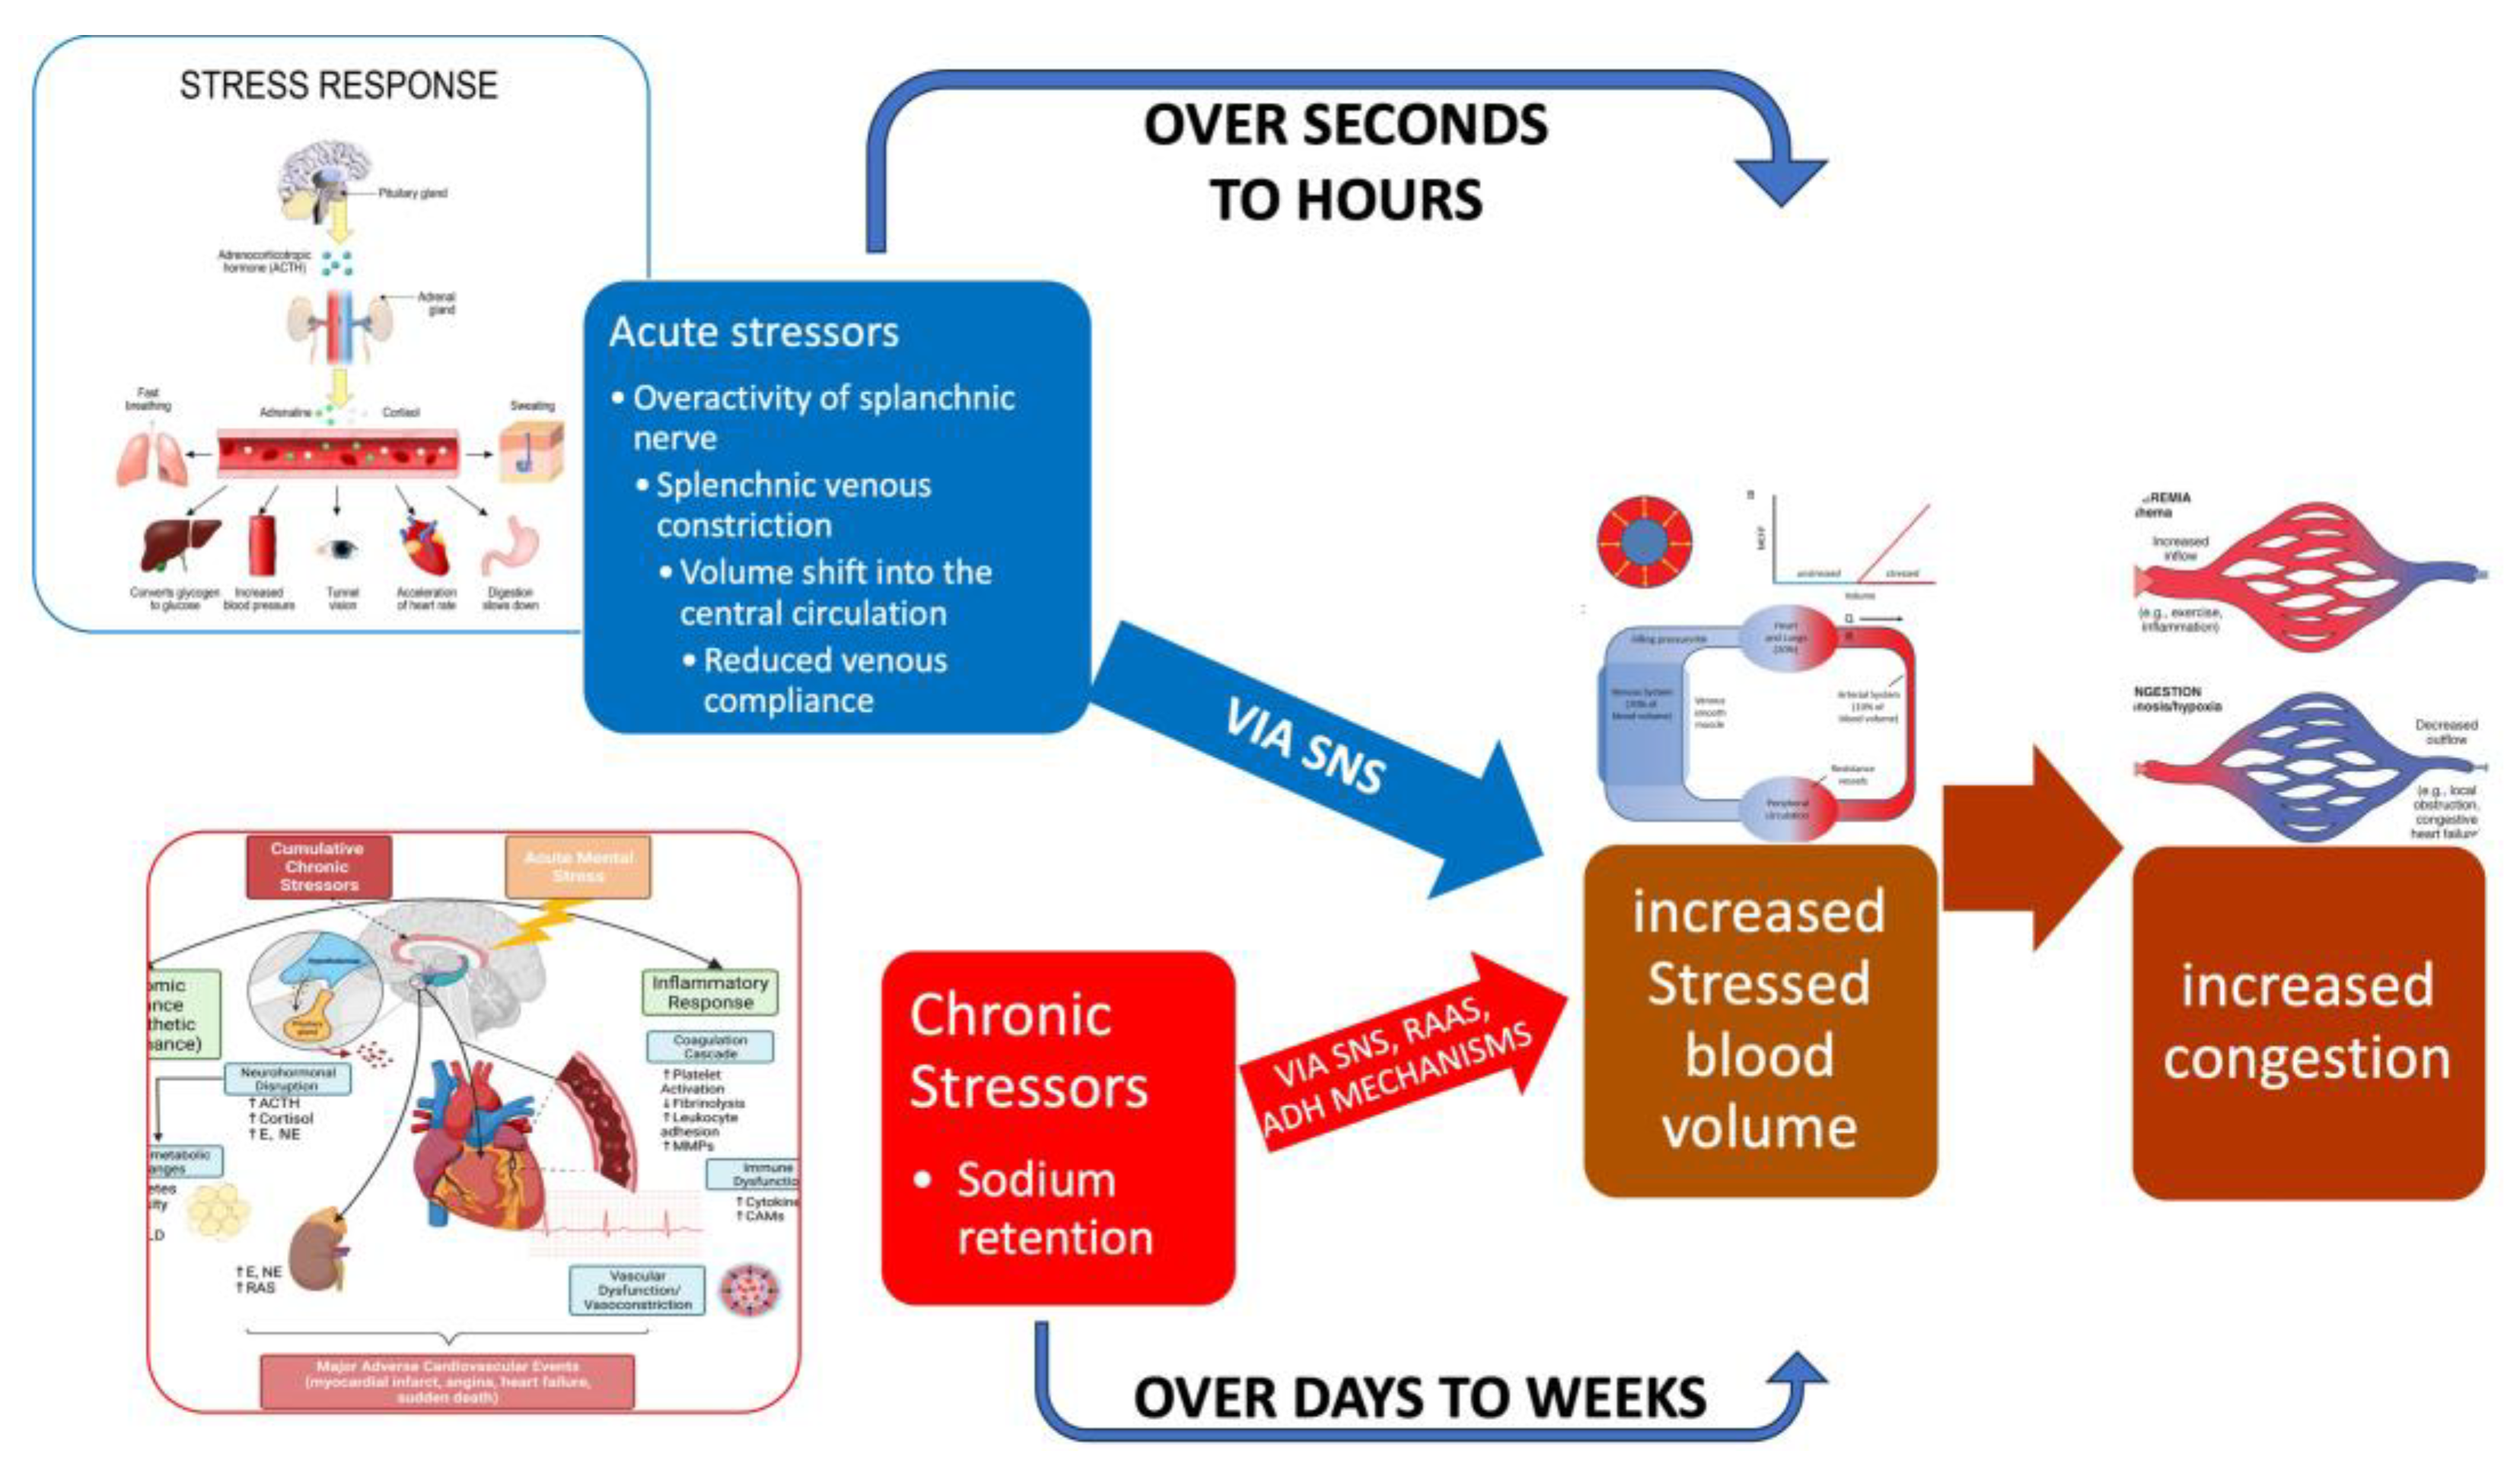
Fast vs. slow mechanisms of congestion. A relatively minor precipitant such as exercise causes a slight increase in sympathetic activity. Depicted on the right are the slow mechanisms that lead to sodium and water retention, causing splanchnic congestion and subsequent increased stressed blood volume. These processes occur slowly over days to weeks. Depicted on the left are the dynamic fast mechanisms that can occur rapidly: Splanchnic venous constriction by the sympathetic activation resulting in volume shifts from the splanchnic compartment to the central compartment, increasing stressed blood volume and causing congestion. These fast processes are often observed in the few days before decompensation. (Yaku et al. [21,34]). Abbreviations: SNS = sympathetic nervous system; RAAS= renin-angiotensin aldosterone system; ADH = antidiuretic hormone.
Figure 2.
Fast vs. slow mechanisms of congestion. A relatively minor precipitant such as exercise causes a slight increase in sympathetic activity. Depicted on the right are the slow mechanisms that lead to sodium and water retention, causing splanchnic congestion and subsequent increased stressed blood volume. These processes occur slowly over days to weeks. Depicted on the left are the dynamic fast mechanisms that can occur rapidly: Splanchnic venous constriction by the sympathetic activation resulting in volume shifts from the splanchnic compartment to the central compartment, increasing stressed blood volume and causing congestion. These fast processes are often observed in the few days before decompensation. (Yaku et al. [21,34]). Abbreviations: SNS = sympathetic nervous system; RAAS= renin-angiotensin aldosterone system; ADH = antidiuretic hormone.
HF manifests differently depending on whether the left, right, or both sides of the heart are affected. Left ventricular dysfunction leads to increased pulmonary pressure, causing pulmonary congestion, dyspnoea, and tachypnoea due to fluid buildup in the lungs. Reduced peripheral circulation (forward failure) results in kidney dysfunction, poor blood flow to peripheral tissues, and malnutrition, contributing to cardiac cachexia. Chronic HF causes prolonged activation of compensatory neurohumoral systems, which leads to further volume overload, liver congestion, ascites, oedema, acrocyanosis, increased heart rate at rest and with exercise, and worsening cardio-renal function. Additionally, anaemia, increased pulmonary pressure, and muscle fatigue (especially in the diaphragm and peripheral muscles) worsen symptoms like dyspnoea. Overload (pressure or volume) of the heart leads to cardiac enlargement and a high cardiothoracic index, often accompanied by a leftward shift in the palpable cardiac pulsation. In cases of volume overload, ventricular filling increases, resulting in the characteristic third or fourth heart sound (a protodiastolic gallop). Overall, HF affects multiple organ systems, making it a systemic disease with a broad clinical spectrum.
Symptoms of right heart failure are primarily caused by systemic venous congestion or low cardiac output. These include shortness of breath with exertion, fatigue, dizziness, ankle swelling, fullness in the upper abdomen, and discomfort or pain in the right upper abdomen [35].
The diagnosis of HF is based on clinical symptoms and signs of fluid overload, such as shortness of breath, dry cough, fatigue, and leg swelling[36,37]. An echocardiogram is typically used to assess heart function, with an ejection fraction (EF) below 40% indicating heart failure with reduced ejection fraction (HFrEF), and an EF between 40% and 49% indicating HF with mildly reduced EF (HFmrEF). An EF greater than 50% with additional criteria included in the HFA-PEFF score[38] indicates HF with preserved ejection fraction (HFpEF) [33,39]. A new category has been recently proposed: symptomatic HF with a baseline LVEF ≤40%, an increase of ≥10 percentage points from baseline, and a second LVEF measurement >40% (HF with improved ejection fraction – HfimpEF - ) [32].
Patients with HFpEF tend to be more often elderly, female, obese, with a history of arterial hypertension and/or atrial fibrillation. Only SGLT2 inhibitors (empagliflozin[40] or dapagliflozin[41]) have demonstrated to reduce the risk of HF hospitalization or CV death in HFpEF. HFrEF is often associated with coronary heart disease, valve disease, uncontrolled hypertension (hypertensive cardiomyopathy), or it might be caused by a primary cardiomyopathy [42]. In HFrEF, the main structural change is eccentric remodelling with chambers dilation and volume overload [43]. The volume overload is typically caused by persistent neurohumoral activation (e.g., the renin-angiotensin-aldosterone system and SNS). On the other hand, HFpEF is characterized by impaired ventricular relaxation, increased stiffness, and elevated filling pressure, often leading to pressure overload, concentric remodelling, and backward failure[43].
The New York Heart Association (NYHA) classification system [44] is commonly used to assess the severity of HF symptoms and functional capacity, and it is an important predictor of mortality and treatment strategies. (Figure ).
HF can present acutely (de novo HF) or as chronic HF. Acute decompensation is the most common presentation, a clinical entity defined as worsening HF[45]. It has been demonstrated that venous congestion in HF is associated with worse outcomes, both in the acute and in the chronic setting. Ultrasonography has become a valuable tool for diagnosing venous congestion in HF due to its non-invasive, rapid, and cost-effective nature[46,47].
While the 2023 ESC Cardiomyopathy guidelines[48] primarily establish a new etiological framework, their utility in congestion evaluation is demonstrated through a critical, paradigm-shifting recommendation: the formal integration of lung ultrasound (LUS) for the detection and grading of pulmonary congestion. This move beyond traditional, often-insensitive clinical signs provides an evidence-based, objective metric to phenotype patients, particularly in heart failure with preserved ejection fraction (HFpEF) which is prevalent within cardiomyopathy cohorts.
By endorsing LUS, the guidelines institutionalize a tool that directly visualizes subclinical congestion, thereby enabling a more proactive and personalized management strategy. This elevates congestion from a binary clinical sign to a quantifiable physiological parameter, integral to the comprehensive 'MAGIC' phenotypic assessment. Consequently, the guidelines empower clinicians to refine volume status evaluation, optimize decongestive therapy pre-emptively, and ultimately, leverage the prognostic power of residual congestion to improve long-term patient trajectories
A significant paradigm shift is underway, moving beyond traditional clinical signs to the use of ultrasound for detecting subclinical fluid overload[49]. This approach, integrating lung and venous Doppler imaging, provides a quantifiable and reproducible window into the patient's hemodynamic status, thereby offering a powerful tool not just for prognostication but for actively guiding decongestive therapy.
The scientific literature now compellingly demonstrates that the degree of congestion quantified by ultrasound serves as a robust barometer for both short- and long-term risk in heart failure. Consequently, these imaging techniques are transitioning from purely diagnostic tools to dynamic guides for therapeutic modulation, particularly in titrating diuretic regimens, with the evidence for lung ultrasound currently being more mature than that for venous Doppler analysis.
Despite the exponential accumulation of evidence validating its utility, the integration of multiparametric ultrasound into the routine management of heart failure remains an aspiration rather than a standard. The current scientific consensus, as reflected in this review, posits that forthcoming data will be crucial to bridge this gap between compelling evidence and widespread clinical implementation, ultimately.
Figure 3.
The American College of Cardiology and American Heart Association stages of Heart failure (ACC/AHA Stages); CVD, cardiovascular disease; GDMT, guideline-directed medical therapy; and HF, heart failure.
Figure 3.
The American College of Cardiology and American Heart Association stages of Heart failure (ACC/AHA Stages); CVD, cardiovascular disease; GDMT, guideline-directed medical therapy; and HF, heart failure.
This review aims to systematically examine and synthesize current evidence on the use of conventional ultrasonography—specifically B-mode, color Doppler, and pulsed Doppler techniques—for the evaluation of splanchnic vascular alterations in patients with heart failure (HF). It seeks to elucidate how ultrasound-based assessment of the hepatic, portal, and mesenteric circulation can provide a non-invasive and dynamic representation of systemic venous congestion, complementing standard echocardiographic and biomarker-based approaches. By integrating data from existing studies, this review intends to identify consistent ultrasonographic patterns—such as portal vein dilation and pulsatility, hepatic vein waveform changes, and bowel wall thickening—that correlate with right atrial pressure, hemodynamic status, and adverse clinical outcomes. The central hypothesis underpinning this review is that the ultrasonographic evaluation of the splanchnic vasculature yields clinically meaningful insights into the pathophysiology and severity of venous congestion in heart failure. It is proposed that these sonographic parameters not only reflect systemic hemodynamic burden but may also serve as valuable prognostic markers and therapeutic guides. Furthermore, the review postulates that integrating splanchnic ultrasound findings into multiparametric frameworks—such as the Venous Excess Ultrasound (VExUS) scoring system—could enhance early detection, improve risk stratification, and optimize decongestive management in both acute and chronic heart failure.
2. Materials and Methods
2.1. Search Strategy
A comprehensive and systematic search in PubMed was conducted to identify relevant literature, utilizing a preplanned, reproducible search strategy. F.G designed, conducted the database search and analysis The search terms used were: (“Splanchnic Vascularization” OR “Splanchnic Circulation” OR “Abdominal Blood Flow”) combined with (“Heart Failure”[Mesh] OR “cardiac failure” OR “ventricular dysfunction” OR “HFpEF” OR “HFrEF” and “ultrasound” or “colordoppler” OR “Pulsed Doppler” OR "VExUS" OR "Venous Excess Ultrasound"). We applied no restrictions regarding the date of publication, covering all articles published up to July 2025.
2.2. Study Selection
We systematically screened titles, abstracts, and full texts to determine their eligibility according to Prisma 2020 statement[50] (Table 1). The inclusion criteria were: 1) language: articles published in English, Spanish, or Italian; 2) type of study: experimental, observational, and systematic review articles, published as original research in peer-reviewed journals, and limited to human studies; 3) population: adult patients diagnosed with any type of heart failure; 4) focus: studies examining changes in splanchnic vascularization and their impact on heart failure progression or management; 5) outcomes: studies that measured physiological parameters of splanchnic circulation and related these to heart failure outcomes. The exclusion criteria included: 1) case reports, opinion papers, editorials, and studies available only as abstracts; 2) pediatric studies; 3) studies focusing on non-heart failure populations; 4) studies utilizing non-standard methods of assessing splanchnic, cardiac and pulmonary vascularization.
2.3. Data Extraction
The study selection process followed the PRISMA 2020 guidelines[50]. Adherence to the PRISMA 2020 guidelines (BMJ 2021; DOI: 10.1136/bmj.n71) was confirmed throughout the review process, ensuring methodological transparency, reproducibility, and completeness of reporting. All stages—from literature search and study selection to data extraction and synthesis—were conducted in accordance with PRISMA’s structured framework to enhance the rigor and reliability of the systematic analysis. A total of 667 records were identified through electronic databases, including Medline (n = 560), EMBASE (n = 105), and the Cochrane Central Register of Controlled Trials (n = 2). Additional records were retrieved from supplementary sources, comprising 24 from websites and five from citation searching, while no records were obtained from organizational repositories. After removal of 104 duplicates and 104 records excluded for other reasons, 563 unique records remained for screening. Title and abstract screening excluded 162 records, leaving 401 reports sought for retrieval. Of these, 208 could not be retrieved, resulting in 193 full-text reports assessed for eligibility. In parallel, 29 additional reports identified from other sources underwent full-text assessment.
Among the database-derived reports, 50 were excluded after full-text evaluation, whereas all 29 supplementary reports met the eligibility criteria. Ultimately, 143 studies, documented across 29 reports, fulfilled the inclusion criteria and were incorporated into the review. The selection process is detailed in the PRISMA 2020 flow diagram (Table ). Reviewer disagreements regarding study eligibility and data interpretation were resolved through discussion and consensus with a third independent reviewer to ensure objectivity and methodological consistency. References and citations were organized using Endnote 21™ for Mac, which facilitated accurate data management and duplication control. No formal risk-of-bias assessment tools, such as the Newcastle–Ottawa Scale[51] or ROB 2.0[52], were applied, as the included studies were highly heterogeneous in design and objectives. Consequently, only a qualitative synthesis was performed, as the diversity of methodologies, imaging parameters, and outcome measures precluded a meaningful or statistically valid meta-analysis.
3. Results
A total of 148 eligible studies, encompassing approximately 7,000 patients, were included in the final qualitative synthesis. These studies collectively examined splanchnic vascular alterations in acute and chronic heart failure using conventional B-mode, color Doppler, and pulsed Doppler ultrasound techniques. The included literature demonstrated consistent associations between the severity of heart failure and measurable changes in splanchnic hemodynamics, such as increased bowel wall thickness, portal vein dilation and pulsatility, and alterations in hepatic venous flow patterns.
HF and liver disease often coexist, with conditions like "congestive hepatopathy" (liver damage due to elevated right heart pressures) and "cardiogenic liver injury" (liver ischemia due to poor blood flow) contributing to a worsened prognosis. Diagnosis of cardiogenic liver injury is typically based on elevated liver enzymes and imaging, but non-invasive techniques like shear wave elastography may offer earlier detection[53]
Splanchnic circulation plays a key role in regulating blood volume and systemic blood pressure in cirrhotic patients with portal hypertension. Modulating splanchnic circulation has gained attention in liver transplant management, as it can reduce venous congestion, restore central blood flow, and optimize blood volume during surgery. Pharmacologic splanchnic modulation using vasoconstrictors like vasopressin or terlipressin minimizes excessive portal blood flow post-transplant, a critical factor since high portal flow hinders liver regeneration and recovery. Surgical interventions, such as splenic artery ligation, splenectomy, or portocaval shunting, can also achieve this effect. Additionally, splanchnic vasoconstriction supports perioperative renal function by reducing portal pressure and mitigating hyperdynamic circulation, potentially protecting against acute kidney injury in liver transplant patients [54] .
3.1. Ultrasound Measurements of Splanchnic Circulation
3.1.1. B-MODE:
Bowel-Wall Thickening
HF is often associated with a loss of appetite, and when combined with liver and intestinal congestion, it can lead to complications such as iron malabsorption, malnutrition, and cachexia[55]. Chronic HF patients may also experience increased colonic wall thickness, possibly due to edema and reduced blood flow to the intestines. This change in the gut may alter the microbiota, triggering systemic inflammation that can worsen heart failure and increase the risk of mortality[56,57].
A study by Ikeda et al. [58] explored the relationship between intestinal wall edema, cardiac function, and clinical outcomes in 168 hospitalized HF patients using spiral CT. Their multivariate analysis found that factors like elevated C-reactive protein, lower estimated glomerular filtration rate, reduced lymphocyte count, a higher E/E' ratio, and altered defecation frequency were independently associated with increased colonic wall thickness (CWT). Moreover, increased CWT was linked to a higher incidence of adverse clinical outcomes, indicating that it reflects reduced cardiac function and can predict poorer long-term outcomes.
Additionally, bowel wall thickness can be assessed through ultrasound, with increased thickness correlating with higher congestion and worse prognosis in HF patients[55,59].
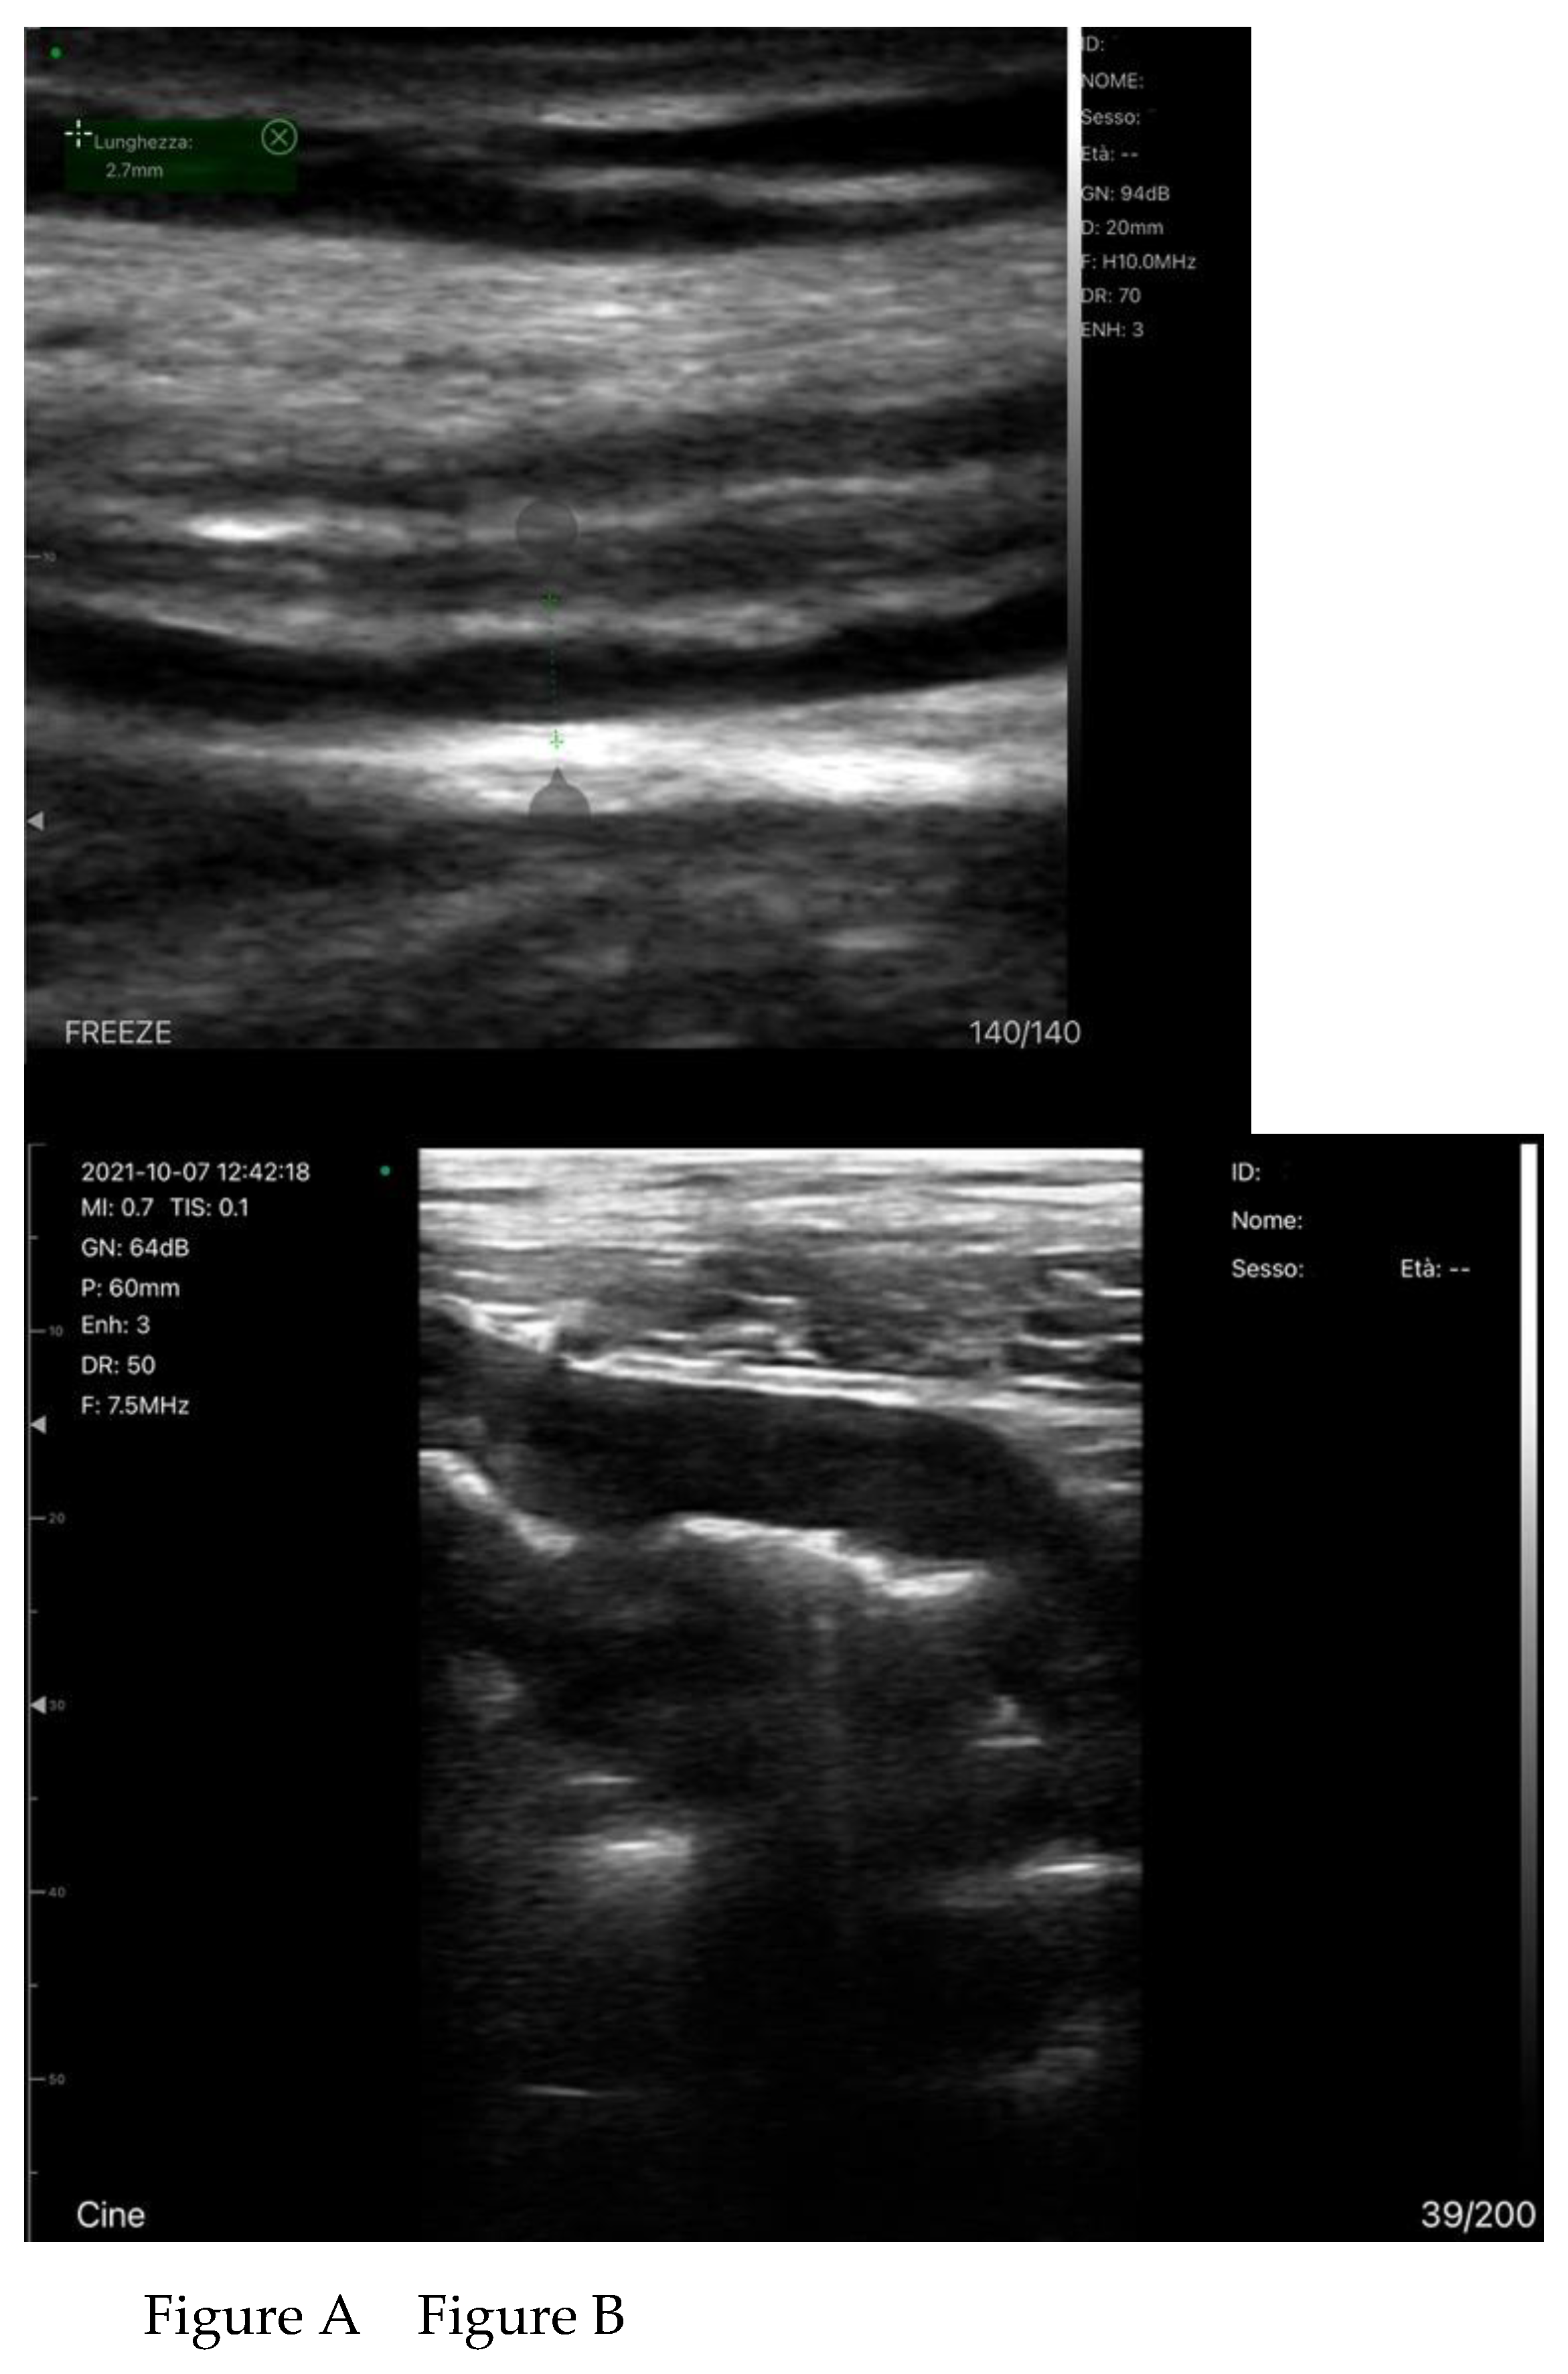
Recently, a Chinese study[60] found that the wall thickness of the ascending colon was significantly different between patients diagnosed with acute heart failure (the study group), and healthy individuals (Controls), while the wall thickness of the gastric antrum and jejunum showed no significant difference. The ascending colon's wall thickness is particularly affected because it is supplied by both the superior mesenteric artery (SMA) and inferior mesenteric artery, making it highly dependent on collateral circulation. In acute heart failure (AHF), any interruption of blood flow can impair this delicate system, leading to hypoperfusion, ischemic injury, and potentially intestinal necrosis. The colon is more vulnerable to hypotension and reduced blood flow from AHF compared to other parts of the gastrointestinal tract due to its poorer autoregulatory capacity. Other parts of the GI tract have better mechanisms to maintain adequate perfusion. Reduced blood flow to the colon can damage the intestinal barrier, increase epithelial permeability, and promote bacterial translocation, especially of anaerobic bacteria. This contributes to systemic inflammation, edema, and thickening of the colon wall (Figure )
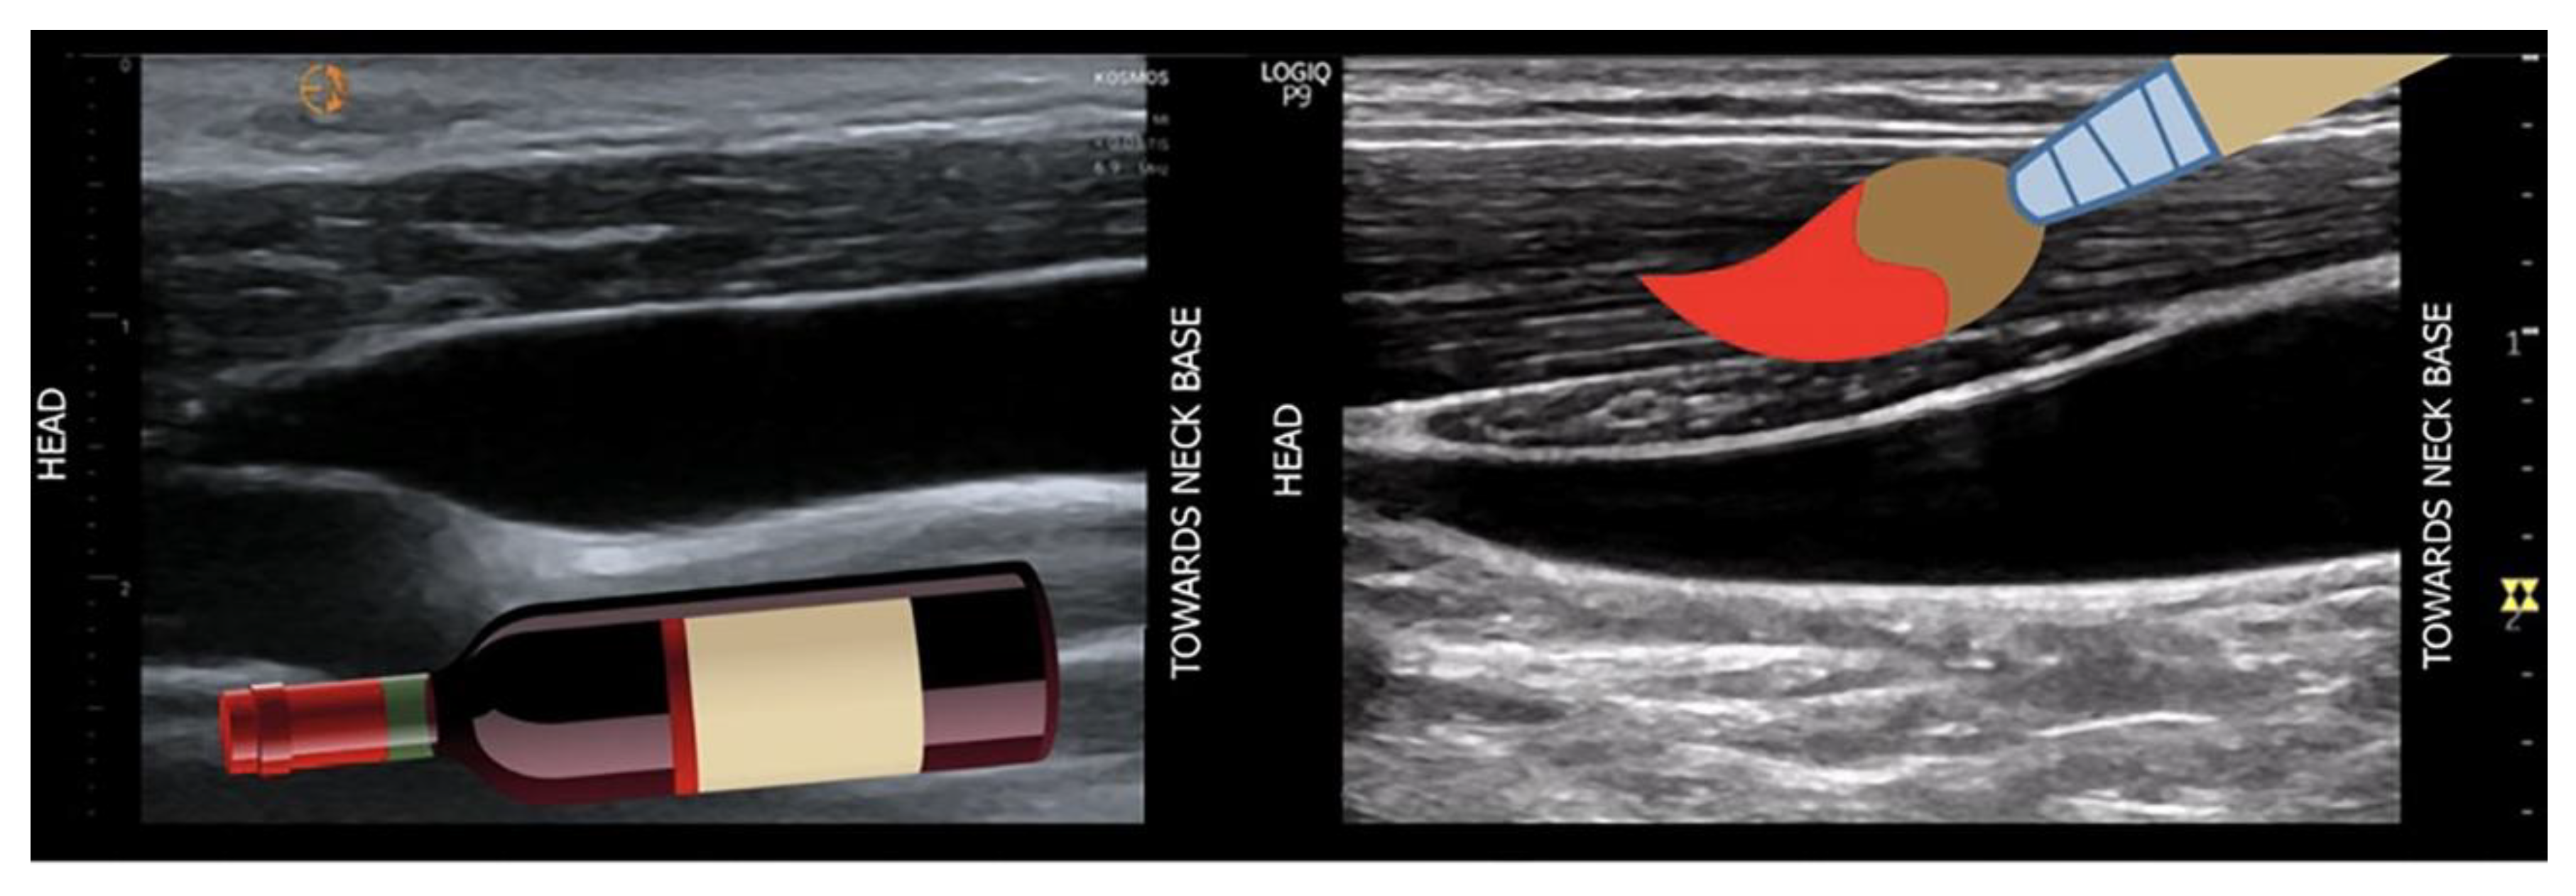
Figure 4.
the wall thickness of the ascending colon was significantly different betweenhealthy individuals (Controls) (Figure 3A) and patients diagnosed with acute heart failure (the study group) (FIGURE 3B), while the wall thickness of the gastric antrum and jejunum showed no significant difference. The ascending colon's wall thickness is particularly affected because it is supplied by both the superior mesenteric artery (SMA) and inferior mesenteric artery, making it highly dependent on collateral circulation. In acute heart failure (AHF), any interruption of blood flow can impair this delicate system, leading to hypoperfusion, ischemic injury, and potentially intestinal necrosis. The colon is more vulnerable to hypotension and reduced blood flow from AHF compared to other parts of the gastrointestinal tract due to its poorer autoregulatory capacity.
A recent Chinese study [60] explored gastrointestinal structural and functional alterations in patients with acute heart failure, using ultrasound as the primary investigative tool. By comparing patients with acute heart failure to healthy controls, the authors examined differences in gastrointestinal wall thickness, vascular dimensions, motility patterns, and self-reported symptoms. The results demonstrated that patients with acute heart failure experienced a heavier burden of gastrointestinal symptoms, particularly related to lower abdominal discomfort and defecatory difficulties. Ultrasound revealed clear evidence of splanchnic congestion, with enlarged hepatic and mesenteric veins and thickened intestinal walls. In parallel, dynamic assessments showed a marked reduction in gastric and intestinal motility, suggesting impaired peristaltic activity across multiple segments of the gastrointestinal tract. Importantly, the study identified significant correlations between vascular parameters and gastrointestinal function: wall thickening of the stomach, jejunum, and colon was positively associated with hepatic venous dilation, while motility indices correlated with superior mesenteric blood flow velocities. These findings link venous congestion and altered mesenteric perfusion to structural changes and functional decline of the gastrointestinal tract. Symptom severity, particularly reflux and abdominal complaints, also showed meaningful associations with both vascular and motility parameters.
Overall, the evidence supports the concept that acute heart failure exerts measurable effects on the gastrointestinal system, mediated through venous congestion and impaired perfusion. The use of ultrasound allowed noninvasive characterization of these alterations, highlighting its potential role as a bedside tool to evaluate gastrointestinal involvement in heart failure. Clinically, these insights reinforce the importance of considering gut function in the management of acute decompensated heart failure and suggest that ultrasound-based monitoring could help guide tailored therapeutic strategies. While these findings highlight the gut as a target organ in HF, the measurement of bowel wall thickness is not yet standardized for routine clinical use and is primarily featured in research settings. In contrast, Doppler-based flow assessments have more robust validation
Venous Congestion
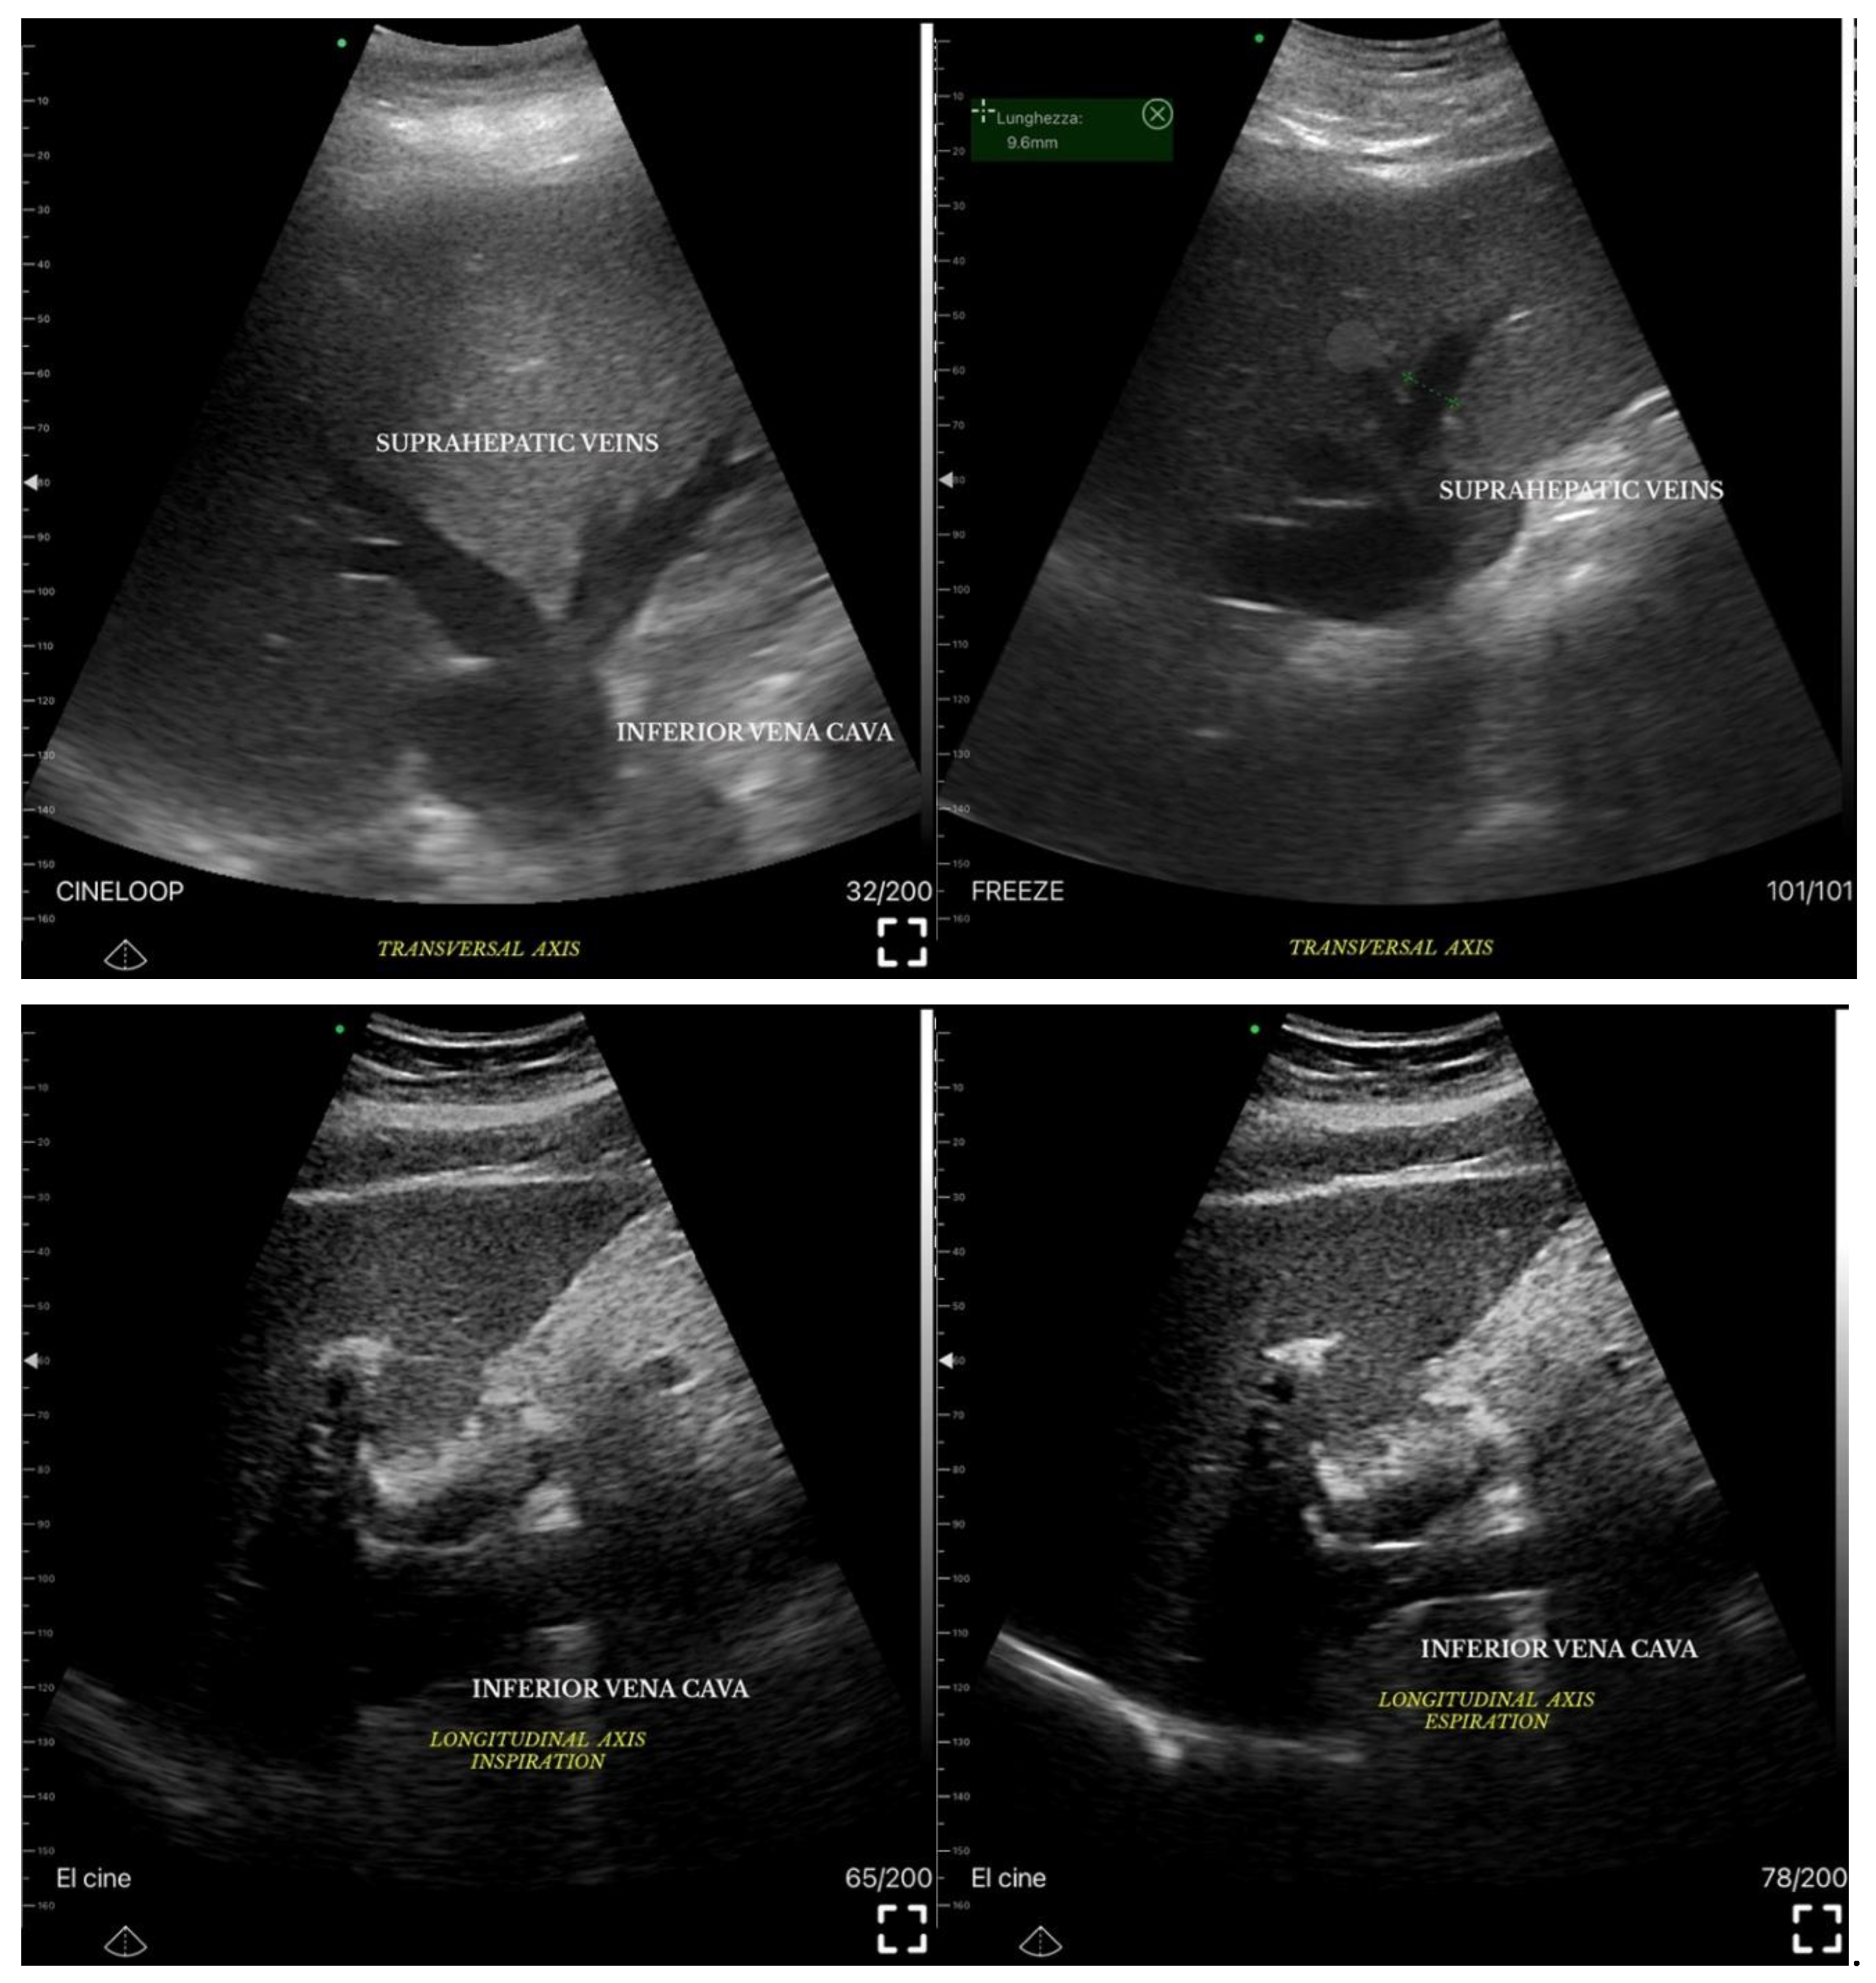
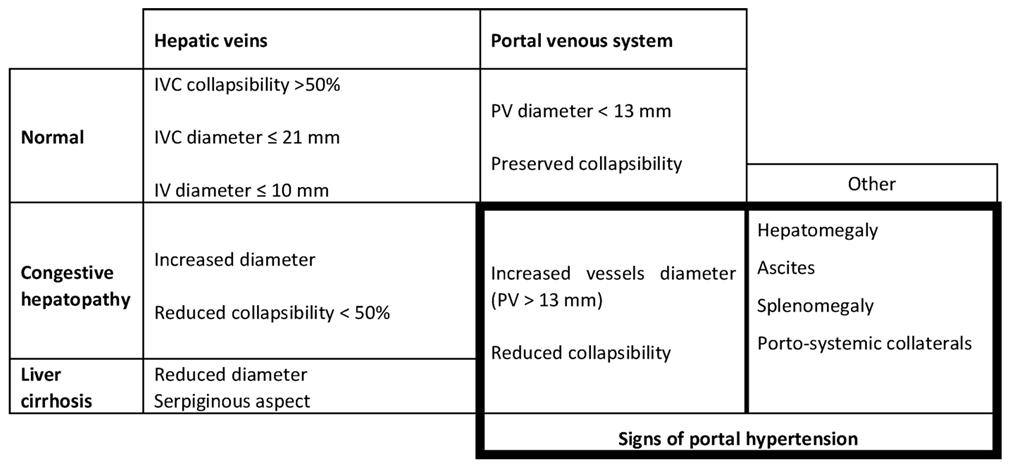
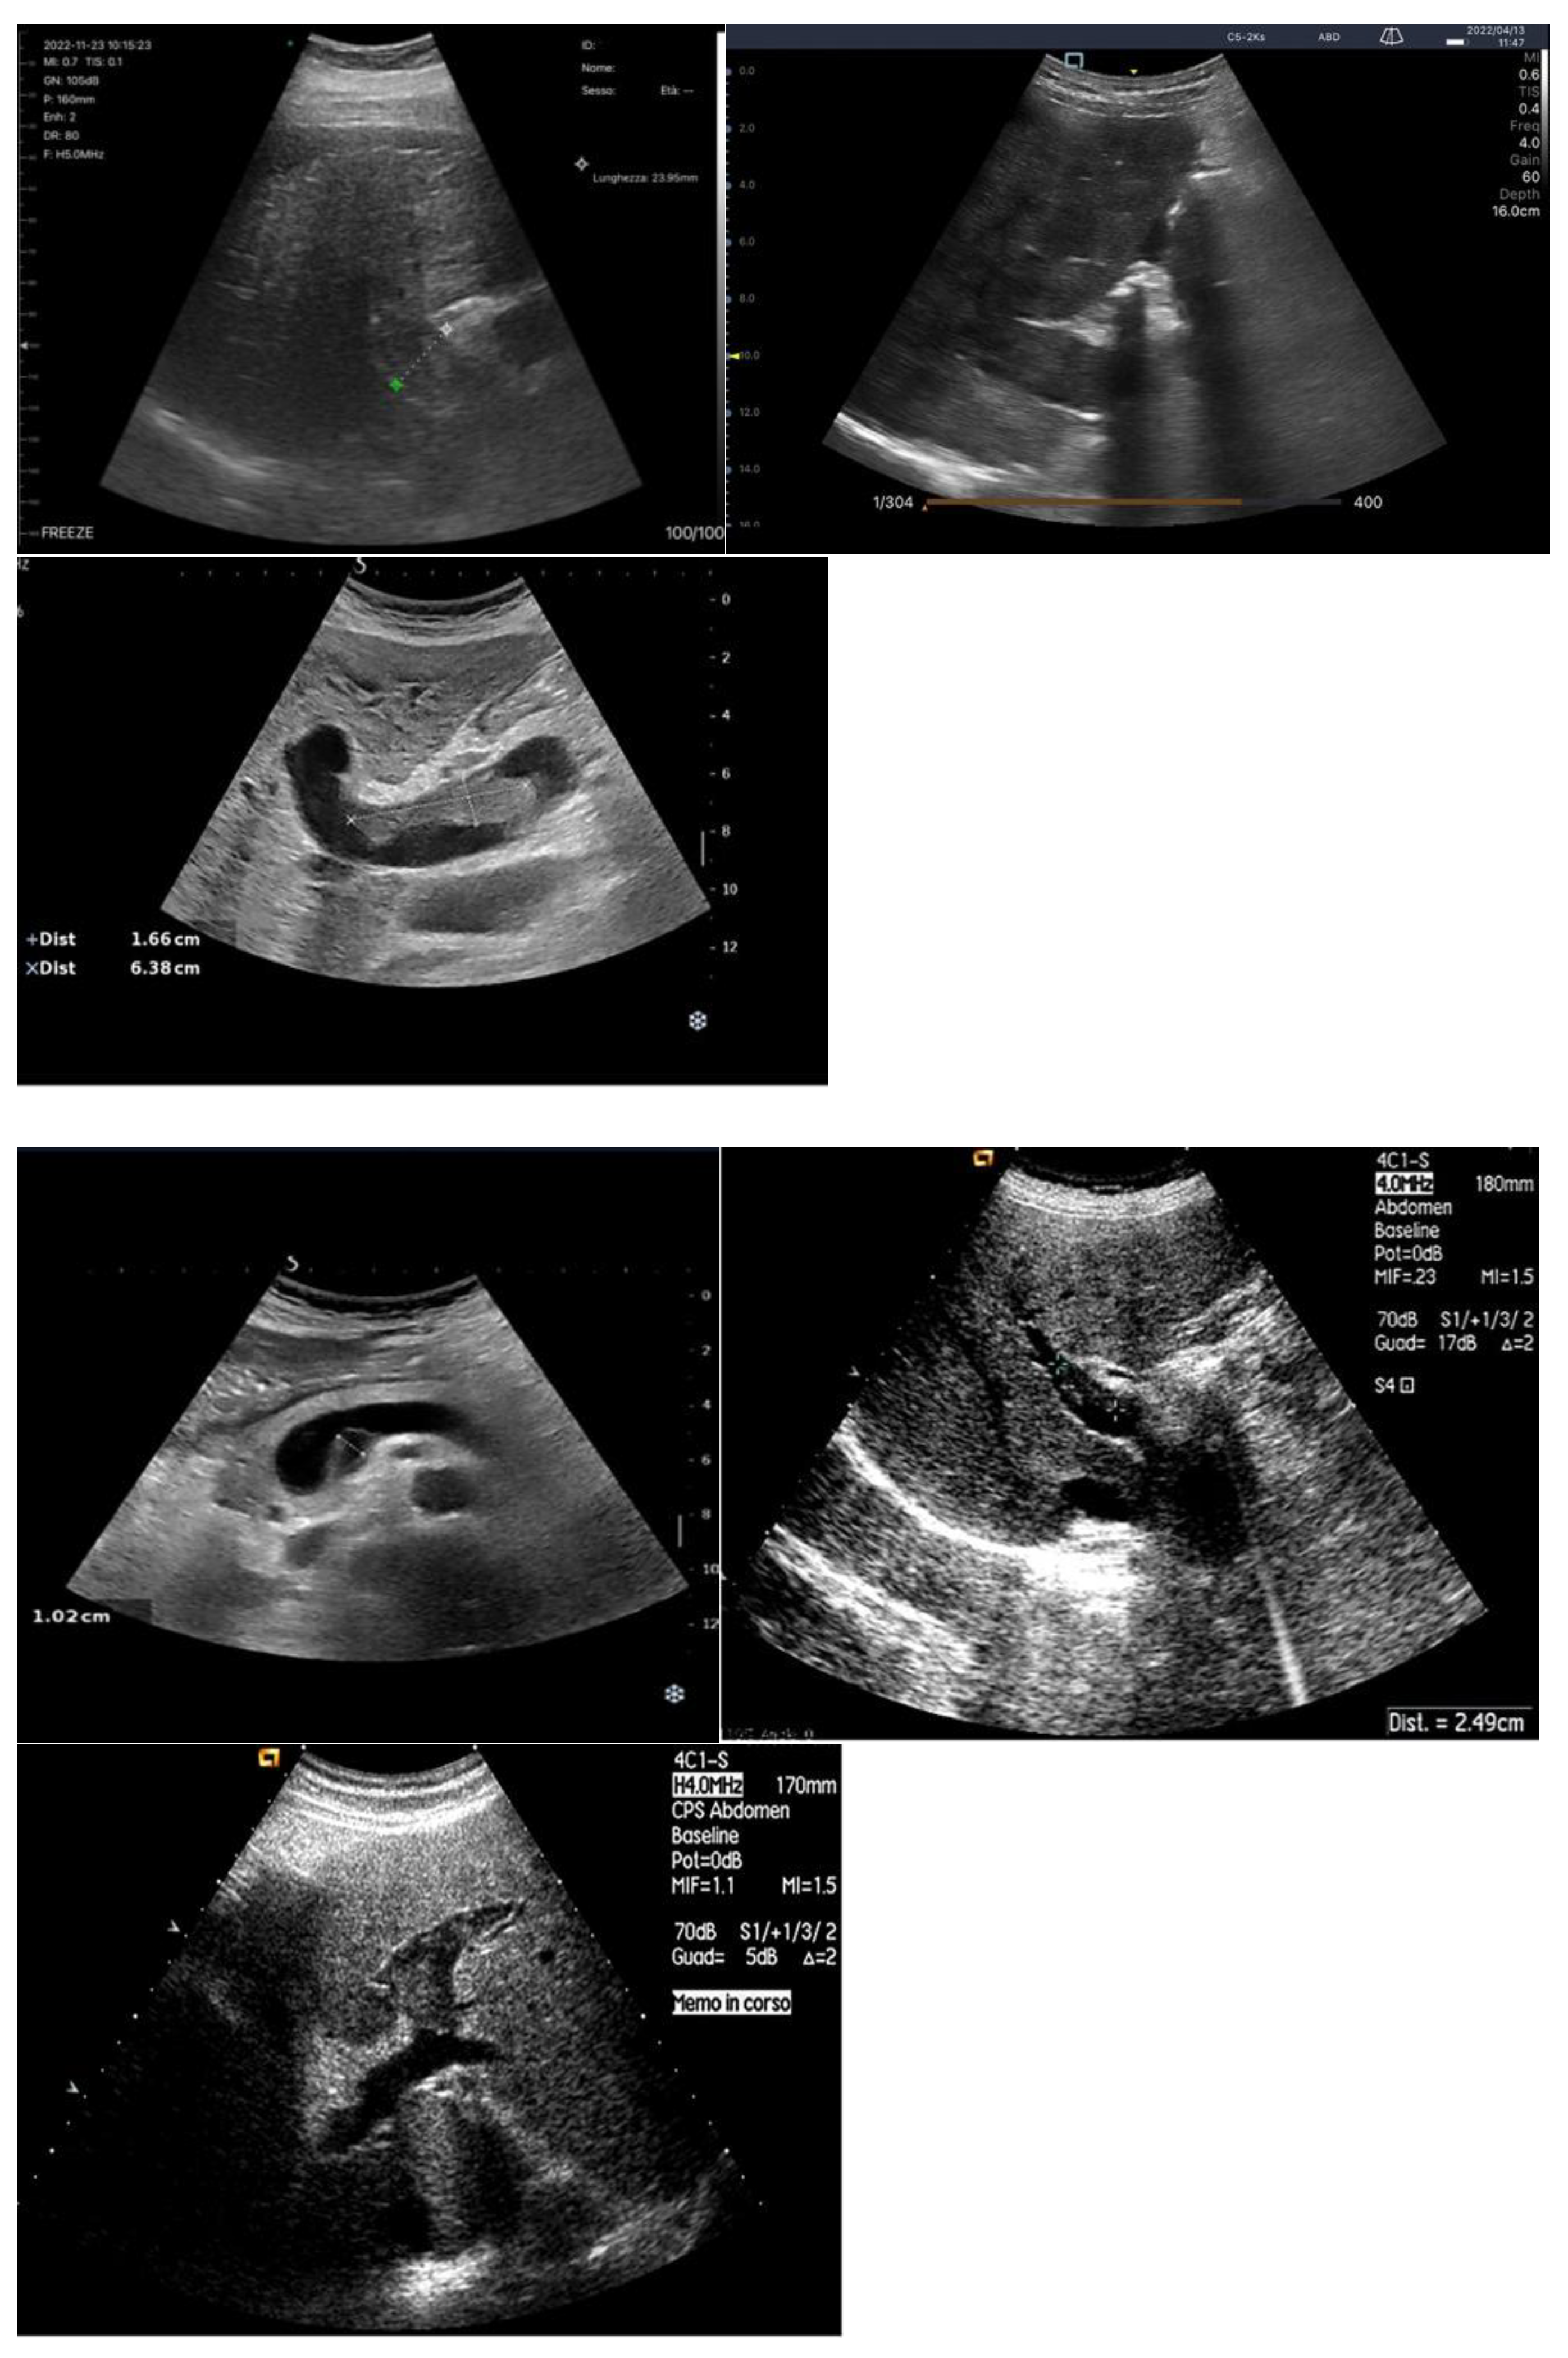
Gray-scale findings: Grayscale ultrasonography is the primary method for imaging chronic liver disease (CLD). Key findings include hepatomegaly and enlargement of the venous structures, such as the Inferior Vena Cava (IVC), Sovrahepatic Veins (SV) and Portal Vein (PV). These veins often show reduced or absent collapsibility during inspiration, which is an important indicator of the patient's fluid status[61]. The IVC's diameter and collapsibility can be measured using B-mode or M-mode, with normal IVC collapsibility greater than 50%[62] (Figure ).
Figure 5.
The Cava Vein can be seen in transverse epigastric scan along its short axis (Figure 4A). In the same scan, the Suprahepatic veins can also be appreciated (Figure 4B). By rotating the probe 90°, the inferior Vena Cava can be seen along its long axis (Figure 4C) with a larger caliber during inspiration (due to the depression created inside the abdomen during this maneuver) and a smaller caliber during expiration (Figure 4D).
The collapsibility index (IVC-CI) helps assess fluid status, with specific measurements correlating to RAP (Table ). For example, a maximum IVC diameter <2.1 cm with >50% collapse indicates RAP of 0-5 mm Hg[63]. In liver disease, especially cirrhosis and fibrosis, changes in the liver parenchyma cause alterations in the venous profile, making veins appear thin and serpentine[64]. Portal hypertension is diagnosed when the portal vein pressure exceeds 12 mm Hg or when the pressure gradient between the portal and hepatic veins is >4-6 mm Hg. In chronic hepatic disease, this portal hypertension is typically caused by increased resistance in the right atrium, which affects venous outflow[65].
While direct measurement of hepatic venous pressure gradient (HVPG) can be done through interventional radiology, ultrasound (US) offers a non-invasive way to detect portal hypertension[66]. US signs of portal hypertension include dilatation of the portal vein (>13 mm), porto-systemic collaterals, reversed blood flow in the portal vein, reduced respiratory variation in the splenic and superior mesenteric veins, reduced portal vein velocity, increased congestion index, splenomegaly, and ascites[67,68]. These features help in diagnosing the severity of portal hypertension in CLD[69] (Table ).

Table 2.
Main grayscale US findings of splanchnic veins congestion in heart failure and hepatopathies.
Table 2.
Main grayscale US findings of splanchnic veins congestion in heart failure and hepatopathies.
3.1.2. Ecocolordoppler and Spectral Velocity Variations:
Doppler ultrasonography (US) is usually the first-line modality for evaluating flow in liver vessels[70]: The vessels usually studied are the portal vein, the suprahepatic veins and the hepatic artery.
PORTAL VEIN:
Based on a review of the provided literature, the incidence of liver dysfunction and cirrhosis in the context of heart failure is a significant and clinically relevant phenomenon. The relationship is bidirectional, where cardiac dysfunction can lead to hepatic injury, and pre-existing liver disease can influence cardiac outcomes. In patients with chronic heart failure, the prevalence of congestive hepatopathy, a chronic liver condition that can progress to fibrosis, is estimated to range substantially from 15% to 65% [71,72]. This condition develops in the setting of long-standing systemic venous congestion, which is a hallmark of right-sided or biventricular heart failure. Conversely, in the acute setting, the incidence of acute cardiogenic liver injury, also known as ischemic hepatitis or "shock liver," is estimated to be between 20% and 30% in patients presenting with acute heart failure [73]. This acute injury results from a combination of passive venous congestion and sudden arterial hypoperfusion due to cardiac, circulatory, or pulmonary failure. Furthermore, the prognostic significance of liver dysfunction in heart failure patients is underscored by studies such as that by Wang et al. [74], which demonstrates that the Albumin-Bilirubin (ALBI) score, a marker of liver function, is independently associated with an increased risk of all-cause mortality in intensive care unit patients with heart failure, highlighting the critical interplay between these two organs.
The anatomy of the portal vein (PV) is assessed using B-mode imaging, with the PV located in the hepatoduodenal ligament, behind the hepatic artery and bile duct. It can be identified by tracing the splenic vein to the right until it joins the superior mesenteric vein[75]. If the PV is hard to visualize in a supine position, the patient should be examined laterally. This method shows the PV in 97% of cases, and failure to visualize it may suggest portal vein thrombosis. However, B-mode imaging is not highly accurate for detecting thrombosis or tumor invasion, so Doppler imaging is recommended for confirmation. The absence of color flow in the PV on Doppler imaging is highly sensitive and specific for diagnosing thrombosis[76].
The normal diameter of the PV is less than 10 mm, with slight increases due to food intake or respiration. In portal hypertension, the PV dilates to over 13 mm and shows little change with respiration. Congestive heart failure can also cause PV dilation, but the IVC will also dilate and the blood flow will be pulsatile in both the portal and hepatic veins. A normal hepatic vein waveform is triphasic, while in portal hypertension, it is often biphasic or monophasic[77] (
Figure 83.
in determining direction of portal blood flow when compared to gold standard angiography[78]. Hepatofugal flow (away from the liver) suggests portal hypertension[79].
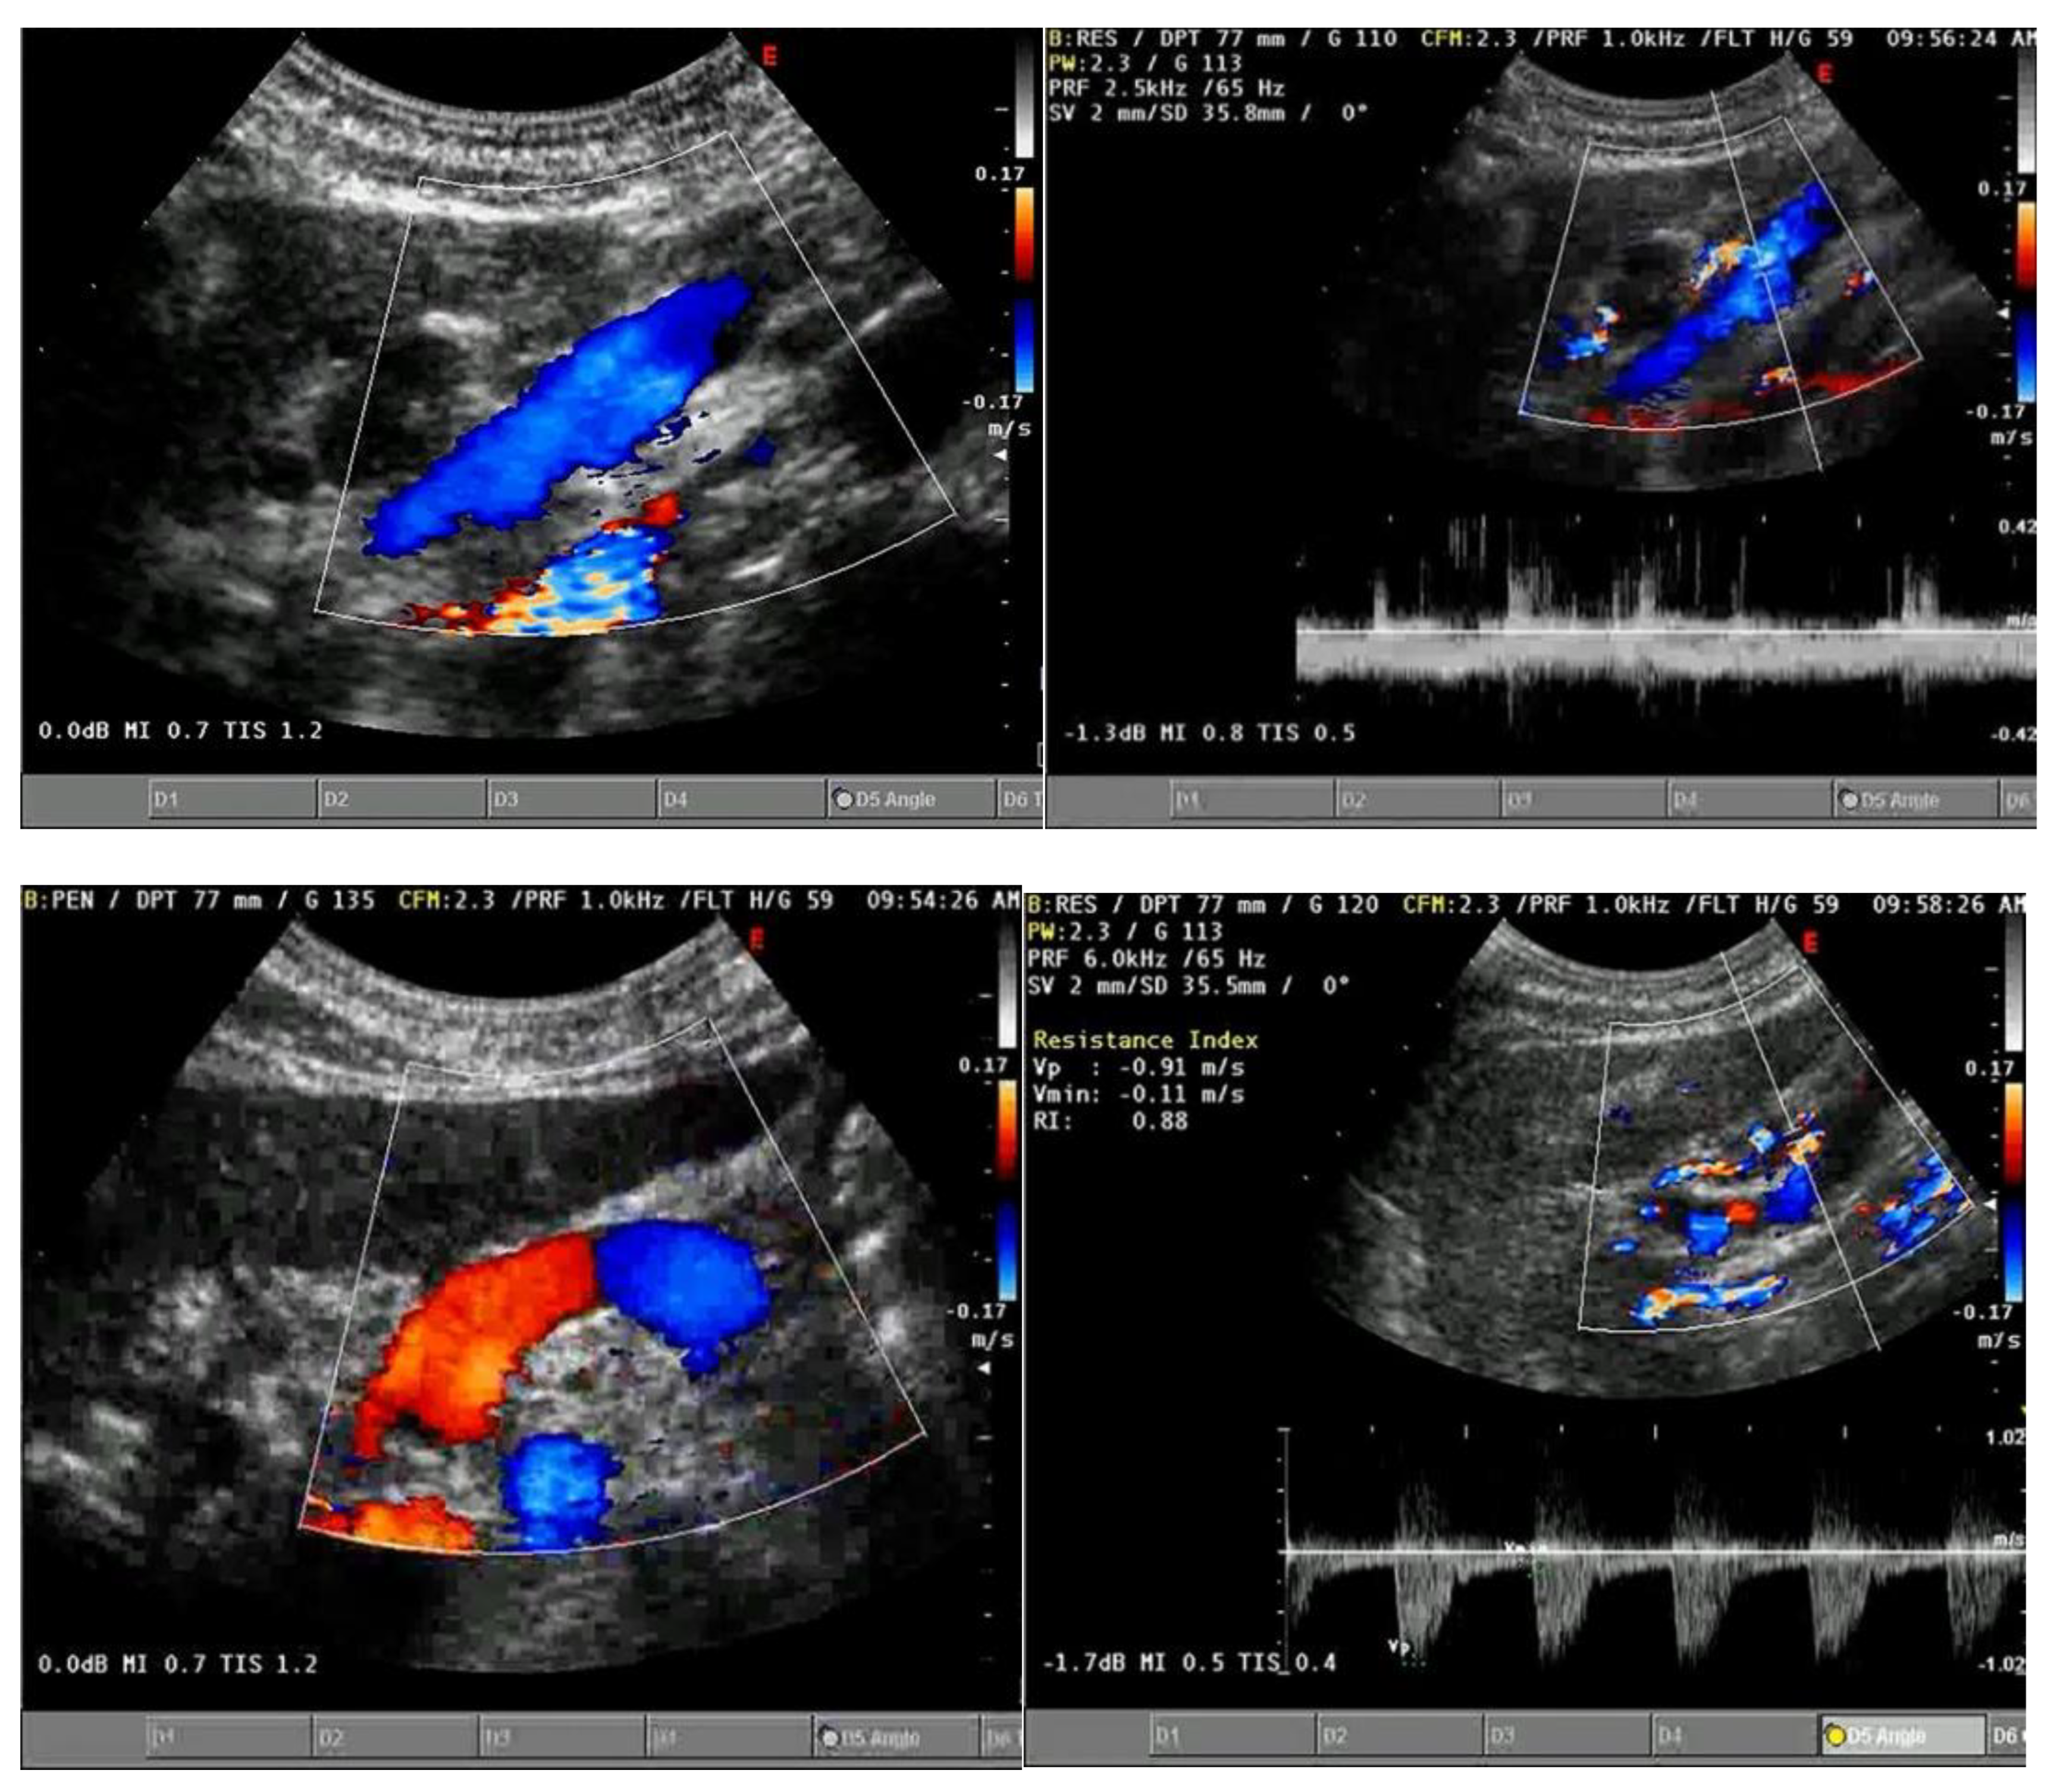
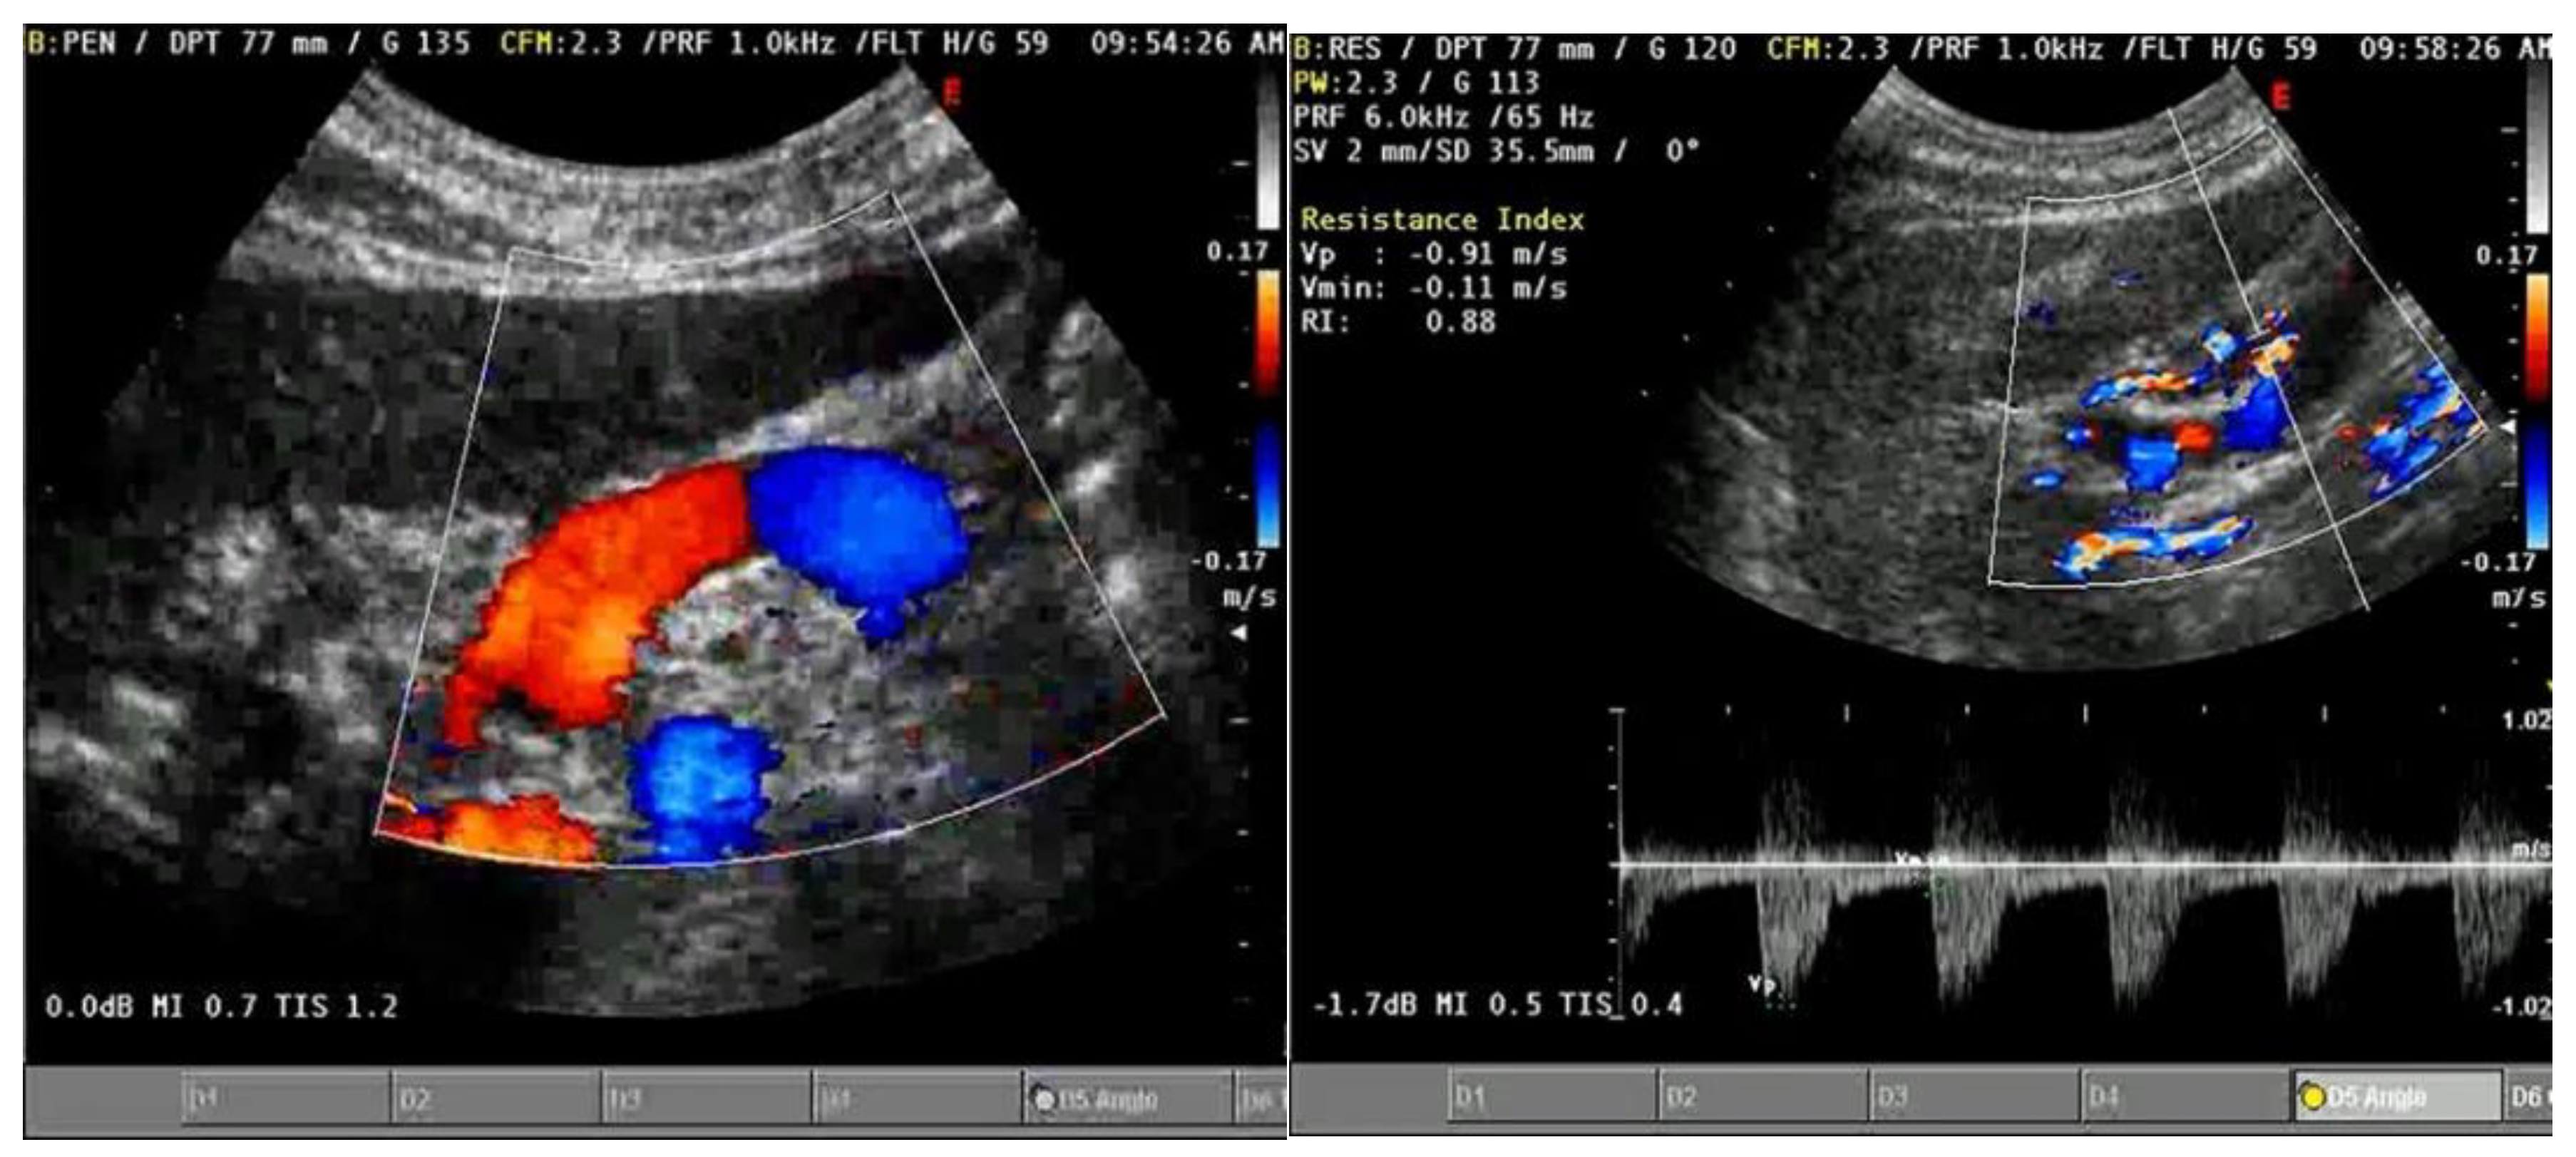
Figure 6.
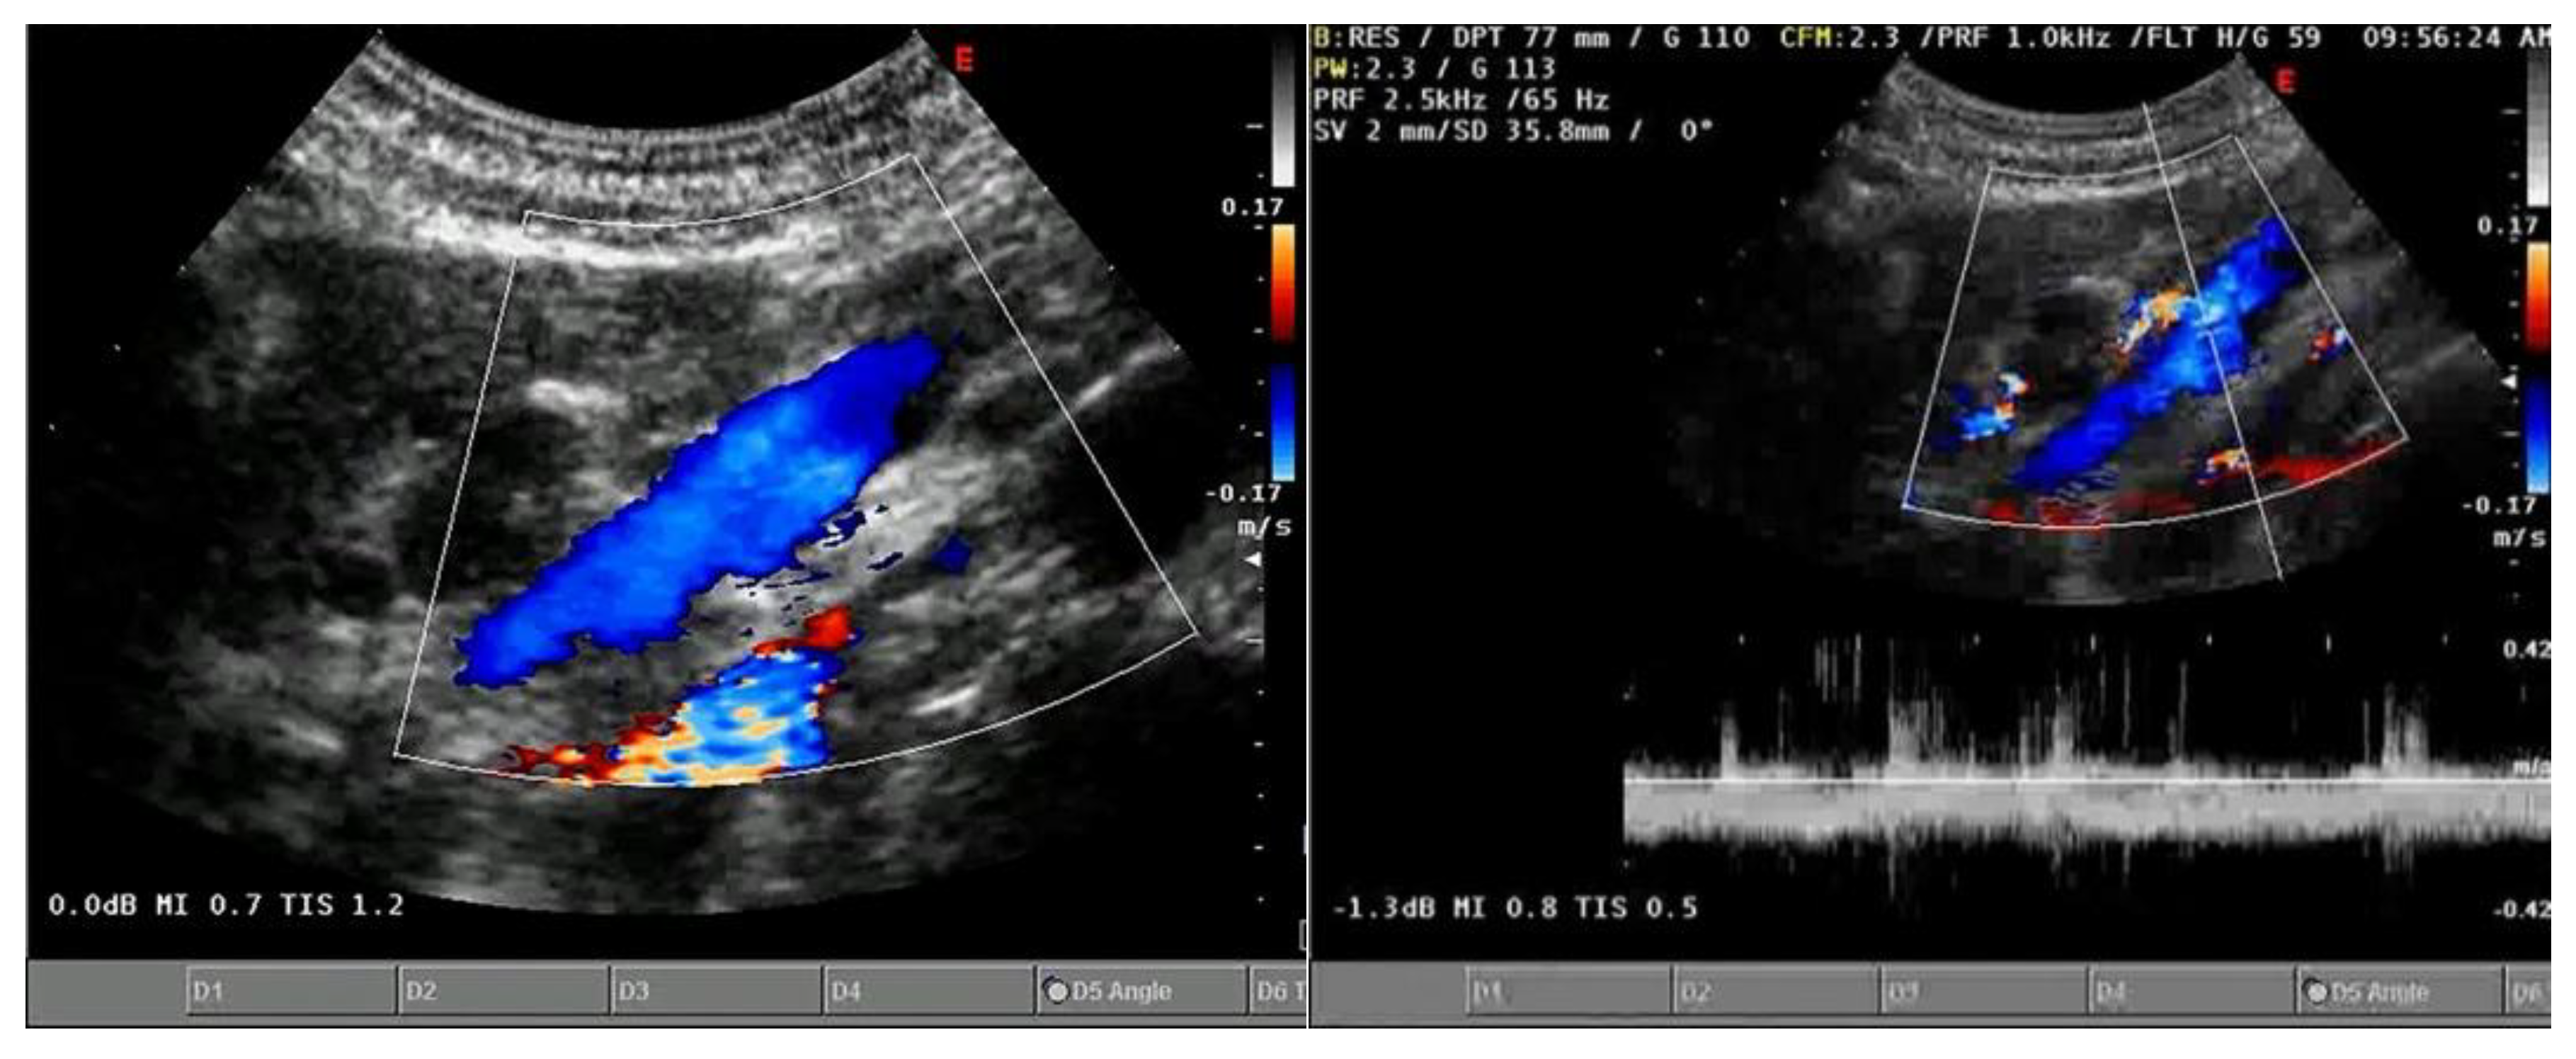
The Portal Vein can be examined via the right subcostal approach: the blue color in this scan indicates a hepatopetal flow (Figure 5a); the evaluation of the same vein with pulsed Doppler confirms a hepatopetal and still biphasic flow (Figure 5B); the Splenic Vein shows a double coloration of the flow on color Doppler (dependent on the direction of the flow relative to the vessel scanning point) but still demonstrates hepatopetal vascularization (Figure 5C); the pulsed Doppler study of the hepatic artery reveals a high resistance index (Figure 5D).
Figure 6.
The Portal Vein can be examined via the right subcostal approach: the blue color in this scan indicates a hepatopetal flow (Figure 5a); the evaluation of the same vein with pulsed Doppler confirms a hepatopetal and still biphasic flow (Figure 5B); the Splenic Vein shows a double coloration of the flow on color Doppler (dependent on the direction of the flow relative to the vessel scanning point) but still demonstrates hepatopetal vascularization (Figure 5C); the pulsed Doppler study of the hepatic artery reveals a high resistance index (Figure 5D).
Additionally, collaterals such as the left coronary vein, paraumbilical vein, splenorenal collaterals, and gastroesophageal collaterals should be assessed (Figure ). A diameter of over 5 mm in the left coronary vein suggests portal hypertension[80], and a dilated paraumbilical vein is a sensitive indicator of the condition if hepatofugal flow is present[81].
Figure 7.
left coronary vein and Paraumbelical vein.
The velocity of blood flow in the portal vein (PV) is measured using Doppler tracings, with normal flow ranging from 15–20 cm/s (0.15–0.20 m/s) [82]. After assessing PV diameter and flow velocity, other hemodynamic measurements can be made. In portal hypertension, blood flow increases while velocity decreases[83], and the congestion index[84], which combines both velocity and PV diameter, is a more reliable marker for diagnosing portal hypertension (PHT).
To understand portal venous flow, two key concepts are important. First, normal flow should always be antegrade (toward the transducer), which creates a waveform above the baseline. Second, hepatic venous pulsatility is partially transmitted to the portal veins through the hepatic sinusoids, explaining the cardiac variability seen in the portal venous waveform. It's also important to note that the flow velocity in the portal vein is relatively low (16–40 cm/sec) compared to the hepatic artery[70].
The normal portal venous waveform gently undulates and remains above the baseline[85]. The peak velocity (V1) occurs during systole, while the trough velocity (V2) occurs at end diastole. This variation is influenced by atrial contraction at end diastole, which creates back pressure transmitted through the hepatic veins and sinusoids, leading to a decrease in forward portal venous flow (the trough). In cases like tricuspid regurgitation, portal venous pulsatility may increase, making the waveform resemble an inverted hepatic venous waveform[86].
The degree of waveform undulation can be quantified with a pulsatility index (PI). The PI for the portal vein is calculated differently than for the hepatic artery, using the formula PI = V2/V1, with V1 typically greater than 0.5. Lower PIs indicate higher pulsatility. The terms "antegrade" and "hepatopetal" both describe the normal flow direction in the portal vein [87].
A linear relationship between RAP and portal vein pulsatility index has been observed in patients with acute exacerbations of congestive heart failure (CHF) [88]. A case series by Denault et al. found portal vein Doppler assessment to be a promising tool for detecting end-organ venous congestion in post-cardiac surgery patients. However, variations in the portal vein can occur due to factors like body shape and intrathoracic pressure [89]. Venous congestion causes IVC distension, hepatic venous flow abnormalities, and portal vein pulsatility, along with renal venous Doppler flow issues. These findings were incorporated into the VEXUS scoring system [87,90].
Abnormal (pathologic) portal venous flow can manifest in four main ways:
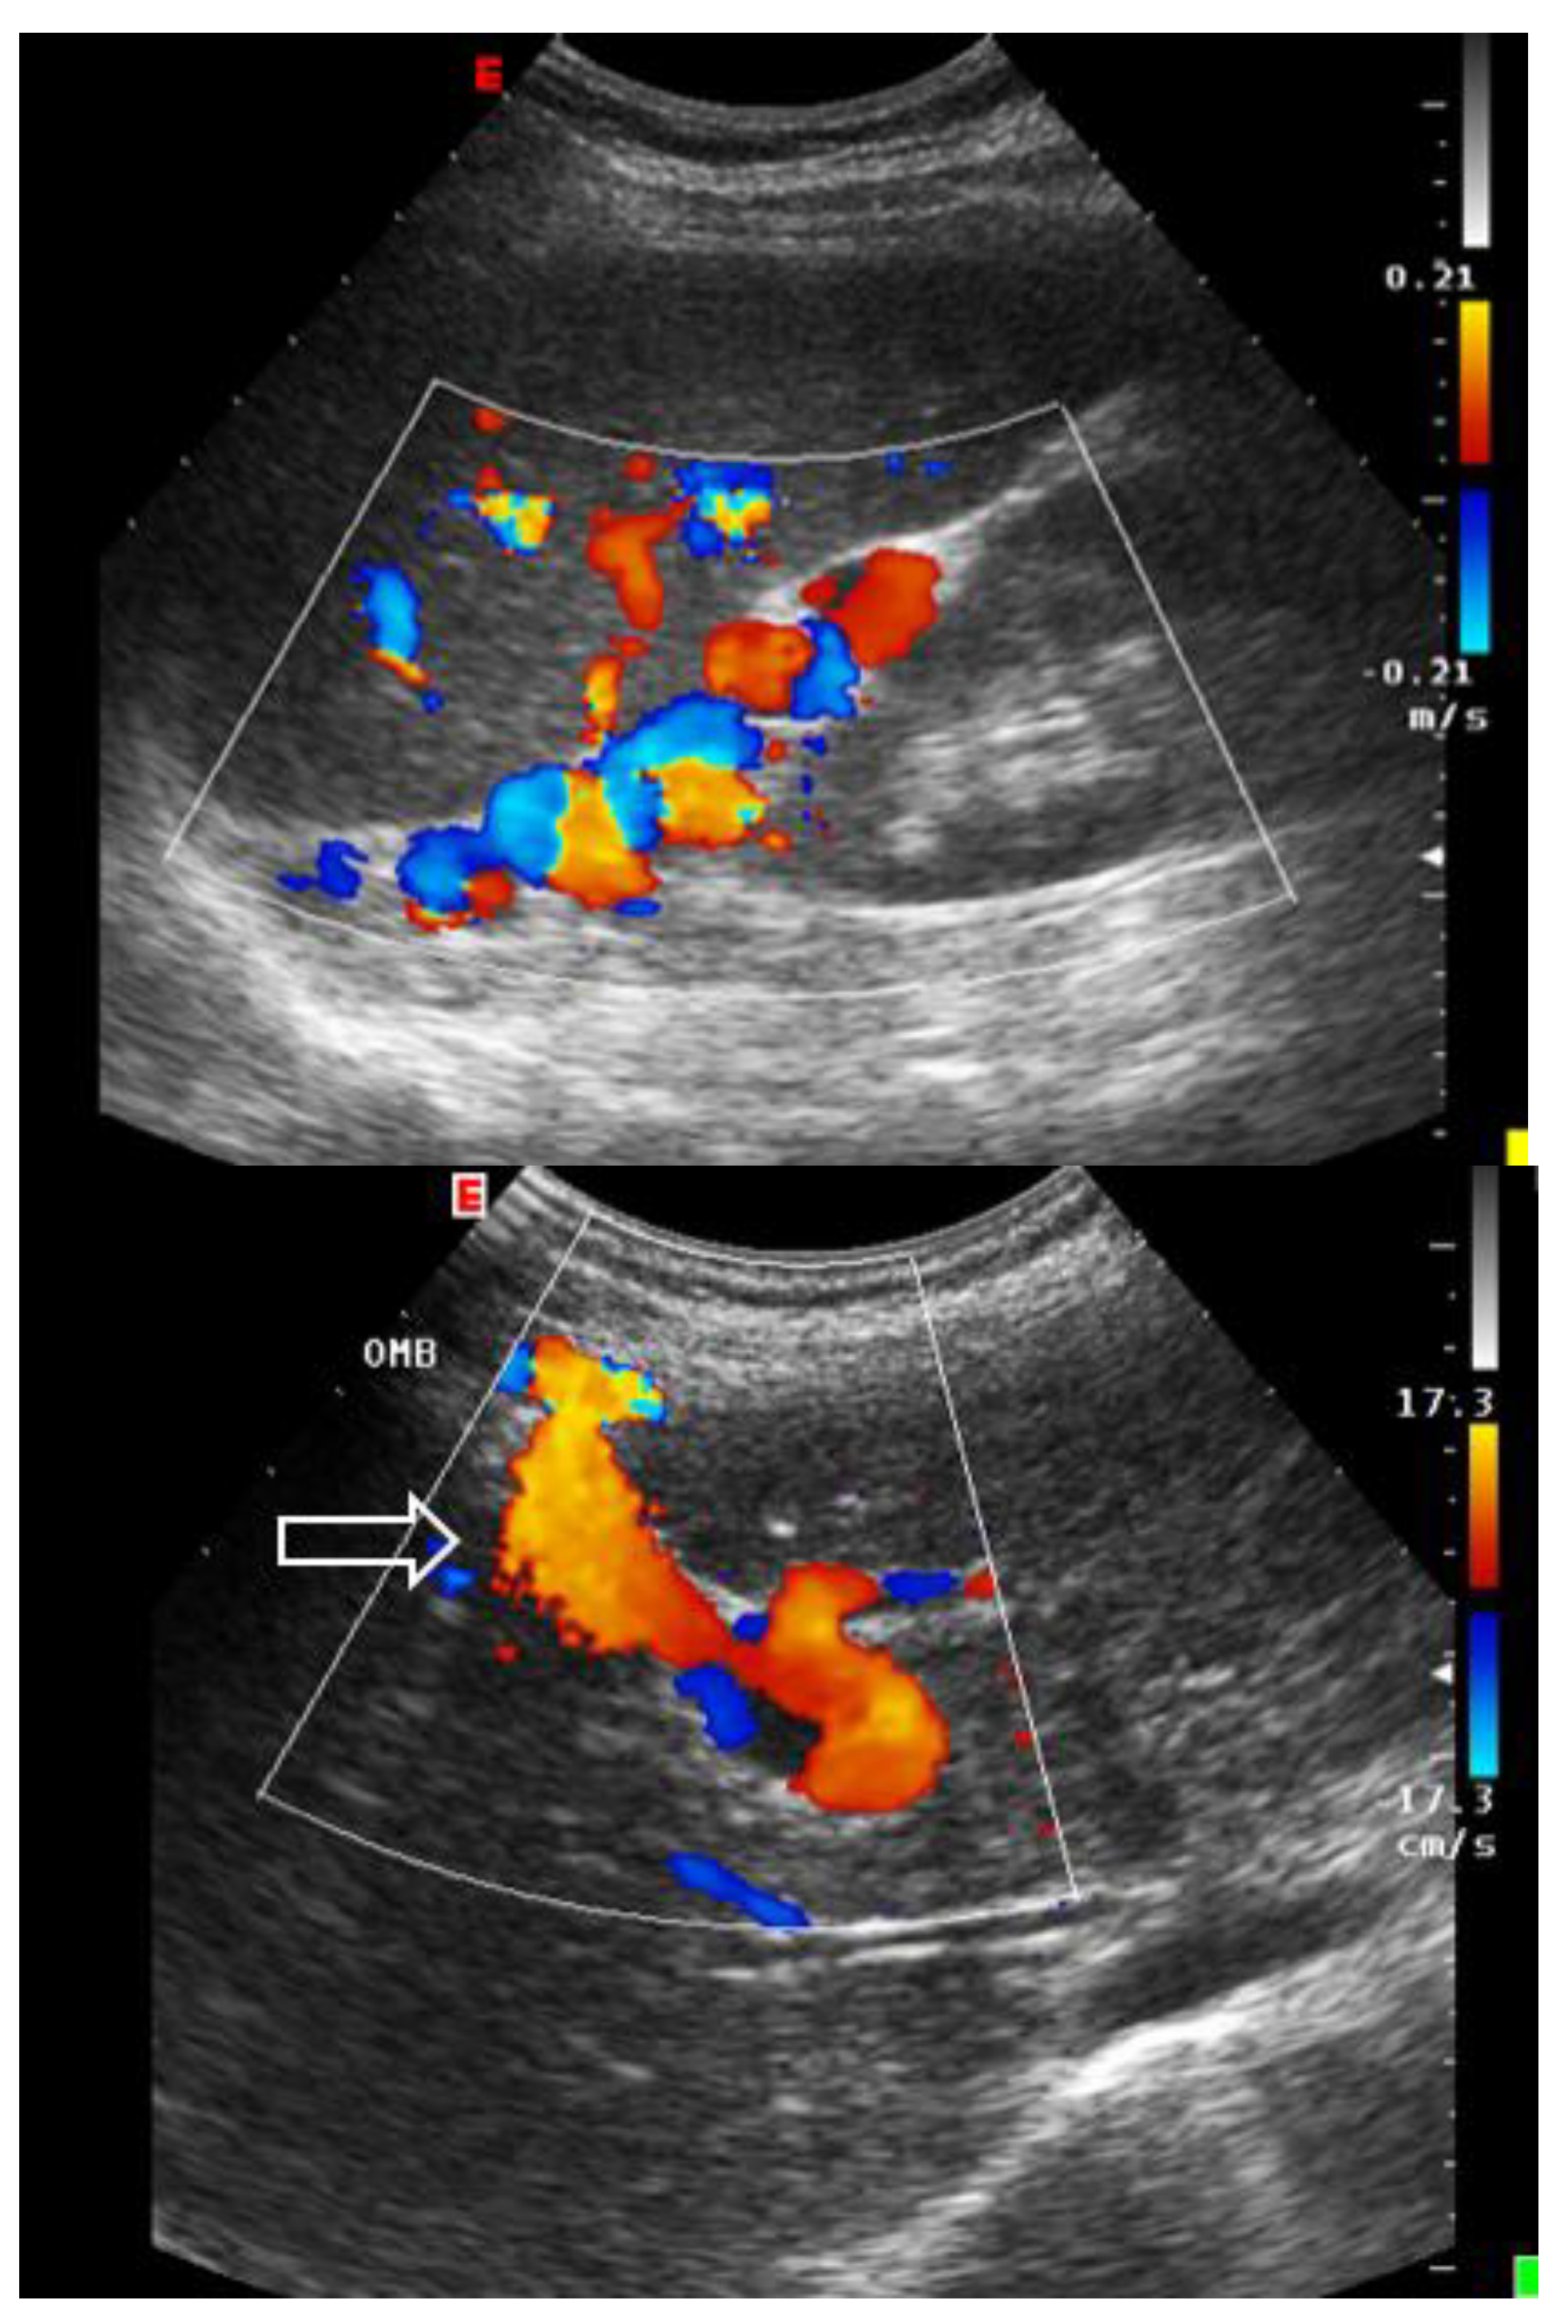
1. Increased Pulsatility (Pulsatile Waveform): A pulsatile portal venous flow occurs when there is a significant difference between peak systolic and end-diastolic velocities. This is due to abnormal transmission of pressure through the hepatic sinusoids, often caused by conditions like tricuspid regurgitation, right-sided heart failure (CHF), or arteriovenous shunting (as seen in cirrhosis or hereditary hemorrhagic telangiectasia (Figure A) [91]. Pulsatility can be differentiated clinically, with right-sided CHF and tricuspid regurgitation identifiable through the hepatic venous waveform and gray-scale US showing dilated hepatic veins, unlike in cirrhosis, where hepatic veins are compressed.
2. Slow Portal Venous Flow: Slow flow occurs when back pressure restricts forward flow, typically indicating portal hypertension. In these cases, peak velocity is less than 16 cm/sec [92]. Causes of portal hypertension include cirrhosis, portal vein thrombosis (prehepatic), and right-sided heart failure (posthepatic). The most specific findings include the development of portosystemic shunts (like a recanalized umbilical vein) and slow or reversed (hepatofugal) flow.
3. Hepatofugal (Retrograde) Flow: Hepatofugal flow happens when the pressure in the portal vein exceeds that of the liver, causing flow to reverse and appear below the baseline. This is another indicator of portal hypertension, which can be caused by various conditions, including cirrhosis, right-sided heart failure and other portal vein obstructions [93] (Figure ).
Figure 8.
A: Increased pulsatility due to arteriovenous shunting In a case of hereditary hemorrhagic telangiectasia; B: Reduced Portal Flow in a case of cirrhosis C: Hepatofugal Flow of Portal Vein is a late sign of Portal Hypertension. It happens when the pressure in the portal vein exceeds that of the liver, causing flow to reverse and appear below the baseline. This is another indicator of portal hypertension, which can be caused by various conditions, including cirrhosis, right-sided heart failure and other portal vein obstructions.
4. Absent (Aphasic) Portal Venous Flow:
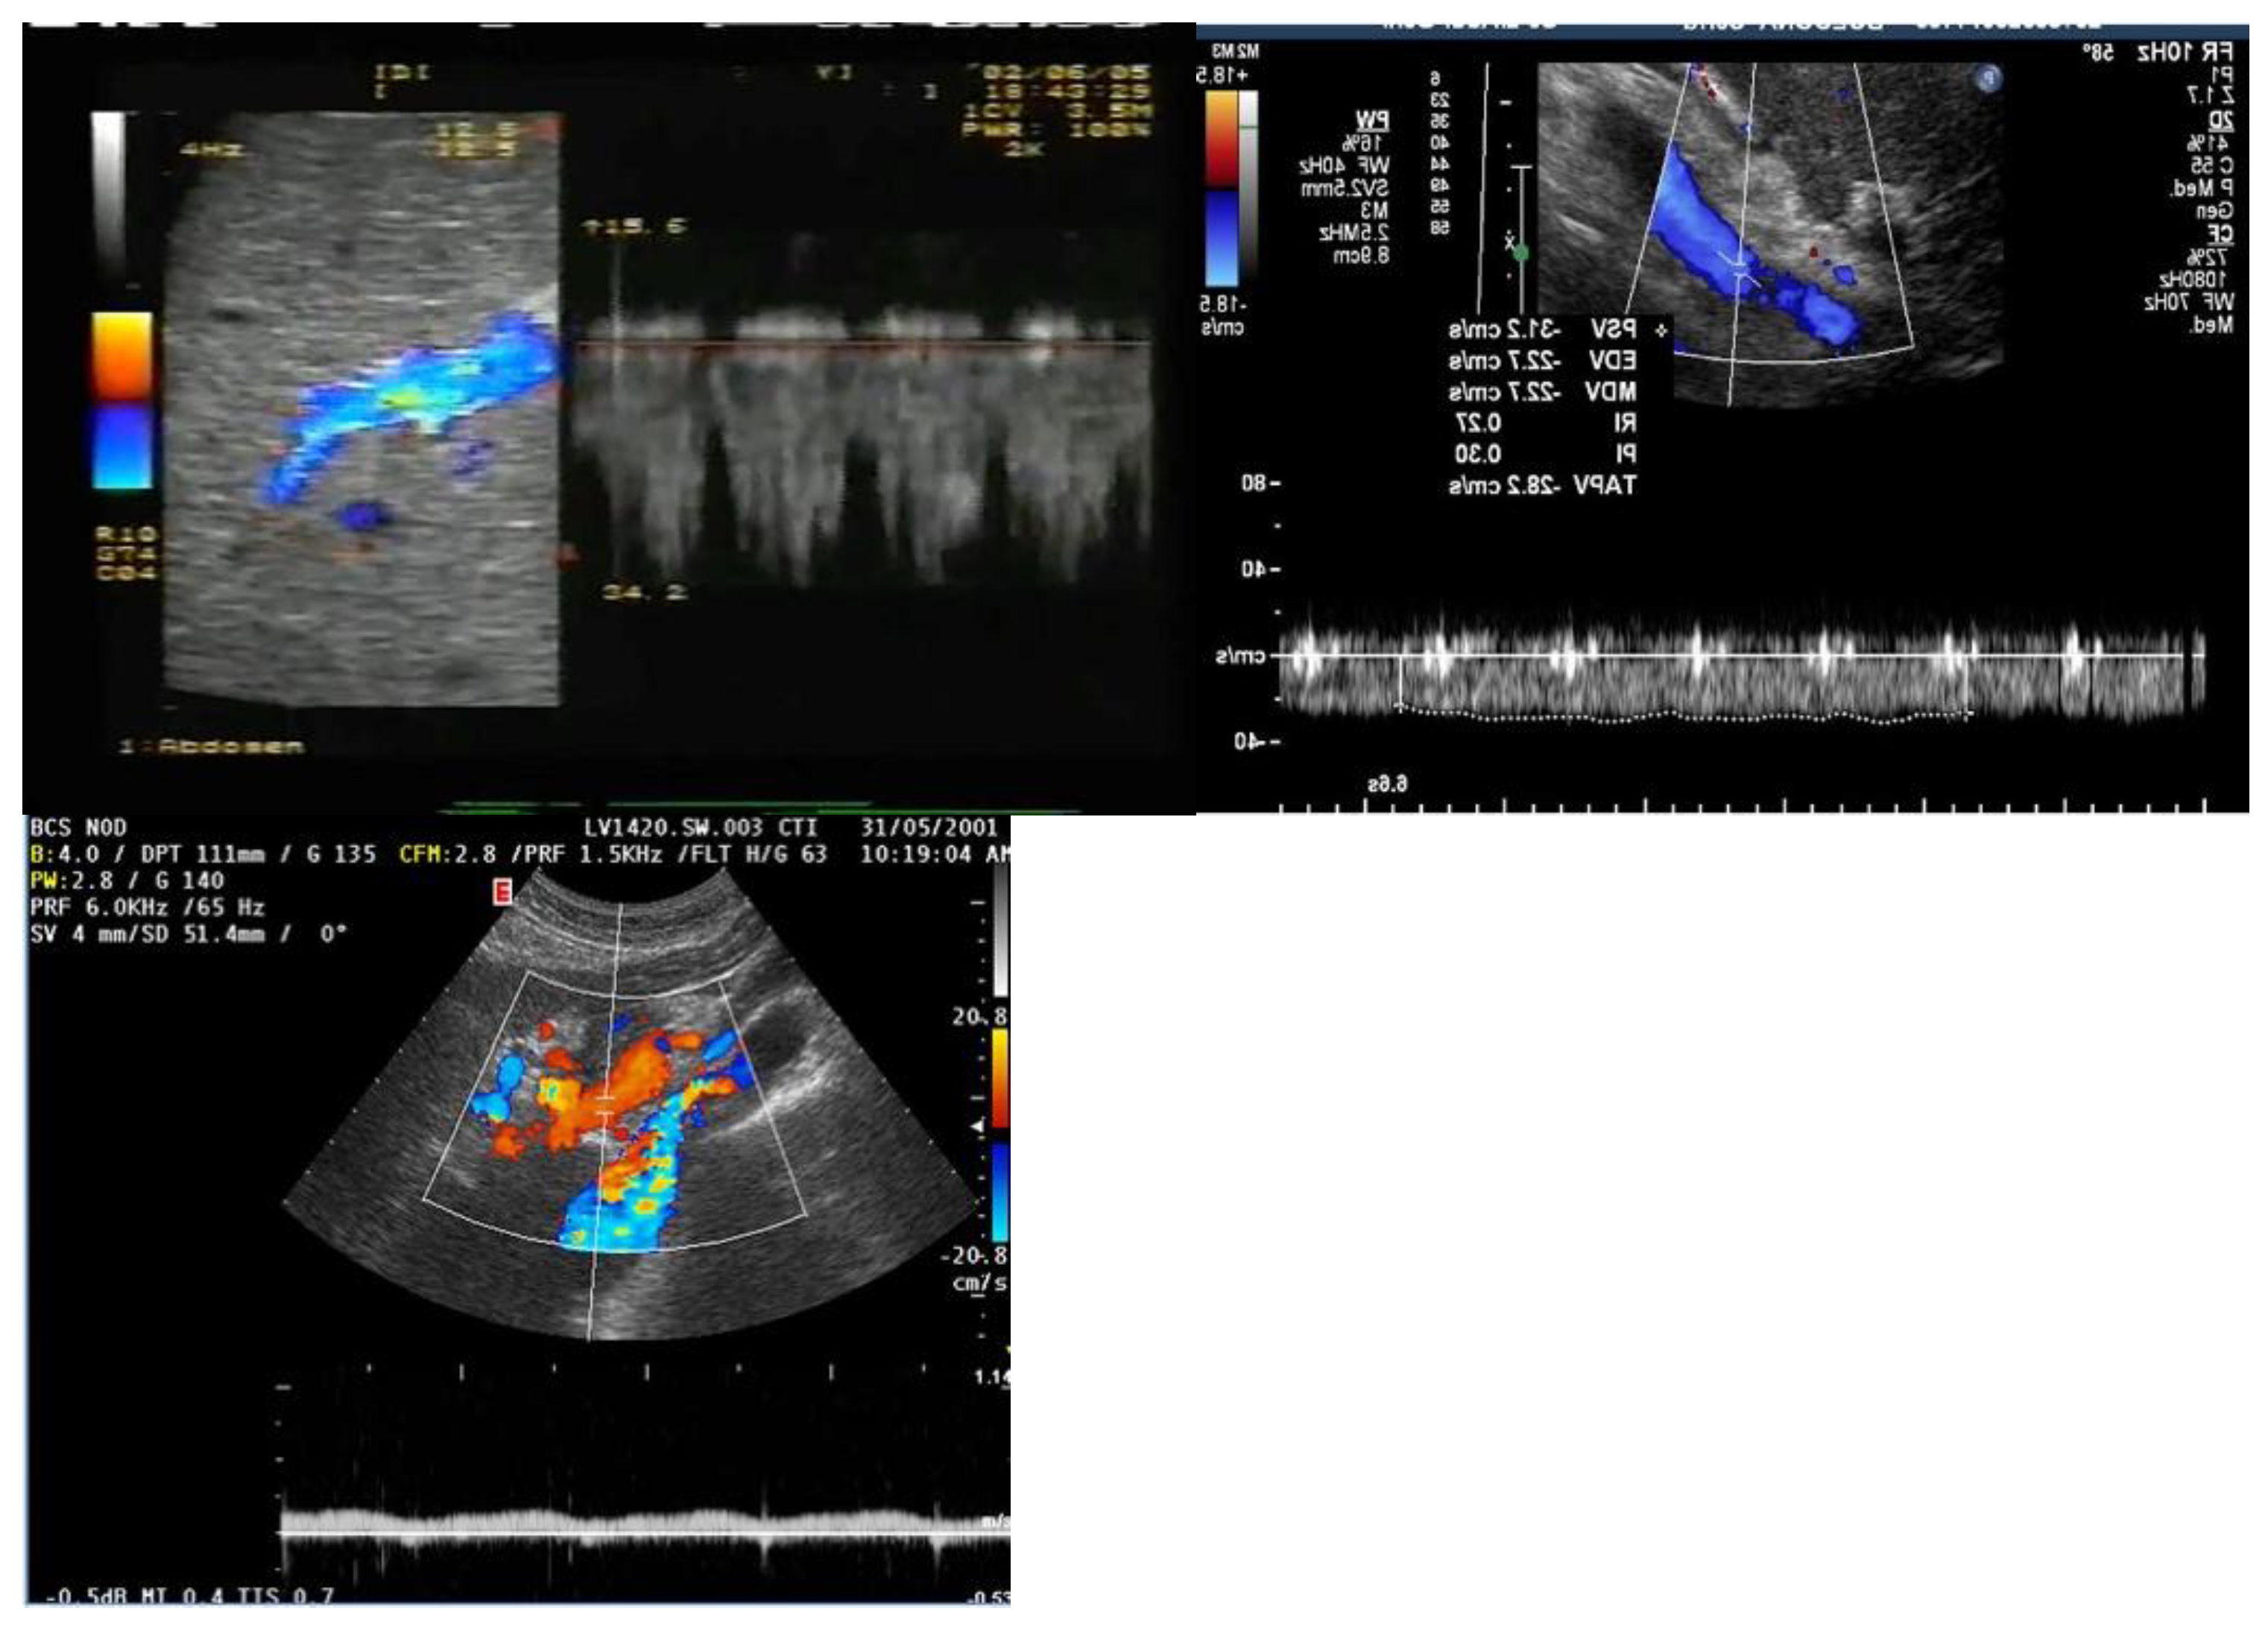
Absent flow in the portal vein may result from stagnant flow due to severe portal hypertension or occlusive disease, often from thrombosis (either benign -Figure A - or malignant -Figure b-). In cases of occlusive thrombosis, the portal vein will be completely blocked, showing no flow on Doppler [94]. However, in severe portal hypertension, absent flow can occur when the flow is neither hepatopetal nor hepatofugal (stagnant), increasing the risk of portal vein thrombosis. Tumor thrombus (malignant thrombosis) in the portal vein is often associated with a liver mass, and color Doppler can show arterial (pulsatile) waveforms within the thrombus, known as the "thread and streak sign." Cavernous transformation, the development of collateral vessels around an occluded portal vein, typically occurs in benign thrombosis and is less common in malignant cases due to the short lifespan of patients with tumor thrombus [94].
Figure 9.
PORTAL THROMBOSIS: A. Complete benign (or vascular) Thrombosis; B. Complete malignant; C. Partial Portal Vein Thrombosis; D. Partial Splenic Vein Thrombosis; E. Partial Right branch Portal Vein Thrombosis; Partial Left branch Portal Vein Thrombosis.
Figure 9.
PORTAL THROMBOSIS: A. Complete benign (or vascular) Thrombosis; B. Complete malignant; C. Partial Portal Vein Thrombosis; D. Partial Splenic Vein Thrombosis; E. Partial Right branch Portal Vein Thrombosis; Partial Left branch Portal Vein Thrombosis.
Finally, an Italian Study [95] demonstrated the effectiveness of contrast-enhanced ultrasonography (CEUS) and spiral computed tomography (CT) in detecting and characterizing portal vein thrombosis associated with hepatocellular carcinoma (HCC). The study included 50 patients with biopsy-confirmed portal vein thrombi, detected using ultrasonography (US) and color Doppler US. Among the thrombi, 13 affected the main portal trunk, and 37 involved segmental branches. Both CEUS and CT were performed within a week of the biopsy. Diagnoses of thrombosis (present/absent) and its nature (malignant/benign) were made by experienced readers and compared to pathological findings for accuracy.
Results showed that CEUS detected all 50 thrombi (100%) and correctly characterized 49 of them (98%). In contrast, CT detected 34 thrombi (68%) and correctly characterized 23 of those (68%). CEUS outperformed CT significantly in both thrombus detection (P < 0.0001) and characterization (P = 0.0001). The study concluded that CEUS is significantly superior to CT for detecting and characterizing portal vein thrombosis complicating HCC and should be considered in the staging of these tumors.
HEPATIC VEINS:
To understand the hepatic venous waveform, two key concepts must be recognized[96]. First, the majority of hepatic venous flow is antegrade, meaning it flows away from the liver toward the heart. This flow is typically displayed below the baseline in waveform analysis. Second, changes in pressure within the right atrium influence hepatic veins, and imagining being inside the right atrium helps predict blood flow direction and speed throughout the cardiac cycle.
The waveform can be decoded by understanding the pressure changes in the right atrium during the cardiac cycle[82]. An increase in RAP, such as during atrial contraction near the end of diastole, causes the waveform to slope upward, while a decrease in RAP, such as during early systole, causes the wave to slope downward.
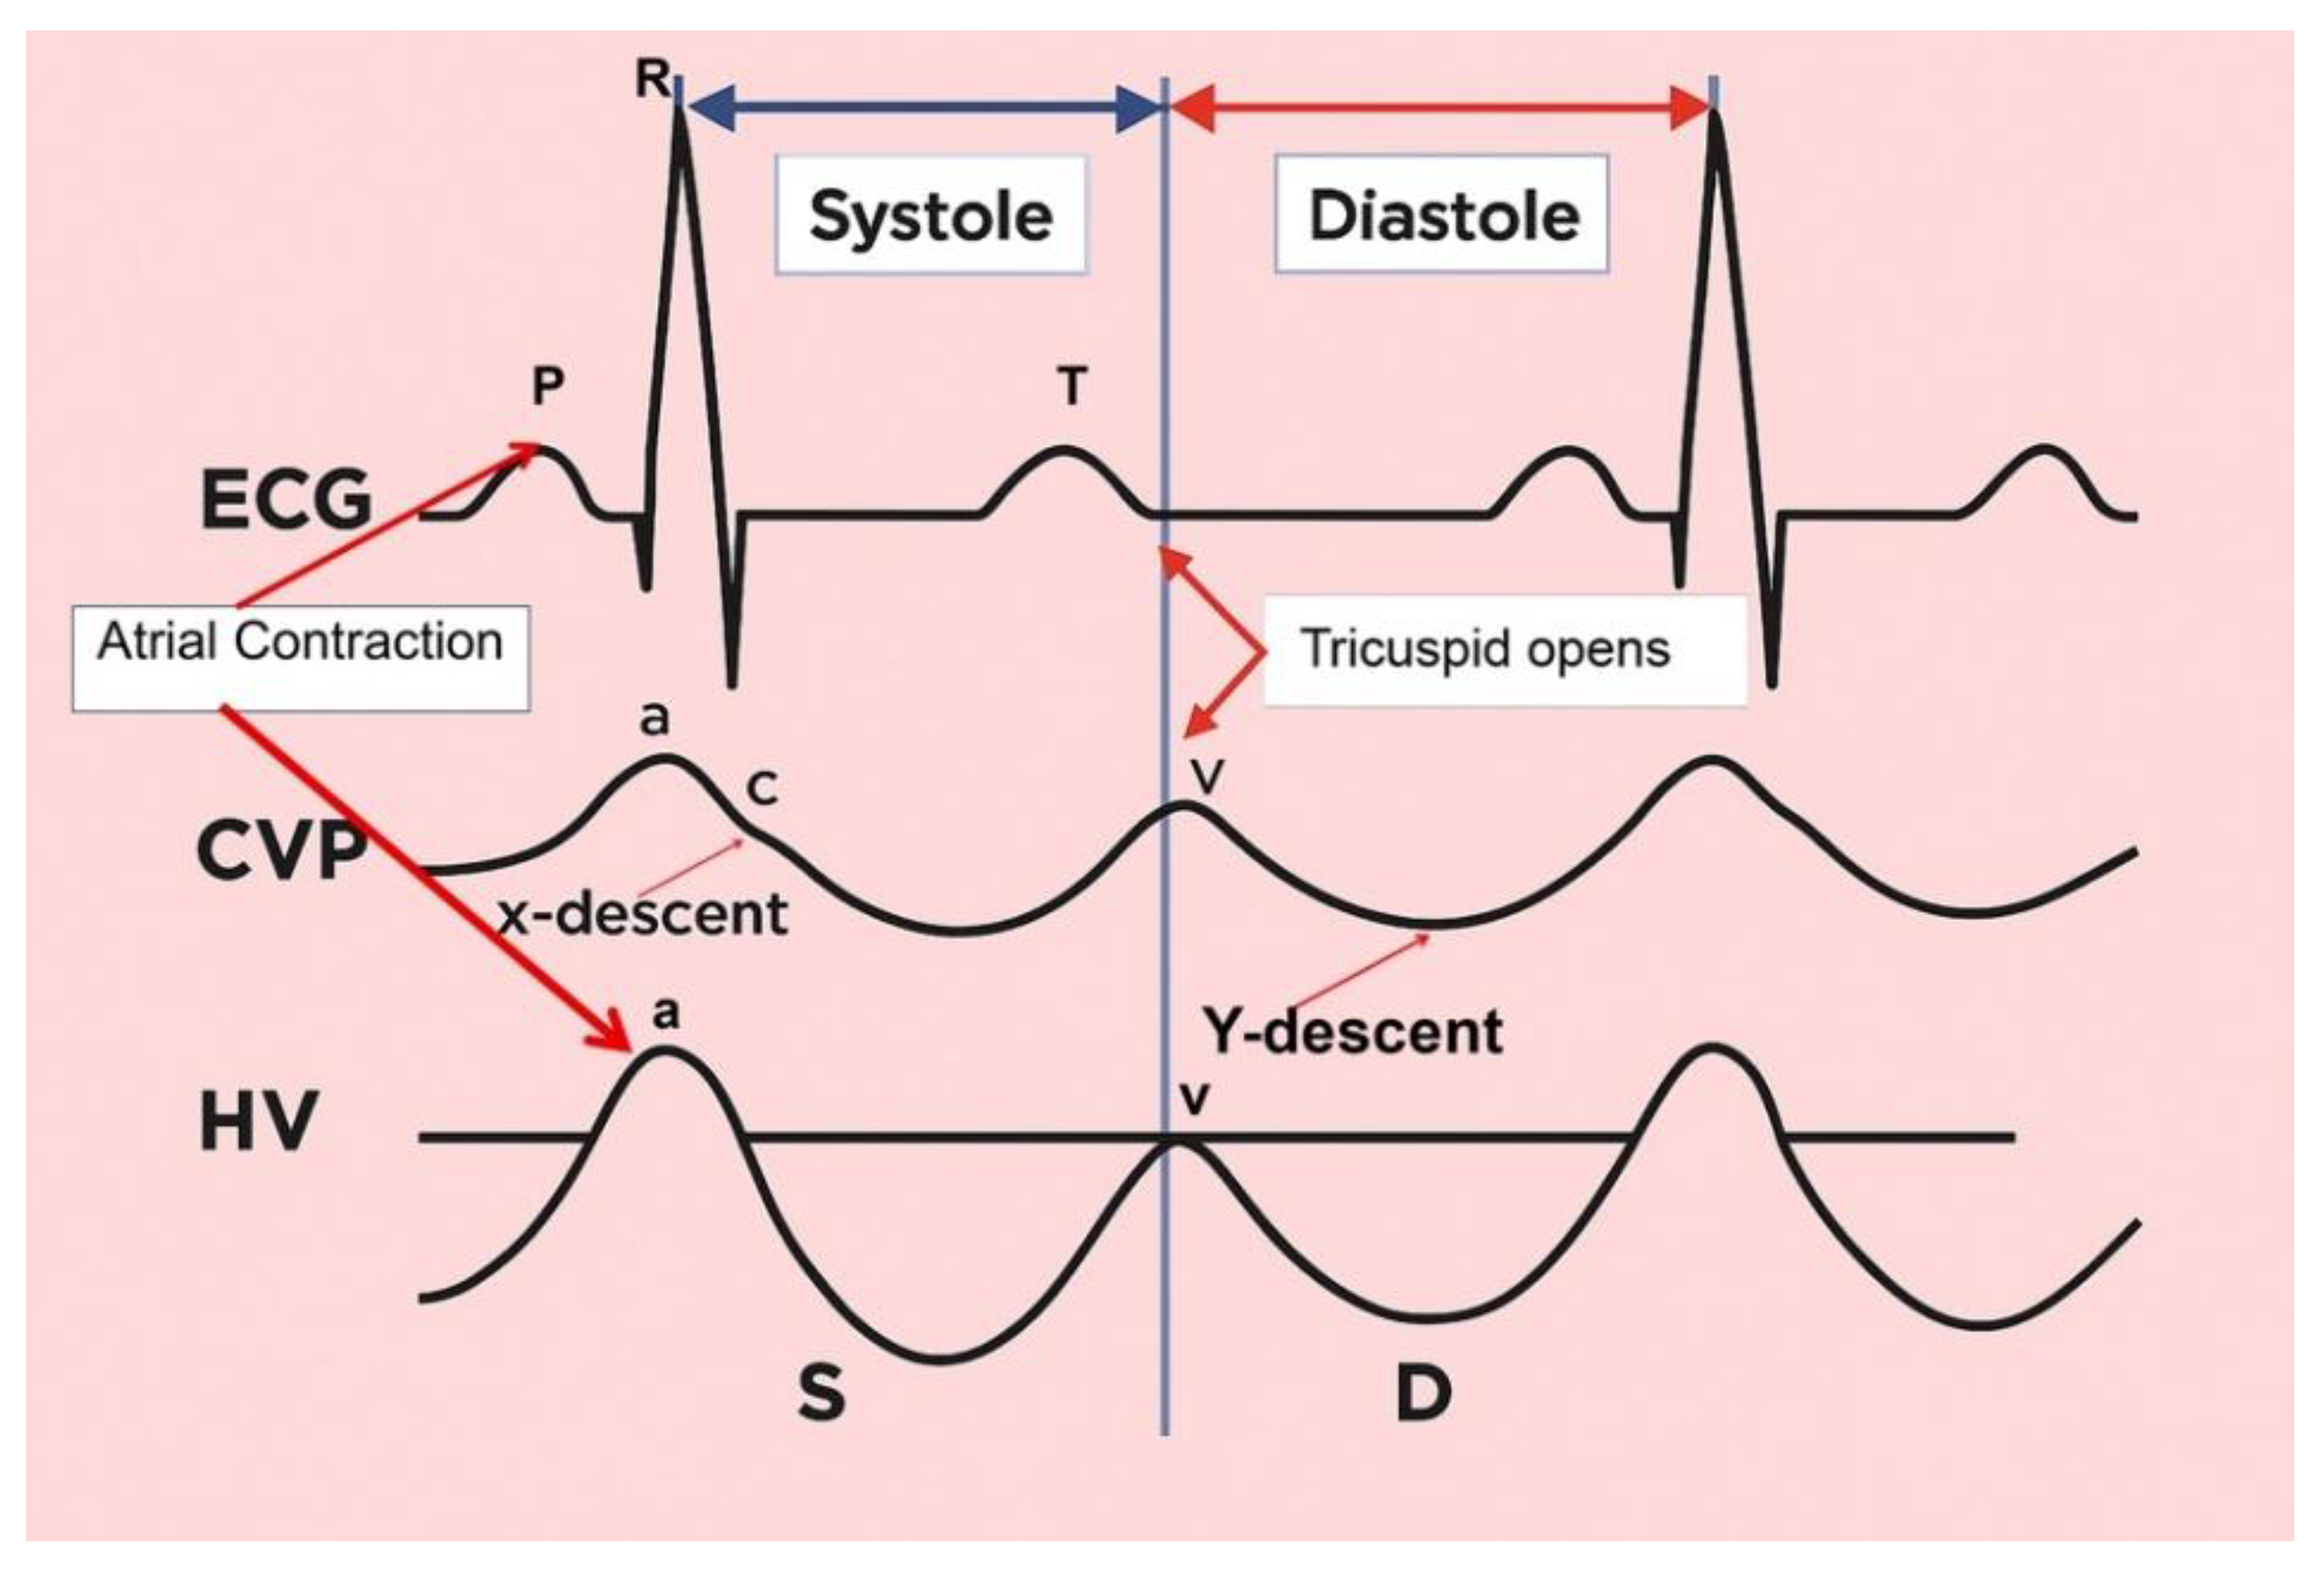
The hepatic venous waveform consists of several waves[70] (Figure ):
1. The a wave: Caused by increased RAP during atrial contraction, this upward wave peaks with maximal retrograde flow. It is wider and taller than the v wave in normal states.
2. The S wave: Generated by a decrease in RAP during systole, this downward wave represents antegrade flow. It reaches its lowest point at midsystole and is the largest downward wave in the cycle.
3. The v wave: This upward wave is produced by increased RAP due to systemic venous return. Its peak marks the transition from systole to diastole, and the wave slopes downward as pressure is relieved during early diastolic right ventricular filling.
4. The D wave: The final wave, caused by a decrease in RAP during rapid early diastolic filling, represents antegrade flow. It is smaller than the S wave and reaches its lowest point during maximal diastolic velocity.
Normally, hepatic venous flow is antegrade (toward the heart) and phasic (Table ).
Figure 10.
In a normal time-correlated analysis of the electrocardiogram (ECG), central venous pressure (CVP) tracing, and hepatic venous (HV) waveform, the following correlations are observed: The peak of the retrograde a wave corresponds to atrial contraction at the end of diastole. The trough of the antegrade S wave aligns with the peak negative pressure created by the downward motion of the atrioventricular septum during early to midsystole. The peak of the upward-facing v wave correlates with the opening of the tricuspid valve, marking the transition from systole to diastole. This peak may cross above the baseline (indicating retrograde flow) or stay below the baseline (indicating antegrade flow); The trough of the antegrade D wave corresponds to rapid early diastolic right ventricular filling.The overall shape of the hepatic venous waveform resembles a "W," which can be remembered using the mnemonic "waveform." This pattern helps in understanding the normal cyclical changes in hepatic venous flow as related to cardiac events.
Variations in flow characteristics affect both venous and arterial vessels[97]. In heart failure (HF), typical findings include marked phasicity in the inferior vena cava (IV) flow, which may even reverse direction. The portal vein (PV) can show increased pulsatility, phases of reverse flow, and interruptions in the flow[98]: the normal spectral Doppler pattern of IV flow is triphasic, consisting of four waves—each linked to different phases of the cardiac cycle and right atrial activity: the "a", "S", "v", and "D" waves (Figure ). The "a" wave is a positive peak, representing retrograde flow during end-diastolic atrial contraction. The "S" wave is a negative peak, indicating anterograde flow during ventricular systole. The "v" wave is typically an ascending peak and corresponds with the opening of the tricuspid valve, signaling the transition from systole to diastole. The "D" wave is a negative wave, reflecting anterograde flow during early diastolic filling. In HF, both anterograde and retrograde speeds increase, leading to more pulsatile IV flow. In cases of tricuspid regurgitation, both the "a" and "v" waves are increased, while the "S" wave decreases, potentially reversing in severe cases, forming an "a-S-v" complex. Right heart failure (RHF) often shows increased "a" and "v" waves but maintains an appropriate ratio between the "S" and "D" waves[98].
Figure 11.
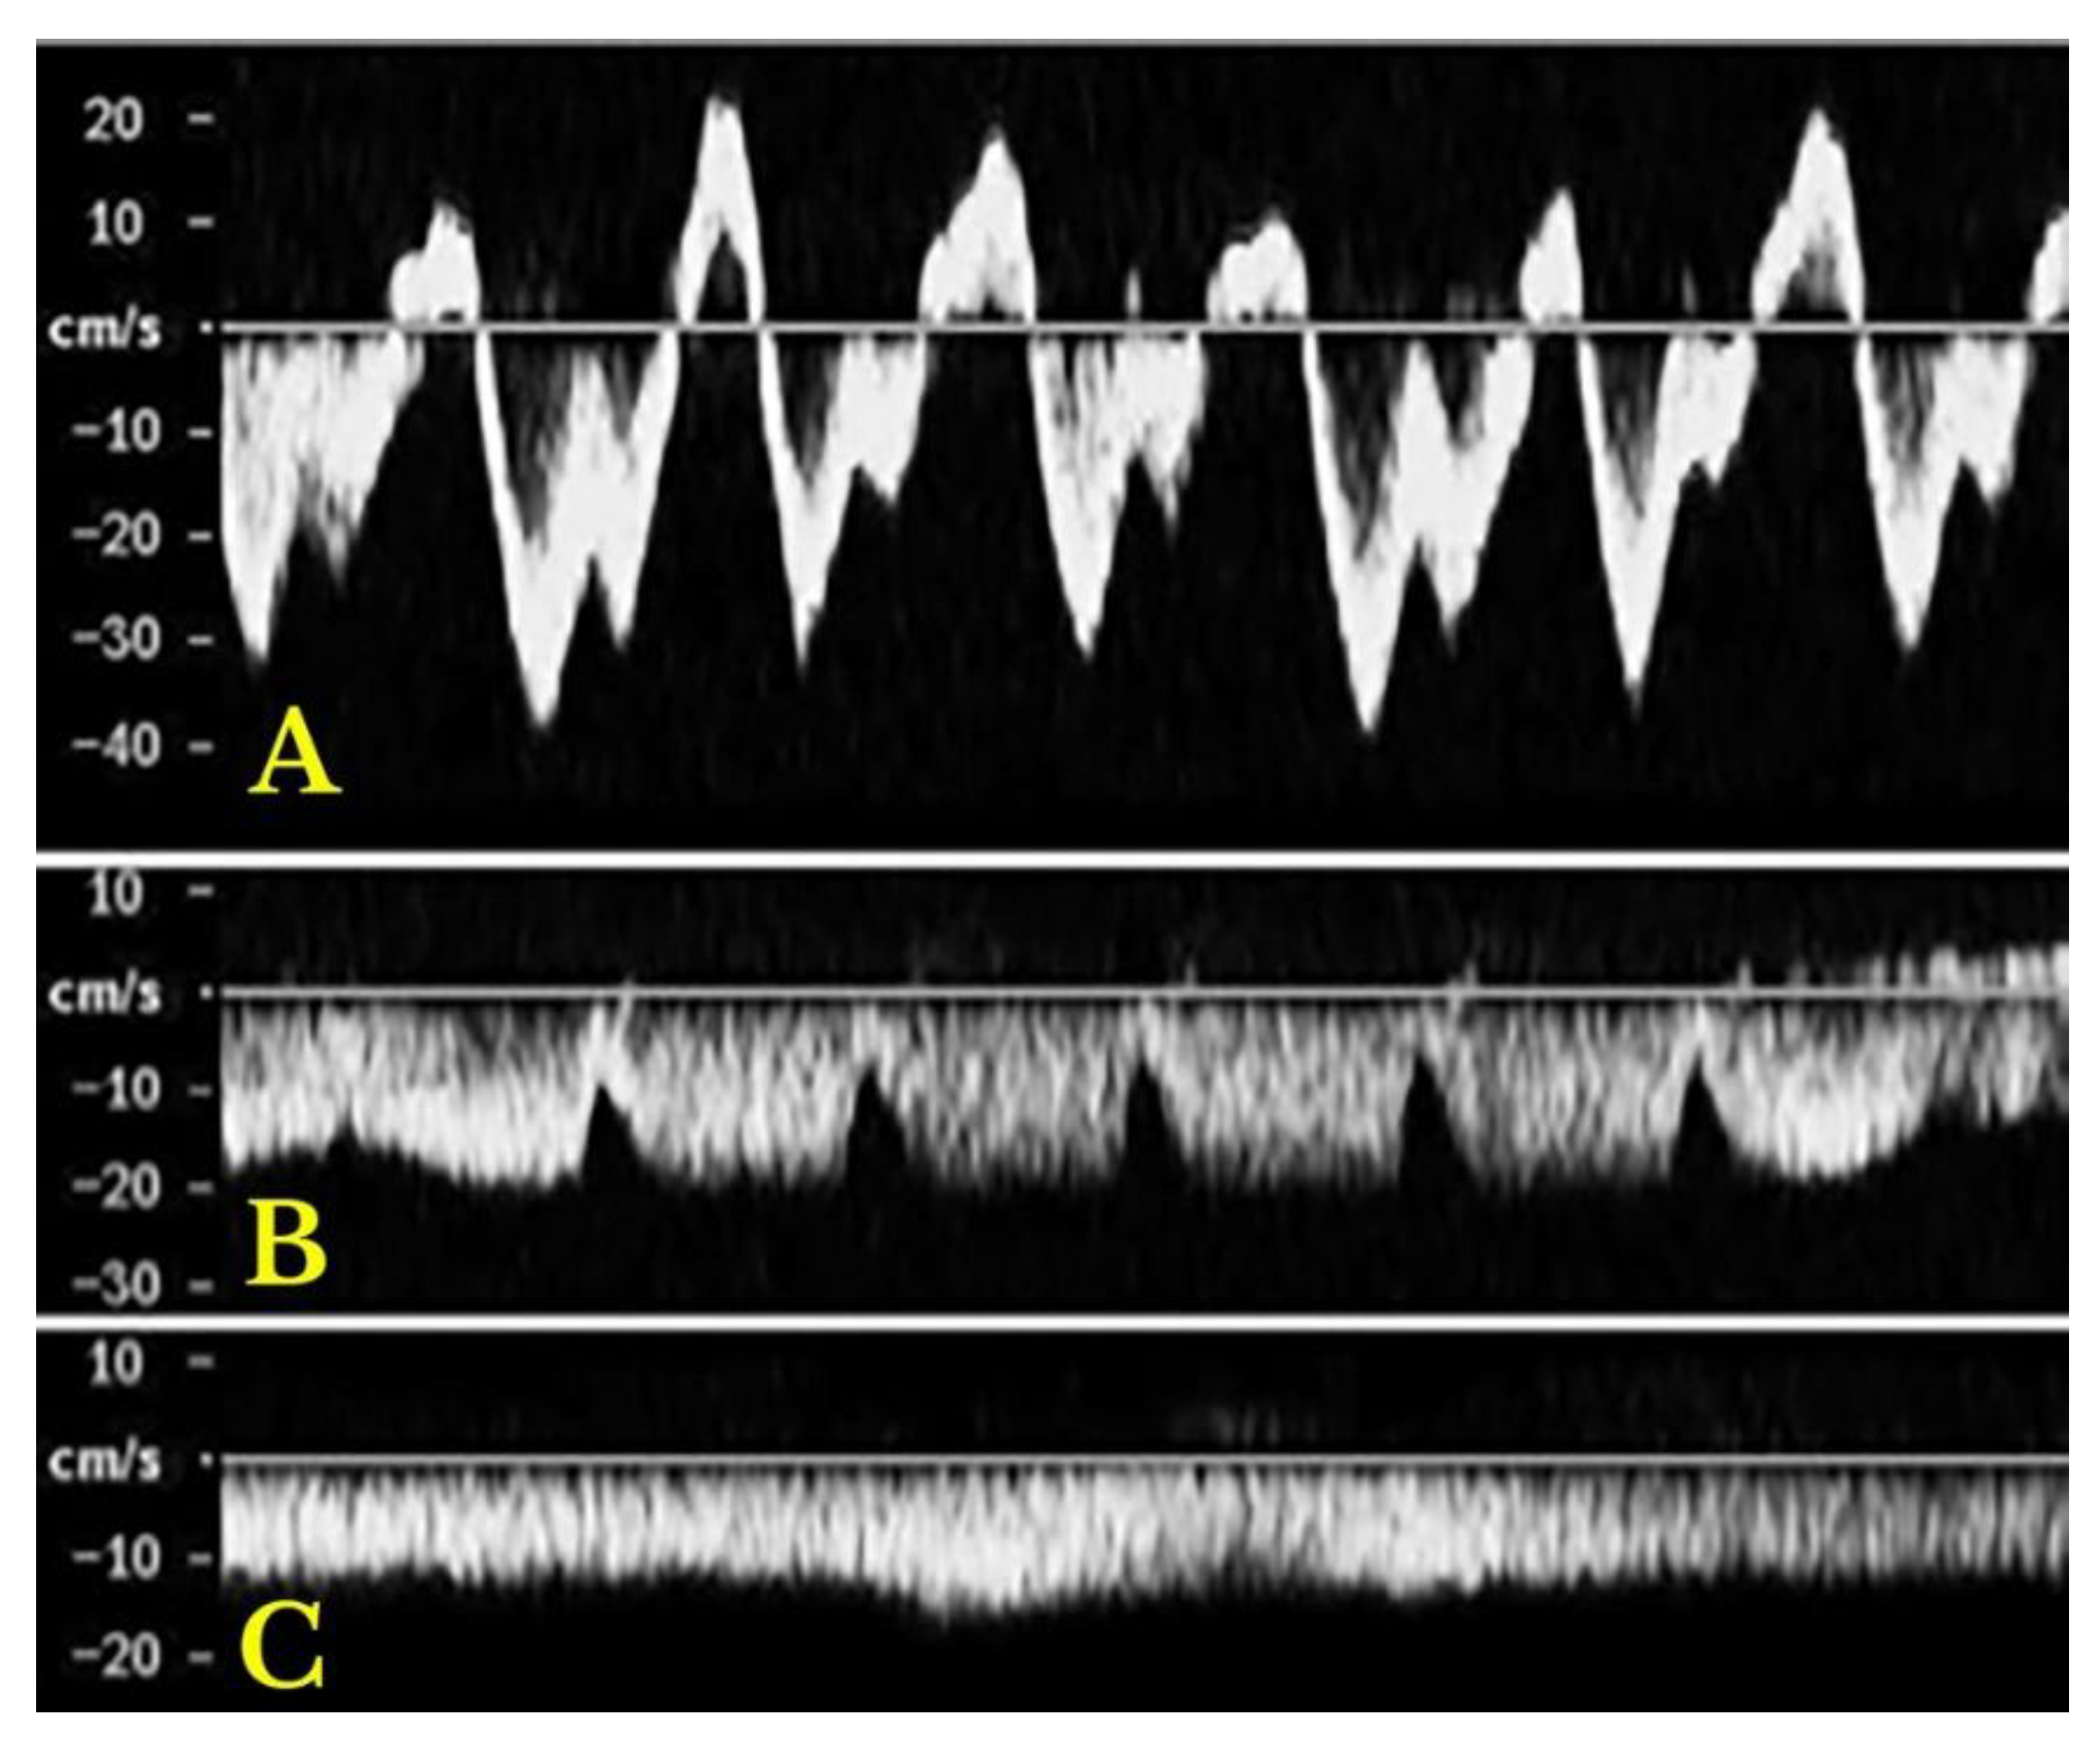
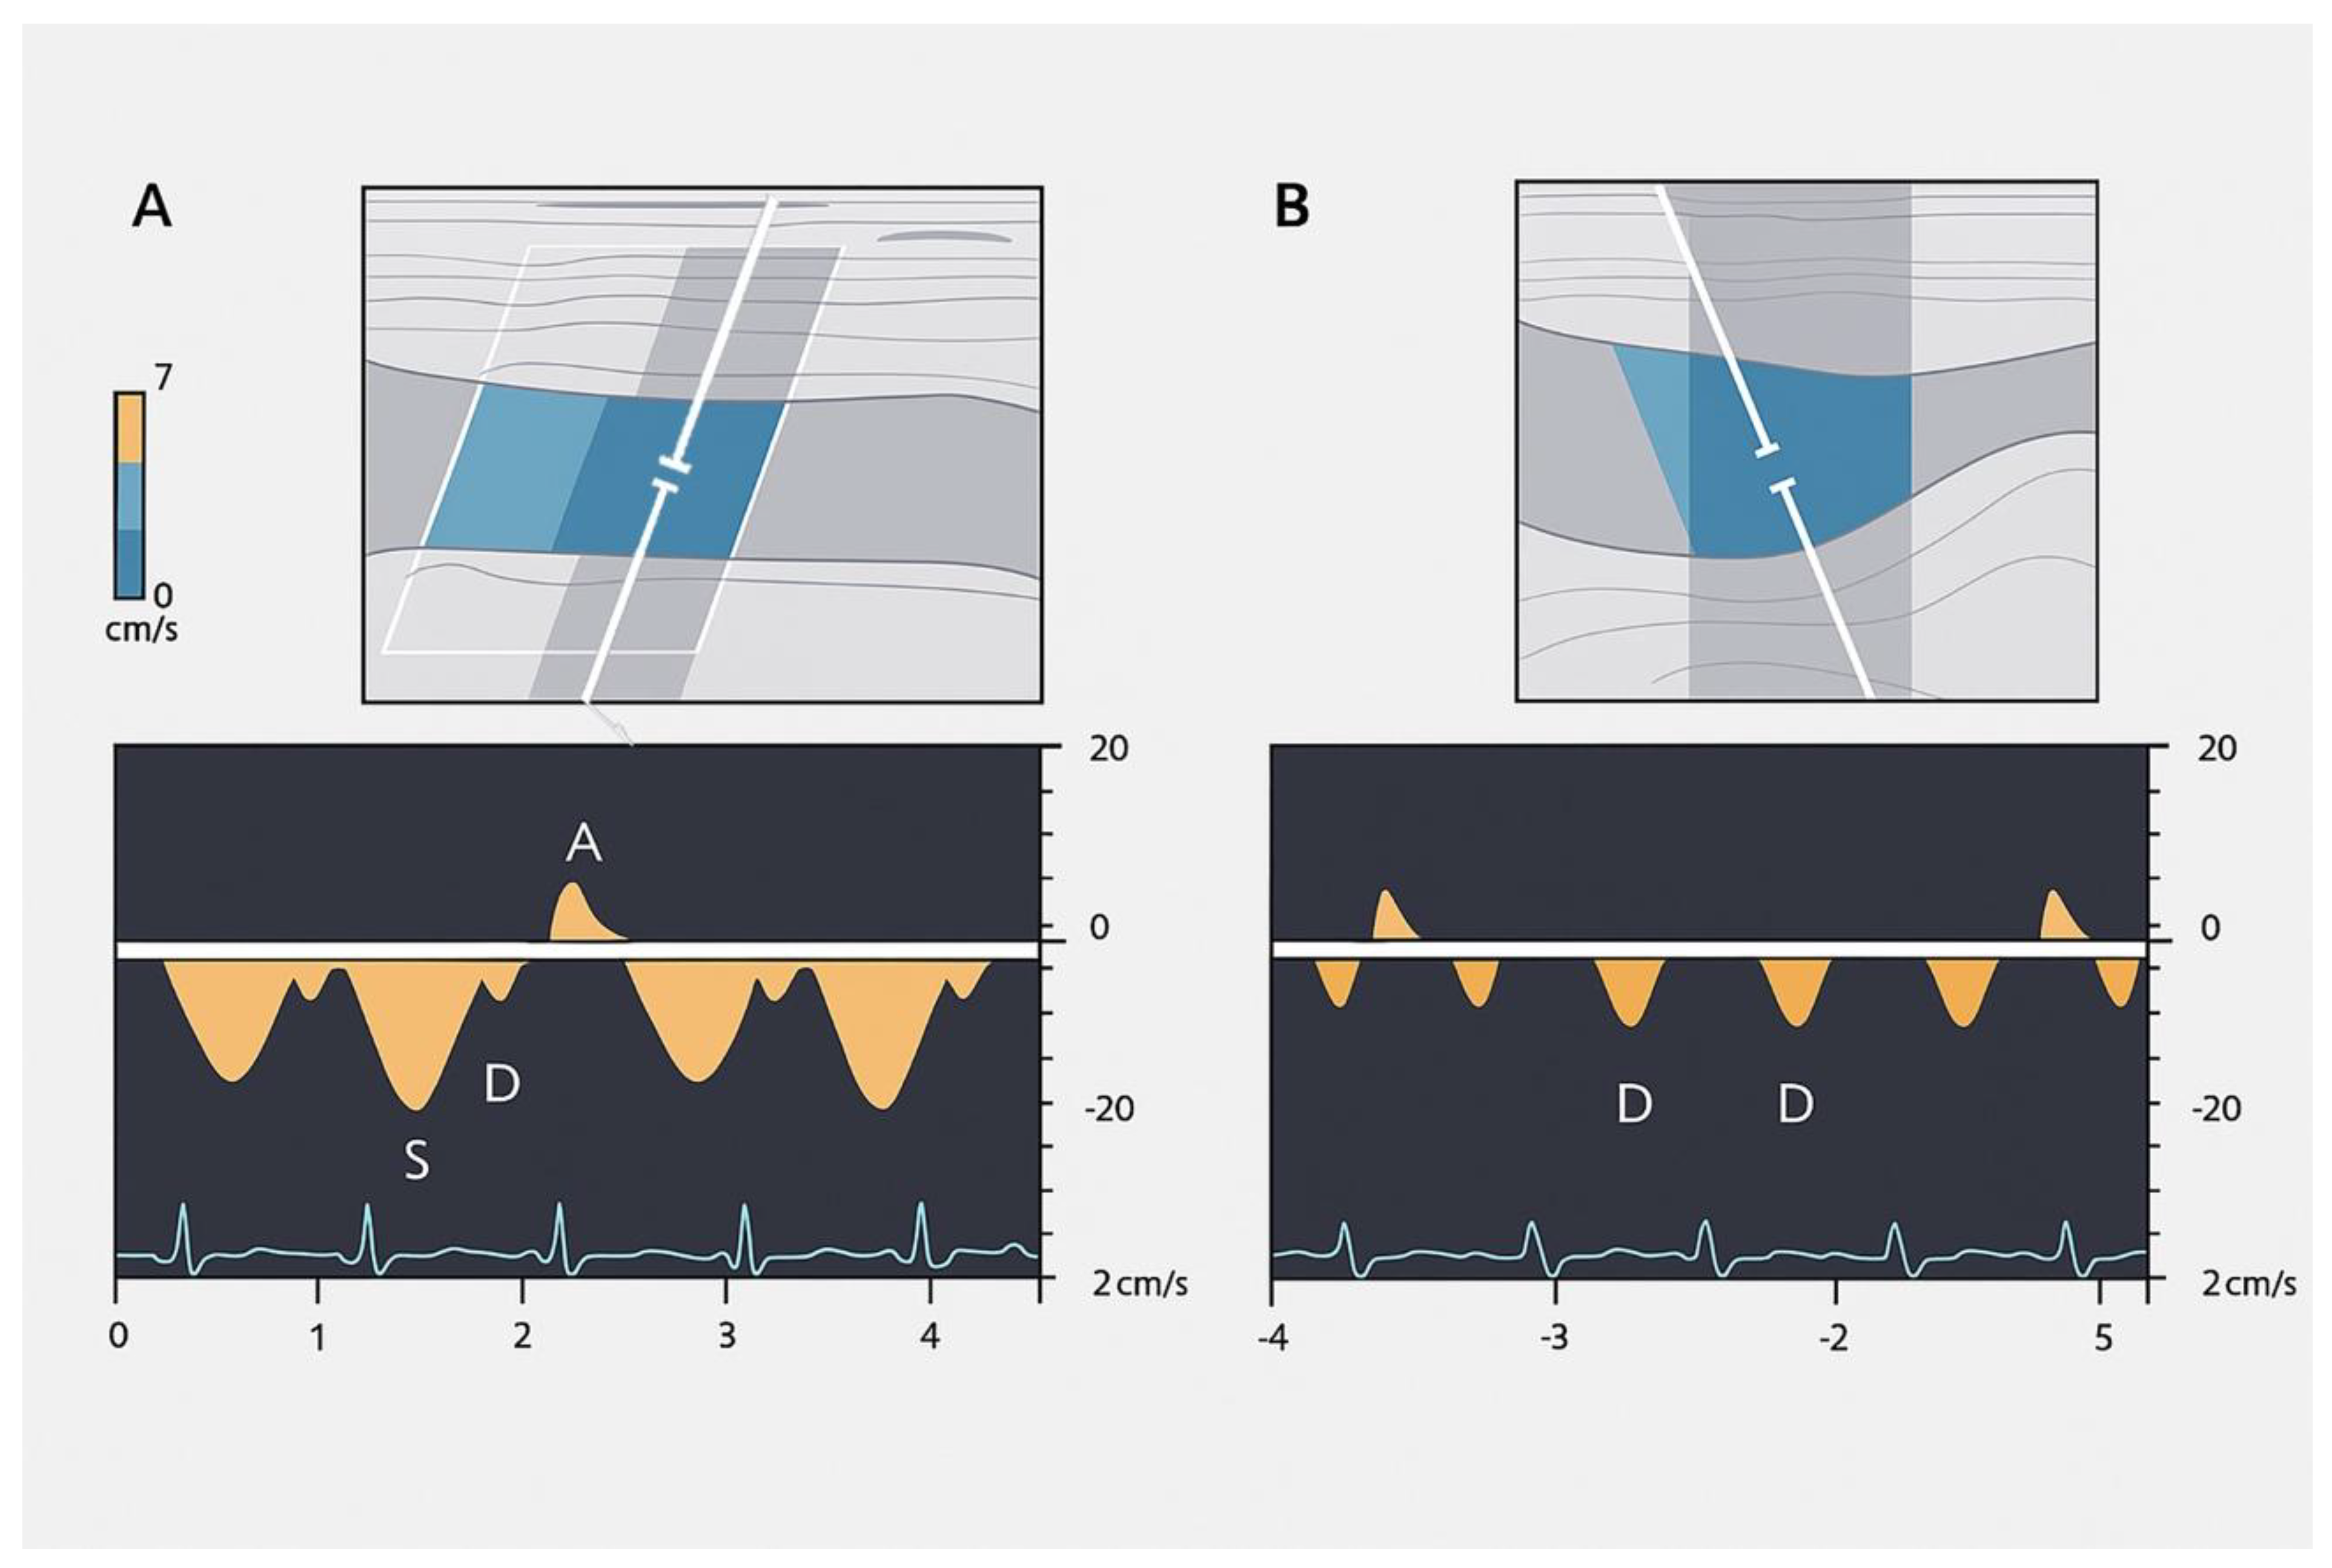
Hepatic vein Doppler waveforms are used to assess blood flow in the hepatic veins. A normal waveform is triphasic (A), characterized by two hepatofugal peaks (flow away from the liver) and one hepatopetal peak (flow towards the liver) at the top of the panel. Abnormal waveforms include: Biphasic (B): Lacks the hepatopetal peak, indicating altered flow dynamics, often associated with portal hypertension. Monophasic (C): Shows a flat waveform, indicating significant disruption to normal blood flow, often seen in advanced portal hypertension or other severe vascular conditions.
Figure 11.
Hepatic vein Doppler waveforms are used to assess blood flow in the hepatic veins. A normal waveform is triphasic (A), characterized by two hepatofugal peaks (flow away from the liver) and one hepatopetal peak (flow towards the liver) at the top of the panel. Abnormal waveforms include: Biphasic (B): Lacks the hepatopetal peak, indicating altered flow dynamics, often associated with portal hypertension. Monophasic (C): Shows a flat waveform, indicating significant disruption to normal blood flow, often seen in advanced portal hypertension or other severe vascular conditions.
The PV normally shows an anterograde (hepatopetal) flow with smooth undulations caused by cardiac activity, with systolic flow speeds ranging between 16 and 40 cm/s and a pulsatility index (PI) greater than 0.5. In HF, both tricuspid insufficiency and RHF increase pulsatility (<0.5 PI, indicating greater pulsatility), which is transmitted through dilated sinusoids into the PV[65]. Reduced velocity (<12.8 cm/s) in the portal trunk is typical in hepatic cirrhosis and can predict decompensation in compensated cirrhosis, while reverse portal flow indicates poor prognosis in decompensated cirrhosis[66]. Several studies[99,100] suggest that PV pulsatility can detect elevated RAP and estimate its level, with the pulsatility ratio inversely correlated with RAP. Hepatic congestion, ascites, and tricuspid regurgitation are associated with higher PV pulsatility, indicating worsening right heart function [100,101]. Therefore, the PV pulsatility ratio can be a useful sign in assessing HF and monitoring therapeutic responses, especially with bedside ultrasonography[100].
In advanced chronic heart failure (HF) and chronic pulmonary hypertension, severe venous congestion can be difficult to manage, and Doppler profiles indicating venous congestion are often linked to poorer prognoses. A study by Iida et al. (2016) [102] investigated intra-renal venous Doppler profiles in 217 chronic HF patients, finding that certain patterns—such as the short interruption (with both S and D waves) and prolonged interruption (only the D wave)—were independently associated with worse outcomes. The short interruption pattern had a hazard ratio (HR) of 6.85, and the prolonged interruption pattern had a HR of 17.8, both with high statistical significance (p < 0.001). These patterns were also linked to worse morbidity and survival in 205 patients with suspected pulmonary hypertension undergoing right heart catheterization, and a lower estimated glomerular filtration rate[103].
Regarding portal vein Doppler assessment, Moriyasu et al. (1986) [104] first described the portal vein pulsatility index (PI) in cirrhotic patients, and later research by Goncalvesova et al. (2010) [100] found that increased pulsatility in portal flow in patients with exacerbated HF corresponds with elevated right ventricular filling pressure. This can help detect elevated RAP and estimate RAP levels. In a study by Ikeda et al. (2018) [105], a higher portal pulsatility index and congestion index at discharge were associated with complications. Similarly, Bouabdallaoui et al. (2020) [106] found that a moderate or severe antegrade pulsatile uninterrupted pattern detected at discharge after a decompensation episode in HF patients was linked to an increased risk of all-cause mortality. The Table summarizes these concepts
Table 3.
Spectral variations in hepatic vessels.
| Intrahepatic veins | Portal vein | Hepatic artery | |
|---|---|---|---|
|
Normal |
Triphasic pattern: "a" wave: positive, "a" > "v" "S" wave: negative, "S" > "D" "v" wave: positive; "v" < "a" "D" wave: negative, "D" < "S" |
Anterograde flow Smoothly undulating venous waveforms Systolic speed 16–40 cm/s Pulsatility index > 0.5 |
Maximum systolic speed: 30–60 cm/s Resistive index 0.55–0.7 |
|
Heart failure |
Increased anterograde and retrograde speeds | All cases of hepatic congestion | |
| Increased pulsatility | |||
| Right heart | Higher “a” and “v” waves | ||
| failure | Adequate ratio maintained between S and D waves |
Pulsatility index < 0.5 |
Resistive index > 0.7 |
| High and both positive “a" and "v" waves |
Reduced systolic speed | ||
| Tricuspid regurgitation | Reduced “S” wave “S” wave < “D” wave |
(more common in LC) |
|
| *Severe TR: "S" wave retrograde (“a-S-v complex”) | |||
| Liver cirrhosis |
Loss of triphasic pattern |
Systolic speed <12.8 cm/s till reversal flow and thrombosis |
|
4.1.1. SYNOPSIS OF THE STUDY OF SPLANCHNIC SYSTEM CONGESTION: Venous Excess Ultrasound Score (VExUS) and EXTENDED VEXUS
Recently, the use of Point-of-Care Ultrasound (POCUS) for hemodynamic monitoring has become a routine practice in perioperative care, primarily focusing on assessing cardiovascular function and fluid responsiveness [107]. While traditional evaluations consider factors like mean arterial pressure and forward flow, understanding systemic venous congestion—indicating increased RAP—is also essential for comprehensive hemodynamic assessment[108]. Venous congestion can result from heart failure, pulmonary vascular resistance, or obstructive conditions, and can lead to organ injury such as kidney hypoperfusion, congestive hepatopathy, and congestive encephalopathy[90].
The integration of these parameters into scoring systems, such as the Venous Excess Ultrasound (VExUS) score, demonstrates high practical and clinical relevance.
The Systemic Venous Congestion may act several consequences: Increased RAP, caused by heart failure or pulmonary conditions, may initially act as a compensatory mechanism, but if excessive, it can cause organ damage by increasing interstitial pressure in organs like the kidneys, which may halt glomerular filtration [108]. Similarly, congestion can affect any organ system, leading to adverse consequences, including, but not limited to, congestive hepatopathy, congestive encephalopathy, and cardio-intestinal syndrome with translocation of lipopolysaccharide [108].
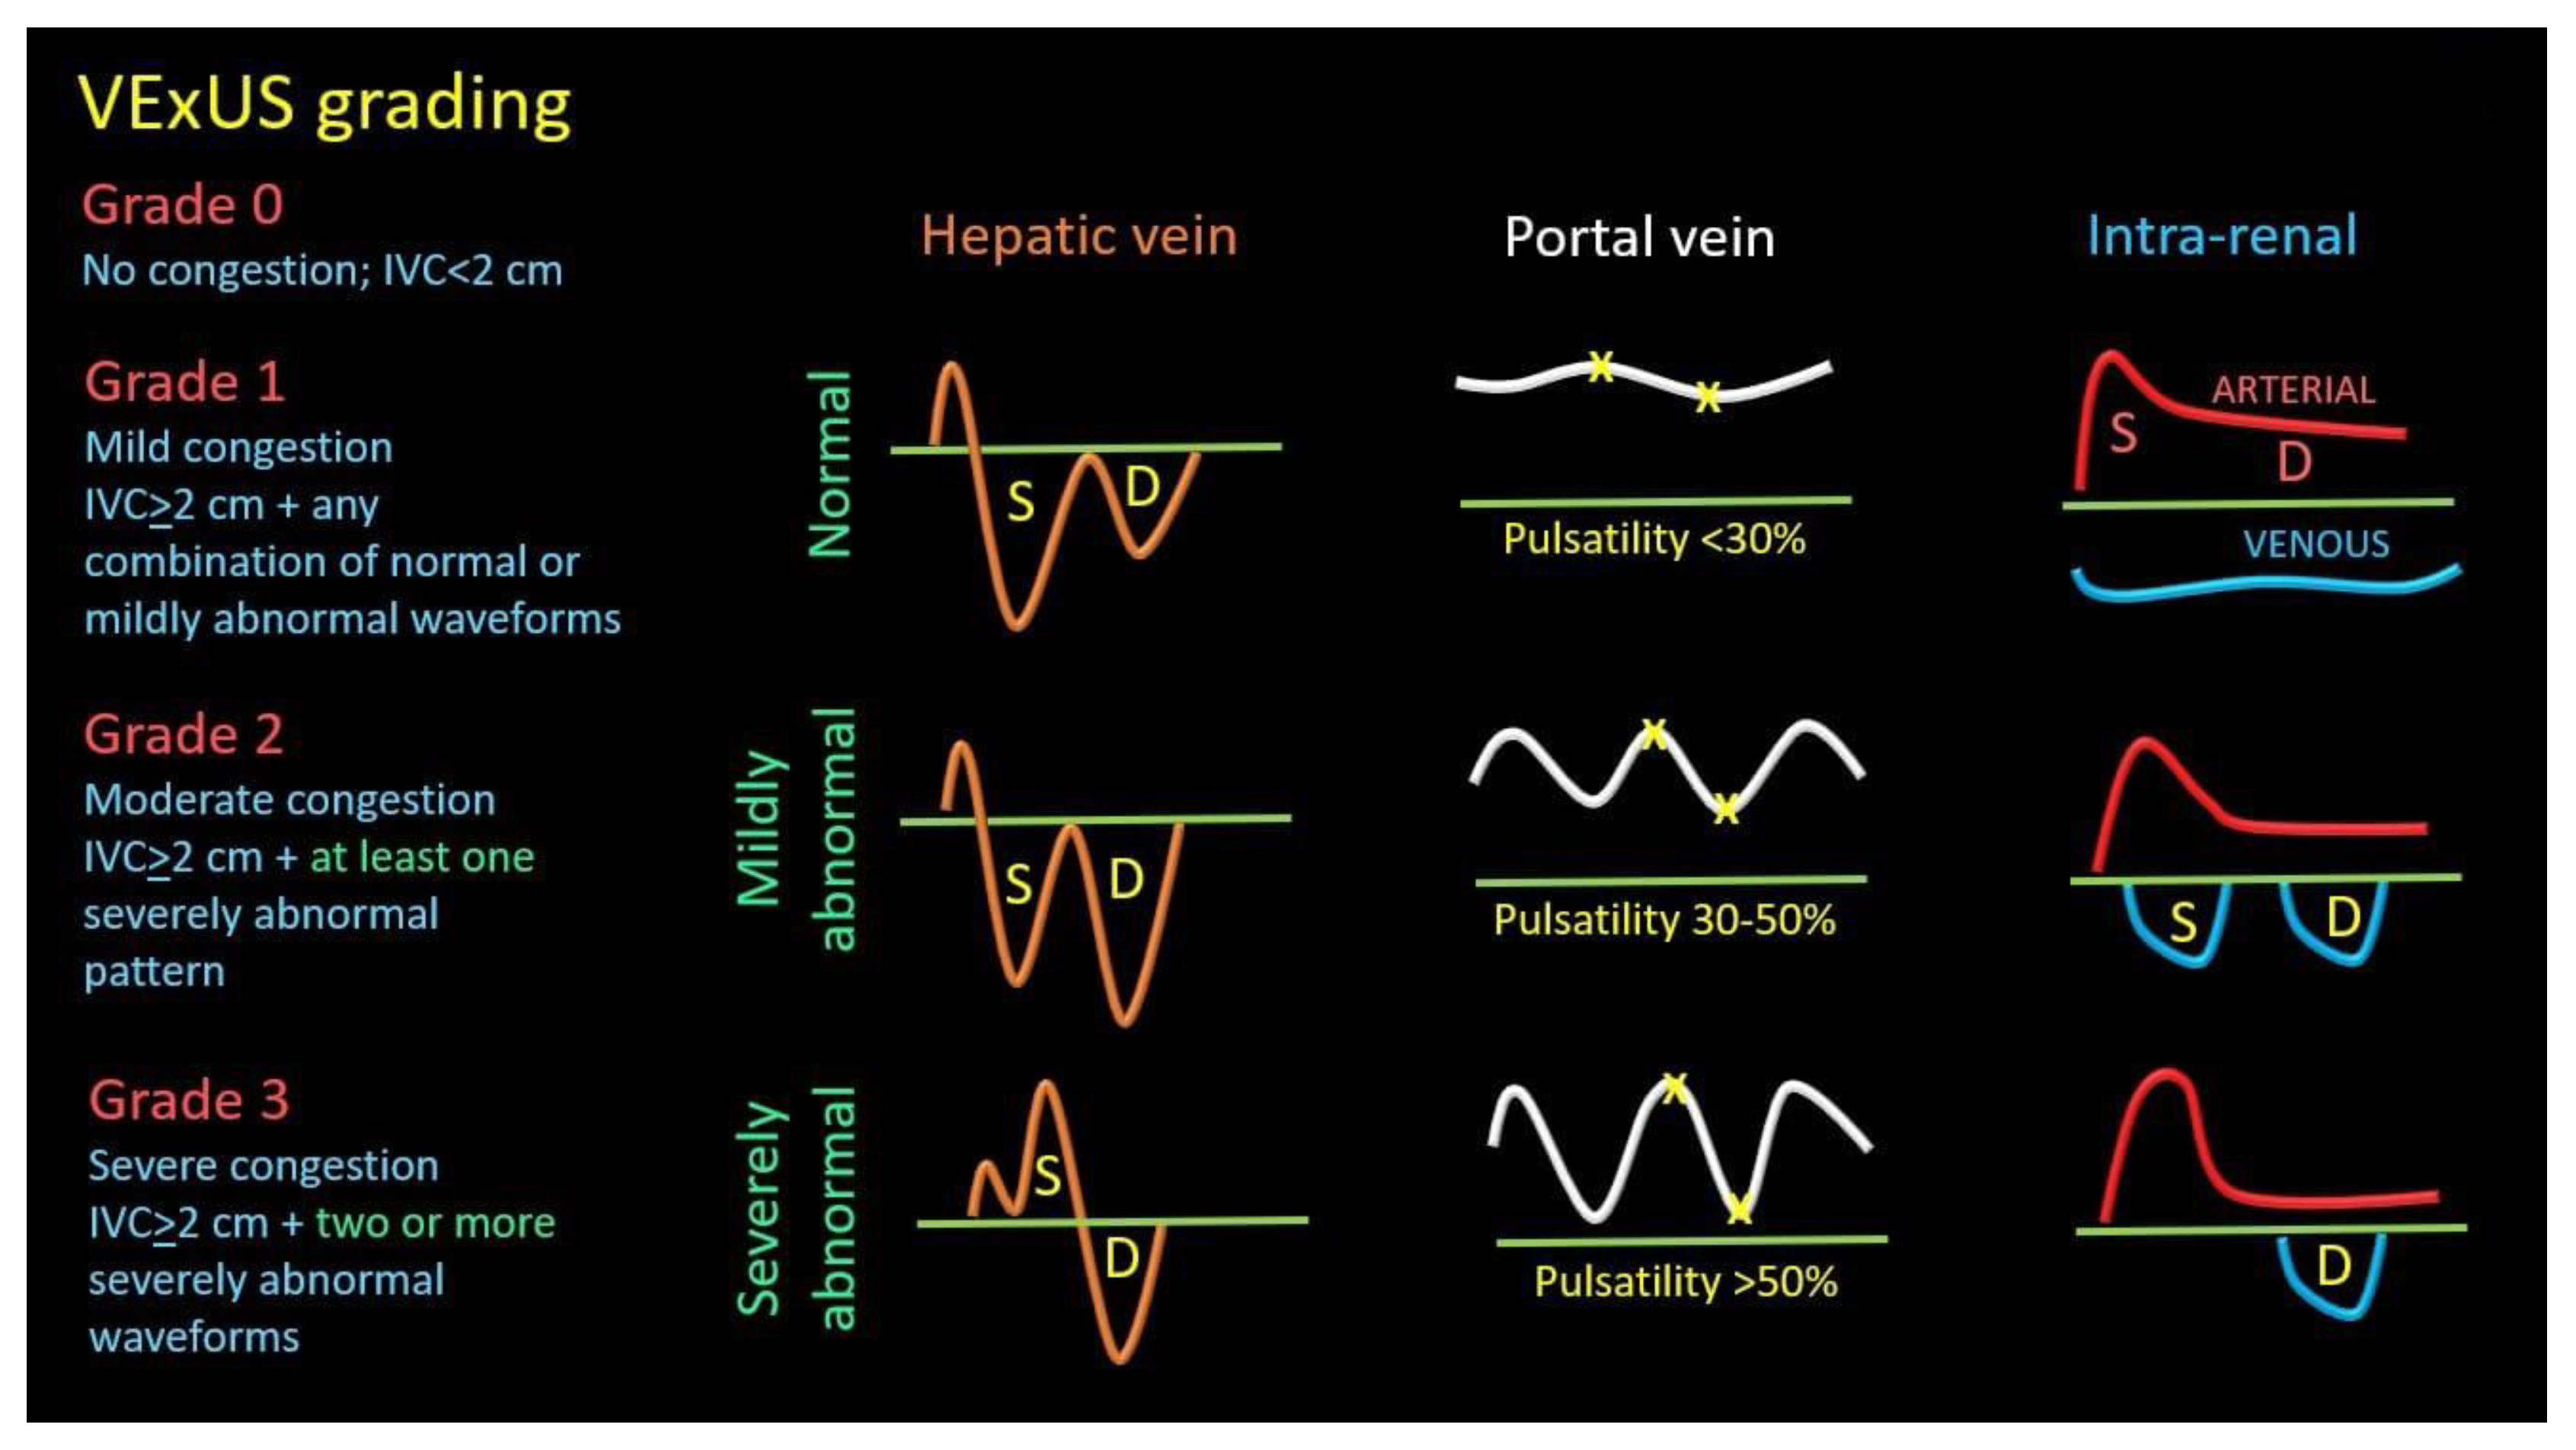
The VExUS grading system represents a significant methodological advancement in the bedside assessment of systemic venous congestion, moving beyond traditional, and often flawed, pressure-based metrics like central venous pressure (CVP) (Figure ) [106].
The system's physiological validity is rooted in the distinct anatomical and hemodynamic perspectives offered by each vessel. The hepatic vein provides a direct reflection of right atrial pressure, the portal vein, being buffered by hepatic sinusoids, offers an integrated measure, and the intrarenal veins are a sensitive marker of parenchymal congestion and the resultant renal capsule tamponade that impairs perfusion. It is this organ-level assessment that constitutes the primary strength of VExUS. While it correlates with right atrial pressure, its paramount clinical utility lies in its superior ability to predict end-organ dysfunction and its dynamic nature. The waveforms are not static indicators but responsive biomarkers that improve with effective decongestive therapy, providing real-time feedback on therapeutic efficacy, a finding substantiated by associations with improved clinical outcomes such as renal recovery in cardiorenal syndrome.
This multiparametric sonographic protocol classifies congestion into a four-tiered ordinal scale (Grade 0-3) (Figure ) based on an initial evaluation of inferior vena cava (IVC) diameter followed by a comprehensive Doppler Interrogation of the hepatic, portal, and intrarenal veins. A plethoric IVC serves as the gatekeeper for further examination; if present, the severity of congestion is determined by the number of venous systems exhibiting severely abnormal Doppler waveforms, including S-wave reversal in the hepatic vein, >50% pulsatility in the portal vein, or a monophasic pattern in the intrarenal vein. A practical guide “how to perform” is recently described by Turk et al. [109].
Venous congestion assessment is performed in two steps: screening and grading:
1. Screening:
The inferior vena cava (IVC) diameter, measured via ultrasound, can indicate increased RAP, with a diameter greater than 20 mm suggesting congestion. This can be assessed from both long- and short-axis views of the IVC. Alternatively, the internal jugular vein can also be used to estimate RAP [110].
2. Grading
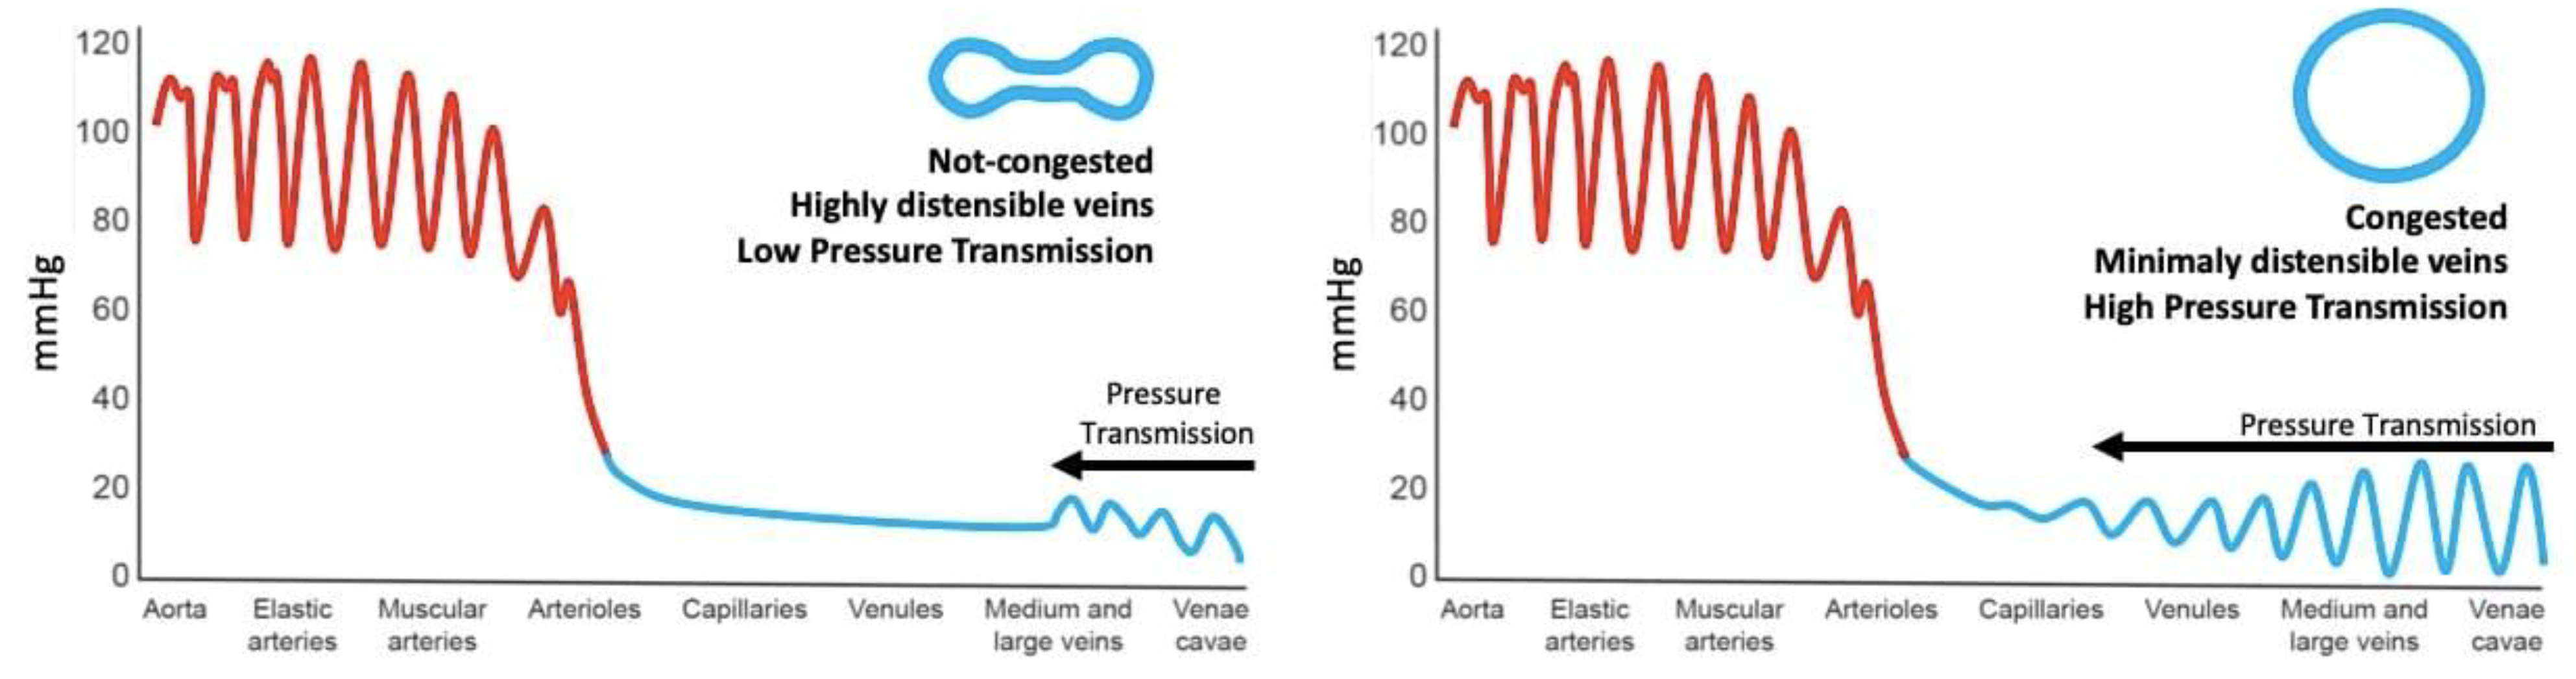
Once congestion is detected, its severity is assessed through venous Doppler to evaluate the return flow pattern. Normal veins and venules allow non-pulsatile blood flow, while congestion leads to increased pulsatility [102] (Figure ).
Figure 12.
Backwards transmission of pressure from right atrium to peripheral venules and capillaries. Note venous congestion greatly enhances pressure transmission.
Figure 12.
Backwards transmission of pressure from right atrium to peripheral venules and capillaries. Note venous congestion greatly enhances pressure transmission.
Doppler assessments in the hepatic, portal, and intra-renal veins help gauge congestion severity and pressure transmission to peripheral organs.
a. Hepatic Vein Doppler: In normal conditions, hepatic vein (HV) flow is pulsatile, corresponding to the RAP waveform. Pathologies like right ventricular dysfunction or tricuspid regurgitation can alter HV waveforms, and increasing RAP can reduce venous return during systole, leading to distinct changes in the waveform.
b. Portal Vein Doppler: Normal portal vein flow is continuous, but severe venous congestion can cause pulsatility in the portal circulation. The pulsatility fraction (PVPF: [(Vmax – Vmin)/Vmax] x 100) quantifies this, with values above 30% indicating mild abnormalities and above 50% suggesting severe congestion [111]. Elevated PVPF is a strong predictor of acute kidney injury in post-cardiac surgery patients.
c. Intra-Renal Vein Doppler: Similar to the portal vein, intra-renal veins show continuous flow under normal conditions, but congestion leads to a pulsatile pattern. This can manifest as a biphasic pattern in moderate congestion and a monophasic pattern in severe cases [103]. Altered intra-renal flow is associated with poor outcomes in heart failure and pulmonary hypertension patients [103,112].
d. Grading Venous Congestion: Venous congestion is categorized into grades 0-3 based on waveform alterations, a system known as VExUS (Venous Excess Ultrasound Score) (Figure ) [113]. This grading system provides a practical method for assessing the severity of venous congestion in clinical settings (Figure ).
Figure 13.
VExUS staging system: Examples of normal and abnormal venous waveforms. S = systole, D = diastole.
Figure 13.
VExUS staging system: Examples of normal and abnormal venous waveforms. S = systole, D = diastole.
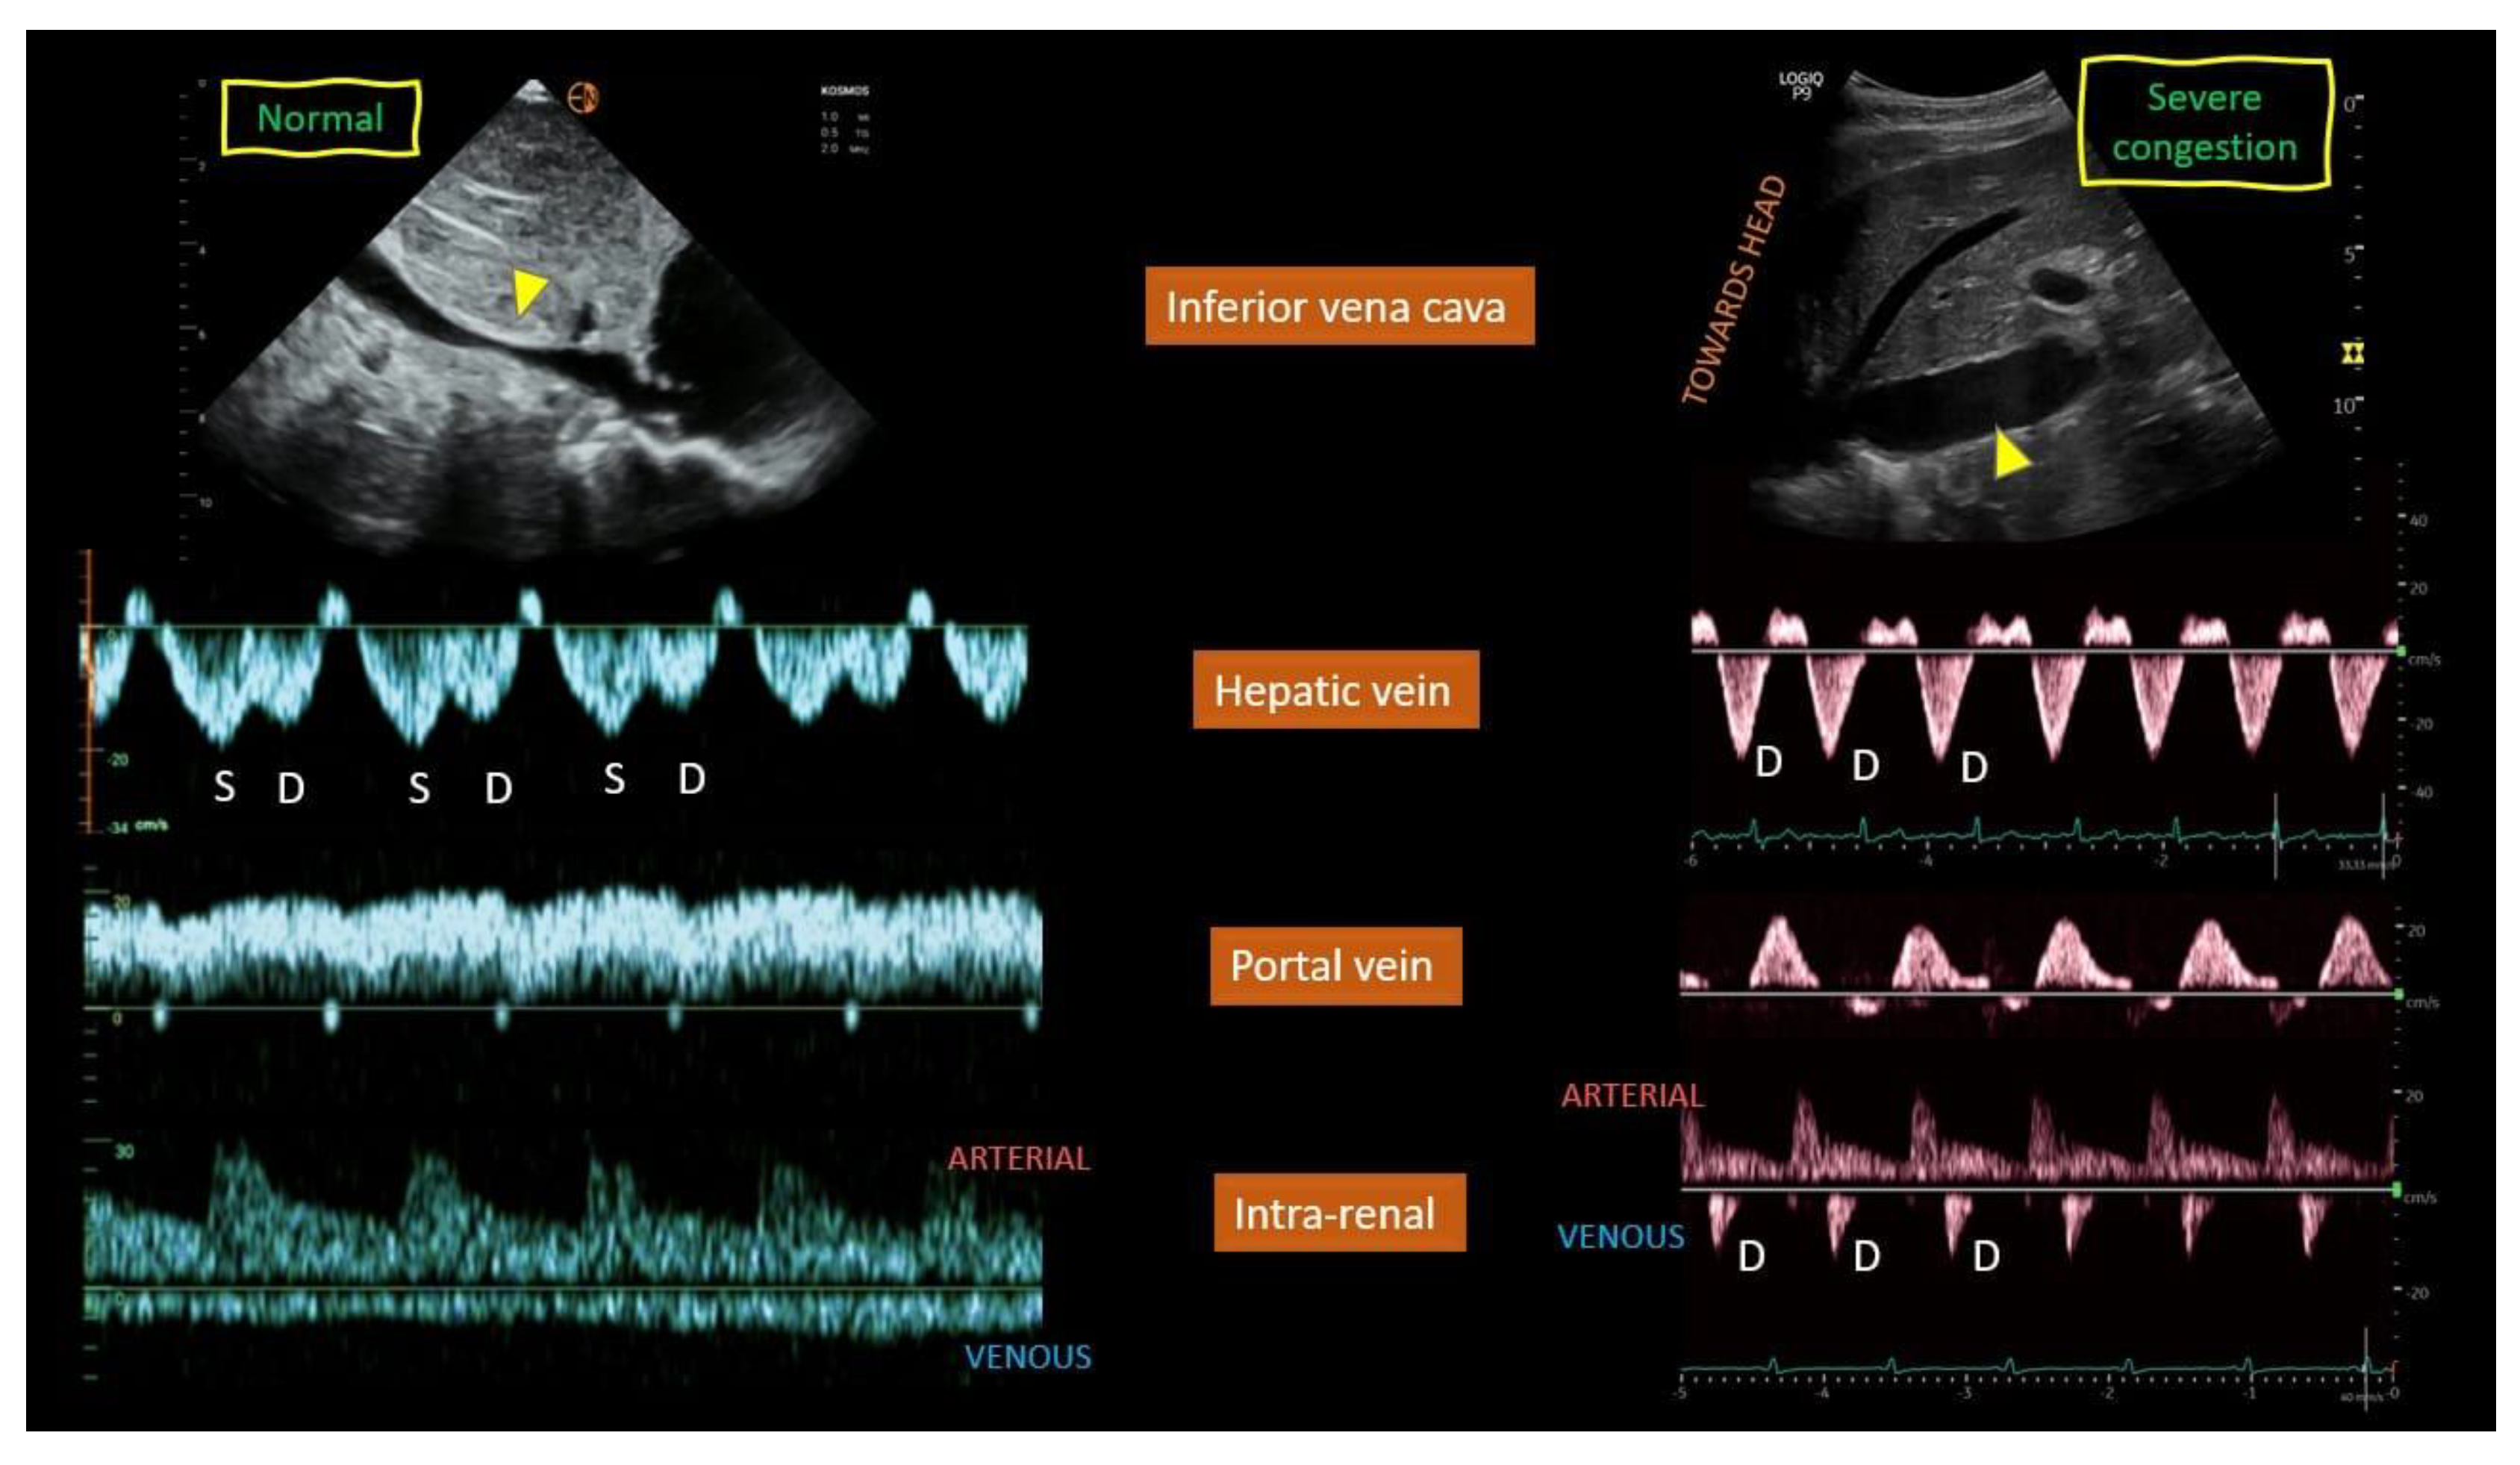
Figure 14.
VExUS grading system. S = systole, D = diastole, IVC = inferior vena cava.
The interpretation of VExUS requires nuanced clinical integration. The IVC diameter cutoff of 2 cm, while useful in the initial validation cohort, must be adjusted for factors such as, athletic history[114], body habitus and elevated intra-abdominal pressure to avoid misclassification [115,116,117]. Furthermore, the system maintains its utility in complex scenarios such as tricuspid regurgitation or pulmonary hypertension. This is because VExUS assesses the final common pathway of congestion—elevated organ afterload—from the downstream, organ-centric perspective, making the upstream etiology of the elevated pressure less relevant to the interpretation of the organ's congested state. Consequently, VExUS has catalyzed a paradigm shift in critical care and heart failure management, refocusing clinical evaluation from a singular emphasis on fluid responsiveness towards a more holistic consideration of fluid tolerance.
In such cases, it is reasonable to expand the evaluation to include additional veins that may offer insights into systemic venous congestion.
Extended Venous Ultrasound (eVExUS) as a Complementary Hemodynamic Paradigm
When the standard Venous Excess Ultrasound (VExUS) examination is precluded by technical limitations or patient-specific factors, the evaluation can be usefully expanded to include other venous systems. This extended approach, often termed eVExUS, encompasses several sonographic parameters that provide corroborative insights into systemic venous congestion, offering a pragmatic and comprehensive bedside assessment when traditional views are inaccessible.
The internal jugular vein (IJV) presents a superficially accessible and clinically intuitive alternative, particularly when the subcostal window is compromised[118]. Ultrasound interrogation of the IJV moves beyond the limitations of visual physical examination, employing techniques ranging from static measurement of the venous column height (enhanced by echocardiographic measurement of right atrial depth for improved accuracy) to dynamic assessment of collapsibility [119] (Figure ). Notably, this method can yield a specific numerical estimate of right atrial pressure, that demonstrates good concordance with invasive measurements and may outperform IVC-based assessment in patients with cirrhosis[120] and elevated intra-abdominal pressure[121]. Furthermore, IJV Doppler waveforms, which closely mirror central venous patterns, offer a functional assessment of right heart hemodynamics. While technically susceptible to transducer pressure and patient positioning, the IJV's drainage of the cerebral circulation also posits a intriguing, though yet unvalidated, role in investigating venous congestion-related cognitive dysfunction[122].
Figure 15.
INTERNAL JUGULAR VEIN: In the normal venous waveform (A), the expected hemodynamic events of the cardiac cycle are clearly delineated. The S-wave, which represents the systolic phase where atrial relaxation draws blood toward the heart, demonstrates a greater amplitude than the D-wave, which corresponds to the diastolic phase of ventricular relaxation. This relationship (S > D) is indicative of a compliant right atrium and unimpeded venous return to the central circulation.In stark contrast, the abnormal pattern (B) signifies a significant deviation from normal physiology, characterized by the complete effacement of the S-wave. This absence suggests a profound dysfunction in the normal systolic suction effect. The waveform is instead dominated by a solitary, prominent D-wave, noted to be below the baseline. This specific positioning confirms that the diastolic flow is still directed antegrade, toward the heart. The transformation into a monophasic pattern consisting solely of this diastolic component is a classic sonographic indicator of severely elevated right atrial pressure. This occurs when the atrium is already overloaded and non-compliant, unable to accommodate the systolic inflow, thereby abolishing the S-wave and leaving only the passive diastolic filling phase to be detected. This pattern is a critical diagnostic finding, often associated with conditions such as right heart failure, cardiac tamponade, or massive pulmonary embolism.
Due to its exceptional technical simplicity, femoral vein Doppler has emerged as a highly practical component of the extended exam. As venous congestion increases, the waveform becomes increasingly pulsatile, often exhibiting flow interruptions The waveform transitions from a continuous, phasic pattern to a highly pulsatile one with increasing congestion, a phenomenon quantifiable by the Femoral Vein Stasis Index (FVSI) (defined as the percentage of the cardiac cycle during which there is no antegrade flow toward the heart [123]). Although its distance from the heart confers a lower sensitivity for detecting elevated central pressures, an abnormal pulsatile pattern carries high specificity and is strongly associated with adverse outcomes, including acute kidney injury [124]. This prospective study assessed the diagnostic and prognostic value of the femoral venous stasis index (FVSI) as a non-invasive surrogate for right atrial pressure (RAP) in patients with pulmonary hypertension. Among 101 participants undergoing right heart catheterisation, FVSI demonstrated a strong correlation with invasively measured RAP, offering both high sensitivity for ruling out elevated pressures and high specificity for confirming severe congestion. Importantly, FVSI also predicted adverse outcomes—including hospitalization, treatment escalation, and mortality—over a two-year follow-up, with excellent reproducibility between operators. These findings suggest that FVSI is a simple, reliable bedside tool with both diagnostic and prognostic relevance in pulmonary hypertension management. Its utility is particularly pronounced in scenarios where hepatic waveforms are confounded, such as in severe tricuspid regurgitation or cirrhosis, though it too may be less reliable in the context of intra-abdominal hypertension [125].
Figure 16.
FEMORAL VEIN: In a normal physiological state (A), the Doppler waveform of the femoral vein is expected to be phasic, demonstrating clear variations in flow velocity that correspond to the rhythmic pressure changes of the respiratory and cardiac cycles. This phasicity signifies healthy, spontaneous blood return toward the heart. The abnormal waveform (B), however, presents a pronounced deviation from this norm. It is characterized by the presence of prolonged intervals within the cardiac cycle where antegrade flow ceases entirely, visualized as "flow gaps" and quantified by the FVSI. This index is calculated as the proportion of the total cycle duration occupied by these periods of absent flow. A higher FVSI value directly correlates with a greater degree of hemodynamic stasis. The text further specifies a severe manifestation of this abnormality, where the typical biphasic pattern is lost. The systolic component of flow is entirely absent, leaving only a solitary diastolic wave propagating below the baseline. This monophasic pattern underscores a critically reduced pressure gradient between the peripheral venous system and the right atrium, severely compromising the vein's ability to propel blood forward effectively. Such a finding is highly suggestive of a proximal obstruction or significantly elevated venous pressure, representing a substantial risk factor for the development of deep venous thrombosis.
Anatomically, the superior vena cava (SVC) provides the most direct sonographic access to right atrial hemodynamics. Its Doppler waveform, best obtained via a subcostal "bicaval" or suprasternal approach, resembles that of the hepatic vein. Evidence suggests that a systolic-to-diastolic wave ratio derived from the subcostal view correlates robustly with elevated right atrial pressure, and its integration with IVC parameters may enhance diagnostic accuracy. Thus, the SVC serves as a valuable adjunctive data point, especially when other central veins cannot be adequately visualized[126,127].
Finally, the splenic vein offers a hemodynamic profile analogous to the portal vein, serving as a viable substitute when the standard right lateral intercostal window is obstructed. Early evidence from pediatric[128] and adult cardiac surgery cohorts[129] indicates that its pulsatility index responds to decongestion, mirroring changes in the portal vein. However, its utility is inherently limited in the context of advanced liver disease, where portal hemodynamics become decoupled from central venous pressure.
In conclusion, the eVExUS concept acknowledges the practical challenges of standardized VExUS acquisition and capitalizes on the interconnected nature of the venous system. By leveraging alternative vessels like the IJV, femoral vein, SVC, and splenic vein (Table 4), clinicians can construct a flexible, patient-tailored hemodynamic assessment, ensuring the evaluation of venous congestion remains feasible and informative across a wide spectrum of clinical scenarios (Table 4).
4.1.2. Arterial Hypovascularization
HEPATIC ARTERY: In a healthy physiological state, arteries can adjust their resistance to redirect blood flow to the organs that need it most. When an organ requires more blood, its arterioles relax, resulting in low resistance and adequate perfusion. Conversely, when an organ enters "power save" mode, its arterioles constrict, causing high resistance and redirecting blood flow to other organs. The hepatic artery is a low-resistance vessel and normally has an RI of 0.55–0.7[70]. Liver disease can cause abnormal changes in the resistance of the hepatic artery, with resistance index (RI) values either elevated (RI >0.7) or decreased (RI <0.55). High resistance is a nonspecific finding that may occur in conditions such as the postprandial state, advanced age, peripheral microvascular compression, and chronic hepatocellular diseases like cirrhosis, hepatic venous congestion, cold ischemia (post-transplantation), and transplant rejection at any stage[130]. Low hepatic arterial resistance is more indicative of disease and has a narrower range of potential causes. These include conditions linked to proximal arterial narrowing, such as transplant hepatic artery stenosis (at the anastomosis), atherosclerotic disease (in the celiac or hepatic arteries), and arcuate ligament syndrome. It can also be associated with distal vascular shunts, such as post-traumatic or iatrogenic arteriovenous fistulas, cirrhosis with portal hypertension and related arteriovenous or arterioportal shunts, and Osler-Weber-Rendu syndrome with arteriovenous fistulas[130].
The hepatic artery normally shows an anterograde flow with low-resistance spectral waves (resistance index [RI] 0.55–0.7) and systolic speeds up to 30–60 cm/s. However, hepatic venous congestion can increase arterial resistance (RI >0.7), due to vasoconstriction in acute settings and fibrosis in chronic cases [98]. Significant correlations have been found between hepatic venous pressure gradient (HVPG) and the resistance indices of the splenic artery, superior mesenteric artery, and renal artery [66,131].
Additionally, hepatic arterial indices are used to calculate early systolic acceleration, which is expressed in meters per second squared (m/s²). The slope of the initial systolic upsweep is measured to calculate the acceleration time, which reflects early systolic acceleration [132].
Although changes in arterial and portal flow are not specific to chronic hepatic diseases (CH), they are commonly seen in hepatic cirrhosis [98,133].
In cirrhosis, increased resistance to blood flow is also seen in the hepatic arteries. Hepatic arterial indices, such as the pulsatility index and resistive index, are calculated to assess this resistance. The pulsatility index[134], which uses mean velocity, is more effective than the resistive index (which uses peak velocity) in estimating PHT. These indices can also help detect hepatic arterial stenosis or thrombosis after liver transplantation. Similar indices can be used for the superior mesenteric artery, splenic artery, and renal vessels.
The initial non-invasive assessment of splanchnic hypertension involved the use of the splenic resistance index (RI) and pulsatility index (PI), first studied by Bolognesi et al. [135] in 1996. Their research on 207 patients with portal hypertension showed a strong correlation between these splenic indices and portal vein resistance, measured by hepatic vein catheterization (RI: r = 0.80, P < 0.001; PI: r = 0.87, P < 0.001). These indices were elevated in cirrhosis patients, indicating portal vein blood flow resistance. In a 2012 follow-up study by the same group[136], splenic PI was measured in 48 heart failure patients and 39 healthy controls. Heart failure patients showed a significantly higher PI (1.19 ± 0.41) compared to controls (0.73 ± 0.11, p < 0.0001). The splenic PI correlated with the diameter of the hepatic vein (p < 0.02) but not with systemic arterial pressure, cardiac output, or splenic arterial resistance. However, it was significantly associated with right atrial mean pressure (p < 0.0003) and right ventricular end-diastolic pressure (p < 0.011). Additionally, Yoshihisa et al. [137] investigated liver hypoperfusion and found that a lower peak systolic velocity (PSV) of the celiac artery was correlated with the cardiac index and tricuspid annular plane systolic excursion.
4.2. Cardiac Evaluation: Echocardiography
Echocardiography remains the principal non-invasive modality for the comprehensive assessment of cardiac structure and function in heart failure (HF). While the determination of left ventricular ejection fraction (LVEF) is indispensable for phenotyping into HF with reduced, mildly reduced, and preserved ejection fraction (HFrEF, HFmrEF, HFpEF), a myopic focus on the left ventricle provides an incomplete hemodynamic picture. A paradigm shift towards a holistic evaluation is critical, one that explicitly recognizes the right heart and systemic venous circulation as the central determinants of congestive pathophysiology. The elevation of right-sided filling pressures, culminating in systemic venous hypertension, constitutes the fundamental hemodynamic link between cardiac dysfunction and the end-organ congestion observed in the splanchnic bed[138]. Consequently, the echocardiographic interrogation must be systematically expanded to quantify the burden on the right heart. The initial evaluation of the inferior vena cava (IVC) provides a direct window into right atrial pressure (RAP). A dilated IVC (>2.1 cm) with diminished respiratory collapsibility (<50%) is a well-validated surrogate for elevated RAP and serves as the foundational marker that should prompt a more detailed assessment of venous congestion [139]. Proximal to the IVC, the right atrium (RA) functions as a compliance chamber and a morphological barometer of chronic pressure overload. RA enlargement (area >18 cm²) is not merely a passive consequence but an independent prognosticator, reflecting the duration and severity of elevated RAP. The primary driver of this elevated pressure is often right ventricular (RV) dysfunction. The RV, a thin-walled chamber adapted for a high-compliance, low-pressure circuit, is exquisitely sensitive to increases in afterload, as seen in pulmonary hypertension (PH). Echocardiographic evaluation of the RV, therefore, requires a multi-parametric approach. Linear measures such as TAPSE (Tricuspid Annular Plane Systolic Excursion <1.7 cm) and two-dimensional measures like fractional area change (FAC <35%) provide robust, albeit load-dependent, assessments of global systolic function. More recently, speckle-tracking echocardiography has enabled the quantification of RV free wall longitudinal strain, a sensitive marker of subclinical myocardial deformation that is often impaired before overt dysfunction is apparent. The afterload on the RV is predominantly defined by the pulmonary vascular system. The peak velocity of the tricuspid regurgitant jet allows for the estimation of RV systolic pressure, a key surrogate for pulmonary arterial systolic pressure. Supporting signs of PH include a shortened pulmonary artery acceleration time (<105 ms) and RV hypertrophy. Significant tricuspid regurgitation (TR), whether primary or more commonly functional secondary to annular dilation and RV remodeling, creates a volume-overloaded state that further exacerbates RA pressure elevation and systemic venous congestion.
In the diagnostic word, echocardiography is paramount for the accurate classification of heart failure into its distinct phenotypes. The assessment begins with the determination of LVEF, which categorizes patients into heart failure with reduced ejection fraction (HFrEF), heart failure with preserved ejection fraction (HFpEF), and the intermediary category of HFmrEF[44] (Figure ).
In heart failure with preserved ejection fraction (HFpEF), the main pathological process is not an impaired ability of the left ventricle to eject blood but rather a compromised capacity to fill during diastole. The ventricle often exhibits concentric hypertrophy, increased wall stiffness, and impaired relaxation, leading to elevated filling pressures despite a normal or near-normal ejection fraction[140]. Hemodynamically, this results in abnormal left atrial pressure-volume relationships, pulmonary venous congestion, and a marked sensitivity to changes in volume status and afterload; these features are exacerbated by microvascular dysfunction and comorbid systemic inflammation[141]. The myocardial substrate is frequently characterized by increased interstitial fibrosis and microvascular rarefaction, which together impair lusitropic function and reserve capacity under stress[140,142].
By contrast, in heart failure with reduced ejection fraction (HFrEF), the hallmark is systolic dysfunction, defined by a significantly decreased capacity of the left ventricle to generate forward stroke volume; ejection fraction here is typically ≤40% [143]. Structural remodeling often manifests as chamber dilation (eccentric hypertrophy), with thinning of walls, reduced contractile performance, and activation of maladaptive neurohormonal pathways [143]. This maladaptive cycle involves increased wall stress, elevated circulating catecholamines, and activation of the renin-angiotensin-aldosterone system, all of which perpetuate further remodeling and deterioration of pump function[3]. The clinical course is marked by reduced cardiac output at rest and during exertion, diminished contractile reserve, and frequent development of secondary mitral regurgitation due to annular dilatation and papillary muscle displacement [143].
Pulmonary hypertension introduces a distinct but interrelated hemodynamic burden, in which increased pulmonary vascular resistance and right ventricular afterload become central. Recent redefinitions (6th World Symposium) lowered the mean pulmonary arterial pressure (mPAP) threshold to >20 mmHg at rest, with emphasis also on pulmonary vascular resistance (PVR) to distinguish pre-capillary from post-capillary PH [144]. The right ventricle, normally adapted to a low-pressure circuit, responds initially with hypertrophy to preserve stroke volume, but chronic elevation of pulmonary arterial pressure eventually leads to dilation, impaired contractility, and right-sided failure; vascular remodeling including smooth muscle proliferation, endothelial dysfunction, and sometimes in situ thrombosis further worsen the load [144]. As the disease advances, ventricular–ventricular interactions become evident, with right ventricular dilatation shifting the interventricular septum and thereby impairing left ventricular filling, linking pulmonary hypertension pathophysiology tightly to both HFpEF and HFrEF through shared mechanisms of pressure overload, neurohormonal activation, and maladaptive remodeling.
In HFpEF, recent evidence emphasizes the role of metabolic and microvascular abnormalities rather than isolated diastolic dysfunction. HFpEF myocardium demonstrates impaired substrate flexibility, with a shift toward fatty acid utilization and impaired ketone oxidation, changes that can be partially modulated by SGLT2 inhibition but not always with functional benefit[145,146]. In patients with type 2 diabetes and HFpEF without coronary disease, cardiovascular magnetic resonance imaging has revealed impaired myocardial perfusion reserve, abnormal left atrial reservoir function, and compensatory booster-pump activity, all correlating with diastolic strain[147]. In parallel, circulating mediator studies suggest that inflammatory and fibrotic pathways, particularly IL-1 receptor signaling, mediate the link between cardiometabolic disease and HFpEF progression[148]. These findings highlight HFpEF as a systemic, comorbidity-driven phenotype with microvascular, metabolic, and inflammatory underpinnings in addition to traditional stiffness and concentric remodeling (Table ).
In heart failure with reduced ejection fraction (HFrEF), the defining characteristic remains systolic dysfunction, but novel data underscore how pharmacological interventions modify cardiac structure and function. A recent meta-analysis confirmed that SGLT2 inhibitors consistently induce left ventricular reverse remodeling, with reductions in end-diastolic and end-systolic volumes across trials[149]. Combination therapy with angiotensin receptor–neprilysin inhibitors (ARNIs) and SGLT2 inhibitors in patients with HFrEF or mildly reduced EF has been associated with significant improvements not only in left ventricular ejection fraction (LVEF), volumes, and mass, but also in global longitudinal strain and right ventricular function within three months of therapy[150]. Furthermore, the Heart Failure Optimization Study demonstrated that continued titration of guideline-directed medical therapy beyond 90 days in de novo HFrEF yields progressive LVEF recovery, underscoring the importance of ongoing therapy adjustment[151]. These findings refine the concept of HFrEF remodeling, moving beyond static chamber dilatation toward a dynamic, partially reversible phenotype responsive to modern therapies (Table ).
Pulmonary hypertension (PH) introduces a distinct hemodynamic burden, with recent studies clarifying both vascular and ventricular remodeling. Three-dimensional imaging of the right ventricle in human and experimental PH has demonstrated that microvascular networks become shorter, more tortuous, and more branched under pressure overload, though capillary density is preserved; importantly, some changes are reversible after unloading[152]. Advanced analyses of right ventricular myoarchitecture in rodent PH models show that the loss of helical fiber range impairs right ventricular–pulmonary arterial coupling and stroke volume generation, distinguishing adaptive from maladaptive remodeling[153]. In clinical settings, multiparametric imaging that integrates CT-based fibrosis scoring with MRI-derived right ventricular strain and volumes has improved diagnostic accuracy for PH in interstitial lung disease[154]. Moreover, right ventricular remodeling assessed by speckle-tracking echocardiography has been associated with prognosis in chronic thromboembolic PH after balloon pulmonary angioplasty[155]. These findings extend the concept of PH from a purely vascular disease to one in which right ventricular remodeling, microvascular adaptation, and ventricular–ventricular interaction determine outcomes (Table ).
Table 4.
Comparison of main cardiac characteristics in heart failure with preserved ejection fraction (HFpEF), heart failure with reduced ejection fraction (HFrEF), and pulmonary hypertension (PH).
Table 4.
Comparison of main cardiac characteristics in heart failure with preserved ejection fraction (HFpEF), heart failure with reduced ejection fraction (HFrEF), and pulmonary hypertension (PH).
| Feature | HFpEF | HFrEF | Pulmonary Hypertension |
|---|---|---|---|
| Primary dysfunction | Diastolic impairment (impaired relaxation, stiff ventricle) | Systolic impairment (reduced contractility, LVEF ≤40%) | Increased RV afterload due to elevated pulmonary vascular resistance |
| Structural remodeling | Concentric LV hypertrophy, LA enlargement, interstitial fibrosis | Eccentric LV hypertrophy, dilatation, secondary MR | RV hypertrophy (early), RV dilatation (late), septal shift |
| Metabolic features | Impaired substrate flexibility, reduced ketone oxidation [1,2] | Reverse remodeling under SGLT2i/ARNI therapy [5,6] | RV microvascular remodeling (shorter, tortuous vessels, preserved density) [8] |
| Microvascular/Perfusion | Reduced myocardial perfusion reserve, LA functional changes [3] | Partially reversible LV microvascular dysfunction | RV perfusion and microarchitecture linked to coupling [9] |
| Neurohormonal/Inflammatory role | Inflammatory mediators (IL-1R1, fibrosis pathways) [4] | Strong neurohormonal activation (RAAS, sympathetic system) | Endothelial dysfunction, smooth muscle proliferation, in situ thrombosis |
| Imaging markers | Strain analysis shows impaired LA reservoir and LV diastolic strain [3] | Global longitudinal strain improves with therapy [6] | RV strain by MRI/echo, CT-MRI integration improves PH detection [10,11] |
| Reversibility | Limited, comorbidity-driven phenotype | Partially reversible with optimal therapy [7] | Some vascular and RV changes reversible after unloading [8] |
The table integrates recent findings on metabolic remodeling, microvascular and perfusion changes, inflammatory pathways, and therapeutic responsiveness (2022–2025). HFpEF is increasingly recognized as a systemic, comorbidity-driven syndrome characterized by metabolic inflexibility, microvascular dysfunction, and limited reversibility. HFrEF remains defined by systolic dysfunction and maladaptive dilatation, but recent evidence highlights the potential for partial reverse remodeling under guideline-directed therapies, particularly with ARNI and SGLT2 inhibitors. PH pathophysiology extends beyond pulmonary vascular resistance to include right ventricular remodeling, microvascular adaptations, and ventricular–ventricular interactions, with certain structural and vascular changes shown to be reversible after unloading or intervention.
Figure 17.
Types of Heart Failure.
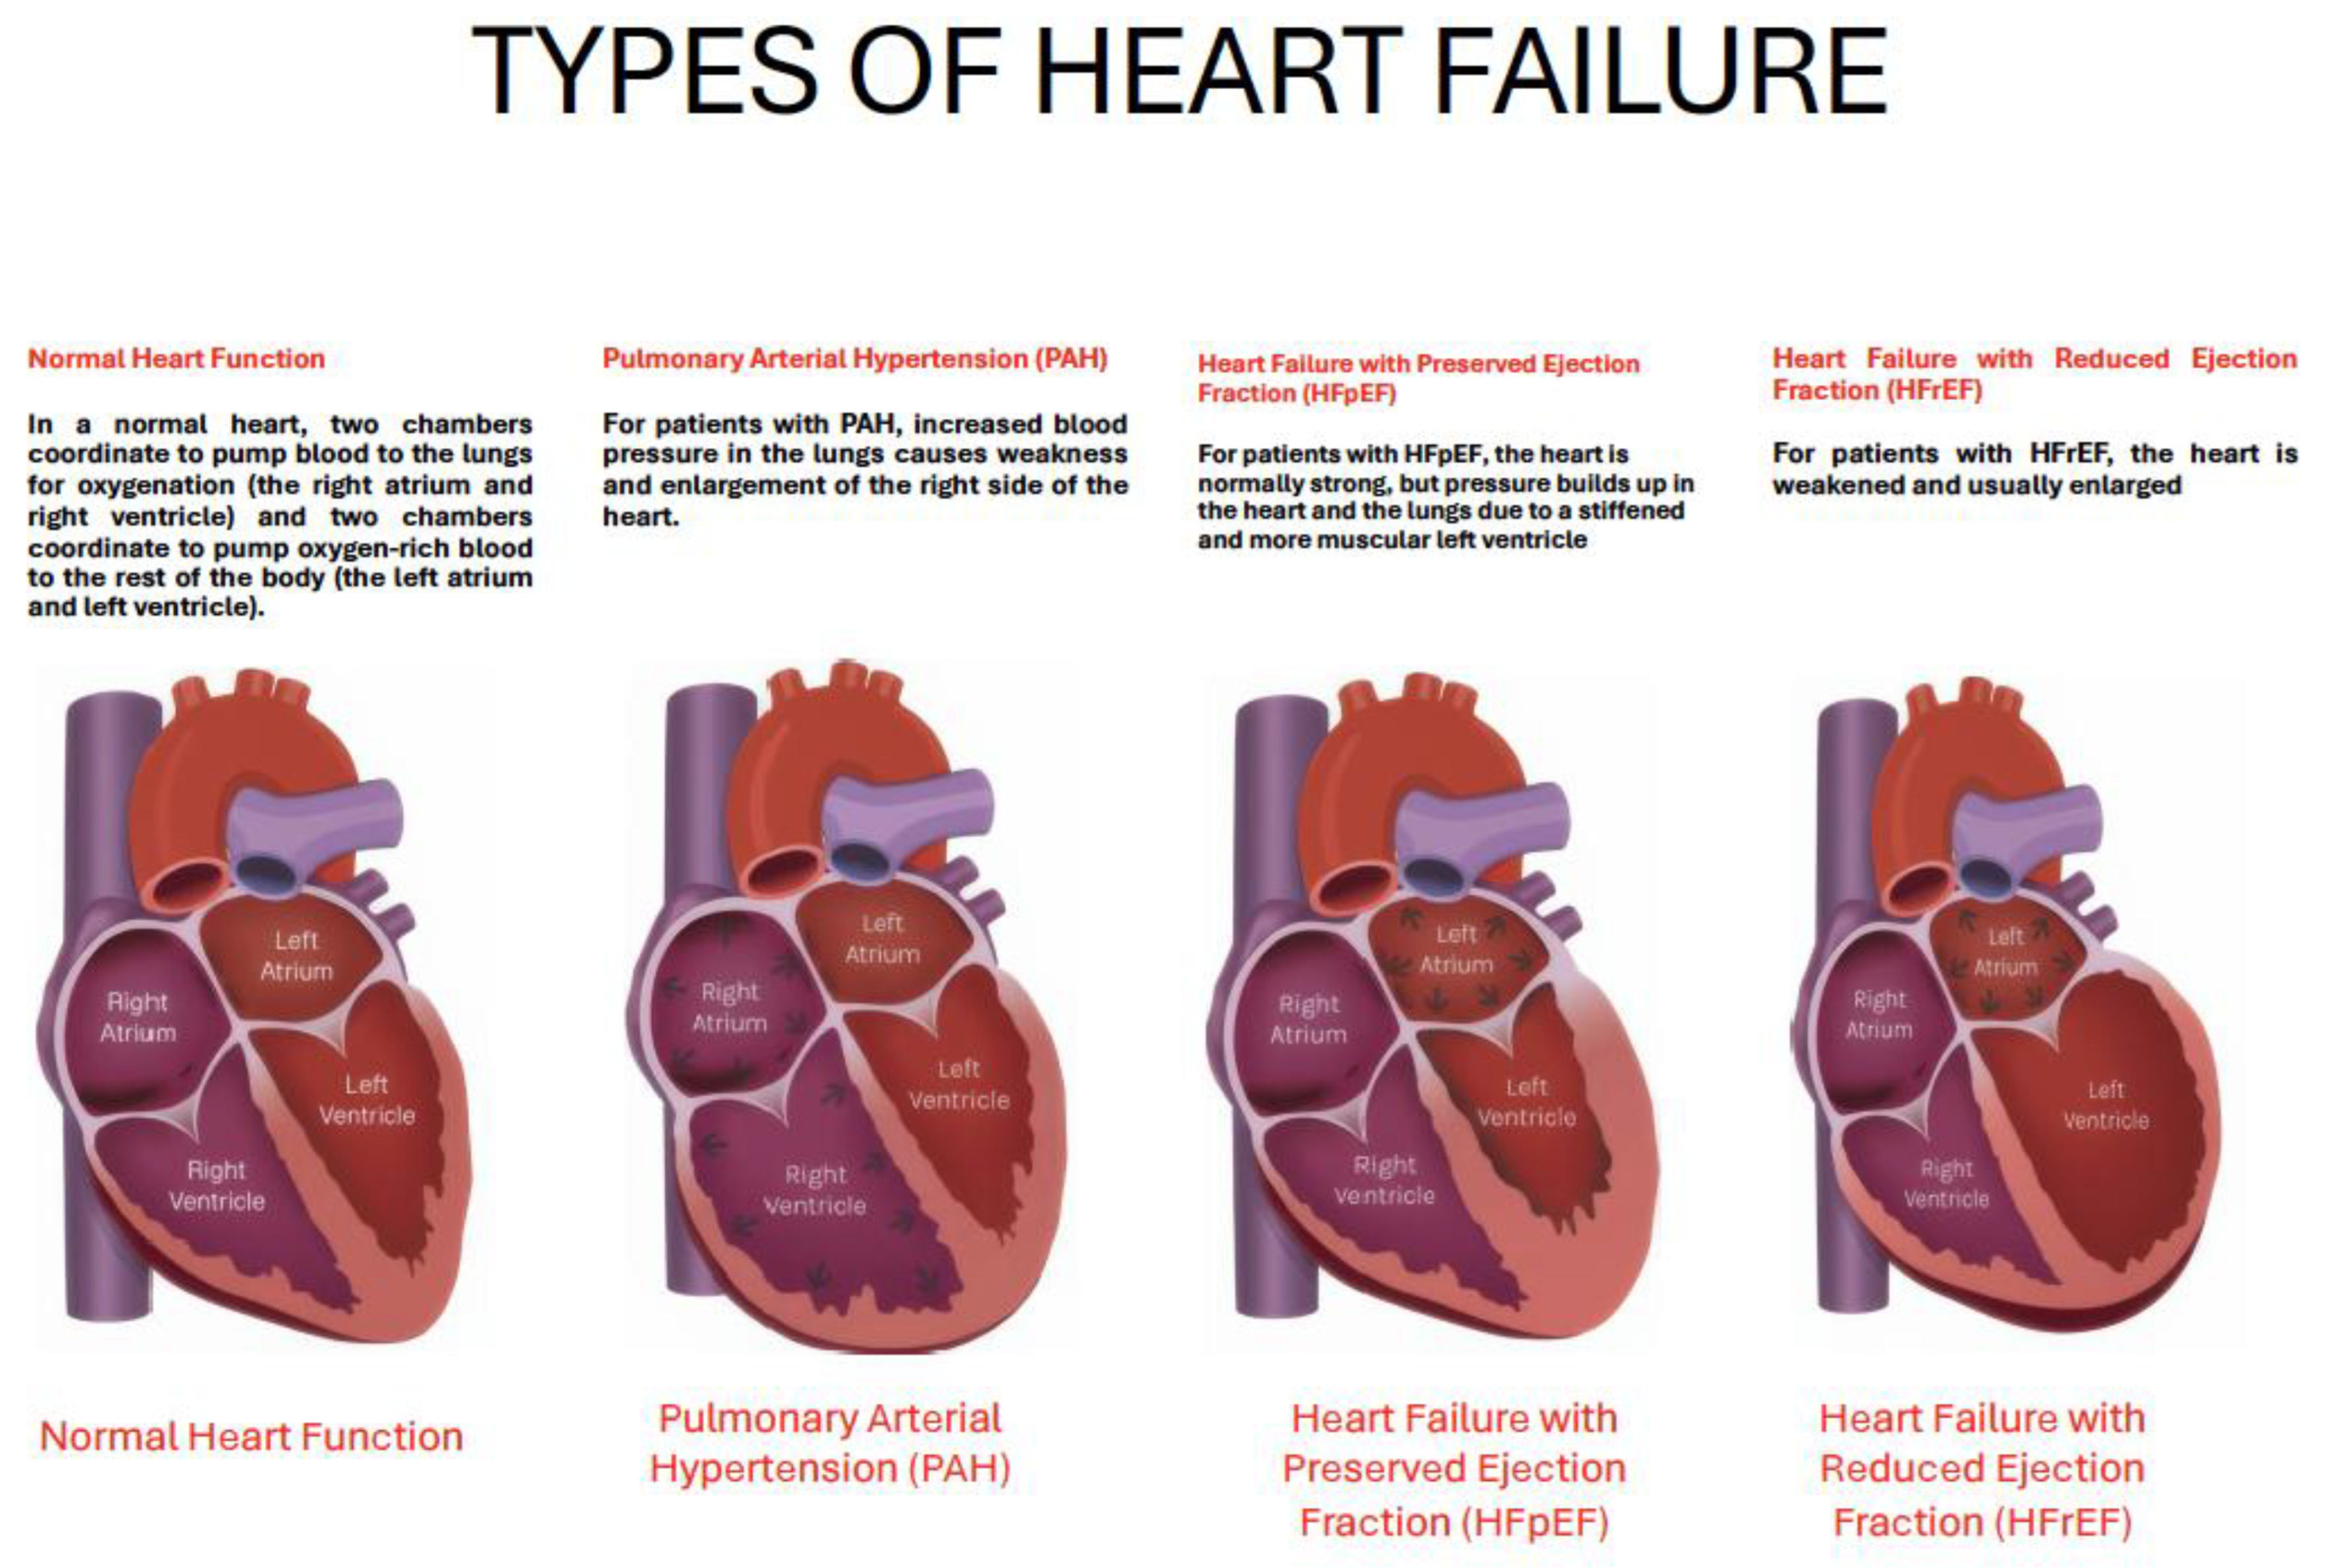
However, a contemporary echocardiographic examination delves much deeper. In HFrEF, it characterizes the extent of adverse ventricular remodeling through linear and volumetric dimensions and evaluates concomitant functional mitral regurgitation. Crucially, as demonstrated by Yoshimura et al. [156], the diastolic function parameter E/e' ratio, a surrogate for left ventricular filling pressure, acquires significant prognostic value even in systolic heart failure (Table 4); a lower baseline E/e' emerges as an independent predictor of subsequent systolic recovery and transition to heart failure with improved ejection fraction (HFimpEF), suggesting a myocardium with less fibrotic burden and greater potential for reverse remodeling.
The echocardiographic diagnosis of HFpEF is more nuanced [157], as no single parameter is pathognomonic. Instead, it relies on a constellation of findings that provide evidence of a elevated filling pressures and cardiac remodeling. This includes left atrial enlargement, which serves as a morphological biomarker of chronically elevated left atrial pressure, left ventricular hypertrophy or concentric remodeling, and objective evidence of diastolic dysfunction. Given that many patients with HFpEF manifest normal hemodynamics at rest, diastolic stress echocardiography is often required to unmask the pathological elevation in left ventricular filling pressures, evidenced by an abnormal rise in the E/e' ratio and pulmonary arterial systolic pressure with exercise. Furthermore, advanced techniques such as speckle-tracking echocardiography are increasingly critical, revealing subclinical systolic dysfunction through impaired global longitudinal strain (GLS) and quantifying left atrial reservoir strain, which is a sensitive marker of atrial myopathy and increased chamber stiffness[157].
Echocardiography is equally vital in the differential diagnosis to exclude specific phenocopies of HFpEF or distinct cardiomyopathies that mandate tailored therapies [158]. It identifies the asymmetric septal hypertrophy and dynamic left ventricular outflow tract obstruction of hypertrophic cardiomyopathy, the concentric hypertrophy with granular sparkling and apical-sparing strain pattern of cardiac amyloidosis, the basal septal thinning and regional wall motion abnormalities in a non-coronary distribution suggestive of cardiac sarcoidosis, and the deep trabeculations of left ventricular non-compaction.
In terms of management and follow-up, echocardiography evolves into a guide for treatment strategy and a monitor of therapeutic response. Serial examinations are used to track the efficacy of guideline-directed medical therapy by documenting reverse remodeling—a reduction in left ventricular volumes, an improvement in LVEF, and a lowering of estimated filling pressures. The confirmation of HFimpEF on follow-up echo carries significant prognostic implications. In HFpEF, echocardiography helps identify dominant phenotypes, such as those with significant pulmonary hypertension or right ventricular dysfunction, which may influence management choices. The integration of echocardiography with cardiopulmonary exercise testing (CPX-ESE) [157] offers a powerful, non-invasive means to dissect the multifactorial contributors to exercise intolerance, linking central cardiac limitations (e.g., failure to augment stroke volume, elevated filling pressures on exertion) to peripheral factors like impaired oxygen extraction. Echocardiography provides a comprehensive hemodynamic and morphologic assessment that is central to the modern management of heart failure. It is the primary tool for establishing etiology and phenotype, a crucial guide for tailoring management, and an essential instrument for monitoring disease progression, therapeutic response, and long-term prognosis. Its power resides in the synergistic interpretation of a multitude of parameters, from fundamental 2D and Doppler indices to advanced deformation imaging, all contextualized within the patient's clinical presentation
4.2.1. The Evolving Role of Echocardiography OF LEFT HEART in Heart Failure
Recent international guidelines and scientific statements have begun to incorporate hepatic and portal vein evaluation. The 2021 ESC Guidelines for the diagnosis and treatment of acute and chronic HF acknowledge the role of intra-abdominal Doppler and organ congestion assessment in the evaluation of patients (McDonagh et al., 2021) [159]. Furthermore, comprehensive review highlighted the assessment of inferior vena cava as a reliable surrogate for elevated right atrial pressure[160] and a predictor of diuretic response and rehospitalization risk[161]. A landmark study demonstrated that a multiparametric echocardiographic protocol including splanchnic vein assessment provided superior prognostic stratification compared to standard echocardiography alone[162].
Echocardiography is a key investigation recommended for evaluating cardiac function. In addition to measuring left ventricular ejection fraction (LVEF), it yields valuable information on chamber dimensions, the presence of concentric or eccentric left ventricular hypertrophy, regional wall motion abnormalities (which may be caused by coronary artery disease or myocarditis), right ventricular function, pulmonary hypertension, valvular abnormalities, and diastolic function. Indeed, the assessment of LVEF, which categorizes patients into heart failure with reduced ejection fraction (HFrEF), heart failure with preserved ejection fraction (HFpEF), and the intermediary category of HFmrEF[44] is only one element in the evalutation of cardiac function. A contemporary echocardiographic examination delves much deeper [163].
Although the measurement of EF is extremely useful in clinical practice, it remains rather simplistic, as there are situations in which LVEF does not truly reflect cardiac function. As illustrated in the two cases described in Figure and Figure 1A, LVEF differs markedly (32% in the case of HFrEF and 56% in HFpEF), yet cardiac performance expressed as stroke volume (SV) and stroke volume indexed to body surface area (SVi) is very similar (around 35 ml/m²). These cases highlight that cardiac function cannot be assessed solely based on LVEF but requires a multiparametric evaluation to better characterize ventricular dysfunction and understand the mechanisms underlying venous congestion. As shown in Figure 2A and 18B and emphasized in the recent American Society of Echocardiography (ASE) guidelines for the evaluation of left ventricular diastolic function [164], HFpEF is characterized by impaired relaxation (defined by a lateral e′ ≤ 7 cm/s) which compromises effective systole and the generation of restoring forces that normally act during diastole (like the release of an elastic spring) [165]. This in turn leads to diastolic dysfunction (defined by E/e′ > 14, E/A > 2, and left atrial enlargement > 34 ml/m²), which is therefore tightly coupled to systolic dysfunction. The rise in filling pressures, occurring for different reasons in both HFrEF and HFpEF, results in pulmonary hypertension (Figure 3B, panels A–B) and venous congestion (Figure 4B, panel C).
Crucially, as demonstrated by Yoshimura et al. [156], the diastolic function parameter E/e' ratio acquires significant prognostic value even in HFrEF (Table 4); a lower baseline E/e' emerges as an independent predictor of subsequent systolic recovery and transition to heart failure with improved ejection fraction (HFimpEF), suggesting a myocardium with less fibrotic burden and greater potential for reverse remodeling.
The echocardiographic diagnosis of HFpEF is more nuanced [157], as no single parameter is pathognomonic. Instead, it relies on a constellation of findings, included in the HFA-PEFF score [166], that provide evidence of diastolic dysfunction, elevated filling pressures and cardiac remodeling. Furthermore, advanced techniques such as speckle-tracking echocardiography are increasingly critical, revealing subclinical systolic dysfunction through impaired global longitudinal strain (GLS) and quantifying left atrial reservoir strain, which is a sensitive marker of atrial myopathy, increased chamber stiffness and filling pressure[157]. Echocardiography is equally vital in the differential diagnosis to exclude specific phenotype of HFrEF and HFpEF or distinct cardiomyopathies that mandate tailored therapies [158].
Figure 22.
HFrEF secondary to acute myocardial infarction with apical akinesia, characterized by low EF and low SV measured using the VTI method. Abbreviations: EF = Ejection Fraction; SV = Stroke Volume; SVi = Stroke Volume index.
Figure 22.
HFrEF secondary to acute myocardial infarction with apical akinesia, characterized by low EF and low SV measured using the VTI method. Abbreviations: EF = Ejection Fraction; SV = Stroke Volume; SVi = Stroke Volume index.
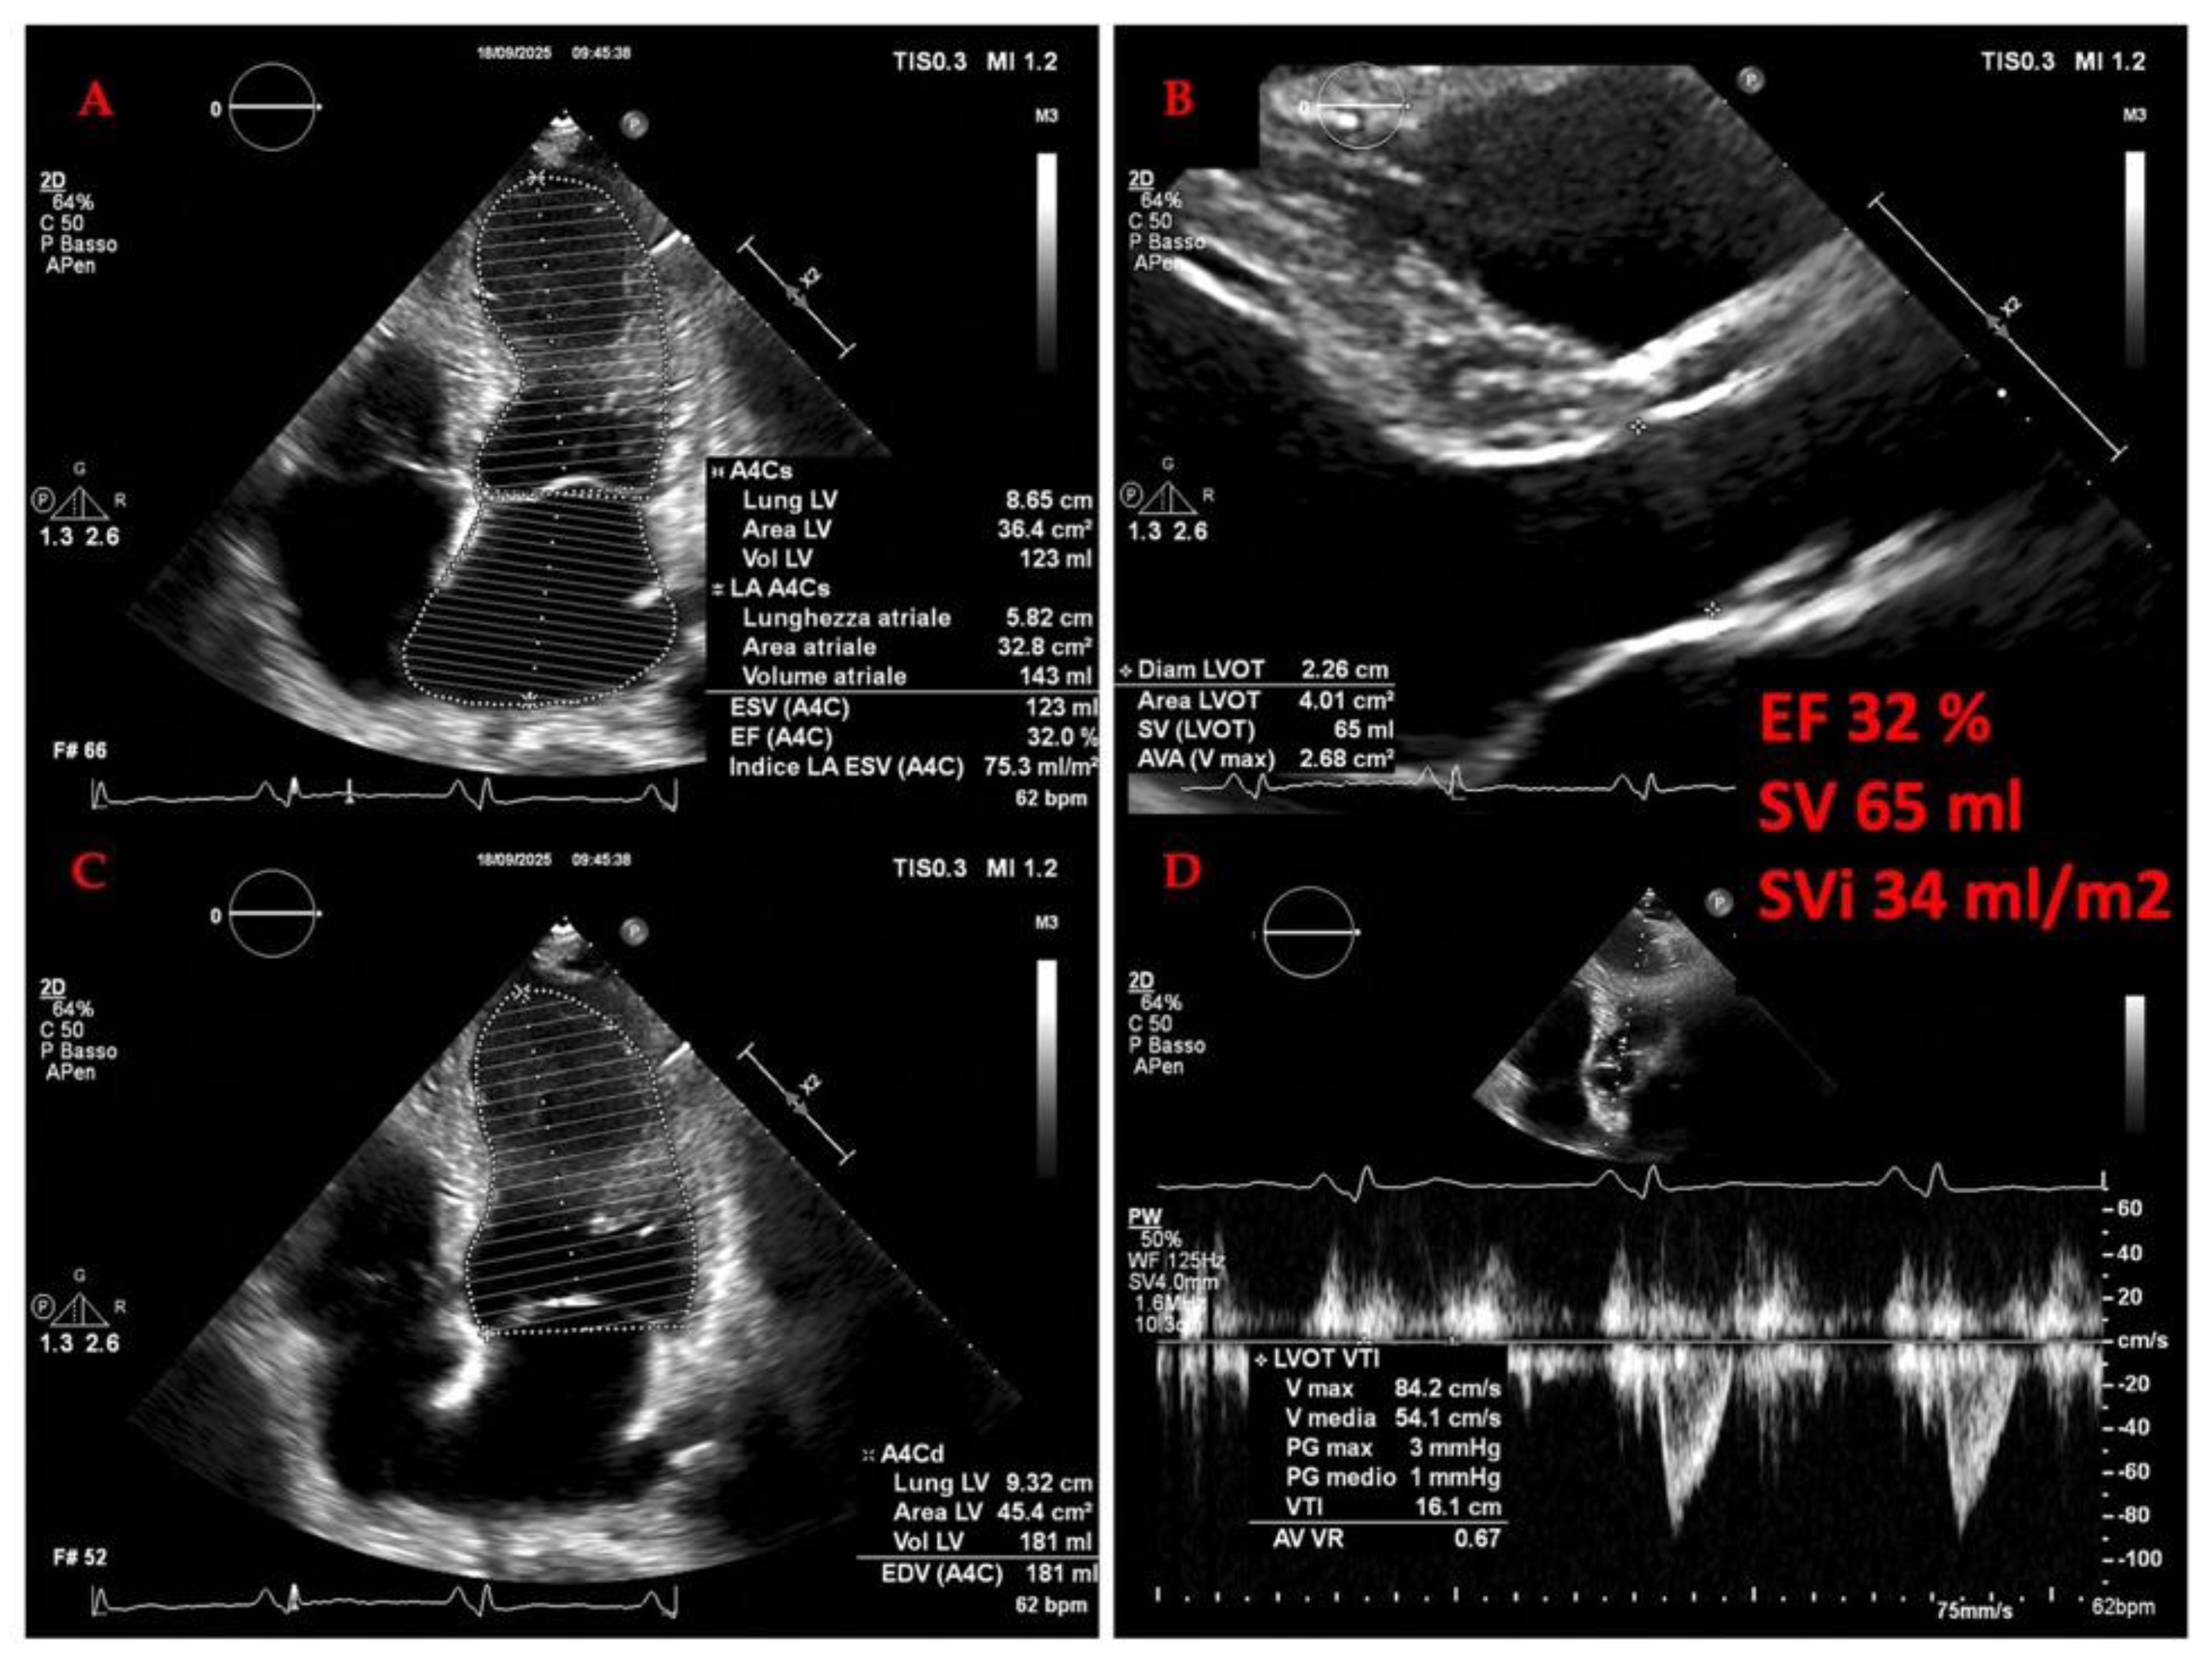
Figure 23.
A HFpEF secondary to hypertension, characterized by low EF and low SV measured using the VTI method. Note the right ventricle dilation (panel A and C). Abbreviations: EF = Ejection Fraction; SV = Stroke Volume; SVi = Stroke Volume index.
Figure 23.
A HFpEF secondary to hypertension, characterized by low EF and low SV measured using the VTI method. Note the right ventricle dilation (panel A and C). Abbreviations: EF = Ejection Fraction; SV = Stroke Volume; SVi = Stroke Volume index.
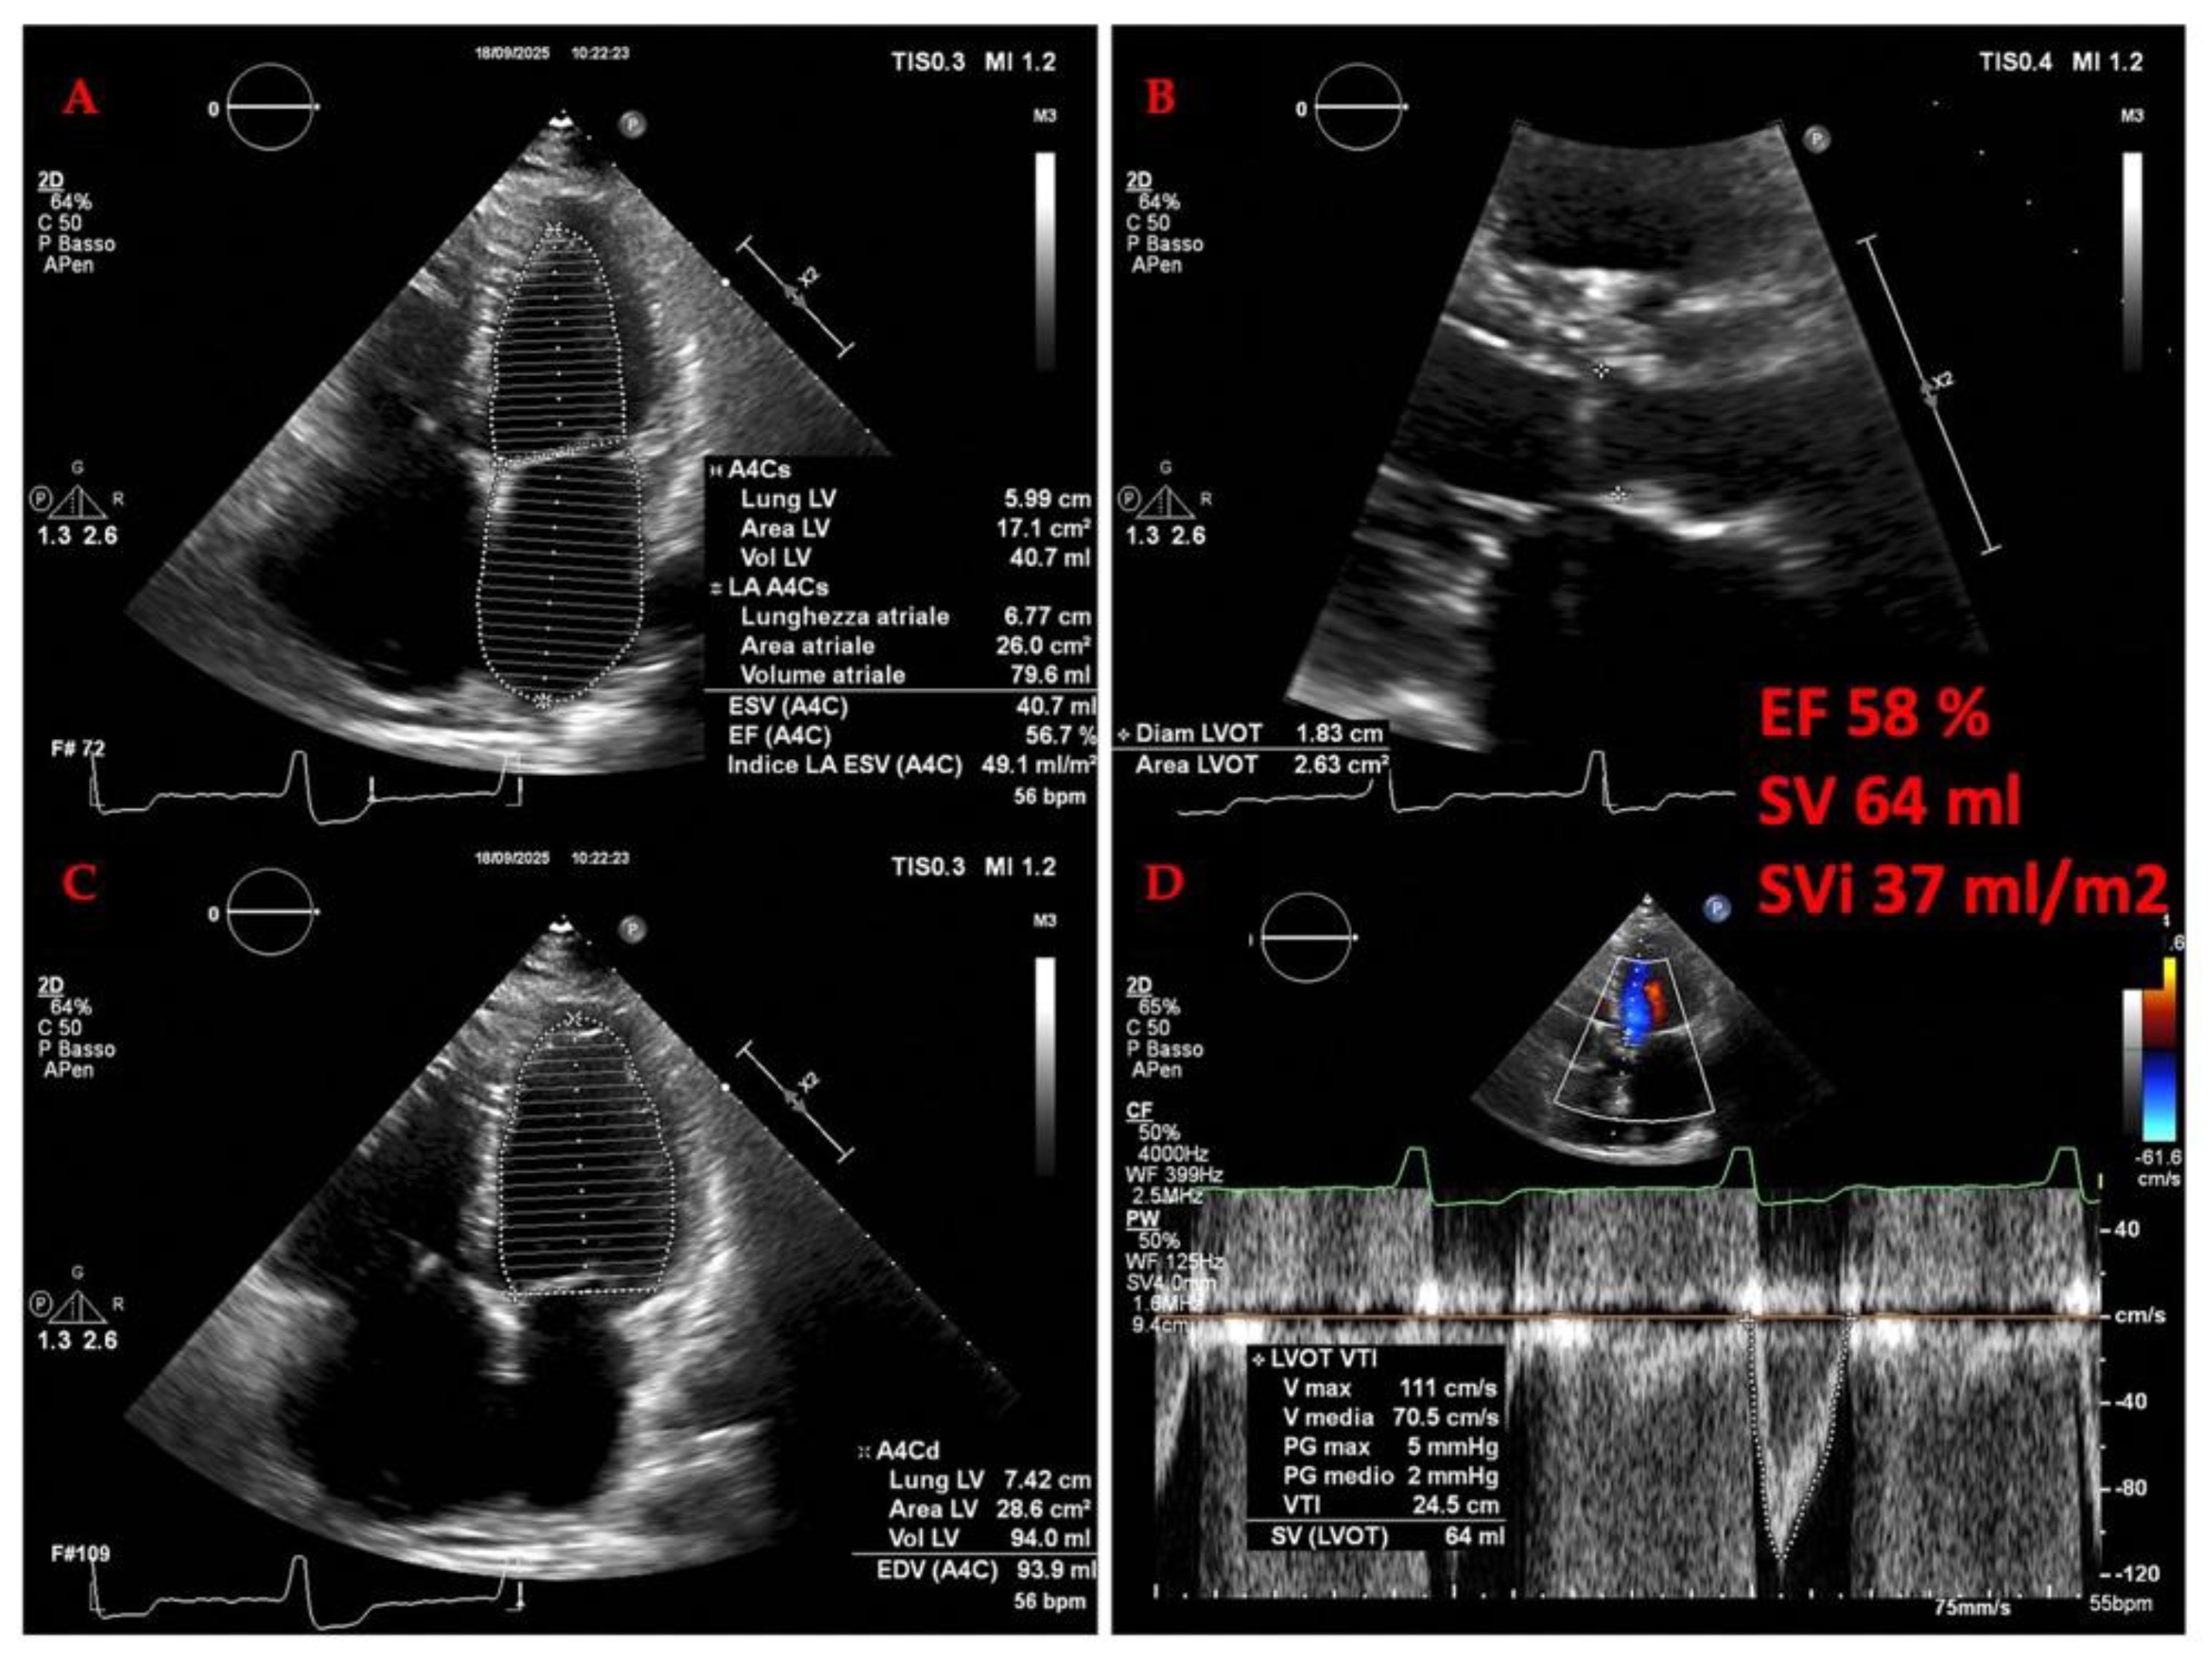
4.2.2. The Evolving Role of Echocardiography in Heart Failure: A Focus on the Right Heart and Pulmonary Hypertension (PH)
The recent ASE guidelines [167] underscore a paradigm shift, emphasizing the necessity of a systematic and quantitative evaluation of the right heart, particularly in the context of pulmonary hypertension (PH), which is a critical determinant of outcomes.
Hemodynamically defined as a mean pulmonary arterial pressure (mPAP) >20 mm Hg, is often first suspected echocardiographically [168]. The estimation of right ventricular systolic pressure (RVSP) from the tricuspid regurgitant jet velocity, combined with an assessment of inferior vena cava dynamics to estimate right atrial pressure (RAP), provides a crucial non-invasive screening tool [169]. However, diagnosis is refined by identifying the phenotypic adaptations of the right heart. Echocardiographic signs such as right ventricular hypertrophy (RVWT >0.5 cm), dilation (basal RV dimension >4.1 cm), impaired systolic function (TAPSE <1.7 cm, FAC <35%), and abnormal septal geometry (LVEI >1) help distinguish pre-capillary from post-capillary etiologies[170]. Furthermore, the identification of a dilated main pulmonary artery (>2.5 cm) or a shortened RV outflow tract acceleration time (AccT <105 ms) adds weight to the probability of significant pulmonary vascular disease [171].
The transition from diagnosis to management is where echocardiography proves its immense practical value (Figure 18B). In patients with heart failure, especially those with preserved EF (HFpEF), distinguishing isolated post-capillary PH from combined pre- and post-capillary PH is paramount, as it directly influences therapeutic strategy [172]. Echocardiographic assessment of left atrial pressure, primarily through the mitral E/e' ratio, provides an estimate of pulmonary capillary wedge pressure (PCWP), helping to identify a significant post-capillary component [173]. The response to therapy can be monitored serially. For instance, the efficacy of pulmonary vasodilators in pulmonary arterial hypertension (PAH) is assessed not only by a reduction in estimated RVSP but, more importantly, by improvements in right ventricular function and reverse remodeling [174]. Parameters like TAPSE, RV free wall strain, and RV fractional area change serve as markers of therapeutic response. The concept of right ventricular-pulmonary arterial (RV-PA) coupling, elegantly captured by ratios such as TAPSE/RVSP, has emerged as a powerful integrative measure. A low ratio indicates uncoupling, signifying that the right ventricle is failing to adapt to its increased afterload, which is a strong indicator for treatment intensification and a predictor of poor outcomes[174].
Long-term follow-up and risk stratification are perhaps the most critical applications of echocardiography in heart failure. Serial studies provide a dynamic window into the disease trajectory. Progressive right atrial enlargement, increasing RV dilation, worsening systolic function, and the development of a pericardial effusion are all echocardiographic harbingers of clinical deterioration and increased mortality [138]. The right atrium, in particular, is gaining recognition as a barometer of chronicity; its size and function, including novel measures like reservoir strain, are strongly prognostic. Advanced techniques such as three-dimensional echocardiography and speckle-tracking strain offer more reproducible and sensitive measures of RV volumes and myocardial deformation, respectively, allowing for earlier detection of subtle changes that may precede overt clinical worsening [175]. In the follow-up of patients with significant valvular heart disease contributing to heart failure, such as functional tricuspid regurgitation (FTR), echocardiography is indispensable for timing intervention and assessing its results, evaluating annular dilation, leaflet tethering, and the hemodynamic impact of the regurgitant lesion [176].
Figure 24.
B. Images from the same case described in figure 18A. Signs of elevated filling pressures, pulmonary hypertension, and venous congestion in HFpEF. Note the high E/e’ ratio (a sign of elevated left ventricular filling pressure), the restrictive diastolic pattern (panel D) with an E wave much larger than the A wave (arrowheads), the notch on the pulsed Doppler profile of the right ventricular outflow tract with AccT <105 ms (a sign of pulmonary hypertension) (arrow), and the dilated inferior vena cava (panel C) (sign of venous congestion).
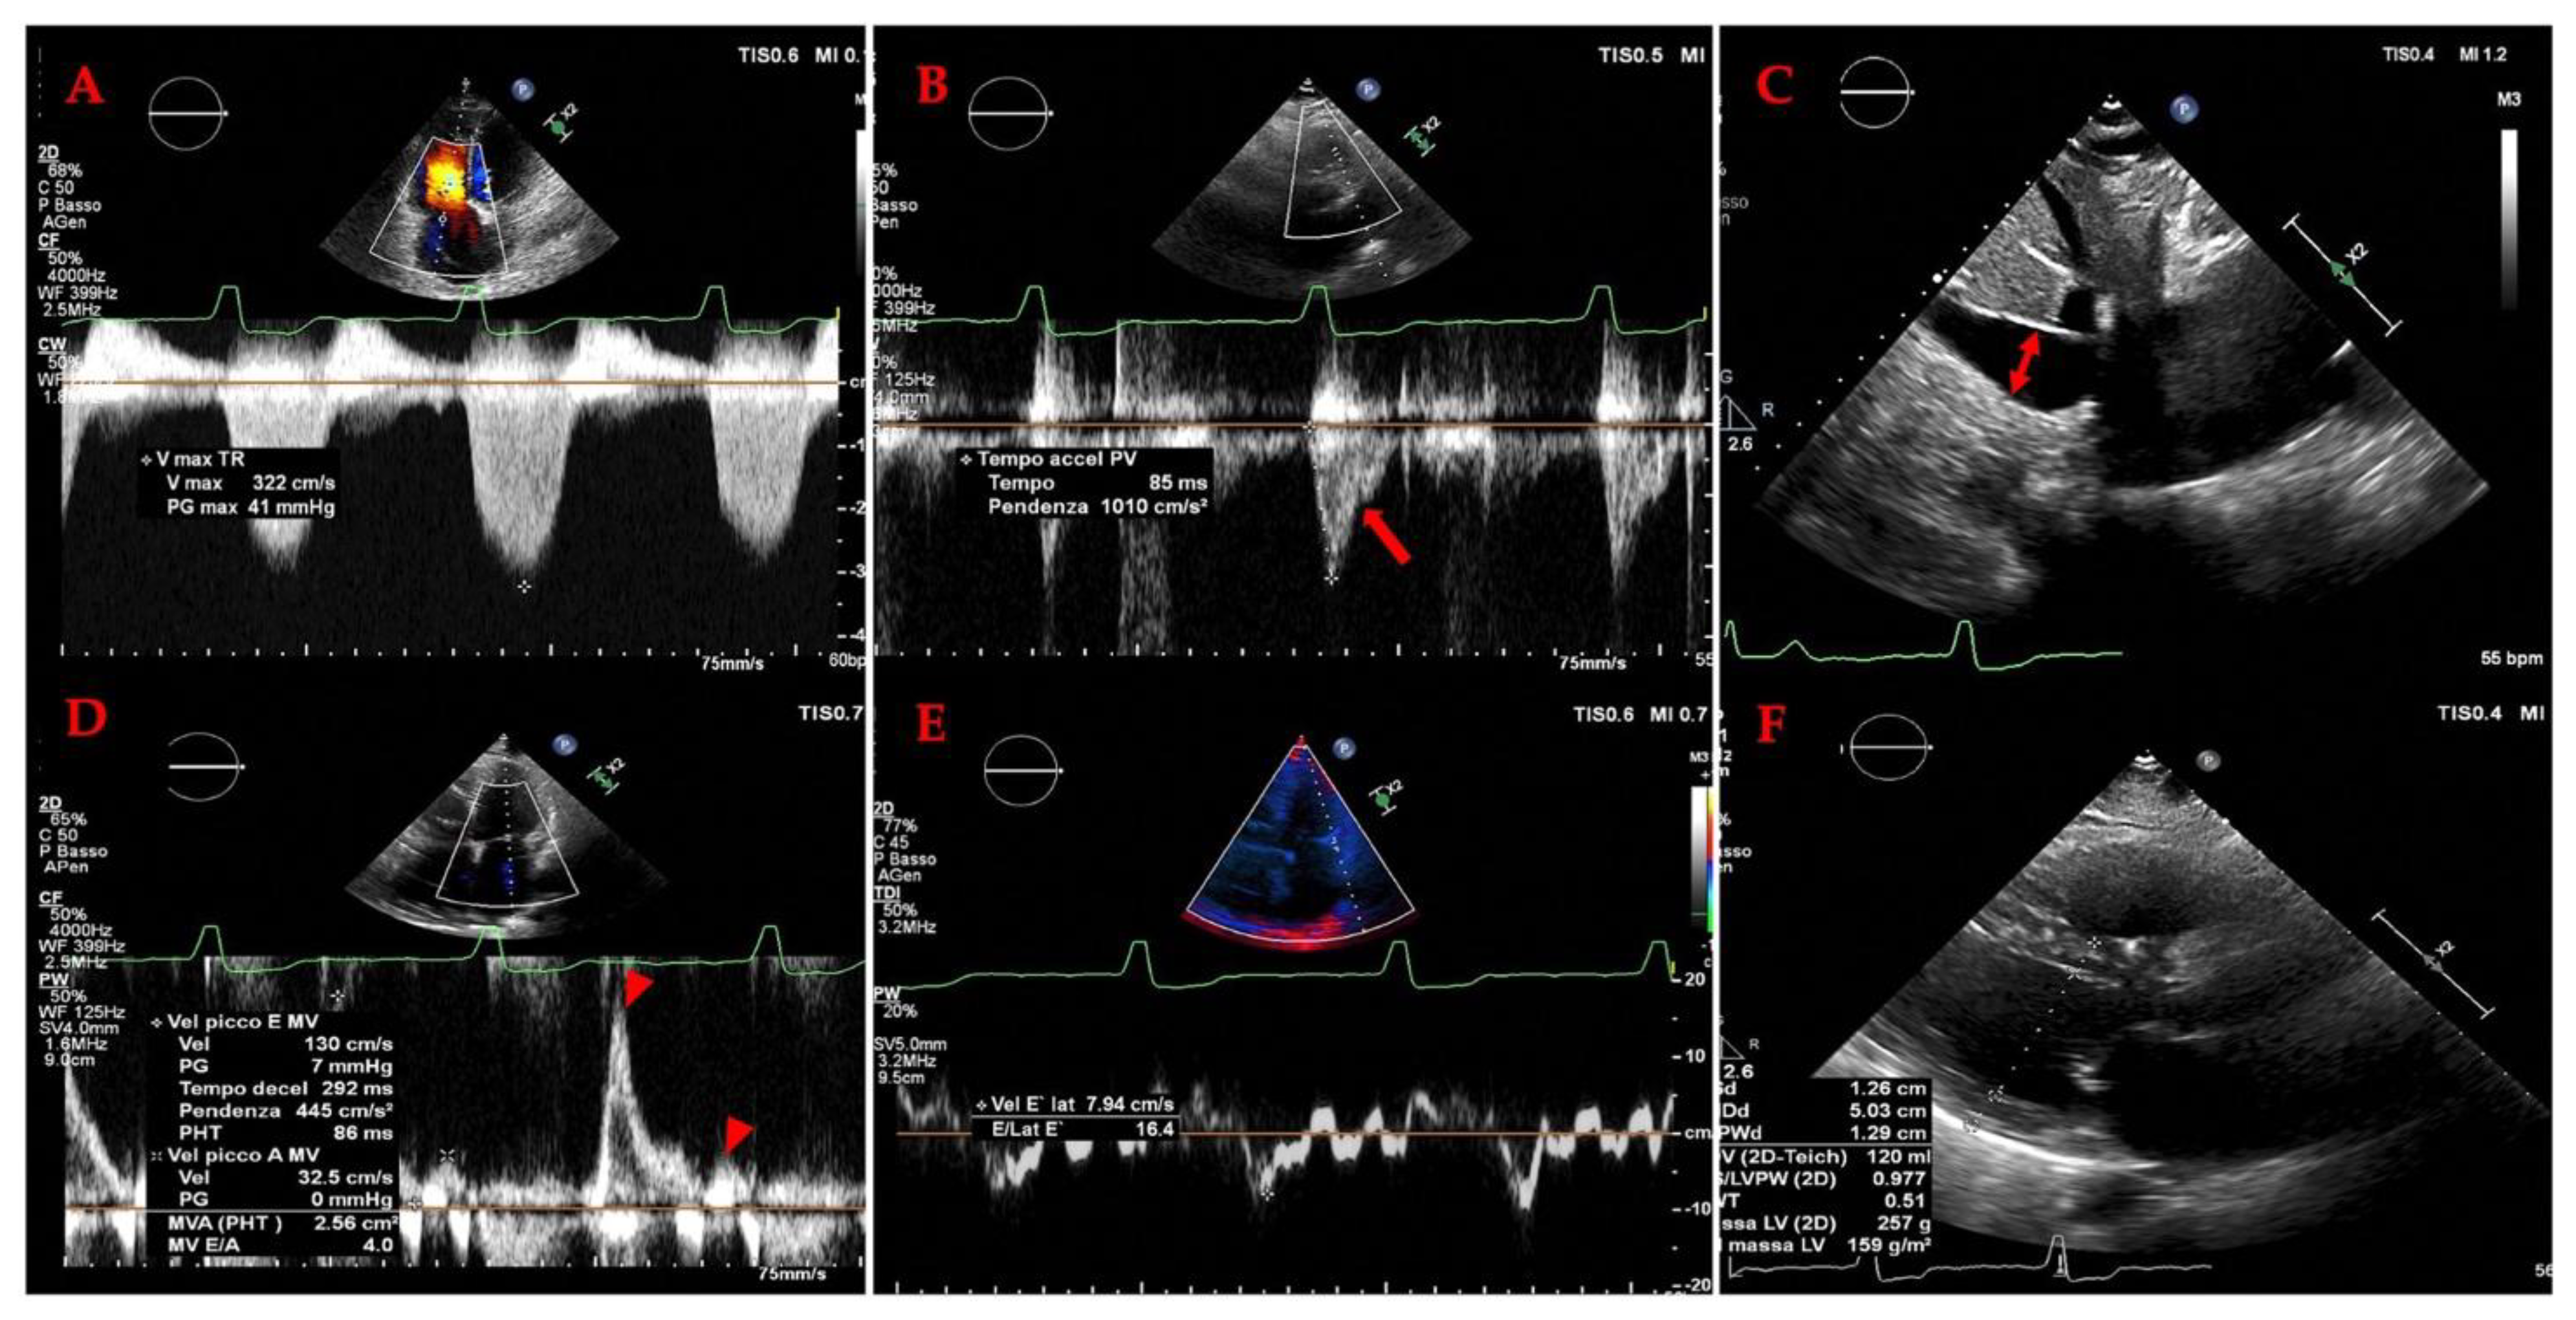
4.2.3. ECHOCARDIOGRAPHY IN ADVANCED HEART FAILURE:
Echocardiography serves as an indispensable, multifaceted tool throughout the continuum of advanced heart failure (AdHF), informing prediction, diagnosis, and clinical management in ways that transcend simple imaging [177]. A standard transthoracic echocardiogram involves a series of images obtained from four windows: parasternal, apical, subcostal, and suprasternal. The parasternal window includes the long-axis (PLAX) and short-axis (PSAX) views. PLAX provides a longitudinal view of the heart, allowing assessment of the left ventricular outflow tract, aortic valve, aorta, left atrium, and left ventricle. PSAX offers a cross-sectional view, enabling evaluation of the left and right ventricles, mitral valve, and tricuspid valve [178].
a. AdHF prediction: Its role begins even before AdHF is established [179,180]. While patients with non-advanced heart failure carry a significant risk of progression to AdHF (exceeding 9% within two years), echocardiography provides critical predictive insights. Notably, this predictive power lies not in conventional markers like left ventricular ejection fraction (LVEF) or mitral regurgitation – which are often ubiquitous in heart failure populations – but rather in parameters reflecting more advanced myocardial and hemodynamic stress. Severe left atrial dilation (conferring a 35% higher adjusted risk), moderate or severe right ventricular dysfunction (a substantial 66% increased risk), pulmonary hypertension (16% increased risk per 10 mmHg), and elevated left ventricular filling pressures (12% increased risk per 5 E/E′ units) emerge as the most potent echocardiographic harbingers of progression to AdHF. Identifying these high-risk patients allows for intensified monitoring and potentially earlier intervention[177].
b. AdHF diagnosis: The diagnosis of AdHF itself is fundamentally anchored in echocardiographic criteria, reflecting its essential role. Current guidelines [181,182] mandate that at least one specific echocardiographic abnormality must be present: severely reduced LVEF (e.g., ≤30%), right ventricular failure, severe diastolic dysfunction (alongside elevated natriuretic peptides), non-operable severe valvular disease, or a non-operable congenital defect. The clinical necessity of these criteria is underscored by real-world data revealing that up to 20% of patients discharged after a heart failure hospitalization were misclassified as advanced due to the absence of these echocardiographic findings. A severely reduced LVEF, particularly ≤20%, is increasingly recognized as a powerful indicator that may prompt consideration for advanced therapies even without fulfilling other criteria. Beyond LVEF, echocardiography consistently reveals a high prevalence of other abnormalities in AdHF cohorts, including right ventricular dysfunction [167], significantly elevated filling pressures, and significant valvulopathies [176]. However, a definitive AdHF diagnosis also requires the presence of severe symptoms, recurrent hospitalizations, and severe functional impairment.
c. AdHF Clinical management: Once AdHF is established, echocardiography transitions into a vital guide for clinical management, [177] particularly concerning the pervasive challenge of chronic congestion – a major determinant of adverse outcomes. Optimizing diuretic therapy to manage congestion effectively, while avoiding hypovolemia that hinders neurohormonal therapy, requires precise assessment. Echocardiography demonstrably surpasses clinical evaluation alone in accurately detecting and quantifying congestion. Key parameters include the diameter and collapsibility of the inferior vena cava (IVC), which reliably estimate RAP, though interpretation must consider confounding factors like concomitant right ventricular failure or tricuspid valve disease. Promisingly, the Valsalva maneuver applied during jugular vein ultrasound (a ratio >1.6) shows high accuracy in discriminating elevated RAP (>7 mmHg). For left-sided congestion, the ratio of systolic to diastolic pulmonary vein flow (S/D ratio <1) proves particularly accurate in AdHF, often outperforming the E/E′ ratio, which can be unreliable in this advanced population compared to invasive measurements. While extra-cardiac ultrasound (e.g., lung B-lines) has limitations in AdHF, techniques like liver and renal venous Doppler show promise in assessing congestion, warranting further study specifically in this group. Critically, serial echocardiographic assessment of congestion trends should directly inform daily adjustments to diuretic dosing. The potential of echocardiography to actively guide therapy and improve outcomes – by reducing subclinical congestion, lowering natriuretic peptides, and decreasing readmissions – is currently being evaluated in dedicated clinical trials.
4.3. LUNG ULTRASOUND AND SPLANCHNIC CIRCULATION IN HEART FAILURE
Pulmonary congestion, resulting from the accumulation of extravascular lung water (EVLW), is a fundamental pathophysiological process in heart failure (HF) and the most common cause of symptoms leading to hospitalization [159,183]. The pathophysiological interplay between lung ultrasound findings and splanchnic circulation is fundamentally rooted in their common role as interdependent indicators of systemic volume congestion [49]. The sonographic presence of B-lines within the pulmonary parenchyma is not an isolated phenomenon but frequently represents the thoracic manifestation of a generalized fluid excess, a significant proportion of which is sequestered within the capacious splanchnic vascular bed. Consequently, the initiation of decongestive therapy necessitates the mobilization of this splanchnic reservoir as a critical first step towards achieving meaningful reduction in total body water [184]. Therefore, the serial diminution and eventual resolution of B-lines observed on lung ultrasound provides a dual insight: it signifies the clearance of pulmonary interstitial edema while simultaneously serving as an indirect, yet real-time, biomarker for successful efflux of fluid from the splanchnic compartment. This paradigm elevates lung ultrasound from a purely pulmonary diagnostic instrument to a comprehensive hemodynamic monitoring tool. It offers dynamic feedback on the efficacy of therapeutic interventions designed to offload the entire circulatory system, both central and splanchnic (Table 4). Ultimately, this integrative physiological perspective highlights the potential of lung ultrasound to inform and guide personalized decongestive strategies, targeting the dysfunctional splanchnic hemodynamics that are central to the perpetuation of the congestive state in heart failure.
Traditional methods for its detection, namely physical examination and chest radiography, are hampered by low sensitivity, often reported around 50-60% [185]. This diagnostic gap has been bridged by the emergence of lung ultrasound (LUS), a rapid, non-invasive, and reproducible bedside tool. LUS allows for the semi-quantitative assessment of pulmonary congestion through the detection of sonographic artifacts known as B-lines (formerly termed "comet-tail artifacts" or "lung comets") [186,187]. These artifacts are reverberations originating from water-thickened pulmonary interlobular septa [188,189,190,191]. Initially validated in critical care to differentiate causes of acute respiratory failure [192], LUS has evolved into an indispensable tool across the entire spectrum of HF care, providing critical insights for diagnosis, treatment guidance, risk stratification, and prognostication [190,193] (Table 4).
4.3.1. Methodological Principles and Protocols
The clinical application of LUS is built upon a clear understanding of its sonographic fundamentals. A normal lung pattern, termed the "A-profile," is characterized by a hyperechoic, horizontally sliding pleural line and repetitive horizontal artifacts (A-lines) beneath it, indicating normal aerated lung [194,195]. The pathological hallmark of interstitial syndrome is the "B-profile," defined as three or more B-lines in a single intercostal space. These are laser-like, vertical hyperechoic artifacts that arise from the pleural line, extend to the bottom of the screen without fading, and move synchronously with lung sliding [187,194].
LUS can be performed with any standard echocardiographic machine. While low-frequency transducers (phased-array or curvilinear, 1-5 MHz) are most commonly used for their penetration depth, B-lines can be identified with any probe type with minimal impact on the overall clinical interpretation [194,196]. To standardize the examination, several scanning protocols have been developed, varying in the number of chest zones assessed. The comprehensive 28-zone protocol provides a highly detailed assessment and has been extensively used in clinical research, particularly in chronic and discharge settings [197,198]. However, its time-consuming nature limits its practicality in acute scenarios. Comparative studies have demonstrated that the 8-zone protocol, introduced by Volpicelli et al., offers the optimal balance between efficiency and diagnostic accuracy, with no substantial loss of clinically relevant information [199,200]. This protocol examines two anterior and two lateral zones on each hemithorax. For ultra-rapid assessment in the emergency department (ED), focused 4- or 6-zone protocols, such as those derived from the BLUE (Bedside Lung Ultrasound in Emergency) algorithm, are also effectively employed [192,201]. Expert consensus now recommends examining at least 6 zones in HF patients [202].
4.3.2. LUS in the Acute Heart Failure Setting
Diagnostic Application:
In the acute setting, particularly the ED, LUS has proven superior to standard diagnostic workups. A large multicenter study by Pivetta et al. (N=1005) demonstrated that a 6-zone LUS approach had a sensitivity of 97.0% and specificity of 97.4% for diagnosing AHF, significantly outperforming clinical workup alone, chest X-ray, or NT-proBNP [203]. A subsequent randomized controlled trial by the same group confirmed that an 8-zone LUS strategy had higher accuracy (AUC 0.95) than a strategy based on chest X-ray and NT-proBNP (AUC 0.87) [204]. A comparative study by Buessler et al. concluded that among various protocols, the 8-zone method (using ≥1 bilateral positive zone) had the highest diagnostic accuracy (C-index 74.0%) and additive value on top of a clinical score for diagnosing AHF in the ED [200]. This high negative predictive value is particularly valuable for rapidly ruling out a cardiogenic cause of dyspnea.
Monitoring Therapeutic Efficacy:
The dynamic nature of B-lines makes LUS an excellent tool for monitoring response to decongestive therapy. Multiple studies have documented a rapid decrease in B-line counts that correlates with clinical improvement in dyspnea and other signs of congestion [205,206,207,208]. This real-time feedback allows for objective titration of diuretic therapy. The kinetics of B-line clearance appear to be faster than the decline in natriuretic peptide levels, especially in patients with renal impairment, highlighting its utility in guiding acute management where biomarker lag can be a limitation [207,208,209].
Prognostic Stratification:
The prognostic value of LUS is significant at both admission and discharge. A high B-line count upon admission (e.g., ≥45 using the 28-zone protocol) is an independent predictor of short-term adverse outcomes, including death and HF rehospitalization [210,211]. However, the assessment of residual pulmonary congestion at the time of discharge is even more powerfully prognostic. Seminal studies by Gargani et al. and Coiro et al. demonstrated that patients discharged with a B-line count >15 (28-zone) or ≥30 had a dramatically higher risk of readmission or death at 3-6 months [198,212]. This risk persists even when congestion is subclinical (i.e., "dry lung" on auscultation but B-lines ≥5 on LUS) and provides incremental prognostic value on top of traditional risk markers like natriuretic peptides and NYHA class [212,213]. Meta-analyses have consolidated this evidence, confirming that elevated B-line counts at discharge are associated with a ~2.5-fold increased risk of adverse events [214].
4.3.3. LUS in the Chronic Ambulatory Heart Failure Setting
In the outpatient clinic, LUS transitions from a tool for diagnosing overt congestion to one for identifying subclinical pulmonary congestion, a precursor to clinical decompensation. Studies have shown a strong correlation between B-line counts and other established markers of hemodynamic stress, including elevated NT-proBNP levels and high left ventricular filling pressures (E/e' ratio) [215,216].
The prognostic value in chronic HF is well-established for both HFrEF and HFpEF. Platz et al. [217] first demonstrated that in ambulatory patients, a B-line count ≥3 (8-zone protocol) was associated with a four-fold higher risk of death or HF hospitalization at 6 months, providing incremental prognostic value over clinical assessment. This finding has been validated across numerous cohorts [218,219]. In HFpEF specifically, LUS has shown similar accuracy to NT-proBNP in predicting adverse outcomes, with a B-line count >15 signifying a significantly increased risk [220].
This robust prognostic data logically gave rise to interventional trials exploring LUS-guided therapy. The LUS-HF and CLUSTER-HF trials randomized HF patients post-discharge to either standard care or a strategy where diuretic therapy was actively titrated based on serial LUS examinations (a B-line count ≥3 signifying congestion) [219,221]. Both trials demonstrated that the LUS-guided strategy significantly reduced the combined risk of urgent HF visits and hospitalizations at 6 months (HR ~0.55), with a Number Needed to Treat (NNT) of 5-6. This approach facilitates pre-emptive decongestion, preventing the cycle of clinical deterioration that leads to emergency care.
4.3.4. LUS During Stress Echocardiography
The application of LUS during stress echocardiography provides a unique window into dynamic changes in pulmonary pressures and congestion during exertion, which is particularly relevant in HFpEF where resting hemodynamics may be normal. The development or significant increase of B-lines during exercise is a marker of exertional pulmonary congestion [222]. This phenomenon is strongly correlated with invasively measured increases in pulmonary capillary wedge pressure and impairments in right ventricular-pulmonary arterial coupling [223,224].Furthermore, stress-induced B-lines carry profound prognostic implications. In HFrEF, a peak stress B-line count ≥30 (28-zone) is a powerful predictor of mortality [225]. In HFpEF, both peak B-line count and the change from rest (ΔB-lines) are independent predictors of cardiovascular death and HF hospitalization. A ΔB-lines >10 during exercise has been identified as a high-risk marker, adding significant prognostic value to clinical and other echocardiographic parameters [226,227]. This identifies a phenotype of patients with limited hemodynamic reserve who are at greatest risk.
Table 4.
Advantages and limitations of POCUS methods for clinical congestion assessment.
| POCUS application | Clinical relevance | Advantages | Limitations |
|---|---|---|---|
| IVC ultrasound | Provides an estimation of | Relatively easy to perform; able to use | Unreliable in many clinical scenarios |
| RAP | handheld ultrasound devices | (e.g., mechanical ventilation, | |
| pulmonary embolism, PH, cardiac | |||
| tamponade, intra-abdominal | |||
| hypertension, chronic TR, athletes); | |||
| unable to distinguish between | |||
| hypovolemia, euvolemia, and high- | |||
| output cardiac states; collapsibility | |||
| influenced by strength of breath | |||
| Internal jugular vein | Provides an estimation of | Relatively easy to perform; able to use | Operator variability (bed angle, |
| ultrasound | RAP | handheld ultrasound devices; useful | transducer pressure, off-axis views); |
| when IVC is inaccessible or unreliable | protocol variability (e.g., column | ||
| (e.g., cirrhosis, obesity) | height, change with Valsalva, | ||
| respiratory variation); incorrect | |||
| assumptions (e.g., RA depth is 5.0 cm) | |||
| Hepatic vein Doppler | Aids in the assessment of | Same window used for assessing the | Need ECG tracing; unreliable in atrial |
| systemic venous | IVC; supplemental information (e.g., | fibrillation, right ventricular systolic | |
| congestion | right ventricular systolic function, | dysfunction, chronic PH, TR, cirrhosis | |
| constriction and tamponade); exhibits | |||
| dynamic change in response to | |||
| decongestive | |||
| treatment | |||
| Portal vein Doppler | Aids in the assessment of | Don’t need ECG; exhibits dynamic | Operator variability (Doppler sampling |
| systemic venous | change in response to decongestive | location); unreliable in athletes (e.g., | |
| congestion | treatment (pulsatility may | pulsatility without high RAP) and | |
| improve even in chronic TR) | cirrhosis (e.g., no pulsatility with high | ||
| RAP or pulsatility due to arterioportal | |||
| shunts) | |||
| Intrarenal venous | Aids in the assessment of | Simultaneous arterial Doppler allows | Technically challenging (especially when |
| Doppler | systemic venous | identification of cardiac cycle; exhibits | patients unable to hold breath); |
| congestion | dynamic change in response to | operator variability (e.g., misinterpret | |
| decongestive treatment | pulsatility of main renal vessel as renal | ||
| parenchymal vessel); change in | |||
| response to decongestive treatment | |||
| may be delayed in the presence of | |||
| interstitial edema; no available data for | |||
| patients with advanced chronic kidney | |||
| disease | |||
| Femoral Vein Doppler (FVD) | Aids in the assessment of | Relatively easy to perform; feasible in | Operator variability (misaligned Doppler |
| systemic venous | patients unable to hold their breath | tracings, overreliance on absolute | |
| congestion | velocities or percent pulsatility); unable | ||
| to rule out venous congestion; | |||
| individual variability (cyclical variation | |||
| limits use of the stasis index) | |||
| Superior vena cava | Aids in the assessment of | Useful when hepatic or renal vessels are | Need ECG tracing; technically |
| Doppler | systemic venous | inaccessible or unreliable (e.g., | challenging transthoracic windows |
| congestion | cirrhosis, advanced kidney disease) | (especially in obese individuals) | |
| Lung ultrasound | Provides an assessment of | Relatively easy to perform; able to use | Operator variability (transducer angle); |
| extravascular lung water | handheld ultrasound devices; may | technically challenging in obese | |
| (e.g., pulmonary edema, | reduce need for serial chest x-ray to | individuals; protocol variability; B lines | |
| pleural effusions) | monitor response to decongestive | lack specificity for pulmonary edema; | |
| treatment | unreliable in preexisting lung disease | ||
| Mitral E/A ratio and E/e’ | Provides an estimation of | Reproducible; prognostic; useful to | Unreliable in many clinical scenarios |
| ratio | left atrial pressure | distinguish cardiogenic versus | (e.g., atrial fibrillation; mitral annular |
| noncardiogenic pulmonary edema | calcification; mitral valve and | ||
| pericardial disease); operator | |||
| variability | |||
| (Doppler cursor angle; sample volume placement); indeterminate E/e’ values are common | |||
5. Discussion
The 2024 ESC Heart Failure guidelines [33] mark a significant shift by formally recognizing splanchnic Doppler ultrasound as an adjunct tool for assessing systemic congestion. Traditionally, the evaluation of congestion has relied heavily on clinical examination, weight monitoring, natriuretic peptides, and thoracic imaging. While these parameters remain essential, they are often insufficient to fully capture the complex and compartmentalized nature of venous hypertension in HF. In accordance with PRISMA 2020 standards, the present review systematically synthesizes current evidence on the ultrasonographic assessment of splanchnic venous congestion in heart failure, highlighting consistent associations across a diverse body of literature. Conventional and Doppler-based ultrasound techniques emerge as valuable adjunctive tools, complementing standard echocardiography and biomarker evaluation, in line with the 2023 ESC Heart Failure Guidelines [48], which recognize multiparametric ultrasound as an evolving component of congestion assessment. The findings of this review are consistent with those reported by Gamarra et al. (2025) [49], who demonstrated that integrating hepatic and portal Doppler indices improves early detection of subclinical venous overload, and align with insights from “Decoding VExUS” (2024) [228], which emphasized the prognostic significance of Doppler-derived venous waveforms within the VExUS framework. Importantly, this review underscores that splanchnic Doppler ultrasound is associated with hemodynamic congestion and adverse outcomes, though causality cannot be inferred from the available data. Technical limitations remain significant, including restricted acoustic windows, operator dependence, and the influence of patient body habitus on image quality and Doppler accuracy. Future research should focus on prospective validation of these non-invasive indices against invasive right atrial pressure (RAP) measurements and clinically relevant endpoints, such as renal dysfunction or decongestion response, to establish standardized thresholds and strengthen their translational application in heart failure management. By explicitly acknowledging the potential role of splanchnic Doppler ultrasound, the guideline introduces a new dimension: the systematic evaluation of abdominal venous congestion as part of a multiparametric strategy. This acknowledges that venous hypertension in HF often involves a "hidden" splanchnic compartment, which can be evaluated non-invasively through Doppler patterns in abdominal veins. These patterns correlate with elevated right atrial pressure and adverse outcomes, offering insights missed by thoracic imaging alone. While cautiously worded due to technical demands and need for standardization, this endorsement validates the growing evidence for protocols like VExUS. It encourages a more holistic, multi-organ view of congestion, paving the way for its potential use in guiding decongestive therapy and improving risk stratification beyond conventional markers. Our paper represents the first comprehensive review to consolidate the current literature on the use of conventional multiparametric ultrasound for evaluating splanchnic vascular alterations in patients with heart failure. The principal finding of this review is that ultrasonographic assessment of the splanchnic circulation provides a valuable, non-invasive window into the degree of systemic venous congestion, offering critical insights into hemodynamic status, prognosis, and potential response to therapy that extend beyond traditional cardiac evaluation. The splanchnic circulation constitutes the body's largest reservoir for unstressed blood volume (UBV), and its dynamic changes are fundamental to the pathophysiology of heart failure [23,229]. Venous tone regulates the distribution of blood volume between stressed and unstressed compartments, directly influencing pressures in the pulmonary and systemic circulations and contributing to the hemodynamic abnormalities observed in HF [230]. Our review demonstrates that ultrasound can effectively interrogate this vast reservoir. Techniques such as measuring bowel-wall thickness, particularly in the ascending colon, serve as a direct sonographic correlate of intestinal edema and congestion, which is associated with worse outcomes and may reflect gut barrier dysfunction and systemic inflammation [57,58,60,62]. The grayscale and Doppler evaluation of abdominal veins provide a more direct assessment of elevated right atrial pressure (RAP) and venous congestion. Key findings include hepatic vein monophasicity, portal vein pulsatility (with a pulsatility index <0.5 indicating significant congestion), reduced portal flow velocity, and in severe cases, hepatofugal flow [76,79,102]. The evidence strongly suggests a linear relationship between RAP and portal vein pulsatility, making it a quantifiable marker for estimating central pressures[90,102]. Importantly, these Doppler abnormalities are not merely observational; they carry significant prognostic weight. The presence of a moderately or severely pulsatile portal vein pattern at discharge is independently associated with increased all-cause mortality, highlighting the role of persistent splanchnic congestion as a marker of high risk[107,108]. The integration of these Doppler findings into the Venous Excess Ultrasound (VExUS) score represents a major methodological advancement in the bedside assessment of systemic venous congestion[107]. This multiparametric protocol moves beyond flawed, pressure-based metrics like central venous pressure by evaluating the downstream organ-level consequences of elevated RAP. By systematically grading congestion based on IVC diameter and Doppler waveforms in the hepatic, portal, and intrarenal veins, VExUS provides a more holistic and physiologically valid assessment of a patient's volume status [92,111]. A Comprehensive Review of Current Evidence and Nomenclature is performed by Deschamps et al. [102]. Its clinical utility lies in its superior ability to predict end-organ dysfunction, such as acute kidney injury, and its dynamic nature, as waveforms improve with effective decongestive therapy, offering real-time feedback on therapeutic efficacy [231,232]. The concept of an extended VExUS (eVExUS), incorporating vessels like the internal jugular, femoral, and superior vena cava, further enhances its applicability in challenging clinical scenarios [120,125,128]. Furthermore, our review underscores that congestion is a multi-organ phenomenon. The strong interplay between lung ultrasound (LUS) and splanchnic circulation findings exemplifies this. B-lines on LUS are not an isolated pulmonary phenomenon but frequently represent the thoracic manifestation of a generalized fluid excess, a significant portion of which is sequestered in the splanchnic bed[188]. Consequently, the successful resolution of B-lines with decongestive therapy signifies not only the clearance of pulmonary edema but also the successful mobilization of fluid from the splanchnic compartment, positioning LUS as a comprehensive hemodynamic monitoring tool[189,212]. The arterial compartment within the splanchnic system also undergoes significant changes. Elevated resistance indices in the hepatic and splenic arteries (e.g., splenic PI >1.19 in HF patients) reflect increased vascular resistance secondary to congestion and are correlated with right heart filling pressures[103,162]. Similarly, reduced peak systolic velocity in the celiac artery indicates liver hypoperfusion and correlates with a reduced cardiac index, linking splanchnic arterial hypoperfusion to overall cardiac dysfunction[160]. Finally, this review reaffirms that echocardiography remains the cornerstone for the comprehensive evaluation of HF, providing indispensable data on etiology, phenotype, and hemodynamics[39,233]. However, the assessment must extend beyond the left ventricle. A dedicated evaluation of the right heart and estimation of pulmonary hypertension are critical, as right ventricular dysfunction is a primary driver of splanchnic congestion[171,172].The recent incorporation of intra-abdominal Doppler assessment into international guidelines signifies the growing recognition of its importance in the holistic management of HF patients[157].
6. Conclusions
In conclusion, the ultrasonographic evaluation of splanchnic vascularization offers a profound and practical enhancement to the standard management of HF. It allows clinicians to visualize and quantify the systemic consequences of elevated filling pressures directly within the body's largest vascular bed. The techniques reviewed—from basic bowel wall measurement to advanced Doppler protocols like VExUS—provide reliable indicators of congestion severity, predict adverse outcomes, and can guide decongestive therapy more effectively than physical exam or standard imaging alone. Future studies should focus on standardizing protocols and demonstrating that therapy guided by these sonographic markers of splanchnic congestion leads to improved hard outcomes for patients across the spectrum of heart failure.
References
- Chen-Izu, Y.; Banyasz, T.; Shaw, J.A.; Izu, L.T. The Heart is a Smart Pump: Mechanotransduction Mechanisms of the Frank-Starling Law and the Anrep Effect. Annu Rev Physiol 2024. [CrossRef]
- Swenne, C.A.; Shusterman, V. Neurocardiology: Major mechanisms and effects. J Electrocardiol 2024, 88, 153836. [CrossRef]
- Manolis, A.A.; Manolis, T.A.; Manolis, A.S. Neurohumoral Activation in Heart Failure. Int J Mol Sci 2023, 24. [CrossRef]
- Patterson, S.W.; Piper, H.; Starling, E.H. The regulation of the heart beat. The Journal of physiology 1914, 48, 465-513. [CrossRef]
- Nichols, C.G.; Hanck, D.A.; Jewell, B.R. The Anrep effect: an intrinsic myocardial mechanism. Can J Physiol Pharmacol 1988, 66, 924-929. [CrossRef]
- Hornby-Foster, I.; Richards, C.T.; Drane, A.L.; Lodge, F.M.; Stembridge, M.; Lord, R.N.; Davey, H.; Yousef, Z.; Pugh, C.J.A. Resistance- and endurance-trained young men display comparable carotid artery strain parameters that are superior to untrained men. Eur J Appl Physiol 2024. [CrossRef]
- Herring, N.; PATERSON, D. Haemodynamics: flow, pressure and resistance. In Levick's Introduction to Cardiovascular Physiology, Herring, N., PATERSON, D., Eds.; CRC Press: Boca Raton, 2018.
- O'Rourke, M.F.; Hashimoto, J. Mechanical factors in arterial aging: a clinical perspective. J Am Coll Cardiol 2007, 50, 1-13. [CrossRef]
- Laurent, S.; Cockcroft, J.; Van Bortel, L.; Boutouyrie, P.; Giannattasio, C.; Hayoz, D.; Pannier, B.; Vlachopoulos, C.; Wilkinson, I.; Struijker-Boudier, H.; et al. Expert consensus document on arterial stiffness: methodological issues and clinical applications. Eur Heart J 2006, 27, 2588-2605. [CrossRef]
- Vanhoutte, P.M.; Shimokawa, H.; Tang, E.H.; Feletou, M. Endothelial dysfunction and vascular disease. Acta Physiol (Oxf) 2009, 196, 193-222. [CrossRef]
- Schiffrin, E.L. Vascular remodeling in hypertension: mechanisms and treatment. Hypertension 2012, 59, 367-374. [CrossRef]
- Shirwany, N.A.; Zou, M.H. Arterial stiffness: a brief review. Acta Pharmacol Sin 2010, 31, 1267-1276. [CrossRef]
- Mitchell, G.F. Arterial stiffness and hypertension. Hypertension 2014, 64, 13-18. [CrossRef]
- Guyton, A.C.; Polizo, D.; Armstrong, G.G. Mean circulatory filling pressure measured immediately after cessation of heart pumping. Am J Physiol 1954, 179, 261-267. [CrossRef]
- Versprille, A.; Jansen, J.R. Mean systemic filling pressure as a characteristic pressure for venous return. Pflugers Arch 1985, 405, 226-233. [CrossRef]
- Guyton, A.C.; Lindsey, A.W.; Abernathy, B.; Richardson, T. Venous return at various right atrial pressures and the normal venous return curve. Am J Physiol 1957, 189, 609-615. [CrossRef]
- Aya, H.D.; Cecconi, M. Mean Systemic Filling Pressure Is an Old Concept but a New Tool for Fluid Management. In Perioperative Fluid Management; 2016; pp. 171-188.
- Spiegel, R. Stressed vs. unstressed volume and its relevance to critical care practitioners. Clin Exp Emerg Med 2016, 3, 52-54. [CrossRef]
- Rosenblum, J.D.; Boyle, C.M.; Schwartz, L.B. The mesenteric circulation. Anatomy and physiology. Surg Clin North Am 1997, 77, 289-306. [CrossRef]
- NETTER, F.H. Overview of lower digestive tract. In Netter Collection of Medical Illustrations: Digestive System, Part II – Lower Digestive Tract; Elsevier, Inc: 2025; Volume II, pp. 1-30.
- Yaku, H.; Fudim, M.; Shah, S.J. Role of splanchnic circulation in the pathogenesis of heart failure: State-of-the-art review. J Cardiol 2024, 83, 330-337. [CrossRef]
- Rutlen, D.L.; Supple, E.W.; Powell, W.J., Jr. The role of the liver in the adrenergic regulation of blood flow from the splanchnic to the central circulation. The Yale journal of biology and medicine 1979, 52, 99-106.
- Parks, D.A.; Jacobson, E.D. Physiology of the splanchnic circulation. Arch Intern Med 1985, 145, 1278-1281.
- Mocan, D.; Lala, R.I.; Puschita, M.; Pilat, L.; Darabantiu, D.A.; Pop Moldovan, A. 2024. [CrossRef]
- Miller, W.L. Congestion/decongestion in heart failure: what does it mean, how do we assess it, and what are we missing?-is there utility in measuring volume? Heart Fail Rev 2024, 29, 1187-1199. [CrossRef]
- Rubio-Gracia, J.; Demissei, B.G.; Ter Maaten, J.M.; Cleland, J.G.; O'Connor, C.M.; Metra, M.; Ponikowski, P.; Teerlink, J.R.; Cotter, G.; Davison, B.A.; et al. Prevalence, predictors and clinical outcome of residual congestion in acute decompensated heart failure. International journal of cardiology 2018, 258, 185-191. [CrossRef]
- Lala, A.; McNulty, S.E.; Mentz, R.J.; Dunlay, S.M.; Vader, J.M.; AbouEzzeddine, O.F.; DeVore, A.D.; Khazanie, P.; Redfield, M.M.; Goldsmith, S.R.; et al. Relief and Recurrence of Congestion During and After Hospitalization for Acute Heart Failure: Insights From Diuretic Optimization Strategy Evaluation in Acute Decompensated Heart Failure (DOSE-AHF) and Cardiorenal Rescue Study in Acute Decompensated Heart Failure (CARESS-HF). Circ Heart Fail 2015, 8, 741-748. [CrossRef]
- Drazner, M.H.; Hellkamp, A.S.; Leier, C.V.; Shah, M.R.; Miller, L.W.; Russell, S.D.; Young, J.B.; Califf, R.M.; Nohria, A. Value of clinician assessment of hemodynamics in advanced heart failure: the ESCAPE trial. Circ Heart Fail 2008, 1, 170-177. [CrossRef]
- Narang, N.; Chung, B.; Nguyen, A.; Kalathiya, R.J.; Laffin, L.J.; Holzhauser, L.; Ebong, I.A.; Besser, S.A.; Imamura, T.; Smith, B.A.; et al. Discordance Between Clinical Assessment and Invasive Hemodynamics in Patients With Advanced Heart Failure. J Card Fail 2020, 26, 128-135. [CrossRef]
- Benjamin, E.J.; Blaha, M.J.; Chiuve, S.E.; Cushman, M.; Das, S.R.; Deo, R.; de Ferranti, S.D.; Floyd, J.; Fornage, M.; Gillespie, C.; et al. Heart Disease and Stroke Statistics-2017 Update: A Report From the American Heart Association. Circulation 2017, 135, e146-e603. [CrossRef]
- Ostrominski, J.W.; DeFilippis, E.M.; Bansal, K.; Riello, R.J., 3rd; Bozkurt, B.; Heidenreich, P.A.; Vaduganathan, M. Contemporary American and European Guidelines for Heart Failure Management: JACC: Heart Failure Guideline Comparison. JACC Heart Fail 2024, 12, 810-825. [CrossRef]
- Bozkurt, B.; Coats, A.J.S.; Tsutsui, H.; Abdelhamid, C.M.; Adamopoulos, S.; Albert, N.; Anker, S.D.; Atherton, J.; Bohm, M.; Butler, J.; et al. Universal definition and classification of heart failure: a report of the Heart Failure Society of America, Heart Failure Association of the European Society of Cardiology, Japanese Heart Failure Society and Writing Committee of the Universal Definition of Heart Failure: Endorsed by the Canadian Heart Failure Society, Heart Failure Association of India, Cardiac Society of Australia and New Zealand, and Chinese Heart Failure Association. European journal of heart failure 2021, 23, 352-380. [CrossRef]
- Authors/Task Force, M.; McDonagh, T.A.; Metra, M.; Adamo, M.; Gardner, R.S.; Baumbach, A.; Bohm, M.; Burri, H.; Butler, J.; Celutkiene, J.; et al. 2023 Focused Update of the 2021 ESC Guidelines for the diagnosis and treatment of acute and chronic heart failure: Developed by the task force for the diagnosis and treatment of acute and chronic heart failure of the European Society of Cardiology (ESC) With the special contribution of the Heart Failure Association (HFA) of the ESC. European journal of heart failure 2024, 26, 5-17. [CrossRef]
- Fudim, M.; Neuzil, P.; Malek, F.; Engelman, Z.J.; Reddy, V.Y. Greater Splanchnic Nerve Stimulation in Heart Failure With Preserved Ejection Fraction. J Am Coll Cardiol 2021, 77, 1952-1953. [CrossRef]
- Galie, N.; Humbert, M.; Vachiery, J.L.; Gibbs, S.; Lang, I.; Torbicki, A.; Simonneau, G.; Peacock, A.; Vonk Noordegraaf, A.; Beghetti, M.; et al. 2015 ESC/ERS Guidelines for the diagnosis and treatment of pulmonary hypertension: The Joint Task Force for the Diagnosis and Treatment of Pulmonary Hypertension of the European Society of Cardiology (ESC) and the European Respiratory Society (ERS): Endorsed by: Association for European Paediatric and Congenital Cardiology (AEPC), International Society for Heart and Lung Transplantation (ISHLT). Eur Heart J 2016, 37, 67-119. [CrossRef]
- Zhang, J.; Xu, M.; Chen, T.; Zhou, Y. Correlation Between Liver Stiffness and Diastolic Function, Left Ventricular Hypertrophy, and Right Cardiac Function in Patients With Ejection Fraction Preserved Heart Failure. Front Cardiovasc Med 2021, 8, 748173. [CrossRef]
- Samsky, M.D.; Patel, C.B.; DeWald, T.A.; Smith, A.D.; Felker, G.M.; Rogers, J.G.; Hernandez, A.F. Cardiohepatic interactions in heart failure: an overview and clinical implications. J Am Coll Cardiol 2013, 61, 2397-2405. [CrossRef]
- Pieske, B.; Tschope, C.; de Boer, R.A.; Fraser, A.G.; Anker, S.D.; Donal, E.; Edelmann, F.; Fu, M.; Guazzi, M.; Lam, C.S.P.; et al. How to diagnose heart failure with preserved ejection fraction: the HFA-PEFF diagnostic algorithm: a consensus recommendation from the Heart Failure Association (HFA) of the European Society of Cardiology (ESC). European journal of heart failure 2020, 22, 391-412. [CrossRef]
- Heidenreich, P.A.; Bozkurt, B.; Aguilar, D.; Allen, L.A.; Byun, J.J.; Colvin, M.M.; Deswal, A.; Drazner, M.H.; Dunlay, S.M.; Evers, L.R.; et al. 2022 AHA/ACC/HFSA Guideline for the Management of Heart Failure: A Report of the American College of Cardiology/American Heart Association Joint Committee on Clinical Practice Guidelines. J Am Coll Cardiol 2022, 79, e263-e421. [CrossRef]
- Anker, S.D.; Butler, J.; Filippatos, G.; Ferreira, J.P.; Bocchi, E.; Bohm, M.; Brunner-La Rocca, H.P.; Choi, D.J.; Chopra, V.; Chuquiure-Valenzuela, E.; et al. Empagliflozin in Heart Failure with a Preserved Ejection Fraction. N Engl J Med 2021, 385, 1451-1461. [CrossRef]
- Solomon, S.D.; McMurray, J.J.V.; Claggett, B.; de Boer, R.A.; DeMets, D.; Hernandez, A.F.; Inzucchi, S.E.; Kosiborod, M.N.; Lam, C.S.P.; Martinez, F.; et al. Dapagliflozin in Heart Failure with Mildly Reduced or Preserved Ejection Fraction. N Engl J Med 2022, 387, 1089-1098. [CrossRef]
- Schwinger, R.H.G. Pathophysiology of heart failure. Cardiovasc Diagn Ther 2021, 11, 263-276. [CrossRef]
- Tanai, E.; Frantz, S. Pathophysiology of Heart Failure. Compr Physiol 2015, 6, 187-214. [CrossRef]
- Yancy, C.W.; Jessup, M.; Bozkurt, B.; Butler, J.; Casey, D.E., Jr.; Drazner, M.H.; Fonarow, G.C.; Geraci, S.A.; Horwich, T.; Januzzi, J.L.; et al. 2013 ACCF/AHA guideline for the management of heart failure: executive summary: a report of the American College of Cardiology Foundation/American Heart Association Task Force on practice guidelines. Circulation 2013, 128, 1810-1852. [CrossRef]
- Greene, S.J.; Bauersachs, J.; Brugts, J.J.; Ezekowitz, J.A.; Lam, C.S.P.; Lund, L.H.; Ponikowski, P.; Voors, A.A.; Zannad, F.; Zieroth, S.; et al. Worsening Heart Failure: Nomenclature, Epidemiology, and Future Directions: JACC Review Topic of the Week. J Am Coll Cardiol 2023, 81, 413-424. [CrossRef]
- Lozano-Jimenez, S.; Garcia Sebastian, C.; Vela Martin, P.; Garcia Magallon, B.; Martin Centellas, A.; de Castro, D.; Mitroi, C.; Del Prado Diaz, S.; Hernandez-Perez, F.J.; Jimenez-Blanco Bravo, M.; et al. Prevalence and prognostic impact of subclinical venous congestion in patients hospitalized for acute heart failure. Eur Heart J Acute Cardiovasc Care 2025. [CrossRef]
- Saadi, M.P.; Silvano, G.P.; Machado, G.P.; Almeida, R.F.; Scolari, F.L.; Biolo, A.; Aboumarie, H.S.; Telo, G.H.; Donelli da Silveira, A. Modified VExUS: A Dynamic Tool to Predict Mortality in Acute Decompensated Heart Failure. J Am Soc Echocardiogr 2025. [CrossRef]
- McDonagh, T.A.; Metra, M.; Adamo, M.; Gardner, R.S.; Baumbach, A.; Bohm, M.; Burri, H.; Butler, J.; Celutkiene, J.; Chioncel, O.; et al. 2023 Focused Update of the 2021 ESC Guidelines for the diagnosis and treatment of acute and chronic heart failure. Eur Heart J 2023, 44, 3627-3639. [CrossRef]
- Gamarra, A.; Salamanca, J.; Diez-Villanueva, P.; Cuenca, S.; Vazquez, J.; Aguilar, R.J.; Diego, G.; Rodriguez, A.P.; Alfonso, F. Ultrasound imaging of congestion in heart failure: a narrative review. Cardiovasc Diagn Ther 2025, 15, 233-250. [CrossRef]
- Page, M.J.; McKenzie, J.E.; Bossuyt, P.M.; Boutron, I.; Hoffmann, T.C.; Mulrow, C.D.; Shamseer, L.; Tetzlaff, J.M.; Akl, E.A.; Brennan, S.E.; et al. The PRISMA 2020 statement: an updated guideline for reporting systematic reviews. BMJ 2021, 372, n71. [CrossRef]
- Wells, A.U.; Shea, B.; O'Connell, D.; Peterson, J.; Welch, V.A.; Losos, M.; Tugwell, P. The Newcastle-Ottawa Scale (NOS) for assessing the quality of nonrandomised studies in meta-analyses. Available online: https://www.ohri.ca/programs/clinical_epidemiology/oxford.asp (accessed on.
- Sterne, J.A.C.; Savovic, J.; Page, M.J.; Elbers, R.G.; Blencowe, N.S.; Boutron, I.; Cates, C.J.; Cheng, H.Y.; Corbett, M.S.; Eldridge, S.M.; et al. RoB 2: a revised tool for assessing risk of bias in randomised trials. BMJ 2019, 366, l4898. [CrossRef]
- Fede, G.; Privitera, G.; Tomaselli, T.; Spadaro, L.; Purrello, F. Cardiovascular dysfunction in patients with liver cirrhosis. Ann Gastroenterol 2015, 28, 31-40.
- Mukhtar, A.; Dabbous, H. Modulation of splanchnic circulation: Role in perioperative management of liver transplant patients. World J Gastroenterol 2016, 22, 1582-1592. [CrossRef]
- Valentova, M.; von Haehling, S.; Bauditz, J.; Doehner, W.; Ebner, N.; Bekfani, T.; Elsner, S.; Sliziuk, V.; Scherbakov, N.; Murin, J.; et al. Intestinal congestion and right ventricular dysfunction: a link with appetite loss, inflammation, and cachexia in chronic heart failure. Eur Heart J 2016, 37, 1684-1691. [CrossRef]
- Sandek, A.; Swidsinski, A.; Schroedl, W.; Watson, A.; Valentova, M.; Herrmann, R.; Scherbakov, N.; Cramer, L.; Rauchhaus, M.; Grosse-Herrenthey, A.; et al. Intestinal blood flow in patients with chronic heart failure: a link with bacterial growth, gastrointestinal symptoms, and cachexia. J Am Coll Cardiol 2014, 64, 1092-1102. [CrossRef]
- Pellicori, P.; Zhang, J.; Cuthbert, J.; Urbinati, A.; Shah, P.; Kazmi, S.; Clark, A.L.; Cleland, J.G.F. High-sensitivity C-reactive protein in chronic heart failure: patient characteristics, phenotypes, and mode of death. Cardiovasc Res 2020, 116, 91-100. [CrossRef]
- Ikeda, Y.; Ishii, S.; Fujita, T.; Iida, Y.; Kaida, T.; Nabeta, T.; Maekawa, E.; Yanagisawa, T.; Koitabashi, T.; Takeuchi, I.; et al. Prognostic impact of intestinal wall thickening in hospitalized patients with heart failure. International journal of cardiology 2017, 230, 120-126. [CrossRef]
- Ikeda, Y.; Ishii, S.; Maemura, K.; Oki, T.; Yazaki, M.; Fujita, T.; Nabeta, T.; Maekawa, E.; Koitabashi, T.; Ako, J. Association between intestinal oedema and oral loop diuretic resistance in hospitalized patients with acute heart failure. ESC Heart Fail 2021, 8, 4067-4076. [CrossRef]
- Hao, R.; Zheng, Y.; Zhao, Q.; Chen, J.; Fan, R.; Chen, P.; Yin, N.; Qin, H. Evaluation value of ultrasound on gastrointestinal function in patients with acute heart failure. Front Cardiovasc Med 2024, 11, 1475920. [CrossRef]
- Ciozda, W.; Kedan, I.; Kehl, D.W.; Zimmer, R.; Khandwalla, R.; Kimchi, A. The efficacy of sonographic measurement of inferior vena cava diameter as an estimate of central venous pressure. Cardiovasc Ultrasound 2016, 14, 33. [CrossRef]
- Zhao, J.; Wang, G. Inferior Vena Cava Collapsibility Index is a Valuable and Non-Invasive Index for Elevated General Heart End-Diastolic Volume Index Estimation in Septic Shock Patients. Med Sci Monit 2016, 22, 3843-3848. [CrossRef]
- Aspromonte, N.; Fumarulo, I.; Petrucci, L.; Biferali, B.; Liguori, A.; Gasbarrini, A.; Massetti, M.; Miele, L. The Liver in Heart Failure: From Biomarkers to Clinical Risk. Int J Mol Sci 2023, 24. [CrossRef]
- Wells, M.L.; Fenstad, E.R.; Poterucha, J.T.; Hough, D.M.; Young, P.M.; Araoz, P.A.; Ehman, R.L.; Venkatesh, S.K. Imaging Findings of Congestive Hepatopathy. Radiographics 2016, 36, 1024-1037. [CrossRef]
- Wells, M.L.; Venkatesh, S.K. Congestive hepatopathy. Abdom Radiol (NY) 2018, 43, 2037-2051. [CrossRef]
- Maruyama, H.; Yokosuka, O. Ultrasonography for Noninvasive Assessment of Portal Hypertension. Gut Liver 2017, 11, 464-473. [CrossRef]
- Gerstenmaier, J.F.; Gibson, R.N. Ultrasound in chronic liver disease. Insights into imaging 2014, 5, 441-455. [CrossRef]
- Weinreb, J.; Kumari, S.; Phillips, G.; Pochaczevsky, R. Portal vein measurements by real-time sonography. AJR Am J Roentgenol 1982, 139, 497-499. [CrossRef]
- Procopet, B.; Berzigotti, A. Diagnosis of cirrhosis and portal hypertension: imaging, non-invasive markers of fibrosis and liver biopsy. Gastroenterol Rep (Oxf) 2017, 5, 79-89. [CrossRef]
- McNaughton, D.A.; Abu-Yousef, M.M. Doppler US of the liver made simple. Radiographics 2011, 31, 161-188. [CrossRef]
- Allen, L.A.; Felker, G.M.; Pocock, S.; McMurray, J.J.; Pfeffer, M.A.; Swedberg, K.; Wang, D.; Yusuf, S.; Michelson, E.L.; Granger, C.B.; et al. Liver function abnormalities and outcome in patients with chronic heart failure: data from the Candesartan in Heart Failure: Assessment of Reduction in Mortality and Morbidity (CHARM) program. European journal of heart failure 2009, 11, 170-177. [CrossRef]
- Brankovic, M.; Lee, P.; Pyrsopoulos, N.; Klapholz, M. Cardiac Syndromes in Liver Disease: A Clinical Conundrum. J Clin Transl Hepatol 2023, 11, 975-986. [CrossRef]
- Harjola, V.P.; Mullens, W.; Banaszewski, M.; Bauersachs, J.; Brunner-La Rocca, H.P.; Chioncel, O.; Collins, S.P.; Doehner, W.; Filippatos, G.S.; Flammer, A.J.; et al. Organ dysfunction, injury and failure in acute heart failure: from pathophysiology to diagnosis and management. A review on behalf of the Acute Heart Failure Committee of the Heart Failure Association (HFA) of the European Society of Cardiology (ESC). European journal of heart failure 2017, 19, 821-836. [CrossRef]
- Wang, J.; Wang, K.; Feng, G.; Tian, X. Association Between the Albumin-Bilirubin (ALBI) Score and All-cause Mortality Risk in Intensive Care Unit Patients with Heart Failure. Glob Heart 2024, 19, 97. [CrossRef]
- Singal, A.K.; Ahmad, M.; Soloway, R.D. Duplex Doppler ultrasound examination of the portal venous system: an emerging novel technique for the estimation of portal vein pressure. Dig Dis Sci 2010, 55, 1230-1240. [CrossRef]
- Tessler, F.N.; Gehring, B.J.; Gomes, A.S.; Perrella, R.R.; Ragavendra, N.; Busuttil, R.W.; Grant, E.G. Diagnosis of portal vein thrombosis: value of color Doppler imaging. AJR Am J Roentgenol 1991, 157, 293-296. [CrossRef]
- Hosoki, T.; Arisawa, J.; Marukawa, T.; Tokunaga, K.; Kuroda, C.; Kozuka, T.; Nakano, S. Portal blood flow in congestive heart failure: pulsed duplex sonographic findings. Radiology 1990, 174, 733-736. [CrossRef]
- Nelson, R.C.; Lovett, K.E.; Chezmar, J.L.; Moyers, J.H.; Torres, W.E.; Murphy, F.B.; Bernardino, M.E. Comparison of pulsed Doppler sonography and angiography in patients with portal hypertension. AJR Am J Roentgenol 1987, 149, 77-81. [CrossRef]
- Gaiani, S.; Bolondi, L.; Li Bassi, S.; Santi, V.; Zironi, G.; Barbara, L. Effect of meal on portal hemodynamics in healthy humans and in patients with chronic liver disease. Hepatology 1989, 9, 815-819.
- Subramanyam, B.R.; Balthazar, E.J.; Madamba, M.R.; Raghavendra, B.N.; Horii, S.C.; Lefleur, R.S. Sonography of portosystemic venous collaterals in portal hypertension. Radiology 1983, 146, 161-166. [CrossRef]
- Gibson, R.N.; Gibson, P.R.; Donlan, J.D.; Clunie, D.A. Identification of a patent paraumbilical vein by using Doppler sonography: importance in the diagnosis of portal hypertension. AJR Am J Roentgenol 1989, 153, 513-516. [CrossRef]
- Iranpour, P.; Lall, C.; Houshyar, R.; Helmy, M.; Yang, A.; Choi, J.I.; Ward, G.; Goodwin, S.C. Altered Doppler flow patterns in cirrhosis patients: an overview. Ultrasonography 2016, 35, 3-12. [CrossRef]
- Afif, A.M.; Chang, J.P.; Wang, Y.Y.; Lau, S.D.; Deng, F.; Goh, S.Y.; Pwint, M.K.; Ooi, C.C.; Venkatanarasimha, N.; Lo, R.H. A sonographic Doppler study of the hepatic vein, portal vein and hepatic artery in liver cirrhosis: Correlation of hepatic hemodynamics with clinical Child Pugh score in Singapore. Ultrasound 2017, 25, 213-221. [CrossRef]
- Baikpour, M.; Ozturk, A.; Dhyani, M.; Mercaldo, N.D.; Pierce, T.T.; Grajo, J.R.; Samir, A.E. Portal Venous Pulsatility Index: A Novel Biomarker for Diagnosis of High-Risk Nonalcoholic Fatty Liver Disease. AJR Am J Roentgenol 2020, 214, 786-791. [CrossRef]
- Zhang, L.; Yin, J.; Duan, Y.; Yang, Y.; Yuan, L.; Cao, T. Assessment of intrahepatic blood flow by Doppler ultrasonography: relationship between the hepatic vein, portal vein, hepatic artery and portal pressure measured intraoperatively in patients with portal hypertension. BMC Gastroenterol 2011, 11, 84. [CrossRef]
- Abu-Yousef, M.M.; Milam, S.G.; Farner, R.M. Pulsatile portal vein flow: a sign of tricuspid regurgitation on duplex Doppler sonography. AJR Am J Roentgenol 1990, 155, 785-788. [CrossRef]
- Bhardwaj, V.; Vikneswaran, G.; Rola, P.; Raju, S.; Bhat, R.S.; Jayakumar, A.; Alva, A. Combination of Inferior Vena Cava Diameter, Hepatic Venous Flow, and Portal Vein Pulsatility Index: Venous Excess Ultrasound Score (VEXUS Score) in Predicting Acute Kidney Injury in Patients with Cardiorenal Syndrome: A Prospective Cohort Study. Indian J Crit Care Med 2020, 24, 783-789. [CrossRef]
- Prowle, J.R.; Bellomo, R. Fluid administration and the kidney. Curr Opin Crit Care 2013, 19, 308-314. [CrossRef]
- Gallix, B.P.; Taourel, P.; Dauzat, M.; Bruel, J.M.; Lafortune, M. Flow pulsatility in the portal venous system: a study of Doppler sonography in healthy adults. AJR Am J Roentgenol 1997, 169, 141-144. [CrossRef]
- Argaiz, E.R. VExUS Nexus: Bedside Assessment of Venous Congestion. Adv Chronic Kidney Dis 2021, 28, 252-261. [CrossRef]
- Caselitz, M.; Bahr, M.J.; Bleck, J.S.; Chavan, A.; Manns, M.P.; Wagner, S.; Gebel, M. Sonographic criteria for the diagnosis of hepatic involvement in hereditary hemorrhagic telangiectasia (HHT). Hepatology 2003, 37, 1139-1146. [CrossRef]
- Abou-Arab, O.; Beyls, C.; Moussa, M.D.; Huette, P.; Beaudelot, E.; Guilbart, M.; De Broca, B.; Yzet, T.; Dupont, H.; Bouzerar, R.; et al. Portal Vein Pulsatility Index as a Potential Risk of Venous Congestion Assessed by Magnetic Resonance Imaging: A Prospective Study on Healthy Volunteers. Front Physiol 2022, 13, 811286. [CrossRef]
- Gorg, C.; Seifart, U.; Zugmaier, G. Color Doppler sonographic signs of respiration-dependent hepatofugal portal flow. J Clin Ultrasound 2004, 32, 62-68. [CrossRef]
- Hidajat, N.; Stobbe, H.; Griesshaber, V.; Felix, R.; Schroder, R.J. Imaging and radiological interventions of portal vein thrombosis. Acta Radiol 2005, 46, 336-343. [CrossRef]
- Rossi, S.; Ghittoni, G.; Ravetta, V.; Torello Viera, F.; Rosa, L.; Serassi, M.; Scabini, M.; Vercelli, A.; Tinelli, C.; Dal Bello, B.; et al. Contrast-enhanced ultrasonography and spiral computed tomography in the detection and characterization of portal vein thrombosis complicating hepatocellular carcinoma. Eur Radiol 2008, 18, 1749-1756. [CrossRef]
- Altinkaya, N.; Koc, Z.; Ulusan, S.; Demir, S.; Gurel, K. Effects of respiratory manoeuvres on hepatic vein Doppler waveform and flow velocities in a healthy population. Eur J Radiol 2011, 79, 60-63. [CrossRef]
- Piscaglia, F.; Donati, G.; Serra, C.; Muratori, R.; Solmi, L.; Gaiani, S.; Gramantieri, L.; Bolondi, L. Value of splanchnic Doppler ultrasound in the diagnosis of portal hypertension. Ultrasound Med Biol. 2001, 27, 893-899.
- Morales, A.; Hirsch, M.; Schneider, D.; Gonzalez, D. Congestive hepatopathy: the role of the radiologist in the diagnosis. Diagn Interv Radiol 2020, 26, 541-545. [CrossRef]
- Rengo, C.; Brevetti, G.; Sorrentino, G.; D'Amato, T.; Imparato, M.; Vitale, D.F.; Acanfora, D.; Rengo, F. Portal vein pulsatility ratio provides a measure of right heart function in chronic heart failure. Ultrasound Med Biol 1998, 24, 327-332. [CrossRef]
- Goncalvesova, E.; Lesny, P.; Luknar, M.; Solik, P.; Varga, I. Changes of portal flow in heart failure patients with liver congestion. Bratislavske lekarske listy 2010, 111, 635-639.
- Catalano, D.; Caruso, G.; DiFazzio, S.; Carpinteri, G.; Scalisi, N.; Trovato, G.M. Portal vein pulsatility ratio and heart failure. J Clin Ultrasound 1998, 26, 27-31. [CrossRef]
- Deschamps, J.; Denault, A.; Galarza, L.; Rola, P.; Ledoux-Hutchinson, L.; Huard, K.; Gebhard, C.E.; Calderone, A.; Canty, D.; Beaubien-Souligny, W. Venous Doppler to Assess Congestion: A Comprehensive Review of Current Evidence and Nomenclature. Ultrasound Med Biol 2023, 49, 3-17. [CrossRef]
- Husain-Syed, F.; Birk, H.W.; Ronco, C.; Schormann, T.; Tello, K.; Richter, M.J.; Wilhelm, J.; Sommer, N.; Steyerberg, E.; Bauer, P.; et al. Doppler-Derived Renal Venous Stasis Index in the Prognosis of Right Heart Failure. J Am Heart Assoc 2019, 8, e013584. [CrossRef]
- Moriyasu, F.; Nishida, O.; Ban, N.; Nakamura, T.; Sakai, M.; Miyake, T.; Uchino, H. "Congestion index" of the portal vein. AJR Am J Roentgenol 1986, 146, 735-739. [CrossRef]
- Ikeda, Y.; Ishii, S.; Yazaki, M.; Fujita, T.; Iida, Y.; Kaida, T.; Nabeta, T.; Nakatani, E.; Maekawa, E.; Yanagisawa, T.; et al. Portal congestion and intestinal edema in hospitalized patients with heart failure. Heart and vessels 2018, 33, 740-751. [CrossRef]
- Bouabdallaoui, N.; Beaubien-Souligny, W.; Oussaid, E.; Henri, C.; Racine, N.; Denault, A.Y.; Rouleau, J.L. Assessing Splanchnic Compartment Using Portal Venous Doppler and Impact of Adding It to the EVEREST Score for Risk Assessment in Heart Failure. CJC Open 2020, 2, 311-320. [CrossRef]
- Galindo, P.; Gasca, C.; Argaiz, E.R.; Koratala, A. Point of care venous Doppler ultrasound: Exploring the missing piece of bedside hemodynamic assessment. World J Crit Care Med 2021, 10, 310-322. [CrossRef]
- Rola, P.; Miralles-Aguiar, F.; Argaiz, E.; Beaubien-Souligny, W.; Haycock, K.; Karimov, T.; Dinh, V.A.; Spiegel, R. Clinical applications of the venous excess ultrasound (VExUS) score: conceptual review and case series. Ultrasound J 2021, 13, 32. [CrossRef]
- Turk, M.; Koratala, A.; Robertson, T.; Kalagara, H.K.P.; Bronshteyn, Y.S. Demystifying Venous Excess Ultrasound (VExUS): Image Acquisition and Interpretation. Journal of visualized experiments : JoVE 2025. [CrossRef]
- Istrail, L.; Kiernan, J.; Stepanova, M. A Novel Method for Estimating Right Atrial Pressure With Point-of-Care Ultrasound. J Am Soc Echocardiogr 2023, 36, 278-283. [CrossRef]
- Beaubien-Souligny, W.; Benkreira, A.; Robillard, P.; Bouabdallaoui, N.; Chasse, M.; Desjardins, G.; Lamarche, Y.; White, M.; Bouchard, J.; Denault, A. Alterations in Portal Vein Flow and Intrarenal Venous Flow Are Associated With Acute Kidney Injury After Cardiac Surgery: A Prospective Observational Cohort Study. J Am Heart Assoc 2018, 7, e009961. [CrossRef]
- Iida, N.; Seo, Y.; Sai, S.; Machino-Ohtsuka, T.; Yamamoto, M.; Ishizu, T.; Kawakami, Y.; Aonuma, K. Clinical Implications of Intrarenal Hemodynamic Evaluation by Doppler Ultrasonography in Heart Failure. JACC Heart Fail 2016, 4, 674-682. [CrossRef]
- Beaubien-Souligny, W.; Rola, P.; Haycock, K.; Bouchard, J.; Lamarche, Y.; Spiegel, R.; Denault, A.Y. Quantifying systemic congestion with Point-Of-Care ultrasound: development of the venous excess ultrasound grading system. Ultrasound J 2020, 12, 16. [CrossRef]
- Goldhammer, E.; Mesnick, N.; Abinader, E.G.; Sagiv, M. Dilated inferior vena cava: a common echocardiographic finding in highly trained elite athletes. J Am Soc Echocardiogr 1999, 12, 988-993. [CrossRef]
- Vivier, E.; Metton, O.; Piriou, V.; Lhuillier, F.; Cottet-Emard, J.M.; Branche, P.; Duperret, S.; Viale, J.P. Effects of increased intra-abdominal pressure on central circulation. Br J Anaesth 2006, 96, 701-707. [CrossRef]
- Crespo-Aznarez, S.; Campos-Saenz de Santamaria, A.; Sanchez-Marteles, M.; Garces-Horna, V.; Josa-Laorden, C.; Gimenez-Lopez, I.; Perez-Calvo, J.I.; Rubio-Gracia, J. The Association Between Intra-abdominal Pressure and Diuretic Response in Heart Failure. Curr Heart Fail Rep 2023, 20, 390-400. [CrossRef]
- Rora Bertovic, M.; Trkulja, V.; Curcic Karabaic, E.; Sundalic, S.; Bielen, L.; Ivicic, T.; Radonic, R. Influence of Increased Intra-Abdominal Pressure on the Validity of Ultrasound-Derived Inferior Vena Cava Measurements for Estimating Central Venous Pressure. J Clin Med 2025, 14. [CrossRef]
- Davison, R.; Cannon, R. Estimation of central venous pressure by examination of jugular veins. Am Heart J 1974, 87, 279-282. [CrossRef]
- Chayapinun, V.; Koratala, A.; Assavapokee, T. Seeing beneath the surface: Harnessing point-of-care ultrasound for internal jugular vein evaluation. World J Cardiol 2024, 16, 73-79. [CrossRef]
- Leal-Villarreal, M.A.J.; Aguirre-Villarreal, D.; Vidal-Mayo, J.J.; Argaiz, E.R.; Garcia-Juarez, I. Correlation of Internal Jugular Vein Collapsibility With Central Venous Pressure in Patients With Liver Cirrhosis. Am J Gastroenterol 2023, 118, 1684-1687. [CrossRef]
- Bauman, Z.; Coba, V.; Gassner, M.; Amponsah, D.; Gallien, J.; Blyden, D.; Killu, K. Inferior vena cava collapsibility loses correlation with internal jugular vein collapsibility during increased thoracic or intra-abdominal pressure. J Ultrasound 2015, 18, 343-348. [CrossRef]
- Benkreira, A.; Beaubien-Souligny, W.; Mailhot, T.; Bouabdallaoui, N.; Robillard, P.; Desjardins, G.; Lamarche, Y.; Cossette, S.; Denault, A. Portal Hypertension Is Associated With Congestive Encephalopathy and Delirium After Cardiac Surgery. Can J Cardiol 2019, 35, 1134-1141. [CrossRef]
- Croquette, M.; Puyade, M.; Montani, D.; Jutant, E.M.; De Gea, M.; Laneelle, D.; Thollot, C.; Trihan, J.E. Diagnostic Performance of Pulsed Doppler Ultrasound of the Common Femoral Vein to Detect Elevated Right Atrial Pressure in Pulmonary Hypertension. Journal of cardiovascular translational research 2023, 16, 141-151. [CrossRef]
- Croquette, M.; Larrieu Ardilouze, E.; Beaufort, C.; Jutant, E.M.; Puyade, M.; Montani, D.; Thollot, C.; Laneelle, D.; De Gea, M.; Trihan, J.E. Femoral venous stasis index predicts elevated right atrial pressure and mortality in pulmonary hypertension. ERJ Open Res 2025, 11. [CrossRef]
- Bhardwaj, V.; Rola, P.; Denault, A.; Vikneswaran, G.; Spiegel, R. Femoral vein pulsatility: a simple tool for venous congestion assessment. Ultrasound J 2023, 15, 24. [CrossRef]
- Murayama, M.; Kaga, S.; Okada, K.; Iwano, H.; Nakabachi, M.; Yokoyama, S.; Nishino, H.; Tsujinaga, S.; Chiba, Y.; Ishizaka, S.; et al. Clinical Utility of Superior Vena Cava Flow Velocity Waveform Measured from the Subcostal Window for Estimating Right Atrial Pressure. J Am Soc Echocardiogr 2022, 35, 727-737. [CrossRef]
- Murayama, M.; Kaga, S.; Onoda, A.; Nishino, H.; Yokoyama, S.; Goto, M.; Suzuki, Y.; Yanagi, Y.; Shimono, Y.; Nakamura, K.; et al. Head-to-Head Comparison of Hepatic Vein and Superior Vena Cava Flow Velocity Waveform Analyses for Predicting Elevated Right Atrial Pressure. Ultrasound Med Biol 2024, 50, 1352-1360. [CrossRef]
- Lee, J.H.; Denault, A.Y.; Beaubien-Souligny, W.; Cho, S.A.; Ji, S.H.; Jang, Y.E.; Kim, E.H.; Kim, H.S.; Kim, J.T. Evaluation of Portal, Splenic, and Hepatic Vein Flows in Children Undergoing Congenital Heart Surgery. Journal of cardiothoracic and vascular anesthesia 2023, 37, 1456-1468. [CrossRef]
- Gonzalez, C.; Chamberland, M.E.; Aldred, M.P.; Couture, E.; Beaubien-Souligny, W.; Calderone, A.; Lamarche, Y.; Denault, A. Constrictive pericarditis: portal, splenic, and femoral venous Doppler pulsatility: a case series. Canadian journal of anaesthesia = Journal canadien d'anesthesie 2022, 69, 119-128. [CrossRef]
- Martinez-Noguera, A.; Montserrat, E.; Torrubia, S.; Villalba, J. Doppler in hepatic cirrhosis and chronic hepatitis. Semin.Ultrasound CT MR 2002, 23, 19-36.
- Kim, M.Y.; Baik, S.K.; Park, D.H.; Lim, D.W.; Kim, J.W.; Kim, H.S.; Kwon, S.O.; Kim, Y.J.; Chang, S.J.; Lee, S.S. Damping index of Doppler hepatic vein waveform to assess the severity of portal hypertension and response to propranolol in liver cirrhosis: a prospective nonrandomized study. Liver Int 2007, 27, 1103-1110. [CrossRef]
- Dodd, G.D., 3rd; Memel, D.S.; Zajko, A.B.; Baron, R.L.; Santaguida, L.A. Hepatic artery stenosis and thrombosis in transplant recipients: Doppler diagnosis with resistive index and systolic acceleration time. Radiology 1994, 192, 657-661. [CrossRef]
- Lemmer, A.; VanWagner, L.; Ganger, D. Congestive hepatopathy: Differentiating congestion from fibrosis. Clin Liver Dis (Hoboken) 2017, 10, 139-143. [CrossRef]
- Schneider, A.W.; Kalk, J.F.; Klein, C.P. Hepatic arterial pulsatility index in cirrhosis: correlation with portal pressure. J Hepatol 1999, 30, 876-881. [CrossRef]
- Bolognesi, M.; Sacerdoti, D.; Merkel, C.; Gerunda, G.; Maffei-Faccioli, A.; Angeli, P.; Jemmolo, R.M.; Bombonato, G.; Gatta, A. Splenic Doppler impedance indices: influence of different portal hemodynamic conditions. Hepatology 1996, 23, 1035-1040. [CrossRef]
- Bolognesi, M.; Quaglio, C.; Bombonato, G.; Gaiani, S.; Pesce, P.; Bizzotto, P.; Favaretto, E.; Gatta, A.; Sacerdoti, D. Splenic Doppler impedance indices estimate splenic congestion in patients with right-sided or congestive heart failure. Ultrasound Med Biol 2012, 38, 21-27. [CrossRef]
- Yoshihisa, A.; Ishibashi, S.; Matsuda, M.; Yamadera, Y.; Ichijo, Y.; Sato, Y.; Yokokawa, T.; Misaka, T.; Oikawa, M.; Kobayashi, A.; et al. Clinical Implications of Hepatic Hemodynamic Evaluation by Abdominal Ultrasonographic Imaging in Patients With Heart Failure. J Am Heart Assoc 2020, 9, e016689. [CrossRef]
- Harjola, V.P.; Mebazaa, A.; Celutkiene, J.; Bettex, D.; Bueno, H.; Chioncel, O.; Crespo-Leiro, M.G.; Falk, V.; Filippatos, G.; Gibbs, S.; et al. Contemporary management of acute right ventricular failure: a statement from the Heart Failure Association and the Working Group on Pulmonary Circulation and Right Ventricular Function of the European Society of Cardiology. European journal of heart failure 2016, 18, 226-241. [CrossRef]
- Lang, R.M.; Badano, L.P.; Mor-Avi, V.; Afilalo, J.; Armstrong, A.; Ernande, L.; Flachskampf, F.A.; Foster, E.; Goldstein, S.A.; Kuznetsova, T.; et al. Recommendations for cardiac chamber quantification by echocardiography in adults: an update from the American Society of Echocardiography and the European Association of Cardiovascular Imaging. J Am Soc Echocardiogr 2015, 28, 1-39 e14. [CrossRef]
- Paulus, W.J.; Tschope, C. A novel paradigm for heart failure with preserved ejection fraction: comorbidities drive myocardial dysfunction and remodeling through coronary microvascular endothelial inflammation. J Am Coll Cardiol 2013, 62, 263-271. [CrossRef]
- Redfield, M.M. Heart Failure with Preserved Ejection Fraction. N Engl J Med 2016, 375, 1868-1877. [CrossRef]
- Sanders-van Wijk, S.; van Empel, V.; Davarzani, N.; Maeder, M.T.; Handschin, R.; Pfisterer, M.E.; Brunner-La Rocca, H.P.; investigators, T.-C. Circulating biomarkers of distinct pathophysiological pathways in heart failure with preserved vs. reduced left ventricular ejection fraction. European journal of heart failure 2015, 17, 1006-1014. [CrossRef]
- Ponikowski, P.; Voors, A.A.; Anker, S.D.; Bueno, H.; Cleland, J.G.; Coats, A.J.; Falk, V.; Gonzalez-Juanatey, J.R.; Harjola, V.P.; Jankowska, E.A.; et al. 2016 ESC Guidelines for the diagnosis and treatment of acute and chronic heart failure: The Task Force for the diagnosis and treatment of acute and chronic heart failure of the European Society of Cardiology (ESC). Developed with the special contribution of the Heart Failure Association (HFA) of the ESC. European journal of heart failure 2016, 18, 891-975. [CrossRef]
- Simonneau, G.; Montani, D.; Celermajer, D.S.; Denton, C.P.; Gatzoulis, M.A.; Krowka, M.; Williams, P.G.; Souza, R. Haemodynamic definitions and updated clinical classification of pulmonary hypertension. The European respiratory journal 2019, 53. [CrossRef]
- Henry, J.A.; Couch, L.S.; Rider, O.J. Myocardial Metabolism in Heart Failure with Preserved Ejection Fraction. J Clin Med 2024, 13. [CrossRef]
- Sun, Q.; Wagg, C.S.; Wong, N.; Wei, K.; Ketema, E.B.; Zhang, L.; Fang, L.; Seubert, J.M.; Lopaschuk, G.D. Alterations of myocardial ketone metabolism in heart failure with preserved ejection fraction (HFpEF). ESC Heart Fail 2025, 12, 3179-3182. [CrossRef]
- Li, X.N.; Liu, Y.T.; Kang, S.; Qu Yang, D.Z.; Xiao, H.Y.; Ma, W.K.; Shen, C.X.; Pan, J.W. Interdependence between myocardial deformation and perfusion in patients with T2DM and HFpEF: a feature-tracking and stress perfusion CMR study. Cardiovasc Diabetol 2024, 23, 303. [CrossRef]
- Lin, M.; Guo, J.; Tao, H.; Gu, Z.; Tang, W.; Zhou, F.; Jiang, Y.; Zhang, R.; Jia, D.; Sun, Y.; et al. Circulating mediators linking cardiometabolic diseases to HFpEF: a mediation Mendelian randomization analysis. Cardiovasc Diabetol 2025, 24, 201. [CrossRef]
- Carluccio, E.; Biagioli, P.; Reboldi, G.; Mengoni, A.; Lauciello, R.; Zuchi, C.; D'Addario, S.; Bardelli, G.; Ambrosio, G. Left ventricular remodeling response to SGLT2 inhibitors in heart failure: an updated meta-analysis of randomized controlled studies. Cardiovasc Diabetol 2023, 22, 235. [CrossRef]
- Correale, M.; D'Alessandro, D.; Tricarico, L.; Ceci, V.; Mazzeo, P.; Capasso, R.; Ferrara, S.; Barile, M.; Di Nunno, N.; Rossi, L.; et al. Left ventricular reverse remodeling after combined ARNI and SGLT2 therapy in heart failure patients with reduced or mildly reduced ejection fraction. Int J Cardiol Heart Vasc 2024, 54, 101492. [CrossRef]
- Veltmann, C.; Duncker, D.; Doering, M.; Gummadi, S.; Robertson, M.; Wittlinger, T.; Colley, B.J.; Perings, C.; Jonsson, O.; Bauersachs, J.; et al. Therapy duration and improvement of ventricular function in de novo heart failure: the Heart Failure Optimization study. Eur Heart J 2024, 45, 2771-2781. [CrossRef]
- Ichimura, K.; Boehm, M.; Andruska, A.M.; Zhang, F.; Schimmel, K.; Bonham, S.; Kabiri, A.; Kheyfets, V.O.; Ichimura, S.; Reddy, S.; et al. 3D Imaging Reveals Complex Microvascular Remodeling in the Right Ventricle in Pulmonary Hypertension. Circ Res 2024, 135, 60-75. [CrossRef]
- Mendiola, E.A.; da Silva Goncalves Bos, D.; Leichter, D.M.; Vang, A.; Zhang, P.; Leary, O.P.; Gilbert, R.J.; Avazmohammadi, R.; Choudhary, G. Right Ventricular Architectural Remodeling and Functional Adaptation in Pulmonary Hypertension. Circ Heart Fail 2023, 16, e009768. [CrossRef]
- Ito, K.; Kato, S.; Yasuda, N.; Sawamura, S.; Fukui, K.; Iwasawa, T.; Ogura, T.; Utsunomiya, D. Integrating CT-Based Lung Fibrosis and MRI-Derived Right Ventricular Function for the Detection of Pulmonary Hypertension in Interstitial Lung Disease. J Clin Med 2025, 14. [CrossRef]
- Ma, Y.; Guo, D.; Wang, J.; Gong, J.; Hu, H.; Zhang, X.; Wang, Y.; Yang, Y.; Lv, X.; Li, Y. Effects of right ventricular remodeling in chronic thromboembolic pulmonary hypertension on the outcomes of balloon pulmonary angioplasty: a 2D-speckle tracking echocardiography study. Respir Res 2024, 25, 164. [CrossRef]
- Yoshimura, R.; Hayashi, O.; Horio, T.; Fujiwara, R.; Matsuoka, Y.; Yokouchi, G.; Sakamoto, Y.; Matsumoto, N.; Fukuda, K.; Shimizu, M.; et al. The E/e' ratio on echocardiography as an independent predictor of the improvement of left ventricular contraction in patients with heart failure with reduced ejection fraction. J Clin Ultrasound 2023, 51, 1131-1138. [CrossRef]
- Upadhya, B.; Rose, G.A.; Stacey, R.B.; Palma, R.A.; Ryan, T.; Pendyal, A.; Kelsey, A.M. The role of echocardiography in the diagnosis of heart failure with preserved ejection fraction. Heart Fail Rev 2025, 30, 899-922. [CrossRef]
- Pender, A.; Lewis-Owona, J.; Ekiyoyo, A.; Stoddard, M. Echocardiography and Heart Failure: An Echocardiographic Decision Aid for the Diagnosis and Management of Cardiomyopathies. Curr Cardiol Rep 2025, 27, 64. [CrossRef]
- McDonagh, T.A.; Metra, M.; Adamo, M.; Gardner, R.S.; Baumbach, A.; Bohm, M.; Burri, H.; Butler, J.; Celutkiene, J.; Chioncel, O.; et al. 2021 ESC Guidelines for the diagnosis and treatment of acute and chronic heart failure. Eur Heart J 2021, 42, 3599-3726. [CrossRef]
- Kuwahara, N.; Honjo, T.; Sone, N.; Imanishi, J.; Nakayama, K.; Kamemura, K.; Iwahashi, M.; Ohta, S.; Kaihotsu, K. Clinical impact of portal vein pulsatility on the prognosis of hospitalized patients with acute heart failure. World J Cardiol 2023, 15, 599-608. [CrossRef]
- Grigore, A.M.; Grigore, M.; Balahura, A.M.; Uscoiu, G.; Verde, I.; Nicolae, C.; Badila, E.; Iliesiu, A.M. The Role of the Estimated Plasma Volume Variation in Assessing Decongestion in Patients with Acute Decompensated Heart Failure. Biomedicines 2025, 13. [CrossRef]
- Dimopoulos, S.; Antonopoulos, M. Portal vein pulsatility: An important sonographic tool assessment of systemic congestion for critical ill patients. World J Cardiol 2024, 16, 221-225. [CrossRef]
- Galderisi, M.; Cosyns, B.; Edvardsen, T.; Cardim, N.; Delgado, V.; Di Salvo, G.; Donal, E.; Sade, L.E.; Ernande, L.; Garbi, M.; et al. Standardization of adult transthoracic echocardiography reporting in agreement with recent chamber quantification, diastolic function, and heart valve disease recommendations: an expert consensus document of the European Association of Cardiovascular Imaging. European heart journal cardiovascular Imaging 2017, 18, 1301-1310. [CrossRef]
- Nagueh, S.F.; Sanborn, D.Y.; Oh, J.K.; Anderson, B.; Billick, K.; Derumeaux, G.; Klein, A.; Koulogiannis, K.; Mitchell, C.; Shah, A.; et al. Recommendations for the Evaluation of Left Ventricular Diastolic Function by Echocardiography and for Heart Failure With Preserved Ejection Fraction Diagnosis: An Update From the American Society of Echocardiography. J Am Soc Echocardiogr 2025, 38, 537-569. [CrossRef]
- Smiseth, O.A.; Morris, D.A.; Cardim, N.; Cikes, M.; Delgado, V.; Donal, E.; Flachskampf, F.A.; Galderisi, M.; Gerber, B.L.; Gimelli, A.; et al. Multimodality imaging in patients with heart failure and preserved ejection fraction: an expert consensus document of the European Association of Cardiovascular Imaging. European heart journal cardiovascular Imaging 2022, 23, e34-e61. [CrossRef]
- Pieske, B.; Tschope, C.; de Boer, R.A.; Fraser, A.G.; Anker, S.D.; Donal, E.; Edelmann, F.; Fu, M.; Guazzi, M.; Lam, C.S.P.; et al. How to diagnose heart failure with preserved ejection fraction: the HFA-PEFF diagnostic algorithm: a consensus recommendation from the Heart Failure Association (HFA) of the European Society of Cardiology (ESC). Eur Heart J 2019, 40, 3297-3317. [CrossRef]
- Mukherjee, M.; Rudski, L.G.; Addetia, K.; Afilalo, J.; D'Alto, M.; Freed, B.H.; Friend, L.B.; Gargani, L.; Grapsa, J.; Hassoun, P.M.; et al. Guidelines for the Echocardiographic Assessment of the Right Heart in Adults and Special Considerations in Pulmonary Hypertension: Recommendations from the American Society of Echocardiography. J Am Soc Echocardiogr 2025, 38, 141-186. [CrossRef]
- Cordina, R.L.; Playford, D.; Lang, I.; Celermajer, D.S. State-of-the-Art Review: Echocardiography in Pulmonary Hypertension. Heart Lung Circ 2019, 28, 1351-1364. [CrossRef]
- Labrada, L.; Vaidy, A.; Vaidya, A. Right ventricular assessment in pulmonary hypertension. Curr Opin Pulm Med 2023, 29, 348-354. [CrossRef]
- Tsipis, A.; Petropoulou, E. Echocardiography in the Evaluation of the Right Heart. US Cardiol 2022, 16, e08. [CrossRef]
- D'Alto, M.; Di Maio, M.; Romeo, E.; Argiento, P.; Blasi, E.; Di Vilio, A.; Rea, G.; D'Andrea, A.; Golino, P.; Naeije, R. Echocardiographic probability of pulmonary hypertension: a validation study. The European respiratory journal 2022, 60. [CrossRef]
- Borlaug, B.A.; Sharma, K.; Shah, S.J.; Ho, J.E. Heart Failure With Preserved Ejection Fraction: JACC Scientific Statement. J Am Coll Cardiol 2023, 81, 1810-1834. [CrossRef]
- Pastore, M.C.; Mandoli, G.E.; Aboumarie, H.S.; Santoro, C.; Bandera, F.; D'Andrea, A.; Benfari, G.; Esposito, R.; Evola, V.; Sorrentino, R.; et al. Basic and advanced echocardiography in advanced heart failure: an overview. Heart Fail Rev 2020, 25, 937-948. [CrossRef]
- Li, J.; Song, Y.; Chen, F. Evaluating the impact of Sacubitril/valsartan on diastolic function in patients with heart failure: A systematic review and meta-analysis. Medicine (Baltimore) 2024, 103, e37965. [CrossRef]
- Galzerano, D.; Savo, M.T.; Castaldi, B.; Kholaif, N.; Khaliel, F.; Pozza, A.; Aljheish, S.; Cattapan, I.; Martini, M.; Lassandro, E.; et al. Transforming Heart Failure Management: The Power of Strain Imaging, 3D Imaging, and Vortex Analysis in Echocardiography. J Clin Med 2024, 13. [CrossRef]
- Zoghbi, W.A.; Jone, P.N.; Chamsi-Pasha, M.A.; Chen, T.; Collins, K.A.; Desai, M.Y.; Grayburn, P.; Groves, D.W.; Hahn, R.T.; Little, S.H.; et al. Guidelines for the Evaluation of Prosthetic Valve Function With Cardiovascular Imaging: A Report From the American Society of Echocardiography Developed in Collaboration With the Society for Cardiovascular Magnetic Resonance and the Society of Cardiovascular Computed Tomography. J Am Soc Echocardiogr 2024, 37, 2-63. [CrossRef]
- Nuzzi, V.; Manca, P.; Mule, M.; Leone, S.; Fazzini, L.; Cipriani, M.G.; Faletra, F.F. Contemporary clinical role of echocardiography in patients with advanced heart failure. Heart Fail Rev 2024, 29, 1247-1260. [CrossRef]
- Mitchell, C.; Rahko, P.S.; Blauwet, L.A.; Canaday, B.; Finstuen, J.A.; Foster, M.C.; Horton, K.; Ogunyankin, K.O.; Palma, R.A.; Velazquez, E.J. Guidelines for Performing a Comprehensive Transthoracic Echocardiographic Examination in Adults: Recommendations from the American Society of Echocardiography. J Am Soc Echocardiogr 2019, 32, 1-64. [CrossRef]
- Colonna, P.; Pinto, F.J.; Sorino, M.; Bovenzi, F.; D'Agostino, C.; de Luca, I. The emerging role of echocardiography in the screening of patients at risk of heart failure. Am J Cardiol 2005, 96, 42L-51L. [CrossRef]
- Gong, F.F.; Campbell, D.J.; Prior, D.L. Noninvasive Cardiac Imaging and the Prediction of Heart Failure Progression in Preclinical Stage A/B Subjects. JACC Cardiovasc Imaging 2017, 10, 1504-1519. [CrossRef]
- Writing Group, M.; Doherty, J.U.; Kort, S.; Mehran, R.; Schoenhagen, P.; Soman, P.; Rating Panel, M.; Dehmer, G.J.; Doherty, J.U.; Schoenhagen, P.; et al. ACC/AATS/AHA/ASE/ASNC/HRS/SCAI/SCCT/SCMR/STS 2019 Appropriate Use Criteria for Multimodality Imaging in the Assessment of Cardiac Structure and Function in Nonvalvular Heart Disease: A Report of the American College of Cardiology Appropriate Use Criteria Task Force, American Association for Thoracic Surgery, American Heart Association, American Society of Echocardiography, American Society of Nuclear Cardiology, Heart Rhythm Society, Society for Cardiovascular Angiography and Interventions, Society of Cardiovascular Computed Tomography, Society for Cardiovascular Magnetic Resonance, and the Society of Thoracic Surgeons. J Am Soc Echocardiogr 2019, 32, 553-579. [CrossRef]
- Edvardsen, T.; Asch, F.M.; Davidson, B.; Delgado, V.; DeMaria, A.; Dilsizian, V.; Gaemperli, O.; Garcia, M.J.; Kamp, O.; Lee, D.C.; et al. Non-Invasive Imaging in Coronary Syndromes: Recommendations of The European Association of Cardiovascular Imaging and the American Society of Echocardiography, in Collaboration with The American Society of Nuclear Cardiology, Society of Cardiovascular Computed Tomography, and Society for Cardiovascular Magnetic Resonance. J Am Soc Echocardiogr 2022, 35, 329-354. [CrossRef]
- Chioncel, O.; Mebazaa, A.; Harjola, V.P.; Coats, A.J.; Piepoli, M.F.; Crespo-Leiro, M.G.; Laroche, C.; Seferovic, P.M.; Anker, S.D.; Ferrari, R.; et al. Clinical phenotypes and outcome of patients hospitalized for acute heart failure: the ESC Heart Failure Long-Term Registry. European journal of heart failure 2017, 19, 1242-1254. [CrossRef]
- Pugliese, N.R.; Mazzola, M.; Bandini, G.; Barbieri, G.; Spinelli, S.; De Biase, N.; Masi, S.; Moggi-Pignone, A.; Ghiadoni, L.; Taddei, S.; et al. Prognostic Role of Sonographic Decongestion in Patients with Acute Heart Failure with Reduced and Preserved Ejection Fraction: A Multicentre Study. J Clin Med 2023, 12. [CrossRef]
- Wang, C.S.; FitzGerald, J.M.; Schulzer, M.; Mak, E.; Ayas, N.T. Does this dyspneic patient in the emergency department have congestive heart failure? JAMA 2005, 294, 1944-1956. [CrossRef]
- Lichtenstein, D.; Meziere, G.; Biderman, P.; Gepner, A.; Barre, O. The comet-tail artifact. An ultrasound sign of alveolar-interstitial syndrome. American journal of respiratory and critical care medicine 1997, 156, 1640-1646. [CrossRef]
- Volpicelli, G.; Elbarbary, M.; Blaivas, M.; Lichtenstein, D.A.; Mathis, G.; Kirkpatrick, A.W.; Melniker, L.; Gargani, L.; Noble, V.E.; Via, G.; et al. International evidence-based recommendations for point-of-care lung ultrasound. Intensive Care Med 2012, 38, 577-591. [CrossRef]
- Picano, E.; Frassi, F.; Agricola, E.; Gligorova, S.; Gargani, L.; Mottola, G. Ultrasound lung comets: a clinically useful sign of extravascular lung water. J Am Soc Echocardiogr 2006, 19, 356-363. [CrossRef]
- Gargani, L. Lung ultrasound: a new tool for the cardiologist. Cardiovasc Ultrasound 2011, 9, 6. [CrossRef]
- Chouihed, T.; Coiro, S.; Zannad, F.; Girerd, N. Lung ultrasound: a diagnostic and prognostic tool at every step in the pathway of care for acute heart failure. Am J Emerg Med 2016, 34, 656-657. [CrossRef]
- Mottola, C.; Girerd, N.; Coiro, S.; Lamiral, Z.; Rossignol, P.; Frimat, L.; Girerd, S. Evaluation of Subclinical Fluid Overload Using Lung Ultrasound and Estimated Plasma Volume in the Postoperative Period Following Kidney Transplantation. Transplant Proc 2018, 50, 1336-1341. [CrossRef]
- Lichtenstein, D.A.; Meziere, G.A. Relevance of lung ultrasound in the diagnosis of acute respiratory failure: the BLUE protocol. Chest 2008, 134, 117-125. [CrossRef]
- Dubon-Peralta, E.E.; Lorenzo-Villalba, N.; Garcia-Klepzig, J.L.; Andres, E.; Mendez-Bailon, M. Prognostic value of B lines detected with lung ultrasound in acute heart failure. A systematic review. J Clin Ultrasound 2022, 50, 273-283. [CrossRef]
- Gargani, L.; Volpicelli, G. How I do it: lung ultrasound. Cardiovasc Ultrasound 2014, 12, 25. [CrossRef]
- Yuriditsky, E.; Horowitz, J.M.; Panebianco, N.L.; Sauthoff, H.; Saric, M. Lung Ultrasound Imaging: A Primer for Echocardiographers. J Am Soc Echocardiogr 2021, 34, 1231-1241. [CrossRef]
- Picano, E.; Scali, M.C.; Ciampi, Q.; Lichtenstein, D. Lung Ultrasound for the Cardiologist. JACC Cardiovasc Imaging 2018, 11, 1692-1705. [CrossRef]
- Jambrik, Z.; Monti, S.; Coppola, V.; Agricola, E.; Mottola, G.; Miniati, M.; Picano, E. Usefulness of ultrasound lung comets as a nonradiologic sign of extravascular lung water. Am J Cardiol 2004, 93, 1265-1270. [CrossRef]
- Gargani, L.; Pang, P.S.; Frassi, F.; Miglioranza, M.H.; Dini, F.L.; Landi, P.; Picano, E. Persistent pulmonary congestion before discharge predicts rehospitalization in heart failure: a lung ultrasound study. Cardiovasc Ultrasound 2015, 13, 40. [CrossRef]
- Volpicelli, G.; Mussa, A.; Garofalo, G.; Cardinale, L.; Casoli, G.; Perotto, F.; Fava, C.; Frascisco, M. Bedside lung ultrasound in the assessment of alveolar-interstitial syndrome. Am J Emerg Med 2006, 24, 689-696. [CrossRef]
- Buessler, A.; Chouihed, T.; Duarte, K.; Bassand, A.; Huot-Marchand, M.; Gottwalles, Y.; Penine, A.; Andre, E.; Nace, L.; Jaeger, D.; et al. Accuracy of Several Lung Ultrasound Methods for the Diagnosis of Acute Heart Failure in the ED: A Multicenter Prospective Study. Chest 2020, 157, 99-110. [CrossRef]
- Liteplo, A.S.; Marill, K.A.; Villen, T.; Miller, R.M.; Murray, A.F.; Croft, P.E.; Capp, R.; Noble, V.E. Emergency thoracic ultrasound in the differentiation of the etiology of shortness of breath (ETUDES): sonographic B-lines and N-terminal pro-brain-type natriuretic peptide in diagnosing congestive heart failure. Acad Emerg Med 2009, 16, 201-210. [CrossRef]
- Platz, E.; Jhund, P.S.; Girerd, N.; Pivetta, E.; McMurray, J.J.V.; Peacock, W.F.; Masip, J.; Martin-Sanchez, F.J.; Miro, O.; Price, S.; et al. Expert consensus document: Reporting checklist for quantification of pulmonary congestion by lung ultrasound in heart failure. European journal of heart failure 2019, 21, 844-851. [CrossRef]
- Pivetta, E.; Goffi, A.; Lupia, E.; Tizzani, M.; Porrino, G.; Ferreri, E.; Volpicelli, G.; Balzaretti, P.; Banderali, A.; Iacobucci, A.; et al. Lung Ultrasound-Implemented Diagnosis of Acute Decompensated Heart Failure in the ED: A SIMEU Multicenter Study. Chest 2015, 148, 202-210. [CrossRef]
- Pivetta, E.; Goffi, A.; Nazerian, P.; Castagno, D.; Tozzetti, C.; Tizzani, P.; Tizzani, M.; Porrino, G.; Ferreri, E.; Busso, V.; et al. Lung ultrasound integrated with clinical assessment for the diagnosis of acute decompensated heart failure in the emergency department: a randomized controlled trial. European journal of heart failure 2019, 21, 754-766. [CrossRef]
- Frassi, F.; Gargani, L.; Gligorova, S.; Ciampi, Q.; Mottola, G.; Picano, E. Clinical and echocardiographic determinants of ultrasound lung comets. Eur J Echocardiogr 2007, 8, 474-479. [CrossRef]
- Volpicelli, G.; Caramello, V.; Cardinale, L.; Mussa, A.; Bar, F.; Frascisco, M.F. Bedside ultrasound of the lung for the monitoring of acute decompensated heart failure. Am J Emerg Med 2008, 26, 585-591. [CrossRef]
- Cortellaro, F.; Ceriani, E.; Spinelli, M.; Campanella, C.; Bossi, I.; Coen, D.; Casazza, G.; Cogliati, C. Lung ultrasound for monitoring cardiogenic pulmonary edema. Intern Emerg Med 2017, 12, 1011-1017. [CrossRef]
- Ohman, J.; Harjola, V.P.; Karjalainen, P.; Lassus, J. Assessment of early treatment response by rapid cardiothoracic ultrasound in acute heart failure: Cardiac filling pressures, pulmonary congestion and mortality. Eur Heart J Acute Cardiovasc Care 2018, 7, 311-320. [CrossRef]
- Facchini, C.; Malfatto, G.; Giglio, A.; Facchini, M.; Parati, G.; Branzi, G. Lung ultrasound and transthoracic impedance for noninvasive evaluation of pulmonary congestion in heart failure. J Cardiovasc Med (Hagerstown) 2016, 17, 510-517. [CrossRef]
- Coiro, S.; Porot, G.; Rossignol, P.; Ambrosio, G.; Carluccio, E.; Tritto, I.; Huttin, O.; Lemoine, S.; Sadoul, N.; Donal, E.; et al. Prognostic value of pulmonary congestion assessed by lung ultrasound imaging during heart failure hospitalisation: A two-centre cohort study. Scientific reports 2016, 6, 39426. [CrossRef]
- Platz, E.; Campbell, R.T.; Claggett, B.; Lewis, E.F.; Groarke, J.D.; Docherty, K.F.; Lee, M.M.Y.; Merz, A.A.; Silverman, M.; Swamy, V.; et al. Lung Ultrasound in Acute Heart Failure: Prevalence of Pulmonary Congestion and Short- and Long-Term Outcomes. JACC Heart Fail 2019, 7, 849-858. [CrossRef]
- Coiro, S.; Rossignol, P.; Ambrosio, G.; Carluccio, E.; Alunni, G.; Murrone, A.; Tritto, I.; Zannad, F.; Girerd, N. Prognostic value of residual pulmonary congestion at discharge assessed by lung ultrasound imaging in heart failure. European journal of heart failure 2015, 17, 1172-1181. [CrossRef]
- Rivas-Lasarte, M.; Maestro, A.; Fernandez-Martinez, J.; Lopez-Lopez, L.; Sole-Gonzalez, E.; Vives-Borras, M.; Montero, S.; Mesado, N.; Pirla, M.J.; Mirabet, S.; et al. Prevalence and prognostic impact of subclinical pulmonary congestion at discharge in patients with acute heart failure. ESC Heart Fail 2020, 7, 2621-2628. [CrossRef]
- Rastogi, T.; Bozec, E.; Pellicori, P.; Bayes-Genis, A.; Coiro, S.; Domingo, M.; Gargani, L.; Palazzuoli, A.; Girerd, N. Prognostic Value and Therapeutic Utility of Lung Ultrasound in Acute and Chronic Heart Failure: A Meta-Analysis. JACC Cardiovasc Imaging 2022, 15, 950-952. [CrossRef]
- Miglioranza, M.H.; Gargani, L.; Sant'Anna, R.T.; Rover, M.M.; Martins, V.M.; Mantovani, A.; Weber, C.; Moraes, M.A.; Feldman, C.J.; Kalil, R.A.; et al. Lung ultrasound for the evaluation of pulmonary congestion in outpatients: a comparison with clinical assessment, natriuretic peptides, and echocardiography. JACC Cardiovasc Imaging 2013, 6, 1141-1151. [CrossRef]
- Pellicori, P.; Shah, P.; Cuthbert, J.; Urbinati, A.; Zhang, J.; Kallvikbacka-Bennett, A.; Clark, A.L.; Cleland, J.G.F. Prevalence, pattern and clinical relevance of ultrasound indices of congestion in outpatients with heart failure. European journal of heart failure 2019, 21, 904-916. [CrossRef]
- Platz, E.; Lewis, E.F.; Uno, H.; Peck, J.; Pivetta, E.; Merz, A.A.; Hempel, D.; Wilson, C.; Frasure, S.E.; Jhund, P.S.; et al. Detection and prognostic value of pulmonary congestion by lung ultrasound in ambulatory heart failure patients. Eur Heart J 2016, 37, 1244-1251. [CrossRef]
- Dwyer, K.H.; Merz, A.A.; Lewis, E.F.; Claggett, B.L.; Crousillat, D.R.; Lau, E.S.; Silverman, M.B.; Peck, J.; Rivero, J.; Cheng, S.; et al. Pulmonary Congestion by Lung Ultrasound in Ambulatory Patients With Heart Failure With Reduced or Preserved Ejection Fraction and Hypertension. J Card Fail 2018, 24, 219-226. [CrossRef]
- Domingo, M.; Conangla, L.; Lupon, J.; de Antonio, M.; Moliner, P.; Santiago-Vacas, E.; Codina, P.; Zamora, E.; Cediel, G.; Gonzalez, B.; et al. Prognostic value of lung ultrasound in chronic stable ambulatory heart failure patients. Rev Esp Cardiol (Engl Ed) 2021, 74, 862-869. [CrossRef]
- Morvai-Illes, B.; Polestyuk-Nemeth, N.; Szabo, I.A.; Monoki, M.; Gargani, L.; Picano, E.; Varga, A.; Agoston, G. The Prognostic Value of Lung Ultrasound in Patients With Newly Diagnosed Heart Failure With Preserved Ejection Fraction in the Ambulatory Setting. Front Cardiovasc Med 2021, 8, 758147. [CrossRef]
- Rivas-Lasarte, M.; Alvarez-Garcia, J.; Fernandez-Martinez, J.; Maestro, A.; Lopez-Lopez, L.; Sole-Gonzalez, E.; Pirla, M.J.; Mesado, N.; Mirabet, S.; Fluvia, P.; et al. Lung ultrasound-guided treatment in ambulatory patients with heart failure: a randomized controlled clinical trial (LUS-HF study). European journal of heart failure 2019, 21, 1605-1613. [CrossRef]
- Araiza-Garaygordobil, D.; Gopar-Nieto, R.; Martinez-Amezcua, P.; Cabello-Lopez, A.; Alanis-Estrada, G.; Luna-Herbert, A.; Gonzalez-Pacheco, H.; Paredes-Paucar, C.P.; Sierra-Lara, M.D.; Briseno-De la Cruz, J.L.; et al. A randomized controlled trial of lung ultrasound-guided therapy in heart failure (CLUSTER-HF study). Am Heart J 2020, 227, 31-39. [CrossRef]
- Reddy, Y.N.V.; Obokata, M.; Wiley, B.; Koepp, K.E.; Jorgenson, C.C.; Egbe, A.; Melenovsky, V.; Carter, R.E.; Borlaug, B.A. The haemodynamic basis of lung congestion during exercise in heart failure with preserved ejection fraction. Eur Heart J 2019, 40, 3721-3730. [CrossRef]
- Simonovic, D.; Coiro, S.; Carluccio, E.; Girerd, N.; Deljanin-Ilic, M.; Cattadori, G.; Ambrosio, G. Exercise elicits dynamic changes in extravascular lung water and haemodynamic congestion in heart failure patients with preserved ejection fraction. European journal of heart failure 2018, 20, 1366-1369. [CrossRef]
- Scali, M.C.; Cortigiani, L.; Simionuc, A.; Gregori, D.; Marzilli, M.; Picano, E. Exercise-induced B-lines identify worse functional and prognostic stage in heart failure patients with depressed left ventricular ejection fraction. European journal of heart failure 2017, 19, 1468-1478. [CrossRef]
- Coiro, S.; Simonovic, D.; Deljanin-Ilic, M.; Duarte, K.; Carluccio, E.; Cattadori, G.; Girerd, N.; Ambrosio, G. Prognostic Value of Dynamic Changes in Pulmonary Congestion During Exercise Stress Echocardiography in Heart Failure With Preserved Ejection Fraction. Circ Heart Fail 2020, 13, e006769. [CrossRef]
- Pugliese, N.R.; Masi, S. The emerging role of endothelial function in cardiovascular oncology. Eur J Prev Cardiol 2020, 27, 604-607. [CrossRef]
- Assavapokee, T.; Rola, P.; Assavapokee, N.; Koratala, A. Decoding VExUS: a practical guide for excelling in point-of-care ultrasound assessment of venous congestion. Ultrasound J 2024, 16, 48. [CrossRef]
- Fudim, M.; Kaye, D.M.; Borlaug, B.A.; Shah, S.J.; Rich, S.; Kapur, N.K.; Costanzo, M.R.; Brener, M.I.; Sunagawa, K.; Burkhoff, D. Venous Tone and Stressed Blood Volume in Heart Failure: JACC Review Topic of the Week. J Am Coll Cardiol 2022, 79, 1858-1869. [CrossRef]
- Fudim, M.; Hernandez, A.F.; Felker, G.M. Role of Volume Redistribution in the Congestion of Heart Failure. J Am Heart Assoc 2017, 6. [CrossRef]
- Kanitkar, S.; Soni, K.; Vaishnav, B. Venous Excess Ultrasound for Fluid Assessment in Complex Cardiac Patients With Acute Kidney Injury. Cureus 2024, 16, e66003. [CrossRef]
- Melo, R.H.; Gioli-Pereira, L.; Melo, E.; Rola, P. Venous excess ultrasound score association with acute kidney injury in critically ill patients: a systematic review and meta-analysis of observational studies. Ultrasound J 2025, 17, 16. [CrossRef]
- Jain, C.C.; Reddy, Y.N.V. Approach to Echocardiography in Heart Failure with Preserved Ejection Fraction. Cardiol Clin 2022, 40, 431-442. [CrossRef]
Table 1.
Flow chart of the literature search according to Prisma 2020 statement[50].
Table 1.
Flow chart of the literature search according to Prisma 2020 statement[50].
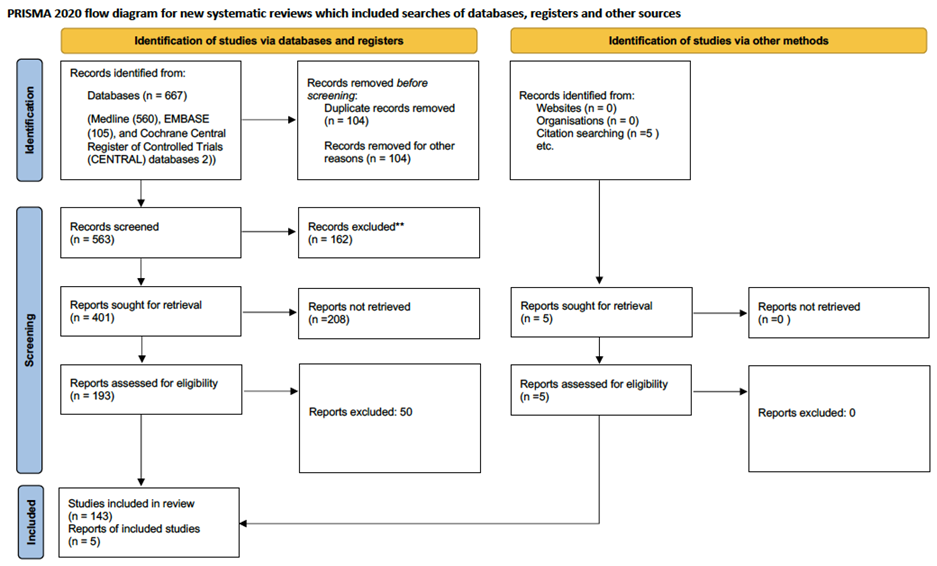
Disclaimer/Publisher’s Note: The statements, opinions and data contained in all publications are solely those of the individual author(s) and contributor(s) and not of MDPI and/or the editor(s). MDPI and/or the editor(s) disclaim responsibility for any injury to people or property resulting from any ideas, methods, instructions or products referred to in the content. |
© 2025 by the authors. Licensee MDPI, Basel, Switzerland. This article is an open access article distributed under the terms and conditions of the Creative Commons Attribution (CC BY) license (http://creativecommons.org/licenses/by/4.0/).
Copyright: This open access article is published under a Creative Commons CC BY 4.0 license, which permit the free download, distribution, and reuse, provided that the author and preprint are cited in any reuse.


