
Submitted:
10 October 2025
Posted:
13 October 2025
You are already at the latest version
Abstract
Extremely premature newborns are predisposed to cardiovascular complications due to a number of factors, including myocardial immaturity, hemodynamic changes, and iatrogenic effects.
There are few studies on myocardial strain in extremely premature infants during the early neonatal period.
The objective of study was to assess the left ventricular (LV) segmental strain in ex-tremely premature newborns during the early neonatal period by employing speck-le-tracking echocardiography (STE).
This prospective study examined 65 newborns with no signs of hemodynamic impair-ment
during the first 72 hours of life.The cohort had a range of birth weights (600-1500 grams) and gestational ages (24-35 weeks).
The peak strain in 18 LV segments during systole (peak S and time to peak S), throughout the cardiac cycle (peak G and time to peak G), and during early systolic prestretch (peak P and time to peak P) were assessed in the longitudinal, circumferen-tial, and radial directions.
We obtained percentile tables of segmental strain characteristics in the longitudinal, circumferential, and radial directions. No dependence of segmental strain on birth weight, gestational age, or arterial duct closure was found. A positive gradient of lon-gitudinal strain magnitude was observed from the base to the apex. The greatest cir-cumferential and radial strain were observed in LV septum.
This study marks the first complete investigation of longitudinal, circumferential, and radial LV strain using STE in extremely premature infants with no signs of hemody-namic disturbances during the first 72 hours of life. Reference values for segmental strain were established.
Keywords:
speckle-tracking echocardiography
; segmental strain
; premature infants
1. Introduction
Assessment of global cardiac function alone is not always sufficient for the diagnosis and prognosis of heart disease. Numerous studies in adult populations demonstrate that the segmental characteristics of left ventricular myocardial deformation serve as predictors of pathological changes in preserved global cardiac function [1,2].
Speckle-tracking echocardiography (STE) is a contemporary ultrasound technique used for evaluating myocardial function. This method is based on the analysis of the spatial displacement of speckles reproduced in a grayscale image, which arise as a result of the interaction of the ultrasound beam with myocardial fibers.
Speckles represent ultrasonic imprints that are tracked throughout the cardiac cycle using specialized software. This software facilitates the calculation of key contraction parameters, including deformation, deformation velocity of selected myocardial regions, rotation, twisting, and untwisting [3].
The STE method is a clinical practice that utilizes three primary characteristics to assess cardiac function. Longitudinal strain provides an assessment of the contraction of muscle fibers that extend longitudinally along the heart's axis, spanning from the base to the apex. Circumferential strain offers an assessment of the contraction of fibers that envelop the heart's circumference. Radial strain reflects thickening (positive strain) of the heart muscle wall.
The utilization of STE facilitates the examination of the characteristics of segment deformation and the variety of LV torsion mechanics, including strain, rotation, and twisting during postnatal growth and development [3]. Premature newborns, particularly those with extremely low birth weight, are predisposed to cardiovascular complications due to myocardial immaturity, hemodynamic changes, and iatrogenic effects [4]. STE offers the potential for early detection of myocardial dysfunction, which can enhance survival and reduce disability in this patient population.
Studies of myocardial deformation using the STE method in premature infants in the early neonatal period are few in number. The existing studies have focused on the evaluation of global characteristics of right ventricular (RV) and left ventricular (LV) deformation, with a particular emphasis on global longitudinal strain (GLS) [4,5,6,7,8].
To date, there is no detailed description in the world literature of regional, longitudinal, circumferential, and radial strain of the heart chambers in extremely premature infants. The aim of this study is to evaluate regional LV strain in the longitudinal, circumferential, and radial directions in extremely premature newborns during the early neonatal period. In particular, to obtain reference values for segmental LV strain characteristics for the patient group under consideration.
2. Materials and Methods
Population
A prospective study was conducted over a period of 1.5 years in the neonatal intensive care unit of the Mother and Child Care Research Institute. The cohort comprised 65 newborns with a birth weight ranging from 600 to 1500 g, gestational age ranging from 24 to 35 weeks, and exhibiting no signs of hemodynamic impairment (no requirement for cardiotonic or vasopressor support). Newborns with congenital malformations, episodes of hemodynamic impairment, or a heart rate below 120 beats per minute or above 180 beats per minute were excluded from the study. All mothers of newborns gave their informed consent for inclusion in the study before participating. The study was conducted in accordance with the Declaration of Helsinki, and the protocol was approved by the Ethics Committee of the Mother and Child Care Research Institute No. 16 on 06/09/2023.
STE
Echocardiography was performed using a portable ultrasound device (GE Vivid iQ) equipped with a sector phased transducer (12S-RS, 4.5-12 MHz). Cine loops were obtained in B-mode with synchronous recording of ECG of the following sections of the heart: apical-4-chamber (4CH), 2-chamber (2CH), and along the long axis of the left ventricle (APLAX); parasternal at the level of the mitral valve (MV), papillary muscles (PM), and apex (AP) of the LV.
The frame rate in recording the cardiac cycle is 100-140 frames per second. The images were saved in DICOM format and subsequently analyzed using the EсhoPac v. 204.
The image analysis was performed by a single researcher, E.G.
The standard echocardiographic parameters of the LV were assessed, including end-diastolic size, end-systolic size, thickness of the interventricular septum, posterior wall, ejection fraction according to Teicholz, cardiac output, and cardiac index [9].
The strain values were also calculated from the STE data (Figure 1).
Peak S of longitudinal or circumferential strain is defined as the maximum negative value of longitudinal or circumferential strain during systole.
Peak G is defined as the maximum absolute value of longitudinal, circumferential, and radial deformation throughout the cardiac cycle.
Peak P of longitudinal or circumferential strain is defined as the positive systolic strain peak, i.e. the positive strain value during systole (if there is no positive peak, it is equal to 0) [10].
As shown in Figure 2, the LV segments for which the peak S, G, and P were assessed are schematically represented.
1. Longitudinal strain (SL) parameters include the following:
-Global longitudinal strain (GLS)
-Regional SL Peak S and the time of its achievement
-Regional SL Peak G and the time of its achievement
-Regional SL Peak P and the time of its achievement
2. Circumferential strain (SC) parameters include the following:
-The regional SC Peak S and the time of its achievement
-The regional SC Peak G and the time of its achievement
-The regional SC Peak P and the time of its achievement
3. Radial strain (SR) parameters include the regional SR Peak G and the time of its achievement.
The longitudinal and circumferential myocardial strain values were defined by the software as negative percentages. The terms "strain decrease" and "strain increase" were employed to denote the behavior of the strain when approaching and exceeding negative values, respectively. The radial strain values were defined by the software as positive percentages. For the purpose of this study, the terms "strain decrease" and "strain increase" were used to describe the behavior of the radial strain values as they vary from small to large values.
Statistics
The R software environment (RStudio 2025.05.1) was used for statistical analysis. The quantitative characteristics enumerated in Table 1 were described by the median (50), 25, and 75 percentiles. Qualitative variables were characterized by the absolute number and frequency of occurrence in percentages.
The distributions of segmental strain peaks and the time to those peaks were presented by percentile curves. In this particular context, the 5th percentile, 25th percentile, 50th percentile, 75th percentile, and 95th percentile were utilized.
The dependence of global and segmental strain characteristics on birth weight and gestational age was assessed using Spearman's rank correlation with FDR (false discovery rate) correction for multiple comparisons.
We assessed differences in subgroups with open and closed arterial ducts using permutation tests with FDR correction for multiple comparisons. The first, a permutation test was performed for the entire set of segments for each characteristic (Peak G, Peak S, Peak P, Time to Peak G, Time to Peak S, and Time to Peak P). If such a test was significant, then a test was performed for each segment with FDR correction for multiple comparisons.
We used the Wilcoxon test with FDR correction for multiple comparisons to assess statistical differences in the same characteristics (peak G, peak S, peak P, time to peak G, time to peak S, and time to peak P) across different segments and also for comparison longitudinal and circumferential strain peaks.
The significance level at which the null hypothesis was rejected was taken as 0.05.
Intra-observer variability was assessed for GLS in a randomly selected subset of 20 patients. The same observer EG, who is cardiologist with 5 years of experience in speckle-tracking, repeated the measurements on two separate occasions, blinded to the results of the first analysis and to patient identifiers. The time interval between measurements was 1 month. Variability was determined using the intraclass correlation coefficient (ICC) for consistency, Bland-Altman analysis (reporting bias and limits of agreement), and the coefficient of variation (CV). Intra-observer variability: ICC was 0.96 (95% CI: 0.91 - 0.98). Bland-Altman analysis showed a mean bias of -0.1% with limits of agreement ranging from -1.5% to +1.3%. The coefficient of variation was 4.2%.The analysis demonstrates high intra-observer reproducibility.
3. Results
In total, we evaluated 254 global and segmental parameters of longitudinal, circumferential, and radial left ventricular (LV) strain, as determined by the speckle tracking echocardiography (STE) method, in 65 extremely premature newborns without signs of hemodynamic disturbances during the first 72 hours of life. The median birth weight in the cohort was 1,210 (980; 1,420) grams, the median gestational age was 29.7 (27.4; 31.1) weeks. Table 1 presents the description and characteristics of the standard echocardiographic protocol for this group of infants.
We investigated statistical differences in segmental strain characteristics among subgroups weighing between 500 and 999 grams (extremely low birth weight, n = 21) and between 1000 and 1499 grams (very low birth weight, n = 44). No statistically significant differences were found. We also performed a correlation analysis between birth weight, gestational age, and the strain characteristics under consideration.
We did not find any statistically significant dependencies between the considered strain peaks, the time at which they were achieved, and gestational age or birth weight (Supplement Table S1). We analyzed differences in the segmental parameters of longitudinal, circumferential and radial LV strain in infants with an open (n = 46) and closed (n = 19) arterial duct. No statistically significant differences were found (Supplement Table S2). Therefore, we presented data for the entire group of infants without separation by weight, gestational age, and regardless of duct closure.
For longitudinal strain, GLS was calculated by the software using three apical projections (4CH, 2CH, and APLAX), and its median value was -16.4 (-14.5;-18.4). The regional characteristics of the peak S of longitudinal strain were compared with this value. The available software does not allow for the calculation of global characteristics for circular and radial strain. For the G and P longitudinal peak and all the circular and radial peak times, the medians of all LV segments were used as global characteristics (Table 1).
Longitudinal Strain
Figure 2, Figure 3 and Figure 4 show the distributions of peaks S,G,P and time to peaksrelative to the location of LV segments for longitudinal strain. Percentile tables of all considered parameters are provided in the Supplement Table S3.
The peak strain of the left ventricular (LV) segments during systole was estimated by the peak S value. In the considered cohort, a gradient of Peak S values was observed from the base to the apex of the LV (Figure 3, heatmap in Supplement Figure S1). Thus, statistically significantly smaller absolute values of Peak S were observed in most basal regions compared to the middle and apical segments. Meanwhile, the apical segments demonstrated statistically significantly larger absolute values of Peak S medians (in Supplement: Table S3, Figure S1, Figure S3 panel A).
Segmental values of peak S longitudinal strain were compared with the GLS (see Supplement Figure S1 panel A). Significant differences were observed in the basal and middle segments, where the strain (absolute peak S value) was statistically lower than the absolute value of GLS. At the same time, the strain values of the apical level of the anteroseptal, septal, and inferior walls were significantly higher. This reveals significant quantitative differences in the contribution of different LV segments to LV longitudinal systolic strain.
The time to peak S in the segments did not differ statistically and did not differ from the global median time to peak S for all segments (Figure 3, Sup. Figure S1 panel A). For most segments of the LV, no significant correlation was found between peak S and the time to peak S (Sup. Table S4); only the basal segments of the posterior and lateral wall, apical anterior-septal segment showed a weak negative correlation (Sup. Table S4).
The P peak characterized the early systolic elongation of the segments. The peak P (Figure 4 top) was greater than zero in the basal segments of the lateral, posterior, and inferior walls, the middle level of the lateral and posterior walls, and the lateral at the apical level. These values were significantly higher than those at the basal level of the anterior- septal, septal and inferior walls, as well as at the middle level of the anterior-septal and septal walls (см. heatmap in Supplements , Figure S4).
Compared with the global median peak P, significantly larger peaks were observed in the lateral wall segments at all levels, the posterior wall at the basal and middle levels, and the apical segment of the septum. Significantly, smaller peak values were observed in the middle segment of the antero-septal wall and the apical segment of the posterior wall (see Supplement Figure S2 panel A).
Segmental times to peak P compared to the global median time to peak P (Figure 4 bottom) were significantly longer in the basal parts of the anterior and lateral walls and in all segments of the septum (Sup. Figure S2 panel A).
For all segments, a significant positive correlation was established between the peak P value and the time it was reached (Table S4 in Supplement), that is, the greater the positive strain of the segment, the more time it took for the segment to reach the peak value of positive deformation in systole.
For all segments, except of the apical anterior segment, a significant positive correlation was found between the P peak magnitude and the S peak magnitude. The time to peak P was positively correlated with the time to peak S, except for the lateral and posterior wall segments at the basal level and the posterior wall segment at the middle level (Table S5 in Supplement).
For all LV segments, a significant positive correlation was established between Peak S and Peak G, Time to Peak S and Time to Peak G (Sup. Table S4).
Similar to the peak S, there was a gradient of Peak G values from the base to the apex of LV (Figure 5). An increase in strain was observed from the base to the apex (see Supplement: Table S3, Figure S1, Figure S3 panel A).
The absolute values of the peak G in the basal and middle segments were significantly smaller, while in the apical segments they were significantly larger compared to the absolute value of the global median peak G (see Supplement Figure S1 panel A). This indicated significant quantitative differences in the contribution of different LV segments to LV longitudinal strain.
The time to peak G did not differ significantly among most segments. However, the median time to reach peak G in the apical segments of the posterior, lateral, and septal walls was significantly longer compared to the basal and middle segments of the anterior-septal and septal walls (see heatmap Figure S3 in Supplements). As for the peak S, no significant correlation was found between peak G and the time to peak G.
Compared with the global median time to peak G, statistically longer times were observed in the lateral wall segments at the middle and apical levels and the septum at the apical level. The anterior-septal wall segment at the basal level statistically earlier reached peak G than the global value (see Supplement Figure S1 panel A).
For all segments, except of the apical anterior segment, a significant positive correlation was found between the P peak value and the G peak value. The time to peak P was positively correlated with the time to peak G except the middle posterior wall segment (see Table S5 in Supplement).
Circumferential Strain
Figure 6, Figure 7 and Figure 8 illustrate the distributions of peaks S, G, and P, as well as the time to peaks S, G, and P, relative to the location of LV segments for circumferential strain. Percentile tables of all considered parameters are provided in the Supplement Table S3.
The absolute value of peak S of circumferential strain (Figure 6) was statistically significantly greater in the anterior septal and septal walls than in the other LV walls (Sup. Figure S3 panel B).
Significantly greater absolute values of the circumferential strain were found compared to the global median in all segments of the anterior-septal wall, septum, and apical segment of the inferior wall (Sup. Figure S2 panel B). Significantly smaller absolute values compared to the global median were observed in the segments of the lateral wall, basal and medial segments of the posterior wall, and middle and apical segments of the anterior wall (Sup. Figure S2 panel B).
The time to peak S (Figure 6) for most segments did not differ statistically among themselves (Sup. Figure S3 panel B), with the exception of the basal segments of the anterior and lateral walls, where the median time to peak was minimal and significantly different from the basal segment of the inferior wall, the middle segment of the posterior wall, and the apical segments of the lateral, posterior, and inferior walls (Sup. Figure S3 panel B). For circumferential strain, no significant correlation was found between peak S and the time to peak S (Sup. Table S4).
In more than half of the subjects in the study group, the peak P value in the circumferential direction was equal to 0 in the segments of the anterior-septal wall and septum. The maximum median values were observed at the basal, middle, and apical levels in the segments of the anterior wall (Figure 7, Sup. Table S3). Significantly higher peak P values compared to the global median were observed in the anterior, lateral, and posterior segments, while a significantly lower peak P value was observed in the middle segment of the septum (Sup. Figure S2 panel B).
The time to peak P was significantly longer than the global median in the anterior wall segments, the basal segments of the lateral wall and septum, and the middle and apical segments of the anterior-septal wall, while the time to peak was significantly shorter than the global median in the posterior and inferior wall segments (sup. Figure S2 panel B).
In the circumferential direction, we did not find a significant correlation between peak P value and the time to peak P. A significant positive correlation was found between peak P and S values in all segments except the basal and middle septal segments (see Table S5 in the Supplement). The time to peak P was positively correlated with the time to peak P in the basal and apical segments of the inferior wall and in the middle and apical segments of the posterior wall (sup. Table S5).
As for longitudinal strain, a significant positive correlation was found between peak S and peak G, time to peak S and time to peak G for all LV segments (Sup. Table S4).
Similarly to the peak S in the circumferential direction, the absolute value of the peak G was statistically significantly greater for the anterior-septal and septal wall compared to other LV walls (Fig.8). However, the time to peak G in the segments did not differ significantly, with the exception of the basal segment of the lateral wall, where the time to peak was minimal compared to other segments.
No significant correlations were found between peak G and the time to it (see Table S4 in the Supplement).
Longitudinal strain in the cardiac cycle was significantly higher compared to circumferential strain in most LV segments, except in the basal segments of the lateral, inferior wall, and basal and mid-septal segments, where no significant differences were found. The only basal segment of the anterior-septal wall had significantly lower longitudinal strain compared to circumferential strain (see Supplement Table S6). The time to reach the longitudinal strain peaks was significantly longer than the time to reach the circumferential strain peaks, except for the anterior-septal, inferior, and septal segments, where the time was not significantly different (see Supplement Table S6).
Radial Strain
Figure 9 shows the distributions of peak G and time to peak G relative to LV wall location for radial strain. The Supplement provides percentile tables of the parameters under consideration.
Peak G demonstrated statistically significantly greater values of radial strain in the septal wall compared to other LV walls (fig. 9). Compared to the global median, significantly greater values were observed in all segments of the septum, basal and middle segments of the inferior wall, and apical segment of the anteroseptal wall. The time to peak G in the radial direction did not differ significantly between segments and did not differ significantly from the global median time to peak G.
4. Discussion
The complex geometry and structure of the human LV are closely related to the spatio-temporal sequence of its electrical activation and regional contraction, which is necessary for an effective pumping function. It has been shown that the spatio-temporal dynamic change in the LV configuration during the heart cycle plays a significant role in regulating the mechanical and pumping function of the LV [11]. In an adult population, a significant change in the regional function of the LV has been demonstrated in heart disease, and assessing the regional features of LV deformation can be important for the diagnosis, prognosis, and treatment of various heart disease [12,13].
Research on the deformation of heart chambers using the STE method in premature infants during the early neonatal period is scarce. The sources we found in global scientific publications only provide values for global strain, most often GLS. In addition, only one study evaluated the more accurate (from three apical views) global longitudinal strain of the LV [5], while other studies used only a four-chamber view [6,14,15,16,17]. There are also few studies that obtained parameters in the first 72 hours of life in premature infants weighing less than 1500 g [5,14,16].
We decided to study segmental strain in more detail and establish a range of reference values, including because our research group had previously recorded cases of wall akinesia/hypokinesia (visual assessment) in premature infants with preserved global systolic LV function at birth, which may indicate the development of myocardial infarction. This pathology is rare in infants. The causes of myocardial infarction in infants and young children are diverse. The literature reports cases of myocardial infarction in infants with congenital heart and coronary artery abnormalities, severe perinatal hypoxia, respiratory distress syndrome, broncho-pulmonary dysplasia, and primary pulmonary hypertension. Severe hypoxia can lead to small-scale intramural infarctions, with disseminated intravascular coagulation playing a significant role in their development. The leading cause of myocardial infarction in the neonatal period may also be paradoxical umbilical vein embolism [18]. Undoubtedly, a specialized study of this group of infants is needed, which will be a further step in our research. Currently, having even basic knowledge of the reference values for segmental LV strain simplifies the diagnosis of segmental anomalies during screening echocardiography.
For the first time, we conducted a complete study of longitudinal, circumferential, and radial LV strain using the STE in extremely premature infants without signs of hemodynamic disorders in the first 72 hours of life.
In the population we examined, the GLS values, which we estimated using three apical views, were slightly lower than -16.4 (-14.5;-18.4) vs -18.4 (-14.6; -22.2) compared to the only study that also used three apical views to estimate GLS [5].
In addition to the assessment of GLS, the following longitudinal, circumferential, and radial strain characteristics were obtained: peak S, peak G, peak P, and the time to reach them in 18 segments of the LV (according to the scheme in Figure 2).
In the cohort we considered, we did not identify significant correlations of the deformation characteristics under consideration with birth weight and gestational age. A similar result was obtained in the study [5], where no statistically significant linear correlation dependence was found between birth weight, gestational age and LV GLS , free wall longitudinal strain (r=0.34 and 0.44, p > 0.1), however, such a statistically significant correlation dependence was determined for right ventricle GLS and septum LS.
We also checked whether there were any differences in the deformation parameters between infants with an open and closed arterial duct in the group under consideration. No statistically significant differences were found in the deformation characteristics, which can be explained by the absence of volume overload in the pulmonary circulation during the first few days of life due to increased pulmonary vascular resistance.
Longitudinal shortening of myocardial fibers contributed more to LV contraction than circumferential shortening. This was because the value of longitudinal strain peaks and the time to reach them were significantly greater than those of circumferential strain for most LV segments.
The apical segments exhibited significantly greater strain in the longitudinal direction than in the circumferential direction. The basal segments of the inferior and septal walls, as well as the middle septum, underwent uniform deformation in the longitudinal and circumferential directions. The only exception was the basal segment of the anterior-septal wall, which underwent greater circumferential strain.
Segmental longitudinal strain was heterogeneous, with significant quantitative differences in the contribution of different LV segments to global LV longitudinal deformation. The longitudinal strain of the apical segments exceeded the global value, whereas the strain of the basal and middle septal segments was significantly lower.
We revealed a gradient of longitudinal strain from the base to the apex of LV. Thus, statistically significant lower absolute values of peak S and G were observed in most basal segments compared to middle and apical segments. In contrast, the apical segments demonstrated statistically significant higher absolute values of peak S and G. Similar results were described in the work of Levy PT et al. [5], in which the longitudinal strain of the interventricular septum, LV free wall, and right ventricular free wall was studied. They showed that, in children, there was a positive gradient of longitudinal strain from the base to the apex of the LV; that is, LV strain was most pronounced in the apical region compared to the base. This gradient presumably arises from the convergence of the right-sided and left-sided spirals of myocardial fibers in the subendocardium and subepicardium, respectively, toward the apex of the heart. This formation is known as a "double helix loop vortex." Additionally, the apex has a thinner wall and greater curvature than the middle and base regions of LV, resulting in higher stress in the apical region compared to other LV regions [5].
The positive peak P of longitudinal strain, which characterizes regional prestretching at the onset of systole, differed significantly for segments of the lateral and posterior walls from the global peak P characteristic and the median zero value observed in the basal segments of the anteroseptal and septal walls of the left ventricle (LV). Furthermore, a significant positive correlation was found between peak P value and time to reach it. In other words, the lateral and posterior wall segments were prestretched to a greater extent and for a longer period compared to other LV segments. Accordingly, shortening in these regions began later.
Additionally, a significant positive correlation was found for most segments between the time to peak P and the time to peak S and G. In other words, the lateral and posterior wall segments underwent longer prestretching and began to shorten later than the other regions. These segments reached their peak longitudinal strain later. The strain of lateral and posterior wall segments at each level (MV, PM, and AP) was smaller than in other segments at the same level. In other words, segments that were prestretched earlier tended to reach peak strain earlier and at a greater magnitude than segments that reached peak strain later. This statistically significant relationship was established in full-term neonates using functional geometry methods [19].
Compared to other segments of the LV and the global strain characteristic, the anterior-septal and septal segments exhibited greater strain value in the circumferential direction. However, the time to peak strain in these segments did not differ significantly. The median value of early systolic elongation (peak P) in the anterior-septal and septal segments was zero. In other words, in the circumferential direction and in the absence of prestretch, greater strain peaks were reached in the same amount of time as in other segments of the LV. This is consistent with the fact that, during LV activation, the septum is activated more uniformly over time due to the presence of the conduction system [11].
In the radial direction, the anterior-septal, septal, and inferior wall segments were identified as the areas with the greatest LV wall thickening. In other words, the septal and anterior-septal wall segments thicken and develop greater tension in the circumferential direction during systole compared to other LV segments.
Thus, this study examined the patterns of segmental, circumferential, and radial LV strain in extremely preterm infants without hemodynamic disturbances during the first 72 hours of life.
5. Conclusions
This is the first study to examine, describe patterns and establish the reference values of longitudinal, circular, and radial LV strain in extremely premature infants without hemodynamic disorders during the first 72 hours of life using STE.
Further research should focus on standardizing values and studying the long-term prognosis in children with altered strain parameters.
Limitation
Performing STE in this group of children is challenging due to their small body surface area, motor activity, lack of conscious interaction, and high heart rate. Two children were excluded from the group because we were unable to evaluate their STE parameters.
Author Contributions
Conceptualization, Tatiana Chumarnaya, Evgeniya Gusarova and Olga Solovyova; Data curation, Tatiana Chumarnaya; Investigation, Tatiana Chumarnaya and Evgeniya Gusarova; Methodology, Tatiana Chumarnaya, Evgeniya Gusarova and Svetlana Koltashova; Project administration, Natalya Kosovtsova; Resources, Evgeniya Gusarova; Supervision, Olga Solovyova; Visualization, Tatiana Chumarnaya; Writing – original draft, Tatiana Chumarnaya and Evgeniya Gusarova; Writing – review & editing, Natalya Kosovtsova, Svetlana Koltashova and Olga Solovyova.
Funding
The research funding from the Russian Science Foundation and the Government of the Sverdlovsk is gratefully acknowledged (Contract No. 24-25-20110.).
Institutional Review Board Statement
The study protocol was approved by the Ethics Committee of Federal State Budgetary Institution Research Institute of OMM of the Ministry of Health of Russia (Protocol № 16, date of approval: 6 September 2023).
Informed Consent Statement
Informed consent was obtained from all subjects involved in the study.
Data Availability Statement
The raw data supporting the conclusions of this article will be made available by the authors on request. The data are not publicly available due to privacy.
Acknowledgments
Supported by grant from the Russian Science Foundation and the Government of the Sverdlovsk Region No. 24-25-20110.
Conflicts of Interest
The authors declare no conflicts of interest.
Abbreviations
The following abbreviations are used in this manuscript:
| LV | Left ventricular |
| STE | Speckle-tracking echocardiography |
| RV | Right ventricular |
| GLS | Global longitudinal strain |
| MV | Mitral valve |
| PM | Papillary muscles |
| AP | Apical |
| SL | Longitudinal strain |
| SC | Circumferential strain |
| SR | Radial strain |
| Ant | Anterior |
| Lat | Lateral |
| Post | Posterior |
| Int | Inferior |
| Sept | Septal |
| AntSept | Anterio-septal |
| FDR | False discovery rate |
| ICC | Intraclass correlation coefficient |
| CV | Coefficient of variation |
| 4CH | 4-chamber |
| 2CH | 2-chamber |
| APLAX | Along the long axis of the left ventricle |
References
- Gritsenko, O.V.; Chumakova, G.A.; Trubina, E.V. Possibilities of speckle tracking echocardiography for the diagnosis of myocardial dysfunction // CardioSomatika 2021, 12(1), pp. 5–10. [CrossRef]
- Tyurina, L.G.; Khamidova, L.T.; Ryubalko, N.V.; Koltashova, S.A.; Kislukhina, E.V.; Gazaryan, G.A. Potential of speckle tracking echocardiography with the assessment of left ventricle myocardial work in predicting coronary artery disease in non-ST-segment elevation acute coronary syndrome. Medical Alphabet 2024, (14), pp. 33–42. (In Russ.) . [CrossRef]
- Pavlyukova, E.N.; Kolosova, M.V.; Neklyudova, G.V.; Karpov, R.S. Left ventricular mechanics in premature infants. Human Physiology, 2023, 49(2), pp. 108–122. [CrossRef]
- El-Khuffash, A.; Schubert, U.; Levy, P.T.; Nestaas, E.; de Boode, W.P.; European Special Interest Group ‘Neonatologist Performed Echocardiography’ (NPE). Deformation imaging and rotational mechanics in neonates: a guide to image acquisition, measurement, interpretation, and reference values. Pediatr. Res. 2018, 84(Suppl 1), pp. 30–45. [CrossRef]
- Levy, P.T.; El-Khuffash, A.; Patel, M.D.; Breatnach, C.R.; James, A.T.; Sanchez, A.A.; Abuchabe, C.; Rogal, S.R.; Holland, M.R.; McNamara, P.J.; Jain, A.; Franklin, O.; Mertens, L.; Hamvas, A.; Singh, G.K. Maturational patterns of systolic ventricular deformation mechanics by two-dimensional speckle-tracking echocardiography in preterm infants over the first year of age. J. Am. Soc. Echocardiogr. 2017, 30(7), pp. 685–698.e1. [CrossRef]
- de Waal, K.; Phad, N.; Lakkundi, A.; Tan, P. Cardiac function after the immediate transitional period in very preterm infants using speckle tracking analysis. Pediatr. Cardiol. 2016, 37(2), pp. 295–303. [CrossRef]
- Bussmann, N.; Franklin, O.; McCallion, N.; McNamara, P.J.; El-Khuffash, A. The impact preload on left ventricular three-plane deformation measurements in extremely premature infants. Early Hum. Dev. 2021, 153, 105291. [CrossRef]
- Mullaly, R.; El-Khuffash, A.F. Haemodynamic assessment and management of hypotension in the preterm. Arch. Dis. Child. Fetal Neonatal Ed. 2024, 109(2), pp. 120–127. [CrossRef]
- Lopez, L.; Colan, S.D.; Frommelt, P.C.; Ensing, G.J.; Kendall, K.; Younoszai, A.K.; Lai, W.W.; Geva, T. Guidelines for performing a comprehensive pediatric transthoracic echocardiogram: recommendations from the American Society of Echocardiography. J. Am. Soc. Echocardiogr. 2024, 37(2), 119–170. [CrossRef]
- GE Healthcare. Vivid E95/E90/E80, EchoPAC Software Only, EchoPAC Plugin Reference Manual, GD092161-1EN Rev.4.
- Katz AM. Physiology of the Heart. Lippincott Williams & Wilkins; 2010. p. 576. ISBN 1608311716.
- Gherbesi E, Gianstefani S, Angeli F, et al. Myocardial strain of the left ventricle by speckle tracking echocardiography: From physics to clinical practice. Echocardiography. 2024;41(1):e15753. [CrossRef]
- Antoniou N, Kalaitzoglou M, Tsigkriki L, et al. Speckle Tracking Echocardiography in Patients with Non-Ischemic Dilated Cardiomyopathy Who Undergo Cardiac Resynchronization Therapy: A Narrative Review. Diagnostics. 2024;14(11). [CrossRef]
- Nasu, Y.; Oyama, K.; Nakano, S.; Matsumoto, A.; Soda, W.; Takahashi, S.; Chida, S. Longitudinal systolic strain of the bilayered ventricular septum during the first 72 hours of life in preterm infants. J. Echocardiogr. 2015, 13(3), pp. 90–99. [CrossRef]
- Hirose, A.; Khoo, N.S.; Aziz, K.; Al-Rajaa, N.; van den Boom, J.; Savard, W.; Brooks, P.; Hornberger, L.K. Evolution of left ventricular function in the preterm infant. J. Am. Soc. Echocardiogr. 2015, 28(3), pp. 302–308. [CrossRef]
- Czernik, C.; Rhode, S.; Helfer, S.; Schmalisch, G.; Bührer, C.; Schmitz, L. Development of left ventricular longitudinal speckle tracking echocardiography in very low birth weight infants with and without bronchopulmonary dysplasia during the neonatal period. PLoS One 2014, 9(9), e106504. [CrossRef]
- Toma, D.; Făgărășan, A.; Cerghit-Paler, A.; Togănel, R.; Cucerea, M.; Săsăran, M.O.; Gozar, L. Comparative assessment of myocardial function between late premature newborns and term neonates using the 2D speckle tracking method. Front. Pediatr. 2024, 12, 1302383. [CrossRef]
- Revunenkov, G.V.; Valyalov, K.A. Echocardiography in the diagnosis of myocardial infarction in newborns. Pediatric Pharmacology,2015, 12(3), pp. 320–322.
- Chumarnaya T.V., Kraeva O.A., Tsyvian P.B., Solovyova O.E. Functional geometry of the left ventricle in term newborns with different birth weights //Human Physiology, 2018, Vol. 44, No. 5, pp. 565–573. [CrossRef]
Figure 1.
The segmental strain traces from LV of the apical four-chamber.The colored lines show the strain values from each segment. Peak P - white arrows, Peak S - red arrows, and Peak G - blue arrows. AVC - aortic valve closure. Х-axis – time(ms); Y-axis - strain (%).
Figure 1.
The segmental strain traces from LV of the apical four-chamber.The colored lines show the strain values from each segment. Peak P - white arrows, Peak S - red arrows, and Peak G - blue arrows. AVC - aortic valve closure. Х-axis – time(ms); Y-axis - strain (%).
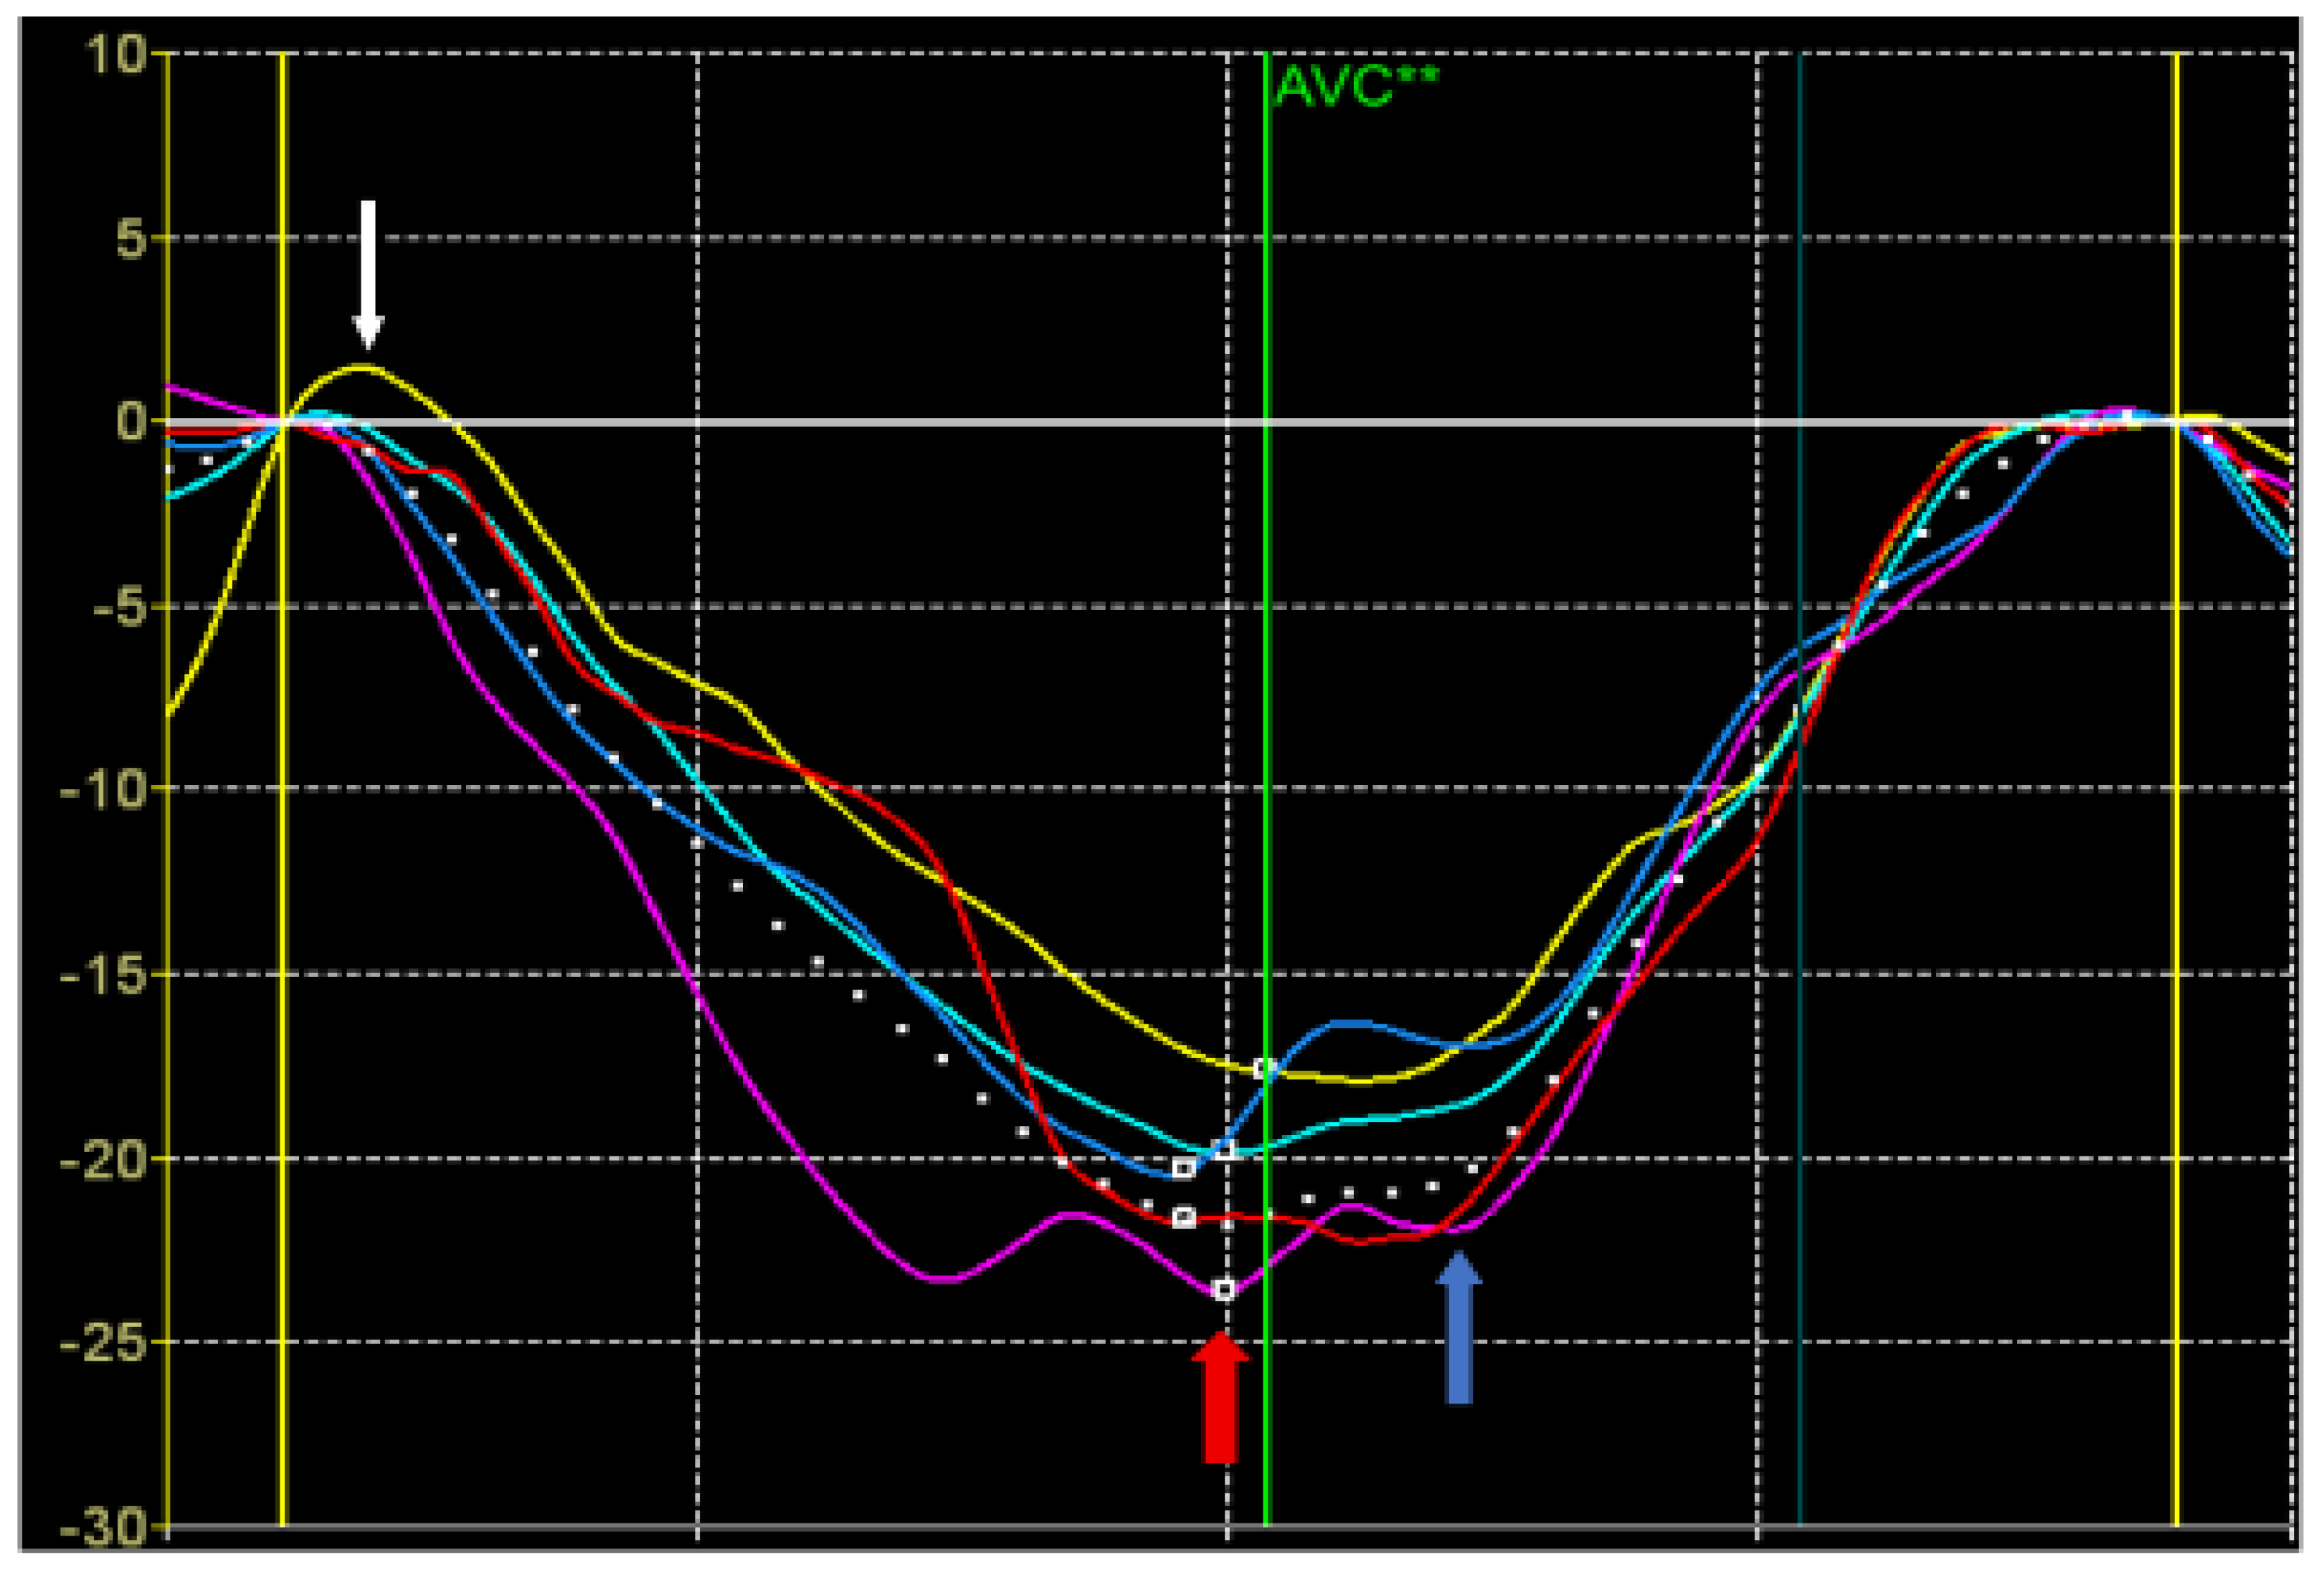
Figure 2.
18-Segment Left Ventricle Model. MV - mitral valve level, PM - papillary muscles level, AP - apical level,Ant – anterior wall, Lat – lateral wall, Post – posterior wall, Int – inferior wall, Sept – septal wall, AntSept - anterio-septal wall.
Figure 2.
18-Segment Left Ventricle Model. MV - mitral valve level, PM - papillary muscles level, AP - apical level,Ant – anterior wall, Lat – lateral wall, Post – posterior wall, Int – inferior wall, Sept – septal wall, AntSept - anterio-septal wall.
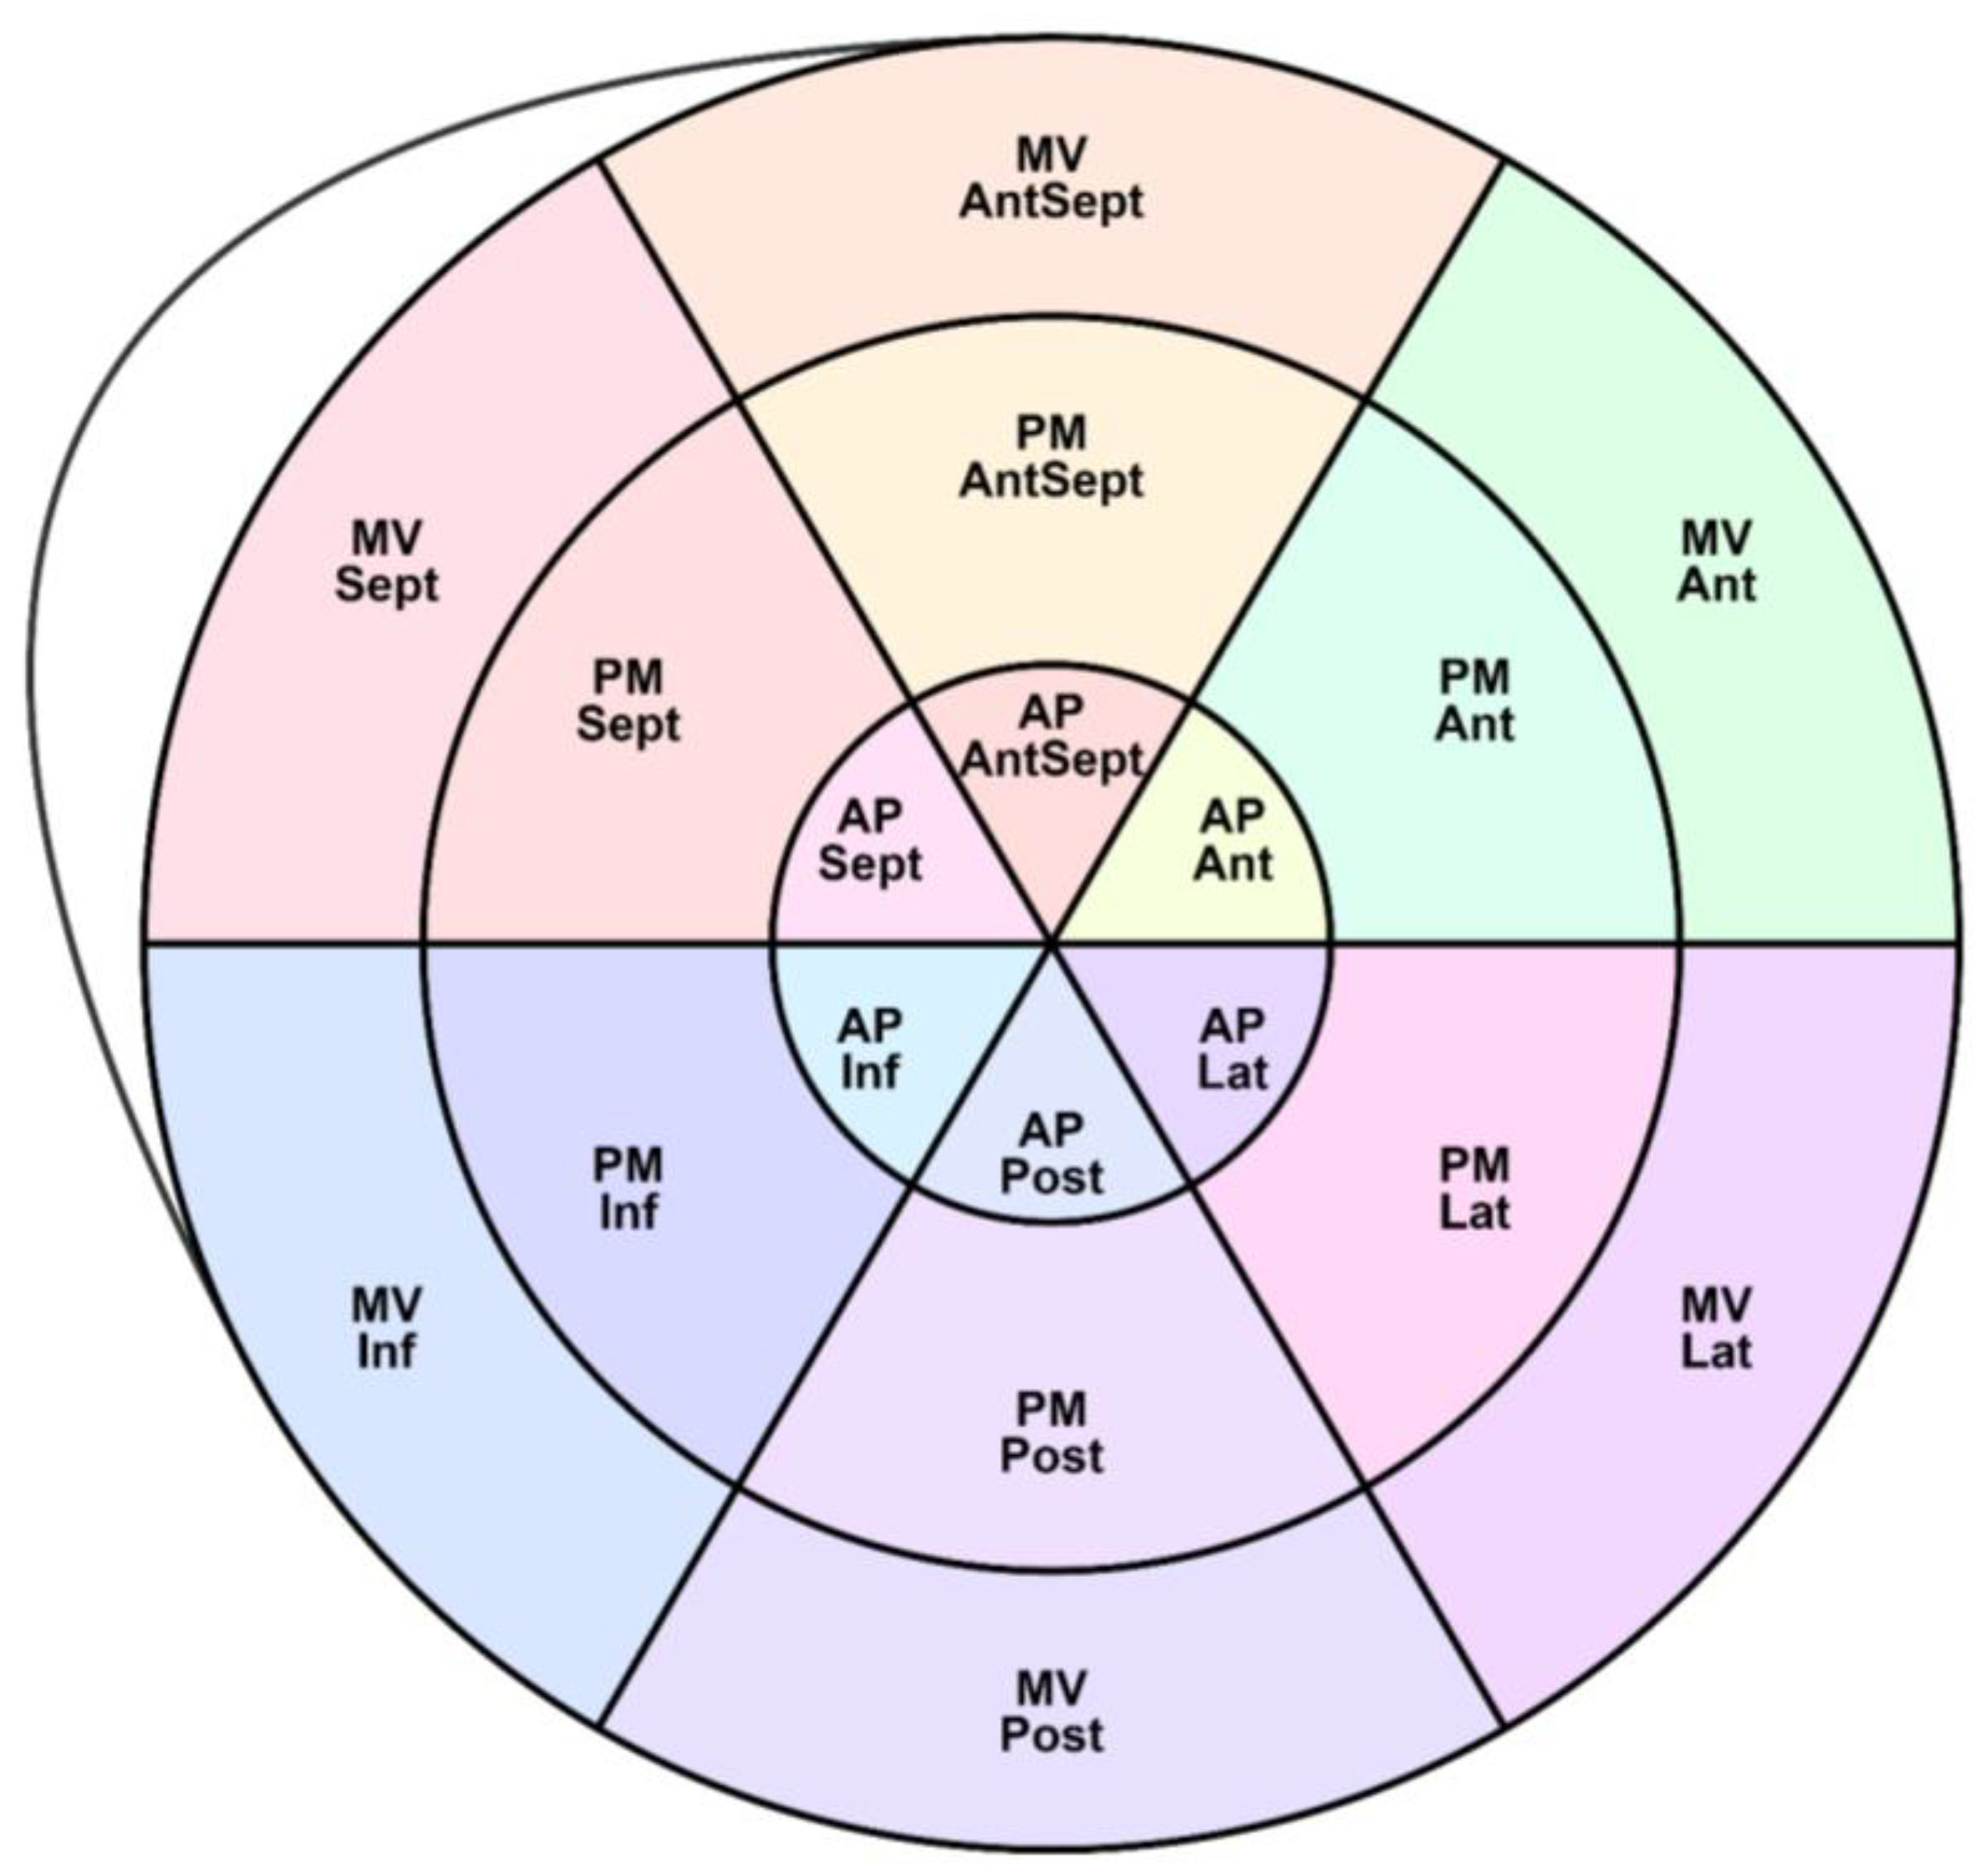
Figure 3.
Distribution of SL Peak S (top) and Time to SL Peak S (bottom) relative to LV segments.
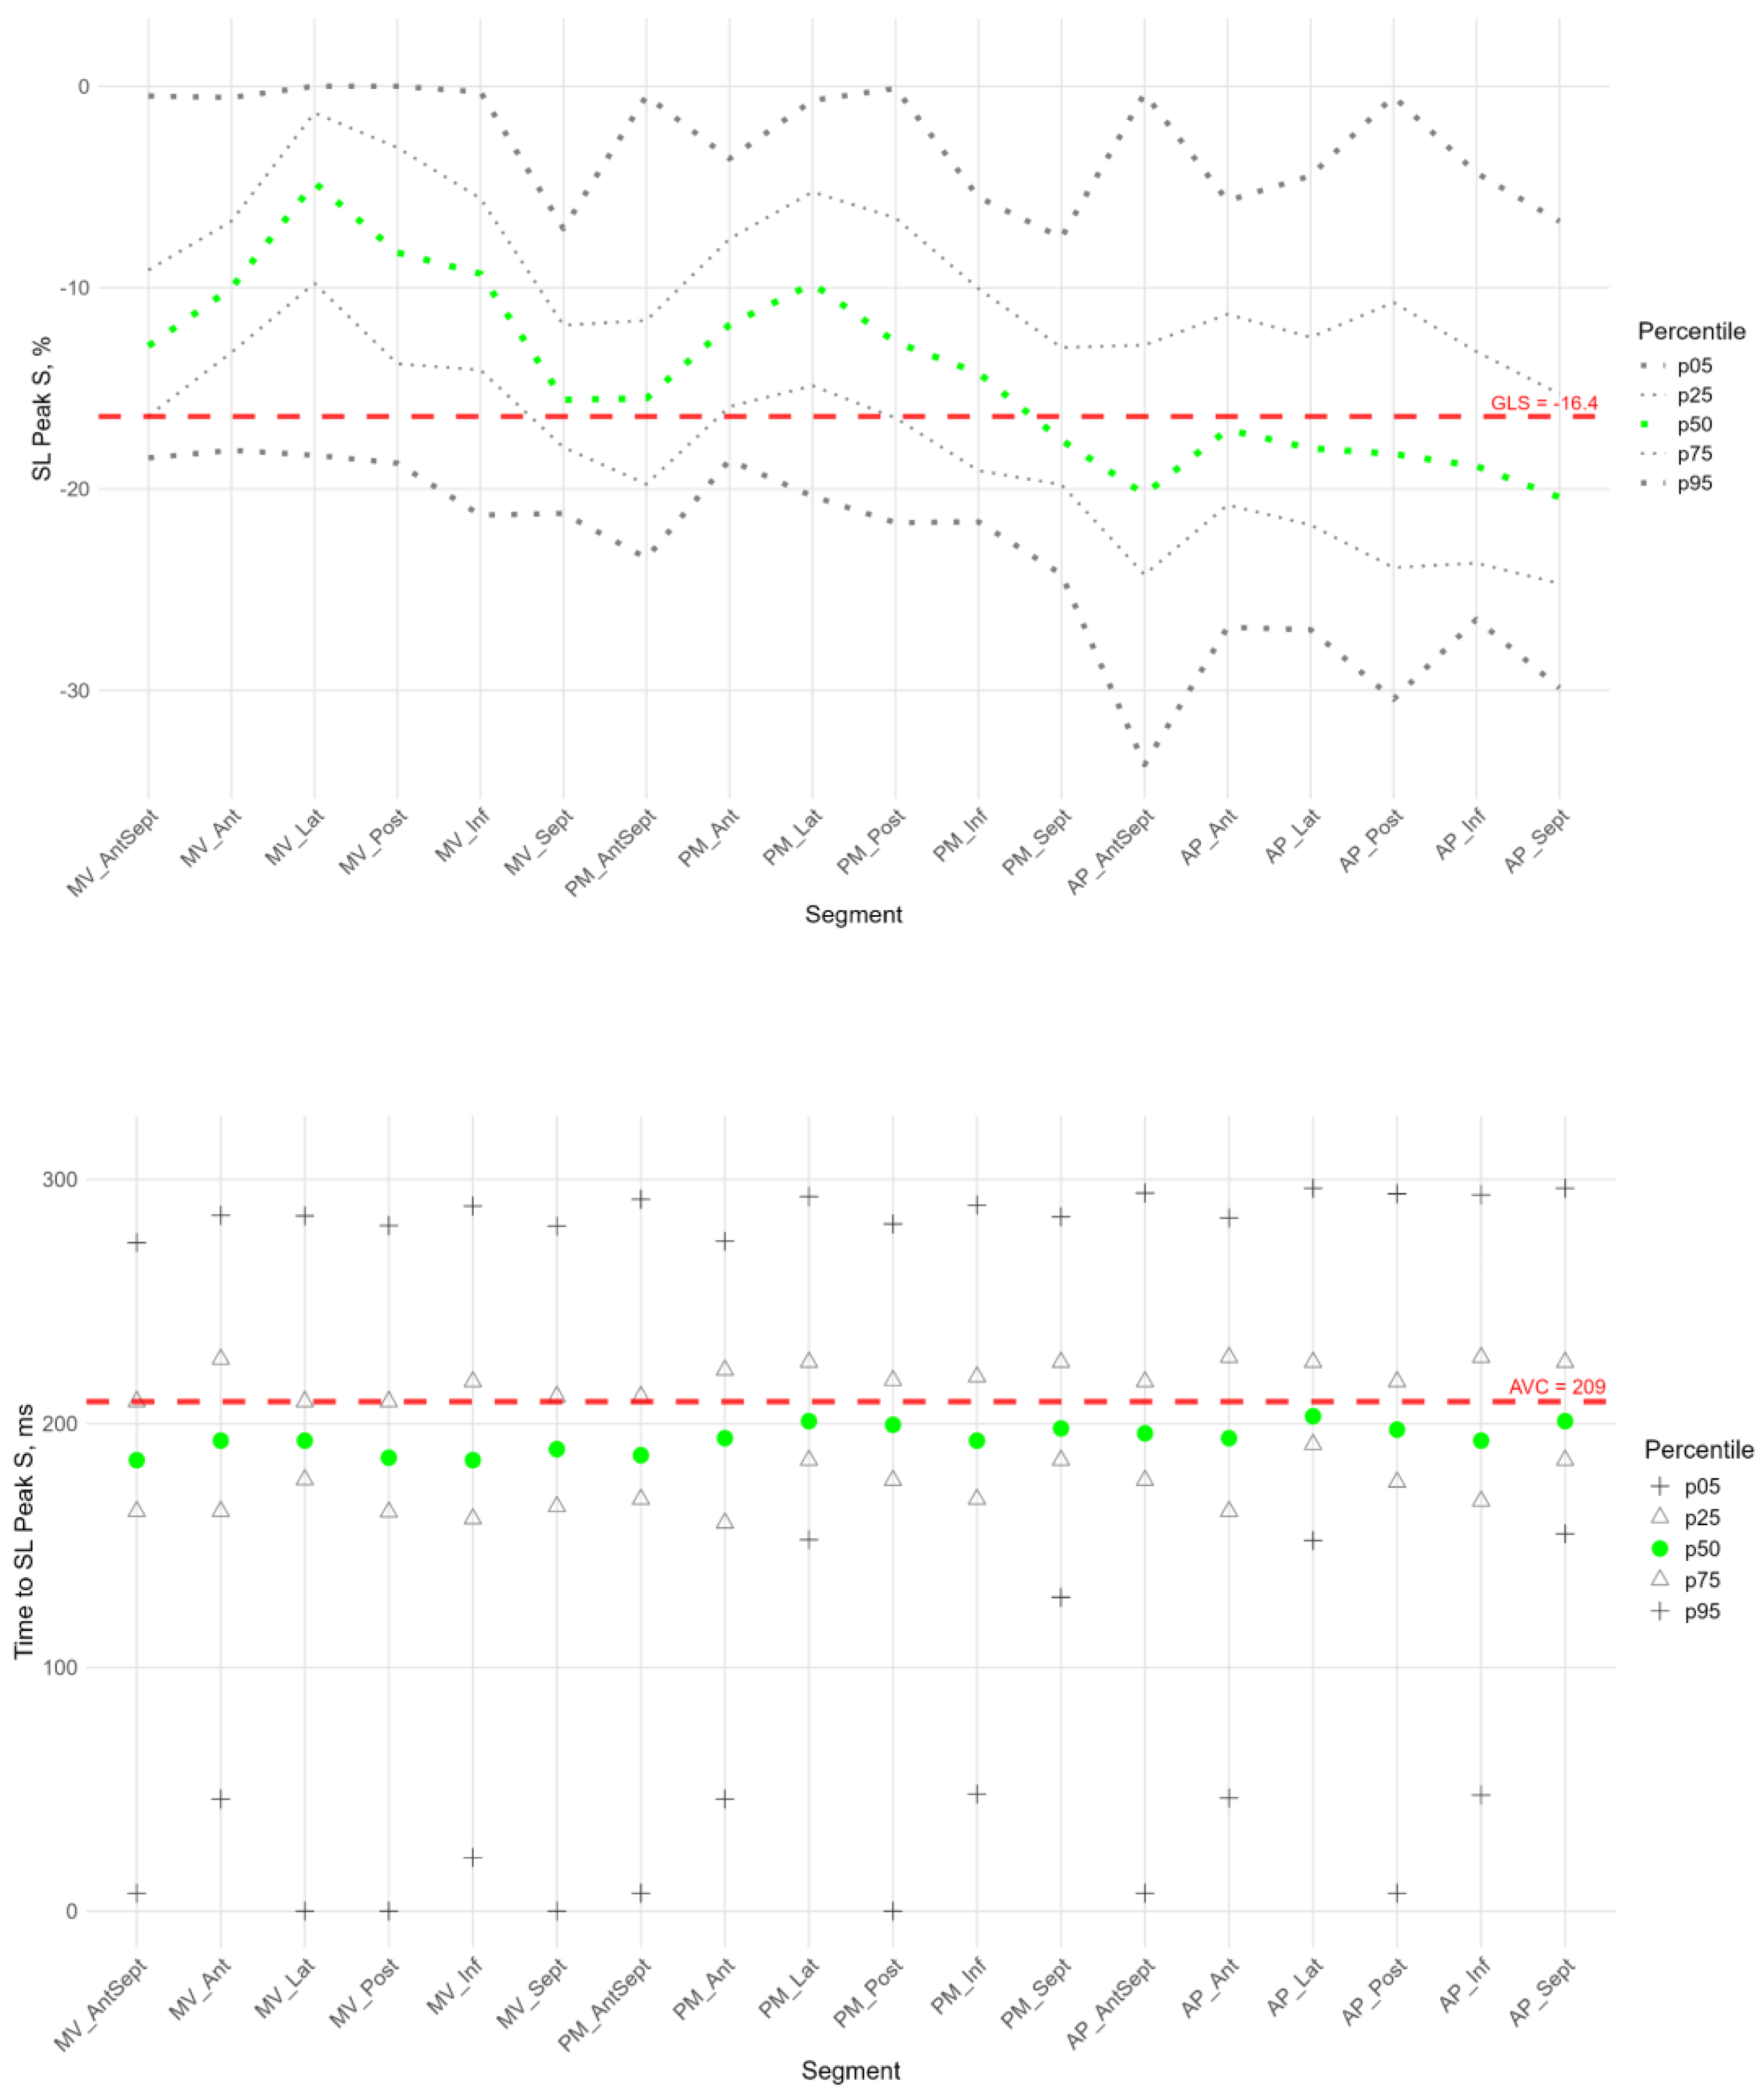
Figure 4.
Distribution of SL Peak P (top) and Time to SL Peak P (bottom) relative to LV segments.
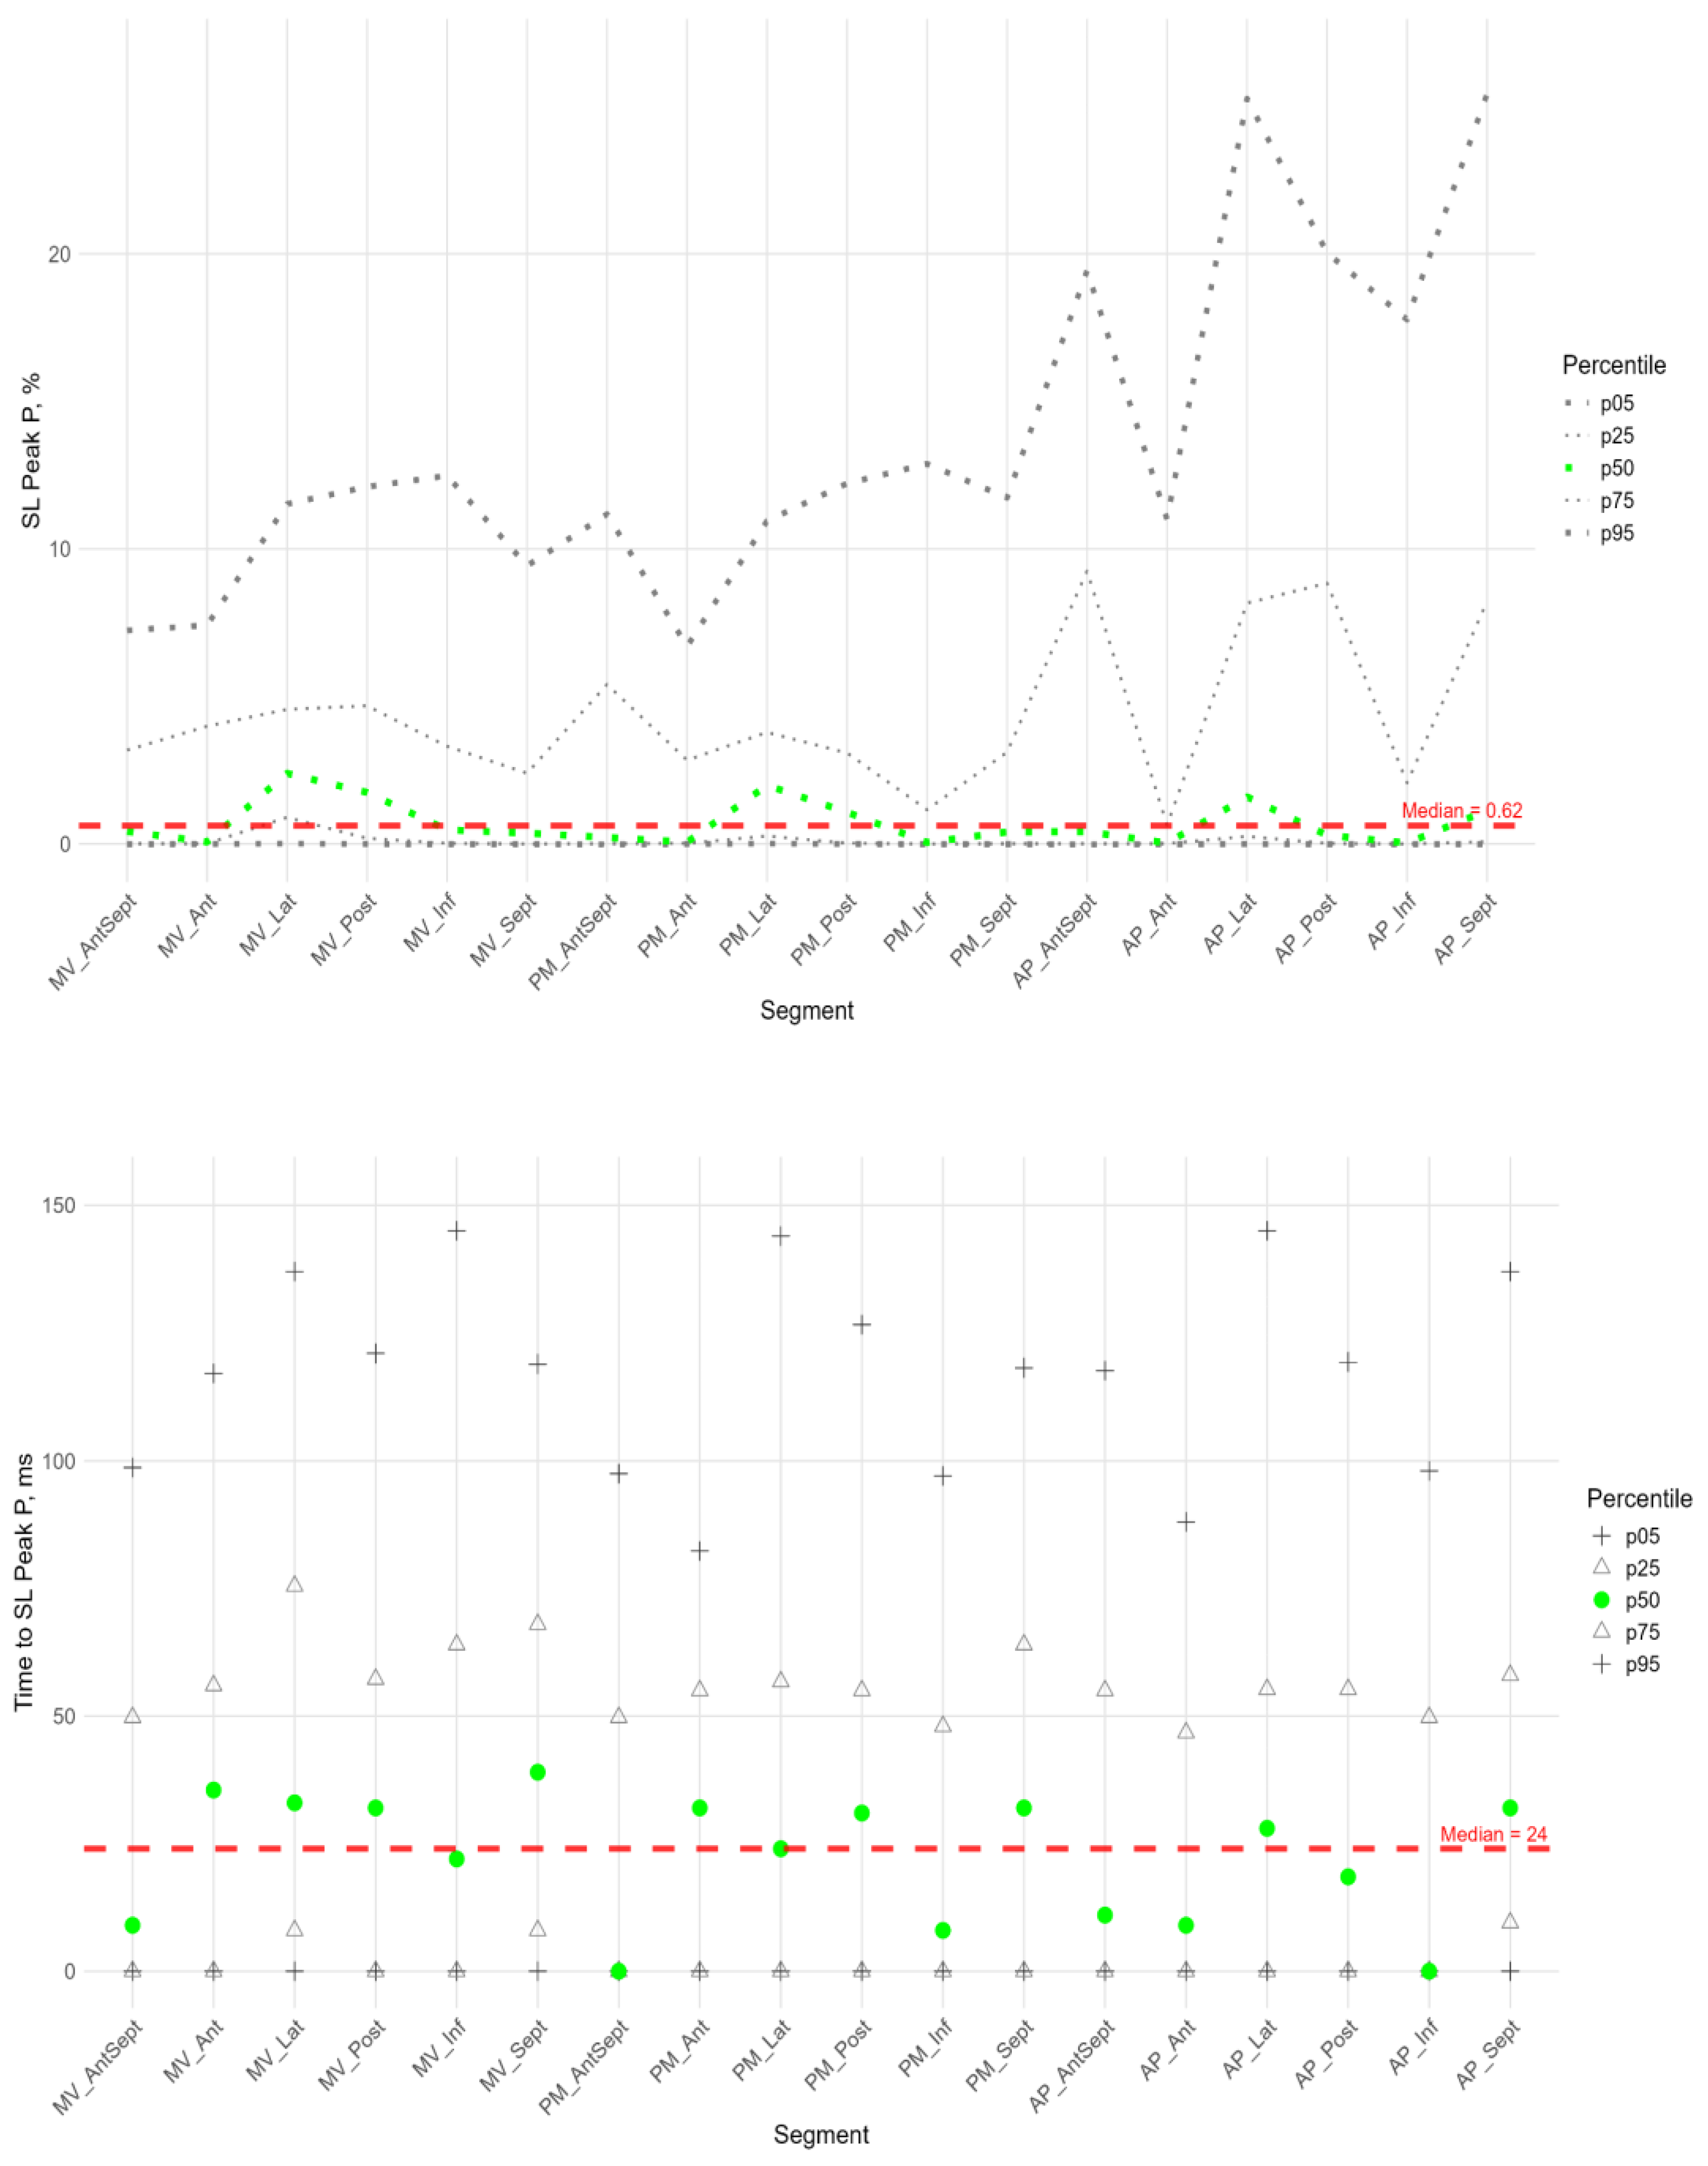
Figure 5.
Distribution of SL Peak G (top) and Time to SL Peak G (bottom) relative to LV segments.
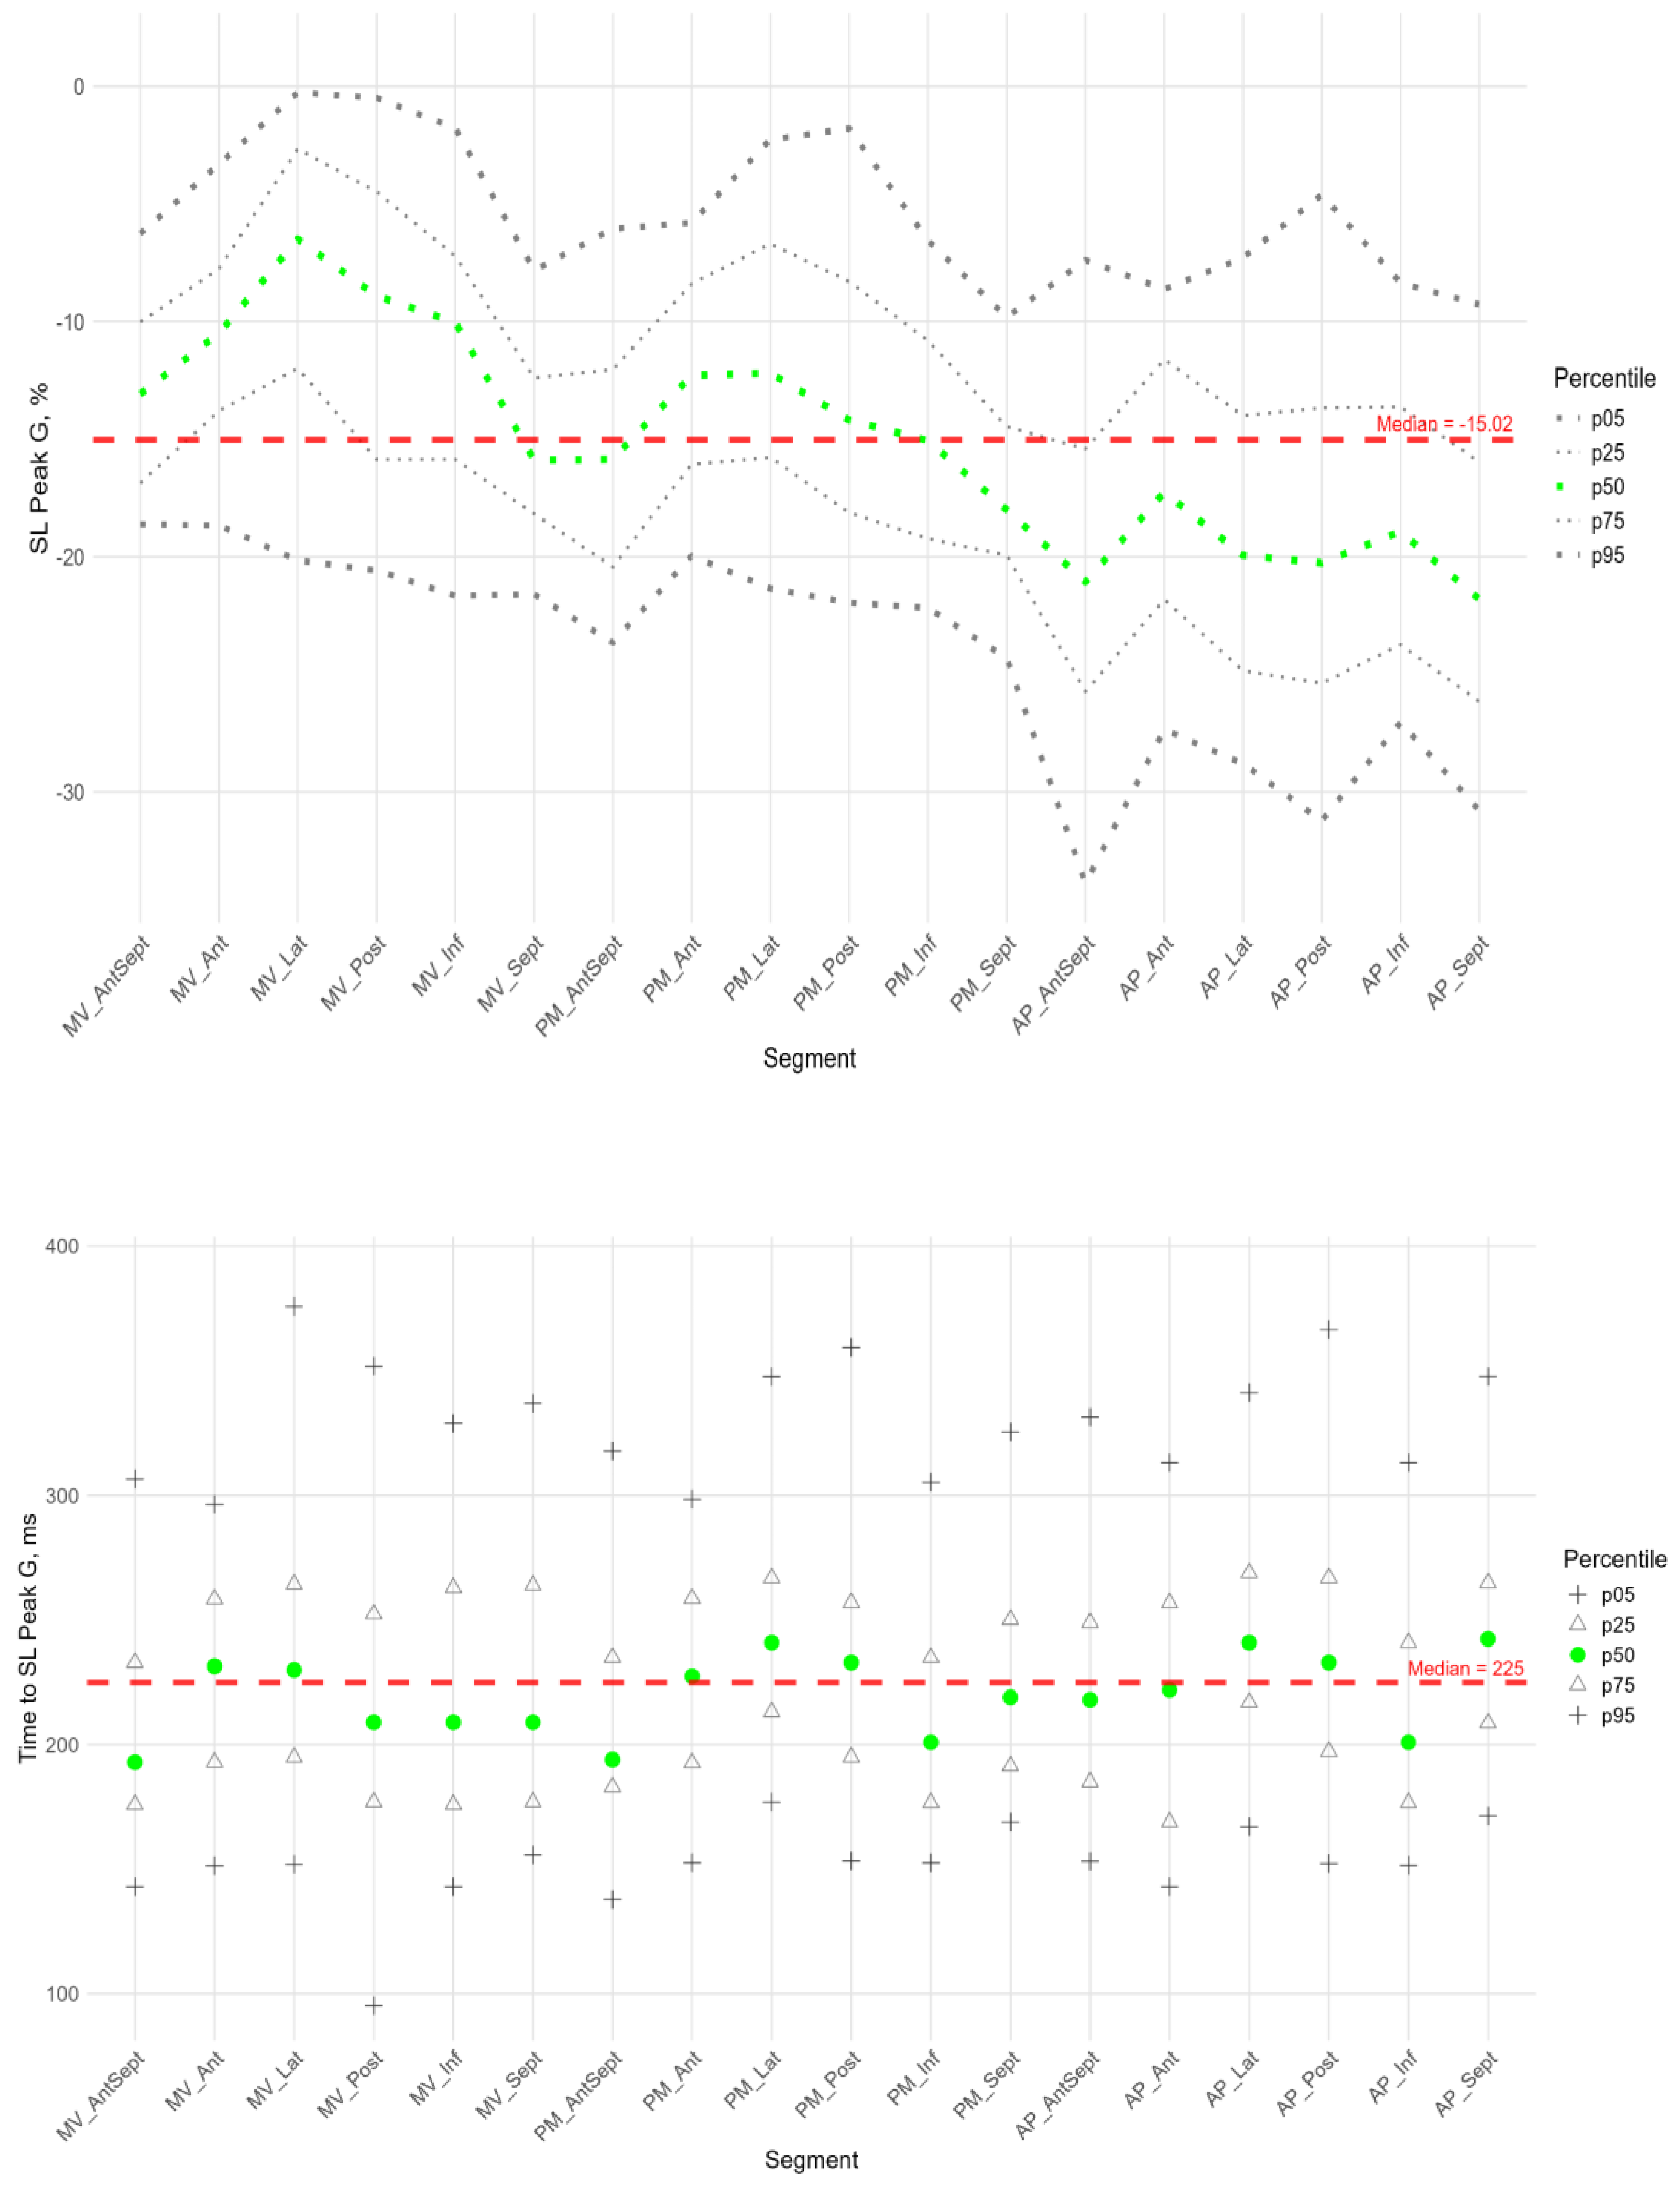
Figure 6.
Distribution of SC Peak S (top) and Time to SC Peak S (bottom) relative to LV segments.
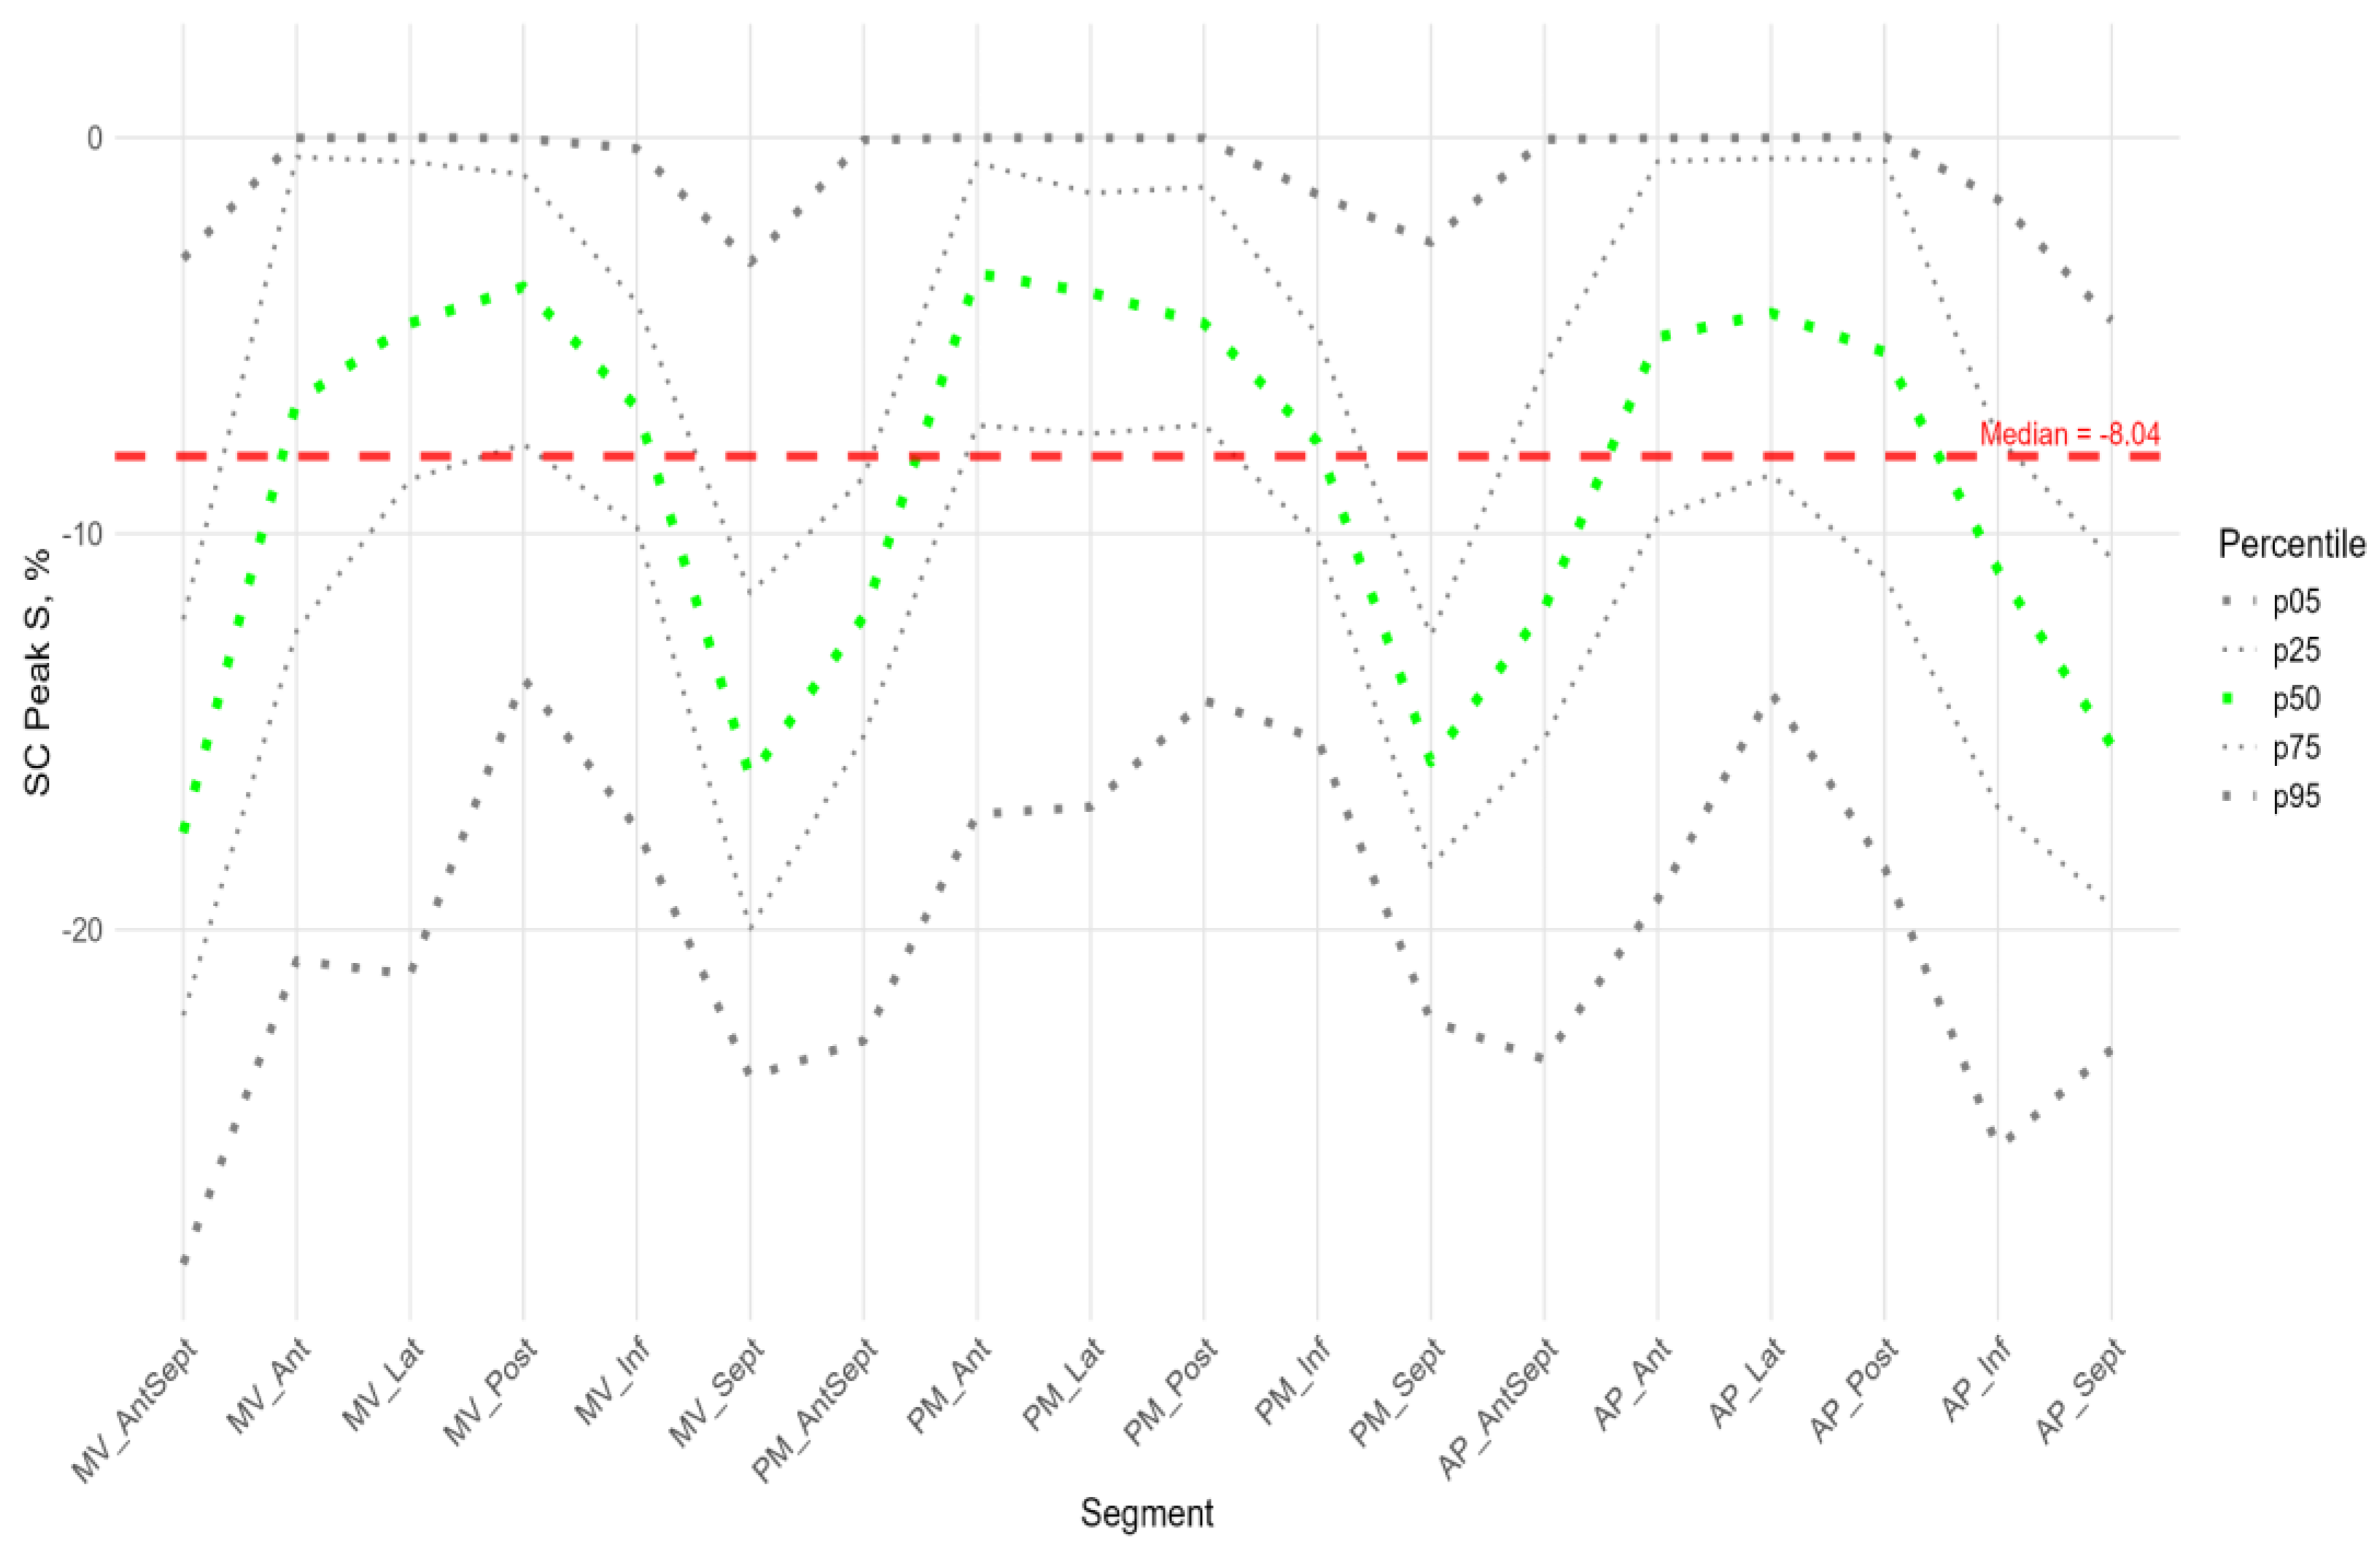
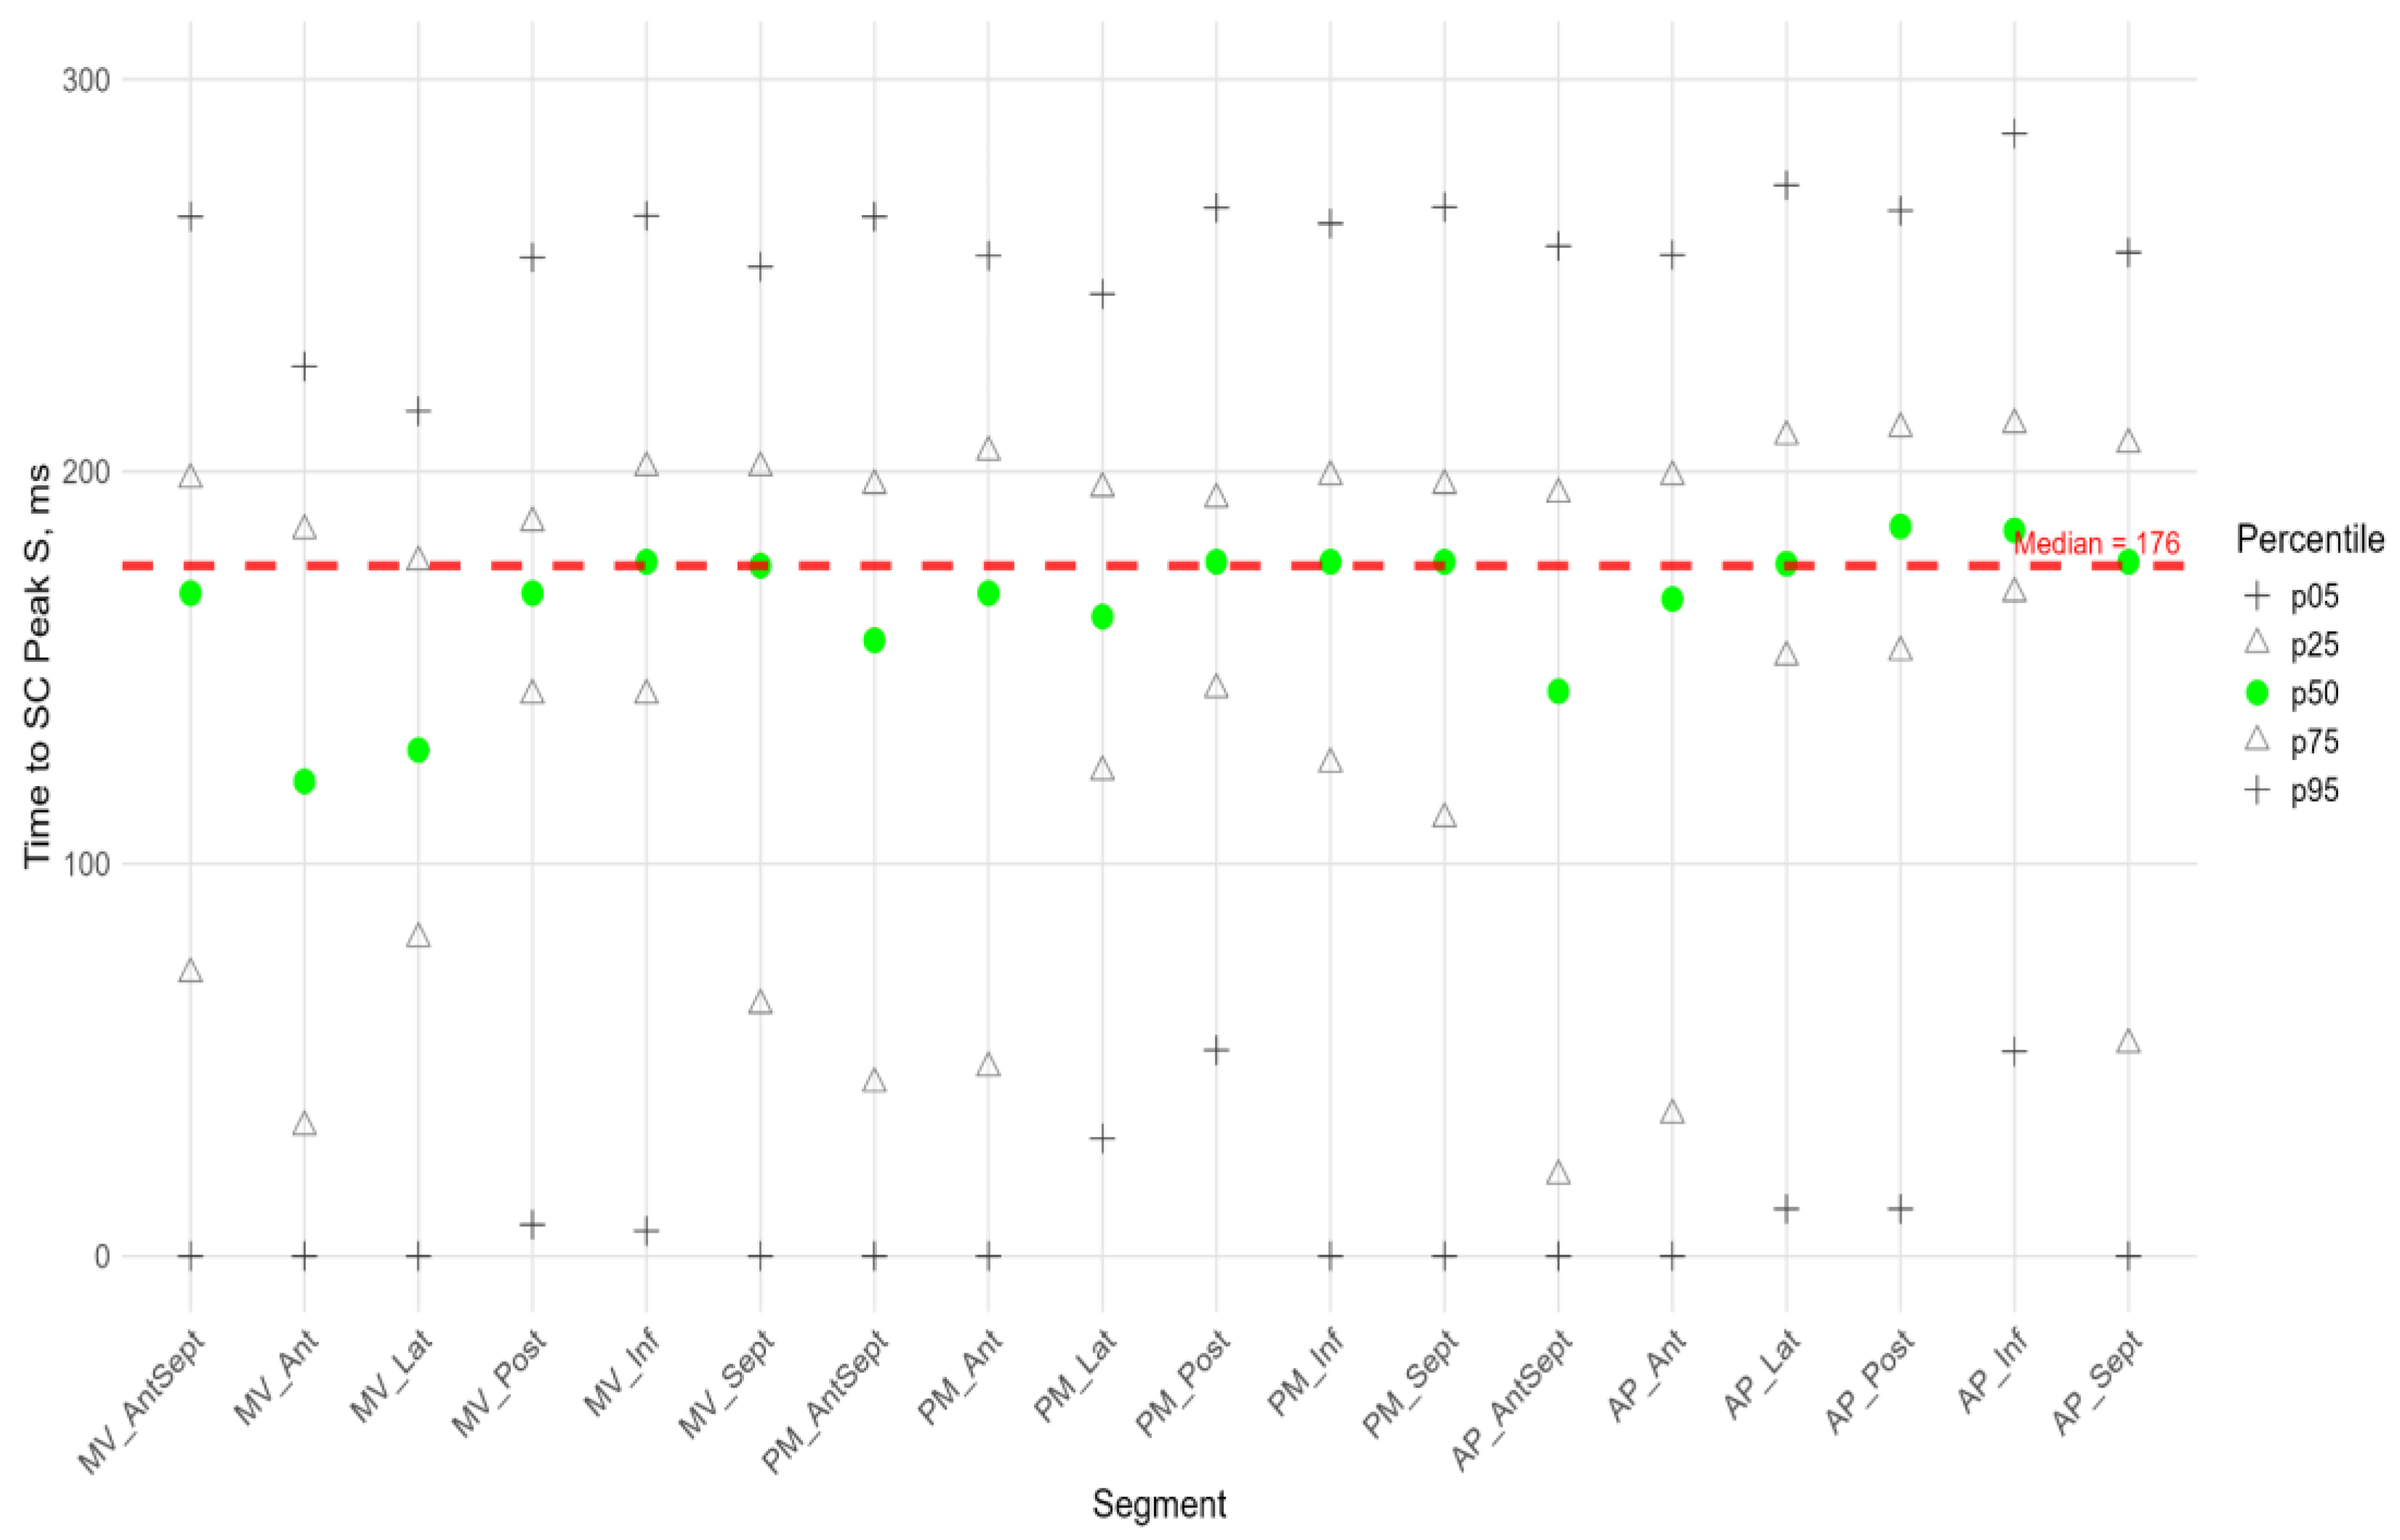
Figure 7.
Distribution of SC Peak P (top) and Time to SC Peak P (bottom) relative to LV segments.
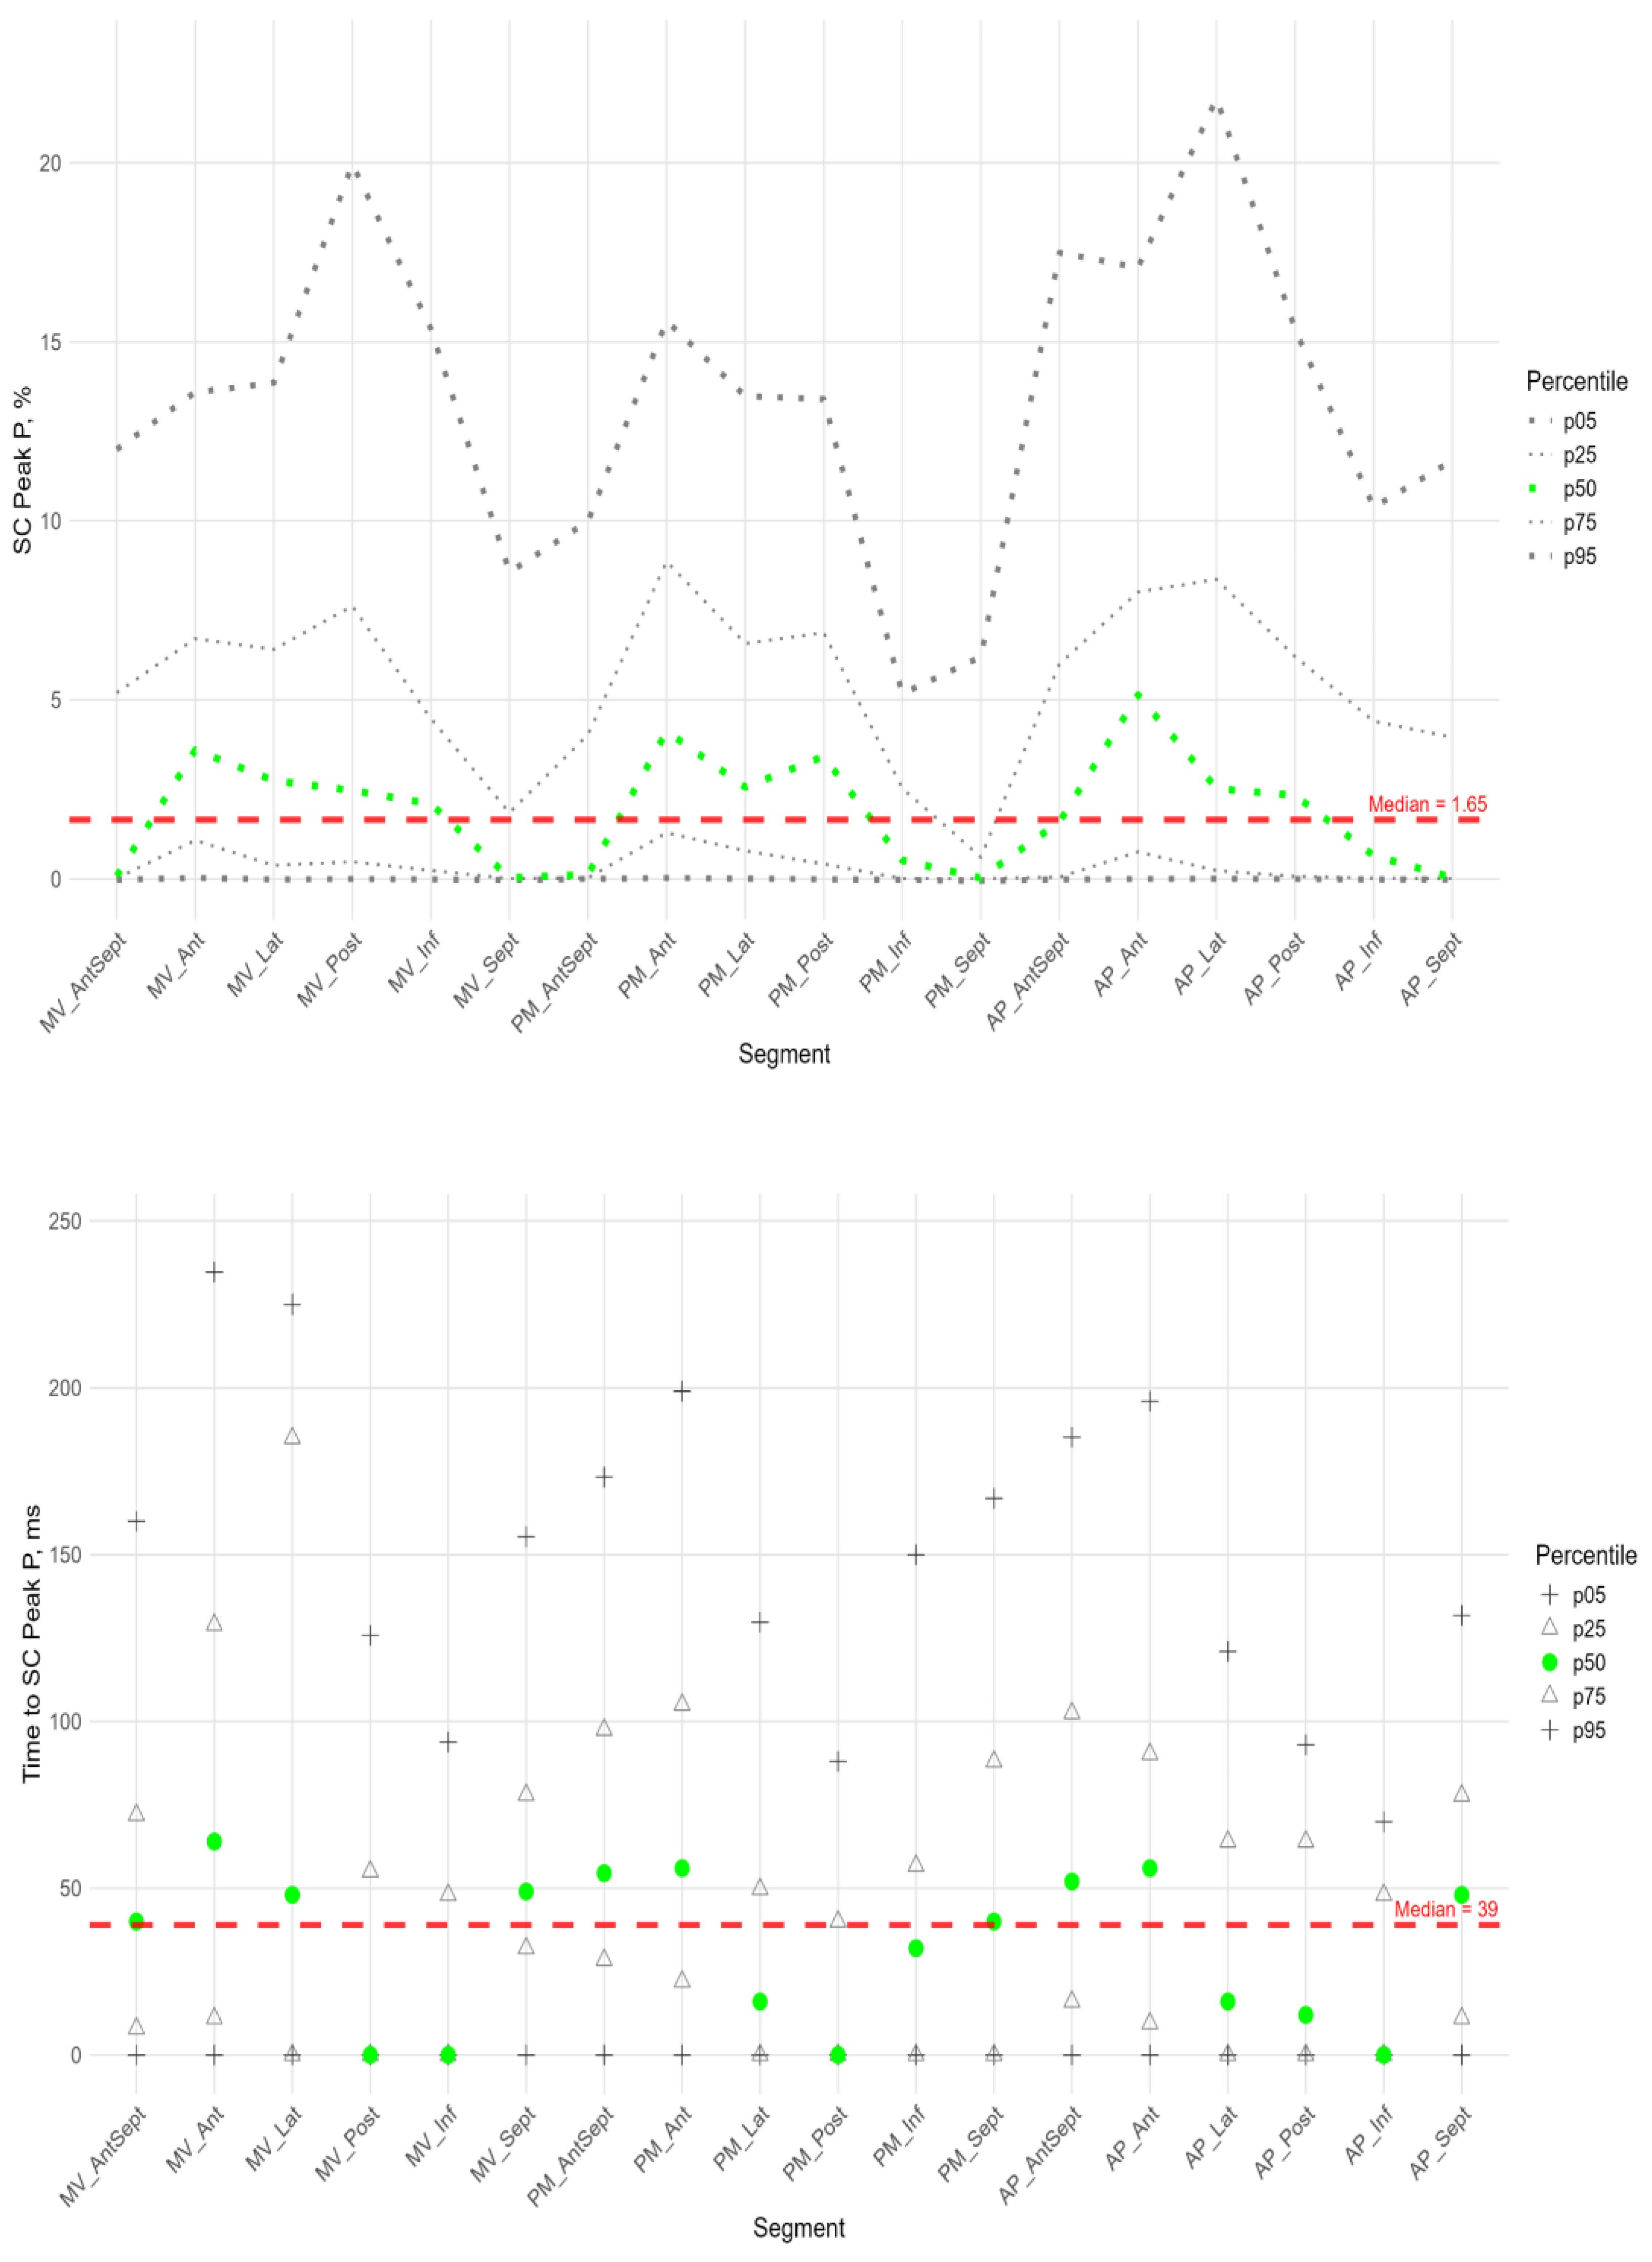
Figure 8.
Distribution of SC Peak G (top) and Time to SC Peak G (bottom) relative to LV segments.
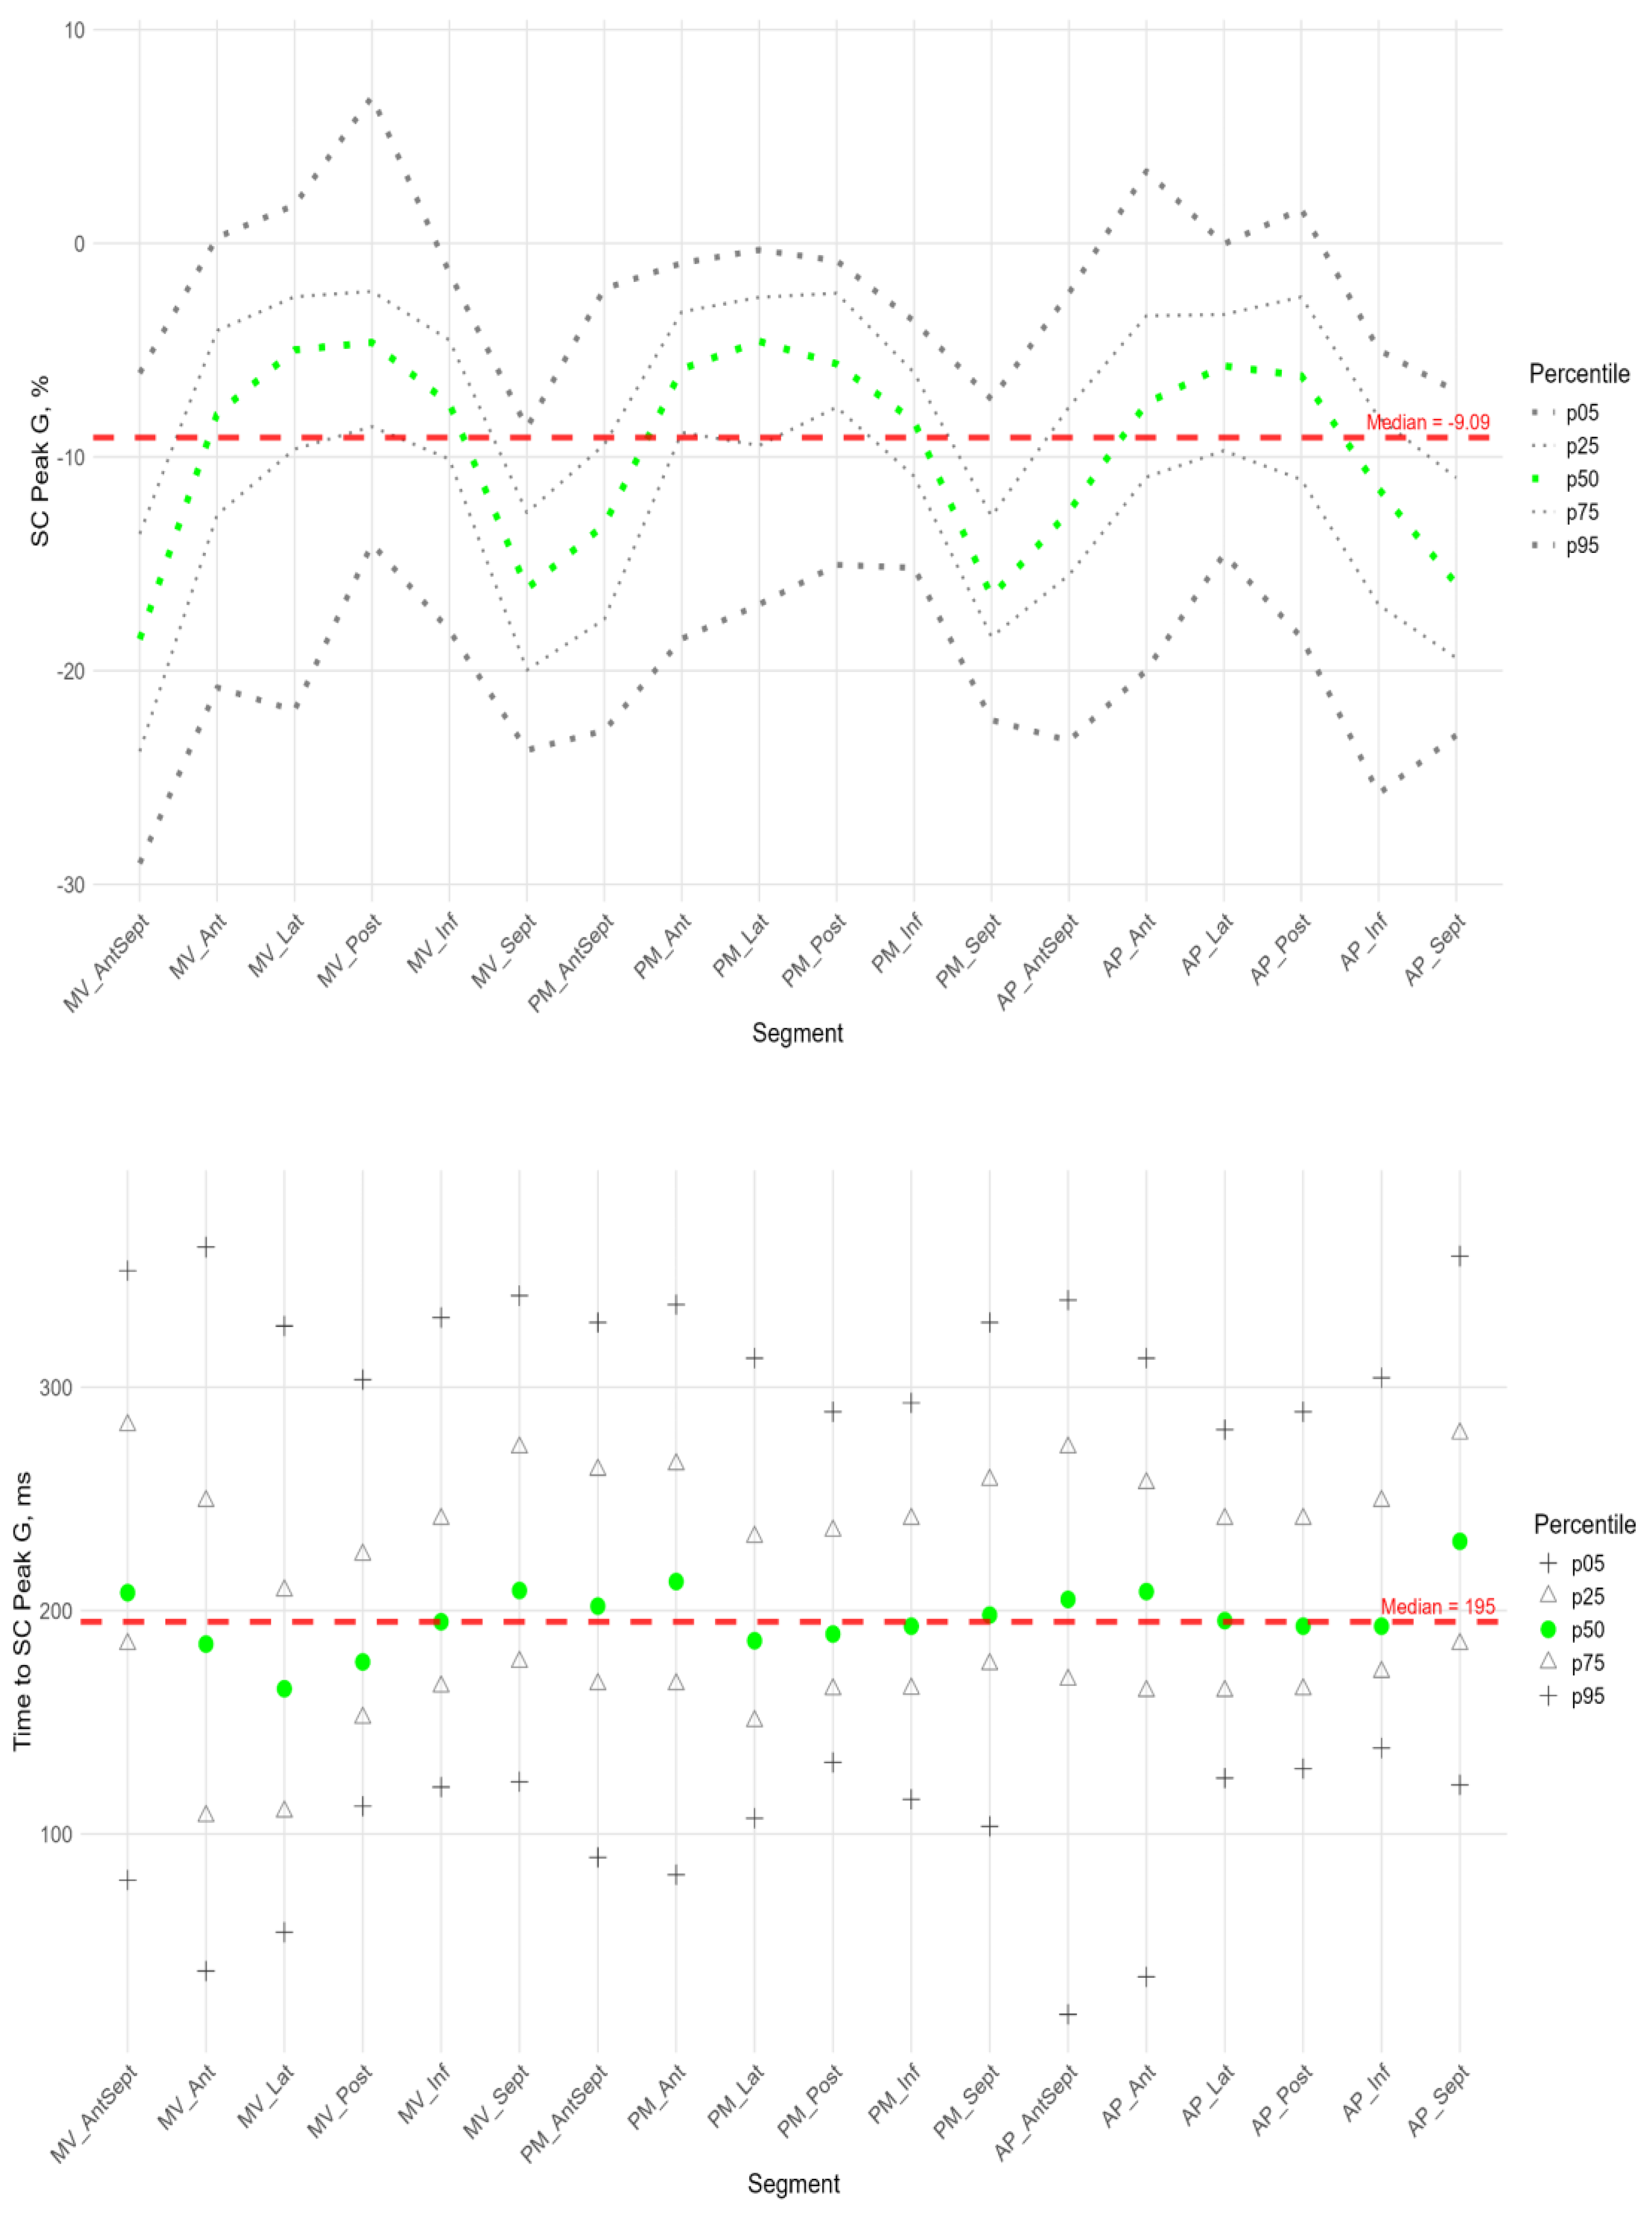
Figure 9.
Distribution of SR Peak G (top) and Time to SR Peak G (bottom) relative to LV segments.
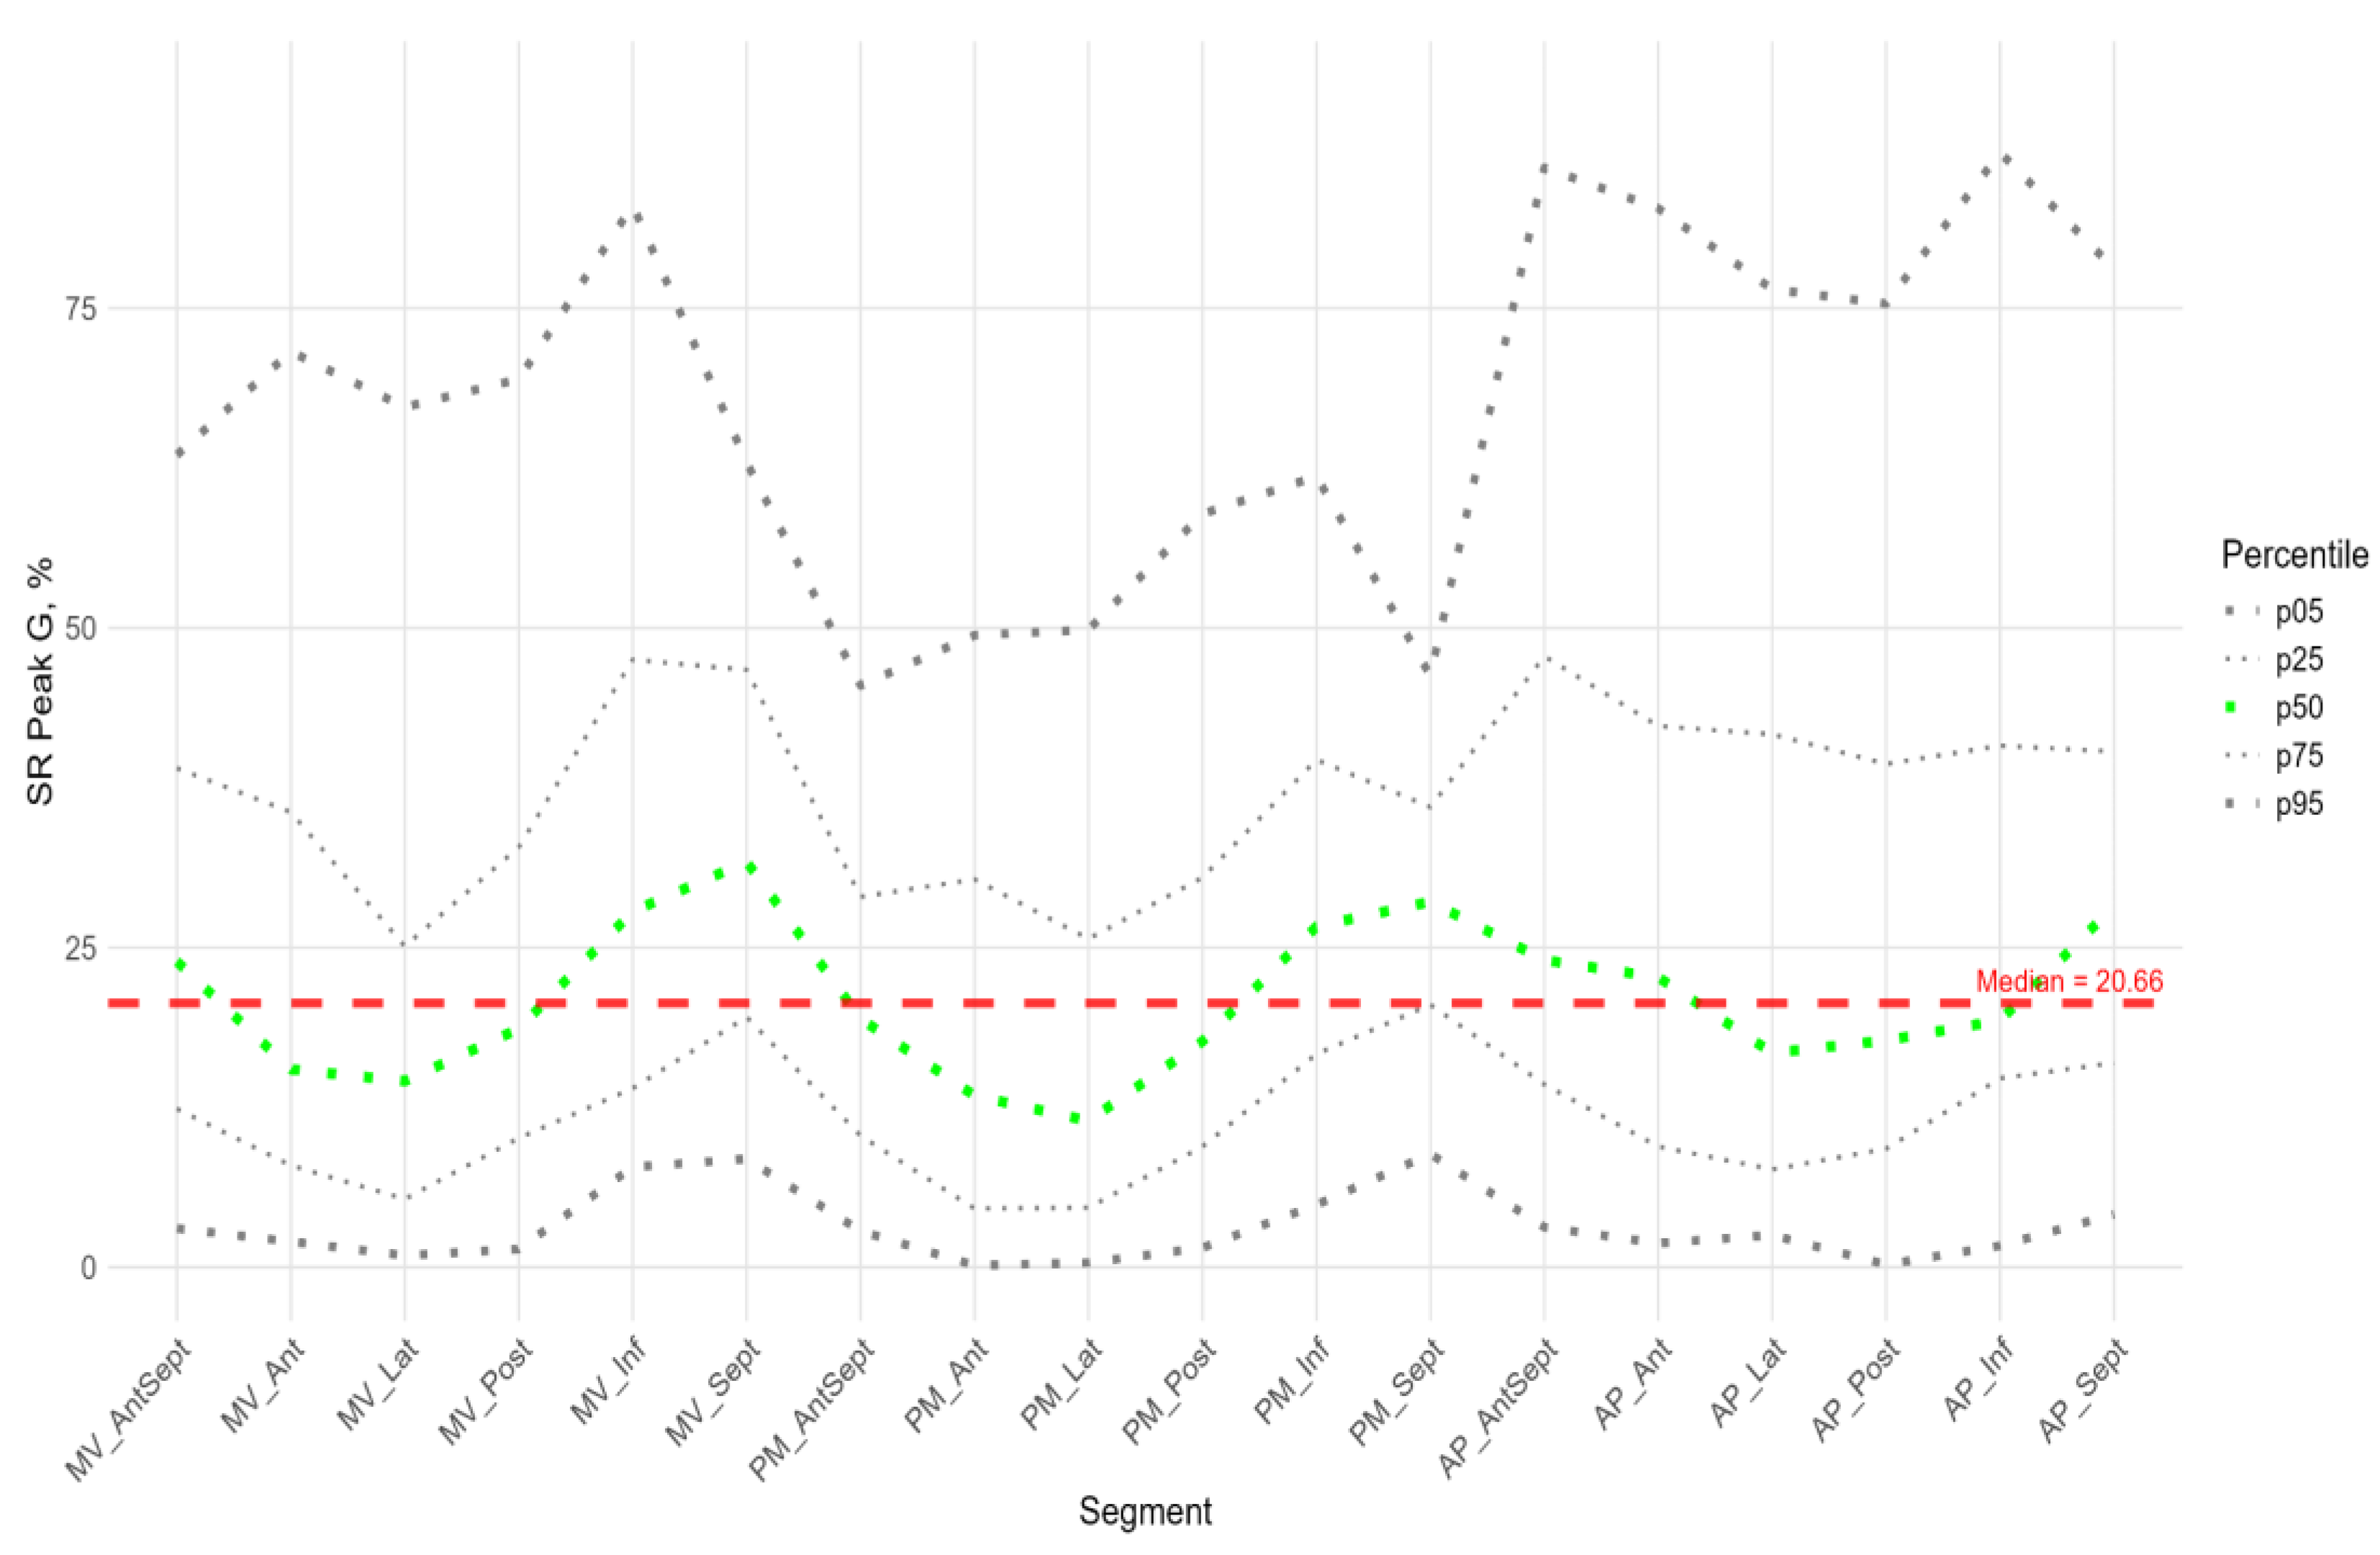
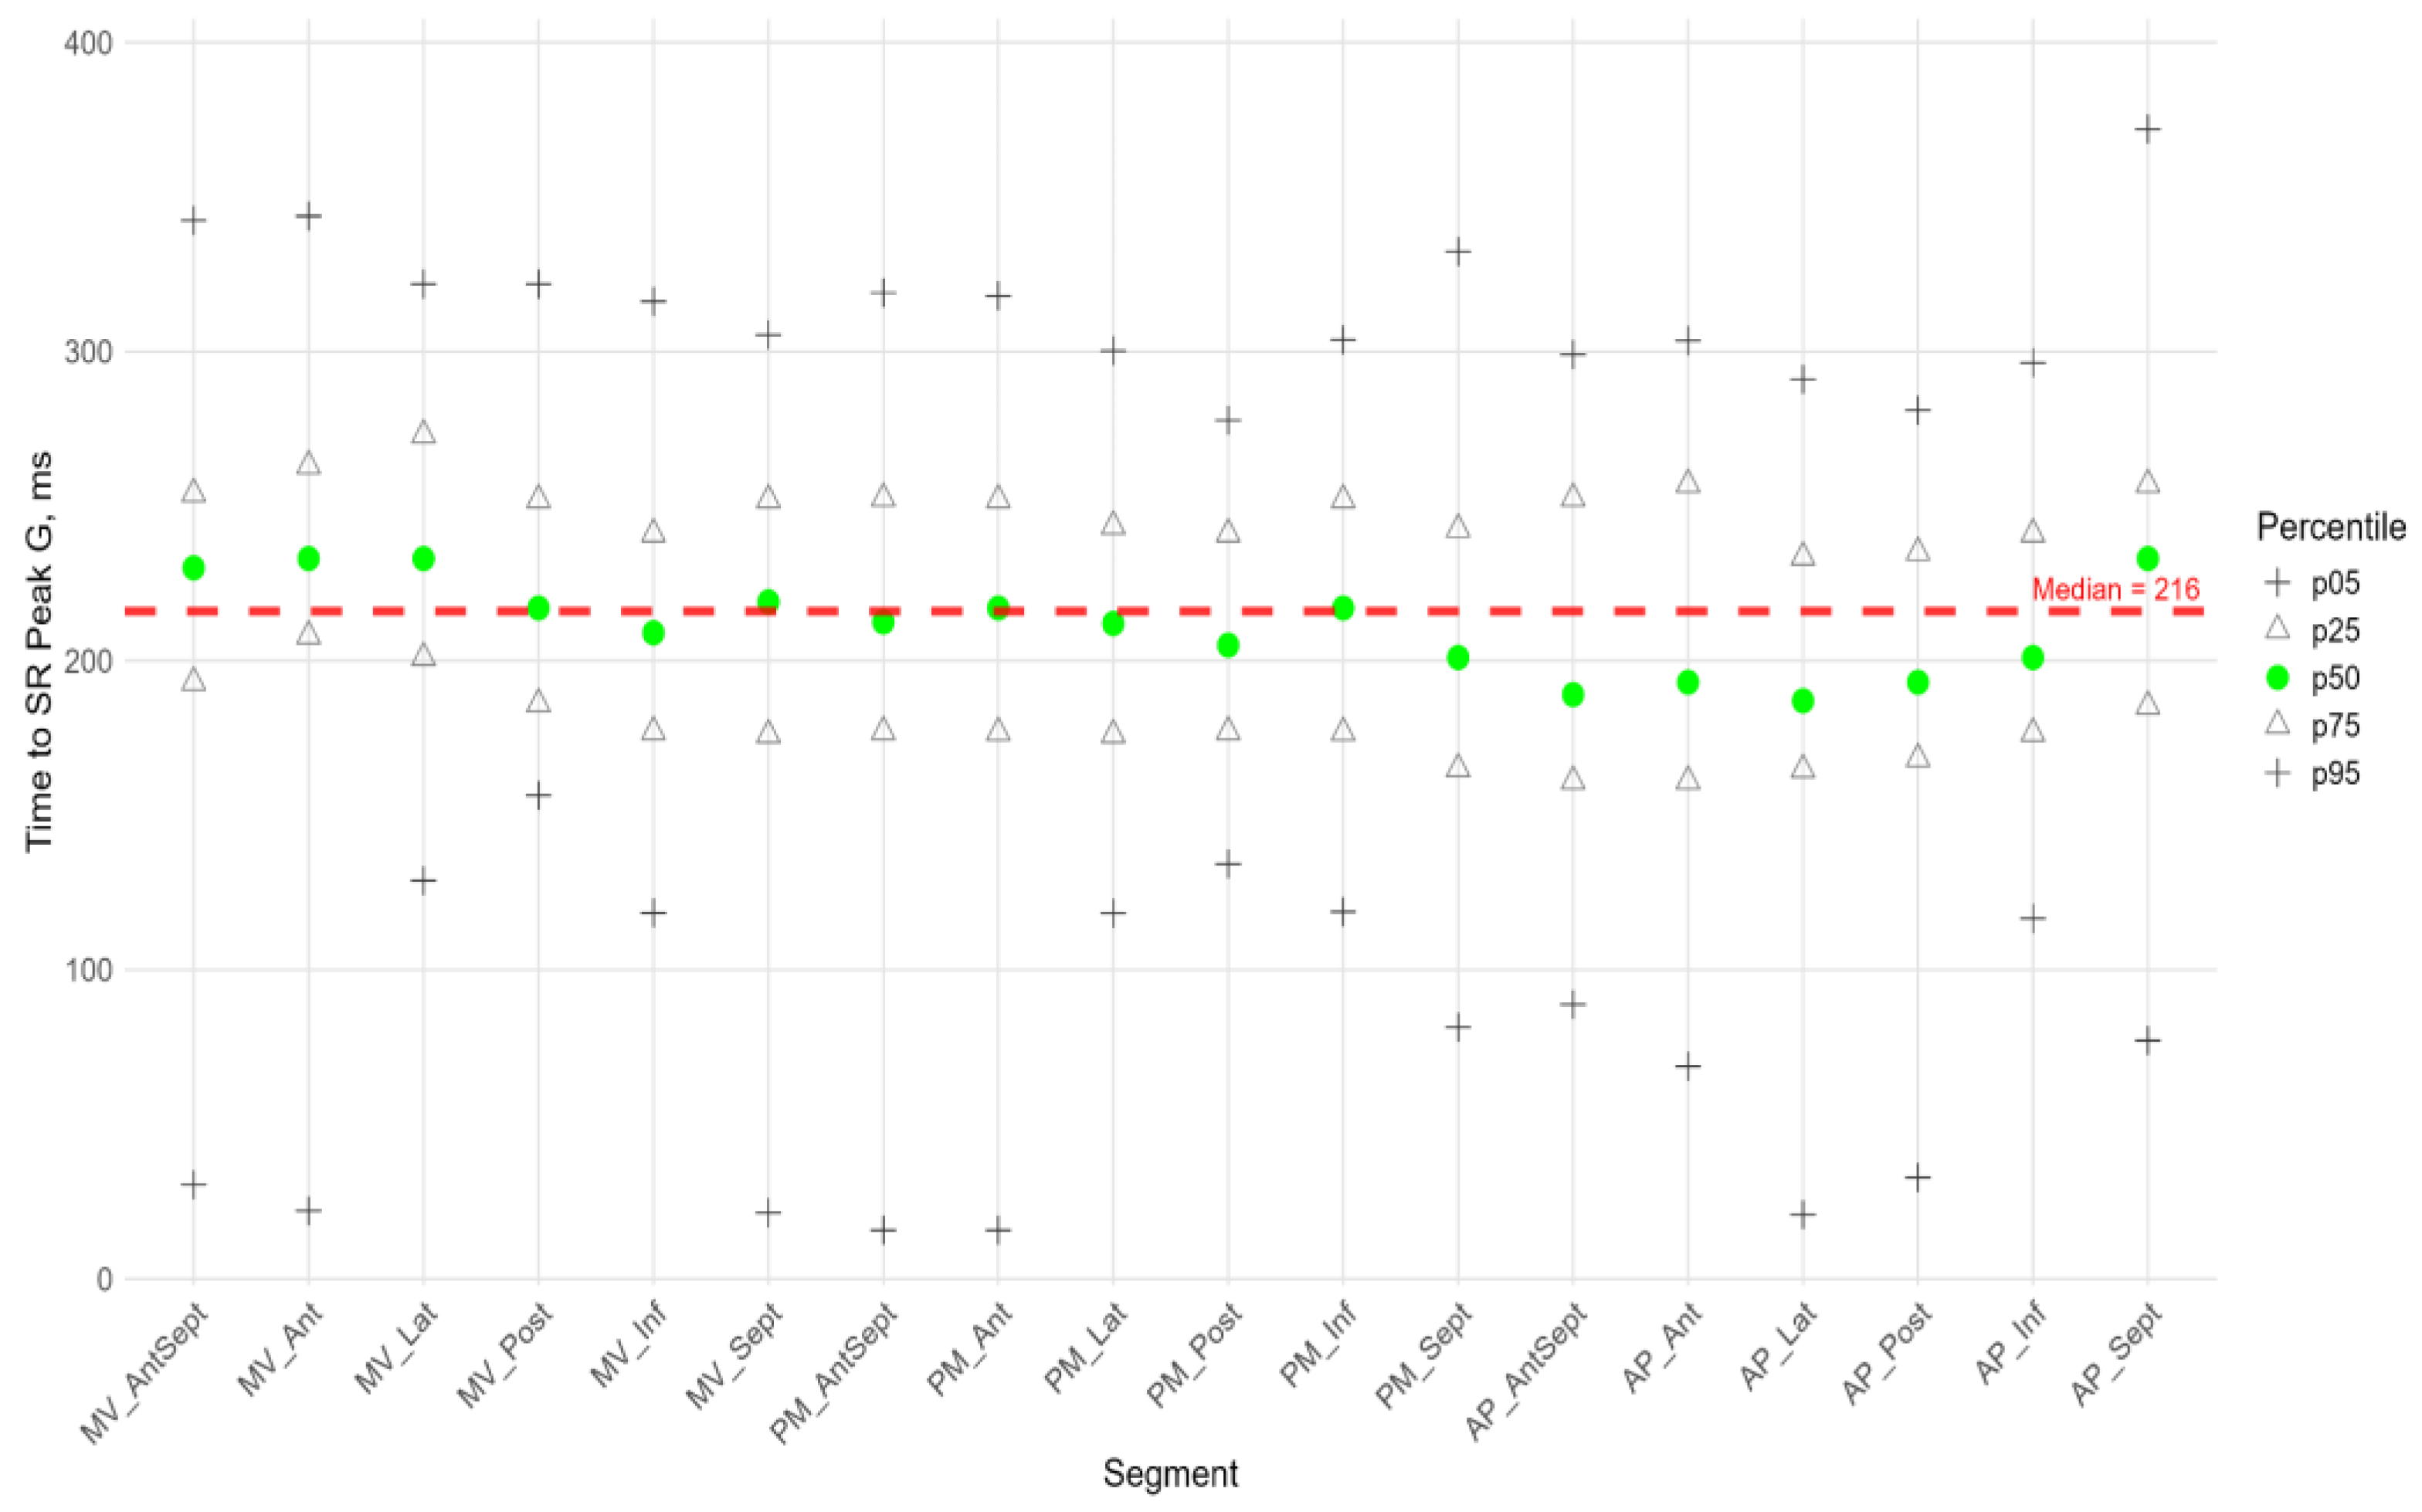

Table 1.
Description of a group of extremely premature newborns without signs of hemodynamic disturbances (n=65).
Table 1.
Description of a group of extremely premature newborns without signs of hemodynamic disturbances (n=65).
| Parameters | Preterm (n=65) Me(25; 75 %) |
|---|---|
| Gestation age, weeks | 29.7 (27.4;31.1) |
| Weight, g | 1210 (980;1420) |
| Height, cm | 37 (35;40) |
| Mean blood pressure, mmHg | 47 (43;56) |
| Heart rate , bpm | 155 (147;166) |
| Saturation (SpO2), % | 96 (94;98) |
| Patent ductus arteriosus, n (%) | 46 (71%) |
| Intraventricular haemorrhage, n(%) | 14 (22%) |
| Respiratory support | |
| Respiratory support, n (%) | 62 (95.4%) |
| Mechanical ventilation, n (%) | 23 (35.4%) |
| Hight frequency ventilation, n (%) | 22 (33.9%) |
| CPAP, n (%) | 16 (24.6%) |
| HFNC, n (%) | 1 (1.5%) |
| Indications for delivery | |
| fetal growth restriction | 7 (10.8%) |
| Preeclampsia | 13 (20.0%) |
| Bleeding | 11(16.9%) |
| Сhorioamnionitis | 8 (12.3%) |
| Premature rupture of membranes | 14 (21.5%) |
| Premature birth without associated diagnosis | 12 (18.5%) |
| Echocardiography | |
| End diastolic diameter LV, mm | 13 (11;15) |
| End systolic diameter LV, mm | 8.5 (7;10) |
| Ejection fraction LV (Teicholz), % | 68 (63;72) |
| Thickness of the interventricular septum, mm | 3.7 (3;4) |
| Thickness of the posterior wall LV, mm | 2 (1;2) |
| Cardiac output, min*ml/kg | 252 (201;303) |
| Cardiac index by VTI | 2.8 (2.1;3.3) |
| Global strain parameters | |
| LV GLS , % | -16.4 (-14.5;-18.4) |
| AVC, ms | 209 (193;225) |
| Global median Time to SL peakS, ms | 195(169;219) |
| Global median SL peakG, % | -15(-20;-10) |
| Global median Time to SL peakG, ms | 225(185;257) |
| Global median SL peakP, % | 0.6(0;4) |
| Global median Time to SL peakP, ms | 24(0;56) |
| Global median SC peakG, % | -9(-15;-5) |
| Global median Time to SC peakG, ms | 195(161;252) |
| Global median SC peakS, % | -8(-15;-3) |
| Global median Time to SC peakS, ms | 176(99;198) |
| Global median SC peakP, % | 2(0;6) |
| Global median Time to SC peakP, ms | 39(0;77) |
| Global median SR peakG, % | 21(11;38) |
| Global median Time to SR peakG, ms | 216(176;252) |
Abbreviations: CPAP, constant positive airway pressure; HFNC, high-flow nasal cannula; LV, left ventricular; VTI, velocity-time integral; LV GLS, left ventricular global longitudinal strain; AVC, aortic valve closure; SL, longitudinal strain; SC, circumferential strain; SR, radial strain.
Disclaimer/Publisher’s Note: The statements, opinions and data contained in all publications are solely those of the individual author(s) and contributor(s) and not of MDPI and/or the editor(s). MDPI and/or the editor(s) disclaim responsibility for any injury to people or property resulting from any ideas, methods, instructions or products referred to in the content. |
© 2025 by the authors. Licensee MDPI, Basel, Switzerland. This article is an open access article distributed under the terms and conditions of the Creative Commons Attribution (CC BY) license (http://creativecommons.org/licenses/by/4.0/).
Copyright: This open access article is published under a Creative Commons CC BY 4.0 license, which permit the free download, distribution, and reuse, provided that the author and preprint are cited in any reuse.


