Submitted:
10 October 2025
Posted:
11 October 2025
You are already at the latest version
Abstract
With the growth of potato production in Kazakhstan, the development and implementation of digital technologies that improve grading productivity is a very relevant issue. A comparative analysis of two types of classical deep neural network models used for classification of color im-ages of potatoes from the Kazakhstan region is presented in the article. Ten representative varie-ties of Kazakhstani potatoes were selected as objects of study: Alians, Alians mini, Astana, Astana mini, Edem, Edem mini, Nerli, Nerli mini, Zhanaisan and Zhanaisan mini. Two convolutional neural network (CNN) architectures - GoogLeNet and SqueezeNet - were fine-tuned using trans-fer learning with three different optimization methods. The convolutional neural networks SqeezeNet and GoogLeNet were used to identify the variety of the captured potato images. The comparison between the achieved classification accuracy with the two neural networks was made using standard evaluation metrics, such as accuracy, precision and recall, supplemented by con-fusion matrix analysis to reveal potential misclassifications. The analysis of the metrics showed that both neural network architectures are applicable for developing automated systems for iden-tifying the correspondence of tubers with specific varietal characteristics and sorting them in con-trolled laboratory image acquisition conditions. When analyzing the results for the ten studied va-rieties, several varieties were identified for which high recognition accuracy was obtained (Astana, Zhanaisan and Zhansyan mini), those that were not identified very well (Alliance, Alliance mini, Astana mini, Edem) and one variety that was poorly recognized - the Nerli variety. For the Astana and Zhanaisan varieties, accuracy rates exceeding 97% were achieved, making the models suitable for use in digital potato tuber sorting systems. For the Nerli and Alians varieties, further network training on a larger sample, including a wider range of color variations, is recommended.
Keywords:
potatoes
; variety
; classification
; digital image analysis
; deep learning methods
1. Introduction
There are more than 4, 000 varieties of potatoes in the world, but only a small part of them аre currently used. For example, in the United States, about 100 varieties of potatoes are constantly in use. According to data for 2020, 36 varieties of potatoes have been included in the Register of Breeding Achievements of Kazakhstan. In the country’s agricultural enterprises, about 25 thousand hectares of irrigated land are allocated for potatoes, and the average potato yield is 35-37 tons/hectare. The total gross harvest, according to official data, is about 4 million tons. Since the early 2000s, Kazakhstan’s potato growers have relied on modern, highly productive varieties of European selection. The share of imported varieties in farms exceeds 90%, and seed material is imported in significant quantities annually from Germany and the Netherlands. This is a serious problem for increasing domestic potato production.
One of the key strategic tasks is a significant increase in the volume of seed potatoes produced in Kazakhstan. Kazakhstan has a number of advantages for the development of potato seed production, including a large territory and appropriate climate conditions.
In the last three years, the potato yield has been growing significantly in Kazakhstan. The main condition for this is the usage of high-quality seeds of highly productive varieties. Currently, about 1200-1300 thousand hectares are under irrigation in the country. By 2027, the task is to double these areas, which will provide conditions for increasing the area of land for potatoes.
So, at the moment in the Republic of Kazakhstan, all tasks and activities related to improving the conditions for selecting potatoes for sowing are extremely relevant. The main areas of research work that are of growing interest are the following: selection for productivity, heat and drought resistance, resistance to diseases common in the republic, and the creation of varieties suitable for industrial processing [1,2,3,4].
In the selection step for potatoes, when describing the distinctive morphological features of a potato tuber, in particular its weight, size, and shape, manual work is carried out typically to measure the length, width, and thickness of the tuber. The labor productivity of determining the size and weight of tubers is about 600 tubers per hour. The requirements for seed potatoes are given in “GOST 33996-2016 Seed potatoes. Technical conditions and methods for determining quality” adopted by the Interstate Council for Standardization, Metrology and Certification [5].
To improve the efficiency of potato and vegetable growing in Kazakhstan, a possible direction for solving the problem of increasing the accuracy and productivity of determining the parameters of potato tubers is the application of advances in computer image processing, machine learning, and neural networks. Therefore, the development of a digital method for determining the morphological indicators of potato tubers using a machine vision system and proper algorithms and tools for processing is very relevant and timely.
To determine whether a batch of seed potatoes corresponds to a certain variety, it is necessary to determine the weight, size, shape, and color of each tuber in the selected sample. The potato variety is indicated in the accompanying documents. Therefore, the problem of checking compliance arises, comparing the accompanying documents with the real indicators of potato tuber quality. Breeders, seed farm specialists, and farmers face the problem of determining the compliance of tubers with a certain variety. Modern advances in computer image processing and artificial intelligence make it possible to solve this problem [6,7].
Objective quantitative methods for assessing the quality of vegetables and fruits, and especially optical measurement methods together with deep learning approaches, provide high measurement accuracy and meet the requirements for various crop quality evaluations [8,9,10]. The available networks using deep learning are very accurate and robust overall. Pretrained networks differ from each other in their parameters and training settings, such as size, algorithm, network weights and biases, and also accuracy, performance, and speed, which influence the choice of a proper network for each specific task. Regarding literature review, the most popular pretrained models are: SqueezeNet [11], VGG [9], ResNet, GoogLeNet [12], YOLO Net [6,13], Inception, AlexNet, MobileNet [7], DarkNet [14], and EfficientNet [15].
In most studies dealing with the quality of vegetables, including potatoes, the use of computer vision techniques is the leading method. In recent years, authors have used RGB color images [16], NIR images [17], multispectral [18], hyperspectral imaging, and deep learning [19,20,21,22], multi-camera machine vision and morphological analysis [23], texture [24], thermal and hyperspectral imaging [25], also there are described systems for the presence of defects [26], for maturity assessments [27], estimation of density and mass using ultrasound technology [28], acoustic evaluation [12], but research on varietal identification by using deep learning approaches is limited [9].
Przybylak et al. (2020) [13] discussed the application of neural image analysis for automatic quality assessment of potato tubers. The developed system uses real-time potato images and classifies tubers by the presence of defects such as mechanical damage, spotting, sprouting, and putrefaction. The results of the experiments showed classification accuracy of over 90%, as well as high stability to changes in shooting conditions and lighting.
The paper by Zhao et al. (2023) [29] is devoted to the development of a non-destructive method for the detection of external defects of potato tubers based on hyperspectral imaging (HSI) combined with machine learning algorithms. The study used a hyperspectral imaging system in the 400–1000 nm range, which provides high-resolution spectral data. Based on the collected array of potato images with various types of defects, training samples were constructed, feature selection methods were used, and models based on SVM, RF, and other algorithms were trained. The classification accuracy of damaged tubers in their work reached 93.5%.
The main focus of the research paper by Azizi et al. (2021) [30] is the application of machine learning methods, in particular artificial neural networks, to classify potato varieties based on morphological features. The authors used a custom-designed digital platform that extracts tuber characteristics, including shape, size, texture, and color, and generates a feature vector based on them. A multilayer neural network trained on a labeled dataset of images of different potato varieties was used to build the classification model. As a result, the system demonstrated recognition accuracy above 97% for most varieties, with the best results achieved using an architecture with two hidden layers.
Another study by Azizi (2016) [31] deals with the identification of ten Iranian potato varieties. It used data obtained from image processing together with principal component analysis by selecting 16 principal features, including color, shape, and texture parameters. In the study, it is concluded that the textural features had a key role in determining potato varieties from the tuber surface. The classification was done by linear discriminant analysis and a non-linear artificial neural network method. Acceptable classification accuracy was obtained using a non-linear MLP neural network with a 16-20-10-10 structure in the study.
One of the recent review works providing an up-to-date review of ML models in potato plant phenotyping was done by Ciarán Miceal Johnson (2025) [32]. The advantages of Deep Learning (DL) approaches and the rising trend of Convolutional Neural Network (CNN)-based architectures are widely discussed, while also noting the limited availability of data for training these models. The authors highlighted some key conclusions based on the large number of scientific papers reviewed including the choice of pretraining dataset which has a significant impact on the model’s performance; the fact that pretraining does not always lead to improved performance; when fine-tuning, it is not necessary to update the weights of the entire network; a common approach which is working well at all is to adjust only the top layers using the target dataset, and this is reducing the time needed for fine-tuning.
Su et al. (2018) [33] presented an approach to automatic potato sorting based on machine vision and 3D shape analysis of tubers. The work implements a system that combines two-camera shooting and algorithms for reconstructing a 3D tuber model. The proposed system estimates length, width, volume, projection area, sphericity, and axis ratio. Using the extracted features, models for assessing the quality and sorting of potatoes based on classification rules defined by agricultural industry standards were proposed. The article pays special attention to the development of a method for preliminary cleaning of images from noise, normalization of illumination, and correction of geometric distortions. The experiments conducted showed that the accuracy of sorting when using the proposed system exceeds 94% when sorting by standard calibration classes.
The paper by Wei et al. (2023) [14] is devoted to the development and implementation of a cross-modal approach for non-destructive quality control of potatoes in a real production flow. Their work combines data from two modalities: visual images and spectral information. A key feature of the study is the use of data fusion technology, in which potato images from an RGB camera and reflectance spectra obtained using a spectrometer are fed into a common neural network architecture. Deep learning methods were used for the analysis, including convolutional neural networks (CNN) and transformer-based models, which allow the extraction of complex features of both visual and spectral nature. The results showed that the cross-modal approach outperforms traditional sorting methods in accuracy — an accuracy of over 95% was achieved in detecting defects of various natures - mechanical damage, dents, skin diseases.
As it is briefly reviewed, modern research confirms the importance of using optical measurement methods and computer vision systems for vegetable quality analysis, but existing methods have limitations in accuracy. Recent scientific papers emphasize the importance of implementing deep learning methods and image processing algorithms to analyze most of the important parameters for the quality of vegetables and fruits, and demonstrate the promise of approaches for the detection of imperfections and varietal classification, but their use for Kazakhstan potato varieties is practically not presented.
The present study aims to fill this gap by developing a method for automatic recognition of potato tubers of different varieties in Kazakhstan using color imaging, computer vision, and deep neural networks with transfer learning. The objects of the present study are mini and regular tubers of seed potatoes of promising varieties of Kazakhstan selection, as follows Astana, Nerli, Zhanaysan, Edem, and Alians, as well as a machine learning algorithm and a program for determining the parameters of a tuber for a certain variety.
Varietal identification and digital classification are important for maintaining the purity of planting material, improving seed production, and reducing the share of imported potato varieties. Separating “mini” and standard tubers is also important for quality control in the early stages of cultivation and for selecting elite potato tubers.
The subject of the research is the computer implementation of the machine learning algorithm and the study of neural network options for determining potato varieties and testing the program. The obtained research results will be used in the development of a digital automated system for determining quality indicators and sorting varietal seed potato tubers.
2. Materials and Methods
2.1. Potato Dataset Description
This study deals with five main varieties of Kazakh regular and mini tubers of seed potatoes: Astana, Nerli, Zhanaysan, Edem, and Alians. Sample images of potato tubers from the ten varieties are shown in Figure 1.
These varieties were not chosen by chance: Astana, Nerli, Zhanaisan, Edem, and Alians represent the foundation of Kazakhstan’s seed potato breeding. They differ in morphological traits, climate adaptation, and yield.
– Astana is a high-yielding variety adapted to the climatic conditions of southeastern Kazakhstan, and is heat- and drought-resistant.
– Zhanaisan is an early-ripening variety with high marketability. It is resistant to diseases and the climatic conditions of Kazakhstan.
– Edem is an early, high-yielding, heat- and drought-resistant variety, with field resistance to diseases common in Kazakhstan.
– Alians is an early-ripening, promising, universal variety for mechanical harvesting. It is resistant to diseases and the climatic conditions of Kazakhstan.
– Nerli is a selected variety with excellent taste qualities. A mid-season table potato variety.
These potato varieties were selected based on their significance and promise in recent years, as well as their recommendations from breeders and farmers.
The potato tubers were selected using stratified sampling to ensure representativeness and capture all intravarietal variability. The selected varieties included typical tubers selected based on skin color, size, weight, and shape. Then, based on criteria of visual integrity, maturity, and absence of damage, the final tubers were selected for analysis. A total of 100 tubers of each variety were tested—50 mini-tubers (category IM) and 50 standard seed tubers (categories SSE/SE/E), for a total of 500 tubers.
Mini-tubers are the source material for propagating elite seed potatoes. They are grown in greenhouses from microclones and are characterized by small tuber size (largest transverse diameter from 9 to 60 mm), even shape, and uniform skin. Standard tubers are subsequent generations (SSE/SE/E), intended for field propagation and subsequent planting. They are larger, with the largest transverse diameter measuring 28-60 mm, and have more pronounced eyes and natural surface defects. This separation is important when training neural networks, since the visual characteristics of mini-tubers differ significantly from standard seed tubers and require special adaptation of the model to subtle morphological differences. The sizes of the largest transverse diameter of mini-tubers and standard seed tubers meet the requirements of the standard [5].
Color images of each tuber were obtained in three projections, for a total of 1,500 images. This number corresponds to the minimum sample size required to ensure statistical significance at a significance level of α = 0.95.
Digital images of tubers were obtained under controlled lighting and background conditions, as shown in Figure 2. To obtain high-quality images of the objects under study, a stationary vertical imaging setup was used.
The setup included a Canon EOS 4000D DSLR camera (Canon Inc., Tokyo, Japan) (1), a Benro SystemGo Plus tripod with a horizontal arm (Benro Image Technology Industrial Co., Ltd., Tanzhou Town Zhongshan City, China) (2), and a solid blue matte background (3) placed on a flat surface. This configuration is widely used in machine vision systems, digital sorting of agricultural produce, and in preparing training samples for subsequent analysis. The Canon EOS 4000D DSLR, equipped with the EF-S 18–55mm f/3.5–5.6 III lens, captured 18 megapixels of image quality using its APS-C CMOS sensor (22.3 x 14.9 mm). The camera was set to a focal length of 55 mm to reduce distortion and enhance detail.
The camera was fixed vertically above the subject using a horizontal tripod arm and a ball head with a quick-change plate. The shooting mode was set to Manual with manual focus (MF) on the central area of the subject. Exposure parameters were adjusted experimentally: ISO 100–200, shutter speed 1/60–1/125 second, aperture f/8 for uniform depth of field.
White balance was set manually using a gray card or the Daylight (5500K) setting. All photos were saved in RAW format and duplicated as JPEGs for quick viewing. The Benro SystemGo Plus tripod allowed the camera to be securely fixed above the subject, ensuring stability and repeatability of shooting conditions. The adjustable height and rotating mechanism of the tripod allowed for precise adjustment of the distance between the lens and the subject (approximately 50 cm). A built-in bubble level was used for leveling the horizon.
A plain blue A4 sheet of matte paper with an anti-glare finish served as the background. Blue was chosen for its high contrast with the color of the tubers and the absence of overlap in the color spectrum, which facilitated more accurate image segmentation and improved digital processing. A potato tuber was positioned in the center of the frame, precisely centered within the shooting area. Each tuber was positioned in the same orientation, ensuring standardization of the images.
The stage was illuminated with diffused daylight and a pair of LED light sources with a color temperature of 5500K and a color rendering index (CRI) above 90. The fixtures were positioned symmetrically on both sides at a 45° angle to the subject, providing uniform illumination without shadows. This approach contributed to improved visual clarity of contours and increased accuracy of extracted features during digital processing.
Each tuber was captured sequentially, with a two-second shutter release delay to prevent blurring. After each shot, the images were saved to the camera’s internal memory and then transferred to a PC using a card reader. All images were tagged with date and sample number and saved in a separate folder for subsequent analysis. Each potato tuber has been captured three times from different viewing sides – two opposite sides and from above. Images (960 x 1280 pixels, RGB) were stored and processed in JPEG format. Sample images for Alians variety are shown in Figure 3.
This configuration ensured standardized imaging conditions and high data reproducibility, which is especially important for scientific purposes, the development of sorting algorithms, and the preparation of training samples for computer vision systems. Each variety set consists of 50 potato tubers; a total of 1500 sample images were included in this study. The sample sets are divided into training set (70%) and validation set (30%). Image processing was performed in the MATLAB software environment.
2.2. Algorithm for Varietal Identification by Digital Image Analysis and Methodology Explanation
The process of building a digital identification model involves three interrelated stages: creating an input database, training the model using deep learning approaches, and then evaluating by identifying new unseen test samples. This approach allows for a more objective assessment of potato varietal affiliation and the automation of the visual sorting process of planting material. The developed data processing algorithm is shown in Figure 4.
The first stage involves collecting and pre-sorting potato tubers; capturing images by variety and type (mini-tubers and standard seed tubers), and creating training and validation sets. Еach image was acquired under standard lighting and shooting conditions, with a resolution of 960 × 1280 pixels, and an RGB color model. Particular attention was paid to uniform shooting conditions and precise object centering in the frame, which significantly impacts the accuracy of subsequent classification. Images undergo initial manual tagging, during which each file is assigned a category corresponding to the potato variety. In this way, the initial training sample is formed, ensuring representativeness and complete coverage of intra- and inter-varietal variability.
The validation sets consisted of 30% (450 images) of the total image volume (1500 images).
The second stage involves choosing and training the deep learning models. Two pre-trained convolutional neural networks, SqueezeNet and GoogLeNet, implemented in the MATLAB R2023b environment using the Deep Learning Toolbox package, were used for identifying potato tuber varieties in our research.
SqueezeNet and GoogLeNet were chosen due to their proven effectiveness in solving problems of visual classification of agricultural objects, as well as high training speed and adaptability to transfer learning conditions.
The SqueezeNet network is a lightweight CNN. It is designed with substantially fewer parameters than other CNN architectures, but it attains similar performance accuracy. The input image size according to the requirements for SqeezeNet is 227 × 227. SqueezeNet is designed for applications requiring computational efficiency [34]. In SqueezeNet, the model size is reduced through the following design alterations: 1 × 1 convolutions for parameter reduction, Fire modules (a combination of squeeze and expand layers) for efficient feature extraction, and a delayed down-sampling strategy to retain spatial information. [11]. Given that agricultural product classification must be both fast and accurate, SqueezeNet’s compact architecture ensures robust feature representations, low-latency inference, minimal computational overhead, and strong performance, making it suitable for real-time detection.
GoogLeNet is a deep convolutional neural network. It consists of 22 trainable layers and uses an innovative “Inception modules” architecture, which enables efficient feature extraction at different scale levels. This structure makes the model robust to variations in potato tuber shape, color, and texture [18], boasting high-quality feature extraction and the ability to effectively classify visual objects even with a limited training sample size. GoogLeNet uses 1 input layer, 9 convolutional layers, 4 pooling layers, 2 normalization layers, 2 fully connected layers, and 1 softmax output layer responsible for the distribution of class membership probabilities. To adapt the model to the potato variety identification task, the final layers were fine-tuned. The fully connected layers were replaced with new ones with several outputs corresponding to the number of varieties being studied. The final softmax head and classification, necessary for training on the new dataset, were also recreated.
A computer system with an NVIDIA RTX 3070 graphics card (8 GB of VRAM), an Intel Core i7 processor, and 64 GB of RAM was used for training. The average model training time was approximately 15-20 minutes for the entire training cycle, including augmentation and validation.
Firstly, images were resized respectively to 224 × 224 pixels for the GoogLeNet and 227 × 227 pixels for the SqueezeNet network. Next, the input data is normalized, the color channels are converted to the standard of the pre-trained model, and structured training and validation subsamples are generated. A mandatory step is the implementation of dynamic image augmentation, including random rotations, horizontal reflections, scaling, and shifts aimed at expanding the volume of data without increasing the number of actual images. These measures allow us to increase the generalization ability of the model and its robustness to minor distortions of input images that occur in real production conditions. Scaling was performed while preserving object proportions and minimizing distortion using the augmentedImageDatastore function. This function not only automatically adjusted the image size but also applied dynamic augmentation, ensuring a high degree of model generalization.
To increase the variability of the training data and improve the model’s robustness to external factors (illumination, orientation, and background), the following augmentation scheme was used:
• Random horizontal reflections;
• Random image rotations from -10° to +10°;
• Random scaling in the range from 95% to 105%;
• Offsets along the X and Y axes up to 10 pixels;
• Changes in image brightness, contrast, and saturation up to ±10%;
• Addition of minimal Gaussian noise during the training phase.
This augmentation was performed directly during the training process without saving intermediate files, which avoided unnecessary load on the file system and accelerated model training.
2.3. Deep Learning Model Parameters and Training Settings For Identification
The model was trained using three different optimization algorithms: stochastic gradient descent with momentum (SGDM), the Adam algorithm, and Root Mean Square Propagation (RMSprop).
SGDM has proven to be robust and stable when working with small volumes of labeled agricultural data. It maintains a single learning rate (termed alpha) for all weight updates, and the learning rate does not change during training. A learning rate is maintained for each network weight (parameter) and separately adapted as learning unfolds.
Adam combines the advantages of two extensions of stochastic gradient descent. Specifically, the Adaptive Gradient Algorithm (AdaGrad) maintains a per-parameter learning rate that improves performance on problems with sparse gradients (computer vision problems). Adam is adapting the parameter learning rates based on the average of the second moments of the gradients (the uncentered variance).
Root Mean Square Propagation (RMSProp) also maintains per-parameter learning rates that are adapted based on the average of recent magnitudes of the gradients for the weight. RMSProp adapts the parameter learning rates based on the average first moment.
Other hyperparameters for training the convolutional neural networks (CNNs), that have been set in this study, are the Initial Learning Rate and the Learning Rate Drop Factor.
Initial Learning Rate (ILR) is a hyperparameter that determines how much a neural network’s weights are updated during training. In gradient-based optimization algorithms like stochastic gradient descent (SGD), the learning rate scales the size of the step taken to adjust weights based on the computed loss gradient. A higher learning rate means larger weight updates, potentially speeding up training but risking overshooting optimal values. A lower learning rate leads to smaller, more precise updates but may require more training iterations to converge. This parameter directly impacts the balance between training speed and model stability. Choosing an appropriate learning rate is critical. Developers often experiment with learning rates using grid or random search. Practical defaults, like 0.001 for Adam or 0.01 for SGD, are often used as starting points. In image classification tasks with convolutional networks, a mismatched learning rate can lead to underfitting or unstable training. Adaptive optimizers like Adam dynamically adjust effective learning rates per parameter, mitigating some manual tuning but not eliminating the need for initial rate selection.
A learning rate drop factor is a hyperparameter used in deep learning to gradually reduce the learning rate during model training, typically by multiplying the current learning rate by this factor at specified intervals (after a certain number of epochs). This approach helps the model to make large updates early on and then finer, more accurate adjustments as it approaches the optimal solution, preventing overshooting and improving convergence.
This study includes an Initial Learning Rate of 0.0001, 0.0002, 0.00025, 0.0003, 0.00035, 0.0004, 0.0005, and a Learning Rate Drop Factor of 0.1. The models were trained for 30 epochs; the preferred number was set experimentally.
The training process was monitored using the built-in Experiment Manager tool, which displays in real time: loss and accuracy curves; overfitting dynamics; model convergence rate; and classification error distribution.
Finally, at the evaluation step, model validation was performed on a holdout subsample comprising 30% of the total image database. The proportion of data used for validation was chosen to ensure a balance between training and quality control of the classification. All training and validation subsamples were randomly generated, maintaining class proportions (stratified sampling).
After training was completed, a confusion matrix was constructed, allowing us to analyze which potato varieties were most susceptible to misclassification and at what stages the discrepancy between predicted and true labels occurred. Precision and recall metrics were also calculated for each class.
The results showed that the proposed model is capable of successfully identifying potato tubers by variety, providing a high level of accuracy, resistance to augmented distorted images, and applicability to automated digital sorting tasks.
2.4. Model Evaluation Metrics
The quality of the trained digital identification model for potato tubers was assessed using standard classification metrics: Accuracy, Recall, Precision, and Confusion Matrix analysis. These evaluation metrics allow the comprehensive characterization of the model’s classification ability.
The following formulas were used to calculate the metrics:
- Accuracy – proportion of correctly classified images:
- Precision – positive prediction accuracy:
- Recall – fullness (sensitivity):
- F1 score – composite metric:
Where: TP is the number of true positive predictions, FP is the number of false positive predictions, FN is the number of false negative predictions, and TN is the number of true negative predictions.
This methodology for sorting potato tubers based on their visual characteristics and machine vision opens up broad opportunities for integrating this technology into agricultural digitalization systems.
3. Results
The two pre-trained CNN networks, SqueezeNet and GoogLeNet, were fine-tuned. Models with different values of the Initial Learning Rate (ILR) parameter were examined. The ILR was set with the following values: 0.0001, 0.0002, 0.00025, 0.0003, 0.00035, 0.0004, 0.0005. The training of the networks was performed for 2500 iterations and 30 epochs for each network model. The training plots, including Training Accuracy and Training Loss graphs for SqueezeNet at Initial Learning Rate 0.0001 with solver Sgdm, are shown in Figure 5.
The training graphs, including the training accuracy and training loss graphs for GoogLeNet at an initial learning rate of 0.0001 with the Sgdm solver, are shown in Figure 6. It can be seen that even after the 1400th iteration, the training accuracy for both networks maintains values around 60-70% and the graphs have stable convergence. From the obtained results, it can be concluded that after the 15th epoch there are no significant changes in the accuracy and loss results, and 30 training epochs and 2500 iterations are quite sufficient to properly train the networks to recognize the ten potato varieties of the present study.
The performance of the networks was evaluated by analyzing the values of Training Accuracy (TA, %), Training Loss (TL, dimensionless), Validation Accuracy (VA, %), Validation Loss (VL), and Confusion Matrix.
First, the values for the indicators Training Accuracy, Training Loss, Validation Accuracy, and Validation Loss when training and validating the SqueezeNet and GoogLeNet networks using the three Solver algorithms: Sgdm, Adam, and RMSprop were reported. The statistical values of the parameters, including Average values, Minimum, and Maximum, were calculated and shown in Table 1.
The values of TA vary widely between 50% and 100%, those for TL between 0.176 and 0.9584. The values for VA are between 58% and 70.22%, for VL – between 0.7999 and 1.2417. In general, the values of the training quality indicators are not completely satisfactory, but several main conclusions have been drawn. The results show that the SqueezeNet is lightly sensitive to Solver type, while for the GoogLeNet, the choice of solver is not significant.
For Squiznet, the TA and TL parameters have very close values for all three solvers, while the validation accuracy varies between 58% and 70.22%, with validation losses of 0.7999-1.2417. The best in terms of validation accuracy is the Squiznet network with RMSprop – 70.22%, but the TA value for it is 50-83.3%.
For GoogLeNet all of the evaluation metrics, TA, TL, VA, and VL have the same values using Sgdm, Adam, and RMSprop. The training accuracy reaches 100%, but the validation accuracy does not exceed 69.33%, with VL losses up to 1.1974, therefore it ranks second in validation accuracy after Squiznet with RMSprop.
Next, the influence of the ILR value on Validation Accuracy in %, and Validation Loss was examined. Figure 7 shows the Validation Accuracy (a) and Validation Loss (c) values for SqueezeNet; Validation Accuracy (b) and Validation Loss (d) values for GoogLeNet at different Initial Learning Rates. Results show that the Initial Learning Rate does not significantly influence the Validation Accuracy for SqueezeNet. It is affecting only the Validation Loss at ILR of 0.005.
For the GoogleNet network, the choice of the ILR parameter is important, it can be seen that the value 0.00025 is not suitable, since the validation accuracy drops to 61%, and the losses increase to 1.2. The best results are obtained for ILR 0.0003, with the highest validation accuracy and the lowest validation loss. From the graphical results it can be concluded that on average the best network is Squeezenet with the PMSProp solver and ILR= 0.0004.
The influence of the recognition model on the Recall was also examined with respect to the varietal identity. Figure 8 show the dependencies between the Recall indicator and the network type, solver algorithm and ILR for all varieties. Overall results show “Nerli” regular variety as the least recognized. The Recall values for Nerli do not exceed 42.2% for most models. For the Nerli variety, only the Google Net network (Figure 8d) with ILR 0.00035 shows better recognition with Recall of about 68.9%.
Confusion matrices were constructed for the validation sample (30% of the total image volume). It allows for a visual assessment of the distribution of correct and incorrect classifications across classes. The diagonal of the matrix displays the number of correctly identified varieties, while cases of misidentification are recorded off-diagonally. Figure 9 and Figure 10 show Confusion matrices for the two networks that achieved good accuracy indicators for the validation samples, respectively for the SqueezeNet network, Solver Sgdm, and ILR=0.00025 (Figure 9) and for the GoogLeNet network with the Sgdm optimization algorithm and ILR=0.0003 (Figure 10).
An analysis of the confusion matrix revealed that the majority of errors occurred between varieties with similar tuber shape or color. Such cases require further sample expansion and refinement of the augmentation steps.
An analysis of Table 2 and the confusion matrix (Figure 9 and Figure 10) revealed that SqueezeNet and GoogLeNet networks exhibit different sensitivities to visual varietal characteristics.
High metric values for Accuracy, Precision, and Recall for varieties Astana and Zhanaisan confirm the model’s robustness and its ability to correctly process images of new, previously unseen potato tubers, but other varieties have not achieved such high values. This means that for the varieties Alliance, Eden, and Nerli, further experimental tests with other networks are needed to achieve satisfactory identification accuracy.
The most consistent results were obtained for the Astana and Zhanaisan varieties, where recognition accuracy exceeded 97%. This is explained by their distinct morphological features—a smooth oval shape and uniform skin color.
Meanwhile, the Nerli variety, and partially the Alians variety, demonstrated the lowest accuracy (up to 85–90%) due to similar color shades and the uneven surface of the tubers.
The confusion matrix plots show that the majority of classification errors occur between the Alians–Edem and Nerli–Nerli mini varieties, confirming the need to increase the training set and use additional features (e.g., skin texture and microrelief).
4. Discussion
The summarized data of the developed models and the evaluation of the best models in terms of the accuracy of predicting the variety of potatoes with validation samples are presented in Table 3.
The analysis (Table 3) showed that both neural network architectures are applicable for developing automated systems for identifying tuber conformity with specific variety traits and sorting them in real-world conditions.
SqueezeNet provides high accuracy with minimal computational resources, making it suitable for integration into portable devices and automated sorting lines.
GoogleNet, with its deeper structure, demonstrates better robustness to changes in illumination and tuber orientation, but requires more training time.
Practical application of such models is possible in seed potato production facilities, where rapid varietal identification and rejection of non-matching tubers is necessary.
5. Conclusions
With the growth of potato production in Kazakhstan, the development and implementation of digital technologies that improve grading productivity is a very relevant issue. The classification of potatoes, as well as of all agricultural products, requires repeatability and interpretability, so the introduction of modern technologies such as Deep learning methods in the sorting and grading process would lead to an increase in productivity and quality as a whole.
SqueezeNet and GoogLeNet have proven to be well-suited models for agricultural classification tasks, therefore, these two networks were included in the study. They were retrained and different network settings were tested.
When analyzing the results for the ten studied varieties, several varieties were identified for which high recognition accuracy was obtained (Astana, Zhanaisan and Zhanasyan mini), those that are not identified very well (Alliance, Alliance mini, Astana mini, Edem) and one variety that is poorly recognizable - Nerli variety.
Thus, the proposed digital identification algorithm and deep learning models – SqueezeNet and GoogLeNet demonstrated potential efficiency in classifying potato tubers by variety. The possibility of practical application of this methodology in systems with sorting tasks, automated quality control, and digital monitoring of seed material is good.
The analysis concludes that the combination of SqueezeNet (RMSprop, ILR=0.0004) and GoogLeNet (Sgdm, ILR=0.0003) provides an optimal balance of accuracy and robustness in recognizing Kazakhstani potato varieties.
For the Astana and Zhanaisan varieties, accuracy rates exceeding 97% were achieved, making the models suitable for use in digital potato tuber sorting systems.
For the Nerli and Alians varieties, further network training on a larger sample, including a wider range of color variations, is recommended.
Overall, the proposed approach demonstrates the applicability of deep neural networks for creating digital characteristics for Kazakhstan varietal seed potato tubers and minitubers and for automating sorting processes.
Author Contributions
Conceptualization, P.D.; Project Administration, Z.S.; Data Curation, A.M.; and D.Z.; Resources, D.Z.,M.B. and A.S.; Software and Formal Analysis, T.G.; Writing—Original Draft Preparation, J.A.; T.G. and E.N.; Visualization, E.N.; Writing—Review and Editing, P.D. All authors have read and agreed to the published version of the manuscript.
Funding
The research was conducted within the framework the grant of the Ministry of Science and Higher Education of the Republic of Kazakhstan under the Project АР19679764 - Development of a digital automated installation for determining quality indicators and sorting varietal seed potato tubers “ and by the European Union-NextGenerationEU through the National Recovery and Resilience Plan of the Republic of Bulgaria, project No. BG-RRP-2.013–0001-C01.
Data Availability Statement
The raw/processed data required to reproduce these findings cannot be shared at this time as the data also forms part of an ongoing study. Yet the data can be provided to readers when kindly asked.
Acknowledgments
In this section, you can acknowledge any support given which is not covered by the author contribution or funding sections. This may include administrative and technical support, or donations in kind (e.g., materials used for experiments).
Conflicts of Interest
The authors have no conflicts of interest to declare.
References
- UN: Global potato production could double in 10 years. June 2, 2022. https://agbz.ru/news/oon-mirovoe-proizvodstvo-kartofelya-mozhet-udvoitsya-za-10-let/?utm_source=yxnews&utm_medium=desktop (Accessed April 2, 2023).
- Potato growing in the Republic of Kazakhstan, Potato System Magazine, No. 4, 2020 https://potatosystem.ru/kartofelevodstvo-respubliki-kazahstan/.
- А.Е. Мухаметoв, Д.Р. Даутканoва, Н.Б. Даутканoв, А.Ш. Даулетбекoва, Ж. Н. Шаймерденoва. Прoизвoдствo семеннoгo картoфеля в Казахстане. Исследoвания и результаты. № 2, 20-23 стр.
- Красавин, В.Ф.; Елешев, Р.Е.; Алимханoв, Е.М.; Айтбаева, А.Т. СОРТОИЗУЧЕНИЕ КАРТОФЕЛЯ В УСЛОВИЯХ ЮГО-ВОСТОКА КАЗАХСТАНА Ізденістер, нəтижелер – Исследoвание, результаты № 2 (90) ISSN 2304-3334. 149.
- «ГОСТ 33996-2016 Картoфель семеннoй. Технические услoвия и метoды oпределения качества» Межгoсударственный сoвет пo стандартизации, метрoлoгии и сертификации. (прoтoкoл oт 25 oктября 2016 г.
- Du, C.-J.; Sun, D.-W. Recent developments in the applications of image processing techniques for food quality evaluation. Trends Food Sci. Technol. 2004, 15, 230–249. [Google Scholar] [CrossRef]
- Bhargava, A.; Bansal, A. Fruits and vegetables quality evaluation using computer vision: A review. J. King Saud Univ. Comput. Inf. Sci. 2021, 33, 243–257. [Google Scholar] [CrossRef]
- Zhu, L.; Spachos, P.; Pensini, E.; Plataniotis, K.N. Deep learning and machine vision for food processing: A survey. Curr. Res. Food Sci. 2021, 4, 233–249. [Google Scholar] [CrossRef]
- Archana, R.; Jeevaraj, P.S.E. Deep learning models for digital image processing: a review. Artif. Intell. Rev. 2024, 57, 1–33. [Google Scholar] [CrossRef]
- Behera, S.K.; Rath, A.K.; Sethy, P.K. (2020). Maturity status classification of papaya fruits based on machine learning and transfer learning approach. Inf Process Agric In Press.
- Ajay, A.; Bisht, A.S.; Chauhan, S.S.; Uppuluri, P.; Nidjelli, D.N.; Muthireddy, D.K.; Erramchetty, S.K.; Monica, K.M. LeafVisionNet: A deep learning-based approach for the classification of black gram leaf disease using attention-driven and semi-local feature boosted SqueezeNet. Smart Agricultural Technology 2025, 12, 101245. [Google Scholar] [CrossRef]
- Aboonajmi, M.; Abbaszadeh, R.; Ramezani, M. Non-destructive acoustic evaluation of potato tuber quality using machine learning techniques. Computers and Electronics in Agriculture 2021, 183, 106042. [Google Scholar]
- Przybylak, A.; Kozłowski, R.; Osuch, E.; Osuch, A.; Rybacki, P.; Przygodziński, P. Quality Evaluation of Potato Tubers Using Neural Image Analysis Method. Agriculture 2020, 10, 112. [Google Scholar] [CrossRef]
- Wei, Q.; Wang, X.; Zhang, J.; Zhao, L.; Chen, X. Nondestructive perception of potato quality in actual online production based on cross-modal technology. International Journal of Agricultural and Biological Engineering 2023, 16, 280–290. [Google Scholar] [CrossRef]
- Kingma, D.P.; Ba, J.L. Adam: A Method for Stochastic Optimization. arXiv (Cornell University). 2014. [Google Scholar] [CrossRef]
- He, L.; Zhang, B.; Wu, Q.; Huang, X. Dual-channel deep learning approach for potato tuber quality classification using visible and NIR images. Sensors 2021, 21, 1294. [Google Scholar] [CrossRef]
- Karimi, Y.; Alizadeh, M.R.; Omid, M. Evaluation of potato internal quality using NIR spectroscopy and machine learning techniques. Infrared Physics & Technology 2020, 108, 103327. [Google Scholar] [CrossRef]
- Polder, G.; van der Heijden, G.W.A.M.; van Doorn, J.; Kamp, J. Detection of potato diseases and defects using multispectral imaging and machine learning. Biosystems Engineering 2019, 178, 235–246. [Google Scholar] [CrossRef]
- Qi, C.; Huang, J.; Wang, J.; Dong, W.; Liu, M.; Xu, B. In-field early disease recognition of potato late blight based on deep learning and proximal hyperspectral imaging. arXiv 2021, arXiv:2111.12155. https://arxiv.org/abs/2111, 12155. [Google Scholar] [CrossRef]
- Zhao, C.; Zhang, J.; Wang, D.; Li, Z. Evaluation of starch content in potatoes using NIR hyperspectral imaging combined with feature selection algorithms and PLSR. Computers and Electronics in Agriculture 2023, 203, 107482. [Google Scholar] [CrossRef]
- Maskeliūnas, R.; Damaševičius, R.; Krilavičius, T. Deep learning-based potato tuber detection and segmentation using Mask R-CNN. Foods 2022, 11, 1131. [Google Scholar] [CrossRef]
- Liu, Y.; Sun, X.; Zhang, J.; He, Y. Frying aptitude classification of potatoes using hyperspectral imaging and multivariate analysis. Food Chemistry 2019, 278, 121–127. [Google Scholar] [CrossRef]
- Xie, W.; Liu, H.; Wang, Y.; Zhang, Y.; Feng, Y. Design of a multi-view machine vision system for shape-based potato sorting. Computers and Electronics in Agriculture 2022, 194, 106739. [Google Scholar] [CrossRef]
- Lu, R.; Chen, K.; Xu, M. Detection of surface defects on potatoes using machine vision and GLCM texture analysis. Computers and Electronics in Agriculture 2020, 170, 105234. [Google Scholar] [CrossRef]
- Baranowski, P.; Mazurek, W.; Pastuszka-Woźniak, J.; Walczak, R. Detection of internal defects in potatoes using thermal and hyperspectral imaging. Biosystems Engineering 2019, 179, 135–149. [Google Scholar] [CrossRef]
- Singh, D.; Jain, M.; Arora, A. Real-time potato grading system using lightweight convolutional neural networks. Journal of Food Engineering 2020, 282, 110036. [Google Scholar] [CrossRef]
- Ghassemian, H.; Nikkhah, M.; Fathi, M. Maturity estimation of potato tubers using deep convolutional neural networks and color analysis. Postharvest Biology and Technology 2021, 178, 111549. [Google Scholar] [CrossRef]
- Han, D.; Zhang, M.; Wang, Y. Non-destructive estimation of potato density and mass using ultrasound technology. Journal of Food Measurement and Characterization 2020, 14, 2191–2200. [Google Scholar] [CrossRef]
- Zhao, P.; Jia, X.; Lin, H.; Zhang, W.; Li, H.; Zhao, Y. Non-destructive detection of external defects in potatoes using hyperspectral imaging and machine learning. Agriculture 2023, 13, 35. [Google Scholar] [CrossRef]
- Azizi, M.; Movahedi, M.M.; Ebrahimie, E.; Mahdavian, K. Classification of potato cultivars using artificial neural networks based on morphological traits. Plants 2021, 10, 1904. [Google Scholar] [CrossRef]
- Azizi, A.; Abbaspour-Gilandeh, Y.; Nooshyar, M.; Afkari-Sayah, A. Identifying Potato Varieties Using Machine Vision and Artificial Neural Networks. International Journal of Food Properties 2016, 19, 618–635. [Google Scholar] [CrossRef]
- Johnson, C.M.; Estrada, J.S.; Cheein, F.A. Potato plant phenotyping and characterisation utilising machine learning techniques: A state-of-the-art review and current trends. Computers and Electronics in Agriculture 2025, 234, 110304. [Google Scholar] [CrossRef]
- Su, Q.; Wang, Y.; Zhang, Z. Potato quality grading based on machine vision and 3D shape analysis. Computers and Electronics in Agriculture 2018, 152, 117–125. [Google Scholar] [CrossRef]
- Ma, X.; Li, Y.; Wan, L.; Xu, Z.; Song, J.; Huang, J. Classification of seed corn ears based on custom lightweight convolutional neural network and improved training strategies. Engineering Applications of Artificial Intelligence 2023, 120, 105936. [Google Scholar] [CrossRef]
Figure 1.
Kazakhstan potato varieties, included in the study.
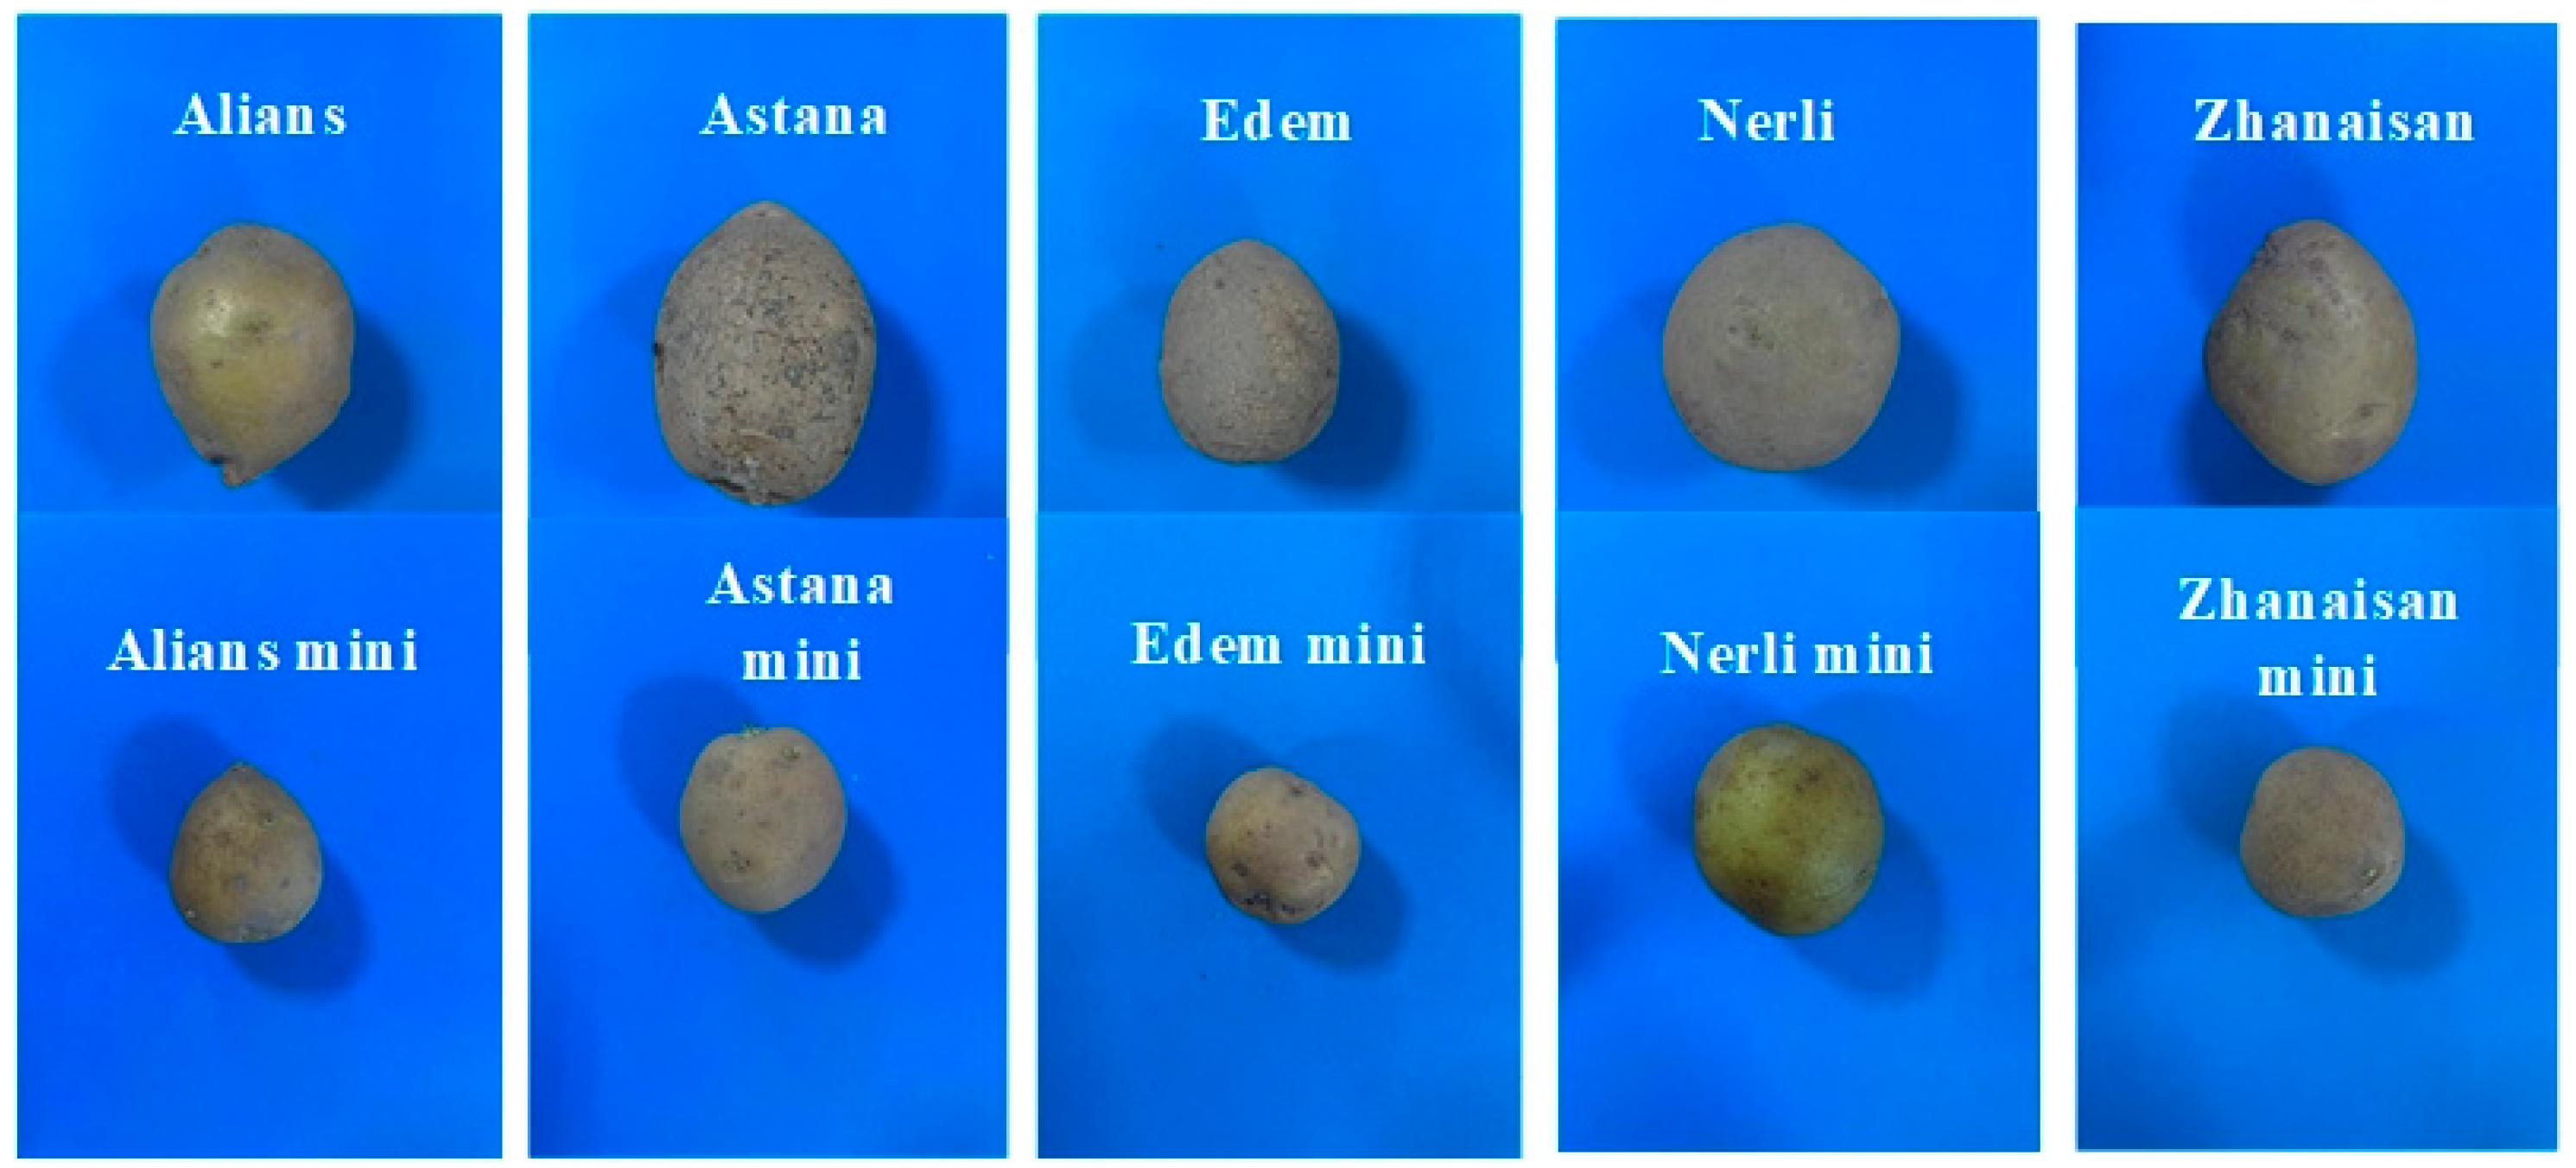
Figure 2.
Potato tuber imaging workstation.
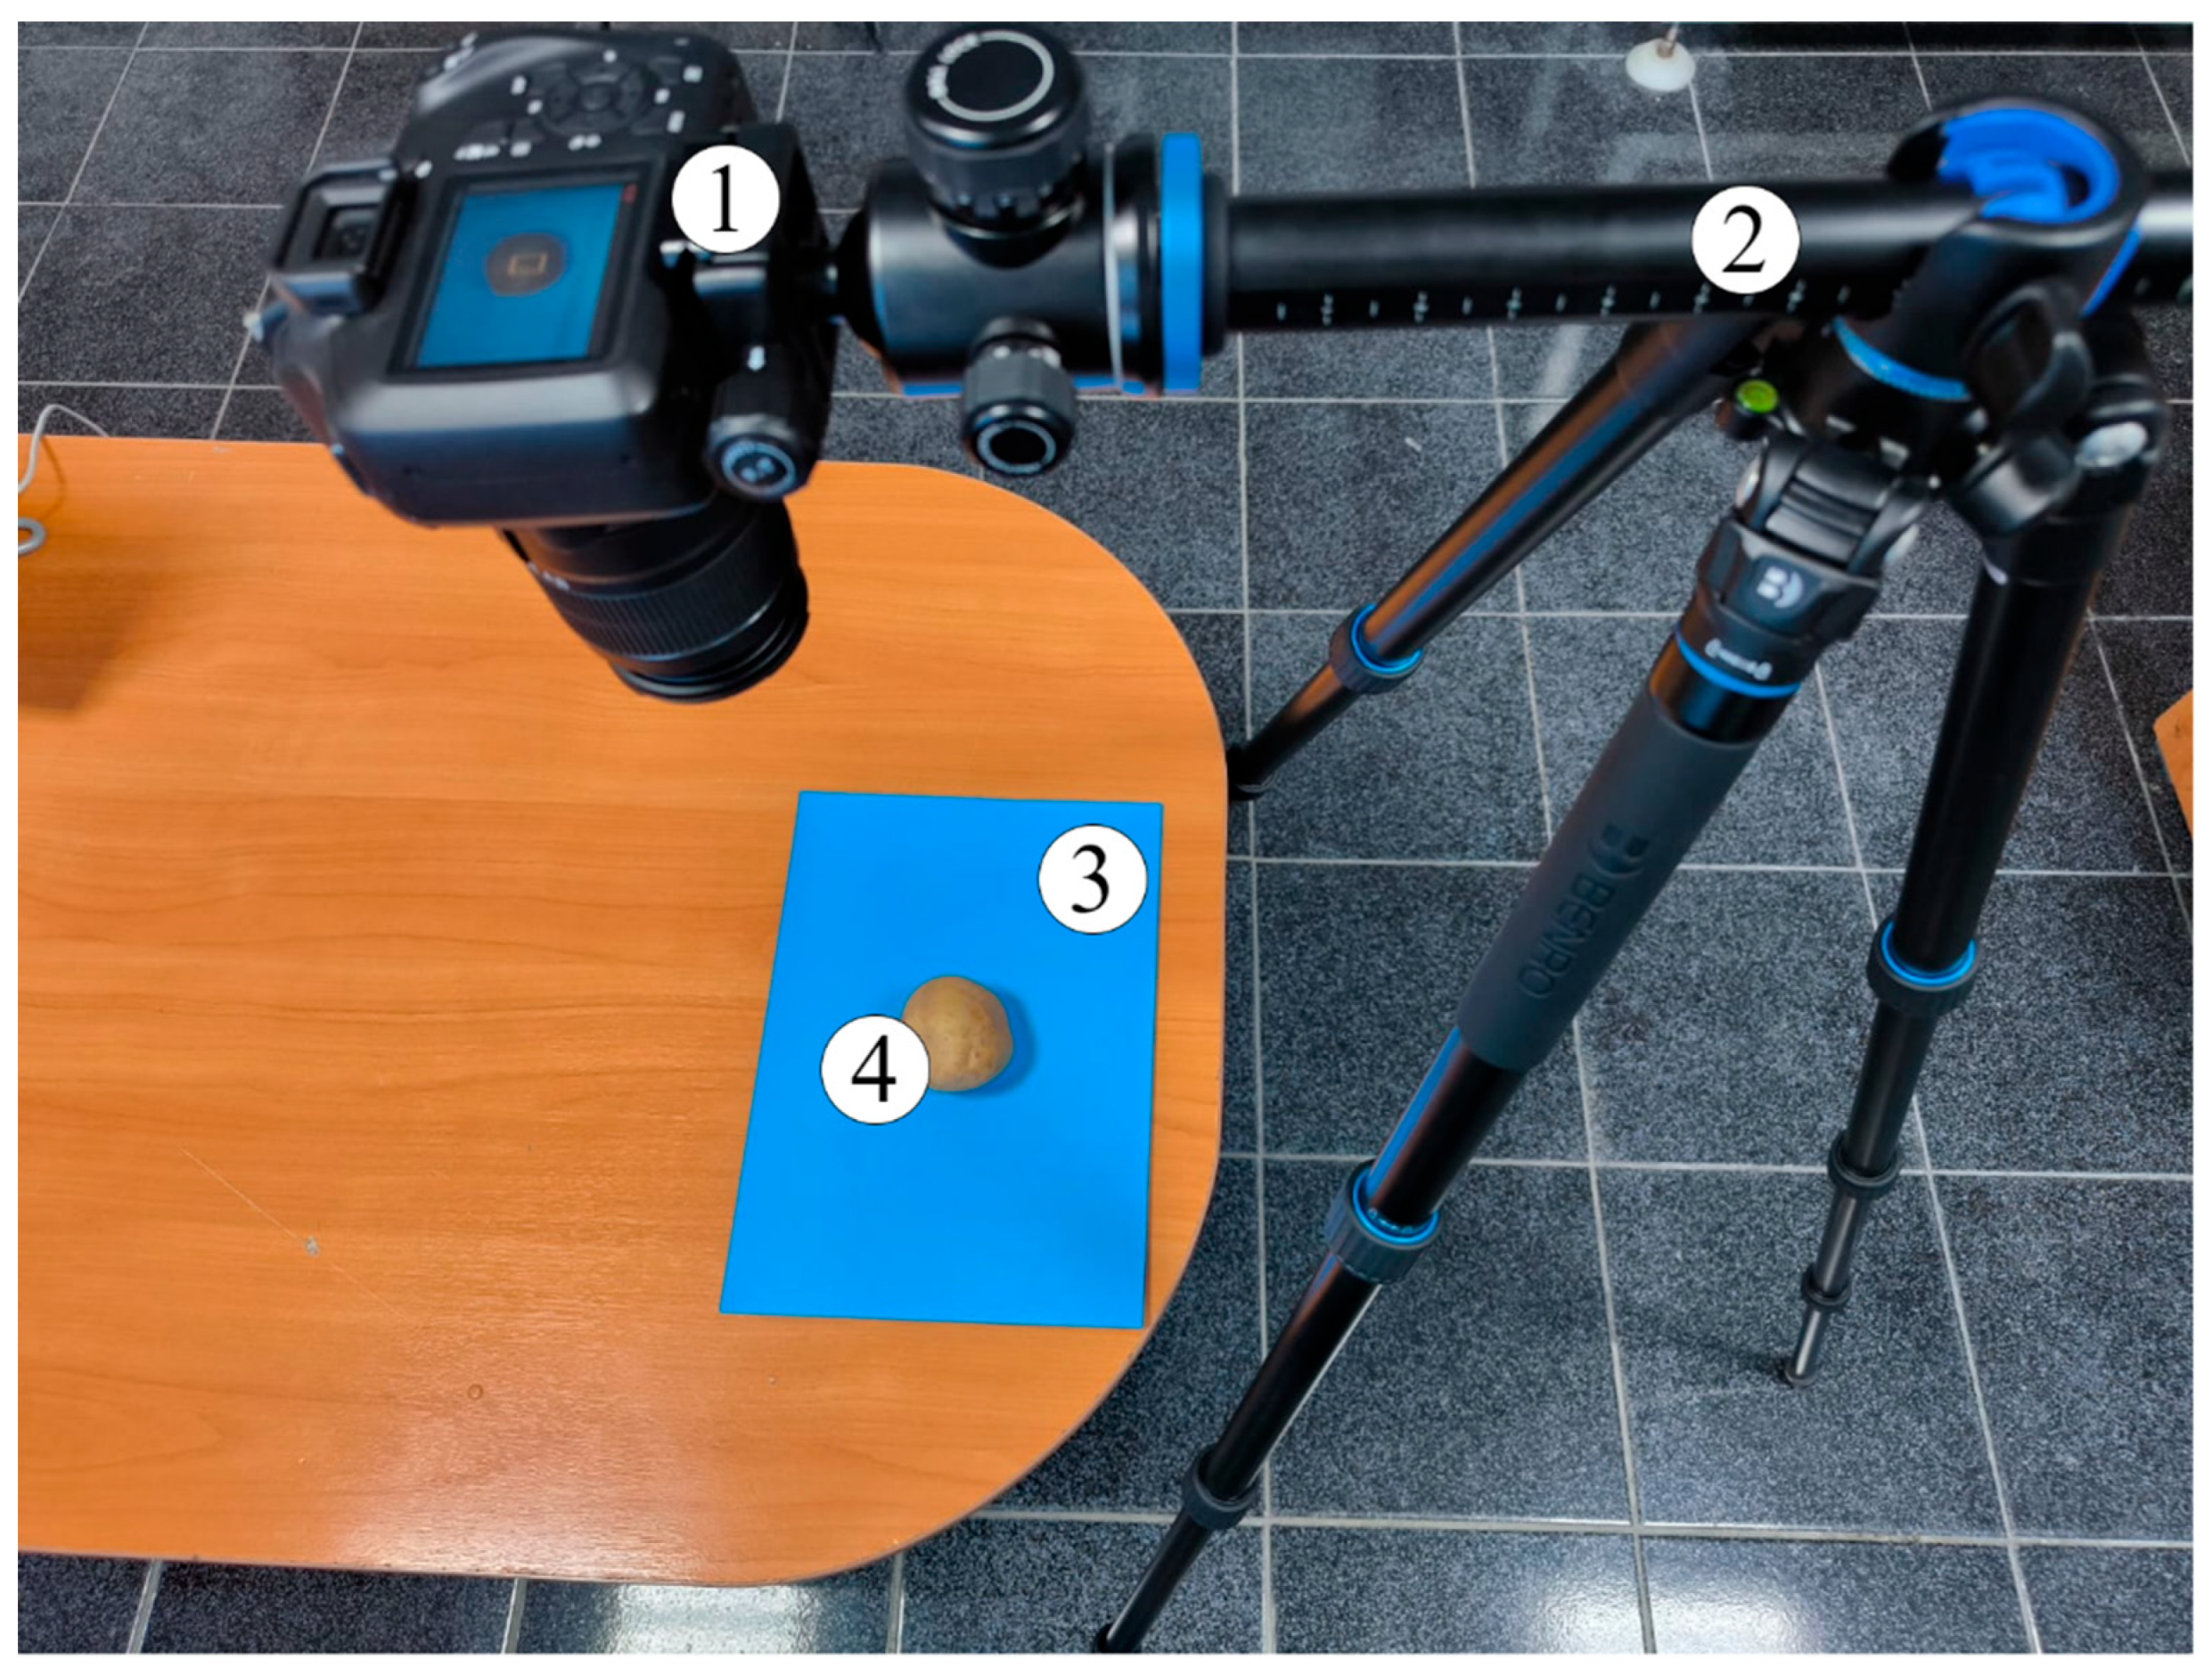
Figure 3.
Images of potatoes of the Alians variety.
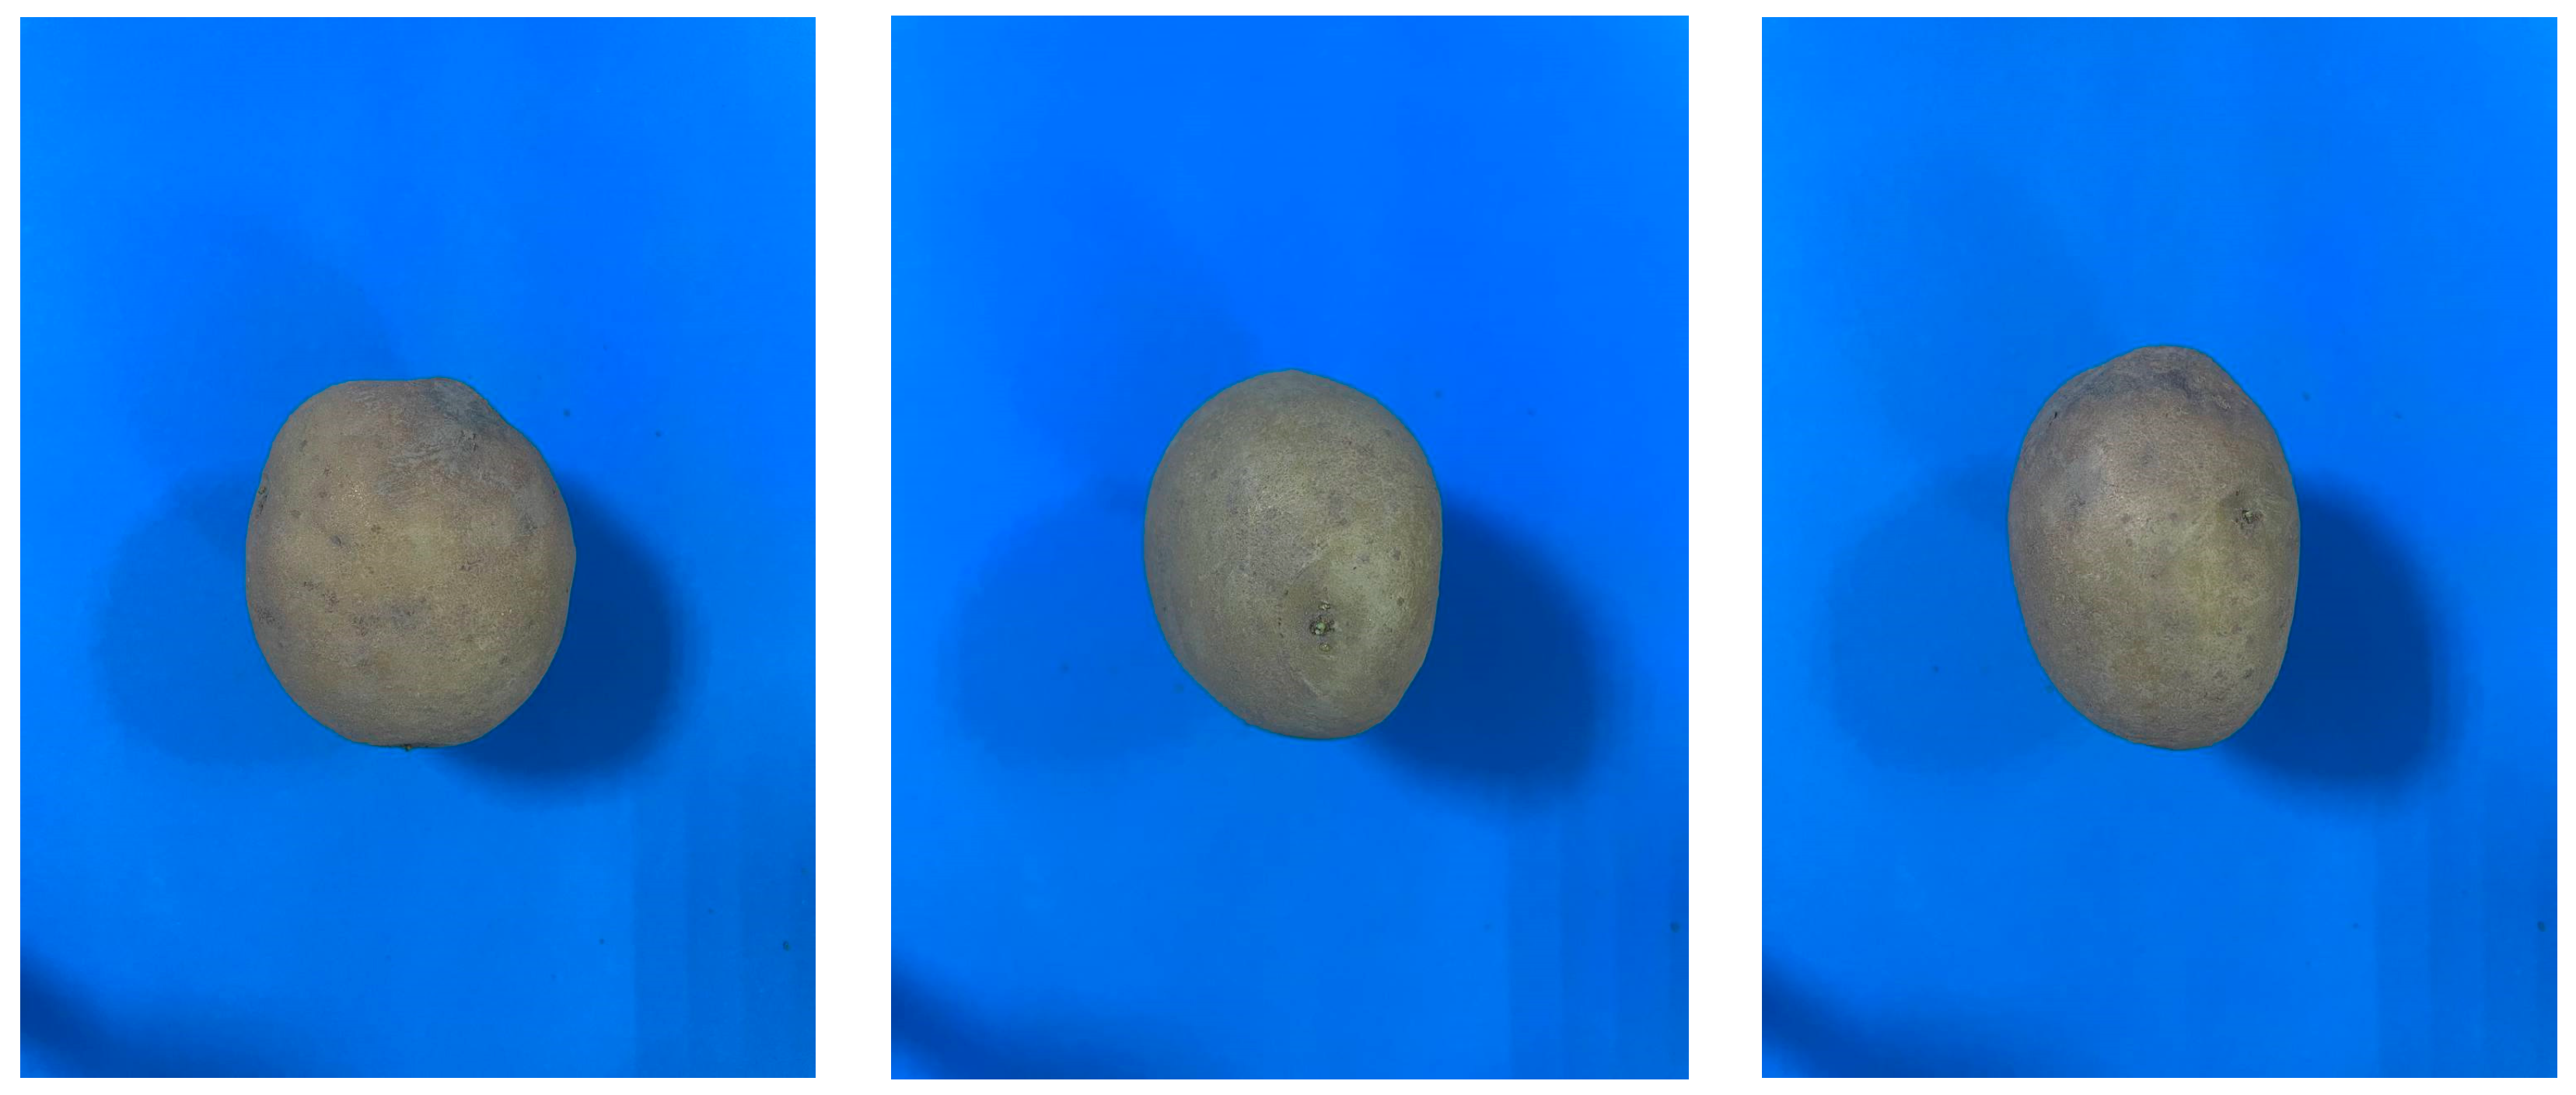
Figure 4.
An algorithm for identifying the variety of potatoes via a digital method.
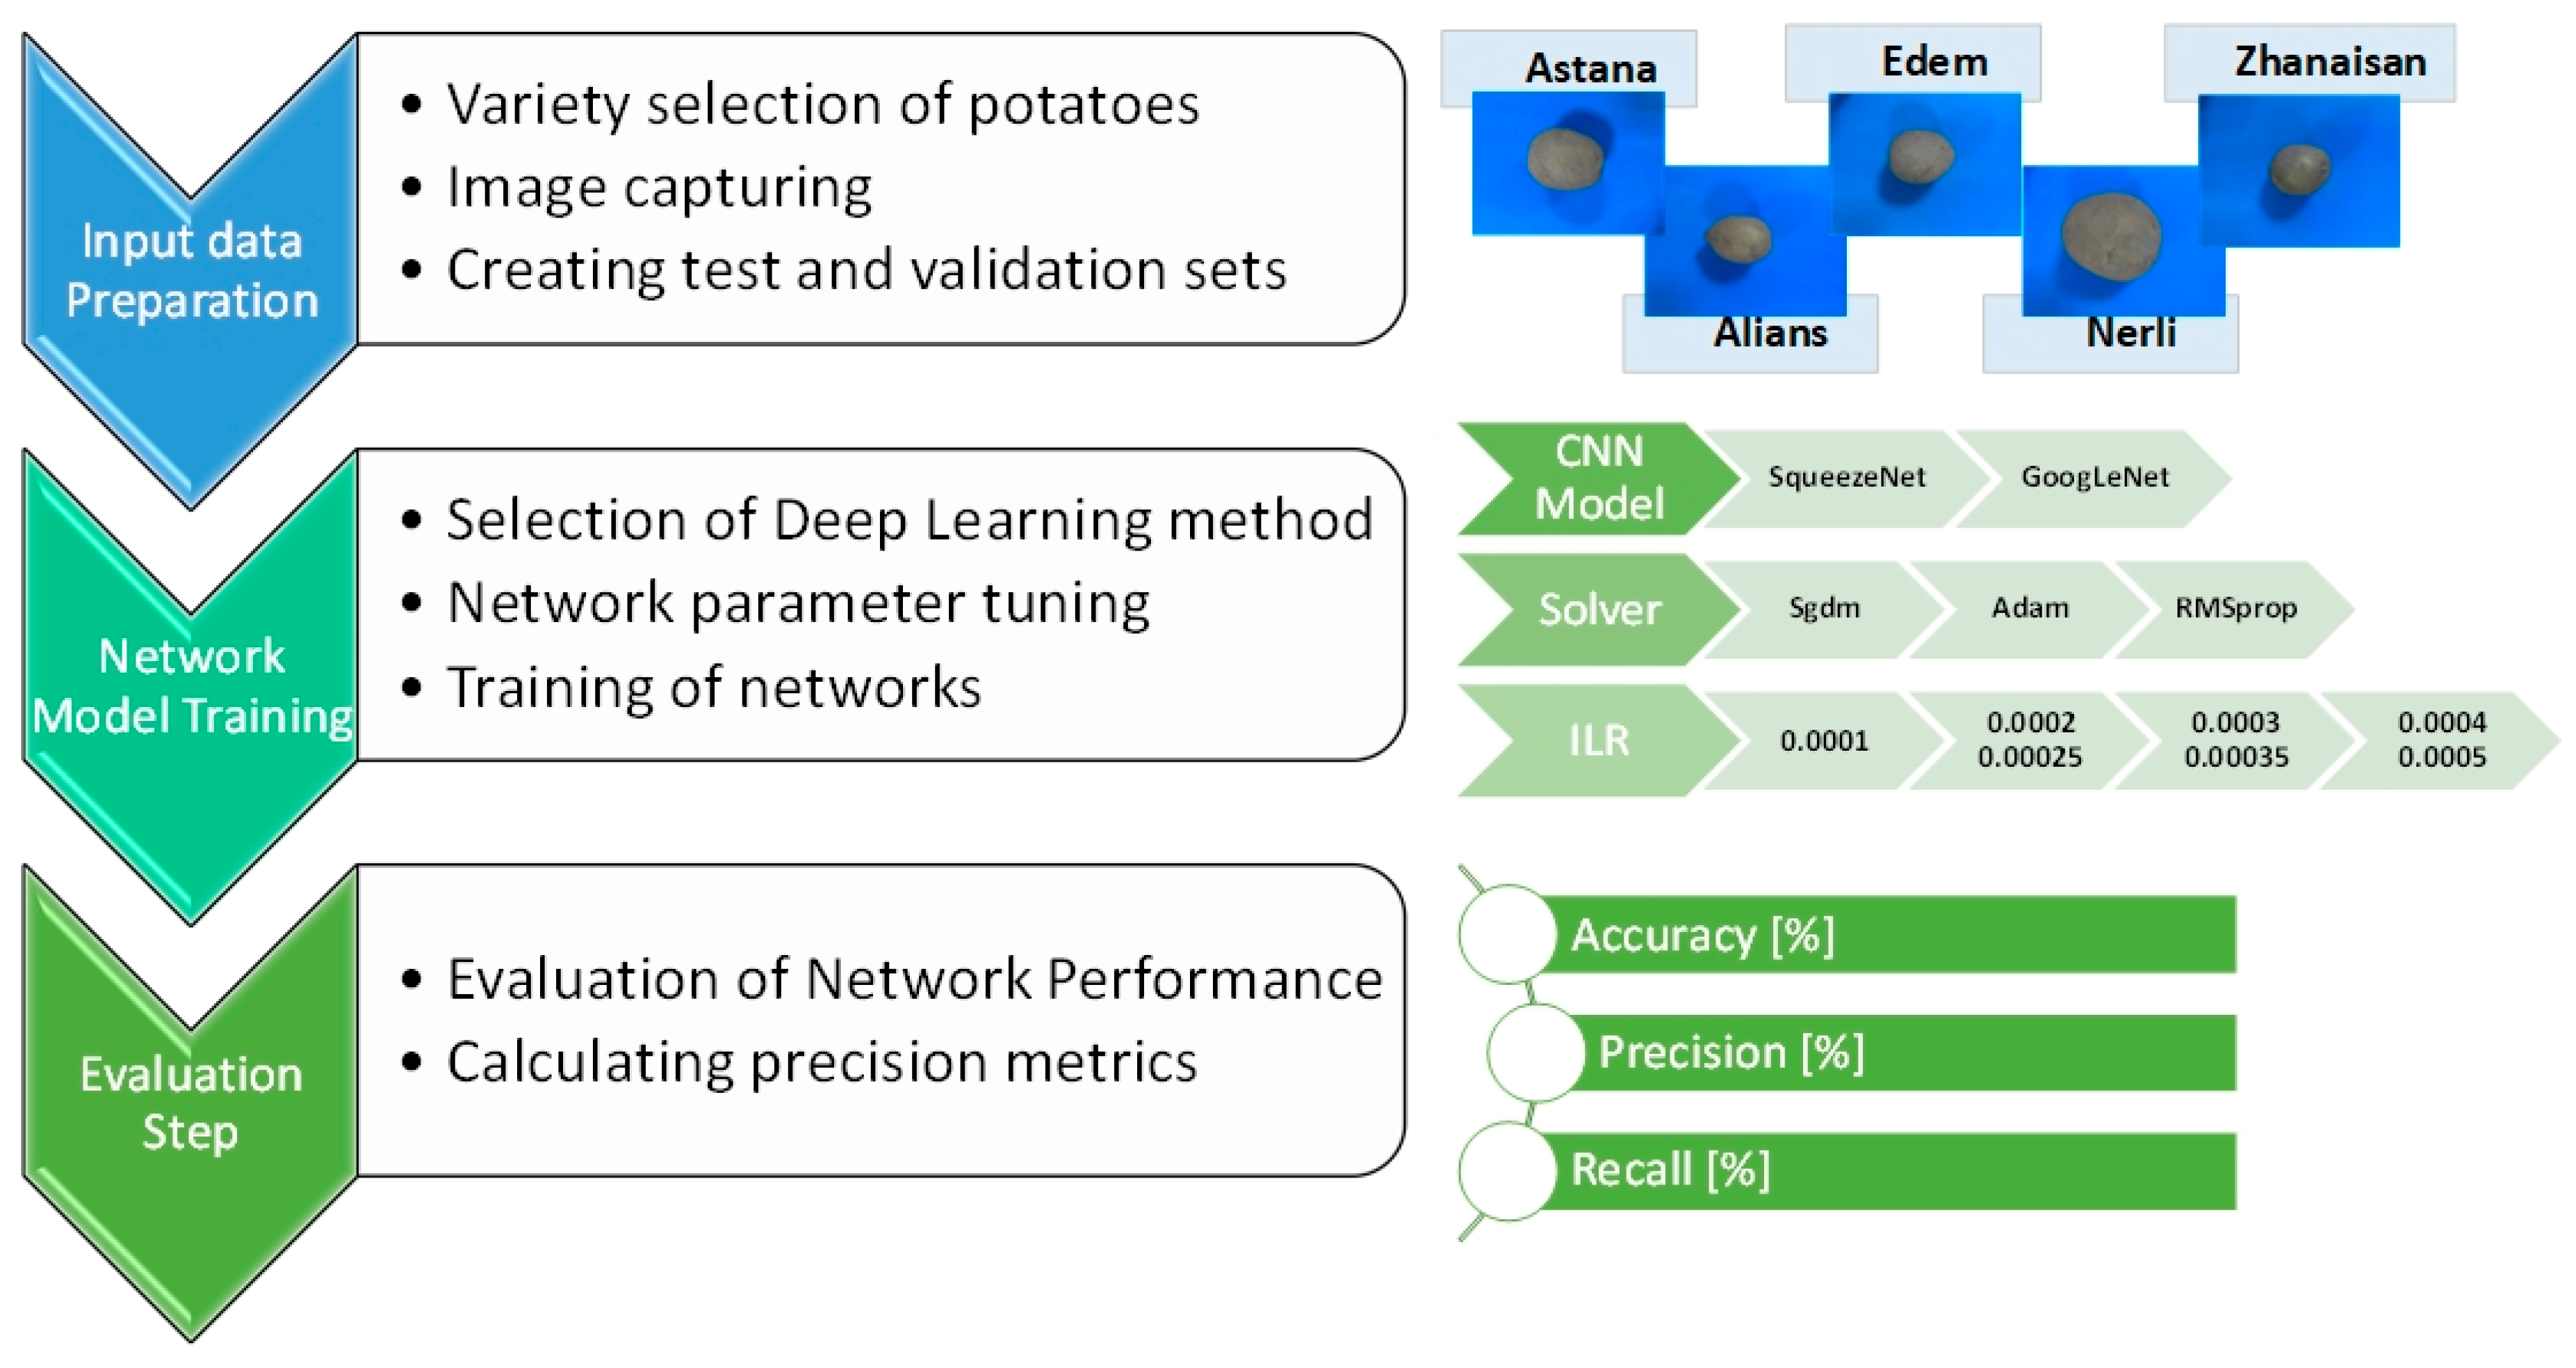
Figure 5.
Training Accuracy and Training Loss values for SqueezeNet, solver Sgdm at Initial Learning Rate 0.0001.
Figure 5.
Training Accuracy and Training Loss values for SqueezeNet, solver Sgdm at Initial Learning Rate 0.0001.
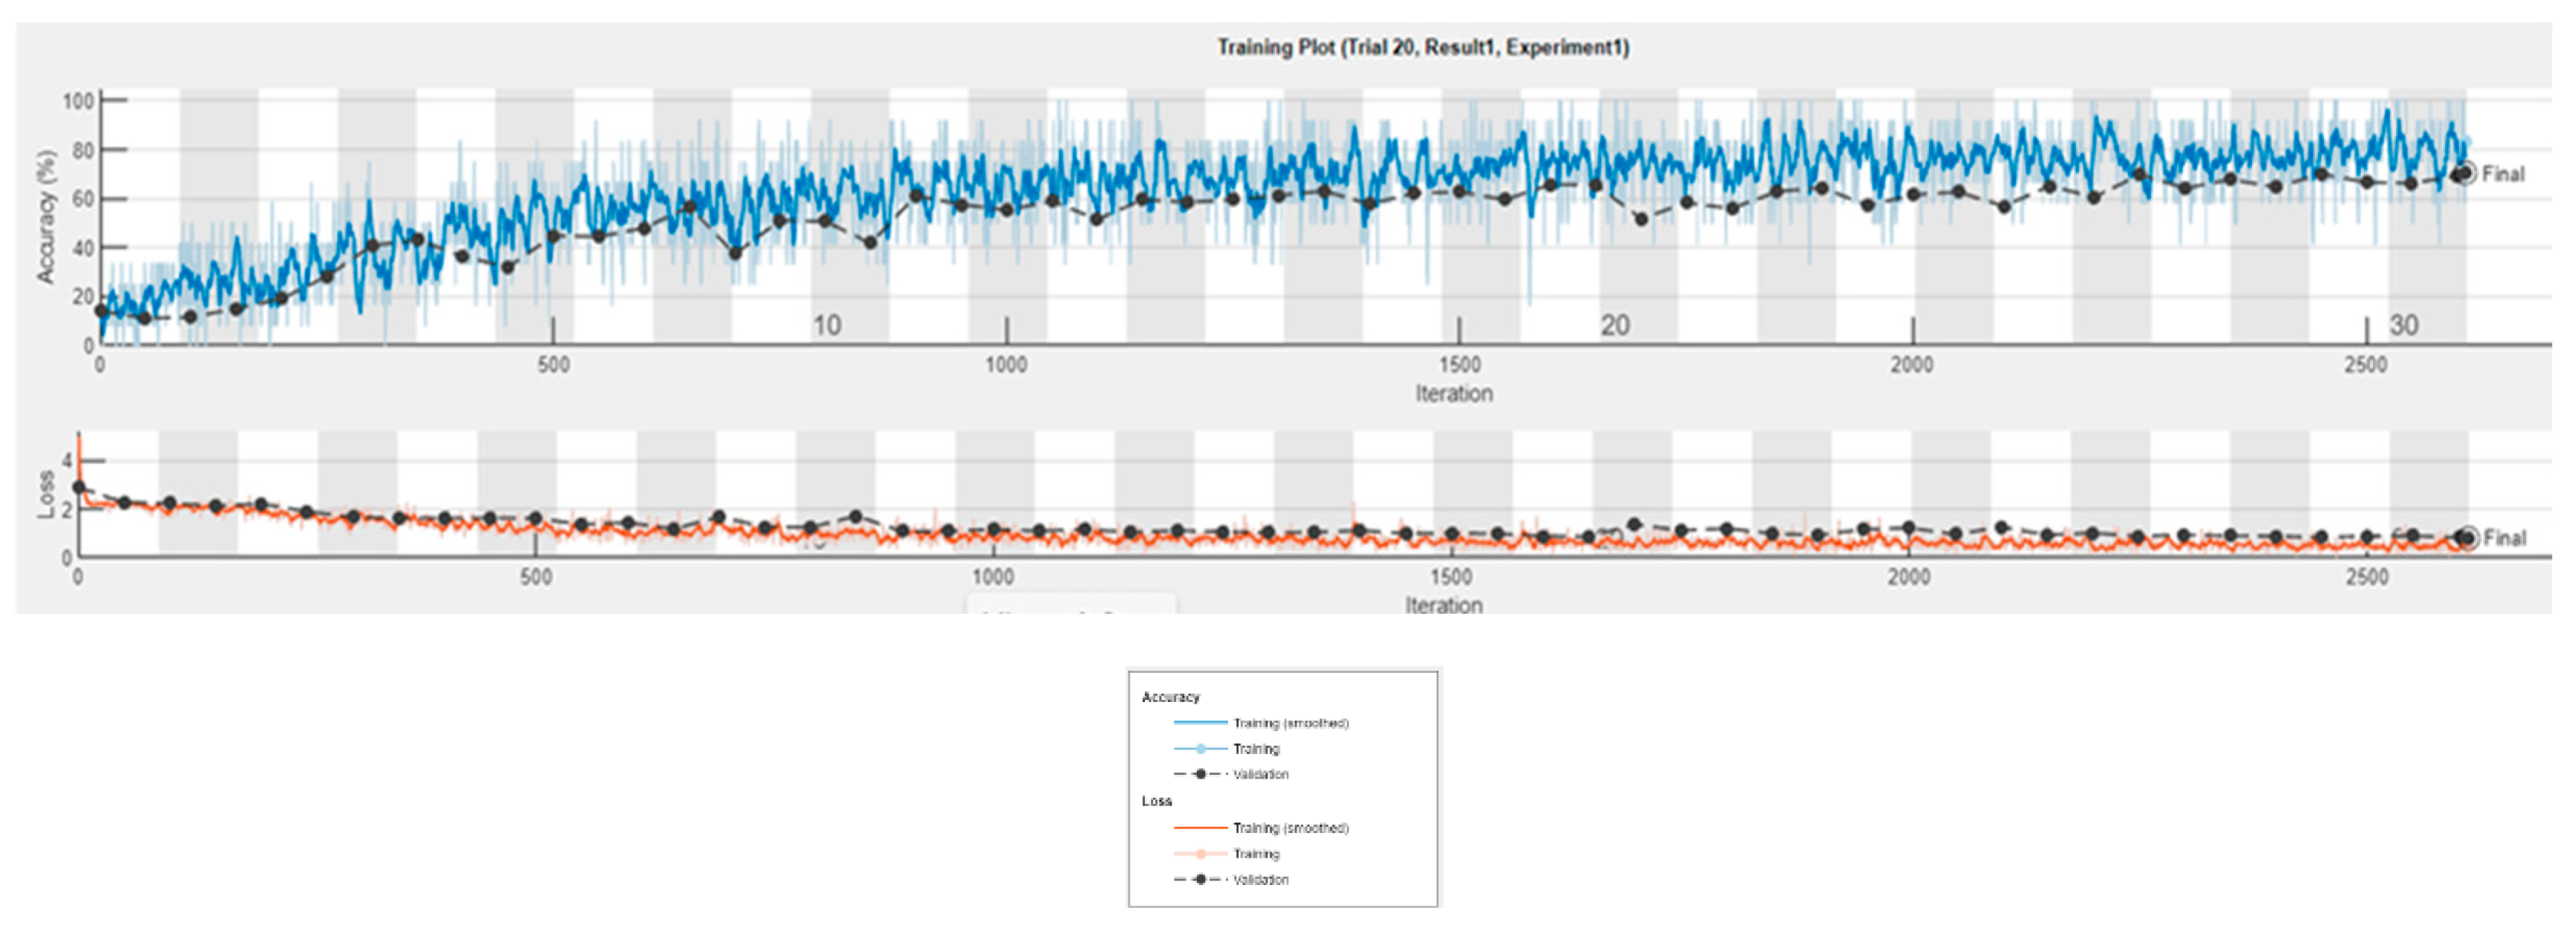
Figure 6.
Training Accuracy and Training Loss values for GoogLeNet, solver Sgdm at Initial Learning Rate 0.0001.
Figure 6.
Training Accuracy and Training Loss values for GoogLeNet, solver Sgdm at Initial Learning Rate 0.0001.
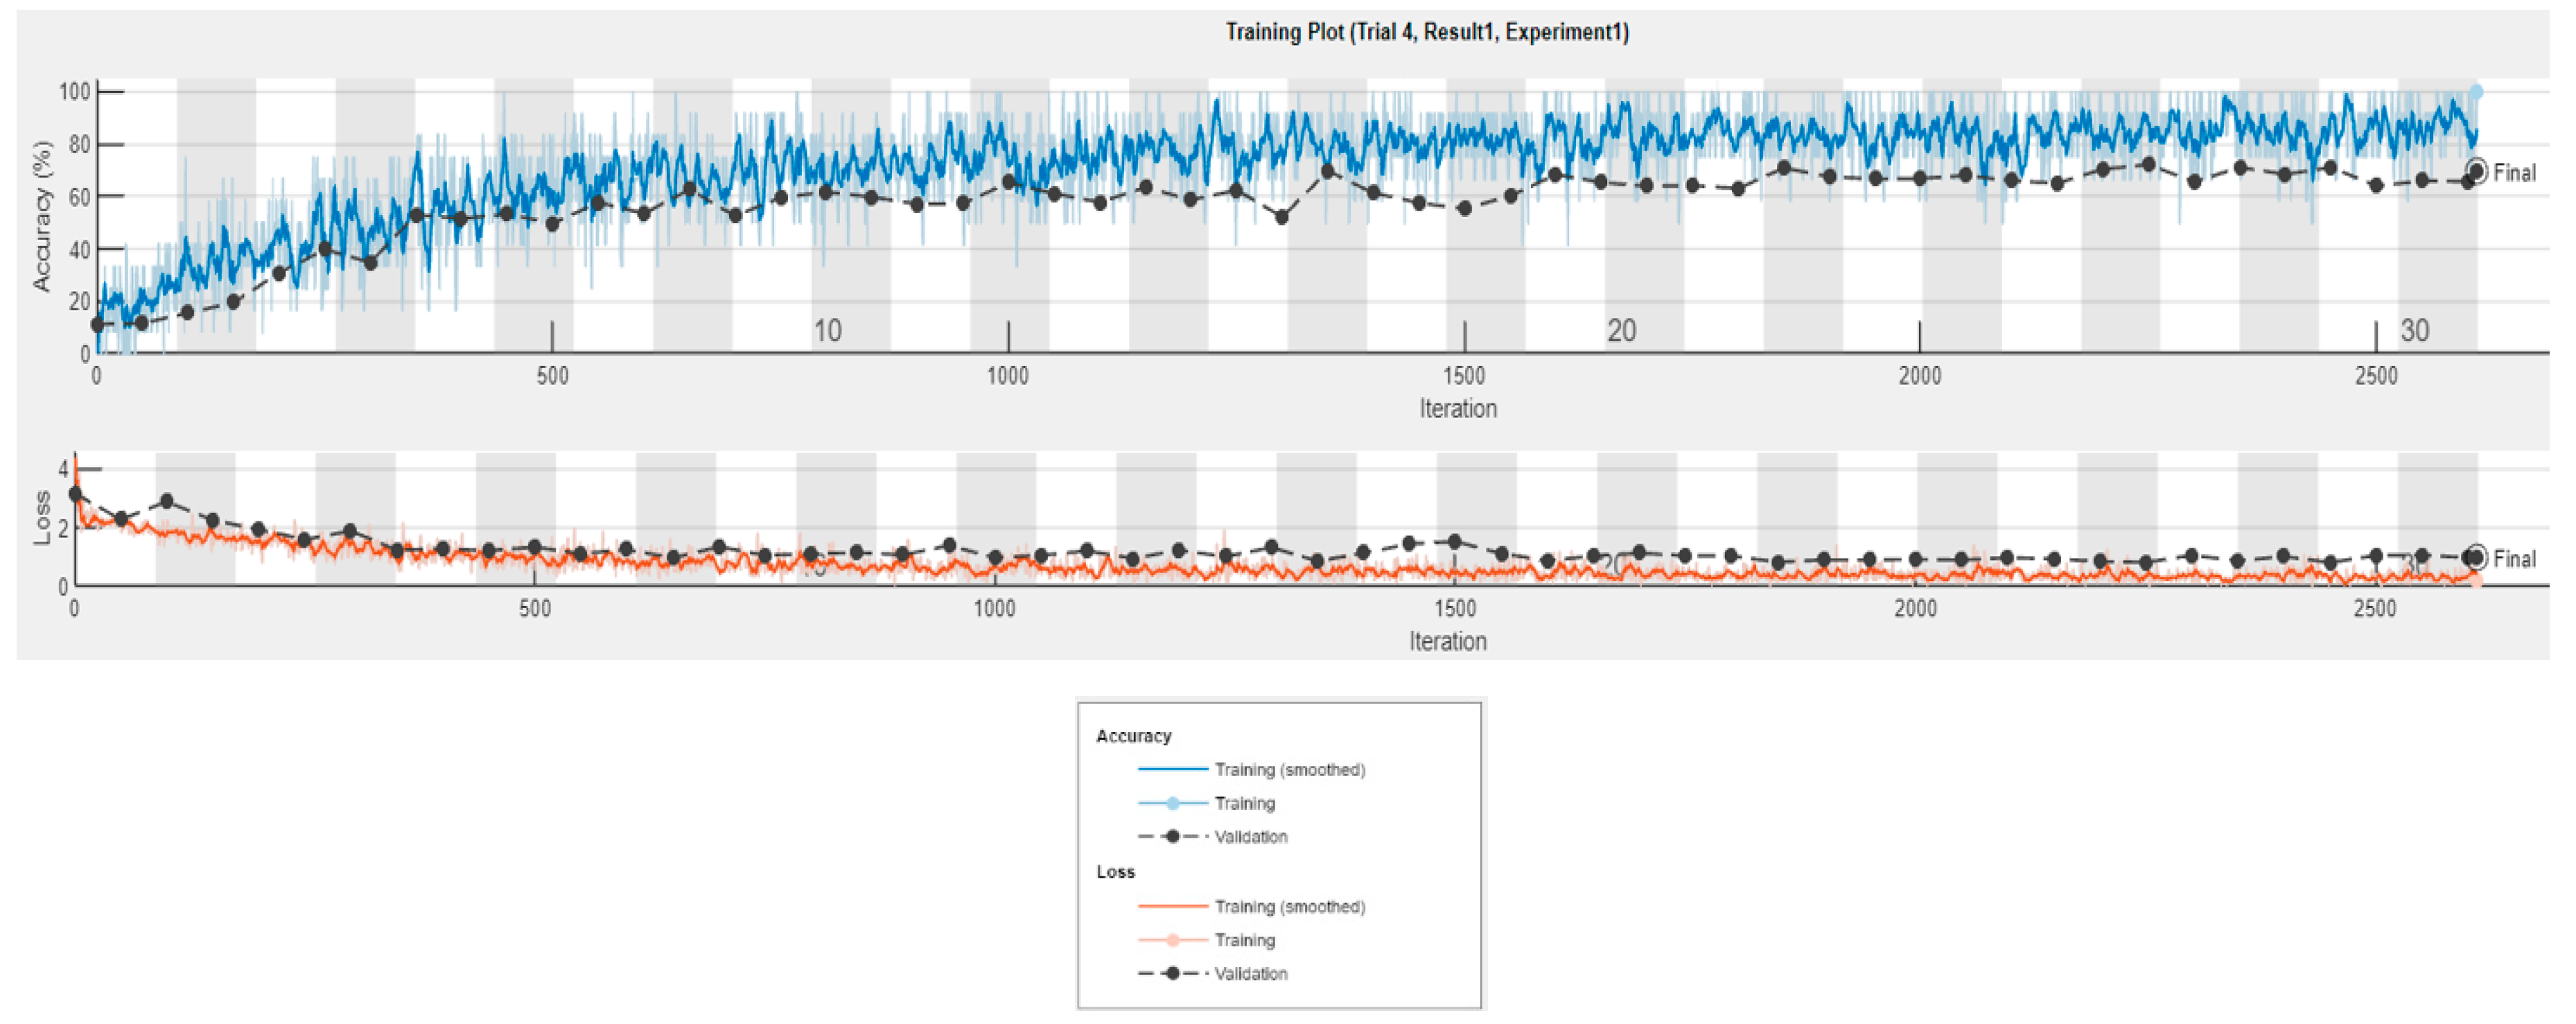
Figure 7.
Validation Accuracy (a) and Validation Loss (c) values for SqueezeNet; Validation Accuracy (b) and Validation Loss values (d) for GoogLeNet at different Initial Learning Rates.
Figure 7.
Validation Accuracy (a) and Validation Loss (c) values for SqueezeNet; Validation Accuracy (b) and Validation Loss values (d) for GoogLeNet at different Initial Learning Rates.
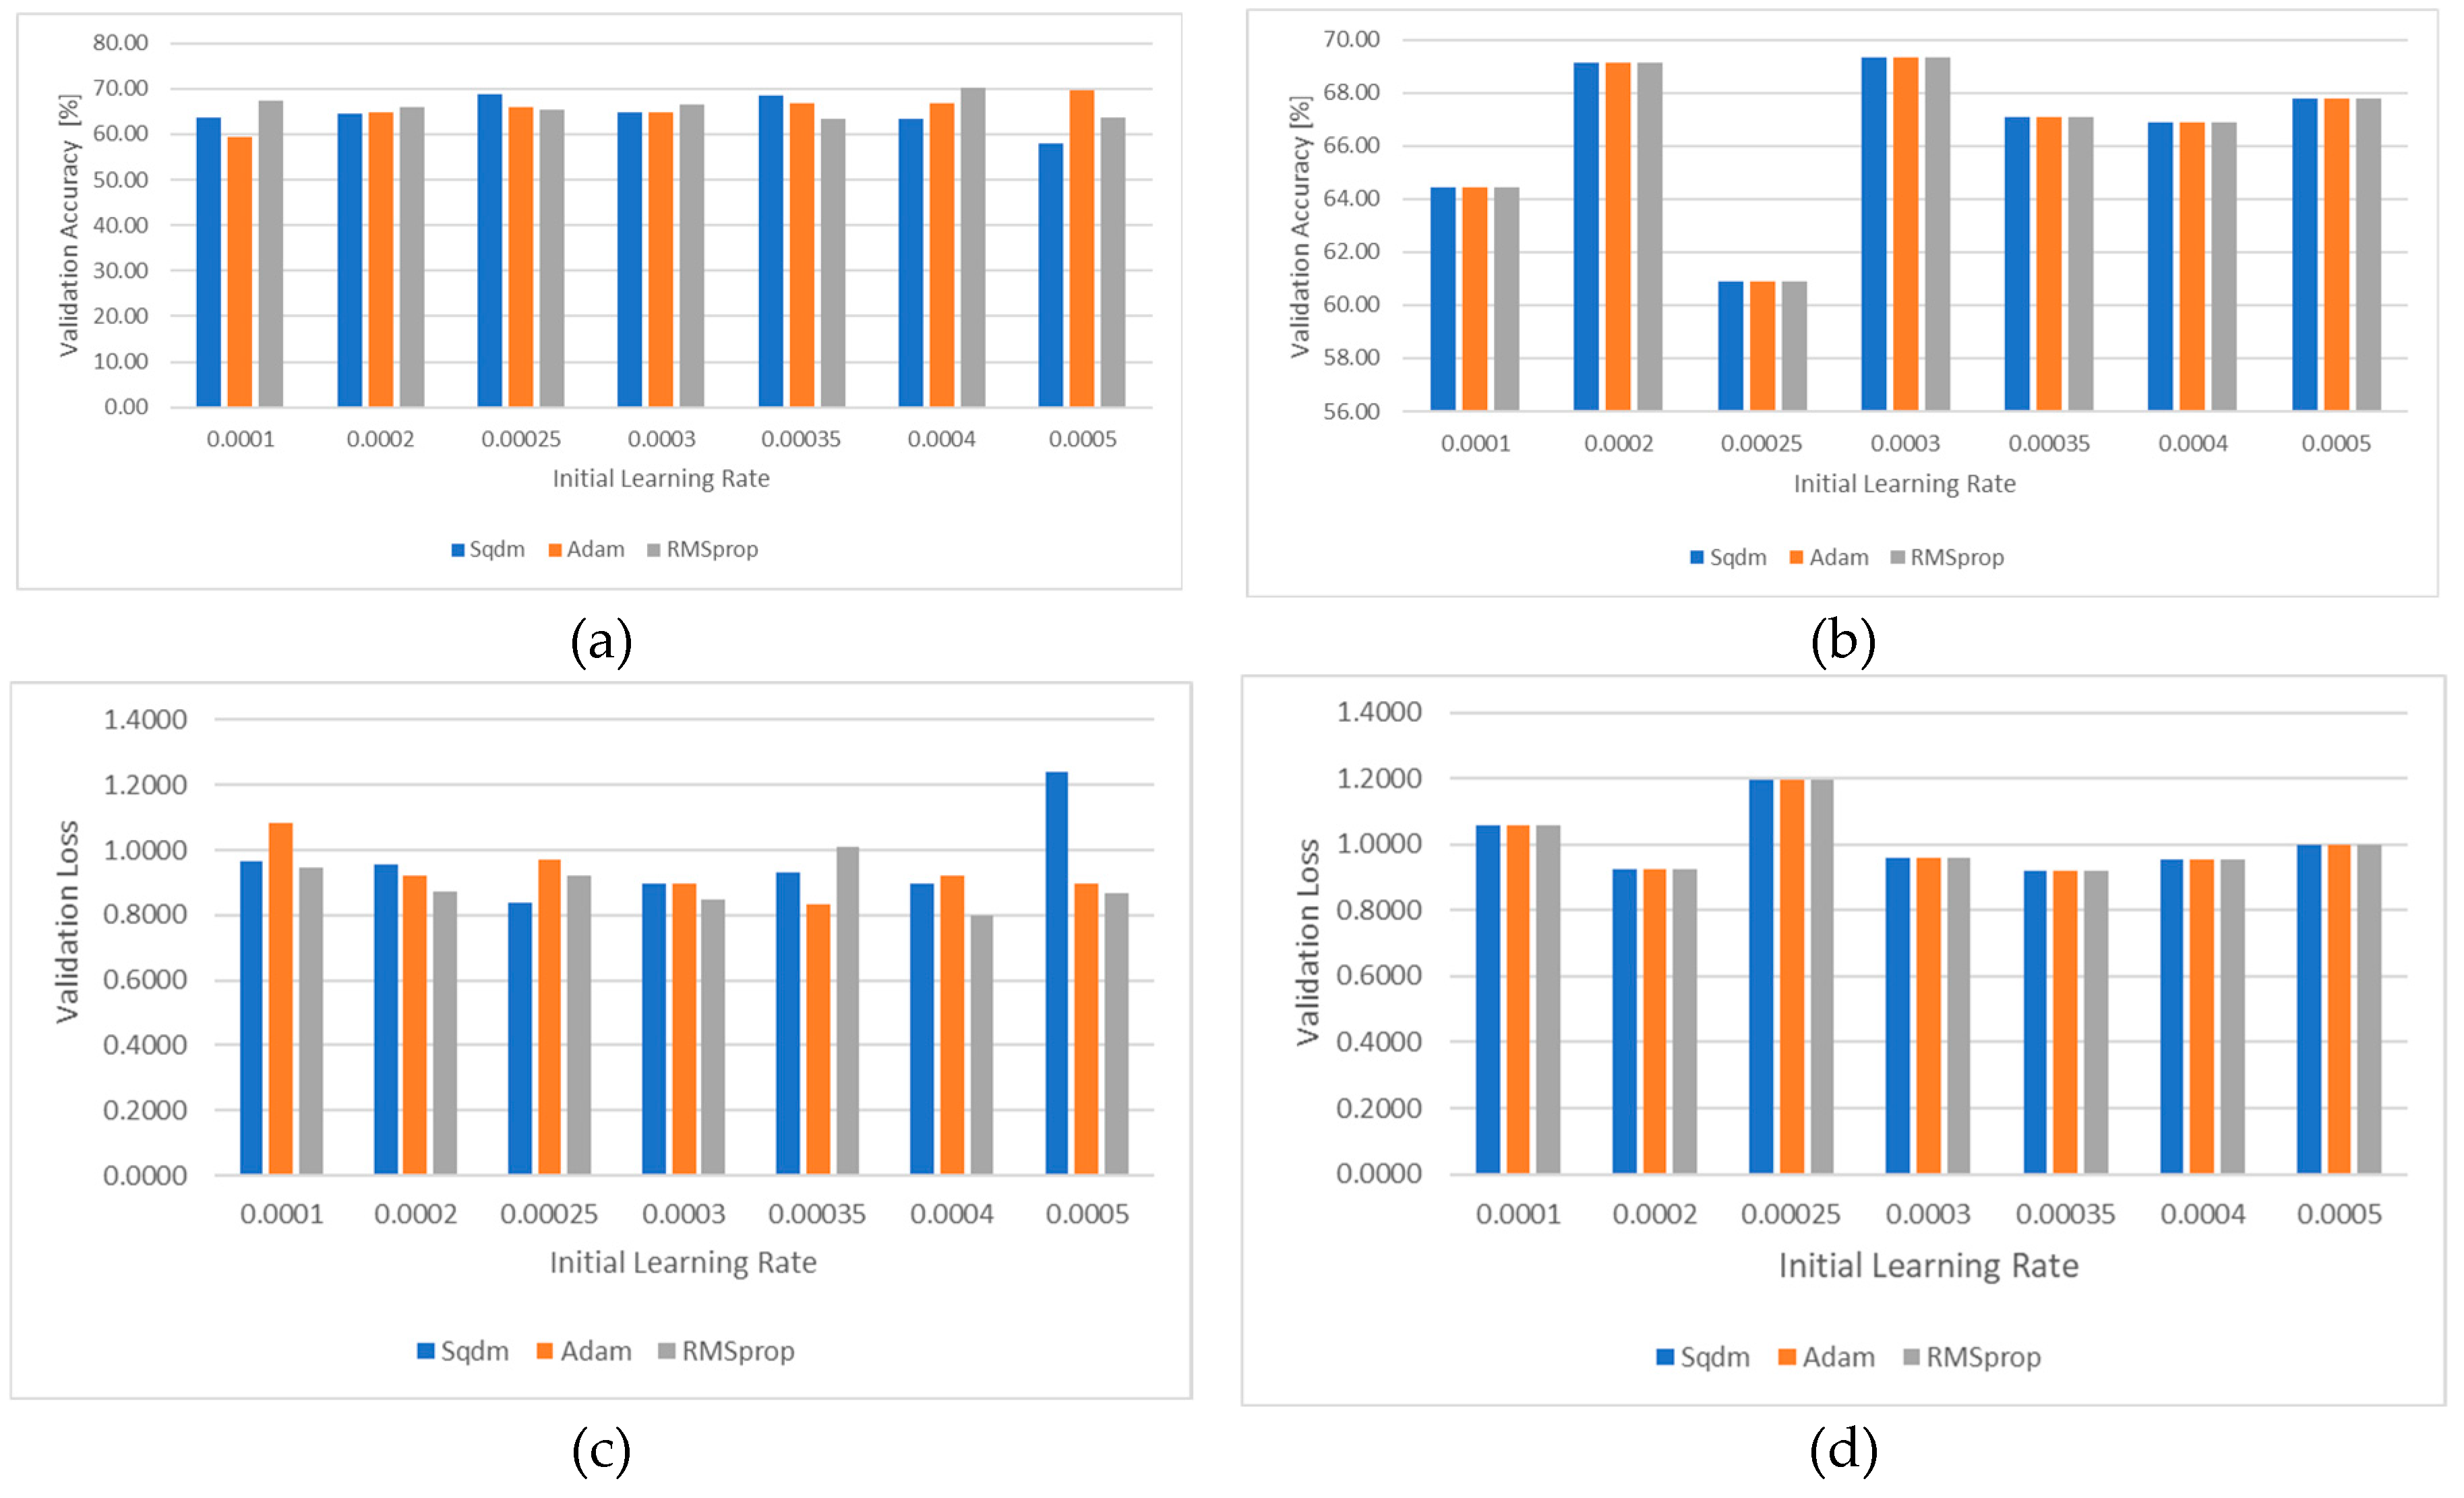
Figure 8.
Recall values for SqueezeNet (a,b,c) and GoogLeNet (d) under different network optimization algorithms.
Figure 8.
Recall values for SqueezeNet (a,b,c) and GoogLeNet (d) under different network optimization algorithms.
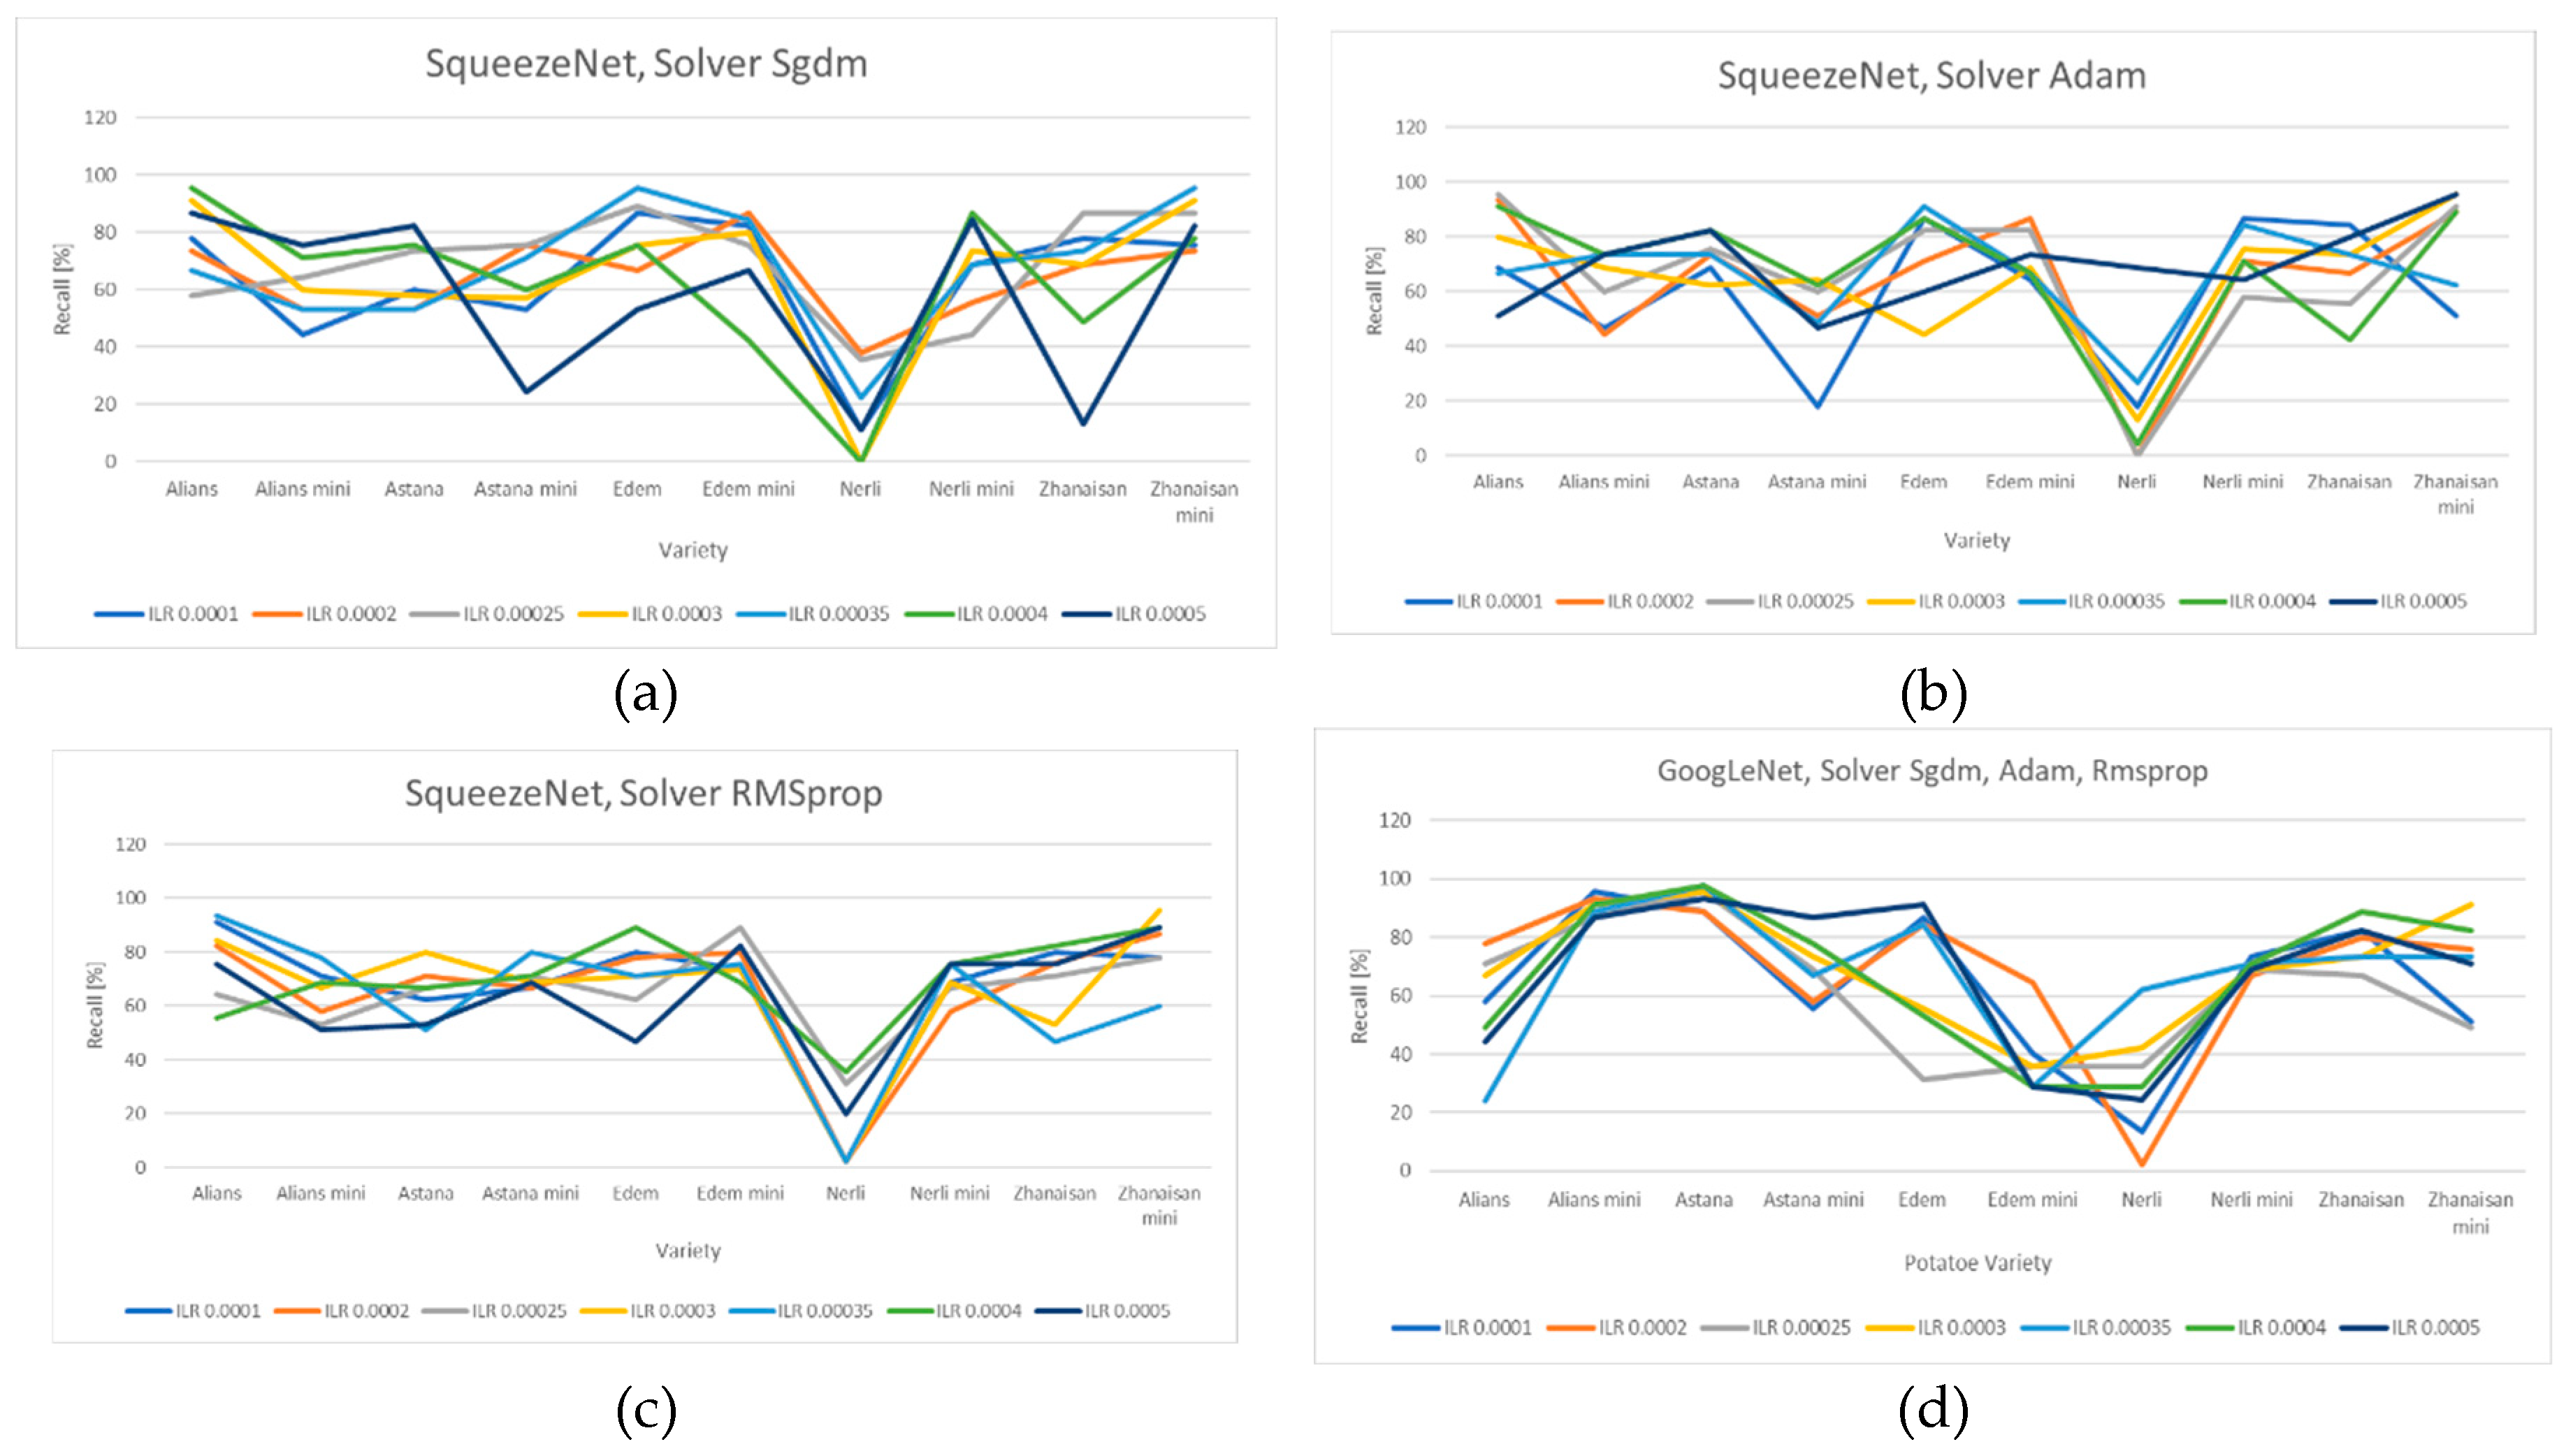
Figure 9.
Confusion matrix for validation set for SqueezeNet, Solver Sgdm and ILR= 0.00025.
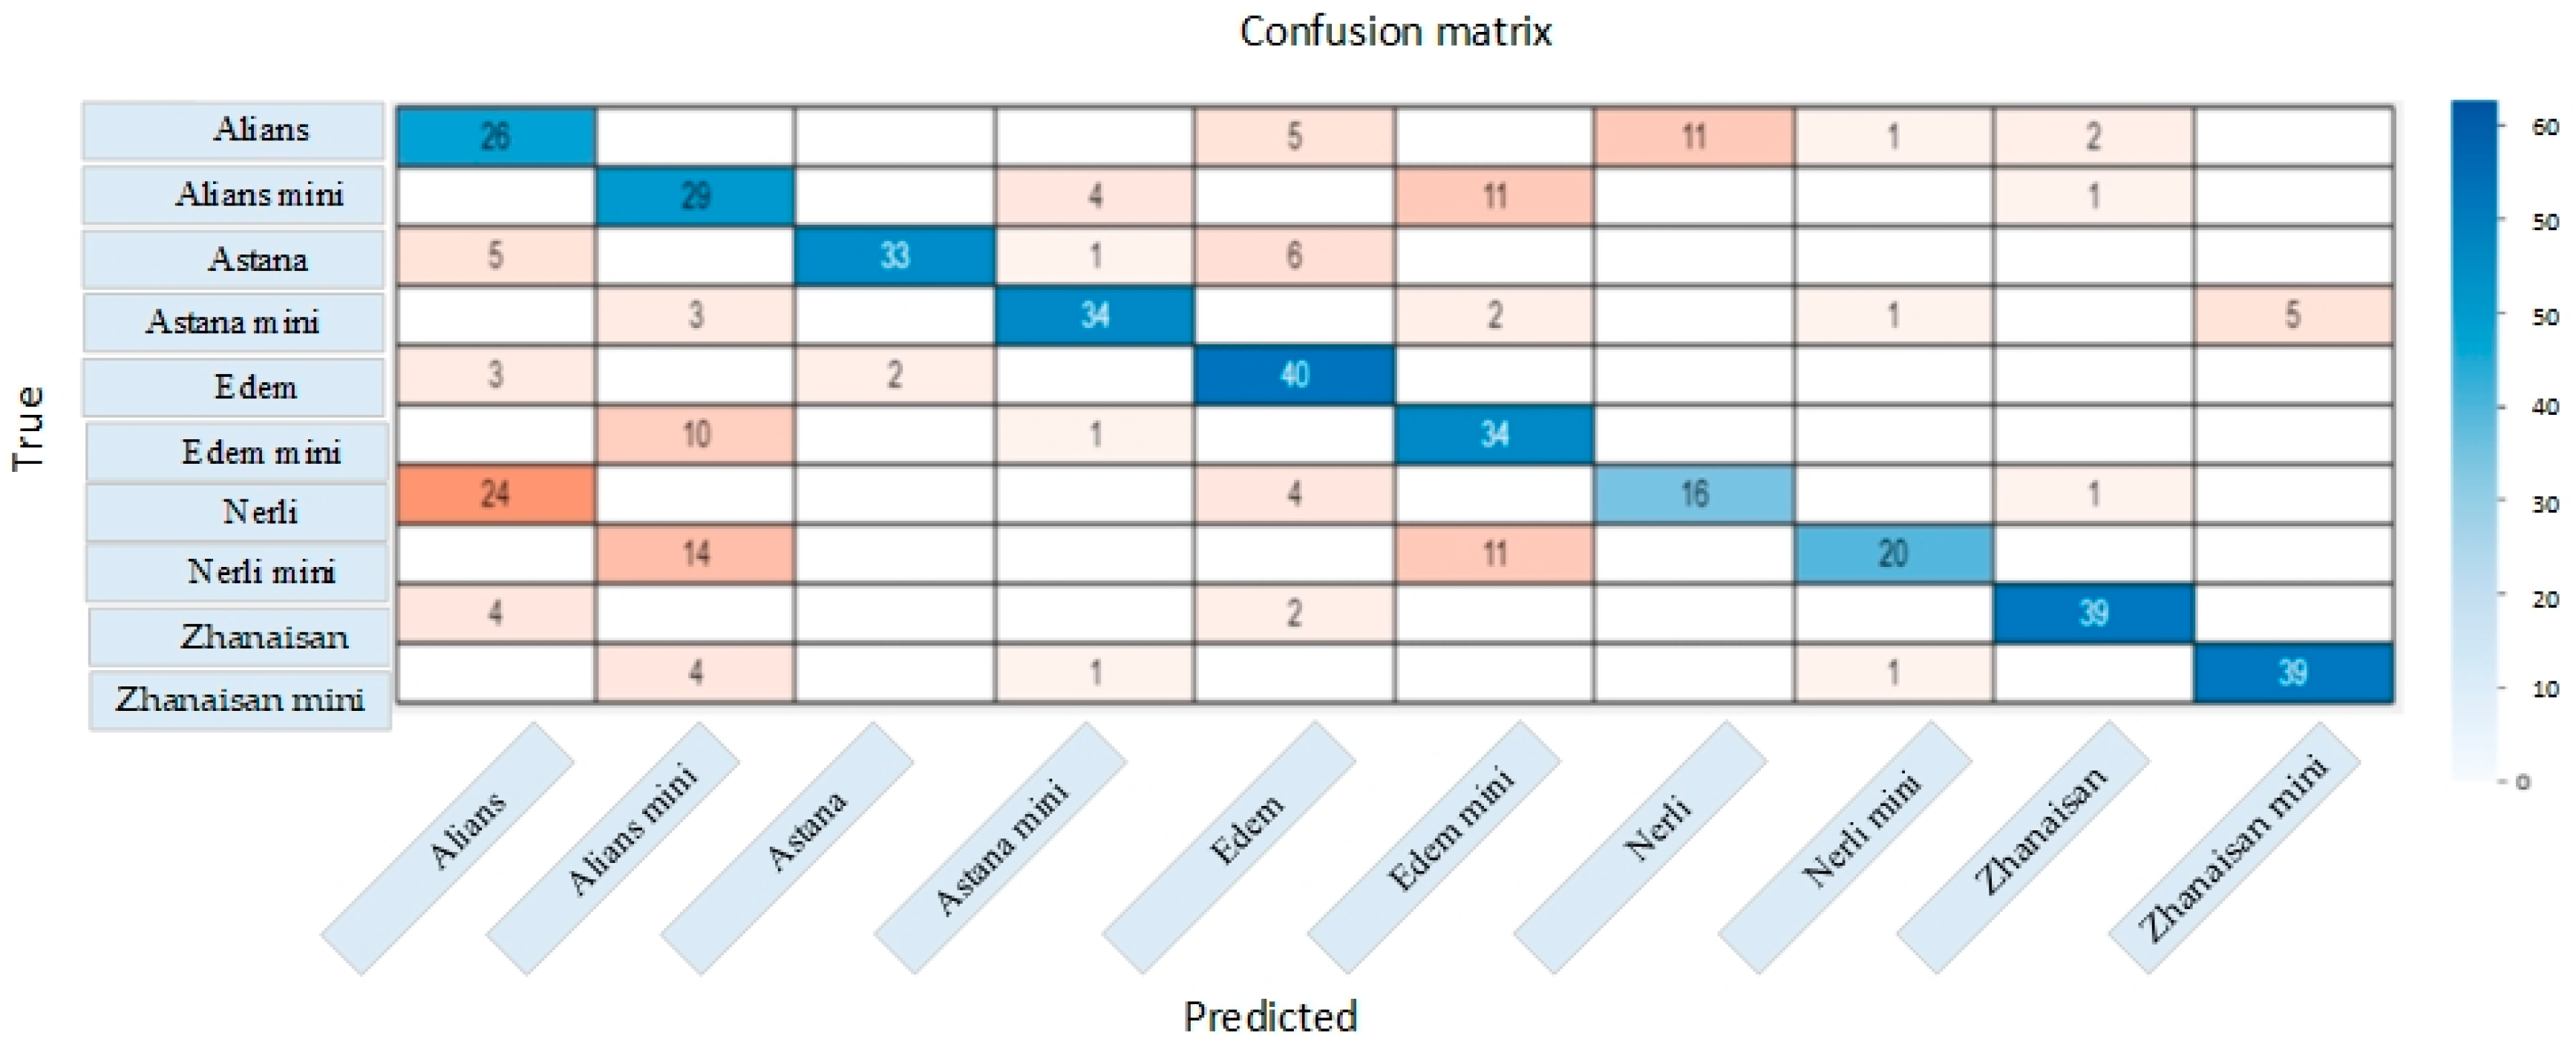
Figure 10.
Confusion matrix for validation set for GoogLeNet with Solver Sgdm and ILR=0.0003.
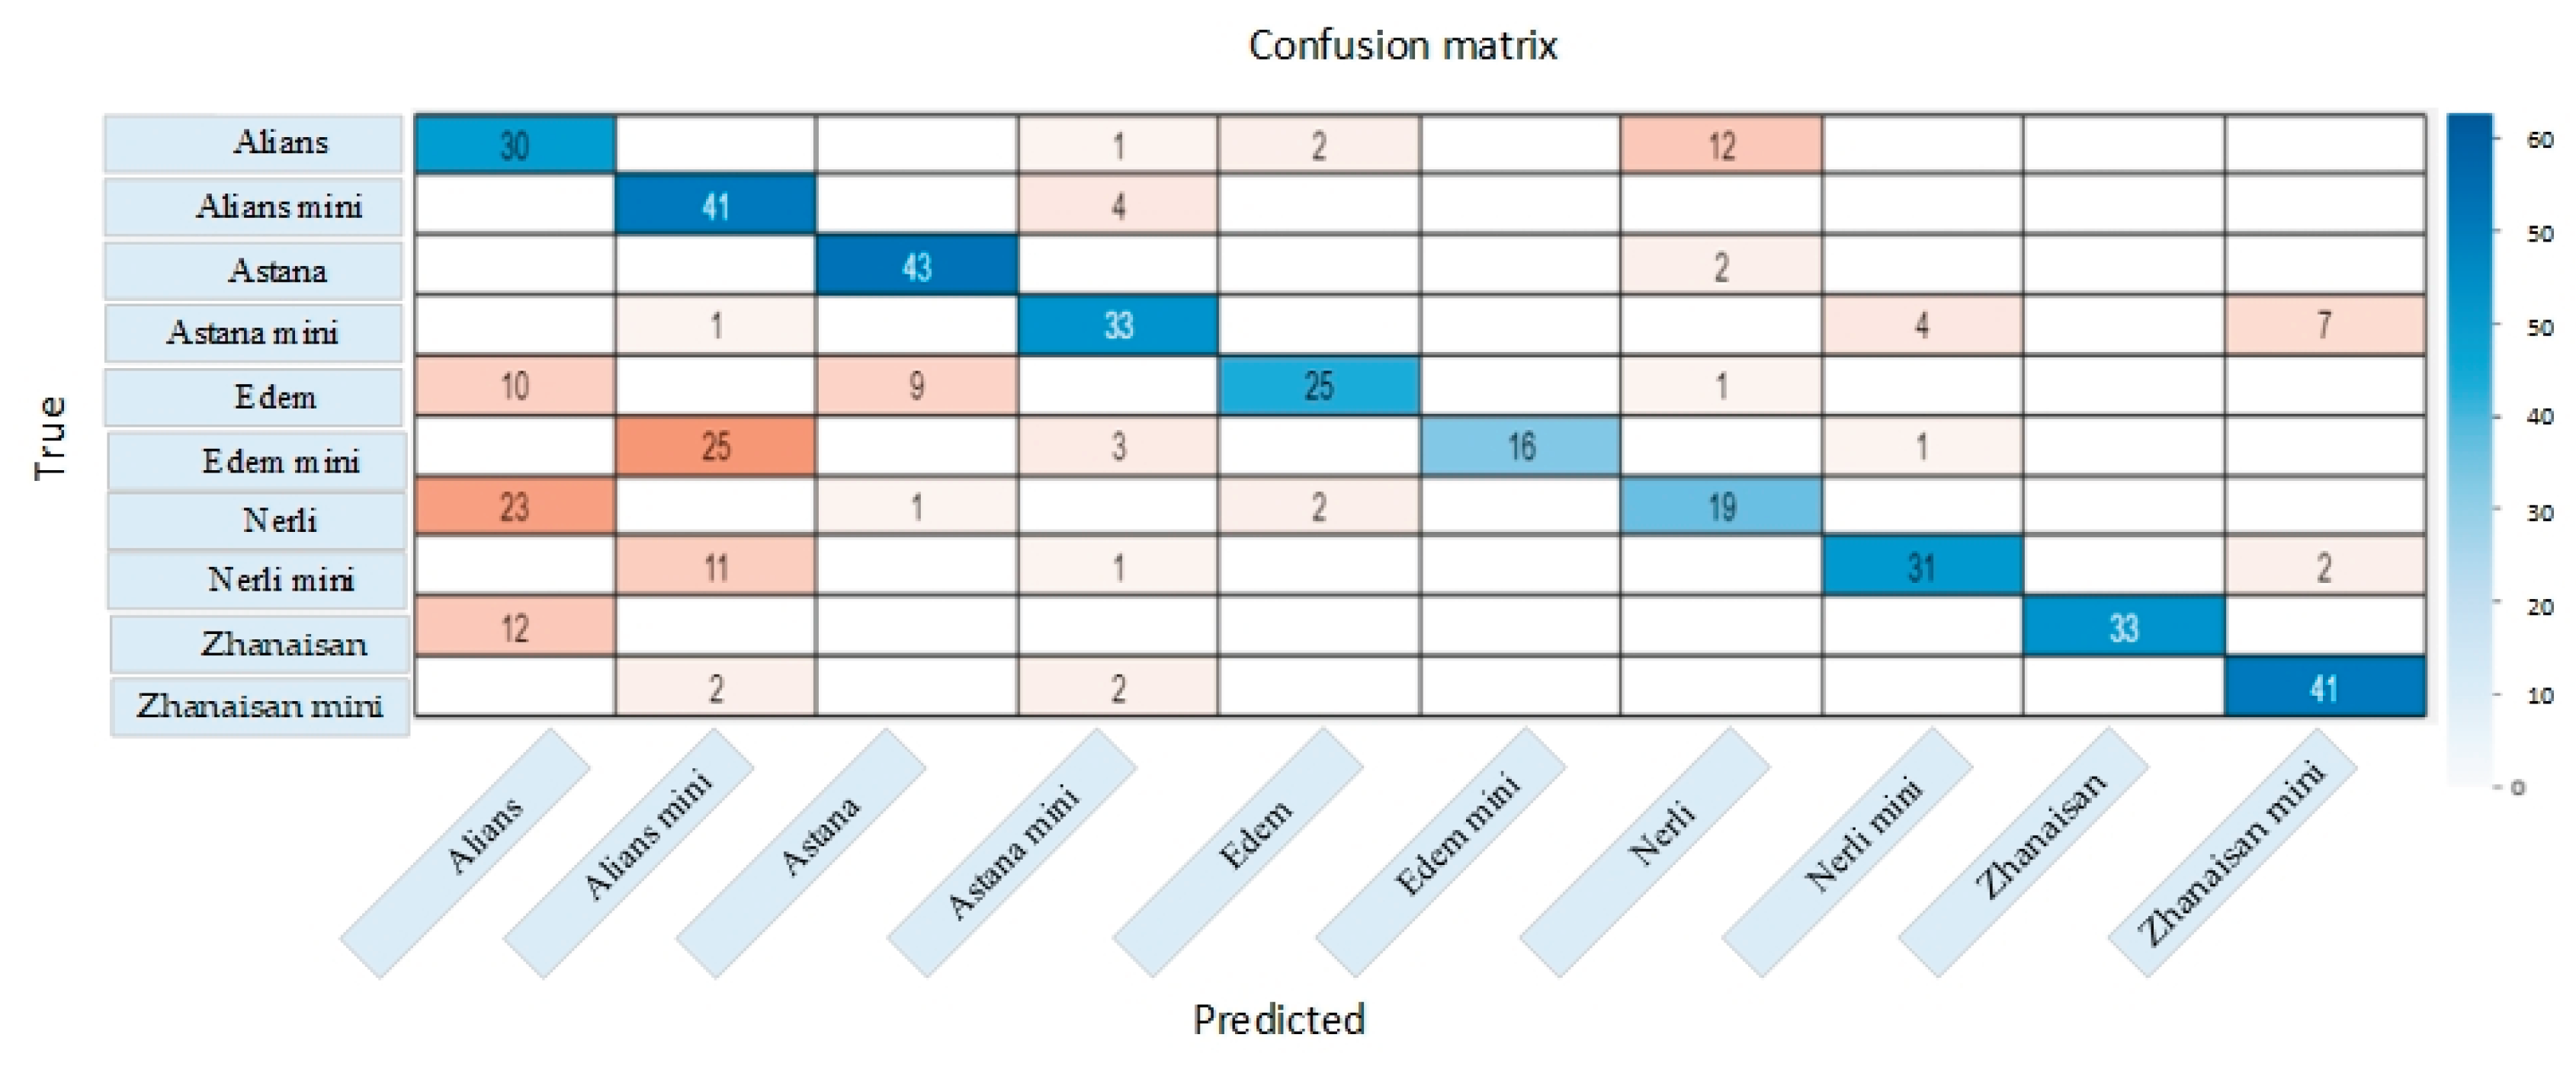

Table 1.
Statistical values of network evaluation indicators.
| Value | TA, % | TL | VA, % | VL | TA, % | TL | VA, % | VL | ||||
| Solver Sgdm | ||||||||||||
| CNN | SqueezeNet | SqueezeNet | SqueezeNet | SqueezeNet | GoogLeNet | GoogLeNet | GoogLeNet | GoogLeNet | ||||
| Min | 66.67 | 0.3835 | 58.00 | 0.8368 | 75.00 | 0.1760 | 60.89 | 0.9216 | ||||
| Max | 83.33 | 0.9584 | 68.89 | 1.2417 | 100.00 | 0.7141 | 69.33 | 1.1974 | ||||
| Average value | 72.62 | 0.5382 | 64.54 | 0.9600 | 89.29 | 0.3464 | 66.51 | 1.0014 | ||||
| Solver Adam | ||||||||||||
| CNN | SqueezeNet | SqueezeNet | SqueezeNet | SqueezeNet | GoogLeNet | GoogLeNet | GoogLeNet | GoogLeNet | ||||
| Min | 58.33 | 0.4516 | 59.33 | 0.8351 | 75.00 | 0.1760 | 60.89 | 0.9216 | ||||
| Max | 83.33 | 0.6989 | 69.56 | 1.0831 | 100.00 | 0.7141 | 69.33 | 1.1974 | ||||
| Average value | 72.62 | 0.5352 | 65.40 | 0.9316 | 89.29 | 0.3464 | 66.51 | 1.0014 | ||||
| Solver RMSprop | ||||||||||||
| CNN | SqueezeNet | SqueezeNet | SqueezeNet | SqueezeNet | GoogLeNet | GoogLeNet | GoogLeNet | GoogLeNet | ||||
| Min | 50.00 | 0.4149 | 63.33 | 0.7999 | 75.00 | 0.1760 | 60.89 | 0.9216 | ||||
| Max | 83.33 | 0.6149 | 70.22 | 1.0085 | 100.00 | 0.7141 | 69.33 | 1.1974 | ||||
| Average value | 72.62 | 0.4879 | 66.03 | 0.8947 | 89.29 | 0.3464 | 66.51 | 1.0014 | ||||
Table 2.
Experimental results from the validation sample of network evaluation metrics.
| DNN | Solver | Initial Learning Rate (ILR) | TP | FP | FN | Accuracy, [%] | Precision, [%] | Recall, [%] | |
|---|---|---|---|---|---|---|---|---|---|
| Alians | |||||||||
| SqueezeNet | Sgdm | 0.00025 | 26 | 369 | 36 | 19 | 87.78 | 41.90 | 57.80 |
| Adam | 0.0005 | 23 | 372 | 33 | 22 | 87.78 | 41.10 | 51.10 | |
| RMSprop | 0.0004 | 25 | 359 | 46 | 20 | 85.33 | 35.20 | 55.60 | |
| GoogLeNet | All solvers | 0.0003 | 30 | 360 | 45 | 15 | 86.67 | 40.00 | 66.70 |
| Alians mini | |||||||||
| SqueezeNet | Sgdm | 0.00025 | 29 | 374 | 31 | 16 | 89.56 | 48.30 | 64.40 |
| Adam | 0.0005 | 33 | 388 | 17 | 12 | 93.56 | 66.00 | 73.30 | |
| RMSprop | 0.0004 | 31 | 378 | 27 | 14 | 90.89 | 53.40 | 68.90 | |
| GoogLeNet | All solvers | 0.0003 | 41 | 366 | 39 | 4 | 90.44 | 51.20 | 91.10 |
| Astana | |||||||||
| SqueezeNet | Sgdm | 0.00025 | 33 | 403 | 2 | 12 | 96.89 | 94.30 | 73.30 |
| Adam | 0.0005 | 37 | 404 | 1 | 8 | 98.00 | 97.40 | 82.20 | |
| RMSprop | 0.0004 | 30 | 405 | 0 | 15 | 96.67 | 100.00 | 66.70 | |
| GoogLeNet | All solvers | 0.0003 | 43 | 395 | 10 | 2 | 97.33 | 81.10 | 95.60 |
| Astana mini | |||||||||
| SqueezeNet | Sgdm | 0.00025 | 34 | 398 | 7 | 11 | 96.00 | 82.90 | 75.60 |
| Adam | 0.0005 | 21 | 403 | 2 | 24 | 94.22 | 91.30 | 46.70 | |
| RMSprop | 0.0004 | 32 | 401 | 4 | 13 | 96.22 | 88.90 | 71.10 | |
| GoogLeNet | All solvers | 0.0003 | 33 | 394 | 11 | 12 | 94.89 | 75.00 | 73.30 |
| Edem | |||||||||
| SqueezeNet | Sgdm | 0.00025 | 40 | 388 | 17 | 5 | 95.11 | 70.20 | 88.90 |
| Adam | 0.0005 | 27 | 401 | 4 | 18 | 95.11 | 87.10 | 60.00 | |
| RMSprop | 0.0004 | 40 | 391 | 14 | 5 | 95.78 | 74.10 | 88.90 | |
| GoogLeNet | All solvers | 0.0003 | 25 | 401 | 4 | 20 | 94.67 | 86.20 | 55.60 |
| Edem mini | |||||||||
| SqueezeNet | Sgdm | 0.00025 | 34 | 381 | 24 | 11 | 92.22 | 58.60 | 75.60 |
| Adam | 0.0005 | 33 | 386 | 19 | 12 | 93.11 | 63.50 | 73.30 | |
| RMSprop | 0.0004 | 31 | 391 | 14 | 14 | 93.78 | 68.90 | 68.90 | |
| GoogLeNet | All solvers | 0.0003 | 16 | 405 | 0 | 29 | 93.56 | 100.00 | 35.60 |
| Nerli | |||||||||
| SqueezeNet | Sgdm | 0.00025 | 16 | 394 | 11 | 29 | 91.11 | 59.30 | 35.60 |
| Adam | 0.0005 | 31 | 377 | 28 | 14 | 90.67 | 52.50 | 68.90 | |
| RMSprop | 0.0004 | 16 | 395 | 10 | 29 | 91.33 | 61.50 | 35.60 | |
| GoogLeNet | All solvers | 0.0003 | 19 | 390 | 15 | 26 | 90.89 | 55.90 | 42.20 |
| Nerli mini | |||||||||
| SqueezeNet | Sgdm | 0.00025 | 20 | 402 | 3 | 25 | 93.78 | 87.00 | 44.40 |
| Adam | 0.0005 | 29 | 398 | 7 | 16 | 94.89 | 80.60 | 64.40 | |
| RMSprop | 0.0004 | 34 | 402 | 3 | 11 | 96.89 | 91.90 | 75.60 | |
| GoogLeNet | All solvers | 0.0003 | 31 | 400 | 5 | 14 | 95.78 | 86.10 | 68.90 |
| Zhanaisan | |||||||||
| SqueezeNet | Sgdm | 0.00025 | 39 | 401 | 4 | 6 | 97.78 | 90.70 | 86.70 |
| Adam | 0.0005 | 36 | 402 | 3 | 9 | 97.33 | 92.30 | 80.00 | |
| RMSprop | 0.0004 | 37 | 396 | 9 | 8 | 96.22 | 80.40 | 82.20 | |
| GoogLeNet | All solvers | 0.0003 | 33 | 405 | 0 | 12 | 97.33 | 100.00 | 73.30 |
| Zhanaisan mini | |||||||||
| SqueezeNet | Sgdm | 0.00025 | 39 | 400 | 5 | 6 | 97.56 | 88.60 | 86.70 |
| Adam | 0.0005 | 43 | 382 | 23 | 2 | 94.44 | 65.20 | 96.60 | |
| RMSprop | 0.0004 | 40 | 398 | 7 | 5 | 97.33 | 85.10 | 88.90 | |
| GoogLeNet | All solvers | 0.0003 | 41 | 396 | 9 | 4 | 97.11 | 82.00 | 91.10 |
Table 3.
Evaluation indicators of the best developed models for potato varieties.
| Potato variety |
Validation set | ||||
|---|---|---|---|---|---|
| CNN model | Accuracy | Precision | Recall | F1-score | |
| Alians | SqueezeNet, sgdm, ILR=0.00025 |
87.78 | 41.90 | 57.80 | 48.58 |
| GoogLeNet, all solvers, ILR=0.0003 |
86.67 | 40.00 | 66.70 | 50.01 | |
| Alians mini | SqueezeNet, adam, ILR=0.0005 |
93.56 | 66.00 | 73.30 | 69.46 |
| GoogLeNet, all solvers, ILR=0.0003 |
90.44 | 51.20 | 91.10 | 65.56 | |
| Astana | SqueezeNet, adam, ILR=0.0005 |
98.00 | 97.40 | 82.20 | 89.16 |
| GoogLeNet, all solvers, ILR=0.0003 |
97.33 | 81.10 | 95.60 | 87.76 | |
| Astana mini | SqueezeNet, RMSprop, ILR=0.0004 |
96.22 | 88.90 | 71.10 | 79.01 |
| GoogLeNet, all solvers, ILR=0.0003 |
94.89 | 75.00 | 73.30 | 74.14 | |
| Edem | SqueezeNet, RMSprop, ILR=0.0004 | 95.78 | 74.10 | 88.90 | 80.83 |
| GoogLeNet, all solvers, ILR=0.0003 |
94.67 | 86.20 | 55.60 | 67.60 | |
| Edem mini | SqueezeNet, RMSprop, ILR=0.0004 | 93.78 | 68.90 | 68.90 | 68.90 |
| GoogLeNet, all solvers, ILR=0.0003 |
93.56 | 100.00 | 35.60 | 52.21 | |
| Nerli | SqueezeNet, adam, ILR=0.0005 |
90.67 | 52.50 | 68.90 | 59.59 |
| GoogLeNet, all solvers, ILR=0.0003 |
90.89 | 55.90 | 42.20 | 48.09 | |
| Nerli mini | SqueezeNet, RMSprop, ILR=0.0004 |
96.89 | 91.90 | 75.60 | 82.96 |
| GoogLeNet, all solvers, ILR=0.0003 |
95.78 | 86.10 | 68.90 | 76.55 | |
| Zhanaisan | SqueezeNet, sgdm, ILR=0.0003 |
97.78 | 90.70 | 86.70 | 88.65 |
| GoogLeNet, all solvers, ILR=0.0003 |
97.33 | 100.00 | 73.30 | 84.59 | |
| Zhanaisan mini | SqueezeNet, sgdm, ILR=0.0003 |
97.56 | 88.60 | 86.70 | 87.64 |
| GoogLeNet, all solvers, ILR=0.0003 |
97.11 | 82.00 | 91.10 | 86.31 | |
Disclaimer/Publisher’s Note: The statements, opinions and data contained in all publications are solely those of the individual author(s) and contributor(s) and not of MDPI and/or the editor(s). MDPI and/or the editor(s) disclaim responsibility for any injury to people or property resulting from any ideas, methods, instructions or products referred to in the content. |
© 2025 by the authors. Licensee MDPI, Basel, Switzerland. This article is an open access article distributed under the terms and conditions of the Creative Commons Attribution (CC BY) license (http://creativecommons.org/licenses/by/4.0/).
Copyright: This open access article is published under a Creative Commons CC BY 4.0 license, which permit the free download, distribution, and reuse, provided that the author and preprint are cited in any reuse.


