Submitted:
09 October 2025
Posted:
10 October 2025
You are already at the latest version
Abstract
To test hydrochar from chicken manure (CM) produced with the hydrothermal carbonization (HTC) process as a potential soil amendment, the fertilization potential and phytotoxicity of the product was assessed to ensure both effectiveness and safety for crops. The hydrochar produced by heating the feedstock at 250 °C for 0.5 h showed low nutrient and organic carbon (Corg) recovery but a high relative abundance of aromatic and alkyl C. Its favorable available-to-recalcitrant nitrogen (N) ratio, and low heavy metal (HM) concentrations suggest low phytotoxicity and high short- to medium-term N fertilization potential of the amendment. Pot experiments with lettuce, sunflower, and tomato plants confirmed species- and dosage-dependent effects. A dosage equivalent to 3.25 t ha⁻¹ (2.7% w/w) improved lettuce and sunflower yields, whereas higher dosage (6.5 t ha⁻¹; 5.4% w/w) did not provide additional growth benefits. Tomato plants, however, exhibited phytotoxic sensitivity to the higher dosage, which was expressed in a negative impact on germination and yield. Overall, these results highlight the need for a thorough chemical characterization of HTC-derived hydrochar before its use as an organic fertilizer amendment, considering dosage, crop species, and their specific sensitivities when applying it.
Keywords:
Hydrothermal carbonization
; Nutrient recovery
; Hydrochar
; Valorization
; Circular economy
; lettuce
; tomato
; sunflower
1. Introduction
The sustained growth of the global population is driving increases in the worldwide consumption of food and livestock feed, which is unfortunately coupled with a surge in the production of organic waste. A compelling goal in the sustainable management of this waste is to convert it into value-added products such as soil amendment or fertilizers which can be reintegrate into the ecological cycle, while concurrently restoring soil physical and chemical properties [1]. Animal waste from livestock farming, such as manure, has garnered particular attention due to its high production and the significant environmental and ecological challenges it poses, including greenhouse gas emissions, water contamination, and soil pollution [2]. Beyond its environmental impact, its revalorization is also of interest from a socioeconomic perspective due to its fertilizing potential, given its content of essential nutrients for agricultural applications [3]. In Europe, a total of 8.7 million (M) tons (t) of nitrogen (N), 2 M t of phosphate, and 2.2 M t of potassium (K) were applied in 2024 to 122.9 M hectares (ha) of farmland [4]. Thus, recycling nutrients from manure and its processed derivatives back into agricultural land can help partially meet the world’s nutrient demand [5].
A common method to recycle manure includes composting. However, this is often associated with malodors and potential soil pollution due to surviving pathogens or pharmaceutical residues [6]. Hence, there is a need for alternatives which achieve efficient hygenization and destruction, i.e by thermal pretreatment such as pyrolysis, to convert this waste into a sterilized solid, charcoal-like product.
Presently, dry pyrolysis at elevated temperatures and hydrothermal carbonization (HTC) are the main approaches used for the production of soil amendments from organic waste. Whereas both are thermal treatments under oxygen-depleted conditions, the first pyrolyses dry feedstocks at temperatures between 300°C and 700°C [7]. The respective product is termed pyrochar (or biochar, when it is used for soil applications). In contrast, the HTC process generates the so-called hydrochar at temperatures between 150 and 350 °C in the presence of water, under its autogenous pressure [8]. Therefore, for wet feedstocks, the benefits of converting biomass into hydrochar instead of pyrochar lies in lower production costs due to lower energy requirements and the fact that drying of the feedstock is not needed [9]. Furthermore, hydrochars amended to soils show a lower biochemical recalcitrance than pyrochar allowing a faster remobilization of nutrients that have been stabilized during the thermal treatment into a plant-available form [3]. However, here it has to be born in mind that water soluble components, released or formed during HTC will be removed with the process water after the treatment. Aside from potentially phytotoxic phenols and furans, important plant nutrients such as N, phosphorus (P) and minerals are also lost [2,10,11]. Nevertheless, hydrochar can still contain a significant amount of nutrients. In contrast to wood-derived biochars, they are further characterized by low pH, allowing their amendment to alkaline soils without the worry of negative impacts on the soil pH [12]. Additionally, hydrochar serves as a valuable carbon (C) provider in soil microbial ecosystems [12,13]. Given the characteristics of hydrochar, several studies have proposed its potential benefits on soil fertility and crop production. Although not as extensively examined as biochar, the evaluation of hydrochar use is emerging with studies focused on germination, plant biomass yield, and phytotoxicity [9,13,14,15].
However, to better understand the impact of hydrochar amendment on plant health, soil properties, and soil biome composition, it is essential to elucidate how feedstock characteristics and process conditions influence the chemical and physical properties of the solid products [3]. Gaining comprehensive insight into all the variables impacting HTC and their effects on the different phases (solid, liquid, and gas) of the process is essential when formulating the methodological framework and understanding the destination and final use of each resultant product. Although many studies have addressed this topic, the focus has not always been primarily centered on losses and the recovery of different nutrients from the solid phase, involving thorough analysis of both the raw material and the resultant product [6,10,16,17,18]. Delving into under-researched elements such as micronutrients and heavy metals (HMs) demands heightened focus to grasp their stability throughout the HTC process. Furthermore, some of these less explored elements, such as Ca and Mg, as well as other metals like Fe and Al, have been reported to play a direct role in modulating P immobilization and preventing its loss during the process [19,20,21,22].
Likewise, few studies have conducted a comprehensive chemical characterization of the diverse forms of organic C and N present in manure-type samples before and after undergoing the HTC process [23,24]. This knowledge is also imperative to enhance our understanding of the stability of these forms, their modifications during HTC, and the potential toxicity they might produce based on the final use of HTC products.
Already, knowledge of the final nutrient content, as well as the presence of potential pollutants, can be beneficial in determining the possible use of an agricultural product. However, only field testing can assess its validity and effectiveness [9,15].
Taking into account all these considerations, the main objectives of this investigation are:
- i)
- to conduct a comprehensive chemical characterization of hydrochar derived from chicken manure (CM), emphasizing the assessment of organic C and N forms by solid-state nuclear magnetic resonance (NMR) spectroscopy, alongside with the quantification of macro- and micronutrient as well as HM contents;
- ii)
- to analyze the losses and recovery rates of different nutritive elements during the HTC process, calculated by taking the product of the hydrochar mass yield and the content of the analyzed element in the hydrochar, and normalizing it by the element’s content in the feedstock; and,
- iii)
- to evaluate the resultant hydrochar in pot experiments for both its phytotoxicity and its potential as a fertilizer on three different economically and agronomically important plant species: lettuce, sunflower, and tomato.
2. Materials and Methods
2.1. Feedstock
Fresh raw CM was collected from a chicken yard located in Utrera (Seville, Spain) (N 37°13’16.7” - W 5°46’25.0”). Chickens were raised non-commercially, intended solely for personal consumption. The diet of these animals was exclusively based on corn (C4 plant). The manure collection was conducted in the morning, selecting the freshest and most recent manure pile from the pen and gathering it manually. The collected material was stored in plastic bags. During the collection process, care was taken to avoid extracting material that was not manure, such as plant residues or soil. However, there were difficulties in avoiding the inclusion of soil, as the material was fresh and easily mixed with the soil. The manure sample was promptly dried to reduce biological activities. Subsequently, the dried manure underwent sieving, and the fraction ranging from 0.2 to 0.8 mm was isolated and preserved for the production of hydrochar and for further analysis.
2.2. Production of Hydrochar
The hydrochar utilized was supplied by “Leibniz-Institut für Agrartechnik und Bioökonomie e.V” (ATB), Potsdam-Bornim, Germany. The production was carried out using an 18.75 L-stirred pressure reactor (Parr reactor 4555 series, IL, USA), which was fitted with an external resistance heater and internal sensors to monitor pressure and temperature. For hydrochar production, CM was the selected raw material, which was mixed with deionized water and introduced into the reactor at a 1:5 ratio. The mixture was subjected to a heating rate of 2 °C min⁻¹ until reaching 250 °C. This temperature was held for 30 minutes. Subsequently, the heater was turned off and left to cool overnight. Reaching the desired temperatures in the reactor required about 120 minutes. Throughout the process, there was constant stirring at 200 rpm. Following a cooling period of approximately 20 hours, the HTC slurry was vacuum filtered using flat filter paper (ROTH Type 113A-110, 5–8 µm). The gaseous product and the process liquid were discharged. The resulting hydrochar was dried for 48 hours at 60 °C before storage in hermetically sealed plastic bags.
2.3. Characterization of the Chicken Manure Utilized and the Produced Hydrochar
2.3.1. Chemical Composition
Prior to the analyses, all samples were oven-dried at 40 °C for 24 hours to remove moisture that may have been adsorbed during storage. For the determination of the ash content of the samples, they were also heated at 105 °C for 1 h to remove additional moisture before increasing the temperature to 550 °C for 5 h to combust organic residues. The pH of the used feedstock and hydrochar was determined in the aqueous phase of a soil suspension (2.5 g of dry sample with 10 mL of deionized water) with a Crison pH-meter Basic 20 (Crison, Barcelone, Spain) after the solid phase had settled for 30 min. Subsequently, the electrical conductivity (EC) was measured in the filtered supernatant using a Crison EC-meter Basic 30+. The maximal water holding capacity (WHC) was obtained according to the method of Veihmeyer and Hendrickson [25] by placing 6 g of each sample over a filter paper (Whatman 2) into a funnel. After saturation of the samples with distilled water and a 2 h resting period, the weight difference between the dry and moist sample was calculated considering the weight of the funnel and the filter paper, resulting in the maximal WHC. The latter is expressed as the retained water as percentage relative to the total dry weight (DW) of the sample.
Total C, organic C (Corg), inorganic C (IC), and N contents were measured using the Primacs SNC100 elemental analyzer (SKALAR, Breda, The Netherlands) and the Shimadzu TOC-V analyzer (Shimadzu, Japan). Elemental hydrogen (H) was determined using a LECO CHNS-932 (St. Joseph, MI, USA) from samples demineralized through four consecutive treatments with 10% (m/m) hydrofluoric acid (HF). Elemental oxygen (O) was calculated as the difference between the total sample weight and the sum of the percentages of ash content, C, N, H, P and sulphur (S). P and S were measured using inductively coupled plasma-optical emission spectroscopy (ICP-OES; Varian 720-ES) (Varian Inc., Palo Alto, CA, USA).
The concentrations of dissolved organic C and N (DOC and DON) were quantified with a Shimadzu TOC-V analyzer (Shimadzu, Japan) in 0.5 M K2SO4 extracts from CM and its hydrochar.
The δ13C (‰; vs. VPDB) and δ15N (‰; vs. air-N2) of both CM and the hydrochar were measured with a Flash HT Plus elemental analyzer coupled to a Delta-V advantage isotopic ratio mass spectrometer (IRMS) via ConFlow IV interfase (Thermo Scientific, Bremen, Germany).
Plant-available inorganic N (Ni) forms, NO3- and NH4+, were extracted with 2M KCl and determined colorimetrically [26,27] using an Omega SPECTROstar (BMG LABTECH GmbH, Germany) spectrophotometer. The contents of total macro- and micronutrient, as well as other metal contents, were obtained using ICP-OES (Varian 720-ES). Available P was determined using a multiparameter ‘Bran-Luebbe’ autoanalyzer (Bran-Luebbe Analytics, Norderstedt, Germany) after extraction with sodium hydrogen carbonate at pH 8.5 [28]. Available K and water-soluble S contents were determined using ICP-OES (Varian 720-ES), with K extracted using ammonium acetate at pH 7 [29].
The recovery ratios after HTC for each element or nutrient were calculated as the product of the hydrochar mass yield and the content of the analyzed element in the hydrochar, divided by the content of the element present in the feedstock.
2.3.2. Solid-State 13C and 15N Nuclear Magnetic Resonance Spectroscopy
Before solid-state NMR spectroscopy, both CM and hydrochar were demineralized with four consecutive treatments with 10% (w/w) HF to enhance the organic matter concentration. Prior to this, the samples were processed with four treatments of HCl (10%) to remove calcium carbonate and prevent the formation of insoluble calcium fluoride during the subsequent demineralization process. Following the removal of the supernatant, the solid residue was washed with distilled water until a pH value exceeding 5 was attained, and then subjected to freeze-drying [30].
Solid-state 13C NMR spectra were generated using a Bruker Avance III HD 400 MHz WB spectrometer, equipped with a triple resonance broadband probe and using zirconium rotors with a 4 mm OD and KEL-F caps. The cross-polarization magic angle spinning (CP-MAS) technique was applied with the rotor spinning at 14 kHz. To prevent spin modulation of Hartmann-Hahn conditions, a ramped 1H-pulse was applied during a 1 ms contact time. Preliminary testing confirmed that a pulse delay of 1 s was adequate to prevent saturation The spectra were obtained with 5000 to 15000 scans, and a line broadening between 50 and 100 Hz. They were quantified according to Knicker et al. [31] using the software package MestReNova 10 ® (Santiago de Compostela, Spain). Assessment of the relative 13C intensity distribution involved integrating specific chemical shift regions: alkyl C (0–45 ppm); N-alkyl/methoxyl C (45–60 ppm); O-alkyl C (60–110 ppm); aryl C (110-140 ppm); O/N-aryl C (140–160 ppm); carboxyl C (160–185 ppm); carbonyl C (185–225 ppm). At the used spinning rate, the chemical shift anisotropy of crystalline structures is not fully averaged. This leads to the appearance of spinning sidebands at both sides of the parent signal at a distance determined by the spinning speed. For the studied hydrochar they occur mainly for the aromatic C and appear between 250 and 300 ppm and between -50 and 0 ppm. Since they contain intensity of the parent signal their relative contribution was added to that of the aromatic C region [31]. Calibration of the 13C chemical shift scale was performed using tetramethylsilane (0 ppm) with glycine as the reference (COOH at 176.08 ppm).
The recovery of Corg as a specific C group in hydrochar as a function of the treatment Cx (hc) has been calculated according to Paneque et al. [24], as follows:
where C (t) represents the remaining C in the hydrochar as a percentage of the C content of the chicken manure (CCM), and C(x) denotes the relative 13C intensity of a specific 13C chemical shift region.
The same spectrometer was used to acquire the solid-state 15N NMR spectra, but using a 7 mm double resonance probe operating at 40.56 MHz. Here, a 1 ms contact time, a 90° H pulse width of 3.5 μs, and a pulse delay of 300 ms, was applied. The chemical shifts are referenced to the nitromethane scale (0 ppm) and were adjusted using 15N-labeled glycine (-347.6 ppm). The region assigned to amide N (-248 to -285 ppm) and pyrrole N (-150 to -248 ppm) were integrated. For the spectra, between 850000 and 1 million scans were accumulated at a spinning speed of 6 kHz.
2.4. Plant Experiment Conditions and Measurements
Due to the physical and chemical properties of the studied hydrochar (low EC, high NO3- content providing a favorable inorganic to recalcitrant organic N ratio, and presumably low concentration of HMs), its potential as a fertilizer as well as its phytotoxicity was assessed. For this purpose, a greenhouse pot experiment was carried out to examine the germination and early growth of lettuce (Lactuca sativa L. var. Batavia), sunflower (Helianthus annuus L.) and tomato (Solanum lycopersicum L.) in response to the application of hydrochar. For each plant, a total of 30 pots (7x7x9 cm) were arranged, each containing a substrate mixture with a peat:vermiculite proportion of 60:40 (v:v). Out of the 30 pots, 10 were left untreated as controls (CTR), 10 received an equivalent dose of 3.25 t ha-1 of hydrochar (HC-3.25), and the remaining 10 pots were amended with a dose of 6.5 t ha-1 (HC-6.5). The doses of 3.25 and 6.5 t ha−1 of hydrochar correspond to 2.7 and 5.4% w/w, respectively, and were applied by mixing it into the top 3 cm. In total, 90 pots were set up.
Four seeds were sown per pot, which were put into a greenhouse with a 14 h/10 h light/dark photoperiod (250 μmol m-2 s-1) at 25°C/20°C respectively and 40-70% relative humidity. To ensure a minimum of 8 seeds per biological replicate for the statistical analysis of the germination, 2 pots were combined. The germinated seeds of lettuce and sunflower plants were counted and recorded during the initial 7 days after sowing (DAS), whereas the data for the tomato seeds were recorded after 14 DAS due to a delayed germination of 7 days. Based on the methodology described in Ranal et al. [32,33], the following key germination parameters were assessed:
- -
- An estimate of the germinability: Germination percentage (G);
- -
- Mean Germination Time (MGT) corresponding to the time required for seeds to germinate or emerge;
- -
- Mean Germination Rate (MGR) representing the speed at which seeds germinate;
- -
- The time required for 50% of the seeds to germinate (T50);
- -
- Synchronization index (Z) describing the uniformity or synchronization in the timing of seed germination;
- -
- The uncertainty of the germination process (U) reflecting the degree of uncertainty associated with the distribution of the relative frequency of germination.
The vigour Index (VI), which determines the performance of seeds during germination and seedling emergence, was calculated as the product of G (%) by the hypocotyl length (cm).
After seven days after seedling (DAS) for lettuce and sunflower and 14 DAS for tomato, one germinated seedling from each pot was selected and left in the substrate (n = 10), while all other seedlings were harvested for an additional biomass analysis (taking the mean for each pot, n = 10). Within each treatment, the chosen seedlings displayed similar health and size characteristics, ensuring uniformity across the samples. The pots were watered daily avoiding any leaching. The trays underwent daily clockwise rotation to provide uniform light exposure and environmental conditions for all plants during the experiment. No pesticides or supplementary fertilizers were introduced to the substrate or plants before or during this research.
The hypocotyl and total plant height of lettuce and sunflower plants was measured daily until 7 DAS, whereas for tomatoes, the assessment was extended until 14 DAS due to the aforementioned delayed germination. Additionally, the total height of all plants (n = 10) was measured at 15 and 20 DAS, and at 25 DAS for tomatoes. Similarly, the photosynthetic efficiency or quantum yield of photosystem-II (QYPSII), a well-known marker for plant stress, was assessed using a portable fluorimeter (FluorPen FP-100; Photon System Instruments, Brno, Czech Republic) at 7, 14, and 20 DAS for lettuce and sunflower plants, and at 14, 20, and 25 DAS for tomato. Three readings were taken from each leaf and averaged for each determination (n = 10).
After 20 days of the experiment, lettuce and sunflower plants were harvested, oven-dried (72 h at 65 °C), and weighed to obtain the shoot dry weight (DW). For the tomato plants, the final harvest occurred at 25 DAS.
2.5. Statistical Analysis
Statistical analysis was performed using the STATGRAPHICS Centurion XIX software (StatPoint Technologies, Warrenton, VA, USA). The Shapiro–Wilk test was used to verify the normality of the datasets. Normal distributed response variables were analyzed by t-Student test or one-way ANOVA, followed by Tukey’s Honestly Significant Difference test (HSD). When response variables were non-normal, Mann–Whitney U or Kruskal–Wallis followed by Mann–Whitney U tests were conducted.
3. Results and Discussion
3.1. Mass Yield and Ash Content
The HTC of CM at 250°C with a residence time in the reactor of 0.5 h led to a 10.4% loss of the original dry weight, resulting in a remarkable higher mass yield compared to the values found in the literature for this type of feedstock subjected to similar carbonization temperatures and residence times [34,35].
The analysis of the ash content revealed that more than 80% of CM was composed of ash (Table 1). This high content deviates from what is typically observed in manure-like feedstock and resembles more the levels found in sewage sludge, where sand is prevalent among the residues [24]. The large contribution of minerals is best explained by the fact that the CM derived from a chicken farm that practises barn farming, which led to a high percentage of mineral soil in the CM. During HTC, both organic and inorganic matter dissolves in the process water. In this case, more organic matter was lost, resulting in an ash content increase to 916 g kg⁻¹ (Table 1). The high ash recovery of 96% indicates that few ash components dissolved in the process water.
3.2. Physical and Chemical Parameters of Chicken Manure and Hydrochar
The HTC of the feedstock slightly but significantly increased its pH from 7.21 to 7.92, whereas EC dropped drastically by 91%, from 3.83 to 0.33 mS cm-1, indicating a considerable loss of charged groups or salts. Even lower values have been documented in other manure-based hydrochars [7,18]. This observation is best explained with the mobilization of ions during the HTC process and their leaching into the reaction solution that has been removed and discarded after the process [8,12]. Here, one has to bear in mind that the thermal process promotes decarboxylation and deamination releasing volatile CO2 and NH3 [8,11].
Although a high WHC is not expected for the lignocellulosic-poor CM, the HTC process decreased this value from 108% (± 6.63) to 32% (± 1.44). As WHC is typically associated with porosity [1], our results suggest poor pore structure development during HTC.
3.3. Modifications in the Elemental and Nutrient Composition During HTC
3.3.1. Elemental and Isotopic Composition
The total Corg content of the feedstock is 77 g kg-1 (7.70%), which is low considering the type of raw material [1,6,34] (Table 1) and is related to the high content of residual soil. The high content of inorganic C (IC) in CM (10.6 ± 0.29 g kg⁻¹), is in line with the calcareous nature of the soils at the farm. Meanwhile, only 68% of total Corg of the feedstock was retained after HTC, resulting in a value of 58.6 g kg-1 (5.86%). Consequently, this product is not suitable for use as a solid fuel or as a soil amendment to increase C content or sequester C. During HTC, biomass components are hydrolyzed into soluble oligomers and monomers, which, along with the DOC already present in the feedstock, can be dissolved in the liquid phase of the process [36]. These soluble compounds can undergo further degradation by dehydratation, dehydroxylation, decarboxylation and condensation [24,37]. This is confirmed by the low recovery of O and H (Table 1) and the decrease of the atomic O/C and H/C ratios after HTC (from 0.34 to 0.18 and from 1.62 to 1.25, respectively). A rough evaluation of the atomic H/C ratio confirms that in average 1.25 protons are bound to one C indicating that the hydrochar does not possess a highly condensed aromatic structure.
In terms of losses, the N content in the hydrochar experienced a much more significant decrease than C as only 18% of this element remained in the hydrochar (Table 1). As a result, the hydrochar exhibited a low N content of only 4.7 g kg-1. Comparable N contents of CM and its hydrochar as well as N-recovery rates were reported by Heilmann et al. [19]. Other authors claim higher losses of over 65% of N after HTC treatment of manure at 250-260°C [1,6,34]. In accordance with the findings proposed by Li et al. [6], a substantial amount of N from the CM must have been converted into the liquid and gas phases rather than the solid phase.
The fact that HTC increased the Corg/N ratio from 3 to 13 confirms the low thermal stability of N-functional groups in CM (Table 2). This is expected since uric acid is the main organic N-form in the faecal remains of birds. Thus, this final ratio falls within the expected range for hydrochars from such feedstock [6,34] and the treatment conditions [35]. Note that more than 97% of the N content of feedstock and product is organic (Table 2). Even though the contribution of Ni is similar in both materials, there was no significant enhancement of plant-available NO3--N and NH4+-N in the hydrochar after HTC. In fact, only up to 24% of these nutrients were retained after HTC. Note that despite the low recovery, the content of Ni in the hydrochar is consistent with other hydrochars, and even higher in the case of NO3--N (82 mg kg-1) [1,24]. The NO3- content is particularly relevant for rapid plant fertilization. Thus, as reported by Paneque et al. [24], a favorable ratio between plant-available, fast-released N and an immobilized organic N that is slowly released is a notable characteristic for a soil amendment that can act as a potential long-term fertilizer. In our case, given the Ni contents observed, the hydrochar appears suitable to supply an initial pulse of readily available N at the onset of fertilization, while also contributing a pool of slow-release N for sustained medium- to long-term nutrition.
A further form of N that is expected to be easily bio-accessible represents DOC and DON. As demonstrated in the study of Bargmann et al. [38], this can increase microbial activity and may affect the overall turnover of soil organic matter. Similarly, as described in the previously cited work, the potential immobilization of labile N in microbial biomass should also be considered. Thus, the contents of DOC and DON of soil amendment can be seen as an important parameter for estimating their fertilization efficiency. In CM the DOC and DON contents were 10.8 ± 0.46 g kg⁻¹ and 3.25 ± 0.11 g kg⁻¹, respectively, whereas these values accounted to 3.48 ± 0.11 g kg⁻¹ and 0.54 ± 0.02 g kg⁻¹ in the hydrochar.
The δ13C signature of CM is with -21.14‰ less negative than for soils with input of plants that follow the C3 photosynthetic pathway (-24 to -30‰ vs. VPDB) (Table S1), which is best explained by the fact that the chickens were fed with corn which is a C4 plant. HTC shifted, the δ13C compositions towards -19.75‰ vs. VPDB, although without significant differences. It has been proposed that changes in the isotopic signature of δ13C during charring may result from the preferentially loss of heavy [39] or light [40] C components through CO2 emissions. It was also suggested that condensation and polymerization processes lead to more stable aromatic structures and heavier isotopically C due to the persistence of certain components [41]. However, the behaviour of the atomic ratios during HTC cannot support such condensation and polymerization processes. The HTC treatment of CM resulted in a change of the δ15N values from 4.85 to 7.61‰ vs. air-N2, which aligns with those of Reza et al. [42]. They proposed, that a shift towards a heavier δ15N composition may be explained by the decomposition of amino acids and the incorporation of N into organic N-heterocyclic compounds through Maillard reactions.
3.3.2. Macronutrient and Micronutrient Analysis
The CM was characterized by a higher concentration of Ca compared to the other analyzed macronutrients (Table 3). These concentrations as well as those of S, fall within the ranges given in the literature for a manure-type raw material [1,6,10,34,43]. However, the values for P, K, and Mg can be considered to be low [1,10,14,34].
The HTC treatment did not result in an enrichment of these macronutrients (Table 3). Conversely, losses were recorded for P (over 65%), K and S (both over 80%). This observation may be related to the high solubility of these elements in water, which facilitates their loss with the liquid phase after HTC (Table 3). Based on the fact that Ca can enhance P immobilization by complexing for example orthophosphate, a lower P loss during the process was expected [2]. Note that Ca has been documented as one of the key factors in controlling the solubility of P and, therefore, in its immobilization and prevention of loss during HTC [20,21].
Due to its high solubility, losses of K of over 80%, and even up to 90%, from the solid phase are reported during the HTC of chicken and cow manure [10,14,34]. In fact, in our study, 100% of the K present in the CM was soluble (Table 3). Nevertheless, despite the low final concentration of K registered for the hydrochar, the ratio of soluble K to total K was 42.4% (Table 3). This indicates that HTC was able to stabilize K in the hydrochar. Similar to what was suggested for N, a balanced ratio between a K that is rapidly plant accessible and immobilized K that is slowly released would be a desirable property for a soil amendment used as a fertilizer. Concerning S, there exists variability in the reported recovery rates of manure-type feedstocks under similar study conditions to those used here. Mau et al. [43], using poultry litter as feedstock, and Hejna et al. [35], applying CM, reported S recovery rates ranging from 65% to 75% following HTC at 250°C or 240°C (respectively) for 0.5 h. However, Li et al. [6] obtained a S recovery rate of less than 32% following HTC of CM or swine manure at 240°C for 10 h. Therefore, the S losses recorded in our study resemble those obtained with longer mean residence times. The macronutrients that showed the highest recovery rates were Ca and Mg, which are among the elements that tend to concentrate most after HTC processing of manure-derived feedstocks [1].
In terms of micronutrients, the Fe content of CM exceeded those of Cu, B, Mn, and Zn (Table 4), a trend commonly reported for other manure-derived biomasses [1]. Whereas most of the analyzed micronutrients typically increase after an HTC treatment at temperatures near 250°C [1,11], the hydrochar produced in our study does not conform to this pattern. Consistent with what was observed with macronutrients, the recovery values of micronutrients are predominantly below 50% (Table 4). Reza et al. [16], following HTC at 260°C for 5 minutes, also observed a significant loss of these micronutrients in the solid product, although it has to be mentioned that they used lignocellulosic biomass. Of note, the essential plant micronutrients Zn and Cu in the hydrochar do not exceed the concentration thresholds set by European law for HMs in solid organic fertilizers [44] or the limits outlined in the soil protection act [3].
3.3.3. Other Metals and Heavy Metals Analysis
Monitoring the fate of HMs as well as other potentially toxic metals such as Na, Al, Ba, Li, or Sr is crucial due to their potential hazardous effects on ecosystems and their impact on the food chain if used as a soil amendment. Compared to other elements, the HMs As, Cd, Co, Cr, Hg, Ni, Mo, Pb and V have often been found to be more resistant against removal with the aqueous phase of the HTC process [3].
The concentrations of As, Pb, Cd, Hg, and Co in the CM (Table 5) fall within the range reported for pig and chicken manures by Luutu et al. [14]. In their study, they observed an enrichment of these elements following HTC at 260°C and 1 h residence time. This was only observed for Cd in this study. In contrast, all other metals demonstrated a significant and effective removal, similar to the study conducted by Reza et al. [16], on HM removal by the HTC treatment of lignocellulosic material at 260°C for 5 min. In our work, the recovery of HM and metals such as Al, Li, and Sr was slightly higher (around 50% in almost all cases) compared to the other metals studied (Table 5). This might be due to their restricted mobility, high boiling points, and the transformation of organic matter [1,3]. Conversely, Na emerged as the element with the highest losses during HTC, primarily due to its tendency to partially enter the aqueous phase owing to its high solubility in water [11].
Remarkably, within the hydrochar, none of the elements exceed the concentration thresholds established by European law for HM in solid organic fertilizers, excluding those not encompassed by this regulation [44]. Yet, when conducting risk assessments, the pollutant’s loading rate holds more significance than its concentration. Hence, a substantial impact of these concentrations of HM on the phytotoxicity of hydrochar is not anticipated.
3.4. Solid-State NMR Spectroscopy
3.4.1. Solid-State 13C NMR Spectroscopy
The solid-state 13C NMR spectrum of CM (Figure 1A) is primarily dominated by signals in the O-alkyl C chemical shift region (60–110 ppm), which embraces resonances from C in simple and complex carbohydrates, alcohols, and ethers. Thus, O-alkyl C represented ~50% of the total 13C intensity. Due to the presence of plant residues mixed within the manure, contributions of cellulose and the propanyl side chain of lignin derivatives are expected [45]. Indeed, the main signals observed around 72–75 ppm is best assigned to C2, C3, and C5 from cellulose, as well as C from xylans. Additionally, peaks at 62-65 ppm can be attributed to the amorphous and crystalline domains (C6) of cellulose. Signals at 83 and 88 ppm, likewise, arise from the non-crystalline and crystalline components of C4, whereas the signal at 104 ppm originates from the anomeric C1 of cellulose. The chemical shift region between 0−45 ppm is assigned to alkyl C and contributes with ~23% the total 13C intensity (Figure 1B; Table S2). This region exhibits a prevalence of methyl groups (CH3) and methylene (CH2) chains (peaks at 23, 30-32 and 40 ppm) as they occur in acetylated sugars, peptides or lipids. The N-alkyl/methoxyl C region between 45-60 ppm indicates the presence of C–N in amino acids or amino sugars but may also contain contribution of methoxyl C in lignin. Aryl C and phenolic C contribute ~7% and ~3%, respectively (Figure 1B; Table S2), to the total 13C intensity. They resonate in the region between 110-160 ppm of the CM spectrum (Figure 1B), showing peaks at 128, 137 and 154 (C in N-heterocyclics and/or aromatic C of lignin like phenolic syringyl-like compounds) [45,46]. Finally, the carboxyl C region (160–185 ppm), contributing with ~7% to the total 13C intensity (Figure 1B; Table S2), shows a peak at 172 ppm, attributable to C in carboxyl groups.
As anticipated, the HTC process led to decarboxylation, evident through the low recovery of carboxyl C of 2.5% (Figure 1B; Table S2). During this process, O-alkyl and N-alkyl/methoxyl C degraded, whereas aromatic C, seemingly formed through the dehydration and cyclization of carbohydrates and peptide material [24]. Thus, the relative contribution to total 13C intensity in both chemical shift regions experienced an increase from ~7% to ~21% and from ~3% to ~6%, respectively (Figure 1B; Table S2), after HTC treatment. This result is consistent with the observed decrease of the O/C and H/C ratios.
The signals in the O-alkyl and N-alkyl/methoxyl C region of the hydrochar spectrum peak at the same chemical shift as in that of the CM (Figure 1A), although their intensity differs from the former. The total 13C intensity for both chemical shift regions varied from ~50% and ~10%, respectively, in CM to ~21% and ~7% in hydrochar (Table S2). However, in the aryl C region amounting to ~21% of the total 13C intensity (Table S2), the peak at 128 ppm evolves to the main signal of the region (Figure 1A). Similar to the increase of the the aromatic C intensity, the contribution of the chemical shift region of alkyl C to the total 13C intensity increased from ~23% to ~40% (Table S2). An increase in this region following HTC has also been reported by Cao et al. (swine manure; 250 °C, 20h) [23] and Paneque et al. (sewage sludge; 260 °C, 0.5h) [24].
Considering the C recovery of the hydrochar and, consequently, the different C groups after the HTC process, no net lipid synthesis or degradation occurred. Rather, a relative enrichment was observed, attributed to the loss of other compounds. Carbohydrates, notably impacted in this instance, are preferentially degraded during thermal processes, consequently causing a relative enrichment among all other classes of compounds [23].
3.4.2. Solid-State 15N NMR Spectroscopy
In the solid-state 15N NMR spectrum of CM, a signal at −260 ppm dominates the amide N chemical shift region (−248 to −285 ppm) (Figure 2A), contributing with 83% to the total 15N intensity (Figure 2B; Table S3). This intensity is mainly caused by peptide-N and, to a lesser extent, by amide-C in amino sugars. The ~10% contribution to the total 13C intensity recorded in the chemical shift region between 60 and 45 ppm in the 13C NMR spectrum of CM may be related to the N-alkyl C of these amides. However, given the possible presence of some plant residues in the CM, it is likely that, although to a small extent, the methoxyl C from lignin is also contributing to this signal.
The remaining ~17% of the total 15N intensity in the 15N NMR spectrum of CM occurs in the pyrrole N region (−150 to −248 ppm) (Figure 2B; Table S3). Here, a small signal at -225 ppm appears and can be assigned to pyrrole-N [24] but may also be indicative for uric acid. Another anticipated peak at -346 ppm, corresponds to terminal amino N in peptides or amino sugars (Figure 2A).
After the HTC process, the pyrrole N region increases with ~65% to the 15N NMR spectrum of the hydrochar (Figure 2AB; Table S3), which is in accordance with the formation of N-heterocyclic aromatic structures such as indoles, imidazoles, and pyrroles during the carbonization process. Indeed, in the 15N NMR spectrum of the hydrochar, a distinct signal appears at -245 ppm, corresponding to the chemical shift of Indole N (Figure 2A). HTC led to a reduction of the 15N intensity in the amide N region of the hydrochar spectrum, from ~83% in the raw material to ~35% in the hydrochar (Figure 2B; Table S3). Although the main peak at -260 ppm observed in the 15N NMR spectrum of the CM can still be identified in the one of hydrochar, the additional signal at -255 ppm in the latter evidences the chemical changes that have occurred during HTC. Despite lacking defined peaks assignable to carbazole N (around -262 ppm) and benzamide-type N (-275 ppm), these could potentially contribute to the shoulder of the amide N resonance [24].
3.5. Assessment of Phytotoxicity and Fertilizing Potential
3.5.1. Germination and Seedling Growth
For lettuce, the application of hydrochar had no impact on the studied germination parameters except for VI. Its value is higher for both hydrochar treatments compared to CTR (Table 6). The hydrochar-treated plants showed longer hypocotyl lengths compared to the CTR already during the first days of the germination period (Figure 3A). This aligns with the VI results, as this index depends on germination (G) and hypocotyl length at 7 DAS (Table 6). Only HC-3.25 treated plants were higher than the CTR plants at 20 DAS (Figure 3B). Zhang et al. [47] reported that during early growth stages, when lettuce plants exhibit high relative growth rates, the rate of N uptake increases over time. Consequently, our results may indicate a deficiency of available N during this early growth phase of the CTR plants, negatively impacting their growth.
In the case of sunflower plants, the HC-3.25 treatment caused delayed germination, as evidenced by the longer time required for seeds to emerge (MGT), the longer time needed until 50% of the seeds germinated (T50), and the degree of uncertainty associated with the distribution of the relative frequency of germination (U) (Table 6). Consequently, this treatment exhibited a lower speed of germination (MGR), and less synchronization of the process (Z) compared to the other treatments. Although HC-3.25 exhibited the lowest VI value, its value did not significantly differ from those of the other treatments (Table 6), thus indicating that this germination delay had no significant impact on seedling growth. However, the germination delay is not attributed to deleterious phytotoxicity of the hydrochar, as higher doses did not promote this effect. Moreover, far from having a negative effect, HC-3.25 treated plants were the only ones that were significantly higher at 20 DAS compared to those of CTR (Figure 3D).
In contrast, the application of the HC-6.5 dose to the pots with the tomato plants adversely affected the G percentage and Z, although this was not seen with the HC-3.25 dose. These results are consistent with those obtained by Suarez et al. [15], reporting that the addition of a 5% (DW) dose of hydrochar derived from garden and park waste affected tomato seed germination negatively, both in soil and peat-based growth media. The diminished VI of the HC-6.5 plants indicates a phytotoxic effect of this dose for this species. In fact, these plants experienced reduced hypocotyl and plant development throughout the experiment (Figure 3EF). Considering that the physical (pH, EC) and chemical (nutrients and HMs) characteristics of the hydrochar do not reach values that could negatively affect germination and seedling growth, all these effects may be explained by the presence of toxic organic species such as furfural, furans or phenolic compounds [14,15,48] that were not removed with the liquid after the HTC. Furthermore, the fact that the effects are only evident at HC-6.5 doses and in tomato plants suggests that this species is more sensitive to potential phytotoxins compared to the other two studied.
The documented effects of hydrochar on germination and growth range from inhibition to stimulation and may vary depending on the feedstock used, hydrochar dosage, and the studied species [9,14,49]. As observed in other studies, both the hydrochar dosage and the plant species used proved crucial in determining hydrochar’s impact on seed germination and early growth in this research.
3.5.2. Biomass and Efficiency of Photosystem II
In the early seedling stage (7 or 14 DAS), none of the studied plants showed significant reductions of the produced shoot dry biomass, although the HC-6.5 tomato plants began to exhibit a negative impact of this treatment (Figure 4C). At 20 DAS, the HC-3.25 treatment emerged as the one that yielded improved shoot dry biomass in lettuce and sunflower plants compared to CTR (Figure 4AB). Hydrochar has previously been documented to enhance plant growth and productivity through the release of nutrients [9,50]. A suitable NO3- content, leading to a favorable inorganic N to organic N ratio such as that found in the used hydrochar, allows short- and medium-term fertilization, as also proposed by Paneque et al. [24]. However, it is worth to highlight that on the long-term, organic N components facilitating a slow release of available N is a further benefit of charred residues [51]. Remarkably, by increasing the application with HC-6.5 and hence the NO3- content, greater or similar plant biomass yields were not obtained in relation to HC-3.25. This may be due to the compensation of the positive effect of increased N-availability by an increase of potential phytotoxins that are non-deleterious but are slightly inhibitory on the growth of lettuce and sunflower plants [14]. This suggest that with lower doses, a better balance between both effects can be achieved. In fact, this can explain why the HC-6.5 sunflower plants exhibited the lowest QYPSII values at 7 and 14 DAS, indicating a higher degree of physiological stress without compromising biomass generation compared to the CTR plants (Figure 4E). Conversely, at 14 DAS, among sunflowers, plants treated with hydrochar achieved the highest QYPSII, aligning with the greatest shoot biomass production at 20 DAS. Paneque et al. [52] also observed that sunflowers treated with biochar exhibited higher efficiency of photosystem-II compared to those grown in unamended substrates, which was associated with increased growth and yield. However, the trend we observed in sunflowers was not replicated in lettuce plants treated with hydrochar, as no significant differences in QYPSII compared to the CTR plants were recorded throughout the experiment (Figure 4D).
In line with our germination results and the study by Suarez et al. [15], the HC-6.5 tomato plants experienced a drastic reduction of the shoot biomass at 25 DAS as a result of the physiological stress induced by this dose (Figure 4C). The plant stress was further evidenced by the drastic decline of QYPSII recorded during the experiment (Figure 4F). The reduction in growth, photosynthetic efficiency, and consequently the inhibition of biomass generation is among the primary responses of plants to stressful situations [52]. This result, along with those obtained for germination and growth, once again highlights the high sensitivity of this species to higher doses of hydrochar, which must be taken into account when developing a soil application strategy for improving crop performance.
4. Conclusions
The low recovery of some of the most important nutrients, such as N, P, and K, after HTC treatment, highlights the importance of further investigating their fate during this process and the need to improve their retention. Furthermore, the comprehensive characterization of the recovery of key micronutrients, other metals, and HMs in this study underscores the importance and need for in-depth research. Additional studies should focus on the loss and enrichment of lesser-studied elements during HTC, which are also of environmental significance. Despite the low N recovery, and as reported in previous studies [24], the studied hydrochar exhibits a good balance between inorganic N and organic N content, making it suitable for N-fertilization in the short or medium term. The same applies for the ratio between soluble and total K. Indeed, the obtained hydrochar demonstrated growth-promoting capacity, particularly at a dose of 3.25 t ha⁻¹ (equivalent to 2.7 w/w), although this seems to be significantly influenced by the respective plant species. This result emphasizes the relevance of considering the application dose, plant species, and their sensitivity when establishing a fertilization framework with amendments. Thus, this preliminary exploration into the phytotoxicity and fertilization potential of chicken-manure derived hydrochar highlights HTC as an alternative and effective means to recycle N and decrease toxic substances in organic farming residues. However, future studies need to extend the investigation to field experiments accessing the nutrient dynamics not only for the short or medium, but also on a long-term scale.
Supplementary Materials
The following supporting information can be downloaded at the website of this paper posted on Preprints.org, Table S1: Isotopic δ13C and δ15N composition of chicken manure and its respective hydrochar produced at 250 °C for 0.5 h.; Table S2: Intensity distribution (%) of the solid-state 13C NMR spectrum of chicken manure and its respective hydrochar, and C recovery of the different C groups after HTC (250 °C for 0.5 h); Table S3: Intensity distribution (%) of the solid-state 15N NMR spectrum of chicken manure and its respective hydrochar, and N recovery of the different N groups after HTC (250 °C for 0.5 h).
Author Contributions
Conceptualization, F.J.M.R., H.K.; methodology, F.J.M.R., H.K., M.V.M., J.L. R.L.N.; software, F.J.M.R., H.K. and M.V.M.; validation, F.J.M.R., H.K. and M.V.M.; formal analysis, F.J.M.R. and H.K.; investigation, F.J.M.R.; writing—original draft preparation, F.J.M.R.; writing—review and editing, H.K., M.V.M., J.L., R.L.N., and F.J.M.R.; supervision, H.K..; project administration, H.K.; funding acquisition, H.K. and R.L.N. All authors have read and agreed to the published version of the manuscript.
Funding
This research was funded by the Junta de Andalucía and the European Regional Development Fund (European Union) (‘SequestCarb’ project; PY20_01065; PAIDI 2020 call). Predoctoral research was supported by the PhD scholarship (PREDOC_00339) awarded by the Junta de Andalucía.
Data Availability Statement
The raw data supporting the conclusions of this article will be made available by the authors on request.
Acknowledgments
The authors acknowledge financial support from the Junta de Andalucía and the European Regional Development Fund (European Union) for funding the project SequestCarb (PY20_01065; PAIDI 2020 call). The authors also gratefully acknowledge the PhD scholarship (PREDOC_00339) granted by the Junta de Andalucía, which enabled Francisco Jesús Moreno Racero to carry out his work. We are grateful for the technical support and expertise of Rocío Reinoso Limones, as well as the ATB team in Potsdam-Bornim who produced the hydrochar, especially Jürgen Kern and Marcus Fischer. The central analytical service as well as the stable isotopes laboratory (LIE) of the IRNAS-CSIC are thanked for their support during analytical data acquisition.
Conflicts of Interest
The authors declare no conflicts of interest.
Abbreviations
The following abbreviations are used in this manuscript:
| CM Corg |
Chicken Manure Organic carbon |
| CP-MAS | Cross-Polarization Magic Angle Spinning |
| DAS | Days After Sowing |
| DM | Dry Matter |
| DOC | Dissolved Organic Carbon |
| DON | Dissolved Organic Nitrogen |
| DW | Dry Weight |
| EC | Electric Conductivity |
| G | Germination percentage |
| HF | Hydrofluoric acid |
| HM | Heavy Metal |
| HSD | Honestly Significant Difference |
| HTC IC |
Hydrothermal Carbonization Inorganic Carbon |
| ICP-OES | Inductively Coupled Plasma-Optical Emission Spectroscopy |
| IRMS | Isotopic Ratio Mass Spectrometer |
| MGR | Mean Germination Rate |
| MGT | Mean Germination Time |
| Ni | Inorganic Nitrogen |
| NMR | Nuclear Magnetic Resonance |
| PSII | Photosystem II |
| QY | Quantum Yield |
| QYPSII | Quantum Yield of Photosystem II |
| SE | Standard Error |
| T50 | Time required for 50% of the seeds to germinate |
| U | Uncertainty of the germination process |
| VI | Vigour Index |
| VPDB | Vienna Pee Dee Belemnite |
| WHC | Water Holding Capacity |
| Z | Synchronization index |
References
- Fu, H.; Wang, B.; Wang, H.; Liu, H.; Xie, H.; Han, L.; Wang, N.; Sun, X.; Feng, Y.; Xue, L. Assessment of livestock manure-derived hydrochar as cleaner products: Insights into basic properties, nutrient composition, and heavy metal content. J. Clean. Prod. 2022, 330, 129820. [Google Scholar] [CrossRef]
- He, X.; Wang, Y.; Zhang, Y.; Wang, C.; Yu, J.; Ohtake, H.; Zhang, T. The potential for livestock manure valorization and phosphorus recovery by hydrothermal technology-a critical review. Mater Sci Energy Technol. 2023, 6, 94–104. [Google Scholar] [CrossRef]
- Libra, J.A.; Ro, K.S.; Kammann, C.; Funke, A.; Berge, N.D.; Neubauer, Y.; Titirici, M.M.; Fühner, C.; Bens, O.; Kern, J.; Emmerich, K.H. Hydrothermal carbonization of biomass residuals: a comparative review of the chemistry, processes and applications of wet and dry pyrolysis. Biofuels. 2011, 2(1), 71–106. [Google Scholar] [CrossRef]
- Fertilizers Europe, 2024. Forecast of food, farming & fertilizer use in the European Union 2024-2034. https://www.fertilizerseurope.com/wp-content/uploads/2024/12/Forecast-2024-34-web.pdf. 20 August.
- Vingerhoets, R.; Spiller, M.; Schoumans, O.; Vlaeminck, S.E.; Buysse, J.; Meers, E. Economic potential for nutrient recovery from manure in the European union. Resour. Conserv. Recycl. 2025, 2025. 215, 108079. [Google Scholar] [CrossRef]
- Li, Q.; Zhang, S.; Gholizadeh, M.; Hu, X.; Yuan, X.; Sarkar, B.; Vithanage, M.; Mašek, O.; Ok, Y.S. Co-hydrothermal carbonization of swine and chicken manure: Influence of cross-interaction on hydrochar and liquid characteristics. Sci. Total Environ. 2021, 786, 147381. [Google Scholar] [CrossRef]
- Liu, Y.; Yao, S.; Wang, Y.; Lu, H.; Brar, S.K.; Yang, S. Bio-and hydrochars from rice straw and pig manure: inter-comparison. Bioresour. Technol. 2017, 235, 332–337. [Google Scholar] [CrossRef]
- Cavali, M.; Junior, N.L.; de Sena, J.D.; Woiciechowski, A.L.; Soccol, C.R.; Belli Filho, P.; Bayard, R.; Benbelkacem, H.; de Castilhos Junior, A.B. A review on hydrothermal carbonization of potential biomass wastes, characterization and environmental applications of hydrochar, and biorefinery perspectives of the process. Sci. Total Environ. 2023, 857, 159627. [Google Scholar] [CrossRef] [PubMed]
- Paneque, M.; Knicker, H.; Kern, J.; De la Rosa, J.M. Hydrothermal carbonization and pyrolysis of sewage sludge: Effects on Lolium perenne Germination and Growth. Agronomy. 2019, 9(7), 363. [Google Scholar] [CrossRef]
- Reza, M.T.; Freitas, A.; Yang, X.; Hiibel, S.; Lin, H.; Coronella, C.J. Hydrothermal Carbonization (HTC) of Cow Manure: Carbon and Nitrogen Distributions in HTC Products. Environ. Prog. Sustain. Energy 2016, 35, 1002–1011. [Google Scholar] [CrossRef]
- Wu, K.; Zhang, X.; Yuan, Q. Effects of process parameters on the distribution characteristics of inorganic nutrients from hydrothermal carbonization of cattle manure. J. Environ. Manage. 2018, 209, 328–335. [Google Scholar] [CrossRef]
- Ren, J.; Wang, F.; Zhai, Y.; Zhu, Y.; Peng, C.; Wang, T.; Li, C.; Zeng, G. Effect of sewage sludge hydrochar on soil properties and Cd immobilization in a contaminated soil. Chemosphere. 2017, 189, 627–633. [Google Scholar] [CrossRef]
- de Jager, M.; Giani, L. An investigation of the effects of hydrochar application rate on soil amelioration and plant growth in three diverse soils. Biochar. 2021, 3(3), 349–365. [Google Scholar] [CrossRef]
- Luutu, H.; Rose, M.T.; McIntosh, S.; Van Zwieten, L.; Weng, H.H.; Pocock, M.; Rose, T.J. Phytotoxicity induced by soil-applied hydrothermally-carbonised waste amendments: effect of reaction temperature, feedstock and soil nutrition. Plant Soil. 2023, 493(1), 647–661. [Google Scholar] [CrossRef]
- Suarez, E.; Tobajas, M.; Mohedano, A.F.; Reguera, M.; Esteban, E.; de la Rubia, A. Effect of garden and park waste hydrochar and biochar in soil application: a comparative study. Biomass Convers. Biorefin. 2023, 13(18), 16479–16493. [Google Scholar] [CrossRef]
- Reza, M.T.; Lynam, J.G.; Uddin, M.H.; Coronella, C.J. Hydrothermal carbonization: Fate of inorganics. Biomass Bioenerg. 2013, 49, 86–94. [Google Scholar] [CrossRef]
- Alhnidi, M.J.; Wüst, D.; Funke, A.; Hang, L.; Kruse, A. Fate of nitrogen, phosphate, and potassium during hydrothermal carbonization and the potential for nutrient recovery. ACS Sustain Chem Eng. 2020, 8(41), 15507–15516. [Google Scholar] [CrossRef]
- Nzediegwu, C.; Naeth, M.A.; Chang, S.X. Carbonization temperature and feedstock type interactively affect chemical, fuel, and surface properties of hydrochars. Bioresour. Technol. 2021, 330, 124976. [Google Scholar] [CrossRef] [PubMed]
- Heilmann, S.M.; Molde, J.S.; Timler, J.G.; Wood, B.M.; Mikula, A.L.; Vozhdayev, G.V.; Colosky, E.C.; Spokas, K.A.; Valentas, K.J. Phosphorus reclamation through hydrothermal carbonization of animal manures. Environ. Sci. Technol. 2014, 48(17), 10323–10329. [Google Scholar] [CrossRef]
- Dai, L.; Tan, F.; Wu, B.; He, M.; Wang, W.; Tang, X.; Hu, O.; Zhang, M. Immobilization of phosphorus in cow manure during hydrothermal carbonization. J. Environ. Manage. 2015, 157, 49–53. [Google Scholar] [CrossRef] [PubMed]
- Huang, R.X.; Fang, C.; Zhang, B.; Tang, Y.Z. Transformations of phosphorus speciation during (hydro)thermal treatments of animal manures. Environ. Sci. Technol. 2018, 52, 3016–3026. [Google Scholar] [CrossRef]
- Paneque, M.; de la Rosa, J.M.; Patti, A.F.; Knicker, H. Changes in the bio-availability of phosphorus in pyrochars and hydrochars derived from sewage sludge after their amendment to soils. Agronomy. 2021, 11(4), 623. [Google Scholar] [CrossRef]
- Cao, X.; Ro, K.S.; Chappell, M.; Li, Y.; Mao, J. Chemical structures of swine-manure chars produced under different carbonization conditions investigated by advanced solid-state 13C nuclear magnetic resonance (NMR) spectroscopy. Energy Fuels. 2011, 25(1), 388–397. [Google Scholar] [CrossRef]
- Paneque, M.; De la Rosa, J.M.; Kern, J.; Reza, M.T.; Knicker, H. Hydrothermal carbonization and pyrolysis of sewage sludges: What happen to carbon and nitrogen? J Anal Appl Pyrol. 2017, 128, 314–323. [Google Scholar] [CrossRef]
- Veihmeyer, F.J.; Hendrickson, A.H. Methods of measuring field capacity and wilting percentages of soils. Soil Sci. 1949, 68, 75–94. [Google Scholar] [CrossRef]
- Keeney, D.R.; Nelson, D.W. forms. In Methods of Soil Analysis Part 2; Bottomley, P.J., Angle, J.S., Weaver, R.W., Eds.; John Wiley & Sons: Hoboken, NJ, USA, 1982; pp. 643–698. [Google Scholar] [CrossRef]
- Greweling, T.; Peech, M.L. Chemical Soil Test; Agriculture Experiment Station, Cornell University: Ithaca, NY, USA, 1960; p. 960. [Google Scholar]
- Olsen, S.R.; Cole, C.V.; Watanabe, F.S. Estimation of Available Phosphorus in Soils by Extraction with Sodium Bicarbonate; Circular (United States. Department of Agriculture); U.S. Department of Agriculture: Washington, DC, USA, 1954. [Google Scholar]
- Helmke, P.A.; Sparks, D.L. cesium. In Methods of Soil Analysis Part 3: Chemical Methods; Sparks, D.L., Ed.; SSSA Book Series No 5; SSSA: Madison, WI, USA, 1996. [Google Scholar] [CrossRef]
- Gonçalves, C.N.; Dalmolin, R.S.; Dick, D.P.; Knicker, H.; Klamt, E.; Kögel-Knabner, I. The effect of 10% HF treatment on the resolution of CPMAS 13C NMR spectra and on the quality of organic matter in Ferralsols. Geoderma 2003, 116, 373–392. [Google Scholar] [CrossRef]
- Knicker, H.; Totsche, K.U.; Almendros, G.; González-Vila, F.J. Condensation degree of burnt peat and plant residues and the reliability of solid-state VACP MAS 13C NMR spectra obtained from pyrogenic humic material. Org. Geochem. 2005, 36, 1359–1377. [Google Scholar] [CrossRef]
- Ranal, M.A.; Santana, D.G. How and why to measure the germination process? Braz J Bot. 2006, 29, 1–11. [Google Scholar] [CrossRef]
- Ranal, M.A.; Santana, D.G.; Ferreira, W.R.; Mendes-Rodrigues, C. Calculating germination measurements and organizing spreadsheets. Braz J Bot. 2009, 32, 849–855. [Google Scholar] [CrossRef]
- Ekpo, U.; Ross, A.B.; Camargo-Valero, M.A.; Williams, P.T. A comparison of product yields and inorganic content in process streams following thermal hydrolysis and hydrothermal processing of microalgae, manure and digestate. Bioresour. Technol. 2016, 200, 951–960. [Google Scholar] [CrossRef]
- Hejna, M.; Świechowski, K.; Rasaq, W.A.; Białowiec, A. Study on the Effect of Hydrothermal Carbonization Parameters on Fuel Properties of Chicken Manure Hydrochar. Materials. 2022, 15(16), 5564. [Google Scholar] [CrossRef] [PubMed]
- Funke, A.; Ziegler, F. Hydrothermal carbonization of biomass: a summary and discussion of chemical mechanisms for process engineering. Biofuel Bioprod. Biorefin. 2010, 4(2), 160–177. [Google Scholar] [CrossRef]
- Hoffmann, V.; Jung, D.; Zimmermann, J.; Rodriguez Correa, C.; Elleuch, A.; Halouani, K.; Kruse, A. Conductive carbon materials from the hydrothermal carbonization of vineyard residues for the application in electrochemical double-layer capacitors (EDLCs) and direct carbon fuel cells (DCFCs). Materials. 2019, 12(10), 1703. [Google Scholar] [CrossRef]
- Bargmann, I.; Martens, R.; Rillig, M.C.; Kruse, A.; Kücke, M. Hydrochar amendment promotes microbial immobilization of mineral nitrogen. J. Plant Nutr. Soil Sci. 2014, 177(1), 59–67. [Google Scholar] [CrossRef]
- Saiz, G.; Wynn, J.G.; Wurster, C.M.; Goodrick, I.; Nelson, P.N.; Bird, M.I. Pyrogenic carbon from tropical savanna burning: production and stable isotope composition. Biogeosciences Discussions. 2015, 11(10), 15149–15183. [Google Scholar] [CrossRef]
- Poole, I.; Braadbaart, F.; Boon, J.J.; van Bergen, P.F. Stable carbon isotope changes during artificial charring of propagules. Org. Geochem. 2002, 33(12), 1675–1681. [Google Scholar] [CrossRef]
- Sabio, E.; Álvarez-Murillo, A.; Román, S.; Ledesma, B. Conversion of tomato-peel waste into solid fuel by hydrothermal carbonization: Influence of the processing variables. Waste Manag. 2016, 47, 122–132. [Google Scholar] [CrossRef]
- Reza, M.T.; Poulson, S.R.; Roman, S.; Coronella, C.J. Behavior of stable carbon and stable nitrogen isotopes during hydrothermal carbonization of biomass. J. Anal. Appl. Pyrol. 2018, 131, 85–92. [Google Scholar] [CrossRef]
- Mau, V.; Quance, J.; Posmanik, R.; Gross, A. Phases’ characteristics of poultry litter hydrothermal carbonization under a range of process parameters. Bioresour. Technol. 2016, 219, 632–642. [Google Scholar] [CrossRef] [PubMed]
- European Parliament, European Council Regulation (EU) 2019/1009 of the European Parliament and of the Council of 5 June 2019 laying down rules on the making available on the market of EU fertilizing products and amending Regulations (EC) No 1069/2009 and (EC) No 1107/2009 and repealing Regulation (EC) No 2003/2003. http://data.europa.eu/eli/reg/2019/1009/2023-03-16. (Accessed on 20 August 2025).
- Schnitzer, M.I.; Monreal, C.M.; Facey, G.A.; Fransham, P.B. The conversion of chicken manure to biooil by fast pyrolysis I. Analyses of chicken manure, biooils and char by 13C and 1H NMR and FTIR spectrophotometry. J. Environ. Sci. Health. Part B Pestic. Food Contam. Agric. Wastes 2007, 42, 71–77. [Google Scholar] [CrossRef]
- Cimò, G.; Kucerik, J.; Berns, A.E.; Schaumann, G.E.; Alonzo, G.; Conte, P. Effect of heating time and temperature on the chemical characteristics of biochar from poultry manure. J. Agric. Food Chem. 2014, 62(8), 1912–1918. [Google Scholar] [CrossRef]
- Zhang, K.; Burns, I.G.; Turner, M.K. Derivation of a dynamic model of the kinetics of nitrogen uptake throughout the growth of lettuce: calibration and validation. J. Plant Nutr. 2008, 31(8), 1440–1460. [Google Scholar] [CrossRef]
- Li, Y.; Shen, F.; Guo, H.; Wang, Z.; Yang, G.; Wang, L.; Zhang, Y.; Zeng, Y.; Deng, S. Phytotoxicity assessment on corn stover biochar, derived from fast pyrolysis, based on seed germination, early growth, and potential plant cell damage. Environ. Sci. Pollut. Res. Int. 2015, 22, 9534–9543. [Google Scholar] [CrossRef]
- Islam, M.A.; Limon, M.S.H.; Romić, M.; Islam, M.A. Hydrochar-based soil amendments for agriculture: a review of recent progress. Arab. J. Geosci. 2021, 14, 1–16. [Google Scholar] [CrossRef]
- Baronti, S.; Alberti, G.; Camin, F.; Criscuoli, I.; Genesio, L.; Mass, R.; Vaccari, F.P.; Ziller, L.; Miglietta, F. Hydrochar enhances growth of poplar for bioenergy while marginally contributing to direct soil carbon sequestration. GCB Bioenergy. 2017, 9(11), 1618–1626. [Google Scholar] [CrossRef]
- De la Rosa, J.M.; Knicker, H. Bioavailability of N released from N-rich pyrogenic organic matter: an incubation study. Soil Biol. Biochem. 2011, 43(12), 2368–2373. [Google Scholar] [CrossRef]
- Paneque, M.; José, M.; Franco-Navarro, J.D.; Colmenero-Flores, J.M.; Knicker, H. Effect of biochar amendment on morphology, productivity and water relations of sunflower plants under non-irrigation conditions. Catena. 2016, 147, 280–287. [Google Scholar] [CrossRef]
Figure 1.
(A) Solid-state 13C NMR spectra of chicken manure and its respective hydrochar produced at 250 °C for 0.5 h. (B) Intensity distribution (%) of the solid-state 13C NMR spectrum of chicken manure and C recovery after HTC treatment of the different C groups (dashed line) in its respective hydrochar produced at 250 °C for 0.5 h. Mean values ± SE. n=3.
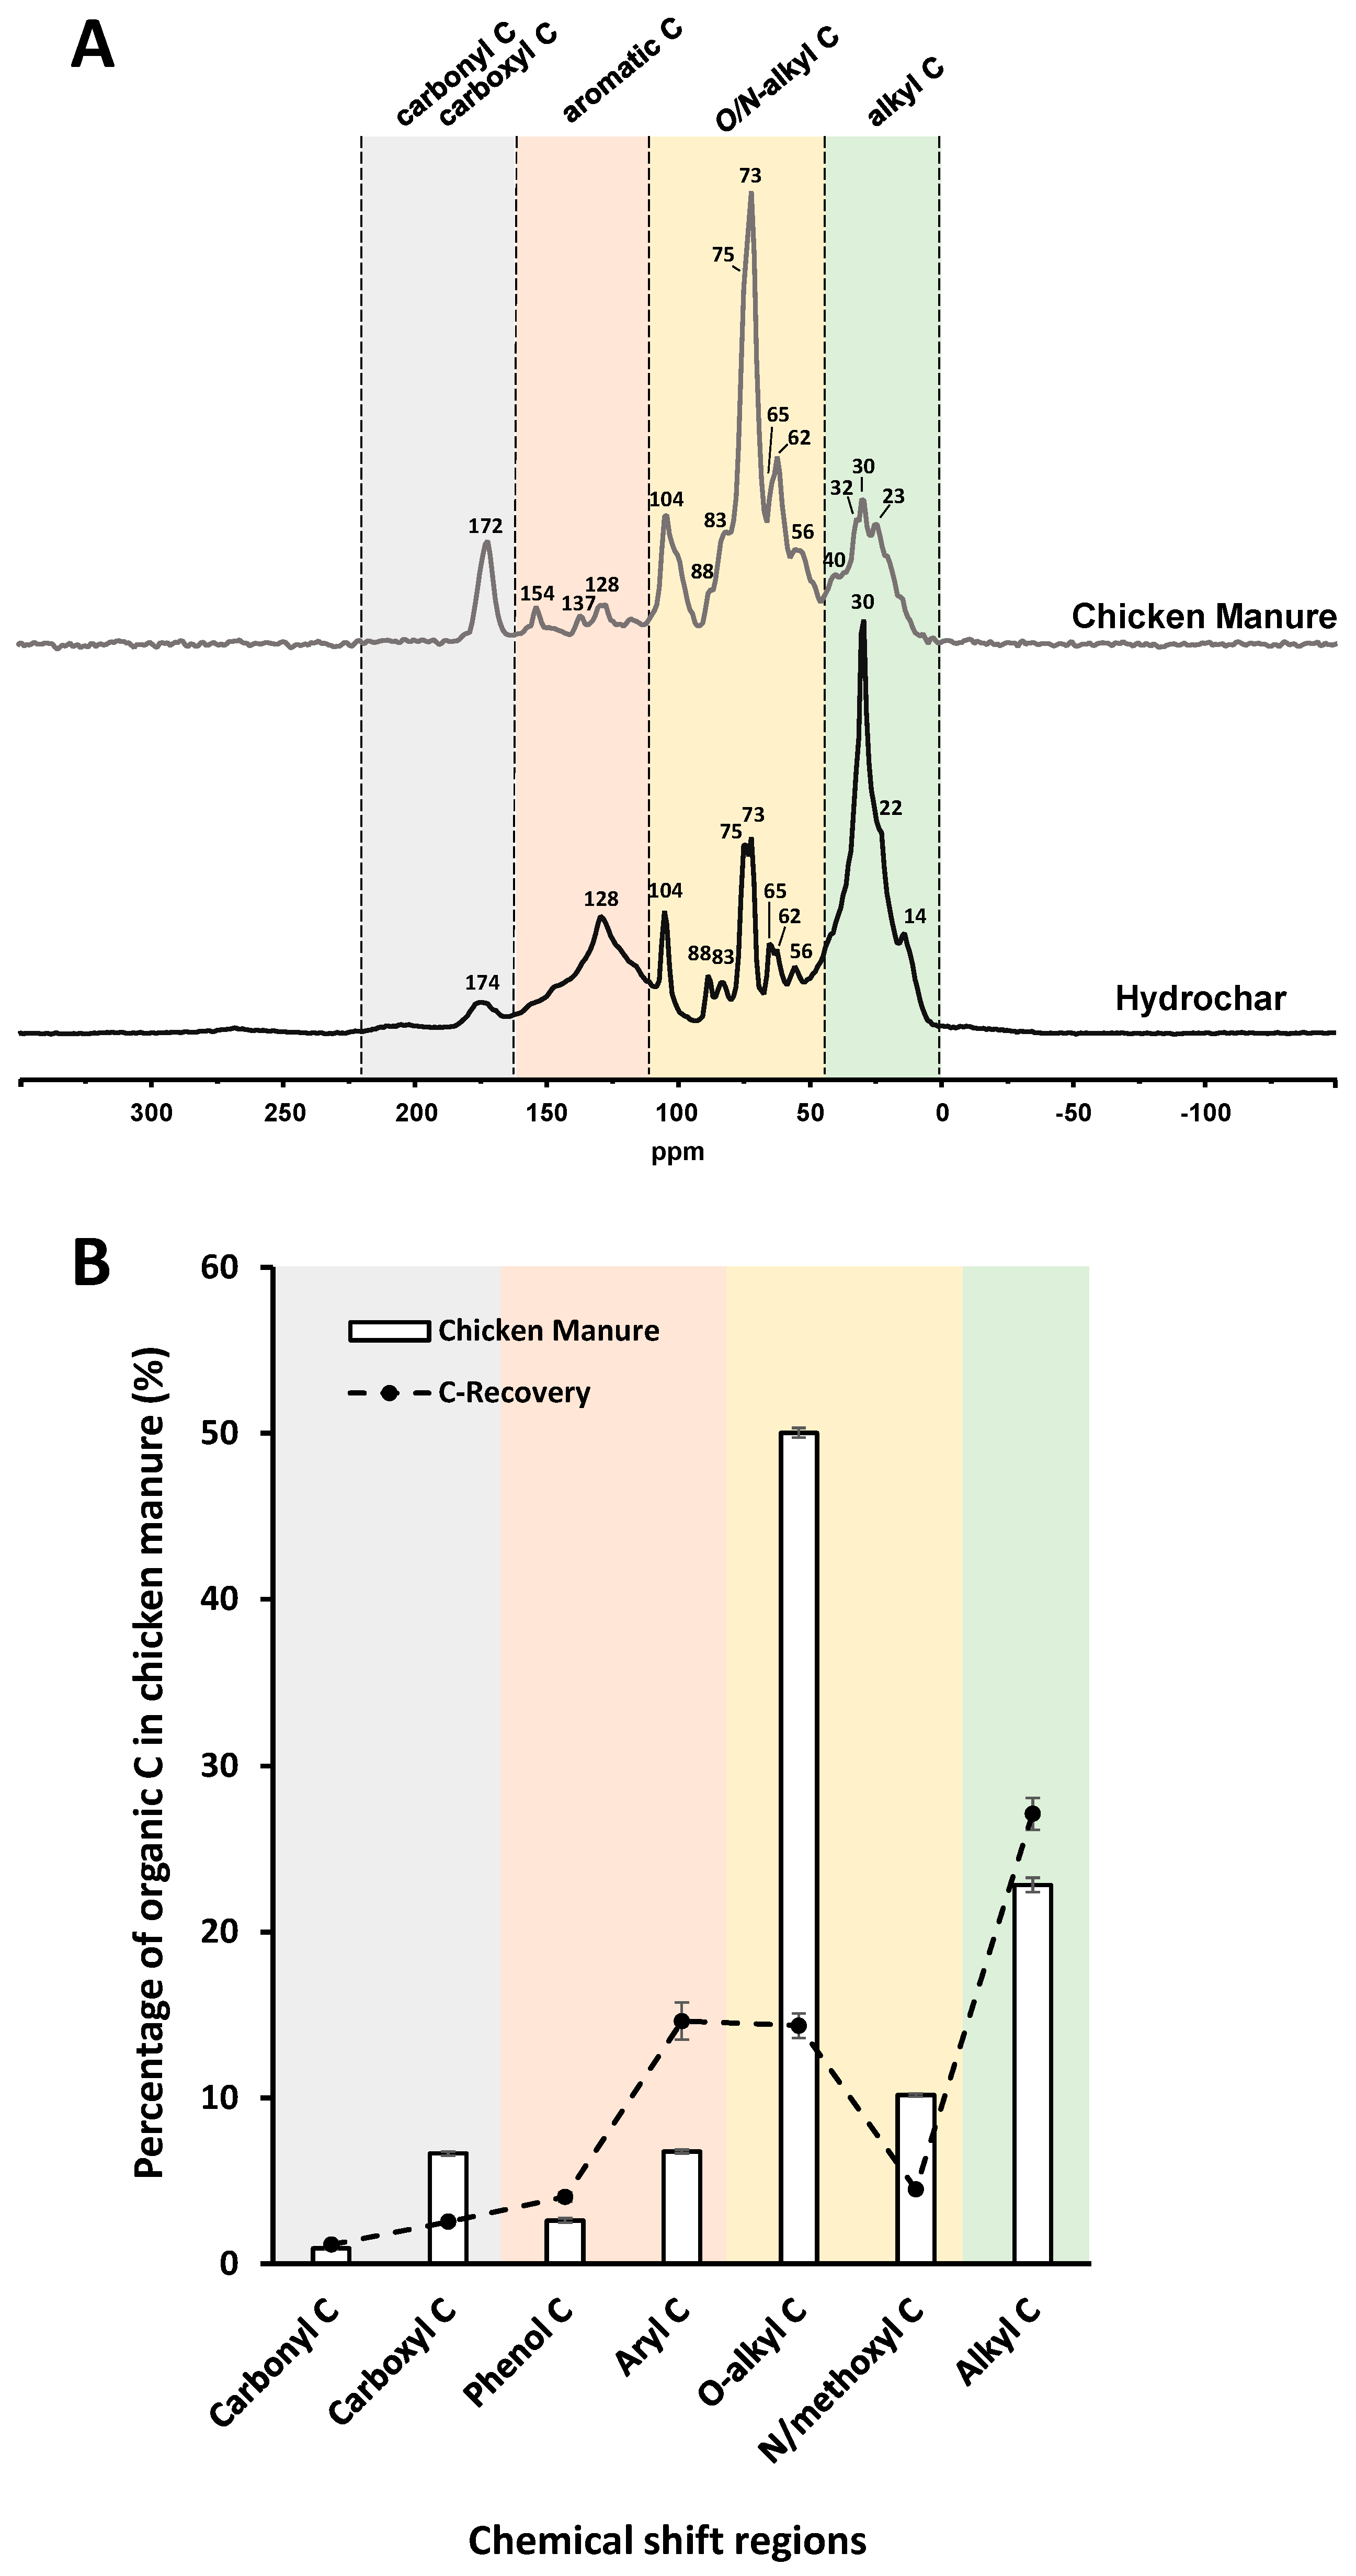
Figure 2.
(A) Solid-state 15N NMR spectra of chicken manure and its respective hydrochar produced at 250 °C for 0.5 h. (B) Intensity distribution (%) of the solid-state 15N NMR spectra of chicken manure and its respective hydrochar produced at 250 °C for 0.5 h.
Figure 2.
(A) Solid-state 15N NMR spectra of chicken manure and its respective hydrochar produced at 250 °C for 0.5 h. (B) Intensity distribution (%) of the solid-state 15N NMR spectra of chicken manure and its respective hydrochar produced at 250 °C for 0.5 h.
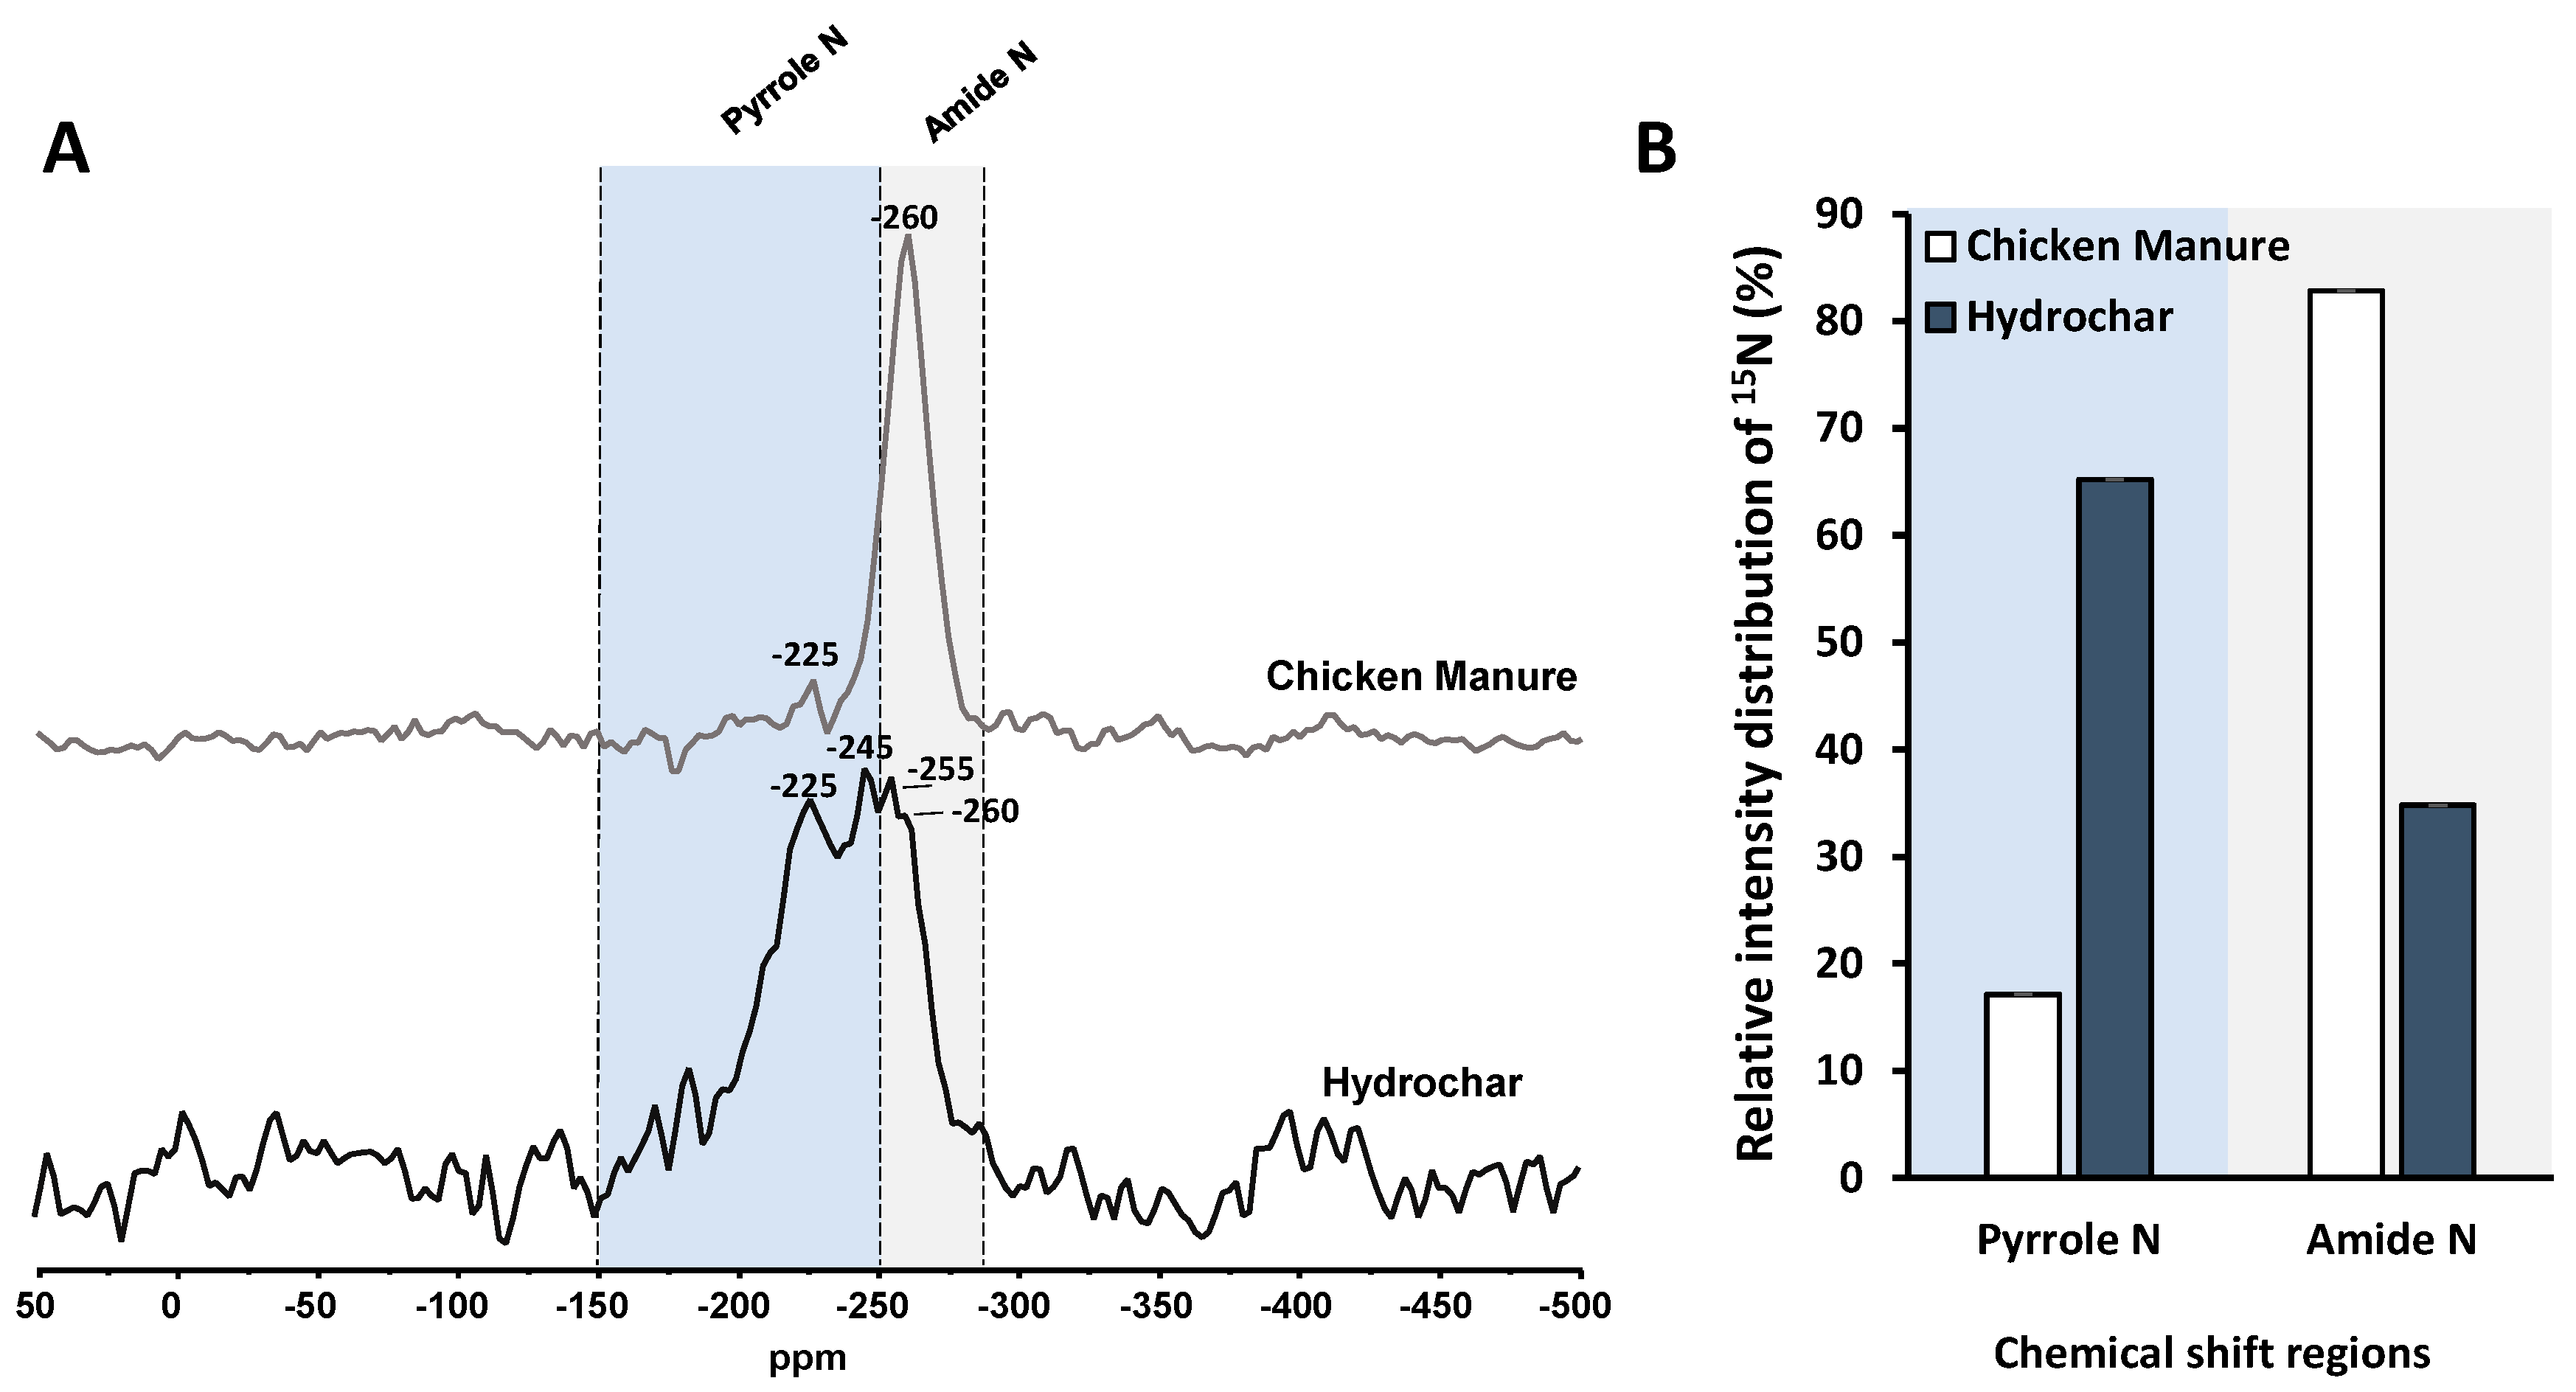
Figure 3.
(A-C) Height of the hypocotyls (cm) measured in the seedlings of lettuce (A), sunflower (B), and tomato (C), throughout the entire cultivation period (days after sowing, DAS); (D-F) Total height (cm) of the seedlings: lettuce (D), sunflower (E), and tomato (F) throughout the cultivation period. Values represent the mean ± standard error (SE). The hypocotyl height and total height of the seedlings were averaged per pot, reaching n = 10 by 7 DAS for lettuce and sunflower, and by 14 DAS for tomato. For total height at 15 and 20 DAS for lettuce and sunflower, and at 25 DAS for tomato, n = 10. Significant differences were calculated through one-way ANOVA test and according to Tukey’s test. Levels of significance: *P ≤ 0.05. **P ≤ 0.01. ***P ≤ 0.001.
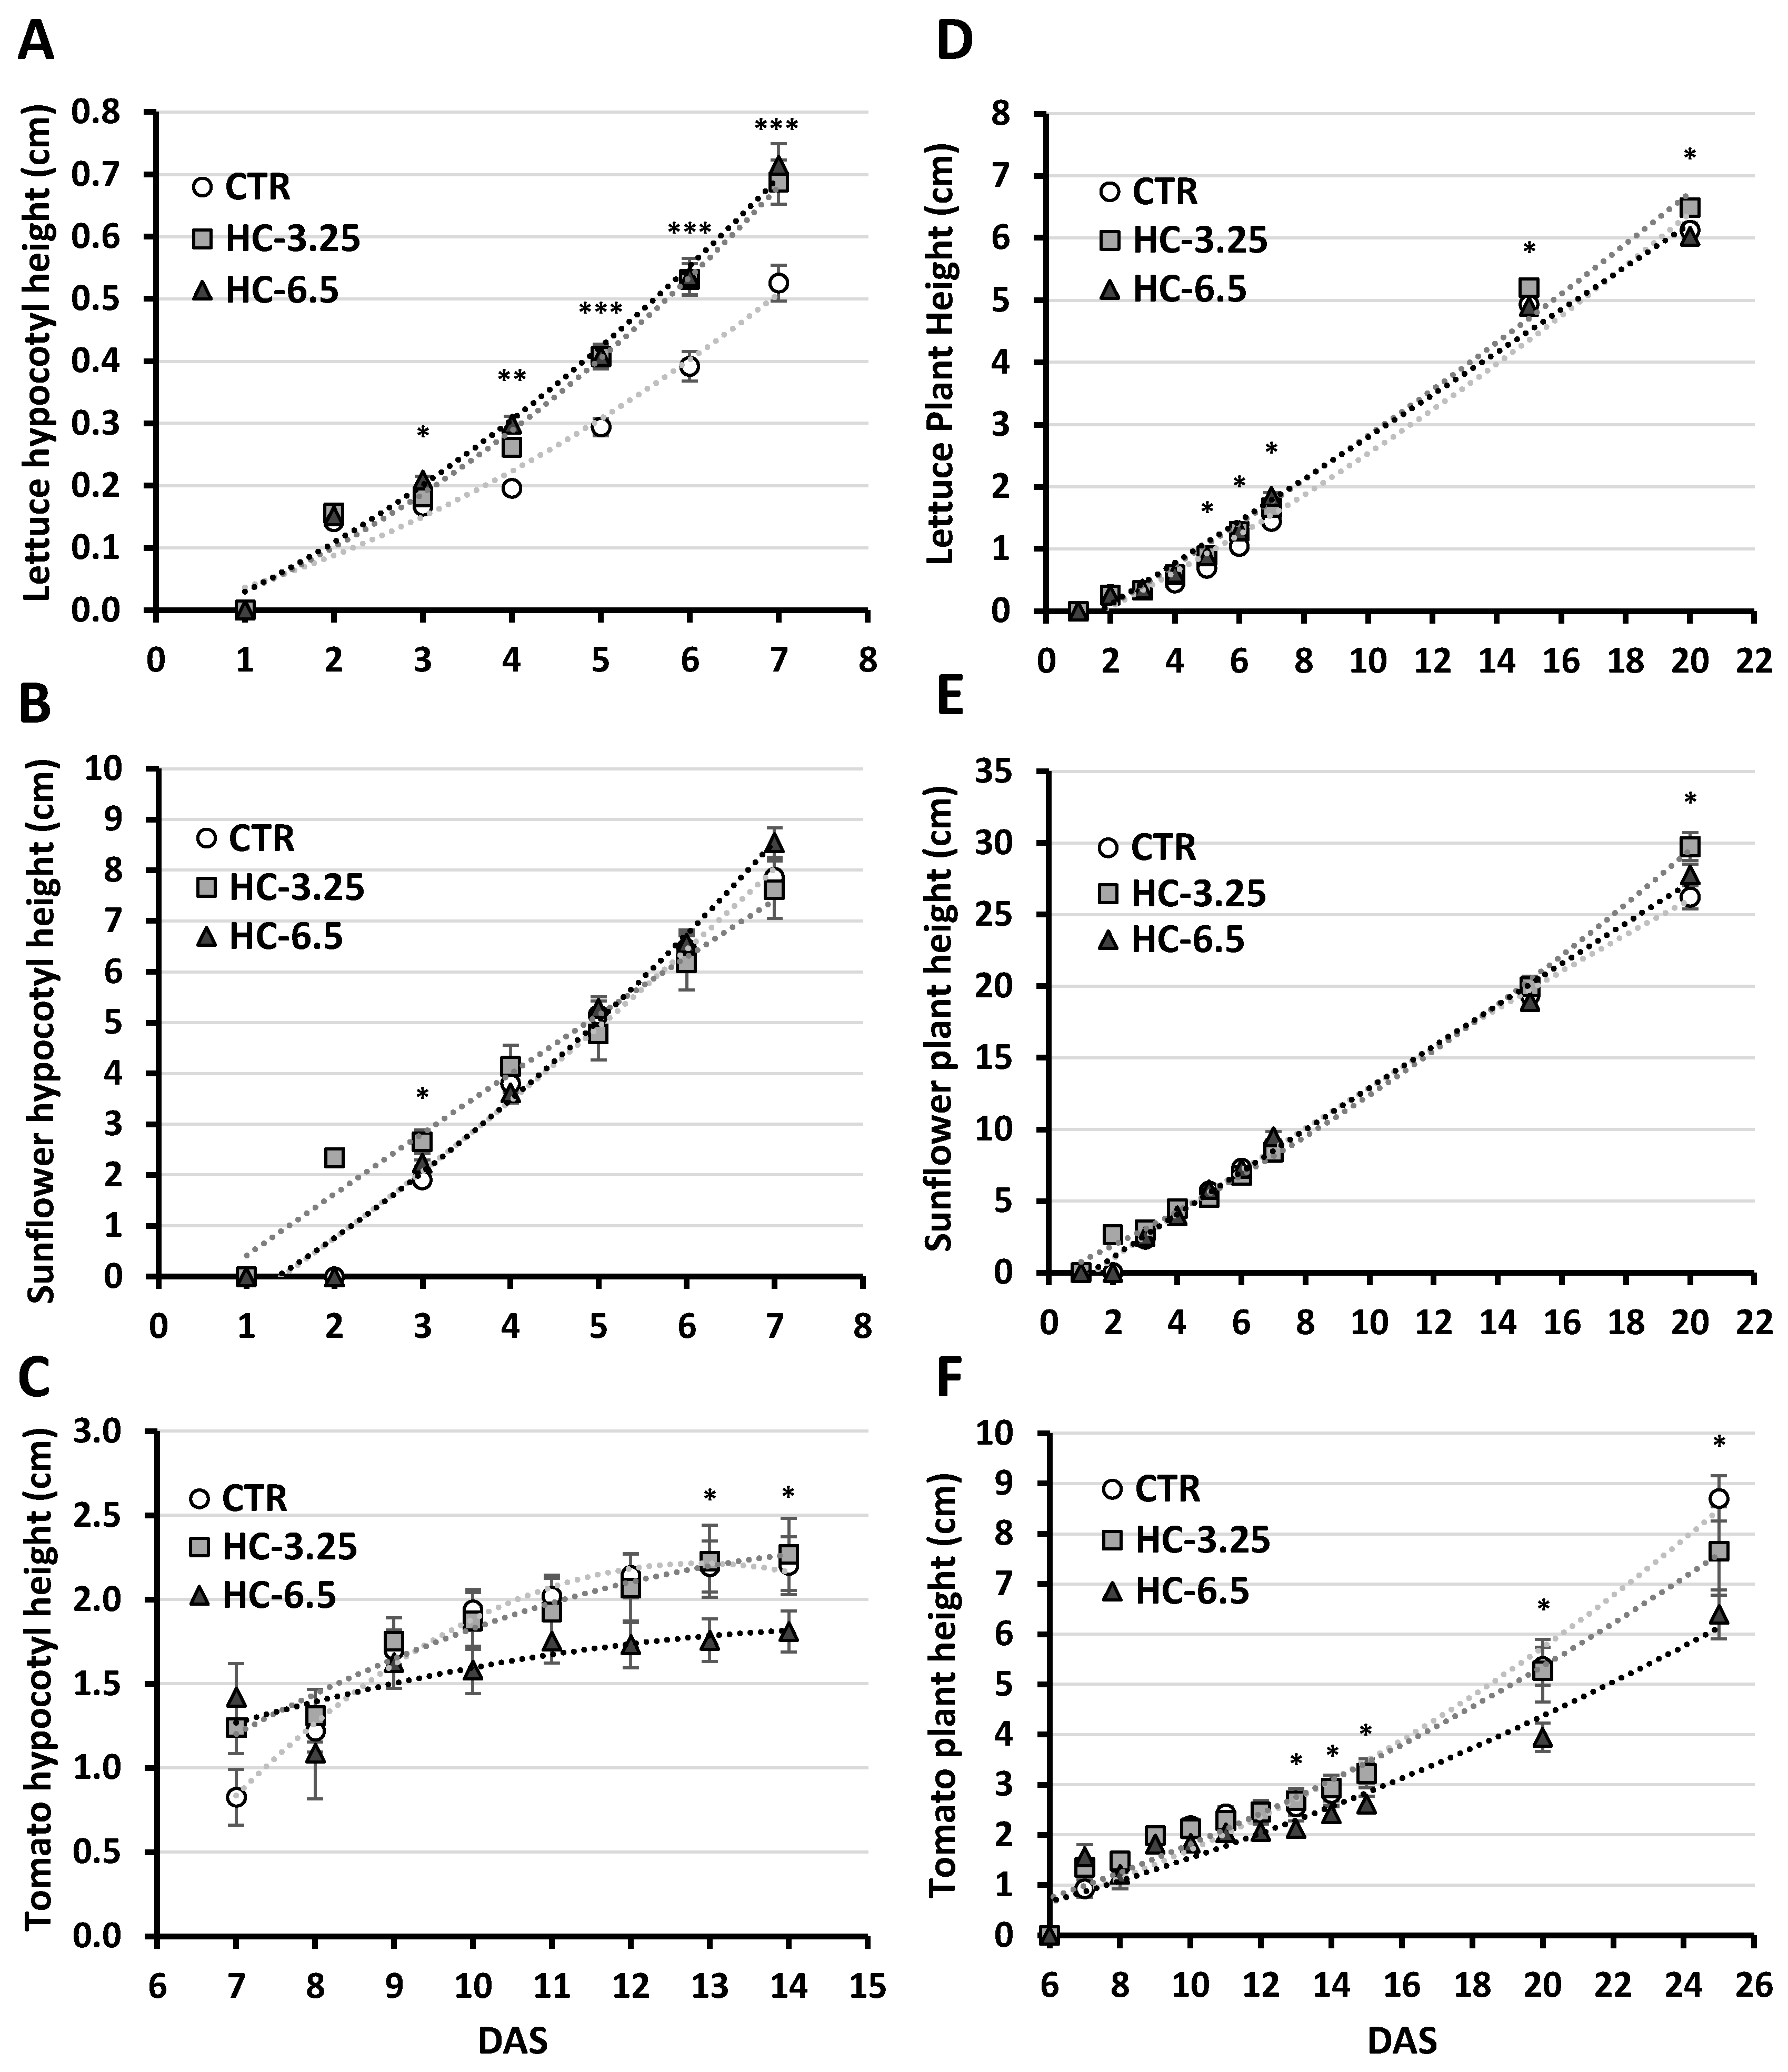
Figure 4.
(A-C) Shoot dry weight biomass (g) of lettuce (A), sunflower (B), and tomato (C), at 2 different harvest times (7 and 20 DAS for lettuce and sunflower; 14 and 25 DAS for tomato). (D-F) Average efficiency of Photosystem-II (Quantum Yield; Fm’ Fv’−1) of lettuce (D), sunflower (E), and tomato (F), throughout the cultivation period (7, 14, and 20 days for lettuce and sunflower; 14, 20, and 25 days for tomato). Values represent the mean ± standard error (SE). The shoot DW of the seedlings at 7 DAS for lettuce and sunflower, and at 14 DAS for tomato, was averaged per pot, reaching n = 10. At 20 DAS for lettuce and sunflower, and at 25 DAS for tomato, n = 10. The sample size for the quantum yield for all the sampled times and plant species is n = 10. “Homogeneous group” statistics was calculated through ANOVA test where mean values with different letters are significantly different according to Tukey’s test. Levels of significance: *P ≤ 0.05. **P ≤ 0.01. ***P ≤ 0.001.
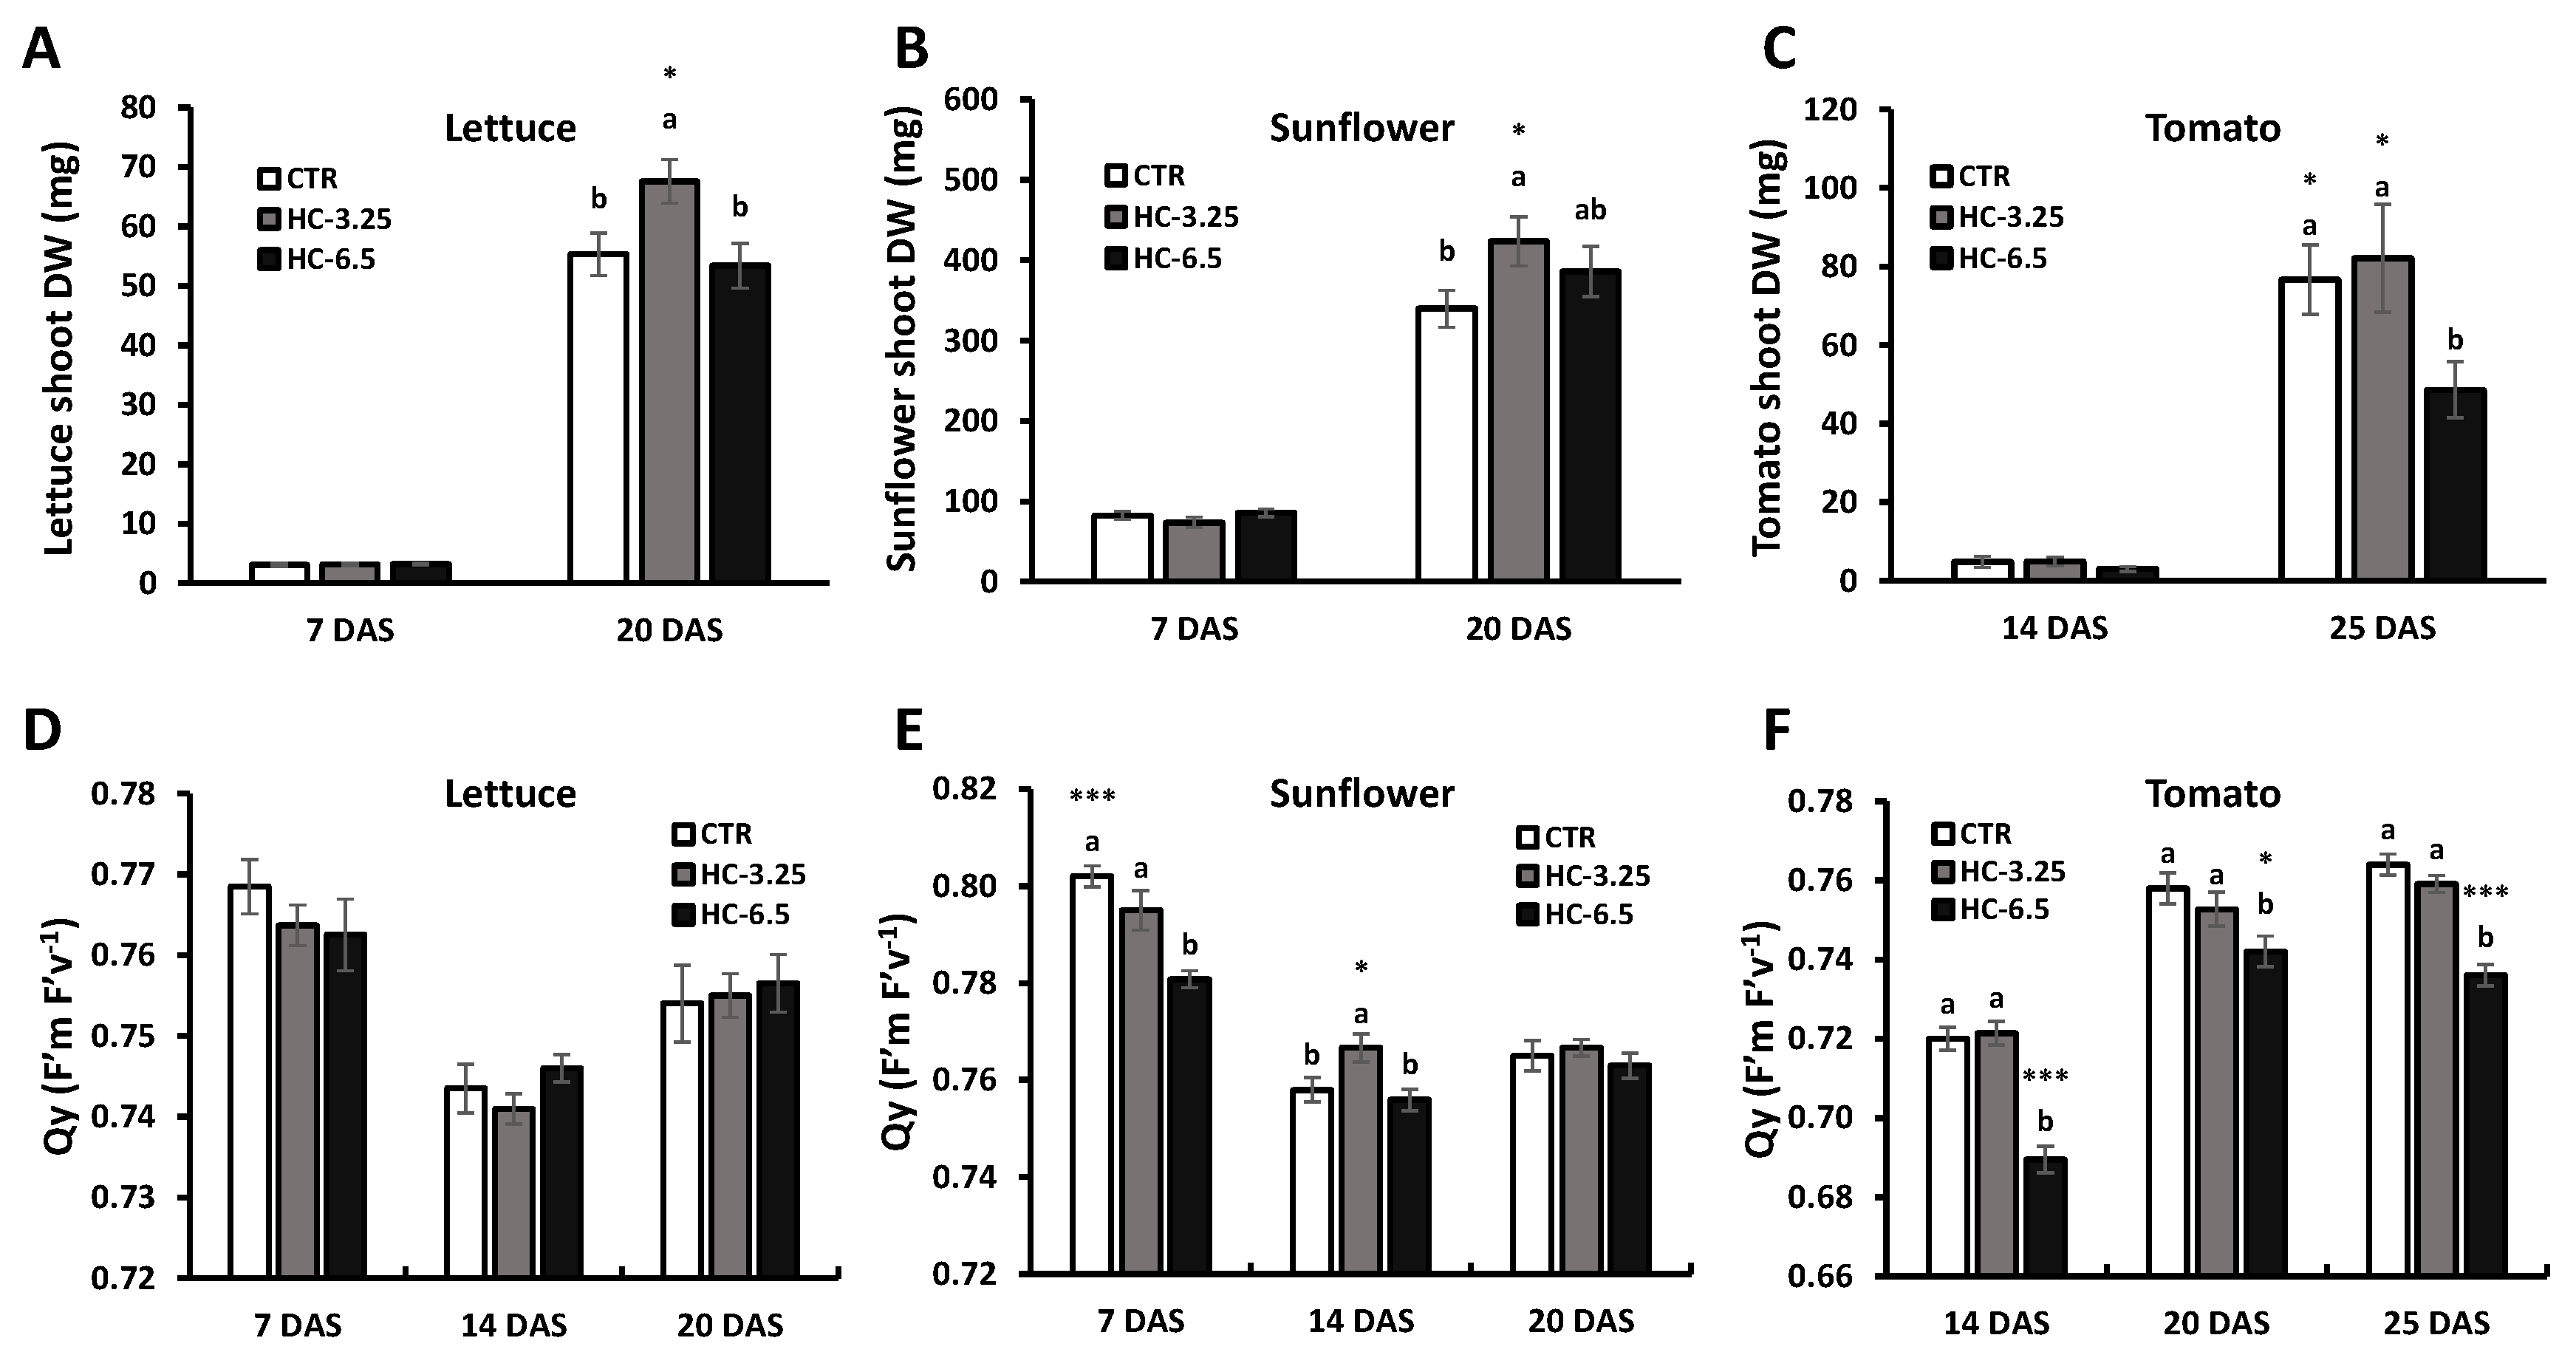

Table 1.
Mass yield after the HTC of chicken manure (CM), the ash content, the elemental composition (Corg, N, O, H) of the feedstock and its respective hydrochar, as well as the recovery of these elements after the HTC treatment at 250 °C for 0.5 h. Values represent the mean of three replicates (n = 3) ± standard error (SE). Values followed by different letters indicate significant differences according the statistical test used (T-Student or U Mann-Whitney). Levels of significance: P > 0.05 (“ns”, not significant differences); *P ≤ 0.05; **P ≤ 0.01; ***P ≤ 0.001.
| Elemental composition | ||||||||||
| Mass yield | Ash content | Corg | N | Oa | H | |||||
| % DMa | g kg-1 | (%) | (%) | (%) | (%) | |||||
| CM | - | 850 ± 9 | 7.70 ± 0.19 a | 2.35 ± 0.18 a | 3.52 ± 1.02 a | 1.04 ± 0.25 | ||||
| Hydrochar | 89.6 | 916 ± 2 | 5.86 ± 0.74 b | 0.47 ± 0.05 b | 1.38 ± 0.21 b | 0.61 ± 0.15 | ||||
| P-value | *** | *** | * | ns | ||||||
|
Recovery (% DM) |
96.0 | 68.3 ± 1.69 | 17.8 ± 1.97 | 49.9 ± 2.59 | 63.7 ± 2.52 | |||||
aDM: dry matter; bO content = 100 - Ash content + C + N + H + P + S.
Table 2.
Total organic carbon (Corg), Corg/N ratios and inorganic N (Ni) contents (NO3--N and NH4+-N) of chicken manure (CM) and its respective hydrochar, as well as the recovery rates after the HTC treatment at 250 °C for 0.5 h. Mean values ± SE. n=9. Values followed by different letters indicate significant differences according the statistical test used (T-Student or U Mann-Whitney). Levels of significance: P > 0.05 (“ns”, not significant differences); ***P ≤ 0.001.
| Corg/N | NO3--N | NH4+-N | Ni of the total N | ||||
| (w/w) | g kg-1 | g kg-1 | % | ||||
| CM | 3.36 ± 0.08 b | 0.38 ± 0.02 a | 0.17 ± 0.00 a | 2.34 ± 0.18 | |||
| Hydrochar | 13.0 ± 0.75 a | 0.08 ± 0.02 b | 0.05 ± 0.01 b | 2.78 ± 0.31 | |||
| P-value | *** | *** | *** | ns | |||
| Recovery (% DM) | - | 19.4 ± 3.90 | 23.5 ± 3.07 | 106 ± 15.5 | |||
Table 3.
Concentration of macronutrients (P, K, S, Ca and Mg) and extractable P, K and S of chicken manure and its respective hydrochar, as well as the recovery rates after the HTC treatment at 250 °C for 0.5 h. Mean values ± SE. n=3. Values followed by different letters indicate significant differences according the statistical test used (T-Student or U Mann-Whitney). Levels of significance: ***P ≤ 0.001.
| Element (g kg-1) | Chicken Manure | Hydrochar | P-value | Recovery (% DM) |
| P | 2.75 ± 0.10 a | 1.04 ± 0.02 b | *** | 34.0 ± 0.62 |
| Extr-P | 0.59 ± 0.01 a | 0.02 ± 0.00 b | *** | 2.55 ± 0.07 |
| K | 4.59 ± 0.18 a | 0.60 ± 0.02 b | *** | 11.7 ± 0.33 |
| Extr-K | 4.60 ± 0.12 a | 0.25 ± 0.01 b | *** | 4.95 ± 0.12 |
| S | 1.33 ± 0.05 a | 0.24 ± 0.01 b | *** | 16.1 ± 0.32 |
| Extr-S | 0.49 ± 0.01 a | 0.04 ± 0.00 b | *** | 7.28 ± 0.06 |
| Ca | 40.3 ± 1.31 a | 32.1 ± 1.09 b | *** | 71.5 ± 2.42 |
| Mg | 1.84 ± 0.04 a | 0.92 ± 0.02 b | *** | 44.8 ± 0.94 |
Table 4.
Concentration of micronutrients (Fe, Cu, B, Mn and Zn) of chicken manure and its respective hydrochar, as well as the recovery rates after the HTC treatment at 250 °C for 0.5 h. Mean values ± SE. n=3. Values followed by different letters indicate significant differences according the statistical test used (T-Student or U Mann-Whitney). Levels of significance: ***P ≤ 0.001.
| Element (mg kg-1) | Chicken Manure | Hydrochar | P-value | Recovery (% DM) |
| Fe | 6889 ± 263 a | 4206 ± 76.3 b | *** | 54.7 ± 0.99 |
| Cu | 66.0 ± 1.88 a | 31.5 ± 3.16 b | *** | 42.7 ± 4.28 |
| B | 10.0 ± 0.28 a | 2.35 ± 0.11 b | *** | 20.9 ± 0.99 |
| Mn | 137 ± 4.36 a | 60.7 ± 0.58 b | *** | 39.6 ± 0.38 |
| Zn | 184 ± 5.93 a | 72.9 ± 2.04 b | *** | 35.5 ± 1.01 |
Table 5.
Concentration of other metals (Na, Al, Ba, Li and Sr) and heavy metals (As, Cd, Co, Cr, Hg, Ni, Mo, Pb and V) of chicken manure and its respective hydrochar, as well as the recovery rates after the HTC treatment at 250 °C for 0.5 h. Mean values ± SE. n=3. Values followed by different letters indicate significant differences according the statistical test used (T-Student or U Mann-Whitney). Levels of significance: P > 0.05 (“ns”, not significant differences); **P ≤ 0.01; ***P ≤ 0.001.
| Element (mg kg-1) | Chicken Manure | Hydrochar | P-value | Recovery (% DM) |
| Na | 1208 ± 31.3 a | 231.4 ± 4.49 b | *** | 17.2 ± 0.33 |
| Al | 6031 ± 114 a | 3425 ± 42.9 b | *** | 50.9 ± 0.64 |
| Ba | 26.3 ± 0.78 a | 10.0 ± 0.17 b | *** | 34.1 ± 0.59 |
| Li | 4.95 ± 0.23 a | 2.82 ± 0.07 b | *** | 51.0 ± 1.19 |
| Sr | 26.3 ± 0.58 a | 15.1 ± 0.43 b | *** | 51.3 ± 1.47 |
| As | 3.42 ± 1.14 a | 1.11 ± 0.57 a | ns | 29.0 ± 14.9 |
| Cd | 0.14 ± 0.04 a | 0.20 ± 0.03 a | ns | 129 ± 19.4 |
| Co | 1.69 ± 0.13 a | 0.96 ± 0.06 b | ** | 50.8 ± 3.31 |
| Cr | 22.0 ± 0.76 a | 15.4 ± 0.26 b | *** | 62.6 ± 1.06 |
| Hg | 1.19 ± 0.29 a | 0.87 ± 0.27 a | ns | 65.4 ± 20.1 |
| Ni | 7.22 ± 0.32 a | 3.87 ± 0.07 b | *** | 48.0 ± 0.93 |
| Mo | 1.39 ± 0.05 a | 0.81 ± 0.09 b | ** | 51.8 ± 5.86 |
| Pb | 11.9 ± 0.60 a | 6.63 ± 0.38 b | ** | 50.0 ± 2.88 |
| V | 13.9 ± 0.49 a | 8.16 ± 0.18 b | *** | 52.7 ± 1.14 |
Table 6.
Germination parameters of lettuce, sunflower and tomato seeds between treatments. Germination (G), Mean Germination Time (MGT), Mean Germination Rate (MGR), Time to 50% germination (T50), Synchronization index (Z), Uncertainty of germination process (U) and Vigour Index (VI). Values represent the mean of five replicates (n = 5) ± standard error (SE). Four seeds per pot were sown, resulting in 20 seeds per treatment. Values followed by different letters in columns indicate significant differences according to Tukey’s test. Levels of significance: P > 0.05 (“ns”, not significant differences); *P ≤ 0.05. “Homogeneous group” statistics was calculated through one-way ANOVA test.
| Treatments | G (%) | MGT (days) | MGR (day-1) | T50 (days) | Z (unit less) | U (bit) | VI | |
| Lettuce | CTR | 87.5 ± 3.95 | 2.81 ± 0.15 | 0.36 ± 0.02 | 2.07 ± 0.17 | 0.42 ± 0.09 | 1.21 ± 0.21 | 46.1 ± 2.44 b |
| HC-3.25 | 85.0 ± 2.50 | 2.66 ± 0.21 | 0.39 ± 0.03 | 1.70 ± 0.06 | 0.56 ± 0.11 | 0.91 ± 0.24 | 58.4 ± 2.58 a | |
| HC-6.5 | 85.0 ± 2.50 | 2.72 ± 0.19 | 0.37 ± 0.03 | 1.98 ± 0.16 | 0.43 ± 0.04 | 1.14 ± 0.11 | 60.8 ± 4.00 a | |
| P-value | ns | ns | ns | ns | ns | ns | * | |
| Sunflower | CTR | 77.5 ± 2.50 | 3.57 ± 0.17 b | 0.28 ± 0.01 a | 3.02 ± 0.18 b | 0.51 ± 0.13 a | 1.21 ± 0.10 b | 609 ± 27.6 ab |
| HC-3.25 | 69.3 ± 6.27 | 4.51 ± 0.24 a | 0.22 ± 0.01 b | 3.97 ± 0.30 a | 0.12 ± 0.05 b | 1.93 ± 0.15 a | 540 ± 44.9 b | |
| HC-6.5 | 77.5 ± 4.68 | 3.84 ± 0.19 b | 0.26 ± 0.01 ab | 2.83 ± 0.11 b | 0.43 ± 0.08 a | 1.14 ± 0.17 b | 671 ± 25.5 a | |
| P-value | ns | * | * | * | * | * | * | |
| Tomato | CTR | 83.3 ± 0.00 a | 9.52 ± 0.56 | 0.11 ± 0.01 | 8.50 ± 0.89 | 0.26 ± 0.07 a | 1.48 ± 0.22 | 185 ± 14.8 a |
| HC-3.25 | 86.7 ± 6.24 a | 9.64 ± 0.89 | 0.11 ± 0.01 | 8.98 ± 1.22 | 0.33 ± 0.09 a | 1.35 ± 0.26 | 187 ± 15.8 a | |
| HC-6.5 | 70.0 ± 3.33 b | 10.4 ± 0.52 | 0.10 ± 0.00 | 9.90 ± 0.58 | 0.03 ± 0.03 b | 1.96 ± 0.13 | 116 ± 8.80 b | |
| P-value | * | ns | ns | ns | * | ns | * | |
Disclaimer/Publisher’s Note: The statements, opinions and data contained in all publications are solely those of the individual author(s) and contributor(s) and not of MDPI and/or the editor(s). MDPI and/or the editor(s) disclaim responsibility for any injury to people or property resulting from any ideas, methods, instructions or products referred to in the content. |
© 2025 by the authors. Licensee MDPI, Basel, Switzerland. This article is an open access article distributed under the terms and conditions of the Creative Commons Attribution (CC BY) license (http://creativecommons.org/licenses/by/4.0/).
Copyright: This open access article is published under a Creative Commons CC BY 4.0 license, which permit the free download, distribution, and reuse, provided that the author and preprint are cited in any reuse.


