Submitted:
09 October 2025
Posted:
10 October 2025
You are already at the latest version
Abstract
Indoor localization finds wide-ranging applications in user navigation and intelligent building systems. Nevertheless, signal interference within complex indoor environments and challenges regarding localization generalization in multi - building and multi - floor scenarios have restricted the performance of traditional positioning methods based on WiFi fingerprinting. To tackle these issues, this paper presents the SE - MTCAELoc model, a multi - task convolutional autoencoder approach that integrates a squeeze - excitation (SE) attention mechanism for indoor positioning. Firstly, the method pre - processes WiFi Received Signal Strength (RSSI) data. In the UJIIndoorLoc dataset, the 520 - dimensional RSSI features are extended to 576 dimensions and reshaped into a 24×24 matrix. Meanwhile, Gaussian noise is introduced to enhance the robustness of the data. Subsequently, an integrated SE module combined with a convolutional autoencoder (CAE) is constructed. This module aggregates channel spatial information through squeezing operations and learns channel weights via excitation operations. It dynamically enhances key positioning features and suppresses noise. Finally, a multi - task learning architecture based on the SE - CAE encoder is established to jointly optimize building classification, floor classification, and coordinate regression tasks. Priority balancing is achieved using weighted losses (0.1 for building classification, 0.2 for floor classification, and 0.7 for coordinate regression). Experimental results on the UJIIndoorLoc dataset indicate that the accuracy of building classification reaches 99.57%, the accuracy of floor classification is 98.57%, and the mean absolute error (MAE) for coordinate regression is 5.23 meters. On the TUT2018 dataset, the floor classification accuracy attains 98.13%, with an MAE of 6.16 meters. These results suggest that the SE - MTCAELoc model can effectively enhance the localization accuracy and generalization ability in complex indoor scenarios and meet the localization requirements of multiple scenarios.
Keywords:
indoor localization
; WiFi fingerprint
; convolutional autoencoder
; SE attention mechanism
; multi-task learning
; RSSI
1. Introduction
Scholars have long delved into the concept of precise localization. The discovery of radio waves in the late 19th century established the groundwork for radio - based navigation and localization systems [1]. Location determination can be categorized into three types: outdoor localization, indoor localization, and seamless indoor - outdoor localization [2]. Among these, indoor localization faces particular challenges due to the presence of indoor obstacles and complex environments, especially when dealing with multi - building and multi - floor indoor scenarios.
Indoor localization finds wide applications in user and robot localization and navigation, manufacturing facilities, large warehouses, smart homes, intelligent factories and buildings, healthcare, intelligent greenhouses, and related domains [2,2]. In 2020, the global market value of indoor positioning and navigation reached 6.1 billion US dollars, and it is predicted to reach 17 billion US dollars by 2025 [2]. Among diverse indoor positioning technologies, WiFi technology has consistently been the preferred option owing to its ease of deployment and cost - effectiveness.
Fingerprint-based localization technology is capable of leveraging a diverse array of physical layer features, such as electrical signals, magnetic fields, acoustic signals, and visible light intensity, contingent upon the sensing approach and application context [2]. WiFi-based fingerprint positioning typically employs either RSSI or Channel State Information (CSI) to acquire location information. RSSI signals are straightforward to measure and are more extensively utilized. Nevertheless, considering the vulnerability of WiFi RSSI signals to environmental interference and their limited generalization across multiple scenarios, the advent of machine learning and deep learning has provided novel research directions for WiFi indoor positioning [2].
WiFi-based indoor localization deep learning models typically involve two phases: offline training and online prediction. In addition to offline learning, deep learning can also be used for feature extraction. In multi-building and multi-floor environments, the primary objectives of prediction are to classify buildings and floors, as well as perform location regression [2].
Limitations in Feature Extraction of Traditional Autoencoders (AE/SAE): In 2017, the stacked autoencoder (SAE) proposed by Nowicki et al. attained a 92% accuracy rate in building/floor classification. Nevertheless, its one - dimensional feature input was unable to capture the spatial correlation information from RSSI, and it overlooked the influence of environmental noise on feature quality, thereby resulting in suboptimal generalization performance in multi - floor complex scenarios [9]. In 2018, the extended SAE model developed by Kim et al., although capable of supporting location regression, lacked an architecture designed for the "coordinated optimization of classification and regression tasks," which led to performance conflicts between the two tasks (wherein higher classification accuracy was associated with increased regression errors) [10].
Deficiencies in Feature Weight Allocation of Convolutional Neural Network (CNN/CAE): In 2019, Zhao et al. were the first to utilize CAE, and in 2021, Qin et al. introduced the CDAE - CNN model. Although these models enhanced spatial feature extraction through two - dimensional transformations, their "equalized channel weighting" mechanism was incapable of dynamically according priority to crucial signal channels (e.g., strong RSSI signals from specific access points (APs)) or mitigating environmental interference (e.g., weak noise caused by wall obstructions). This shortcoming resulted in the classification accuracy remaining below 99% in multi - building scenarios [11,12]. In 2024, the CNN - CAE model proposed by Kargar - Barzi et al. streamlined the localization process; however, it converted regression tasks into classification tasks, sacrificing fine - grained coordinate precision and failing to meet the real - world requirements for continuous positioning [13].
The absence or imbalance of multi-task learning architectures: Most existing models (e.g., WiFiNet [14]) focus solely on single tasks (classification or regression). Few multi-task models (e.g., HADNN [2]) lack reasonable loss weight allocation strategies, resulting in excessively high errors for core localization tasks (coordinate regression) (average absolute error MAE generally>9 meters). This imbalance fails to balance the dual requirements of "building/floor classification accuracy" and "coordinate regression precision" .
To address the aforementioned three types of shortcomings, this paper proposes a multi - task convolutional autoencoder model that incorporates compression and excitation (SE) attention mechanisms. The specific solutions are as follows:
(1)The one - dimensional RSSI signal is transformed into a 24×24 two - dimensional matrix and fed into the CAE. By leveraging local receptive fields within the convolutional layers to uncover spatial correlation information, and introducing Gaussian noise enhancement (with a mean of 0 and a standard deviation of 5) during data pre - processing, the model’s noise resistance is improved. This mitigates the limitation of traditional AE models that solely rely on one - dimensional features.
(2)An SE attention mechanism module is introduced, which dynamically learns feature channel weights through a "squeeze - and - excite" operation (e.g., assigning high weights to AP signal channels with strong localization associations and low weights to noise channels). Experimental results suggest that this module reduces the Mean Squared Error (MSE) of the CAE pre - trained model by 26.2% and the MAE by 14.2% on validation sets, effectively enhancing key features and suppressing interference.
(3)A three - task integrated architecture is constructed, combining building classification, floor classification, and coordinate regression. A weighted loss strategy is adopted (with weights of 0.1 for building classification, 0.2 for floor classification, and 0.7 for coordinate regression). By exploiting scene constraints from classification tasks (such as the signal distribution features of "a specific building’s floor"), the accuracy of the regression task is optimized. On the UJIIndoorLoc dataset, this approach achieves a building classification accuracy of 99.57% and a floor classification accuracy of 98.57%, while reducing the MAE of coordinate regression to 5.23 meters, attaining balanced multi - task performance.
The subsequent sections of this paper are organized as follows: In Section 2, a systematic review of relevant research findings in the field of indoor positioning technology will be conducted, with an emphasis on analyzing the current research progress and technical challenges. Section 3 provides a comprehensive elaboration of the methodological framework proposed by our research group. Section 4 explores the core components of the model and their optimization strategies through experimental studies. Finally, Section 5 concludes the entire paper.
2. Related Work
An autoencoder, a type of neural network, is predominantly utilized for feature extraction, dimensionality reduction, and data compression [15]. This technology was initially applied in indoor positioning by Nowicki et al. in 2017 [9]. On the UJIIndoorLoc dataset, researchers adopted a stacked autoencoder (SAE) architecture with a (256 - 128 - 64) structure, combined with a classification framework, attaining an accuracy of 92% in building/floor classification. Subsequently, in 2018, Kim et al. extended the SAE technology to multi - building and multi - floor indoor positioning tasks, effectively realizing the dual functions of building/floor classification and position regression [10].
When employing CNNs for indoor localization, it is generally requisite to transform one-dimensional RSSI values into two-dimensional data [16,17]. A 13 - layer convolutional network, namely WiFiNet [14], was developed. This network first transforms the RSSI values of WiFi APs into images before inputting them into the CNN network. In 2024, Arslantas et al. proposed a model architecture that performs joint training of an autoencoder and a CNN to address issues such as sparse Wi - Fi fingerprint data and difficulties in feature extraction [18]. This model utilizes an autoencoder to optimize Wi - Fi fingerprints before inputting them into a CNN for classification and regression, thus achieving the dual objectives of floor classification and coordinate localization.
CAEs integrate the unsupervised learning characteristics of Autoencoders (AEs) with the spatial learning capabilities of CNNs [19]. In 2019, Zhao et al. first applied CAEs in the field of indoor positioning [11], and designed a three - layer CAE architecture. Subsequently, in 2021, Qin et al. proposed CCpos, a WiFi fingerprint indoor positioning system [12], which combines Convolutional Denoising Autoencoders (CDAE) with CNNs. The system first purifies the Received Signal Strength Indicator (RSSI) signals via CDAE to extract robust features, and then uses CNNs to determine the positioning results. By 2024, Kargar - Barzi et al. put forward a simplified indoor positioning method that combines CNNs with convolutional autoencoders [13]. This method adopts a regional grid strategy to transform regression - based positioning into classification tasks, thus achieving improved classification accuracy.
In recent years, attention mechanisms have been widely employed in the field of indoor localization. By dynamically focusing on key features and suppressing redundant information, this mechanism effectively addresses issues such as signal noise and multi - modal heterogeneity present in complex indoor environments, thereby significantly improving positioning accuracy and robustness. In the research on RSSI fingerprint positioning for LoRaWAN networks [22], researchers enhanced CNN models using Squeeze - Excitation (SE) blocks (a variant of channel attention). Through the “squeeze - excite” process, the model strengthens the gateway RSSI channel features that contribute more to positioning. In the research on indoor scene recognition - assisted positioning [20], the model integrated single self - attention with multi - head attention. Single self - attention was used to extract visual local discriminative features (e.g., objects within scenes), while multi - head attention was utilized to fuse global scene features. In the research on WiFi fingerprint positioning [23], the MSNN - Loc model introduced channel attention and multi - head self - attention. Channel attention was employed to filter invalid Access Point (AP) signals and amplify stable AP features, and multi - head self - attention was applied to capture the global spatial correlations of AP signals. In the research on WiFi and Inertial Measurement Unit (IMU) fusion positioning [29], the DbDIO model adopted temporal attention (TA) and branch attention. Temporal attention focused on effective IMU motion time segments (e.g., gait peaks), and branch attention was used to fuse multi - scale motion features.
This paper converts Wi-Fi RSSI into two - dimensional data, which is subsequently directly inputted into a CAE. The CAE integrates the SE attention mechanism. Through the utilization of a multi-task framework, this study concurrently achieves the classification of buildings and floors, as well as coordinate regression, especially in the context of architectural environments.
A comparative analysis of relevant literature is presented in Table 1.
3. Proposed Method
This paper puts forward an indoor localization model which employs a two-dimensional CAE integrated with attention mechanisms for CNN-based triple-task learning. Through the conversion of Wi-Fi signal features into two-dimensional image data, the model attains accurate positioning across multiple buildings and floors. Figure 1 depicts the framework of this multi-task structural localization model, and detailed explications of its components are presented below.
3.1. Network Structure
The SE-MTCAELoc network is a multi-task indoor positioning algorithm that relies on RSSI signals. Its core procedure is "data preprocessing → pre-training of the SE convolutional autoencoder → fine-tuning of the multi-task model," as depicted in Figure 1. Initially, the original 520-dimensional RSSI signals are subjected to Gaussian noise enhancement, 24×24 matrix padding, and label encoding/normalization operations. Subsequently, the SE convolutional autoencoder is trained (the encoder compresses features into a 6×6×64 bottleneck feature via three layers of convolution, with each layer integrating an SE module for dynamic channel weighting, and the decoder symmetrically reconstructs the input, accomplishing unsupervised pre-training with MSE loss). Subsequently, a multi-task model is built based on the pre-trained encoder.
The multi-task head of the SE-MTCAELoc network constructed based on the bottleneck feature output by the shared encoder, designing differentiated branches for three types of tasks: the building classification head compresses features into a 64-dimensional vector through global average pooling, processed by a fully connected layer of 64 neurons (with ReLU activation and regularization) and dropout (), and outputs the probability distribution of three building categories through a 3-neuron Softmax layer; the floor classification head utilizes the same pooling and fully connected structure, completing five-floor classification through a 5-neuron Softmax layer; the coordinate regression head retains spatial features, first enhanced by 128 and 64 convolution kernels (all with ReLU activation and regularization), then flattened and processed by a fully connected layer of 256 neurons (with ReLU, batch normalization), and dropout (), followed by a fully connected layer of 128 neurons with ReLU and dropout (), and finally outputs normalized coordinates through a 2-neuron linear layer. The three task heads are jointly optimized through weighted loss (building , floor , coordinates ), achieving task-specific learning on shared features, balancing the differences between classification and regression characteristics to enhance overall positioning performance. The SE module significantly improves the accuracy of fine-grained positioning tasks by enhancing key signal channel features.
3.2. SE-CAE
As illustrated in Figure 3, the SE-CAE belongs to a category of CAE that integrates the SE attention mechanism. Its input is an RSSI signal matrix with dimensions of . The encoder compresses the features into a bottleneck feature of size through three layers of convolution operations (utilizing , , and convolution kernels, all equipped with regularization (), Batch Normalization, ReLU activation, and Dropout ()), in combination with MaxPooling2D. After each convolution layer, an SE module is inserted (spatial information is compressed by means of Global Average Pooling 2D, channel weights are learned via a fully-connected layer with a reduction factor of 16, and the weights are output through the sigmoid function and multiplied by the input features). The decoder symmetrically reconstructs the bottleneck features into an output of through convolutional layers and transposed convolutional layers (employing and transposed convolution kernels, with a stride of 2), also inserting SE modules. Ultimately, the reconstruction of the input signal is achieved by minimizing the Mean Squared Error (MSE) loss. This method preserves the spatial feature extraction ability of the convolutional autoencoder while dynamically enhancing key channel features through the SE module, thereby enhancing the robustness against noisy signals.
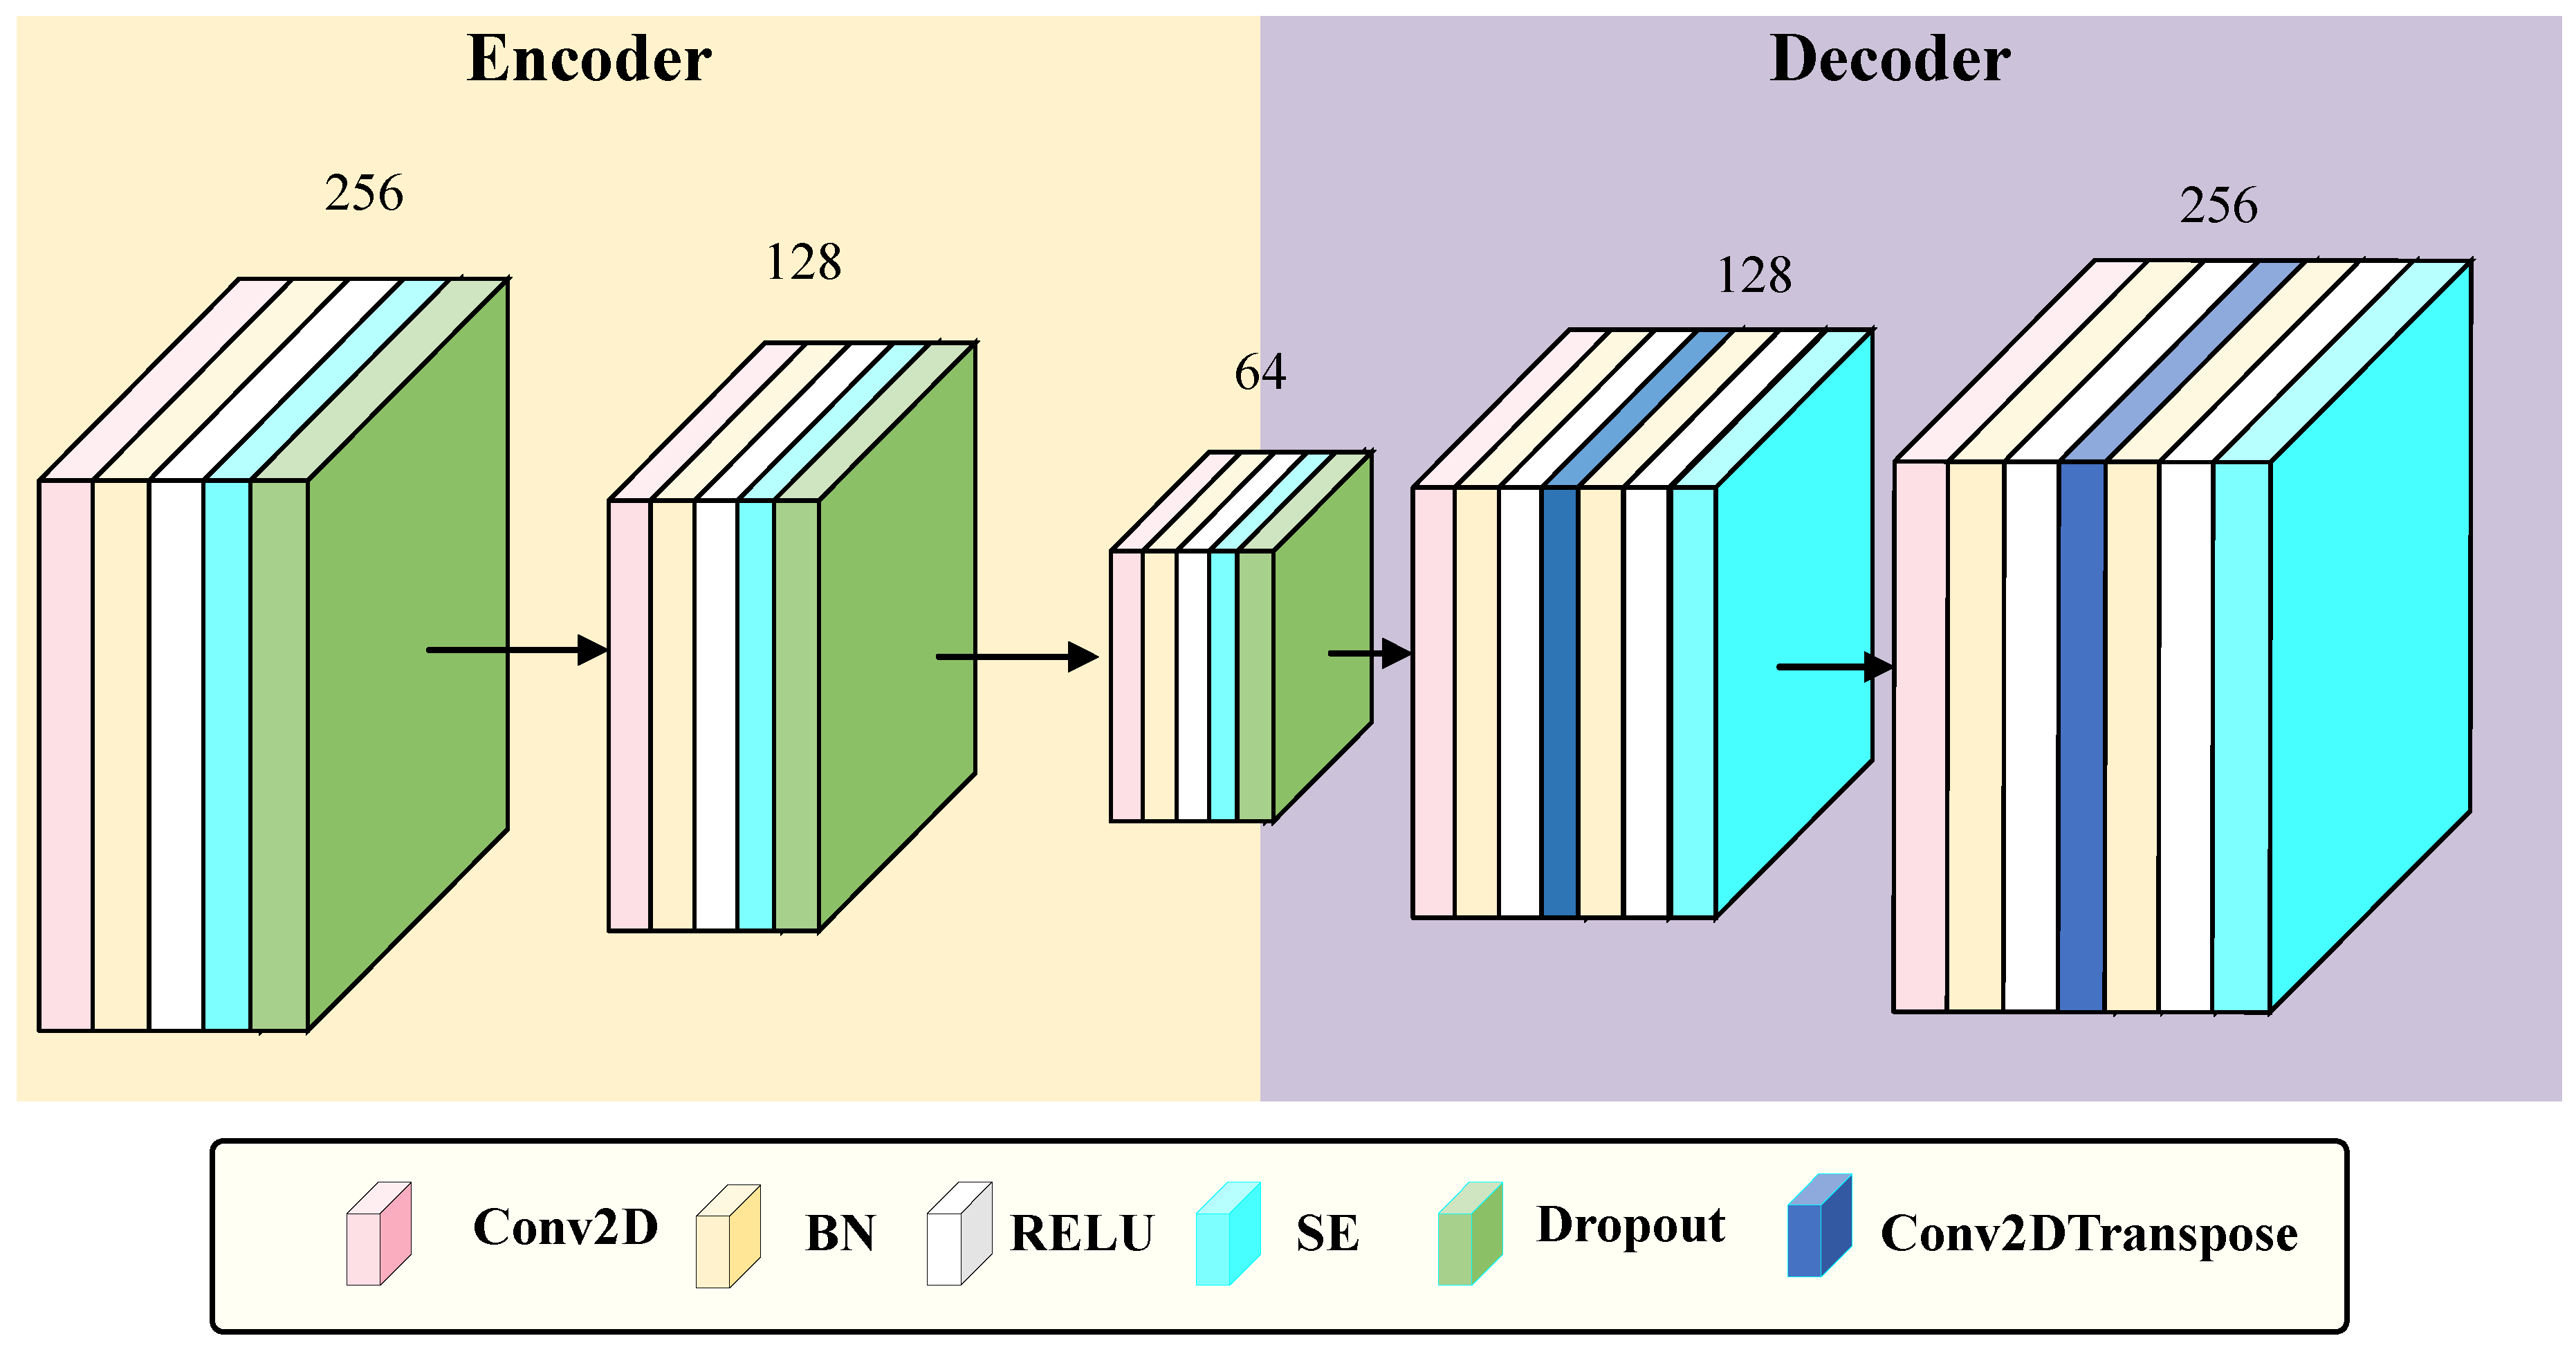
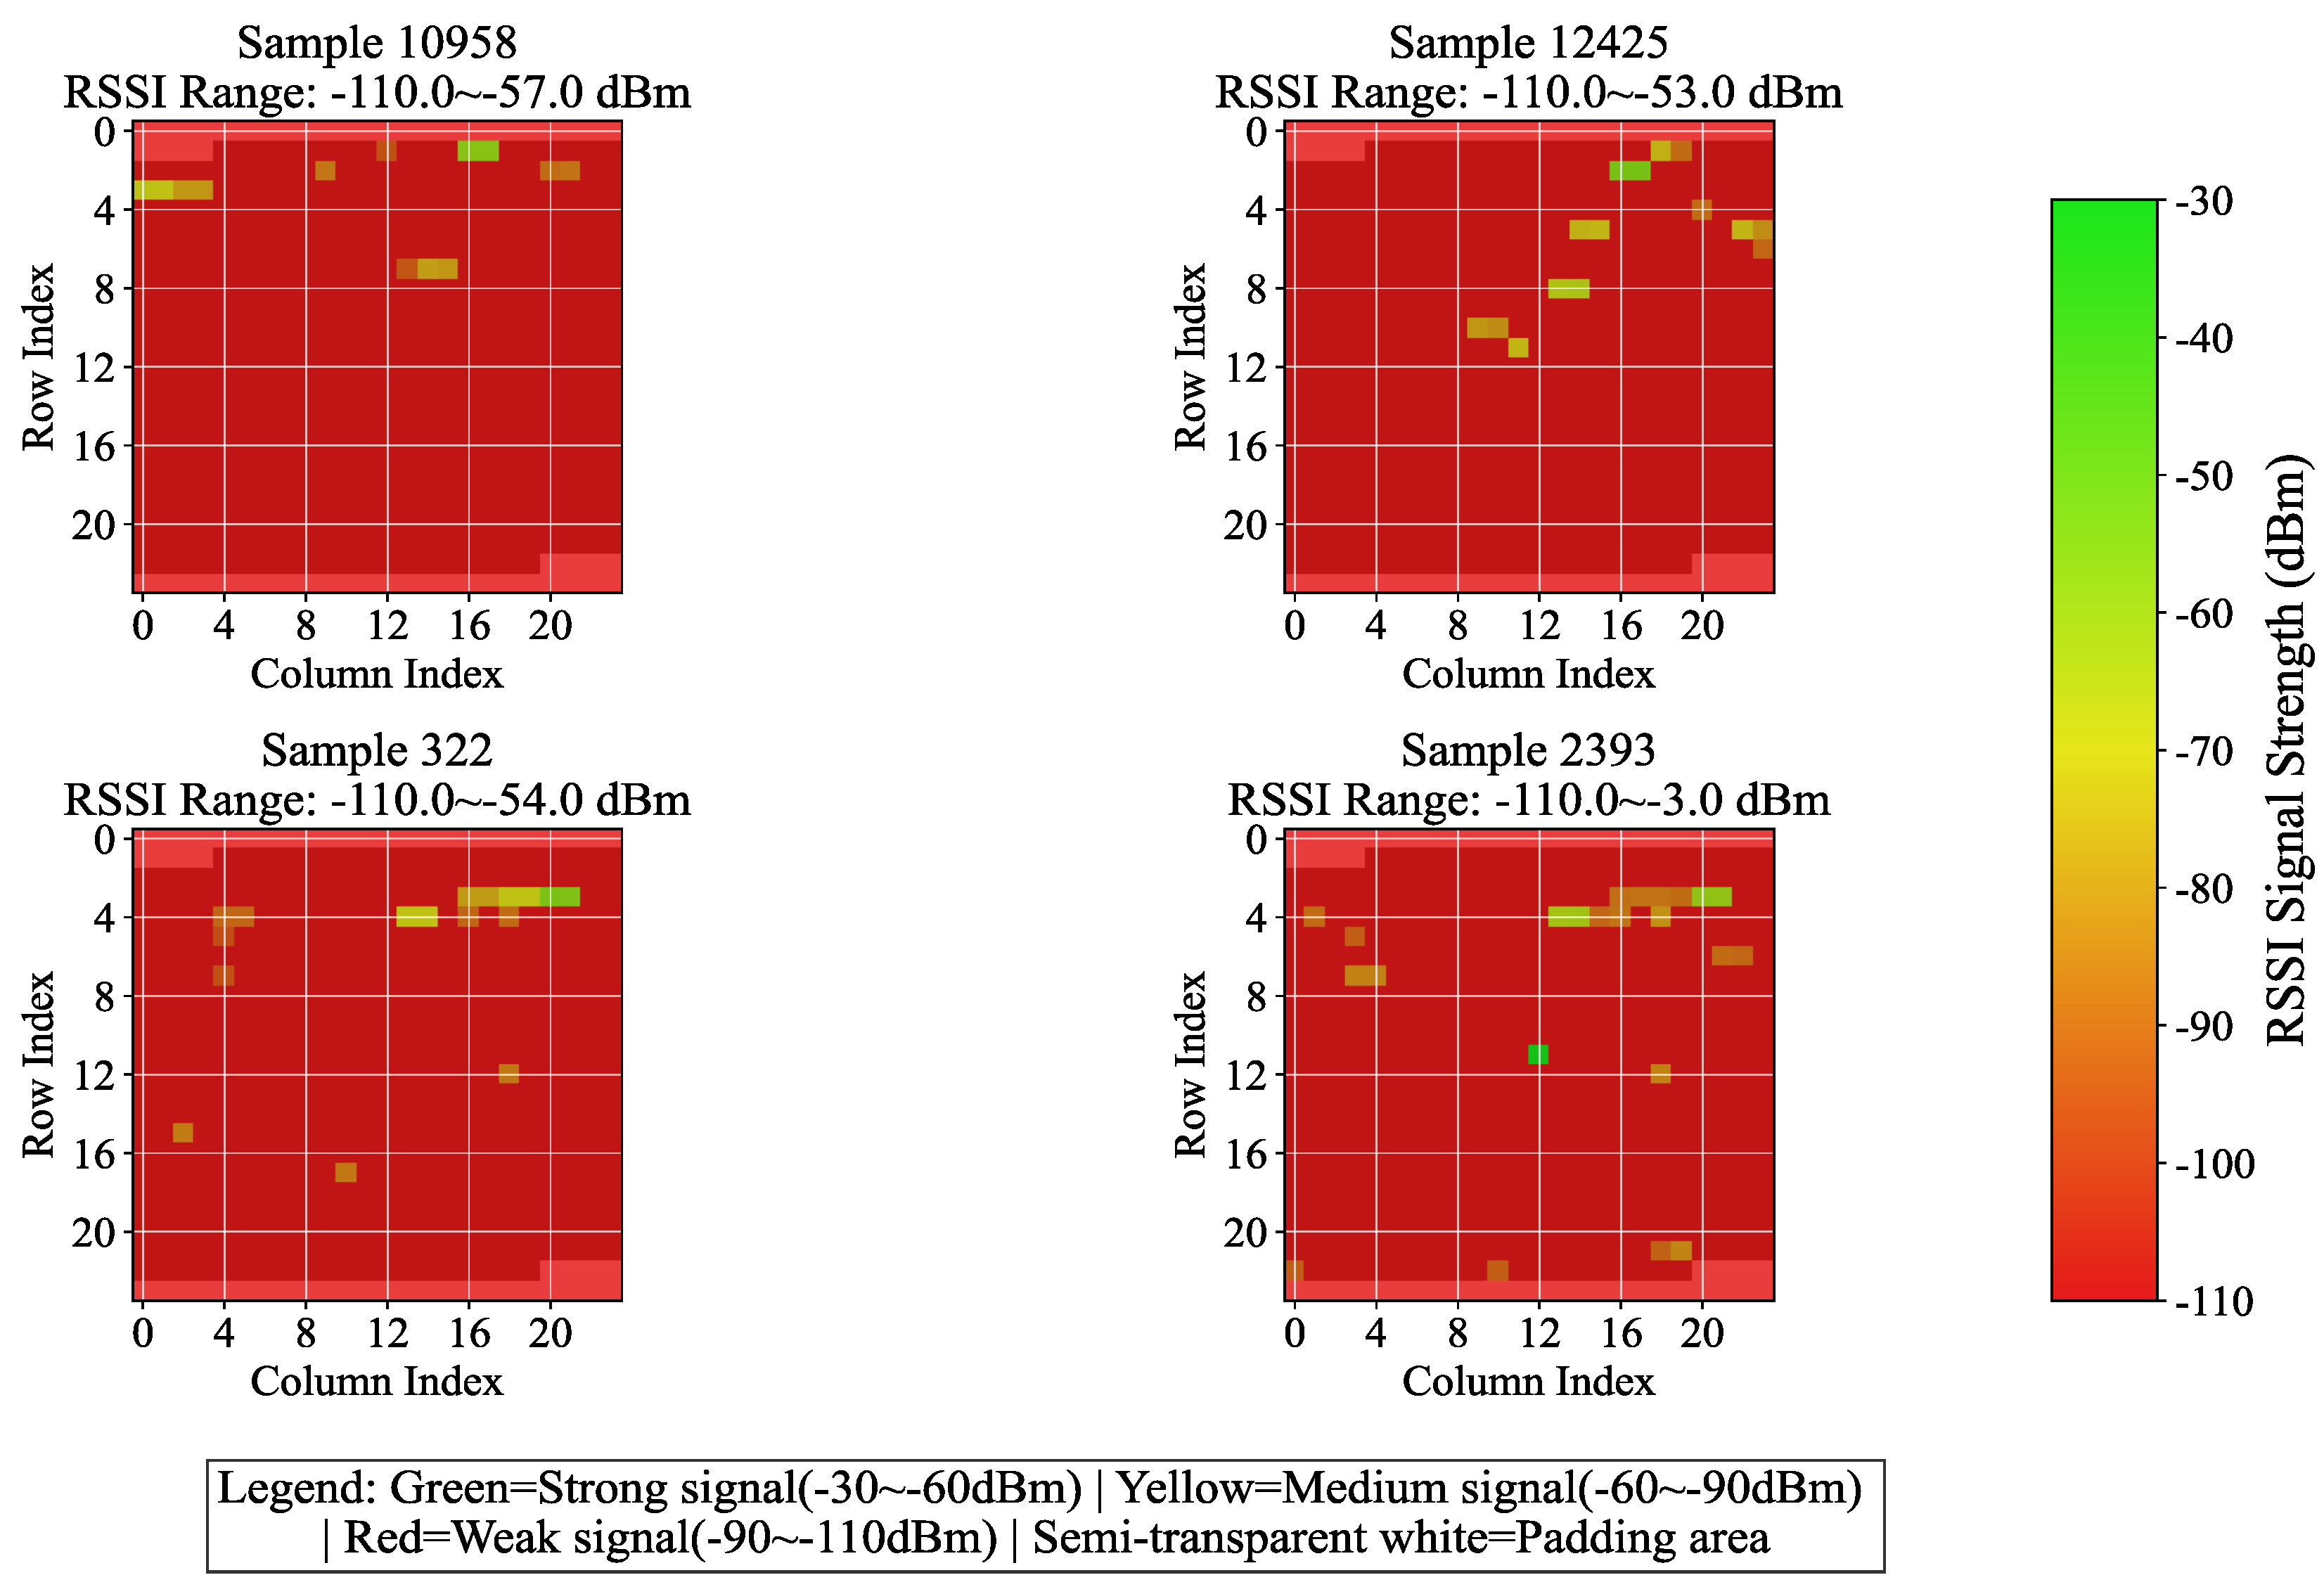
Figure 2.
The architectural configuration of the Squeeze-and-Excitation Convolutional Autoencoder (SE-CAE)
Figure 2.
The architectural configuration of the Squeeze-and-Excitation Convolutional Autoencoder (SE-CAE)
Figure 3.
One-dimensional RSSI variation converted into two-dimensional image data (four randomly selected samples)
Figure 3.
One-dimensional RSSI variation converted into two-dimensional image data (four randomly selected samples)
3.3. SE Attention Mechanism Module
In the proposed network, the attention mechanism employs the SE module [28]. The core function of this module is to enhance significant features and suppress redundant information by learning the importance weights of feature channels. The workflow can be divided into three steps, as shown in Algorithm 1.
Firstly, global average pooling compresses the input feature maps (e.g., 24×24×256) via the squeezing operation. This process aggregates the spatial information of each channel into a single value, thus forming one - dimensional vectors (e.g., 256 - dimensional).
Secondly, two layers of dense networks execute the excitation process. The number of channels is reduced to 1/16 (e.g., 256→16) to mitigate the computational burden. After ReLU activation, the number of channels is restored to the original level (e.g., 16→256).
Finally, Sigmoid activation outputs the channel weights within the range of 0 to 1. Subsequently, the learned weights are multiplied with the original feature maps on a channel - by - channel basis to realize adaptive weighting of features in different channels.
After integrating the SE module into each convolution block, it dynamically regulates the proportion of effective features (e.g., signals highly correlated with location) and interference features (e.g., noise) in RSSI signals. This regulation enhances the model’s sensitivity to critical signals, making it particularly appropriate for scenarios where RSSI signals are prone to interference in complex indoor environments.
| Algorithm 1: Workflow of SE Attention Mechanism |
|
4. Experiments and Results
Experiments and validations were carried out on the public dataset UJIIndoorLoc, followed by tests on the TUT2018 dataset. The entire implementation process was grounded in the TensorFlow 2.10.0 framework and accomplished on an RTX 4090 GPU platform.
4.1. Dateset
4.1.1. UJIIndoorLoc dataset
TThe UJIIndoorLoc dataset, a widely-used open-source dataset in the field of Wi-Fi indoor positioning, is primarily utilized to evaluate the performance of the SE-MTCAELoc model in complex multi-building and multi-floor scenarios. The detailed configuration is presented as follows:
(1) Dataset Scale and Scenario Coverage:The dataset encompasses three buildings, each with 4 or 5 floors, and consists of 19,937 rows of sample data and 529 columns of features. These data cover typical indoor environments, including corridors and offices. Furthermore, data from different time periods are collected to reflect the variations in the stability of environmental signals.
(2) Core Data Fields and Signal Features:The dataset contains 520 Wi-Fi access points (APs) with Received Signal Strength Indicator (RSSI) values, ranging from -104 to 100 dBm. Here, 100 dBm represents invalid signals that need to be replaced during pre-processing. Other components include building labels (with three categories), floor labels (five categories across 14 floors in three buildings), geodetic coordinates (UTM coordinates based on the WGS84 geodetic system for coordinate regression tasks), and timestamps. This comprehensive structure supports three core tasks: building classification, floor classification, and coordinate regression.
(3) Experimental Suitability Statement:The multi-building and multi-floor characteristics of this dataset are highly consistent with the research objective of "multi-task localization" in this paper. It can be used to verify the classification accuracy and regression error of the SE-MTCAELoc model in complex scenarios.
4.1.2. TUT2018 Dataset
This dataset is a multi-floor open architectural dataset formulated to assess the generalization ability of the SE-MTCAELoc model across diverse data distributions. The configuration particulars are presented as follows:
(1) Data Scale and Scenario Coverage: It encompasses a single building with three floors (ground, first, and second), consisting of approximately 400 samples . Collected within campus indoor settings, it diverges from UJIIndoorLoc in terms of AP deployment density.
(2) Core Data Fields and Signal Features: It incorporates x/y/z coordinates (where the z-axis corresponds to floor labels), RSSI values of 492 APs (excluding APs with a signal validity of less than 0%), and lacks architectural labels.
(3)Experimental Adaptability: The "single building with varying AP density" configuration validates the architectural flexibility of the model subsequent to the removal of architectural classification branches. Comparative analysis with UJIIndoorLoc (such as differences in floor classification accuracy and MAE regression) evaluates data adaptability and showcases generalization capability.
4.2. Data Preprocessing
4.2.1. Based on UJIIndoorLoc Dataset
The data preprocessing procedure of the UJIIndoorLoc dataset is presented in Algorithm 2. Data is loaded from the CSV file, where the initial 520 columns of Received Signal Strength Indicator (RSSI) features are extracted. Columns 520-521 contain latitude and longitude coordinates, column 522 holds floor labels, and column 523 has building labels. To augment the robustness of RSSI features, Gaussian noise with a mean of 0, a standard deviation of 5, and a clipping range between -110 to -30 dBm is incorporated. For compatibility with 2-D CNN, the 520 columns of RSSI are padded with -110 dBm to reach 576 elements and then reshaped into a 24×24 two-dimensional matrix. Figure 3 presents the variation results of four randomly selected samples. Building and floor labels are initially converted into integers by means of the LabelEncoder, and subsequently transformed into one-hot vectors through the to_categorical function. Coordinates are normalized to the 0-1 range using the MinMaxScaler, and the original ranges and normalization parameters are saved for inverse conversion. Finally, validation is conducted to ensure the accuracy of data processing, and the formatted feature matrices, encoded labels, and metadata are outputted to offer standardized inputs for model training. This methodology preserves crucial information while adapting to the model architecture via enhancement, encoding, and normalization operations, thereby enhancing training stability and laying the groundwork for multi-task learning.
| Algorithm 2: Preprocessing Flow for UJIIndoorLoc Dataset |
|
4.2.2. Based on TUT2018 Dataset
◦In the data preprocessing stage, a comprehensive workflow was formulated, encompassing data loading and cleaning, feature engineering, normalization enhancement, and dataset partitioning. Initially, the CSV data was loaded, and the coordinates of the first three columns were extracted (where z was mapped to three - layer labels of ), along with the subsequent RSSI features. Invalid signal values of 100 were replaced with - 110 dBm. Subsequently, valid Access Points (APs) were filtered (excluding those with signal effectiveness below 30%), and location - related features were integrated (number of APs with strong signals, signal dynamic range). The original 492 columns of RSSI features were expanded to 576 dimensions by scaling them with - 110 dBm. For the training set, augmented samples were generated by applying Gaussian noise (acting only on valid signals within the range of ). Meanwhile, the RSSI features were standardized using the StandardScaler, and the coordinates were normalized to the range of to alleviate scale effects. Finally, the original training and test sets were combined through stratified sampling at an 8:2 ratio, ensuring consistent proportions of samples at the floor level. Floor labels were transformed into one - hot encoding to provide high - quality, balanced, and format - compatible data for subsequent model training.
4.3. Pretraining Initialization
SE-CAE pre-training was carried out on RSSI feature data for 100 epochs of unsupervised learning. The training employed the Adam optimizer (with an initial learning rate of 1e - 3), in conjunction with learning rate decay and early stopping mechanisms. MSE was utilized as the loss function, and MAE was adopted as an auxiliary evaluation metric. The objective was to empower the model to acquire effective feature representations of the RSSI data via the reconstruction task.
As depicted in Figure 4, the training process manifests distinct three - phase characteristics. In the initial phase (epochs 1 - 20), the model rapidly assimilated fundamental feature patterns. The MSE declined from 941.42 to 2.39, and the MAE decreased by more than 96%, from 22.78 to 0.89, which illustrates the model’s rapid acquisition of RSSI signal distribution patterns.
The intermediate phase (epochs 21 - 60) entered a stage of gradual convergence. During this phase, the MSE gradually decreased to 0.68, and the MAE decreased to 0.23. The model started to capture weak signal features and subtle correlations. Despite the slower progress, it maintained a stable decline rate.
In the final phase (epochs 61 - 100), the model reached a stable state with the learning rates decaying to 6.25e - 05. The MSE of the validation set remained stable at 0.39, while the MAE stabilized at 0.16. The minimal error fluctuations indicate that the model was approaching its optimal state.
The pre - training exhibits remarkable performance and excellent generalization ability. The error differences between the training set and the validation set are minimal (the MSE difference is 0.15, and the MAE difference is 0.03), and no overfitting phenomenon is observed. Remarkably, the error of the validation set is even lower than that of the training set. This can be ascribed to the Gaussian noise introduced in the training set, in contrast to the original data utilized in the validation, which underscores the model’s denoising and reconstruction capabilities. The SE attention module effectively strengthens crucial signal channels during the training process, thereby enhancing the efficiency of feature learning. The final pre - trained weights capture the universal feature representations of the RSSI, offering a high - quality shared encoder foundation for subsequent multi - task localization models. This substantially reduces the training time and enhances the model’s robustness.
4.4. Attention Mechanism and Its Ablation Experiments
In the autoencoder pre - training process, there were significant disparities between models with and without SE modules, as depicted in Figure 5. The final outcomes indicated that the model equipped with SE modules attained a Mean Absolute Error (MAE) of 5.23 on the validation set. This value was approximately 10.3% lower than the MAE of 5.83 for the model without SE modules, suggesting a remarkable superiority in reconstruction accuracy.
During the training process, the model integrated with the SE module demonstrated more rapid convergence in the initial phase, along with a more significant reduction in loss during epochs 5 - 10. Subsequently, although both models reached a stable state, the model incorporating the SE module consistently sustained lower loss levels. It is worth noting that both models demanded a comparable training time per epoch (all around 3 seconds), suggesting that the SE module dynamically regulates feature weights via the channel attention mechanism without notably augmenting the computational burden. This mechanism facilitates the enhancement of the extraction of crucial signal features and effectively alleviates noise interference.
In conclusion, the SE attention module dynamically adjusts the weights of RSSI signal channels, enabling autoencoders to concentrate on more critical signal features for localization purposes. This substantially enhances the precision and efficiency of feature reconstruction, laying a foundation for higher - quality feature representation for subsequent multi - task models. It is anticipated to exert a positive influence on downstream tasks such as building classification, floor classification, and coordinate regression.
During the training process of the multi - task model equipped with the SE module, the entire model manifested distinct convergence tendencies. As depicted in Figure 6, the performances of all tasks exhibited substantial enhancements. Regarding the total loss, the overall loss of the model declined from 2.0824 at Epoch 1 to 0.0414 at Epoch 80, signifying a reduction exceeding 98%. This phenomenon implies an augmented task - specific fitting capacity, accompanied by refined optimization via adaptive learning rate adjustments (gradually decreasing from 0.001 to 1.5625e - 05).
The building classification task demonstrated the most remarkable performance improvement. The training accuracy ascended from 45.74% to 99.64%, while the validation accuracy remained stable at 99.57%. Concurrently, the loss decreased from 1.0747 to 0.0146, indicating the model’s precise recognition of building features. The floor classification task also achieved outstanding results. The training accuracy increased from 23.58% to 98.64%, and the validation accuracy reached 99.58%. Despite certain fluctuations, the loss decreased from 1.5568 to 0.0635, suggesting a strong ability to capture floor features.
In the coordinate regression task, the normalized MAE decreased from 0.5818 at the start of training to 0.0177 on the validation set, corresponding to an error of 5.23 meters in actual conversion. Moreover, the loss further declined from 0.7074 to 0.0008, demonstrating a continuous improvement and stabilization of regression accuracy.
As presented in Table 2, the multi - task model integrating the SE module exhibits superior performance in building classification, floor classification, and coordinate regression tasks. Significantly, it attains an accuracy approaching 100% in classification tasks while keeping regression errors at a low level. This implies that the attention mechanism within the SE module effectively strengthens the feature representation capabilities, offering a high - quality shared feature basis for multi - task learning.
4.5. Experiments Based on UJIIndoorLoc Dataset
The multi - task learning model developed in this research, which integrates subtasks of building classification, floor classification, and coordinate regression, exhibited stable training dynamics and remarkable task adaptability throughout a total of 183 training cycles (with a pre - planned 200 epochs). The training process remained continuous, with each epoch comprising 63 training batches. The average duration of each batch spanned from 42 to 45 ms, guaranteeing high overall training efficiency and controllability.
The learning rate employed a step - wise decay strategy: initially (epoch 1 - 111), a relatively high learning rate (starting from 7.81e - 06 at epoch 101) was utilized to attain rapid convergence of core parameters; during the intermediate phase (epoch 112 - 119), it was decreased to 3.90e - 06 for parameter fine - tuning; in the later phase (epoch 120 - 183), it was further reduced to 1.00e - 06 to sustain slow updates, effectively preventing parameter oscillations in the later stages of training. The experimental findings are presented in Table 3.
Within the context of task execution, the classification subtasks (building and floor classification) exhibited the traits of "early saturation and consistent performance throughout the process". As shown in Figure 7, in the building classification task, the accuracy of the training set remained stable within the interval of 99.40% - 99.60%, and the accuracy of the validation set was within 99.47% - 99.65%. The corresponding losses of the training set ranged from 0.021 to 0.024, and those of the validation set ranged from 0.014 to 0.016, suggesting that the model’s capacity to distinguish building categories neared the optimal state. Concerning floor classification, the accuracy of the training set reached a maximum of 98.11% (stable range: 97.71% - 98.11%), whereas the accuracy of the validation set reached 98.70% (stable range: 98.07% - 98.70%). Notably, the loss of the validation set (0.048 - 0.058) consistently stayed lower than that of the training set (0.076 - 0.085), indicating the model’s strong generalization ability in floor classification tasks. This suggests that the uniform distribution of floor categories across the training and validation sets contributed to the model’s robust performance.
The coordinate regression sub-task, functioning as the core localization task, demonstrates a pattern characterized by "continuous and stable optimization, accompanied by a deceleration in convergence during the later stage". During the training process, the coordinate regression loss gradually declines and stabilizes within the ranges of 0.0022 - 0.025 (training set) and 0.00068 - 0.00092 (validation set). The loss of the validation set consistently stays lower than that of the training set, which suggests a continuous enhancement in the model’s fitting and generalization abilities for coordinate prediction. After inverse normalization, the actual physical error reveals that the mean absolute error (MAE) of coordinate regression is 5.23 meters. This error is acceptable for large - scale outdoor localization scenarios such as parks and campuses. Nevertheless, for high - precision indoor localization requirements (usually demanding MAE < 3 meters), there remains scope for optimization.
Following 183 epochs of training, the model attained a state characterized by "saturated performance in classification tasks and approaching convergence in regression tasks". Throughout the training process, no occurrences of overfitting or underfitting were detected (the losses and performance of the verification set consistently outperformed or were on par with those of the training set). Given the limited potential for improvement in the remaining 17 epochs and the fact that the current performance already satisfied the requirements of the scenario, early stopping was adopted to prevent unnecessary iterations. The model with the lowest total verification set loss (e.g., when the epoch is 173, the validation loss is 0.0416) was preserved.
The multi-task localization model developed in this research (encompassing building classification, floor classification, and coordinate regression sub-tasks) attained outstanding classification accuracy and stable localization performance on the test dataset (comprising a total of 3988 samples). In the classification sub-tasks, the building classification task exhibited remarkably high recognition accuracy. For the three types of buildings (with sample sizes of 1050, 1039, and 1899 respectively), the precision, recall, and F1 score for each category consistently ranged from 99% to 100%. The overall accuracy rate reached 99.57%, and the classification loss was as low as 0.0145, suggesting that the model can distinguish between building categories with near-zero error, thereby offering precise scene constraints for subsequent localization tasks. As depicted in Figure 8, the confusion matrix for building classification further reveals accuracy rates of 100%, 99%, and 100% for the three buildings respectively.
The floor classification task focuses on five types of floors (with support sample sizes of 899, 1016, 856, 1003, and 214 respectively), attaining an overall accuracy rate of 98.57%. The weighted average precision, recall, and F1 score all reach 99%. Among these, the precision and recall rates of three types of floors (labels 0, 1, and 3) surpass 98%. Meanwhile, the recall rate of label 4 (the type with the smallest sample size, 214) is 97%, corresponding to a classification loss of 0.0478. This suggests that the model still exhibits strong robustness in the context of imbalanced sample floor classification and can effectively meet the identification requirements of different floors. As depicted in Figure 9, the confusion matrix for floor classification further illustrates accuracy rates of 99%, 99%, 98%, 99%, and 97% for the five - story building respectively.
In the core coordinate regression task, the model exhibited stable localization capabilities. Specifically, the coordinate regression loss was as low as 0.0007, and the normalized mean absolute error (MAE) was 0.0166. After inverse normalization, the actual physical error presented an average absolute error (MAE) of 5.23 meters, which satisfies the practical application requirements for large - scale outdoor positioning scenarios such as industrial parks and campuses. Regarding indoor high - precision positioning scenarios (usually demanding MAE < 3 meters), further optimization can be realized through data augmentation or adjustments to loss weighting. Overall, the model achieved a total loss of merely 0.0416. There were no significant conflicts between the losses and accuracy metrics of the classification and regression subtasks, validating the rationality of the multi - task framework design. This approach guarantees high - precision classification tasks while effectively maintaining coordinate positioning accuracy, offering reliable model support for multi - scenario positioning requirements.
4.6. Experiments Based on TUT2018 Dataset
At the network model level, the SE - CAE structure was retained (as shown in Figure 3). In the multi - task learning architecture, the building task branch was removed as the TUT2018 dataset only contains data from one building.
Based on the final evaluation results of the multi - output model (integrating floor classification and coordinate regression), the model demonstrates notable performance disparities in the two tasks. It achieves high performance in the floor classification task, whereas the accuracy of the coordinate regression task requires enhancement. Specifically, regarding coordinate regression, the normalized mean absolute error (MAE) on the validation set is 0.0244. After coordinate denormalization, the average positioning error in the actual physical space is 6.16 meters. This error is at a medium level in indoor positioning scenarios (which generally demand sub - meter or meter - level accuracy) and may be influenced by WiFi signal fluctuations, environmental interference, or the model’s inadequate capture of fine - grained location features.
The floor classification task exhibits excellent performance. The classification report reveals that for the three floor categories (ground floor, first floor, second floor), precision, recall, and F1 - score are all high. For the ground floor, the precision is 0.93, recall is 1.00, and F1 - score is 0.96 (87 samples); for the first floor, the precision is 1.00, recall is 0.97, and F1 - score is 0.98 (226 samples); for the second floor, all three metrics are 1.00 (62 samples). The overall classification accuracy reaches 98.13%, with both the macro - average and weighted - average F1 - scores at 0.98. This indicates that the model can stably and accurately distinguish different floors via WiFi fingerprints and maintains consistent high performance on both the first floor with a larger sample size and the second floor with a smaller sample size, without obvious class bias issues.
5. Conclusion and Discussion
This paper presents a multi - task convolutional autoencoder indoor localization model integrated with the SE attention mechanism (SE - MTCAELoc), with the objective of resolving issues such as the susceptibility of Wi - Fi RSSI signals to interference in complex indoor environments, poor generalization across multiple scenarios, and inadequate collaborative optimization of localization tasks. Through systematic model design, experimental verification, and comparative analysis, the following core conclusions can be derived.
The SE attention mechanism notably enhances feature quality: In the pre - training phase of SE - CAE, compared to the model without the SE module, the model incorporating the SE module reduces the mean squared error (MSE) on the validation set by 26.2% (from 10.49 to 7.75) and the mean absolute error (MAE) by 14.2% (from 2.54 to 2.18), while there is no significant increase in the single - round training time (approximately 3 seconds). This suggests that the SE module can enhance key RSSI features relevant to localization through dynamic channel weighting, suppress environmental noise interference, and establish a high - quality feature foundation for subsequent multi - task learning.
The multi - task architecture realizes collaborative optimization: Experiments based on the UJIIndoorLoc dataset demonstrate that the model performs well in building classification (test - set accuracy of 99.57%), floor classification (test - set accuracy of 98.57%), and coordinate regression (actual test - set MAE of 5.23 meters), and there is no significant conflict among the three types of task losses (total loss of 0.0416). By assigning loss weights of 0.1 (building), 0.2 (floor), and 0.7 (regression), the model effectively leverages inter - task correlations (such as classification results providing scenario constraints for regression) to achieve the collaborative objective of ’high classification accuracy - stable regression performance’.As presented in Table 4, ours method attains classification outcomes comparable to those of methods like HADNN and CCpos in terms of accuracy for building classification and floor classification. Simultaneously, it yields the optimal result in position regression.
The model possesses cross - dataset generalization ability: On the TUT2018 dataset (single building, 3 floors), after removing the building classification branch, the model still attains a floor classification test - set accuracy of 98.13% (precision/recall/F1 - score for the three floor categories are all over 0.96), with an actual MAE of 6.16 meters for coordinate regression. This indicates that after data adaptation (such as invalid access point filtering, band feature extraction), the model can maintain stable performance in indoor scenes with different data distributions, validating its generalization potential. As presented in Tabel Table 5, our method attained the optimal outcomes in floor classification accuracy, and the Mean Absolute Error (MAE) was comparable to that of LCVAE - CNN.
The current experiments solely validated the performance within static indoor environments, without considering the dynamic interference scenarios (e.g., crowd movement or obstacle repositioning) that could potentially affect the model. Future research can focus on simulating dynamic interference scenarios and investigating the real - time adaptability of the model. Although MAE(with a coordinate regression accuracy ranging from 5.50 to 6.16 meters) meets the requirements of medium - to - large scales, it still falls short of high - precision indoor positioning (MAE < 3 meters). To enhance the forward - looking nature of research, future studies should integrate Channel State Information (CSI) [21] signals and multi - signal fusion techniques to further reduce errors. For example, a system for accurate and continuous pedestrian localization is proposed via the integration of Wi - Fi fingerprinting with inertial measurement units (IMUs) [29].
Author Contributions
Conceptualization, Y.L. and J.H.; methodology, Y.L.; software, Y.L.; validation, Y.L. and J.H.; formal analysis, Y.L. and J.H.; investigation, Y.L.; resources, Y.L. and J.H.; data curation, Y.L. and J.H.; writing—original draft preparation, Y.L.; writing—review and editing, Y.L.; visualization, Y.L. and J.H..; supervision, B.H.; project administration, B.H.; funding acquisition, Y.L and B.H. All authors have read and agreed to the published version of the manuscript.
Funding
This research was funded by the Provincial Key Platforms and Major Research Projects of Universities in Guangdong Province (2021ZDZX3012 and 2023ZDZX1044).
Institutional Review Board Statement
Not applicable.
Informed Consent Statement
Not applicable.
Data Availability Statement
Dataset available on request from the authors.
Conflicts of Interest
The authors declare no conflicts of interest.
References
- Sesyuk, A.; Ioannou, S.; Raspopoulos, M. A survey of 3D indoor localization systems and technologies. Sensors 2022, 22(23), 9380. [Google Scholar] [CrossRef] [PubMed]
- Mallik, M.; Panja, A.K.; Chowdhury, C. Paving the way with machine learning for seamless indoor–outdoor positioning: A survey. Information Fusion 2023, 94, 126–151. [Google Scholar] [CrossRef]
- Roy, P.; Chowdhury, C. A survey of machine learning techniques for indoor localization and navigation systems. Journal of Intelligent & Robotic Systems 2021, 101(3), 63. [Google Scholar] [CrossRef]
- Singh, N.; Choe, S.; Punmiya, R. Machine learning based indoor localization using Wi-Fi RSSI fingerprints: An overview. IEEE Access 2021, 9, 127150–127174. [Google Scholar] [CrossRef]
- Radaelli, L.; Jensen, C.S. Towards fully organic indoor positioning. In Proceedings of the Fifth ACM SIGSPATIAL International Workshop on Indoor Spatial Awareness; 2013; pp. 16–20. [Google Scholar]
- Wu, S.; Zeng, X.; Zhang, M.; Cumanan, K.; Waraiet, A.; Chu, Z.; Xu, K. LCVAE-CNN: Indoor Wi-Fi Fingerprinting CNN Positioning Method Based on LCVAE. IEEE Internet of Things Journal 2025. [Google Scholar] [CrossRef]
- Nessa, A.; Adhikari, B.; Hussain, F.; Fernando, X.N. A survey of machine learning for indoor positioning. IEEE Access 2020, 8, 214945–214965. [Google Scholar] [CrossRef]
- Cha, J.; Lim, E. A hierarchical auxiliary deep neural deep neural auxiliary deep neural network architecture for large-scale indoor localization based on Wi-Fi fingerprinting. Applied Soft Computing 2022, 120, 108624. [Google Scholar] [CrossRef]
- Nowicki, M.; Wietrzykowski, J. Low-effort place recognition with WiFi fingerprints using deep learning. In International Conference Automation; Springer, 2017; pp. 575–584. [Google Scholar]
- Kim, K.S.; Lee, S.; Huang, K. A scalable deep neural network architecture for multi-building and multi-floor indoor localization based on Wi-Fi fingerprinting. Big Data Analytics 2018, 3(1), 4. [Google Scholar] [CrossRef]
- Zhao, L.; Huang, H.; Li, X.; Ding, S.; Zhao, H.; Han, Z. An accurate and robust approach of device-free localization with convolutional autoencoder. In IEEE Internet of Things Journal; IEEE, 2019; Volume 6, 3, pp. 5825–5840. [Google Scholar]
- Qin, F.; Zuo, T.; Wang, X. Ccpos: Wifi fingerprint indoor positioning system based on cdae-cnn. Sensors 2021, 21(4), 1114. [Google Scholar] [CrossRef] [PubMed]
- Kargar-Barzi, A.; Farahmand, E.; Chatrudi, N.T.; Mahani, A.; Shafique, M. An edge-based wifi fingerprinting indoor localization using convolutional neural network and convolutional auto-encoder. IEEE Access 2024, 12, 85050–85060. [Google Scholar] [CrossRef]
- Hernández, N.; Parra, I.; Corrales, H.; Izquierdo, R.; Ballardini, A.L.; Salinas, C.; García, I. WiFiNet: WiFi-based indoor localisation using CNNs. Expert Systems with Applications 2021, 177, 114906. [Google Scholar] [CrossRef]
- Hinton, G.E.; Salakhutdinov, R.R. Reducing the dimensionality of data with neural networks. Science 2006, 313(5786), 504–507. [Google Scholar] [CrossRef] [PubMed]
- Jang, J.-W.; Hong, S.-N. Indoor localization with WiFi fingerprinting using convolutional neural network. In 2018 Tenth International Conference on Ubiquitous and Future Networks (ICUFN); IEEE, 2018; pp. 2018–758. [Google Scholar]
- Sinha, R.S.; Hwang, S.-H. Comparison of CNN applications for RSSI-based fingerprint indoor localization. Electronics 2019, 8(9), 989. [Google Scholar] [CrossRef]
- Alitaleshi, A.; Jazayeriy, H.; Kazemitabar, J. EA-CNN: A smart indoor 3D positioning scheme based on Wi-Fi fingerprinting and deep learning. Engineering Applications of Artificial Intelligence 2023, 117, 105509. [Google Scholar] [CrossRef]
- Masci, J.; Meier, U.; Cireșan, D.; Schmidhuber, J. Stacked convolutional auto-encoders for hierarchical feature extraction. In International Conference on Artificial Neural Networks; Springer, 2011; pp. 52–59. [Google Scholar]
- Chen, L.; Duan, W.; Li, J.; Wu, M.; Pedrycz, W.; Hirota, K. Attention-Based Deep Neural Network Combined Local and Global Features for Indoor Scene Recognition. In IEEE Transactions on Industrial Informatics; IEEE, 2024. [Google Scholar]
- Rao, X.; Luo, Z.; Luo, Y.; Yi, Y.; Lei, G.; Cao, Y. MFFALoc: CSI-based multifeatures fusion adaptive device-free passive indoor fingerprinting localization. IEEE Internet of Things Journal 2023, 11(8), 14100–14114. [Google Scholar] [CrossRef]
- Lutakamale, A.S.; Myburgh, H.C.; De Freitas, A. RSSI-based fingerprint localization in LoRaWAN networks using CNNs with squeeze and excitation blocks. Ad Hoc Networks 2024, 159, 103486. [Google Scholar] [CrossRef]
- Xu, D.; Wang, Y.; Guo, J.; Meng, L. WiFi Fingerprint Localization Model Based on Multi-Scale Residual Convolution and Self-Attention Mechanism. In 2025 5th International Symposium on Computer Technology and Information Science (ISCTIS); IEEE, 2025; pp. 277–280. [Google Scholar]
- Torres-Sospedra, J.; Montoliu, R.; Mart’ınez-Us’o, A.; Avariento, J.P.; Arnau, T.J.; Benedito-Bordonau, M.; Huerta, J. UJIIndoorLoc: A new multi-building and multi-floor database for WLAN fingerprint-based indoor localization problems. In 2014 International Conference on Indoor Positioning and Indoor Navigation (IPIN); IEEE, 2014; pp. 261–270. [Google Scholar]
- Lohan, E.S.; Torres-Sospedra, J.; Leppäkoski, H.; Richter, P.; Peng, Z.; Huerta, J. Wi-Fi crowdsourced fingerprinting dataset for indoor positioning. Data 2017, 2(4), 32. [Google Scholar] [CrossRef]
- Mendoza-Silva, G.M.; Richter, P.; Torres-Sospedra, J.; Lohan, E.S.; Huerta, J. Long-term WiFi fingerprinting dataset for research on robust indoor positioning. Data 2018, 3(1), 3. [Google Scholar] [CrossRef]
- Wilson, J.; Patwari, N. Radio tomographic imaging with wireless networks. IEEE Transactions on Mobile Computing 2010, 9(5), 621–632. [Google Scholar] [CrossRef]
- Hu, J.; Shen, L.; Sun, G. Squeeze-and-excitation networks. In Proceedings of the IEEE Conference on Computer Vision and Pattern Recognition; 2018; pp. 7132–7141. [Google Scholar]
- Zhou, P.; Wang, H.; Gravina, R.; Sun, F. WIO-EKF: Extended Kalman filtering-based Wi-Fi and inertial odometry fusion method for indoor localization. IEEE Internet of Things Journal 2024, 11(13), 23592–23603. [Google Scholar] [CrossRef]
Figure 1.
Framework diagram of the proposed model.
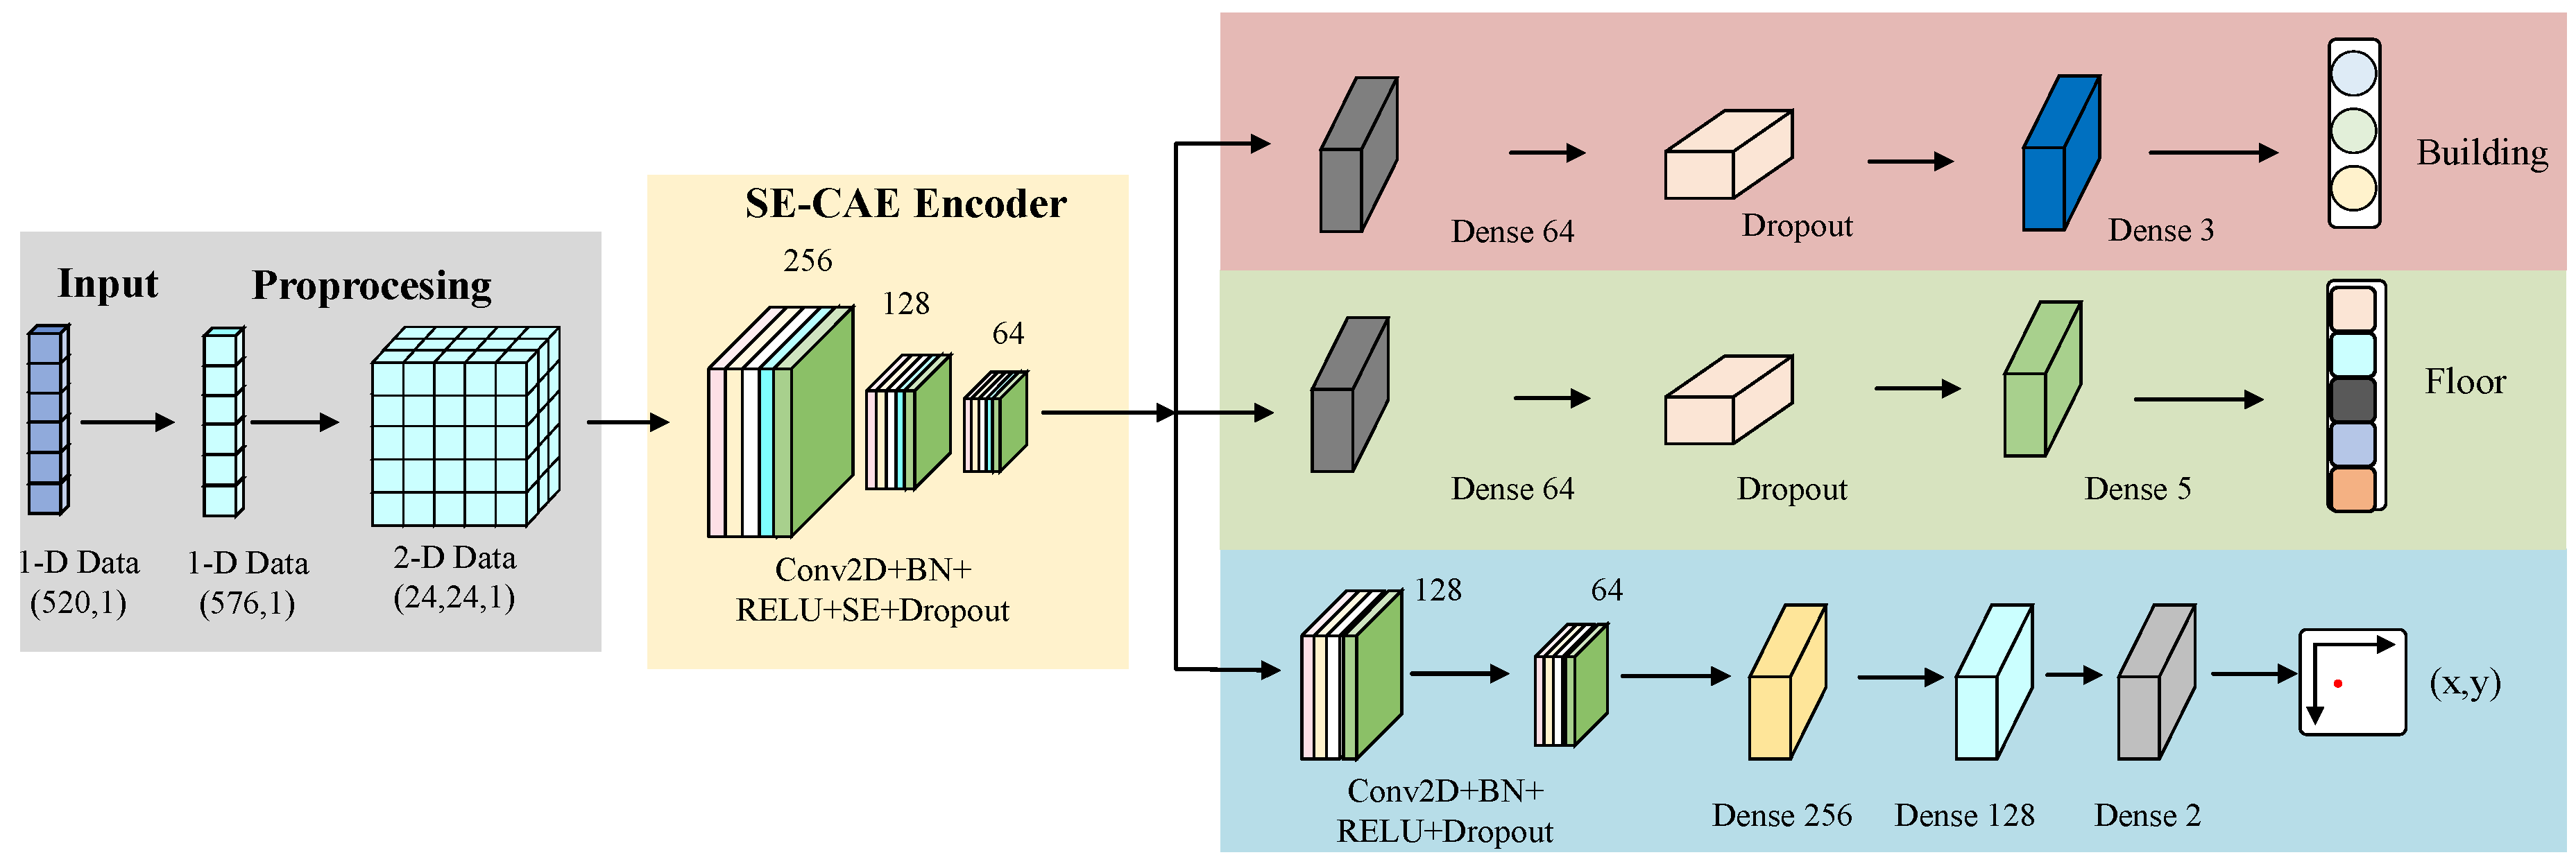
Figure 4.
SE-CAE reconstruction loss and MAE curve
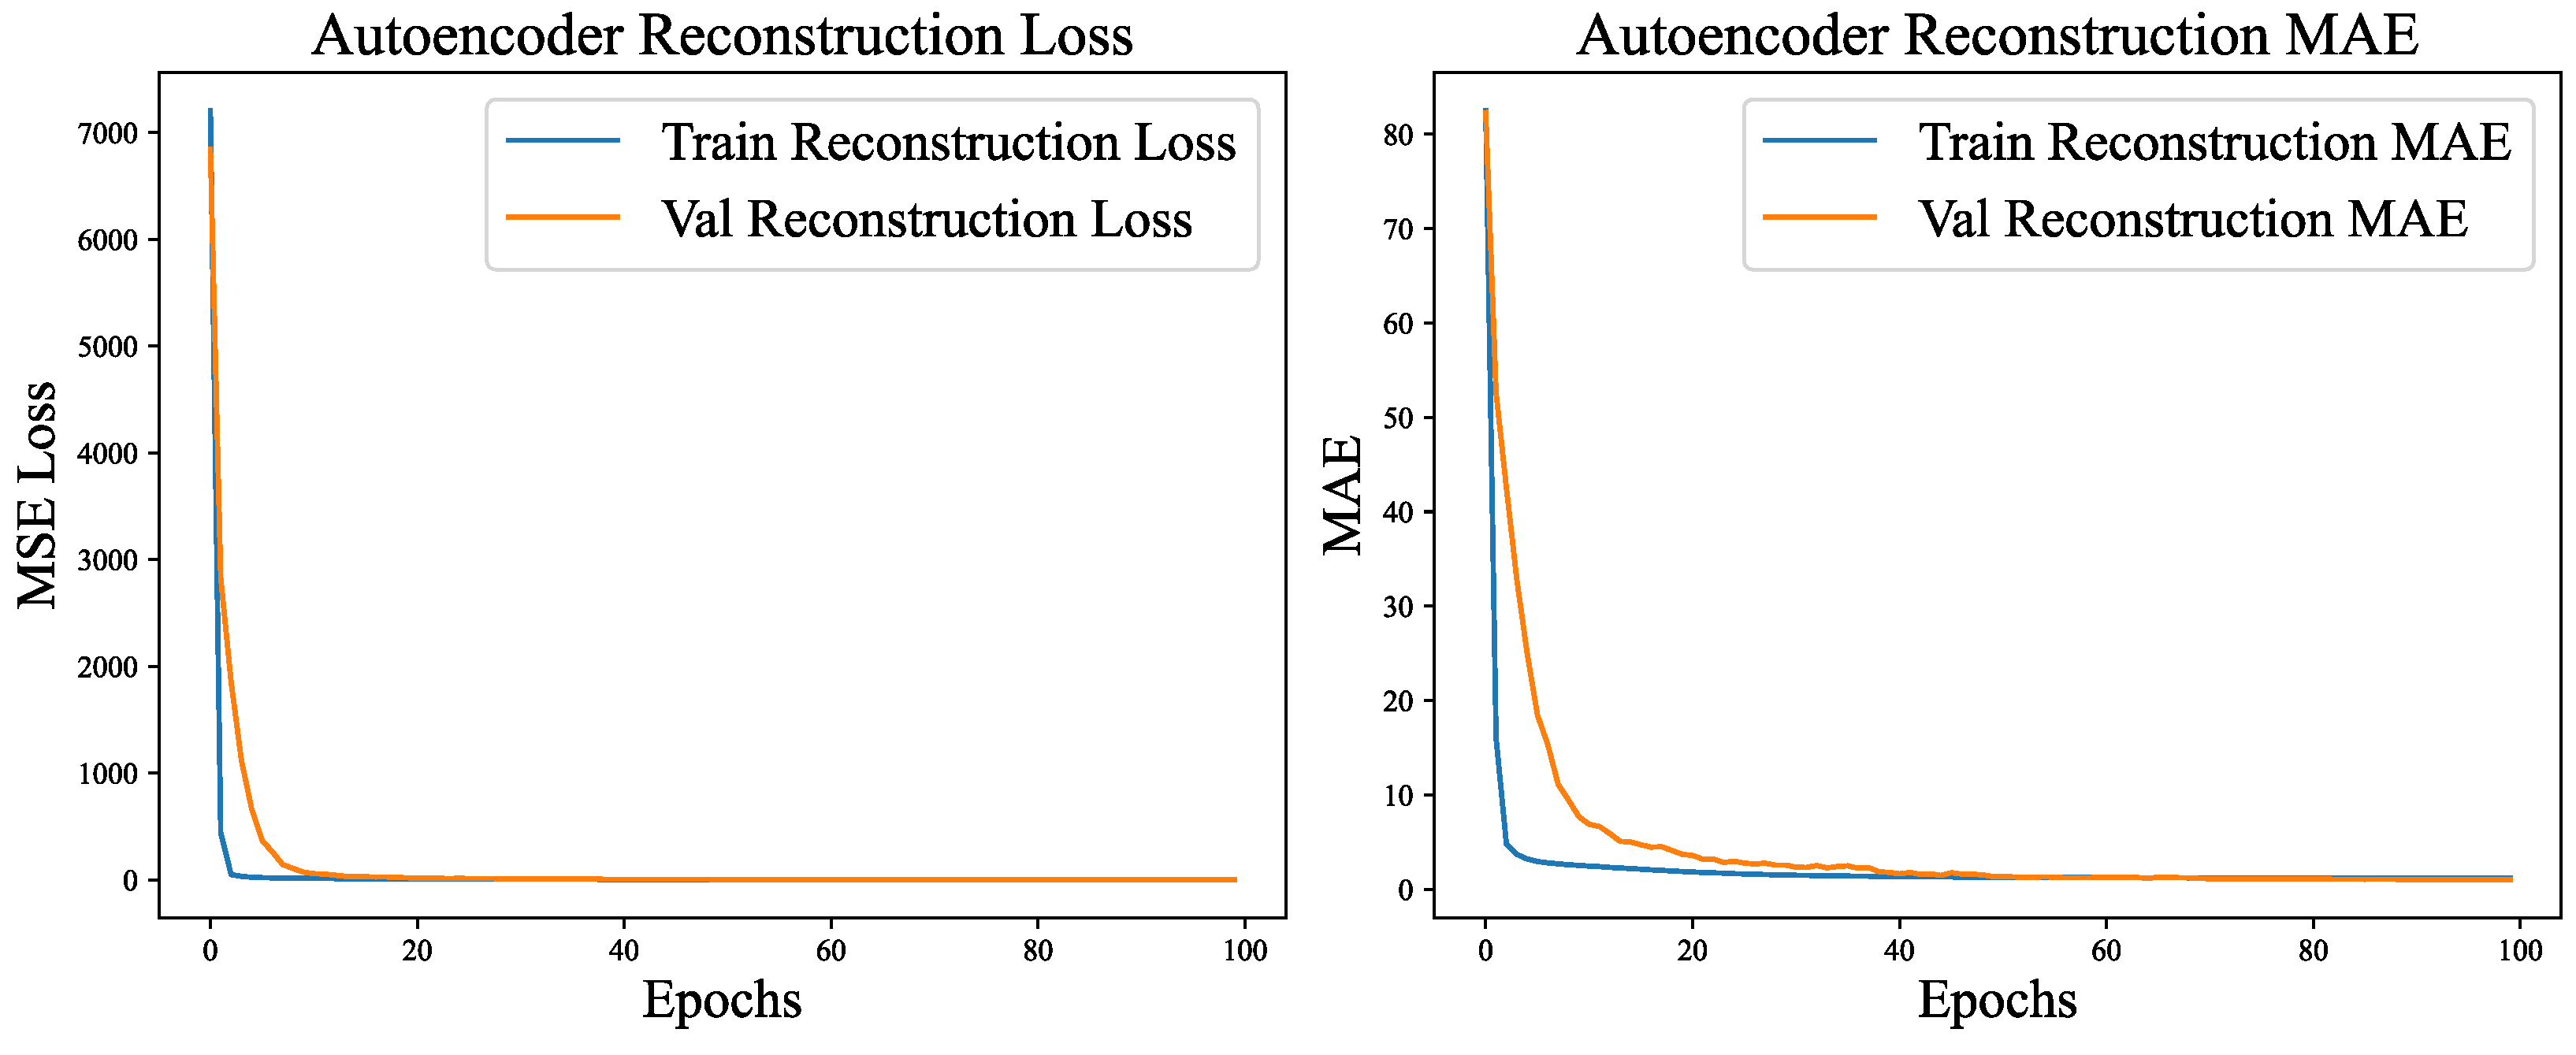
Figure 5.
Ablation Experiments on Autoencoder Reconstruction.
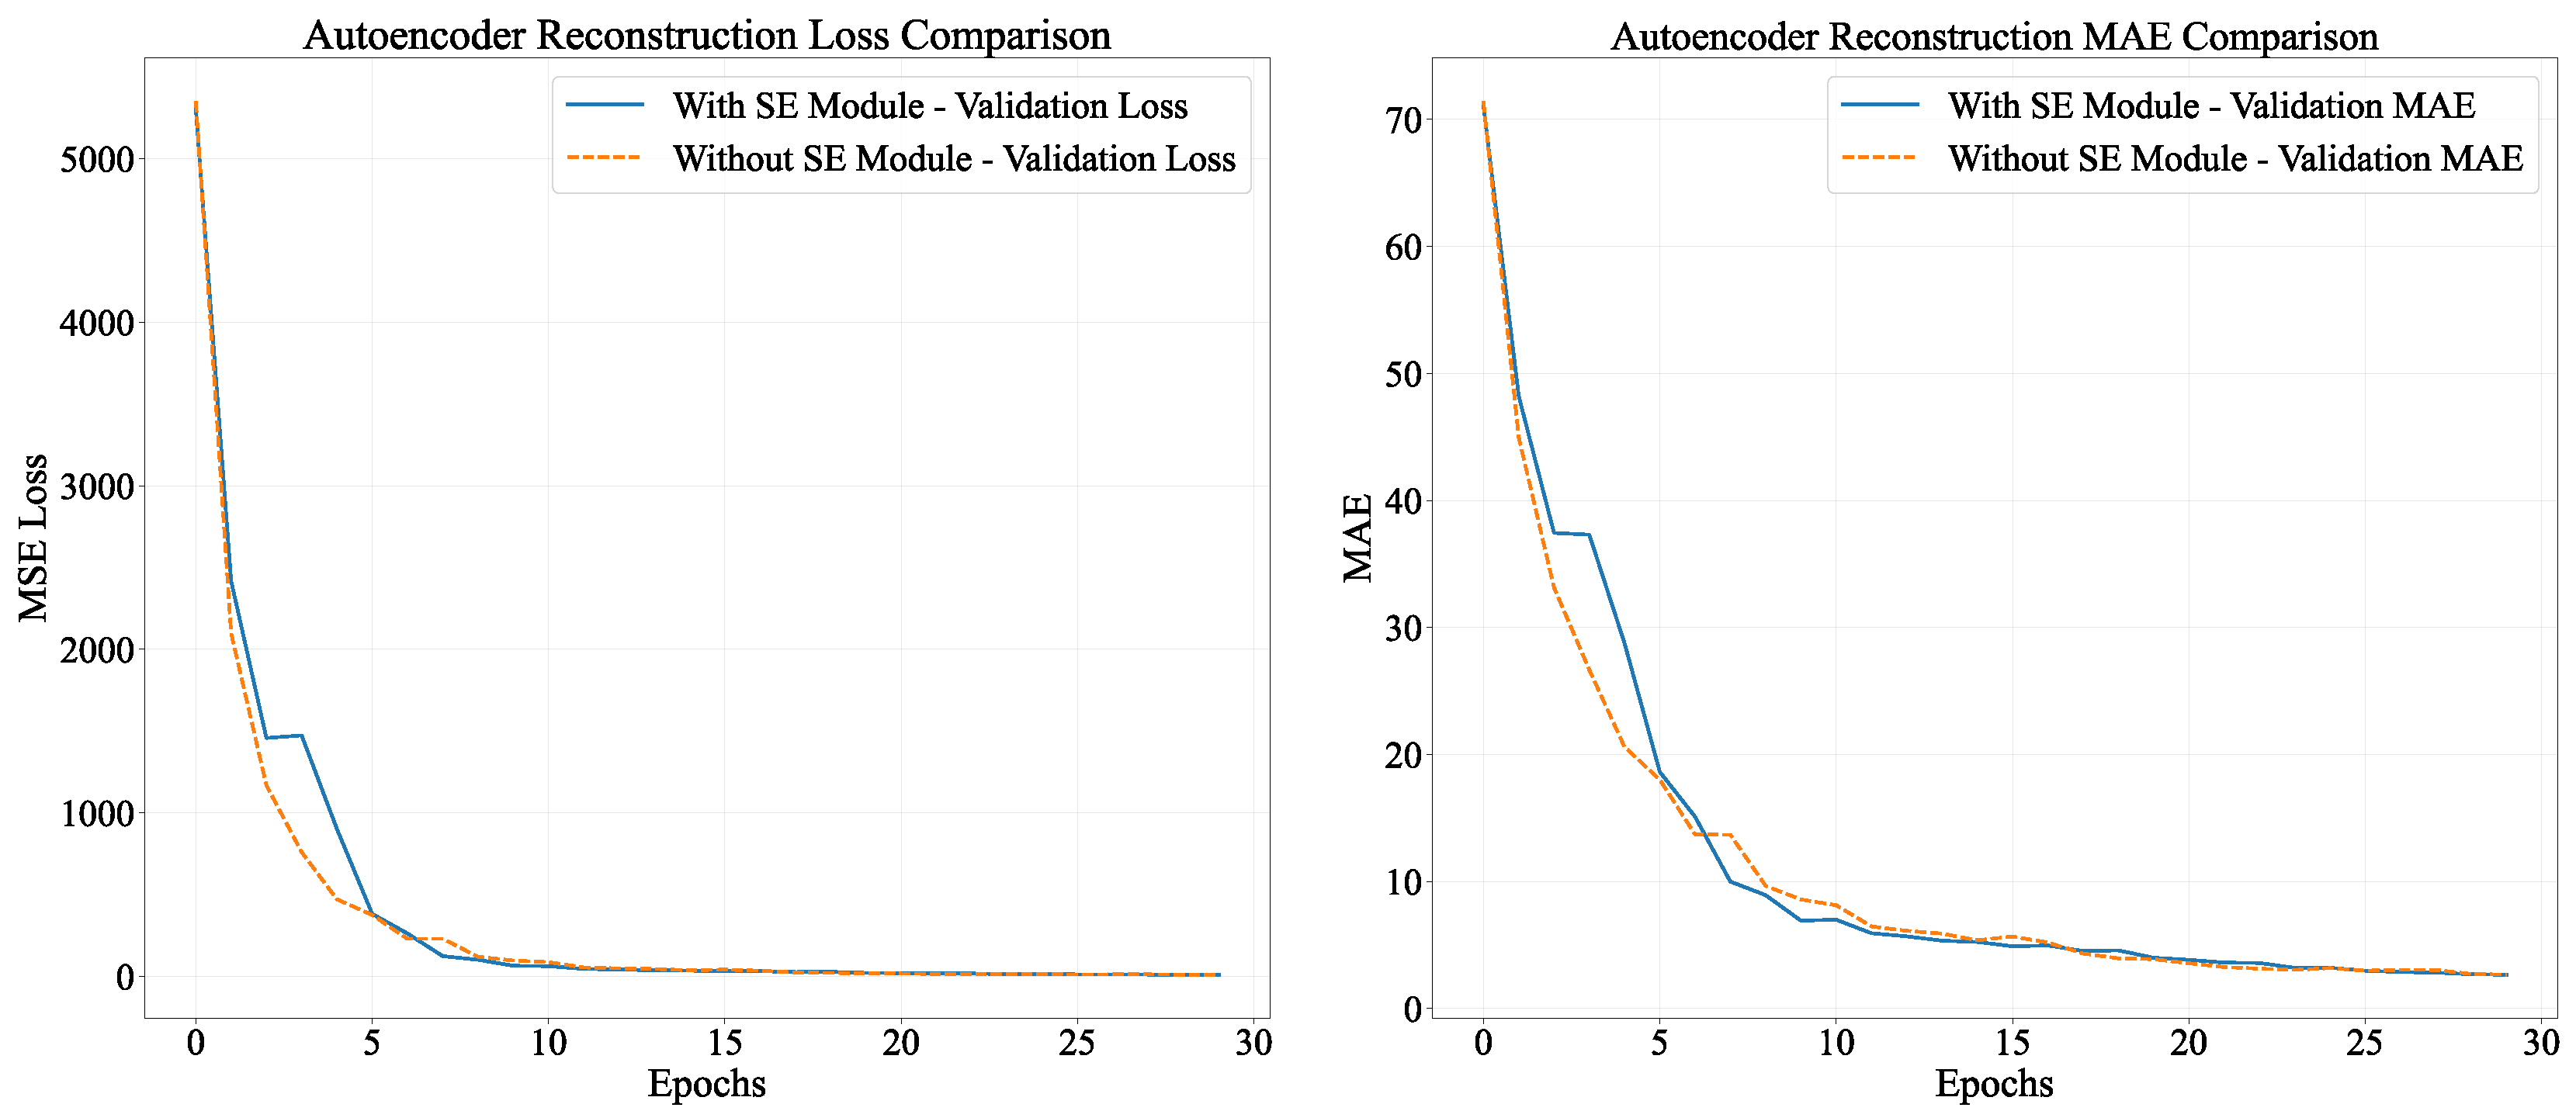
Figure 6.
The influence of the SE attention mechanism.
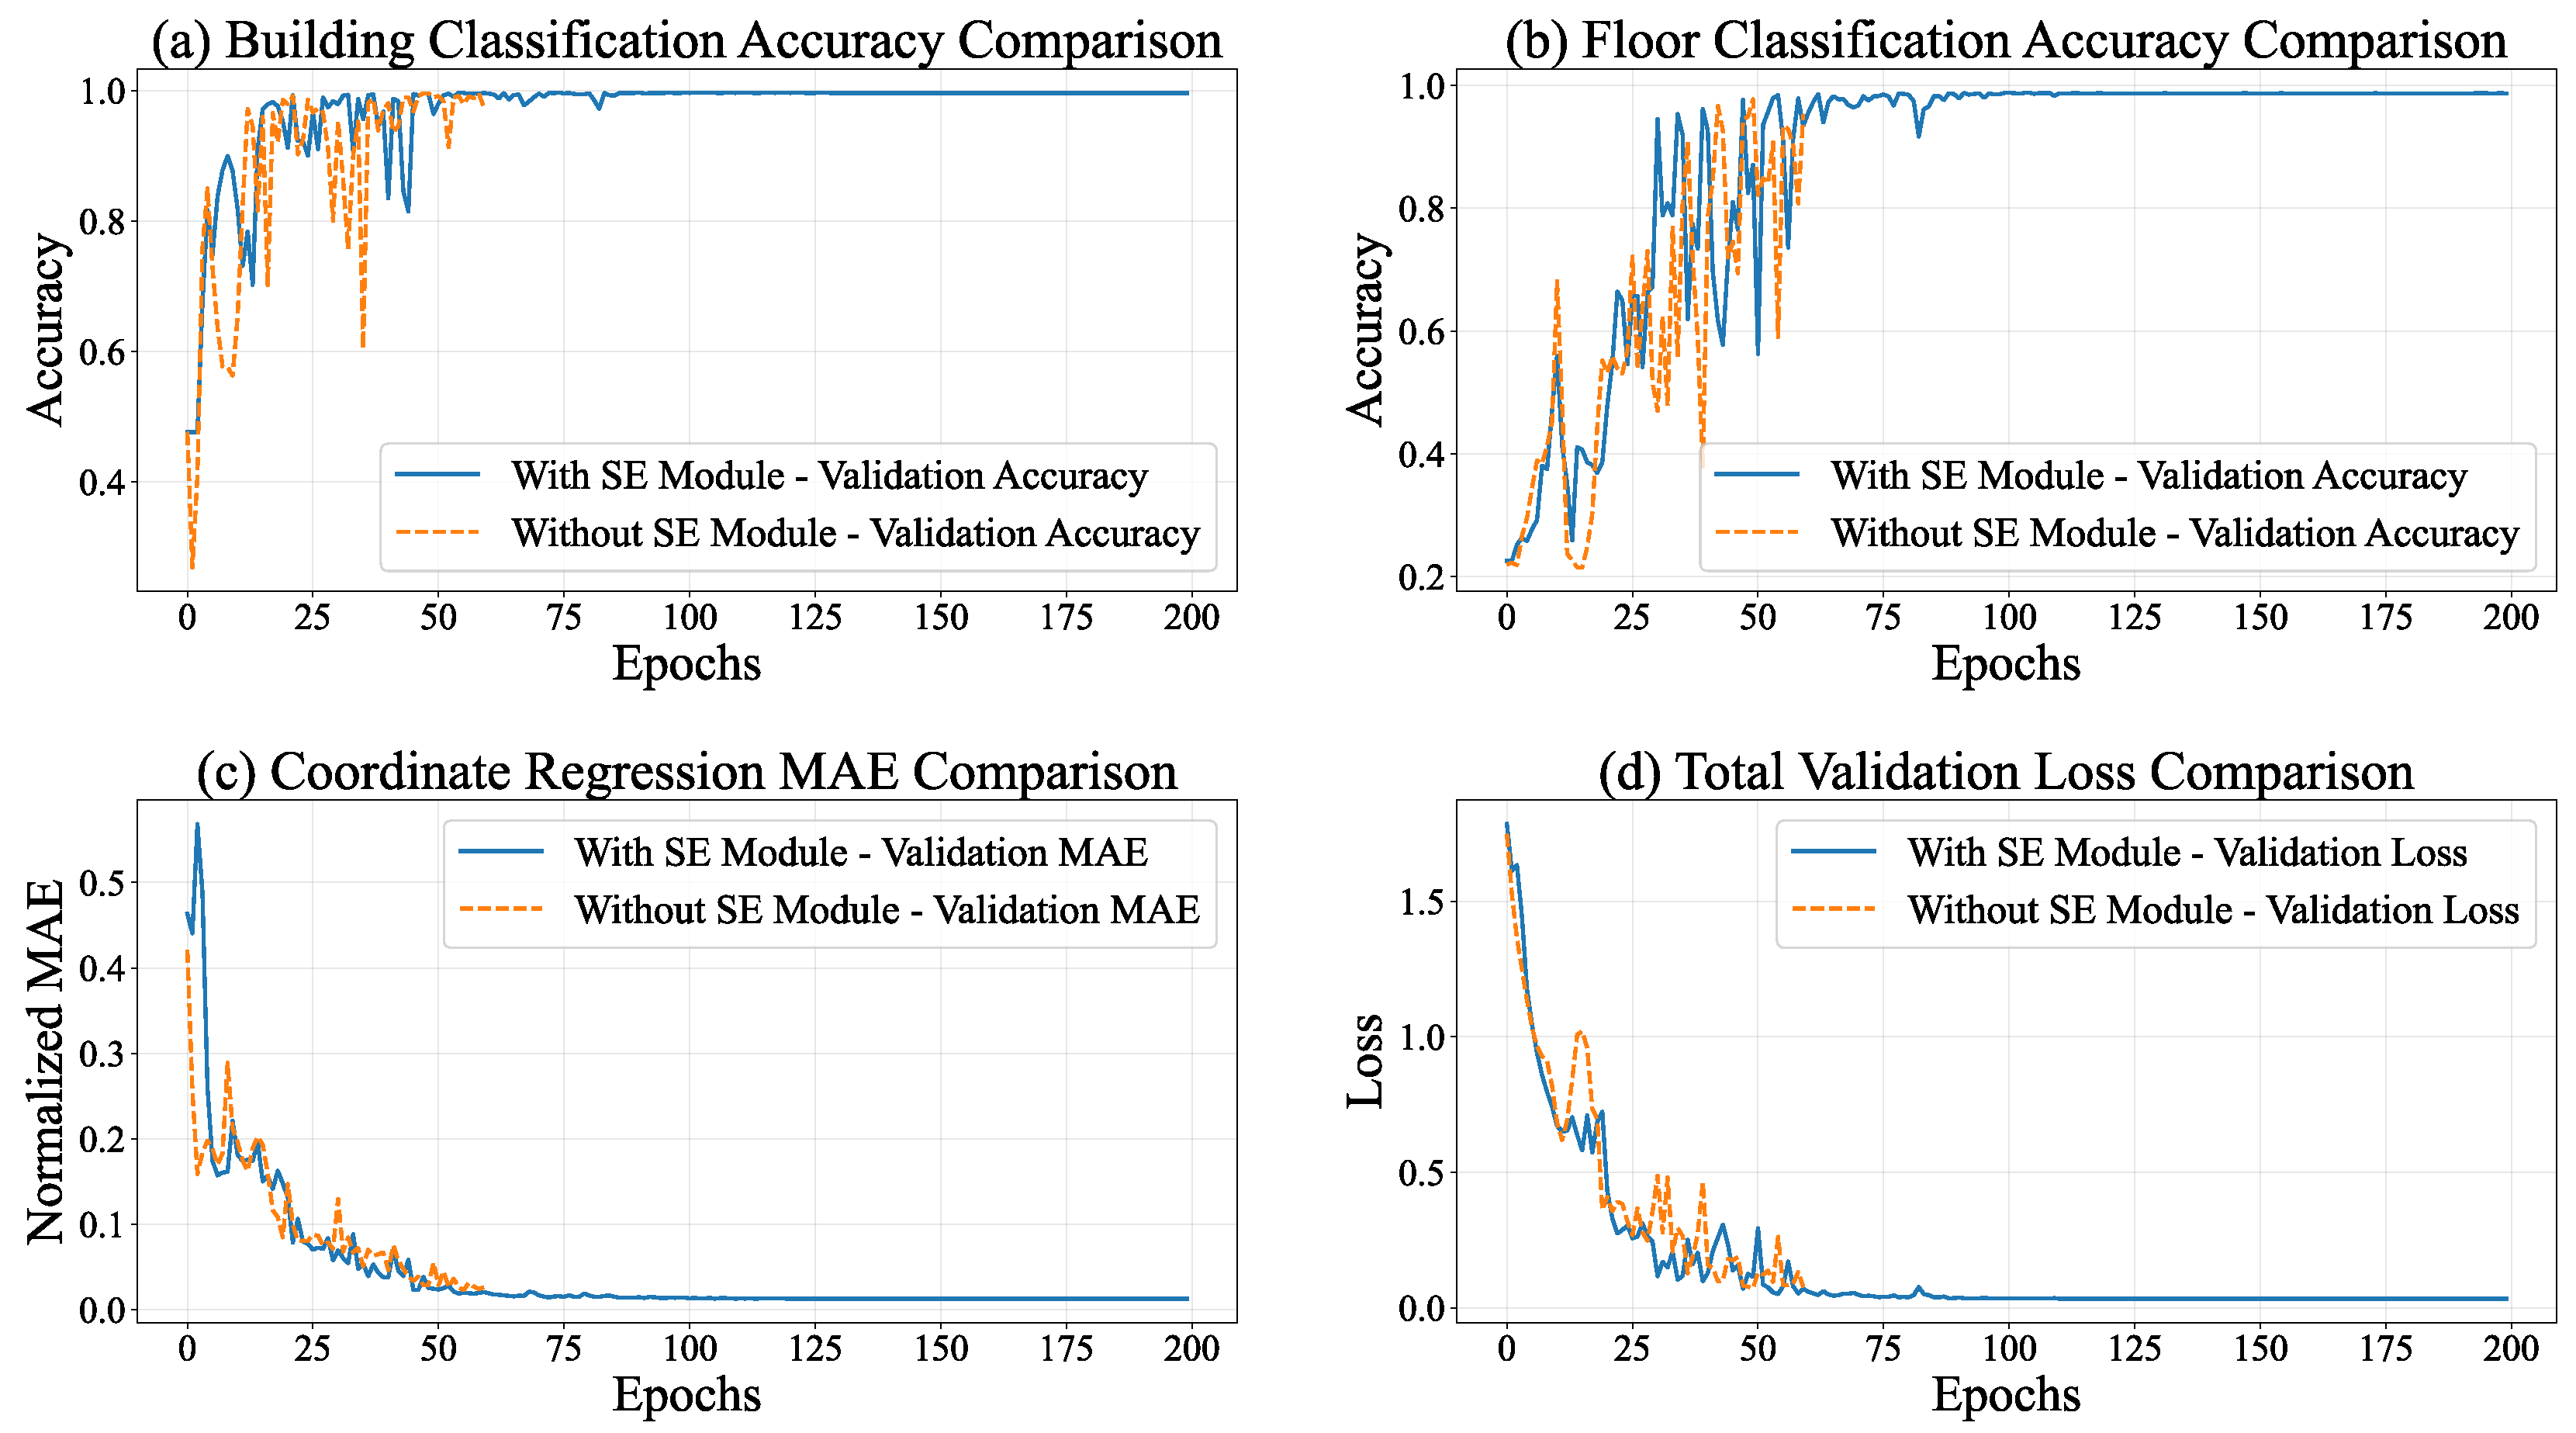
Figure 7.
Change curves of key metrics for training and testing.
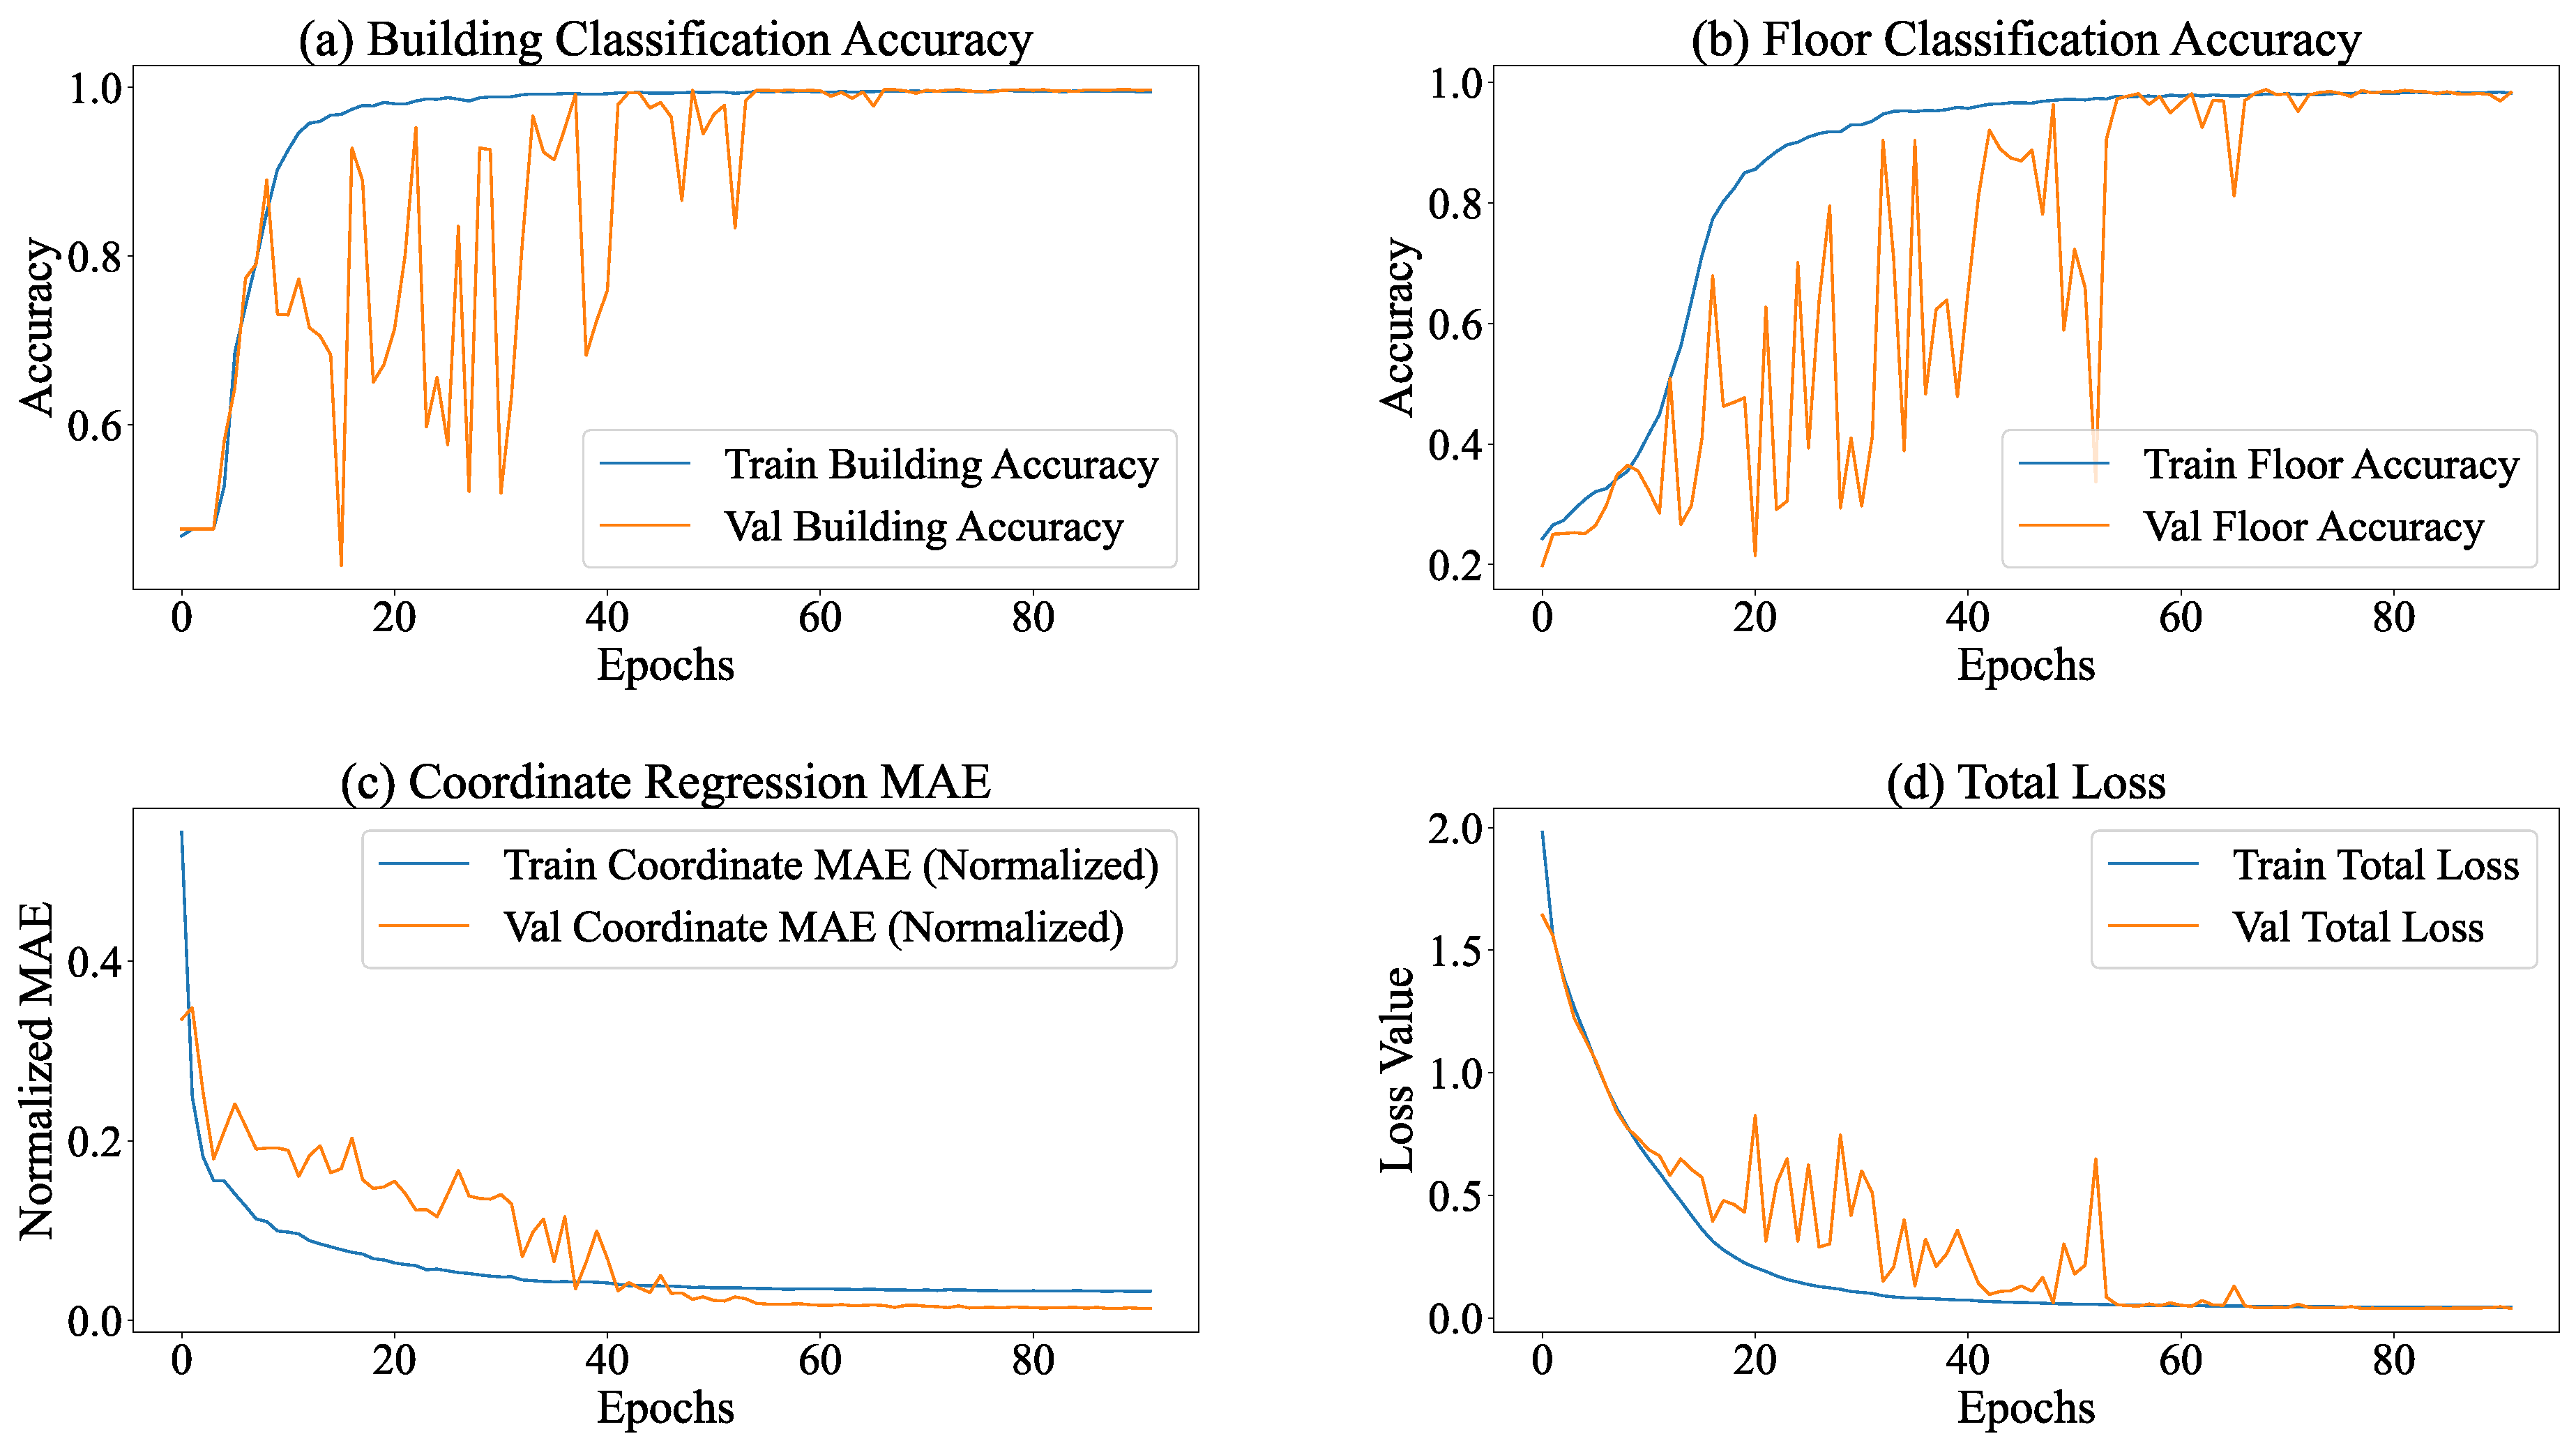
Figure 8.
Normalized Confusion Matrix for Building Classification.
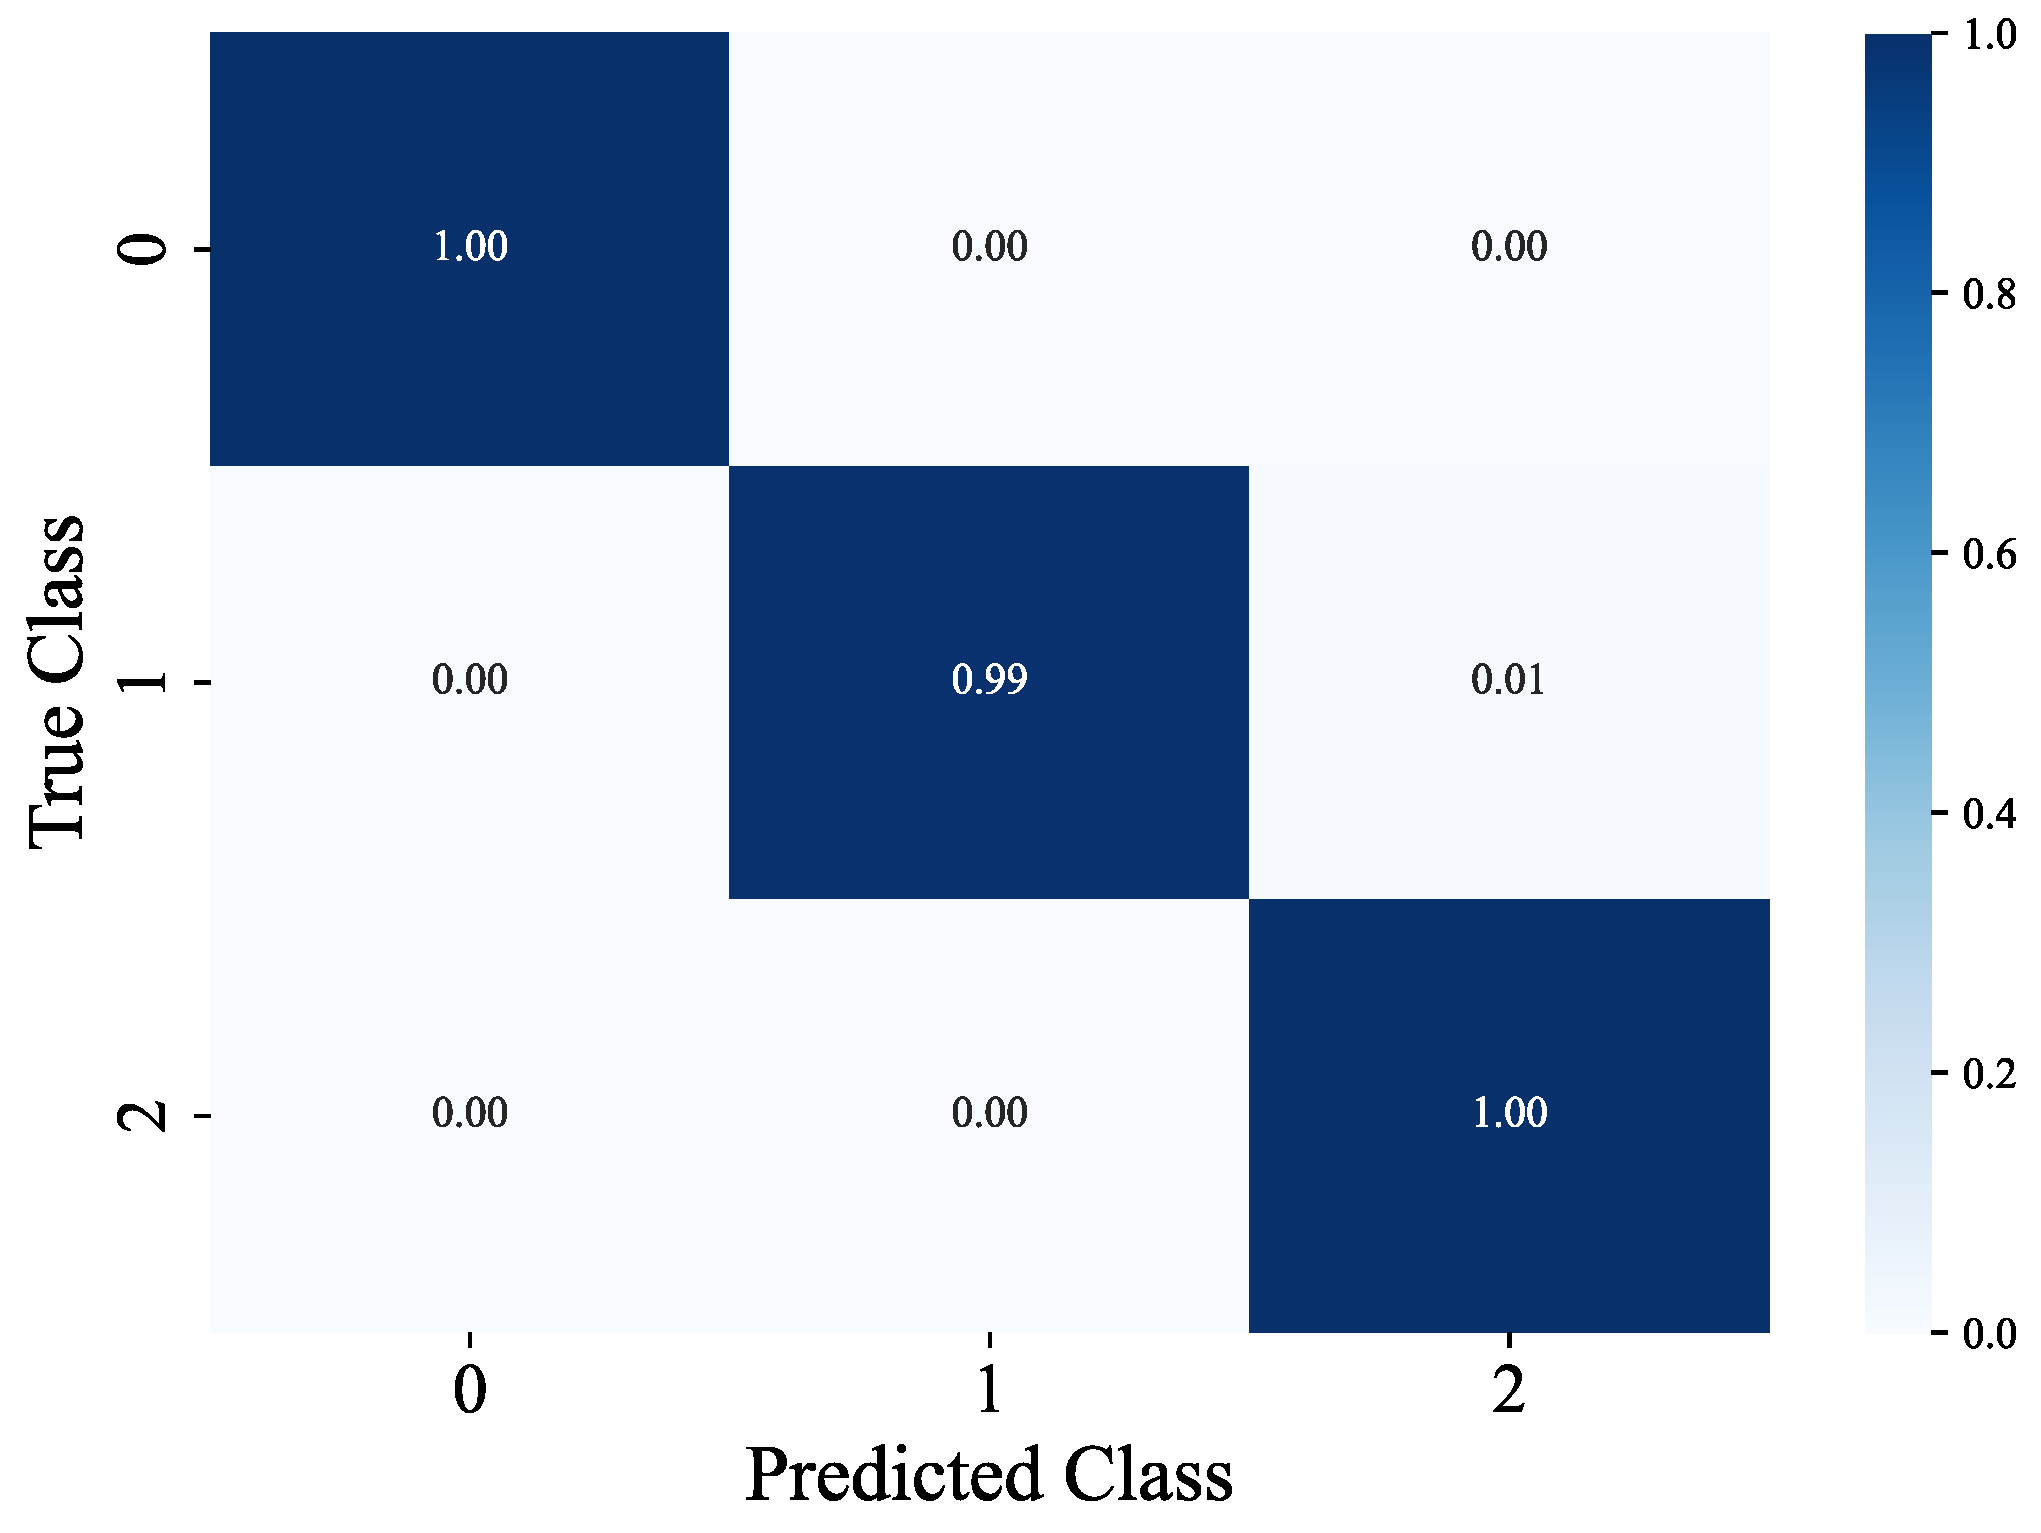
Figure 9.
Normalized Confusion Matrix for Floor Classification.
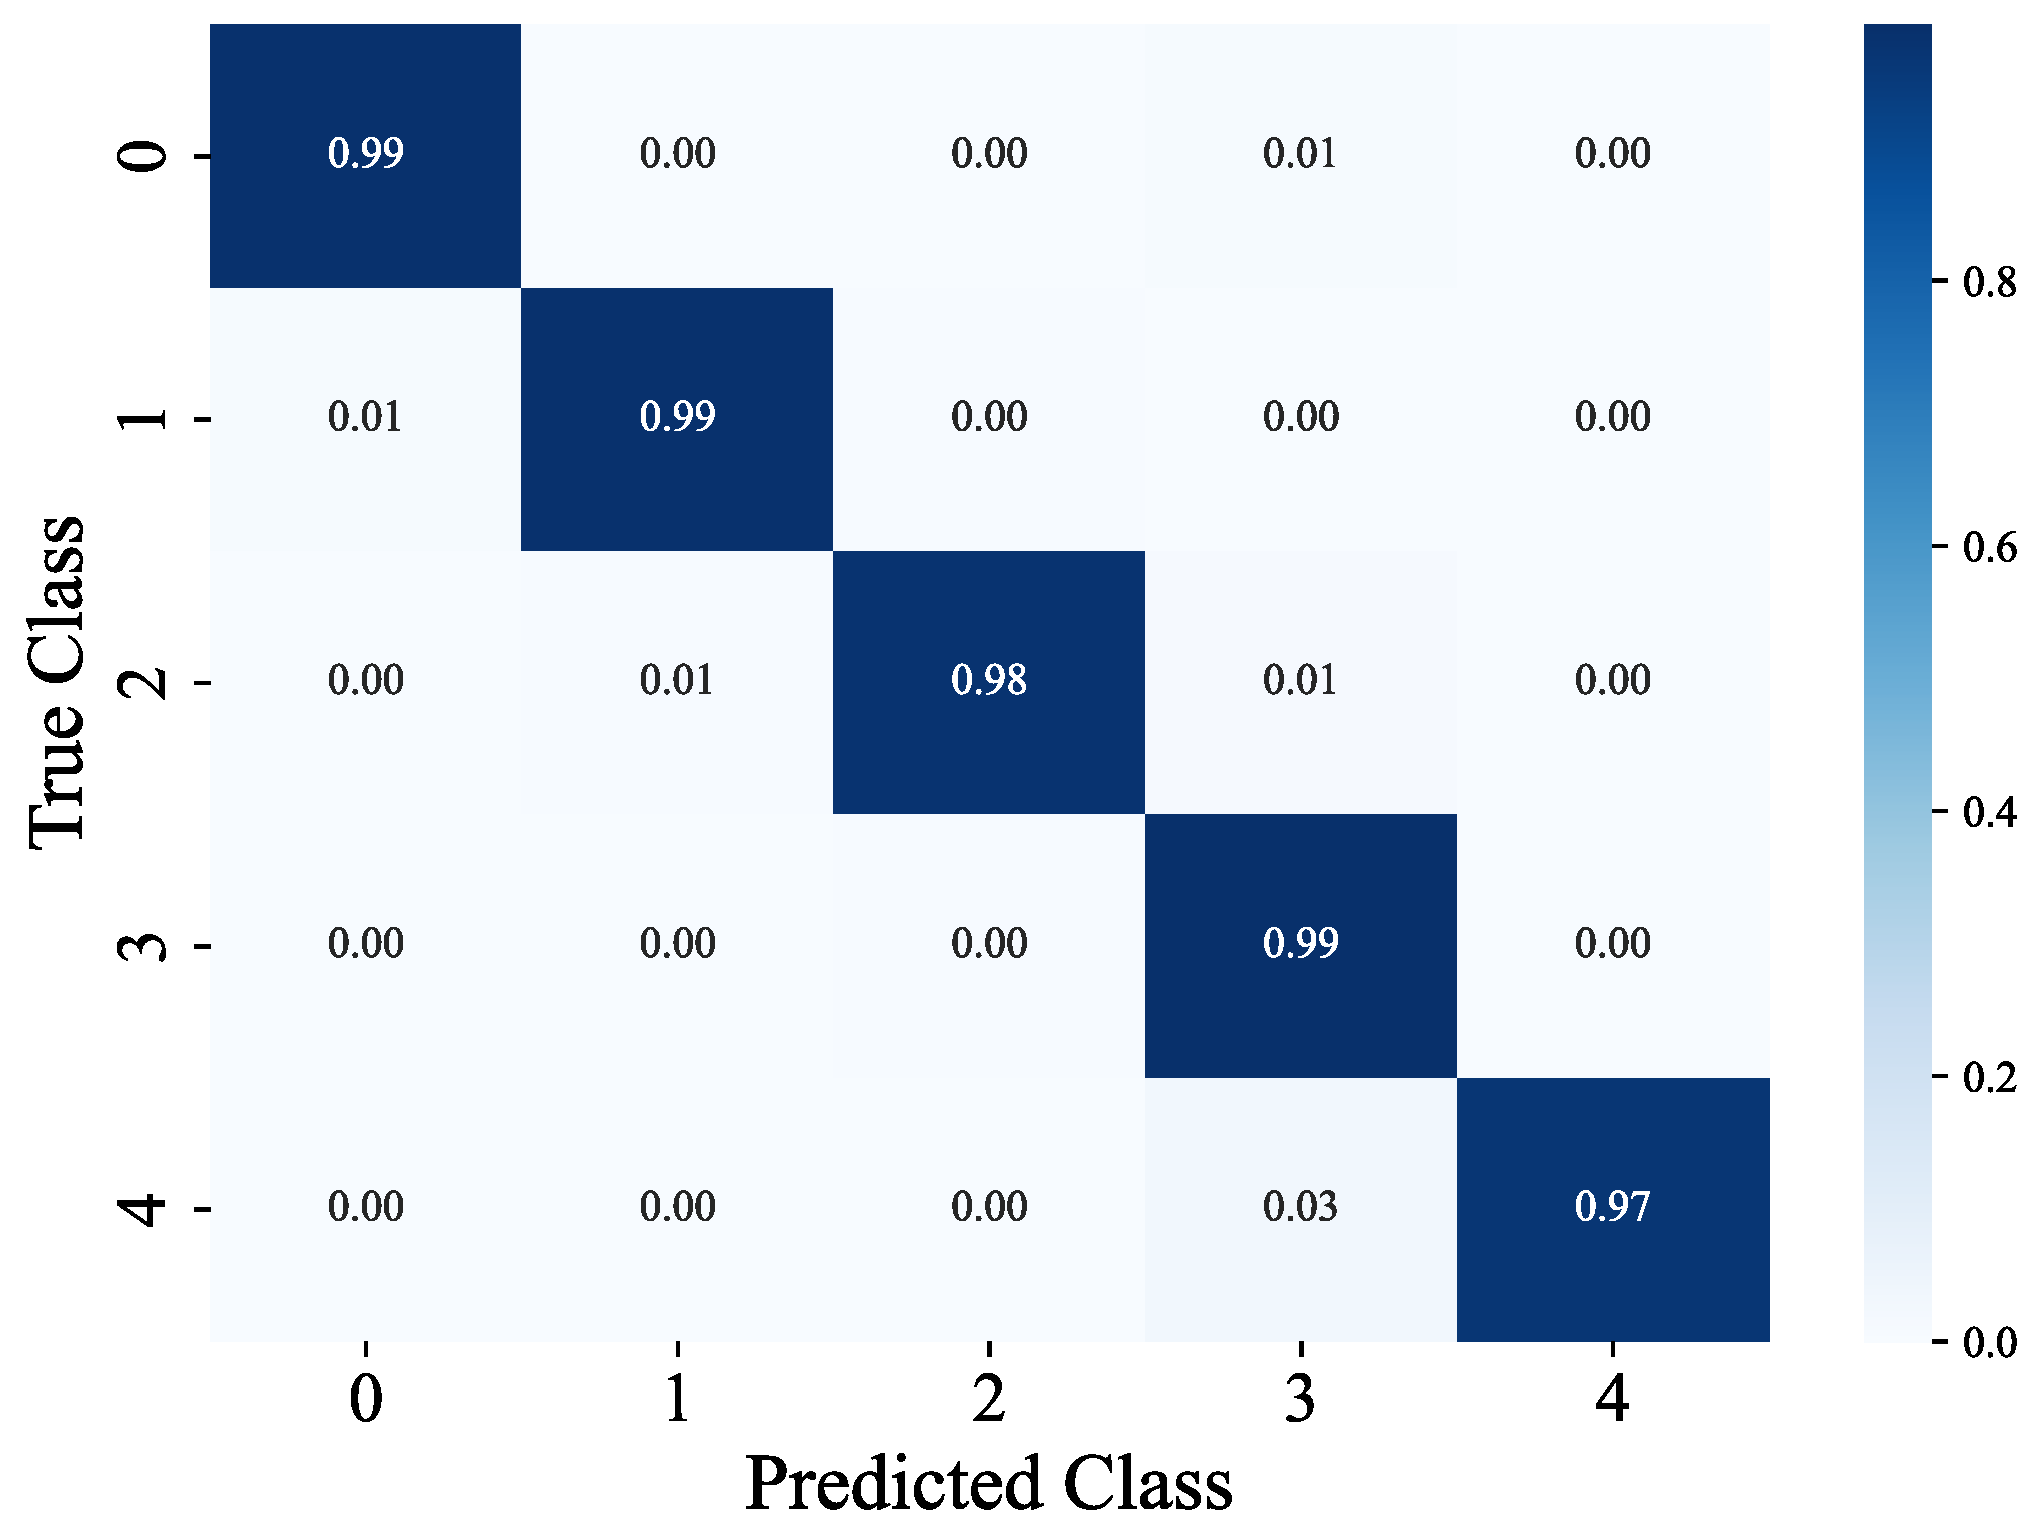

Table 1.
Indoor Localization Studies by Wi-Fi RSSI.
| Study | Method | Dataset(Conditions) | Result |
|---|---|---|---|
| [2] | HADNN | UJIIndoorLoc [24] | 100% building accuracy |
| 93.15% floor accuracy | |||
| 14.93m Mean Error | |||
| TUT2017 [25] | 94.58% floor accuracy | ||
| 9.05m Mean Error | |||
| TUT2018 [26] | 98.06% floor accuracy | ||
| 9.91m Mean Error | |||
| [11] | 2D-CAE | 2010 Outdoor RTI [27] | 100% accuracy |
| [12] | 2D-CDAE, CNN | UJIIndoorLoc [24] | 99.6% building accuracy |
| 95.3% floor accuracy | |||
| 12.4m Mean Error | |||
| [13] | 2D-CAE, CNN | UJIIndoorLoc [24] | 99.4% building accuracy |
| 90.5% floor accuracy | |||
| 9.5m Mean Error | |||
| Tampere [25] | 88.9% floor accuracy | ||
| 10.24m Mean Error | |||
| [10] | SAE, DNN | UJIIndoorLoc [24] | 99.82% building accuracy |
| 91.27% floor accuracy | |||
| 9.29m Mean Error | |||
| [2] | LCVAE, CNN | UJIIndoorLoc [24] | 98.80% floor accuracy |
| 6.79m Mean Error | |||
| Tampere [25] | 97.22% floor accuracy | ||
| 5.44m Mean Error | |||
| Ours | 2D-SE-CAE, CNN | UJIIndoorLoc [24] | 99.57% building accuracy |
| 98.57% floor accuracy | |||
| 5.23m Mean Error | |||
| TUT2018 [26] | 98.13% floor accuracy | ||
| 6.16m Mean Error |
Table 2.
The influence of the attention mechanism on classification accuracy and regression MAE.
| Attention Mechanism | Building Accuracy | Floor Accuracy | MAE(m) |
|---|---|---|---|
| NO Attention Mechanism | 99.45% | 97.72% | 5.83 |
| SE Attention Mechanism | 99.57% | 98.57% | 5.23 |
Table 3.
Experimental Metrics for Different Tasks (Without Validation Set Column).
| Task Type | Training Set Metrics | Test Set Metrics |
|---|---|---|
| Building Classification | Accuracy 99.64%, Loss 0.0146 | Accuracy 99.57%, F1=0.998 |
| Floor Classification | Accuracy 98.34%, Loss 0.0635 | Accuracy 98.57%, F1=0.990 |
| Coordinate Regression | MAE=0.0177 (normalized) | MAE=5.23m (physical space) |
Table 4.
Comparison of Different Methods based on the UJIIndoorLoc dataset.
| Comparison Method | Building Accuracy | Floor Accuracy | MAE (m) |
|---|---|---|---|
| HADNN (2020) [2] | 100% | 93.15% | 14.93 |
| CCpos (2021) [12] | 99.6% | 95.3% | 12.4 |
| CAE+CNN (2024) [13] | 99.40% | 90.50% | 9.50 |
| LCVAE-CNN (2025) [2] | - | 98.80% | 6.79 |
| Ours | 99.57% | 98.57% | 5.23 |
Disclaimer/Publisher’s Note: The statements, opinions and data contained in all publications are solely those of the individual author(s) and contributor(s) and not of MDPI and/or the editor(s). MDPI and/or the editor(s) disclaim responsibility for any injury to people or property resulting from any ideas, methods, instructions or products referred to in the content. |
© 2025 by the authors. Licensee MDPI, Basel, Switzerland. This article is an open access article distributed under the terms and conditions of the Creative Commons Attribution (CC BY) license (http://creativecommons.org/licenses/by/4.0/).
Copyright: This open access article is published under a Creative Commons CC BY 4.0 license, which permit the free download, distribution, and reuse, provided that the author and preprint are cited in any reuse.


