
Submitted:
15 September 2024
Posted:
17 September 2024
You are already at the latest version
Abstract
With the urgent need of precise positioning faced by internet of things (IoT) applications, the universality and cost of indoor positioning devices become key factors. Since the 5G network has been widely deployed, new opportunity is brought by tightly fusing the traditional low-cost sensors, i.e., the magnetometer. In this study, using 5G channel state information (CSI) and geomagnetic data, a multi-input convolutional neural network (CNN) localization system was proposed. First, to generate a data tensor that is easy for CNN processing, the raw data was reconstructed individually. Then, to comprehensively incorporate the features of 5G CSI and geomagnetic strength data, the ReLU function was chosen as the activation function of the convolutional layer. After that, a multi-input CNN was trained using the incorporated geomagnetic strength and CSI amplitude in the off-line side, and the trained CNN was recorded as a location fingerprint, which can be used for the user position prediction. Finally, in the online side and using a multi-input CNN, the 2-D coordinates are estimated and tested indoors in a typical conference room scenario. The results showed that longer sampling time of fingerprint data result in better uniqueness of the reference point, while the data collection time of locating points does not need to be long. Taking the positioning efficiency and accuracy into consideration, a sampling time of 3s at the reference point and 0.2s at the locating point are recommended. The positioning accuracy using the proposed method was 1.41 m, with an improvement of 22.9% compared with the 5G positioning, and an improvement of 18.0% compared with the 5G and geomagnetic fusing positioning using single CNN.
Keywords:
5G channel state information
; low-cost magnetometer
; multi-input convolutional neural network
; fingerprint localization
; heterogeneous fusion
1. Introduction
The most common method used for indoor localization is fingerprint localization. In complex interior scenarios, the suggested technique does not require the detection of non-line-of-sight (NLOS) signals. For the purpose of location identification, it simply depends on the feature information of wireless signals [1]. Online matching and offline database generation are the two primary steps of the fingerprint localization approach [2]. One often used measurement of localization in fingerprint database is the received signal strength (RSS). It includes all of the effects of reflection, diffraction, and refraction combined with signal transmission [3]. In order to improve the uniqueness of signal characteristics and reduce the likelihood of false matches in localization, it is frequently crucial to evaluate the propagation characteristics of various signals. To find their resemblance, the measured information and the feature information kept in the fingerprint database must be compared throughout the fingerprint matching process. The Euclidean distance and the Manhattan distance are two of the main metrics used to evaluate feature similarity. Commonly used fingerprint matching methods include the nearest neighbor, k-nearest neighbor (KNN) and weighted k-nearest neighbor (WKNN) algorithms. Because deep learning algorithms are always improving, researchers are using more sophisticated methods, such as convolutional neural network (CNN), support vector regression, and clustering, for matching [4].
Wi-Fi signals are the most popular option for improving the usability of fingerprint localization systems because of their low cost, simplicity of setup, and broad compatibility [5]. The extensive adoption of the fifth-generation mobile communication network (5G) has attracted a lot of attention because of the technologies’ novel access methods, high frequency, extensive broadband, and ultra-reliability [6]. In particular, cutting-edge location options are provided by the 5G new radio (NR)[7]. The fine-grained signal propagation characteristics of wireless communication links can be reflected by 5G channel state information (CSI). Specifically, the multi-subcarrier characteristics of CSI have been confirmed to support the development of more widely used indoor localization applications [8]. The complex interior environment has a significant impact on the positioning accuracy of a single positioning signal source. The geomagnetic field can be interfered with in indoor situations by magnetic materials like steel, iron, and alloy compounds found in structures. This disturbance results in geomagnetic anomalies, which change the distribution of magnetic fields in various places [9]. As a result, these abnormalities provide a new source of signal for fingerprint localization. By combining CSI with geomagnetic signals, location fingerprints could become more unique and localization errors could be reduced significantly. In order to establish information fusion based on the model of the observed value function, two popular multi-sensor fusion localization algorithms, Kalman filtering and factor graph algorithms, have been employed extensively in a variety of domains, including satellite localization [10,11]. Fuzzy theory is the foundation of deep learning algorithms, which use a lot of training to find the best match between input and output. Significant progress has been made in deep learning-based information fusion algorithms as a result of the development of big data technologies and the wide range of sensor types [12]. The commonly used CNN method consists of repeatedly modifying observations to find hidden patterns in the data with the ultimate goal of achieving fusion [13]. However, because CSI and geomagnetic signals have different strengths in terms of signal values and sensor output frequencies, synchronization processes such multi-sensor data alignment, interpolation, or thinning are required. Regretfully, these procedures make the data fusion process less useful.
In this regard, the purpose of this article is to explore a localization system that can efficiently combine several sensors to estimate the whereabouts of mobile devices. We only use two types of sensors: 5G and geomagnetic, because indoor environments are so complex. We then go on and conduct field tests in indoor spaces to confirm that the suggested method. We have developed a system that can be adjusted to work with more kind of sensors. With the use of suitable data input interfaces, sensors with various output frequencies and numerical scales can be effectively fused together. Additionally, this positioning method is not constrained by the network and can provide location services to multiple users at the same time and place. It is therefore perfect for emergency rescue missions and other critical circumstances. Moreover, this method provides accurate placement for objects that can be combined with optical and inertial navigation, which are frequently utilized in mobile robots [14], in order to satisfy the need for increased localization accuracy.
The following are the main contributions:
1. Fusing the two types of data, the widely utilized 5G signal and the geomagnetic signal, lowers the cost of indoor localization without requiring the deployment of additional base stations.
2. A fingerprint database is created for the CSI and geomagnetic component data separately based on the Multi-CNN fusion localization model. Various CNN branches are then employed for feature extraction, which maximizes the retention of the data’s inherent features and enhances the localization performance.
3. Field tests were carried out in two distinct environments, a conference room and a hall, and the localization and data collection strategies were created to satisfy the needs of indoor robot navigation.
The sections that follow are organized as follows: This paper’s Section II looks at recent developments in fingerprint localization as well as the basic methods that are already in use. It also gives a thorough rundown of the multi-input CNN’s technical features. The fusion principle of merging geomagnetic data with CSI using a multi-input CNN network is presented in Section III of the article. In Section IV, empirical research is conducted in two different settings: a conference room and a teaching building hall. The results are then thoroughly analyzed. The article is summarized in Section V.
2. Related Work
Two forms of wireless signal data are employed in fingerprint localization: RSS and CSI. The superposition value of multiple effects in the wireless signal propagation is known as the RSS, and it is a type of coarse-grained information. It fluctuates with time at a fixed site, with a maximum variation of 30 dBm [15]. Moreover, it should be mentioned that every single transmitter can only provide one RSS number. As a result, many base station (BS) deployments are required to get improved accuracy. It can be said that localization systems based on RSS fingerprinting perform poorly and show a limited precision location. CSI is a information subset of comprehensive physical layer that makes it possible to gather subcarrier-level channel measurement data within a packet. This data offers an abundance of measurement information and can be obtained from a single base station. Moreover, it is noteworthy that when considering stationary sites, CSI demonstrates stronger constancy in received data than RSS. Studies have revealed that the accuracy of indoor location estimation using CSI in the same environment is significantly higher than RSS [16]. Using the KNN approach, Song et al. [17] used the CSI amplitude as a unique identifier for localization purposes. The localization performance attained by the authors was superior to that of RSS approaches. Nevertheless, because of its computational complexity, the KNN algorithm faces difficulties with categorization. It requires calculating the distances between every point and every other sampled location, which adds significantly to the computing load. Moreover, the probability of misclassification is increased when there is an unbalanced sample size. In order to deploy 5G positioning system, a large number of base station antennas must be integrated with signal processing methods that depend on measured CSI. This method offers a wider variety of CSI feature information and improves the efficacy of CSI signals [18,19].
It is not necessary to use additional hardware or infrastructure because indoor magnetic fields are commonly present. These days, geomagnetic data collection on cellphones is possible with minimal interference from the environment, continuous temporal stability, and positional fluctuations [20]. He et al. [21] combined the idea of deep learning-based image recognition with the creation of heat maps from geomagnetic sequences. Using deep learning methods, this technique made geomagnetic localization possible. Remarkably, the attained localization accuracy exceeded 1 m. However, the narrow set of properties of geomagnetic matching limits its usefulness. This constraint makes it unable to discern between different situations with enough accuracy, which results in mismatching and major errors. Yeh et al. [22] collect geomagnetic intensity using the smartphone’s built-in geomagnetic field sensor, offer location services in interior spaces like airports, and identify mobile phones using KNN with a 71.3% accuracy rate.
Due to poor differentiation capabilities, it is observed that certain wireless signal data inside the fingerprint library may correspond to many locations in circumstances when the localization range is large. As a result, there are notable errors that arise from this lack of differentiation. Scholars have investigated the integration of various sensor data to improve the accuracy of position estimation. The integration of geomagnetic and WiFi RSS data was accomplished by Zhang [23] using a deep neural network (DNN), which resulted in a significant reduction in the degree of similarity observed across reference sites. However, due to the low RSS data, more base stations must be deployed in order to obtain sufficient fingerprint information. This technique is influenced by the environment in which it operates. Furthermore, the two sensors cannot be directly integrated into the DNN due to their different type measurements. As such, scaling of the fingerprint data is required before training. Using geomagnetic strength and CSI amplitude data as the CNN’s input, Wang et al. [24] were able to attain positioning precision with an average positioning error of 1.2 m. However, CSI data has to be compressed during the fusion process in order to combine two different, large datasets. Sadly, this method was unable to fully capitalize on the wealth of data that CSI measurements were able to gather.

Table 1.
Recent studies on fingerprint positioning.
| Research work | Ref. | Input | Algorithm | Performance |
| Zhang H et al. (2022) | [25] | RSS | WAKNN-HIF | Mean error: 1.19 m |
| Wu S X et al. (2022) | [26] | RSS | CNN, virtual-AP | Error < 2 m, 95% |
| Liu Y T et al. (2021) | [27] | RSS | Auto-encoder, LSTM | Error < 1 m, 68% |
| Wang B Y et al. (2020) | [28] | RSS | APD-WKNN | Error < 1 m, 70.53% |
| Nkabiti K et al. (2021) | [29] | CSI | SAMFI | Accuracy rate: 86.5% |
| Zhang B et al. (2022) | [30] | CSI | AARes-CNN | Accuracy improved by about 30% |
| Huang X L et al. (2023) | [31] | CSI | PSO-BPNN | Mean error: 1.19 m |
| Huang X D et al. (2017) | [32] | CSI, GS | MDSKNN | Mean error: 1.4 m |
| Wang Y et al. (2018) | [24] | CSI, GS | CNN | Mean error: 1.2 m |
| Peihao L et al. (2020) | [33] | CSI, GS | M-KNN, DTW | Mean error < 0.5 m |
(SAMFI: self-attention mechanism; GS: geomagnetic strength; AARes-CNN: attention-augmented residual CNN; MDSKNN: multi-dimensional scaling k-nearest neighbor; M-KNN: multi-module data k-nearest neighbor).
This work offers a recommended method for successfully fusing geomagnetic and CSI data in order to fully extract fingerprint data features. The technique, which is intended for positioning applications, is based on Multi-CNN. The Multi-CNN model is able to analyze data from multiple sensors at the same time, including but not limited to text and images, audio, and video. The use of multimodal input enables the model to obtain a more comprehensive and refined feature representation, hence augmenting the model’s resilience. Seismic burst recognition and bearing fault diagnosis are two domains where Multi-CNN has proven to be superior to single-input CNN. The Multi-CNN architecture has the powerful image recognition powers that come with CNN. It can create different network branches according to different data sources. This makes it possible to separately extract spatial information from any data source. Then, model fusion is executed, which improves the model’s ability to efficiently handle the distinct features of complicated datasets. As a result, the model’s capacity for generalization is enhanced. Therefore, it can be utilized to accomplish the unification of various data sources.
3. Methodology
The flow chart of the approach is depicted in Figure 1, illustrating the several stages involved, including data collection and preprocessing, neural network training, and online real-time localization. Initially, the collection of 5G raw data and geomagnetic intensity data is undertaken. Subsequently, the extraction of CSI amplitude information and three-axis geomagnetic intensity data is performed in order to generate a composite location fingerprint. In order to streamline subsequent CNN processing and organize the data into tensor-type format that is conducive to network processing. In order to streamline subsequent CNN processing and organize the data into tensor-type format that is conducive to network processing. During the training phase of the neural network, the input layer consists of tensor data representing the amplitude of CSI and geomagnetic data. The output layer corresponds to the coordinates, and these inputs are fed into separate branches of CNN. The training outcomes are consistently enhanced by the adjustment of training durations and network architecture, while the integration of the two network branches forms a comprehensive Multi-CNN network. During the online real-time localization step, the test data is fed into the trained multi-input network in order to determine the coordinates of the point.
3.1. Data Collection and Preprocessing
The fundamental concept underlying fingerprint localization is to delineate distinct geographical positions by using the diverse data gathered at each specific site. The distinctiveness of the position is determined by the distinctiveness of the data characteristic, hence the creation of the fingerprint data significantly impacts the total localization outcome. In the context of applications, the accuracy of fingerprint localization may be improved by extending the data sampling period and upgrading the sensor type, hence enhancing the fingerprint data characteristics. Nevertheless, the practical utility of fingerprint localization is diminished as the data sampling period is extended. Hence, it is important to thoroughly evaluate both the timeliness and accuracy aspects of localization.
This section describes the sampling and preprocessing of CSI and geomagnetic data.
3.1.1. CSI Data Processing
CSI is a channel attribute of a communication link, and CSI data can be obtained by demodulating the baseband signal through OFDM. In this paper, a set of CSI data is 60 discrete samples of the channel frequency response (CFR) of a 5G NR signal. The first sampled CSI data can be expressed as
where denotes the CSI at center frequency , and are the amplitude and phase of the first subcarrier, .
The collected data after processing can be represented by the matrix (Equation 2). Each element of the matrix is represented in complex form, so the amplitude information of each carrier . When constructing the data fingerprint library, the initial CSI is a discrete numerical matrix that cannot be directly inputted into the CNN, so it needs to be preprocessed and added with location labels to construct a complete location fingerprint data
The CSI encompasses the signal propagation attributes between the transmitting and receiving entities, encompassing factors such as signal scattering, environmental attenuation, distance attenuation, and related details. The amplitude of CSI is subject to variation and inconsistency due to the intricate and diverse nature of the propagation environment. This variability arises from the multiple pathways by which the signal propagates. However, it is observed that the CSI amplitude remains reasonably consistent over time at a certain site. Figure 2 illustrates the CSI amplitude pictures captured at two distinct places. The amplitude of the 60 subcarriers at the same location exhibits a relatively consistent stability over time. Furthermore, the variation pattern of CSI amplitude differs across different locations. This characteristic can be leveraged to effectively capture changes in location by monitoring CSI variations, thereby establishing a mapping relationship between CSI and location.
3.1.2. Geomagnetic Data Processing
The spatial distribution features of the Earth’s magnetic field may be inferred from geomagnetic intensity. It is crucial to acknowledge that geomagnetic data in interior settings can be influenced by the presence of steel-framed building structures, such as reinforced concrete, leading to the occurrence of geomagnetic anomalies. However, this abnormality imparts a distinctive texture to the adjacent structures, hence enabling its utilization for indoor fingerprint location. Furthermore, unlike the propagation paths of wireless signals, which can be influenced by the spatial arrangement of indoor objects, the geomagnetic data remains unaffected by the intricate nature of indoor environments. Moreover, once the position of an object capable of generating magnetic fields is relatively established, the localization remains relatively stable. Figure 3 depicts the three-dimensional spatial arrangement of the geomagnetic field within a conference room. The unit of measurement employed in this context is μT, while the range of colors employed, transitioning from dark blue to dark red, serves to visually represent the progressive rise in magnetic field intensity. It is evident that there exists variation in geomagnetic intensity across different geographical regions. The steel reinforcement in close proximity to the load-bearing columns exhibits a high density, resulting in elevated magnetic interference intensity. Consequently, the magnetic field value inside the red area is notably greater compared to other regions. In regions located at a significant distance from the load-bearing columns, there is a discernible inclination for the magnetic field strength to diminish. This observation demonstrates that there exist variations in geomagnetic strength across different geographical regions, hence enabling the utilization of these intensity variances to represent distinctions in location.
The magnetometer employed in this study gathered geomagnetic data, namely the intensity values of the X, Y, and Z axis geomagnetic components, as well as the geomagnetic mode values. The coordinate system utilized is defined by the instrument itself. When the data-gathering device is oriented in a specific manner, its X-axis is positioned horizontally to the right, the Y-axis is oriented vertically upward, and the Z-axis, along with the X and Y axes, forms a right-handed, orthogonal coordinate system. Insufficient differentiation ability leads to the correspondence of geomagnetic intensity with various sites, as a consequence of the expanded gathering range. The geomagnetic triaxial and comprehensive intensity of several places exhibit consistent trends, as seen in Figure 4. The uniformity of comprehensive geomagnetic strength across various locations hinders the effective differentiation of magnetic field intensity variations caused by changes in position. Conversely, the distinctiveness of geomagnetic triaxial strength changes in different locations enables an effective description of positional changes. Therefore, this study opts for employing geomagnetic triaxial strength for the construction of geomagnetic fingerprints.
Since CNN have been shown to have excellent capabilities in image feature extraction, the triaxial component data of the geomagnetism was reconfigured before constructing the fingerprint library, and the initial geomagnetism data was formatted as (Equation (3)).
The initial data structure is reconstructed by the ‘reshape’ function. Firstly, the data on each axis component is taken out and filled into a matrix in order. Subsequently, the three axis components are combined using the ‘Vstack’ function to create the desired data format. Lastly, position labels are incorporated into the dataset, resulting in the formation of a comprehensive fingerprint database.
3.2. Multi-CNN
The effectiveness of placement is directly influenced by the performance of the matching algorithm. Given the inherent limitations of the low-cost geomagnetic sensor in terms of accuracy, it becomes imperative to undertake algorithm modification in order to enhance the precision of location. This section provides an overview of the network design and the various parameter settings connected to the network.
3.2.1. Network Architecture Setup
Figure 5 shows the schematic diagram of the Multi-CNN framework. The model is constructed based on ‘Keras API’, where the two input branches are the CSI magnitude and the reconfigured geomagnetic triaxial component data. We set the two networks up to four and three convolutional layers, respectively, depending on the size of the data.
First, in order to fully extract the features of the input data, the two branches are designed as different network structures according to different data types. In order to speed up the convergence of the network, batch normalization (BN) is performed after each convolutional layer of the above two branches.
Then, due to the relatively small dimensions of the two datasets, the ‘padding’ parameter of the convolutional layer is set to ‘same’ in order to ensure that the input and output dimensions of the convolutional layer are the same. To further reduce the number of neurons, a ‘max-pooling’ layer is added before the full unfolding layer to obtain N sets of matrices of the format . The convolutional layer is then expanded by the ‘Flat’ parameter. It is then fully expanded and spliced into a one-dimensional array of by the ‘Flat’ function.
Finally, the ‘concatenate’ function is used to concatenate the two sets of data. After the number of elements is large, add ‘Dropout’ to randomly discard some neurons to prevent overfitting of the network. After adding multiple dense layers, the number of elements in the array can be significantly reduced after passing through multiple dense layers. After the fully connected layer, the mapping relationship between the output array and the corresponding position coordinates is established by the ‘Linear’ linear activation function, and the number of output neurons in the last dense layer is set to 2, representing x and y of the output position respectively.
3.2.2. Network Parameter Setting
The Multi-CNN architecture comprises of several CNN branches that operate independently of each other. Each branch is designed with distinct network structures that are tailored to the specific characteristics of the input data. The CNN architecture typically has three main components: the convolutional layer, the pooling layer, and the fully connected layer. To address various challenges, it is often important to create distinct configurations of the three layers and adjust the respective parameters to develop CNN models that are tailored to diverse applications.
- (1)
- Convolutional layer
The main function of the convolutional layer is to extract features from the input data through the utilization of convolutional kernels. Each convolution kernel is assigned to a specific channel and is responsible for extracting features from that channel independently. This method enhances the efficiency of the network’s forward computation. The process of convolution involves the continuous sliding of a kernel across an input matrix. During this process, the elements of the kernel are multiplied by the corresponding elements of the local matrix at each sliding location, and the resulting products are then summed.
where is the feature map of layer ; is the activation function; is the set of input feature maps; denotes the convolution operation; is the convolution kernel; is the bias. At the beginning of the operation, a convolution kernel is randomly generated and adjusted according to the loss in the backpropagation process. After several tests, the convolution kernel size is set to 3.
- (2)
- Activation function
Activation functions are a crucial component of neural networks as they facilitate the establishment of a functional link between the output of a higher-level node and the input of a lower-level node. The selection of the activation function has significant importance in neural networks. The Rectified Linear Unit (ReLU) is a type of piecewise linear function that falls under the category of unilateral suppression functions (Equation 5). It is known for its ability to enhance the training speed of neural networks by promoting sparse activation. Additionally, the derivative of the positive part of ReLU is constant and equal to 1, which effectively mitigates the issues of gradient vanishing and exploding during backpropagation. Hence, the authors of this article have chosen the ReLU function as the activation function for the convolution layer.
The final layer is the output layer, which is used for regression prediction. The output layer activation function is a ‘Linear’ function. Specifically, assuming that the final data after processing through the fully connected layer is , the expression for the predicted value is
where, is the weight parameter corresponding to the feature; is the bias term; is the predicted value used to distinguish the true value .
- (3)
- Optimizer
To improve the network’s loss function and update its hidden parameters using gradient information, it is necessary to establish an optimizer for the network. This study employs the adaptive moment estimation (Adam) technique for parameter optimization, which integrates the strengths of the ‘AdaGrade’ algorithm with the ‘RMSProp’ optimization algorithm. The thorough consideration of both the first and second moment estimation of the gradient is undertaken, followed by the calculation of the update step. Additionally, the preservation of previous gradient information is implemented to prevent convergence to the global optimum. The given expression represents a mathematical function.
where, and are the estimated values of the first and second moments of the gradient, respectively, and are the exponential decay rates of the current estimate, respectively, is the gradient calculated in this iteration.
Before the iteration, the estimates of the first and second moments can deviate significantly, so a correction is needed. The corrected function is shown as:
where, and are the corrected estimates of the first-order and second-order moments, respectively, is the current number of iterations.
After correction, the gradient can be updated to:
where, is the gradient, is the learning rate, is a small constant that avoids going to zero in the denominator.
- (4)
- Loss function
In order to measure the gap between the output value of the network model and the real value, and to adjust the corresponding parameters according to this gap, a loss function is required. The mean square error (MSE) loss function is the most commonly used loss function in regression calculation. The loss function index is MSE shown as:
where, and are the predicted and true values of the coordinates, respectively.
- (5)
- Batch_size and epoch
The appropriate setting for the batch size should be determined based on the magnitude of the data volume. If the batch size is insufficiently large, the convergence of the network will not be achieved. When the batch_size is increased over a certain threshold, the duration of each iteration is extended. The process of a whole data set passing through the neural network once and being returned once is referred to as an epoch. If the epoch size is insufficient, the frequency of weight updates in the neural network will decrease, resulting in an underfitted fitted curve that is not suitable for accurate regression prediction. When the epoch is excessively big, the time required for weight updates in the neural network will grow. Consequently, the fitting curve will exhibit over-fitting, which entails a satisfactory fit for the training dataset but a suboptimal fit for the test dataset. Hence, it is imperative to select an optimal batch size and epoch in order to minimize the loss function. Following a series of experimental evaluations, it has been determined that the optimal values for the epoch and batch_size parameters are 60 and 6, respectively.
4. Experiments Validation
In order to assess the accuracy of the suggested method’s positioning performance, a more effective technique for constructing finger-print data is initially chosen, employing a 5G sensor. Subsequently, the geo-magnetic sensor data is integrated to enhance the overall accuracy. Field testing often carried out within controlled indoor environments.
Table 1 displays the apparatus utilized in the conducted experiment. The device employed for the purpose of collecting geomagnetic data is the Wit-motion device. The sampling frequency of this device has been configured to operate at 100 Hz, while maintaining a magnetic field precision of 1 μT and 5G. The existing geomagnetic gathering applications on smartphones have demonstrated the capability to attain the same level of accuracy as dedicated devices as Physics Tools, in terms of sample frequency and data precision.
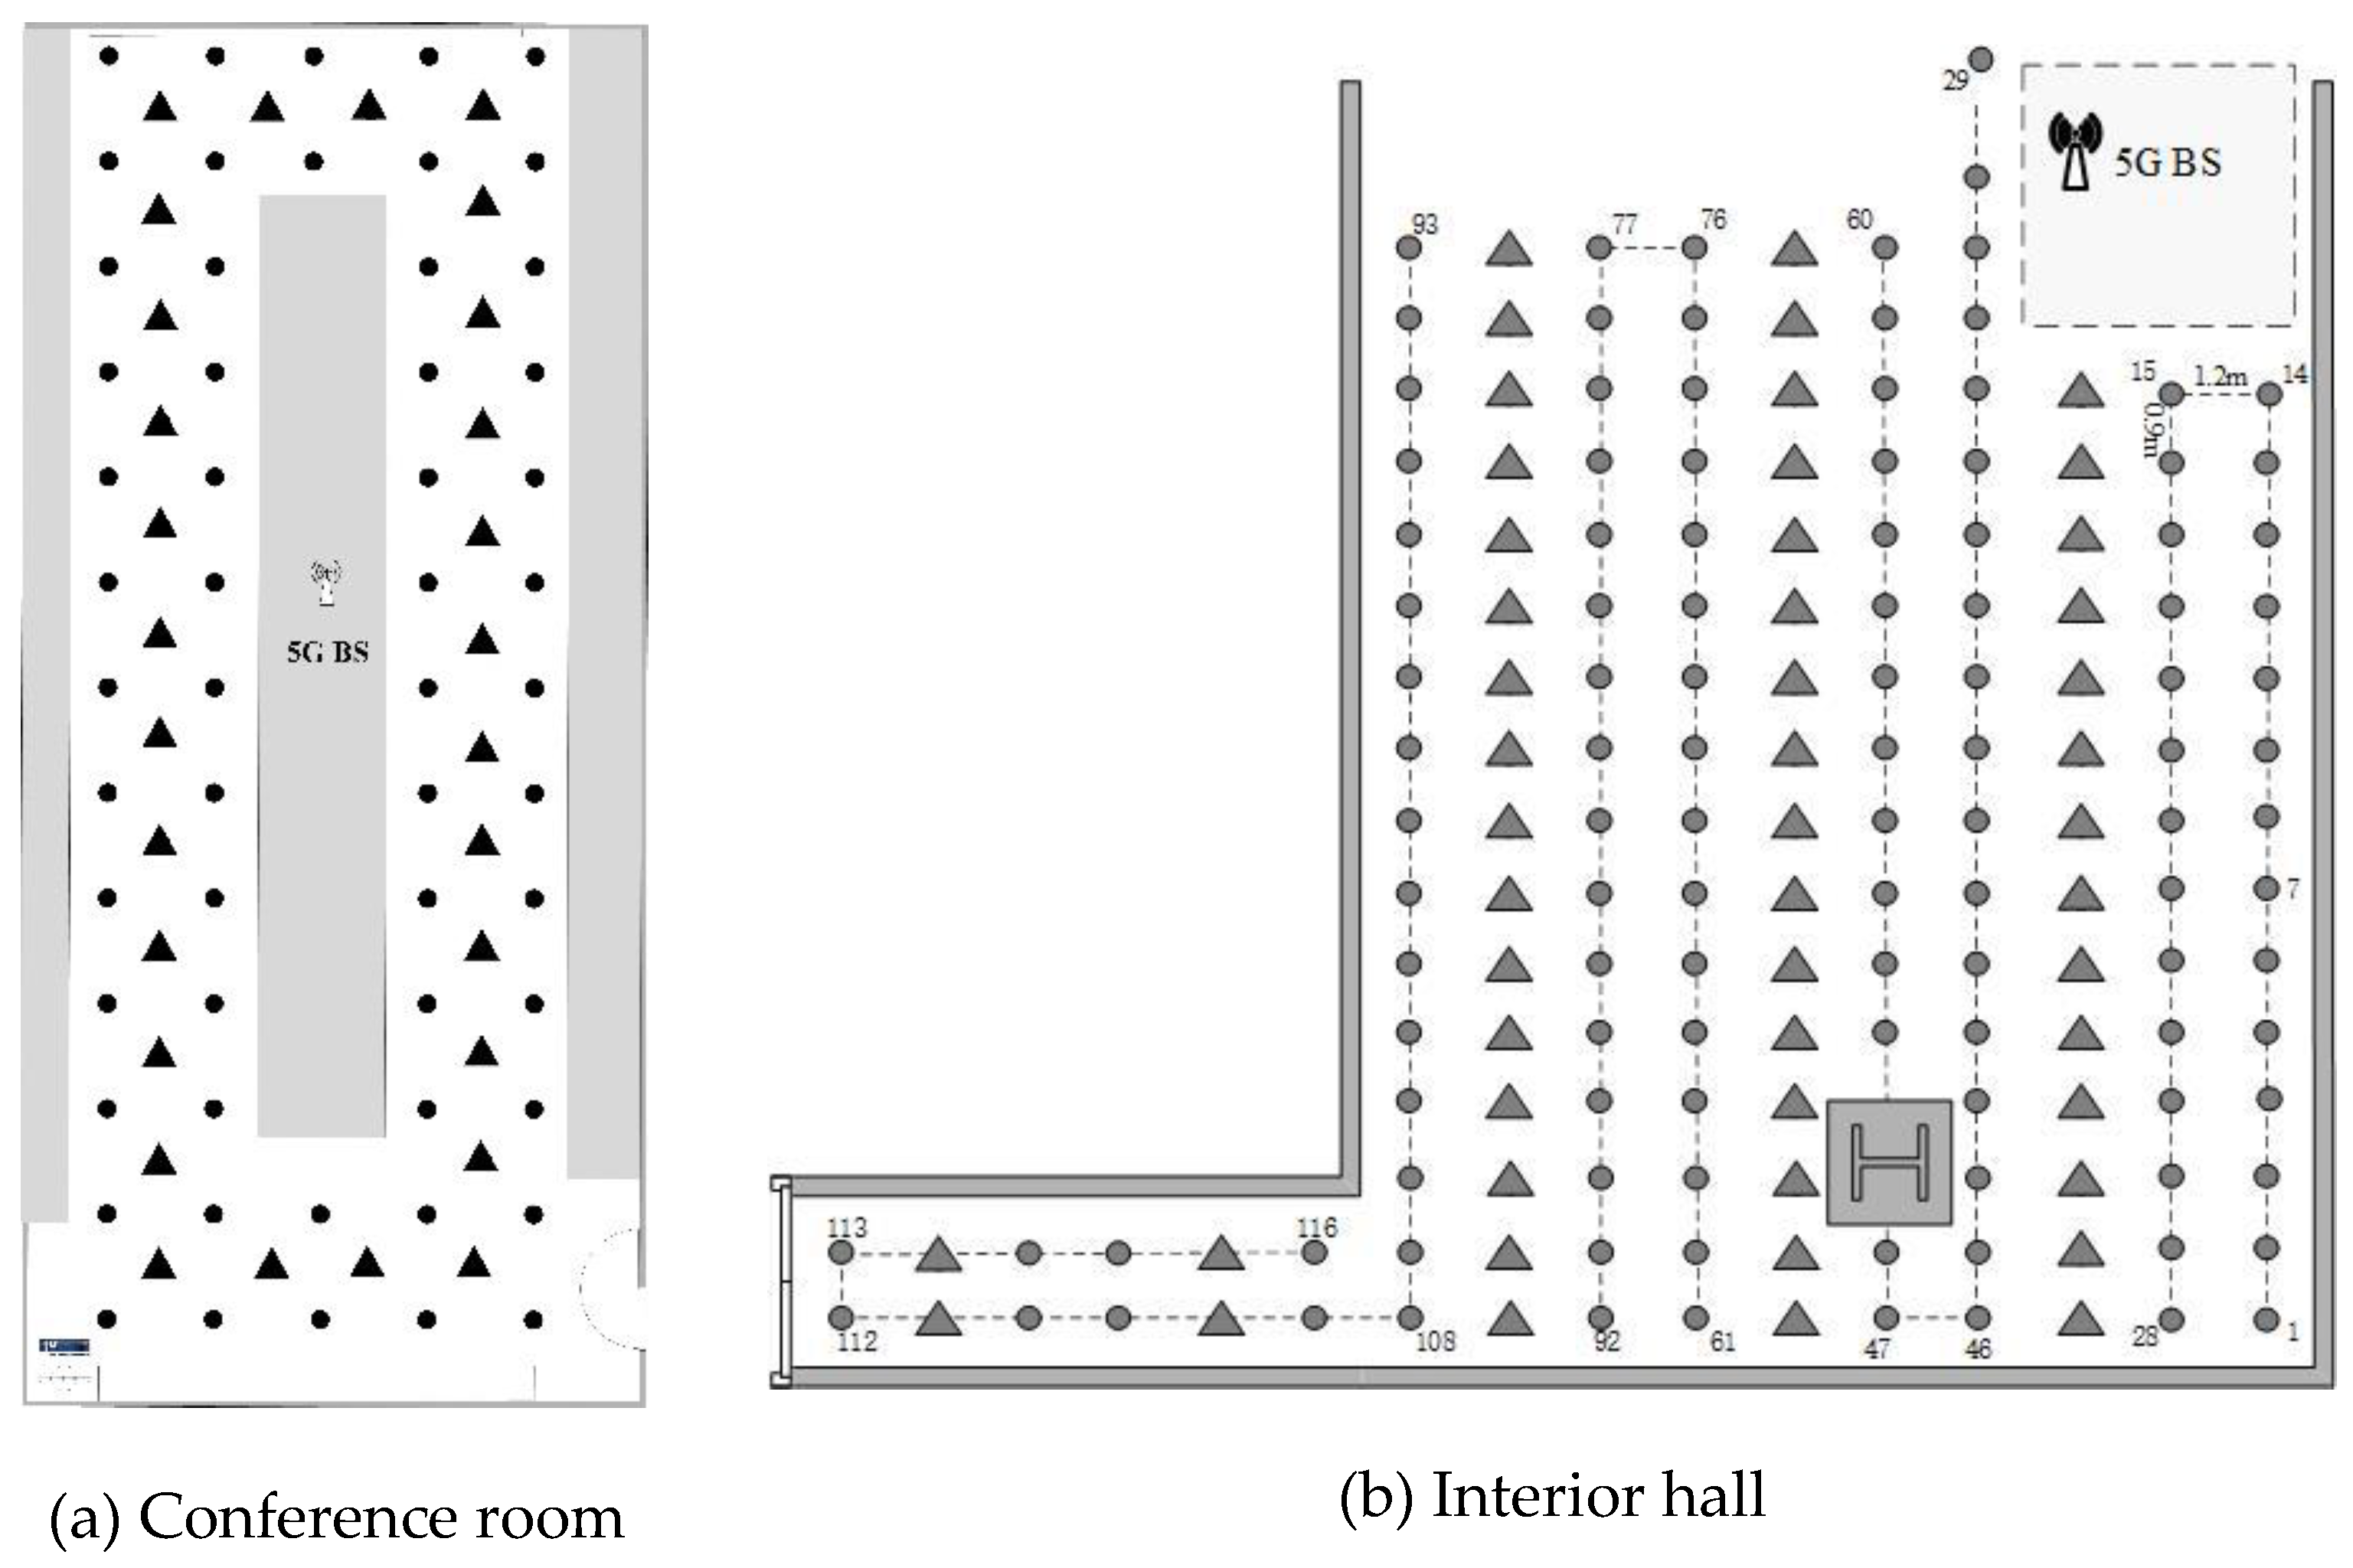
The two laboratory experiment scenarios are shown in Figure 5a,b respectively, in which the circular point is the sampling point and the triangular point is the undetermined point.
Figure 6.
The floor plans of the two experiments with measurement routes.
4.1. Experiment on Positioning Efficiency of 5G Single Base Station
The distinctiveness of location fingerprints and the efficacy of real-time localization are significant metrics for evaluating fingerprint localization methods. This paper presents a study that aims to build an experiment to determine the optimal frequency of data collecting for constructing valid fingerprint data. In the conference room scenario, data is gathered at each point in time, particularly at 1 s, 2 s, 3 s, 4 s, and 5 s. The test sites are strategically positioned outside the fingerprint collecting spots, ensuring an equitable distribution across the conference room. Given the fact that individuals on foot would traverse a specific location within a brief timeframe during the process of dynamic localization, the sampling rate for localization has been established at 10 Hz. Figure 7 displays the cumulative distribution function (CDF) of localization errors for various collecting times, while Table 2 presents the statistical outcomes of different approaches. It is evident that as the duration of fingerprint data sampling rises, there is a steady enhancement in the overall accuracy of localization. However, this increase in sampling time also significantly amplifies the effort associated with updating the fingerprint database in subsequent stages. After conducting a full evaluation of both accuracy and workload, the decision has been made to set the collecting time at 3 s.
4.2. Positioning Test in Conference Room
In order to verify the superiority of the proposed multi-input fusion localization algorithm, the proposed algorithm is compared with WKNN, CNN and other matching algorithms. Figure 8 shows the CDF of different methods, and Figure 9 shows the positioning error at each point. Table 3 compares the positioning errors of the three positioning methods.
The figure illustrates that the fusion of 5G and geomagnetic data through the application of APD-WKNN and single-input AARes-CNN algorithms leads to a reduction in the maximum positioning error. However, the overall improvement is not deemed significant. This can be attributed to the fusion of the two types of data prior to utilizing the same convolutional network for data feature extraction. Consequently, the network fails to effectively extract features from the two distinct data types, which possess varying dimensions and properties. In contrast, the Multi-CNN method exhibits a positioning error mostly confined to a range of 2 m, which is generally considered more desirable. Furthermore, the approach achieves a notable reduction in maximum positioning error, leading to a substantial improvement in total localization accuracy. The reason for fusing the Multi-CNN algorithm at the final localization level is to fully consider the characteristics of the data during the previous convolutional operation. This is achieved by extracting features from different network branches that capture the distinct dimensions and properties of the data. The fusion process at the final positioning level enhances the model’s ability to acquire a more comprehensive and diverse set of feature information. Furthermore, the Multi-CNN method demonstrates enhanced capability in managing the connection between CSI and geomagnetism. This is achieved by effectively leveraging the complimentary information provided by the two sensors, resulting in improved resilience and generalization capacity of the model. Hence, the Multi-CNN approach exhibits superior performance in terms of overall stability.
Table 3 presents the statistical data regarding the localization outcomes achieved by various localization methods. The APD-WKNN algorithm exhibits an average localization error of 2.13 m, the BPNN algorithm exhibits an average localization error of 1.93 m while the single-input AARes-CNN localization method demonstrates an average error of 1.78 m. On the other hand, the Multi-CNN localization approach yields an average error of 1.41 m, resulting in an enhancement of approximately 33.8% and 26.9% in overall localization accuracy compared to the APD-WKNN and PSO-BPNN method. Furthermore, the single-input AARes-CNN method enhances the overall localization accuracy by approximately 20.8%. The multi-input fusion approach that we present demonstrates superior effectiveness in terms of both stability and localization accuracy. We think the reason is that for APD-WKNN, PSO-BPNN, and single-input AARes-CNN algorithms, the data from different sensors need to be spliced before extracting the data features in order to build a unified location fingerprint library, but based on the different values obtained by two sensors and the large difference in the magnitude of the different values and the different influence of the different values, the single-input algorithms can not deal with this kind of directly spliced data effectively. However, Multi-CNN assigns distinct access points for each data sets and does not need data splicing, hence disregarding the impact of varied values. Multi-CNN constructs distinct libraries for the two sensors, ensuring that the fingerprint libraries remain unaffected by each other. This effectively mitigates the impact of sensor instability on the fingerprint library’s quality. Furthermore, the convolutional layer and pooling layer of CNN has a remarkable capacity to extract data features. They excel at capturing local characteristics, efficiently processing network structure data, and extracting spatial features from the data.
4.3. Positioning Test in Interior Hall
To enhance the validation of the fusion positioning algorithm’s positioning capability, an experiment was conducted within an indoor hall. Figure 6b depicts the experimental setting. The depicted picture encompasses a hallway with an approximate area of 275 m2, surpassing that of the conference room. It features shorter passageways, load-bearing columns, and a continuous flow of people, rendering it more conducive to practical utilization. Figure 10 depicts the CDF of several approaches, whereas Figure 11 illustrates the positioning inaccuracy observed at each individual point.
The data presented in Figure 10 demonstrates that the expansion of the experimental range, in comparison to the conference room setting, leads to an increase in the number of sample points gathered for the construction of the fingerprint library. Consequently, this increase in sample points results in a higher level of similarity. As a result, when comparing the localization results of the test points to those of the conference room, an overall decrease is observed. Furthermore, it is evident from Figure 11 that the localization error in the corridor exhibits a notable increase. This may be attributed to the constrained nature of the corridor, where the limited area and substantial signal obstructions diminish the discernibility of signal features. Nevertheless, the approach presented in this study exhibits superior performance in terms of localization stability, resulting in a predominantly confined inaccuracy within a 3 m range. The reason for the effectiveness of Multi-CNN lies in its capacity to use the information from each input data source more efficiently. This is achieved by doing feature extraction on distinct inputs individually and subsequently merging these features in successive layers. As a result, the overall stability of the model is enhanced. Furthermore, the Multi-CNN network architecture is designed to be more adaptable, allowing for improved management of the interdependencies among various inputs.
Statistics on positioning results of different positioning methods are shown in Table 4. The average positioning error of APD-WKNN method is 3.70 m, the average positioning error of BPNN method is 3.21 m, that of single-input CNN method is 3.13m, and that of Multi-CNN method is 2.66 m. Compared with APD-WKNN, PSO-BPNN and single-input AARes-CNN, the overall positioning accuracy is improved by 28.1% 17.1% and 15% respectively. It can be seen that in a large range of scenes, the positioning performance of the fusion method proposed by us is more superior in terms of stability and positioning accuracy, and can improve the accuracy of indoor positioning.
Table 4 presents the statistical data pertaining to the outcomes of various placement strategies. The APD-WKNN technique exhibits an average positioning error of 3.70 m, while the single-input AARes-CNN method demonstrates an average positioning error of 3.13 m. In contrast, the Multi-CNN method displays a lower average positioning error of 2.66 m. When comparing the performance of APD-WKNN and ingle-input AARes-CNN, it is seen that the overall accuracy of placement is enhanced by 28.1% and 15% correspondingly. The fusion approach presented by our research team demonstrates greater stability and positioning accuracy over a wide range of scenarios, hence enhancing the precision of indoor positioning. The reason is that in order to create a unified location fingerprint library, the data from different sensors needs to be combined before extracting the data features for APD-WKNN, PSO-BPNN, and single-input AARes-CNN algorithms. However, due to the varying values obtained by two sensors, the significant difference in magnitude, and the diverse impact of these values, the single-input algorithms are unable to effectively handle this directly combined data. However, Multi-CNN assigns distinct access points for each data sets and does not need data splicing, hence disregarding the impact of varied values. Multi-CNN constructs distinct libraries for the two sensors, ensuring that the fingerprint libraries remain unaffected by each other. This effectively mitigates the impact of sensor instability on the fingerprint library’s quality. Furthermore, the convolutional layer and pooling layer of CNN has a remarkable capacity to extract data features. They excel at capturing local characteristics, efficiently processing network structure data, and extracting spatial features from the data.
5. Conclusions
In order to increase indoor localization accuracy and decrease fingerprint localization mismatch, this research suggests a fusion localization approach based on the Multi-CNN model for CSI and geomagnetic data. Based on these two types of data, we build fingerprint feature libraries, respectively. Due to variable data format and sampling frequency, the present technique, known as the classic WKNN, BPNN and CNN algorithm, finds it difficult to fully utilize the advantages of each sensor’s data.
The main conclusions are as follows.
1. Research balancing positioning efficiency and accuracy show that while appropriately extending the data sampling period will improve positioning accuracy, an abundance of data will undoubtedly lengthen the time required for data processing and reduce positioning efficiency. A 3 s collecting data can more efficiently meet the 10 Hz positioning requirements.
2. The placement accuracy of the Multi-CNN approach is around 31% better than that of the conventional WKNN algorithm. This effectively overcomes the inadequacy of a single similarity index (Euclidean distance or Manhattan distance) and reduces the positioning mismatching rate.
3. When comparing the Multi-CNN technique to the BPNN and CNN algorithm, the location accuracy is improved by around 22% and 18%. Furthermore, it avoids carrying out extra compression or transformation processing before fusion, retaining most of the properties of the sensor data.
The effectiveness of using the Multi-CNN algorithm as a positioning method to integrate CSI and geomagnetic intensity is examined in this study. The results indicate that, in future research, increasing the number of positioning sensors included into the system may help to some extent with positioning accuracy. Geomagnetic signals and readily available cell communication data are also utilized in this investigation. The study’s geomagnetic sensor is inexpensive and offers accuracy on par with built-in sensors from smartphones. It also holds a lot of promise for enhancing indoor location techniques. Nevertheless, manual debugging is still necessary for network training in order to perform tasks like choosing training batches and changing various parameters. To create a data-driven system, the next stage will be to integrate optimization mechanisms across the entire network. The method now in use, single-point acquisition, is time-consuming. Additionally, the original fingerprint library needs to be updated in case the localization scenario changes. Therefore, in order to accomplish dynamic updating of the fingerprint library in the future, we wish to use the crowdsourcing data approach. Moreover, the existing approach is unable to effectively utilize the fingerprint data’s temporal information. Consequently, in order to more effectively extract the data features from diverse sensors, we will integrate LSTM and other approaches. Next, we will assess how well this method works in dynamic scenarios using unmanned vehicles.
CRediT authorship contribution statement
Zhenhao Cheng: Conceptualization, Methodology, Software, Validation, Visualization, Writing – original draft. Dongqing Zhao: Conceptualization, Funding acquisition, Supervision, Writing – original draft, Writing –review & editing. Wenzhuo Guo: Resources, Validation. Linyang Li: Funding acquisition, Writing – review & editing.
Declaration of Competing Interest
The authors declare that they have no known competing financial interests or personal relationships that might have appeared to affect the work presented in this paper.
Acknowledgements
This study was supported by the National Natural Science Foundation of China (Grant Nos. 42104033, 41774037) and Postdoctoral Science Foundation of China (Grant Nos. 2022M712442).
Data availability
Data will be made available on request.
References
- Zhe W, Jialei C, Hai T, Huan Z, et al. RSSI-based location fingerprint method for RFID indoor positioning: a review. nondestructive testing and evaluation 2023, 1-29. [CrossRef]
- Su S, Chen J, Wang L, et al. A review of indoor and outdoor positioning technology. Intelligent Computer and Applications 2023, 13, 179-183.
- Li Q, Liao X, Liu M, et al. Indoor Localization Based on CSI Fingerprint by Siamese Convolution Neural Network, in IEEE Transactions on Vehicular Technology 2021, 70, 12168-12173. [CrossRef]
- Liu W, et al. Survey on CSI-based Indoor Positioning Systems and Recent Advances, 2019 International Conference on Indoor Positioning and Indoor Navigation (IPIN), Pisa, Italy, 2019, 1-8. [CrossRef]
- Li Y B, Sun X. A Highly Robust Indoor Location Algorithm Using WiFi Channel State Information Based on Transfer Learning Reinforcement. Journal of Electronics & Information Technology 2023, 45, 3657-3666.. [CrossRef]
- Kim H, Ben-Othman J, Mokdad L, et al. Research Challenges and Security Threats to AI-Driven 5G Virtual Emotion Applications Using Autonomous Vehicles, Drones, and Smart Devices, in IEEE Network 2020, 34, 288-294. [CrossRef]
- Barneto C, Riihonen T, Turunen M, et al. Radio-based Sensing and Indoor Mapping with Millimeter-Wave 5G NR Signals, in 10th International Conference on Navigation, Localization and GNSS (ICL-GNSS), 2020.
- Ruan Y, Chen L, Zhou X, et al. Hi-Loc: Hybrid Indoor Localization via Enhanced 5G NR CSI, IEEE Transactions on Instrumentation and Measurement 2022, 71, 1-15. [CrossRef]
- Lu Y, Wei D, Ji X, Review of geomagnetic positioning method. Navigation Positioning and Timing 2022, 9, 118-130.
- Zhu J, Lin Z, Lin H, et al. PDR algorithm based on Kalman filter for optimizing heading. Bulletin of Surveying and Mapping 2023, 30-34+63. [CrossRef]
- Zhong Q Q, Guo J H. Research on the Positioning Method of Mobile Robot in Wilderness Environment. Computer & Digital Engineering 2022, 50, 71-74+89.
- Yao X, Zhao S, Xu P, et al. Multi-Source Domain Adaptation for Object Detection,2021 IEEE/CVF International Conference on Computer Vision (ICCV), Montreal, QC, Canada 2021, 3253-3262.
- Grira H, Chammakhi M, Grayaa K. Enhancing Fingerprinting Indoor Positioning Systems Through Hierarchical Clustering and GAN-Based CNN, 2023 IEEE Symposium on Computers and Communications (ISCC), Gammarth, Tunisia, 2023:1054-1057.
- Lee S. Lee S, Choi Y, et al. GeoSS: Geographic Segmentation Security Barriers for Virtual Emotion Detection With Discriminative Priorities in Intelligent Cooperative Vehicular System, in IEEE Transactions on Vehicular Technology 2023, 72, 6491-6502. [CrossRef]
- Xin L, Wei H, Z T, et al. The Improvement of RSS-based Location Fingerprint Technology for Cellular Networks, 2012 International Conference on Computer Science and Service System, Nanjing, China, 2012, 1267-1270. [CrossRef]
- Shi S, Sigg S, Chen L, et al. Accurate Location Tracking From CSI-Based Passive Device-Free Probabilistic Fingerprinting, in IEEE Transactions on Vehicular Technology 2018, 37, 5217-5230. [CrossRef]
- Song Q, Guo S, Liu X, et al. CSI Amplitude Fingerprinting-Based NB-IoT Indoor Localization, in IEEE Internet of Things Journal 2018, 5, 1494-1504. [CrossRef]
- Yan R, Liang C, Xin Z, et al. iPos-5G: Indoor Positioning via Commercial 5G NR CSI. IEEE Internet of Things Journal 2022, 10, 1-1. [CrossRef]
- Zhou X, Chen L, Ruan Y. Indoor Positioning With Multibeam CSI From a Single 5G Base Station. IEEE Sensors Letters 2024, 8, 1-4. [CrossRef]
- Yang C, Zhao D, Jia X, et al. An localization method based on BP neural network combining WiFi and geomagnetism. Engineering of Surveying and Mapping 2023, 32, 14-18.
- He T, Niu Q, He S, et al. Indoor Localization with Spatial and Temporal Representations of Signal Sequences, 2019 IEEE Global Communications Conference (GLOBECOM), Waikoloa, HI, USA, 2019, 1-7.
- Yeh S C, Lai CJ, Sai F, et al. Research on calibration-free fingerprinting positioning techniques based on terrestrial magnetism databases for indoor environments. IET Radar, Sonar and Navigation, 2022, 16, 896-911. [CrossRef]
- Zhang W, Sengupta R, Fodero J, et al. Deep Positioning: Intelligent Fusion of Pervasive Magnetic Field and WiFi Fingerprinting for Smartphone Indoor Localization via Deep Learning, 2017 16th IEEE International Conference on Machine Learning and Applications (ICMLA), Cancun, Mexico, 2017, 7-13.
- Wang Y, Huang X D, Guo S T. Indoor Fingerprint Location Algorithm Based on Convolutional Neural Network. 2018.
- Zhang H, Wang Z K, Xia W C, et al. Weighted Adaptive KNN Algorithm With Historical Information Fusion for Fingerprint Positioning. IEEE Wireless Communications Letters 2022, 11, 1002-1006. [CrossRef]
- Wu S X, Huang W X, Li M, et al. A Novel RSSI Fingerprint Positioning Method Based on Virtual AP and Convolutional Neural Network. IEEE sensors journal 2022, 22, 6898-6909. [CrossRef]
- Liu Y T, Chen J J, Tseng Y C, et al. Combining Auto-Encoder with LSTM for WiFi-Based Fingerprint Positioning[C], International Conference on Computer Communications and Networks, 2021: 1-6. [CrossRef]
- Wang B Y, Gan X G, Liu X L, et al. A Novel Weighted KNN Algorithm Based on RSS Similarity and Position Distance for Wi-Fi Fingerprint Positioning. IEEE Access 2020, 8: 30591.0-30602.0. [CrossRef]
- Nkabiti K, Chen Y. Application of solely self-attention mechanism in CSI-fingerprinting-based indoor localization. Neural Computing and Applications 2021, 33, 9185-9198. [CrossRef]
- Zhang B, Sifaou H, Li G. CSI-fingerprinting Indoor Localization via Attention-Augmented Residual Convolutional Neural Network. IEEE Transactions on Wireless Communications 2022, 22, 5583-5597. [CrossRef]
- Huang X, Huang L, Xie J, et al. The CSI Fingerprint Location Method Based on PSO-BPNN. Journal of Jiangxi Normal University (Natural Sciences Edition) 2023, 47.
- Huang X, Guo S, Wu Y, et al. A fine-grained indoor fingerprinting localization based on magnetic field strength and channel state information. Pervasive and Mobile Computing 2017, 41: 150-165. [CrossRef]
- Li P H, Yang X, Yin Y Q, et al. Smartphone-Based Indoor Localization With Integrated Fingerprint Signal. IEEE Access 2020, 8, 33178-33187. [CrossRef]
Figure 1.
Overall process of positioning system.
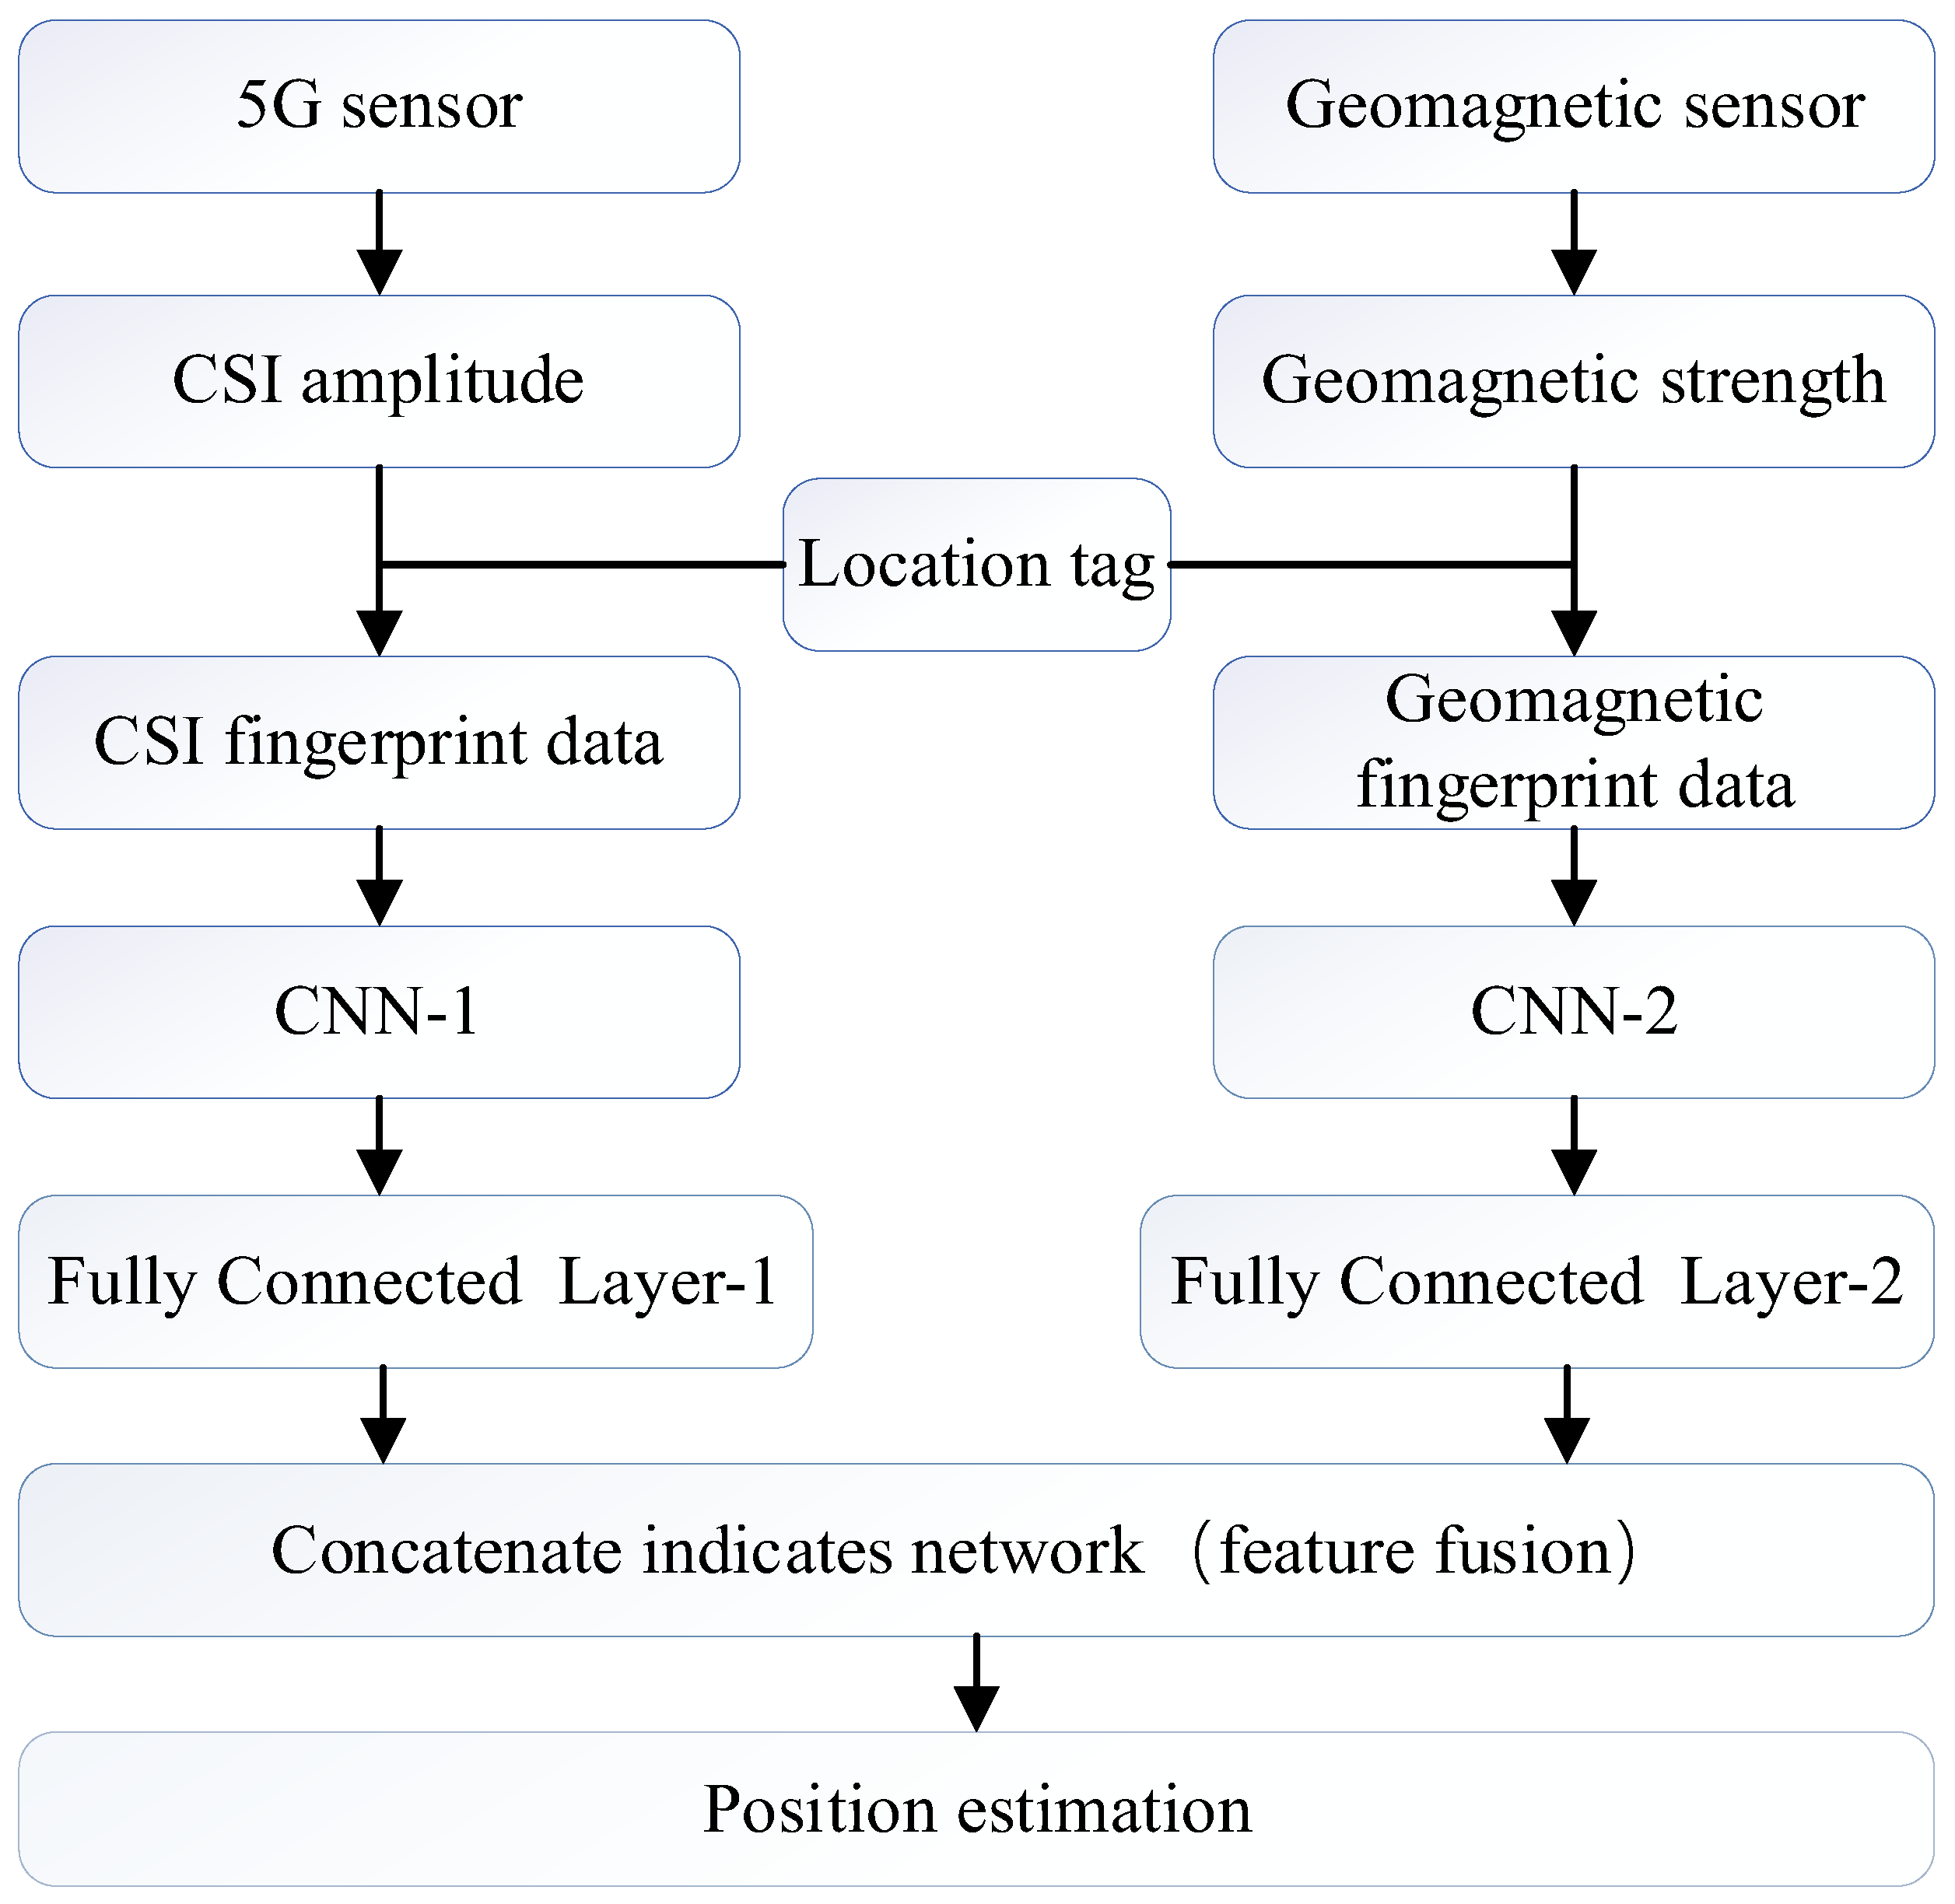
Figure 2.
3-D images of CSI data collected at different locations(a) Location A. (b) Location B.
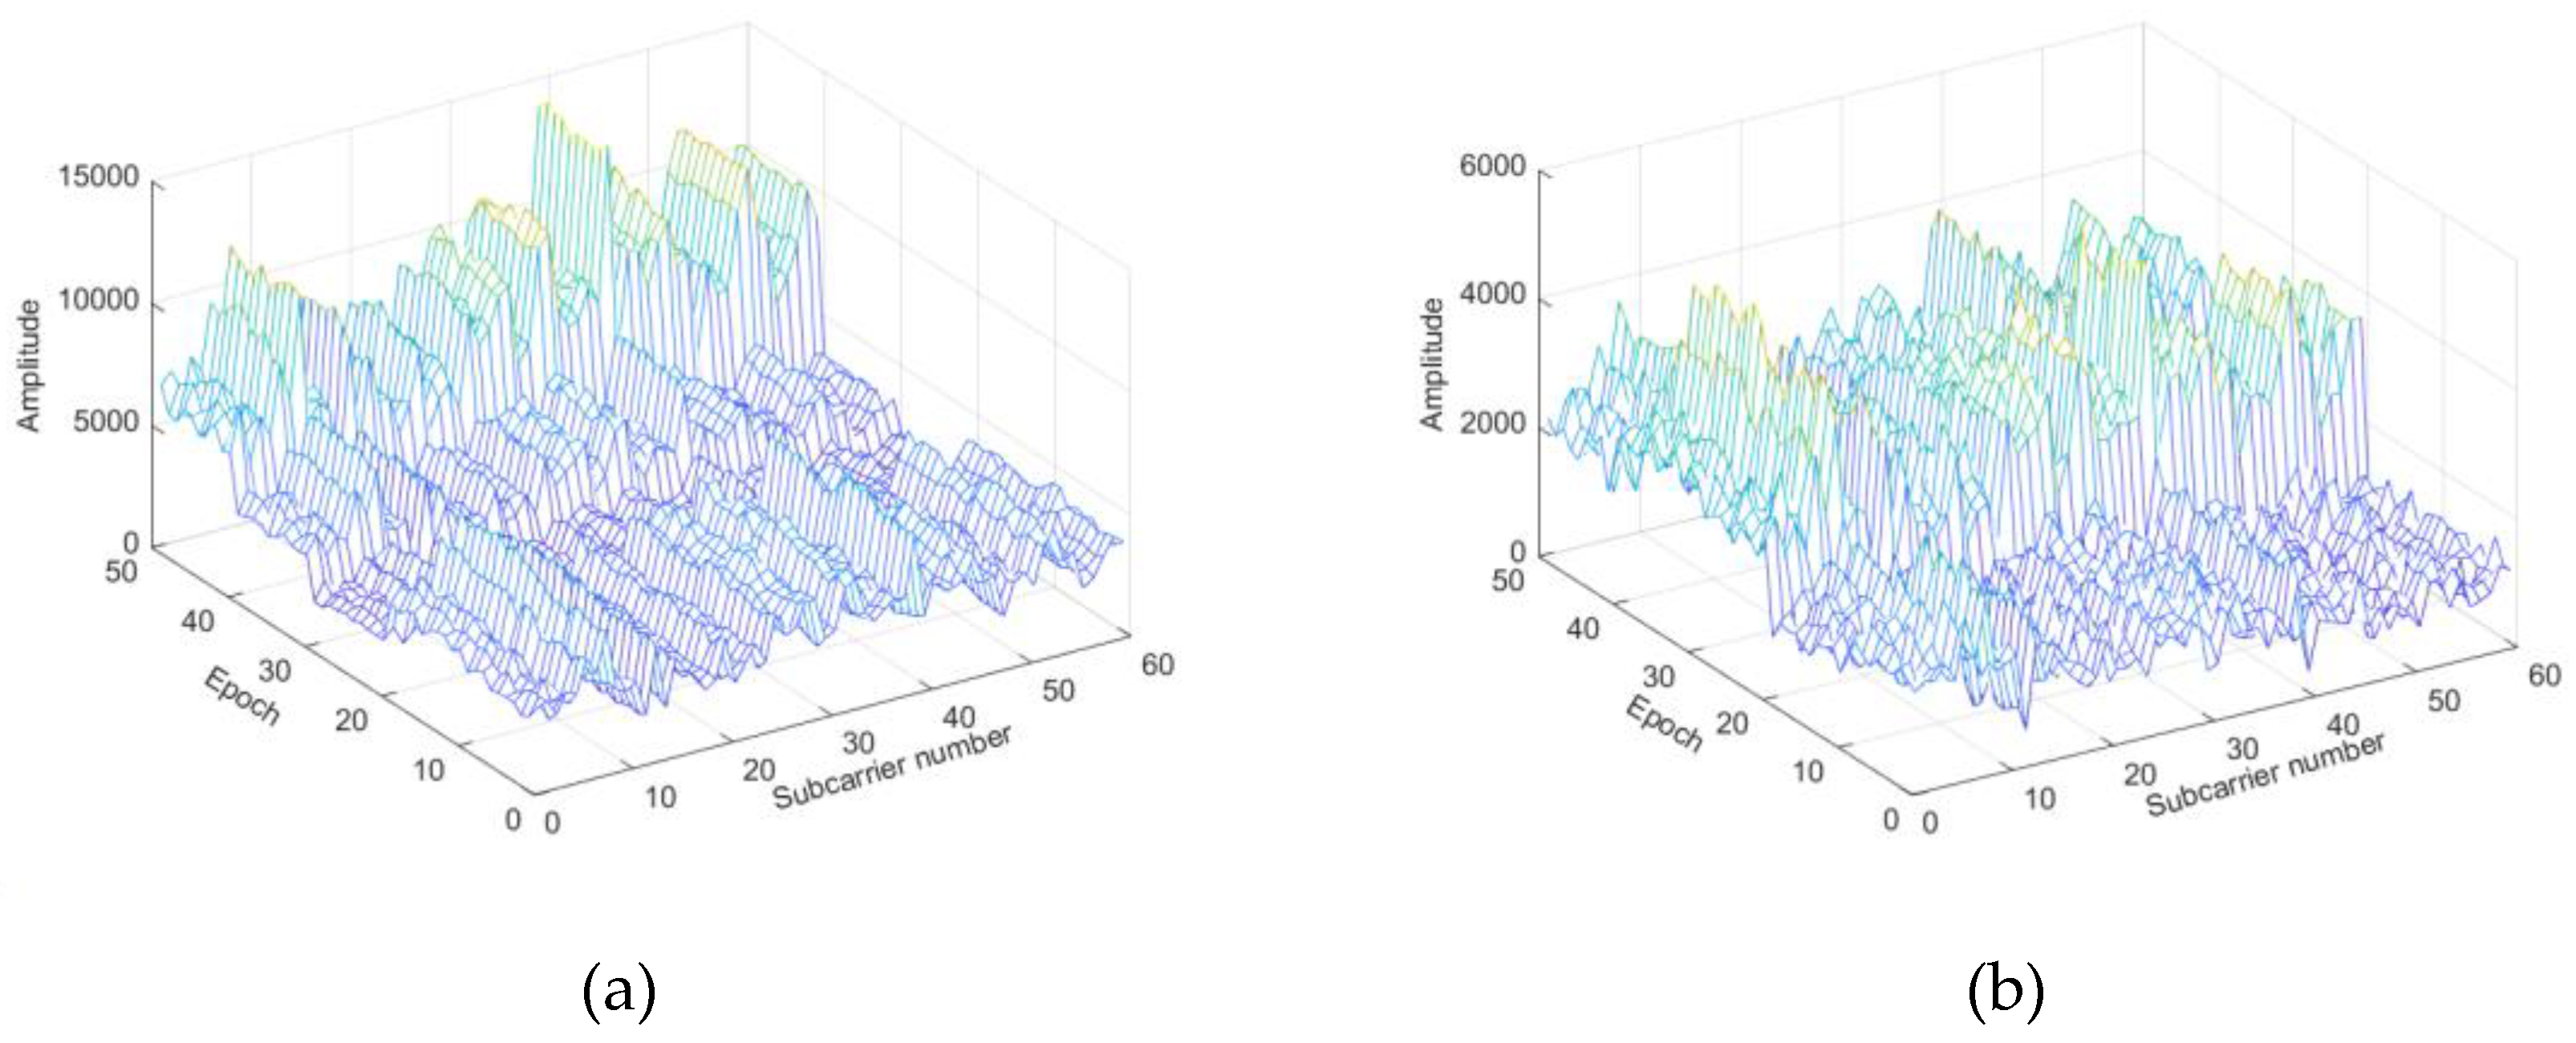
Figure 3.
Geomagnetic intensity distribution.
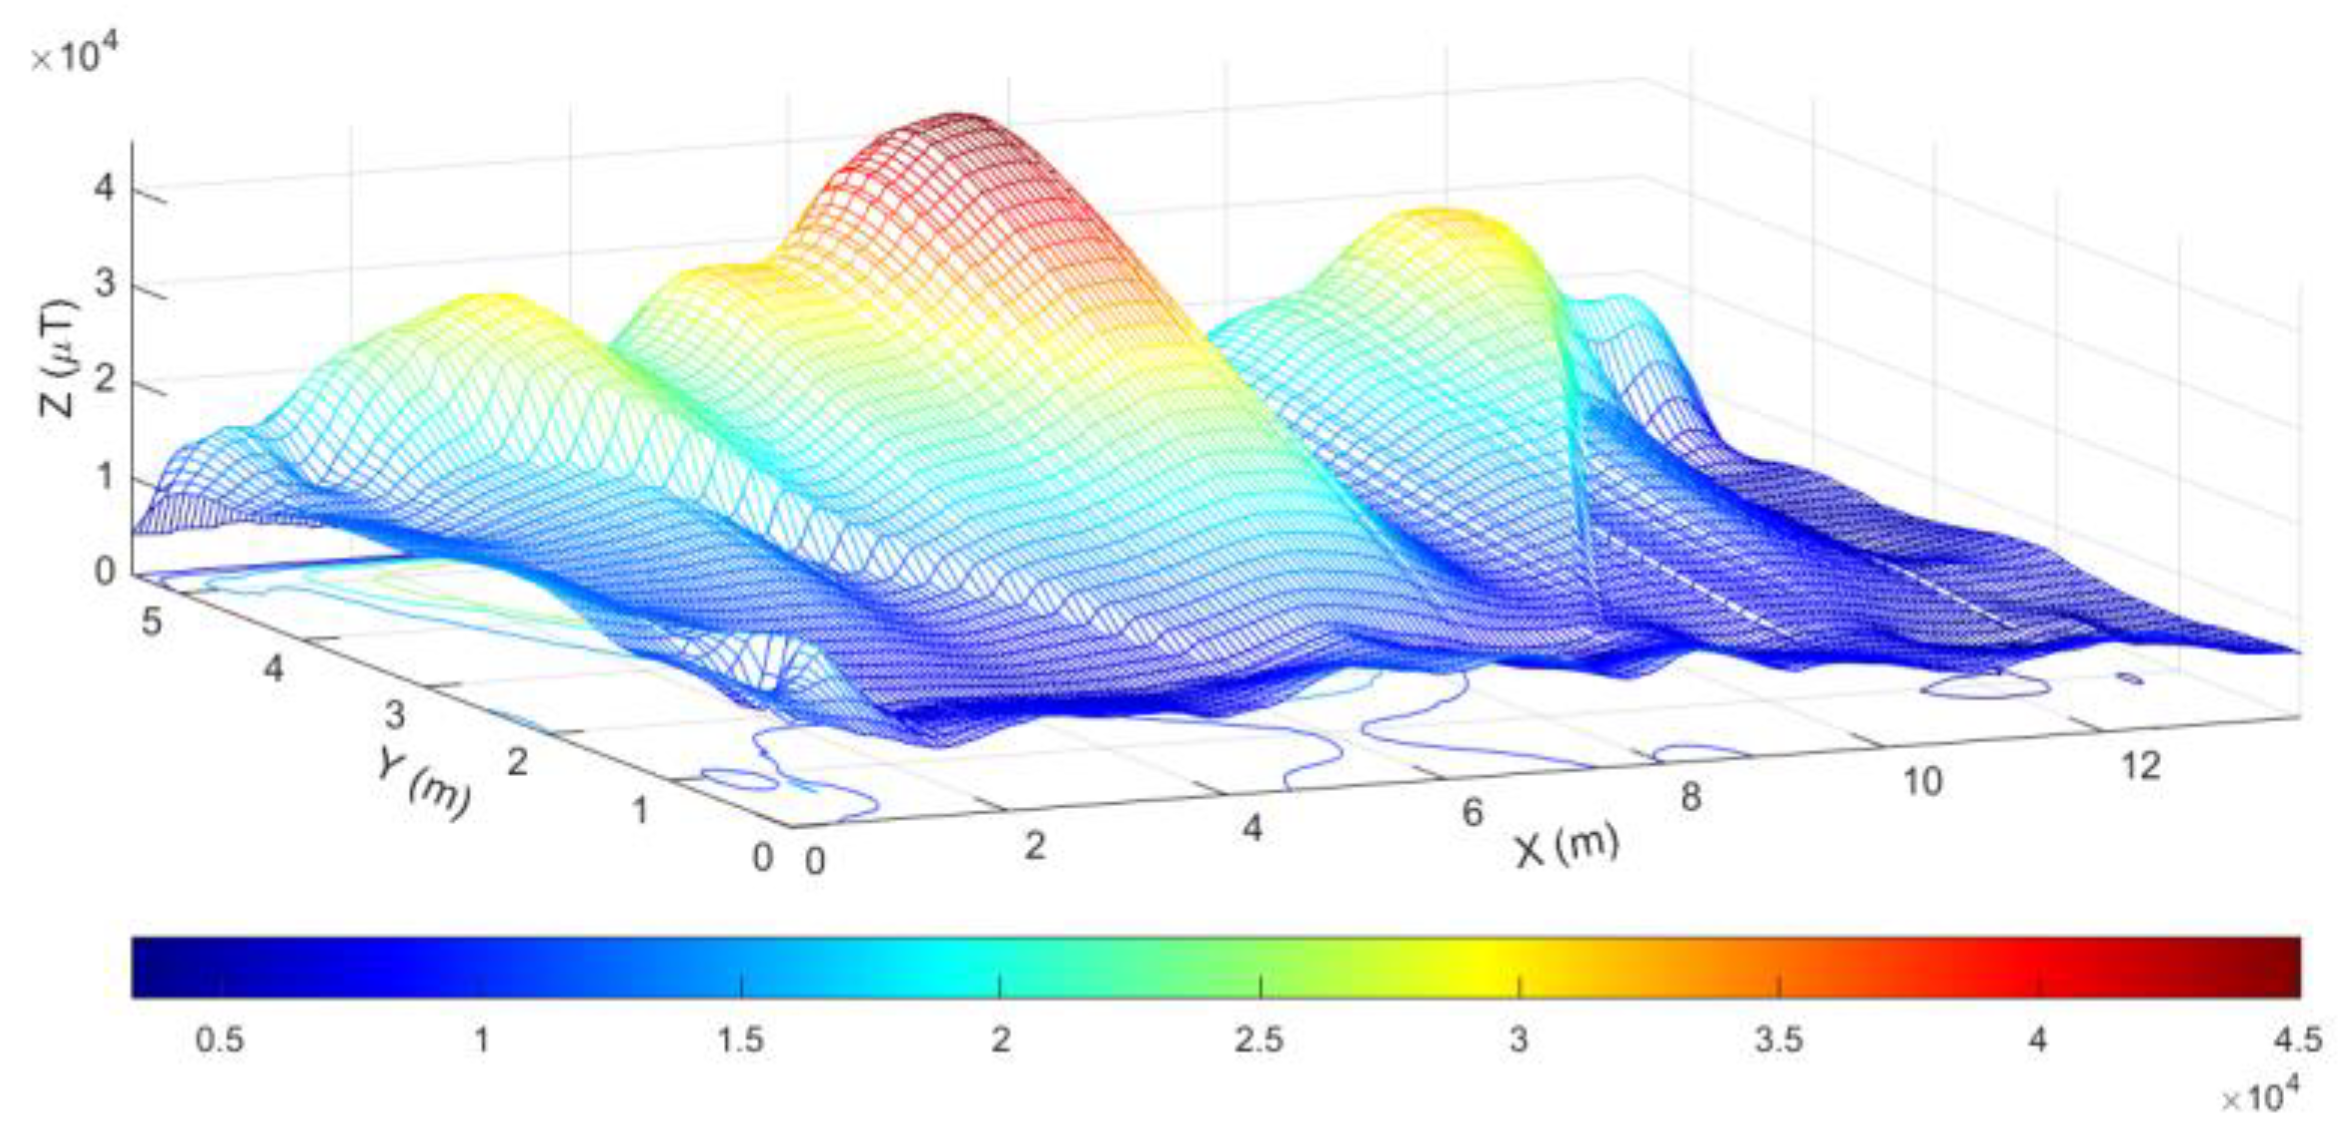
Figure 4.
Magnetic field strength at different locations.
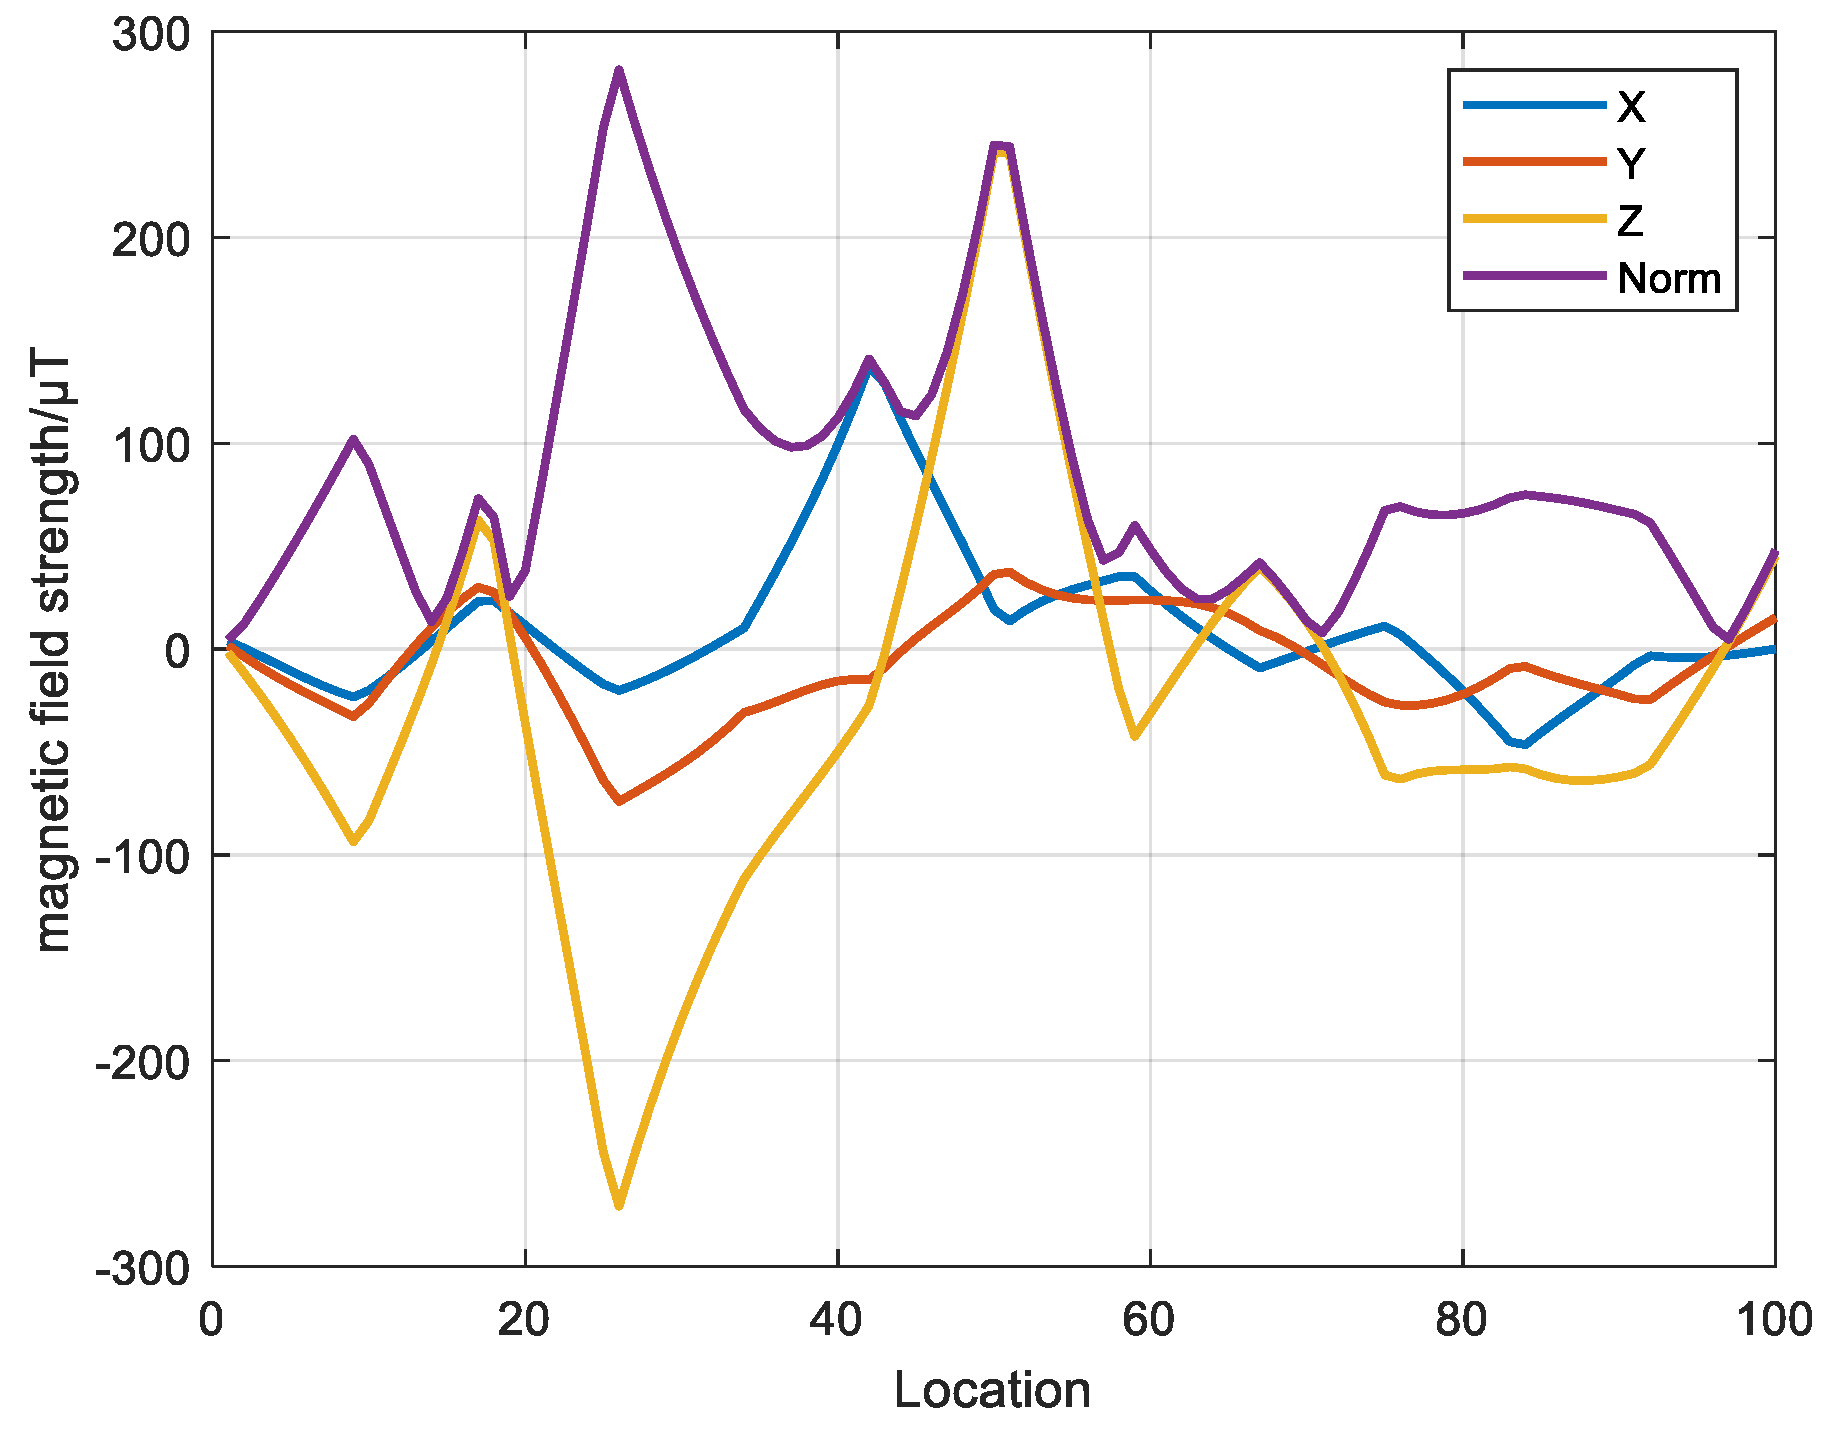
Figure 5.
Schematic diagram of multi-input convolutional neural network framework (blue is 5G fingerprint feature input network; gray is geomagnetic fingerprint feature input network; black is fused data after concatenation; Conv-2D indicates that the convolution type adopted is 2-dimensional convolution).
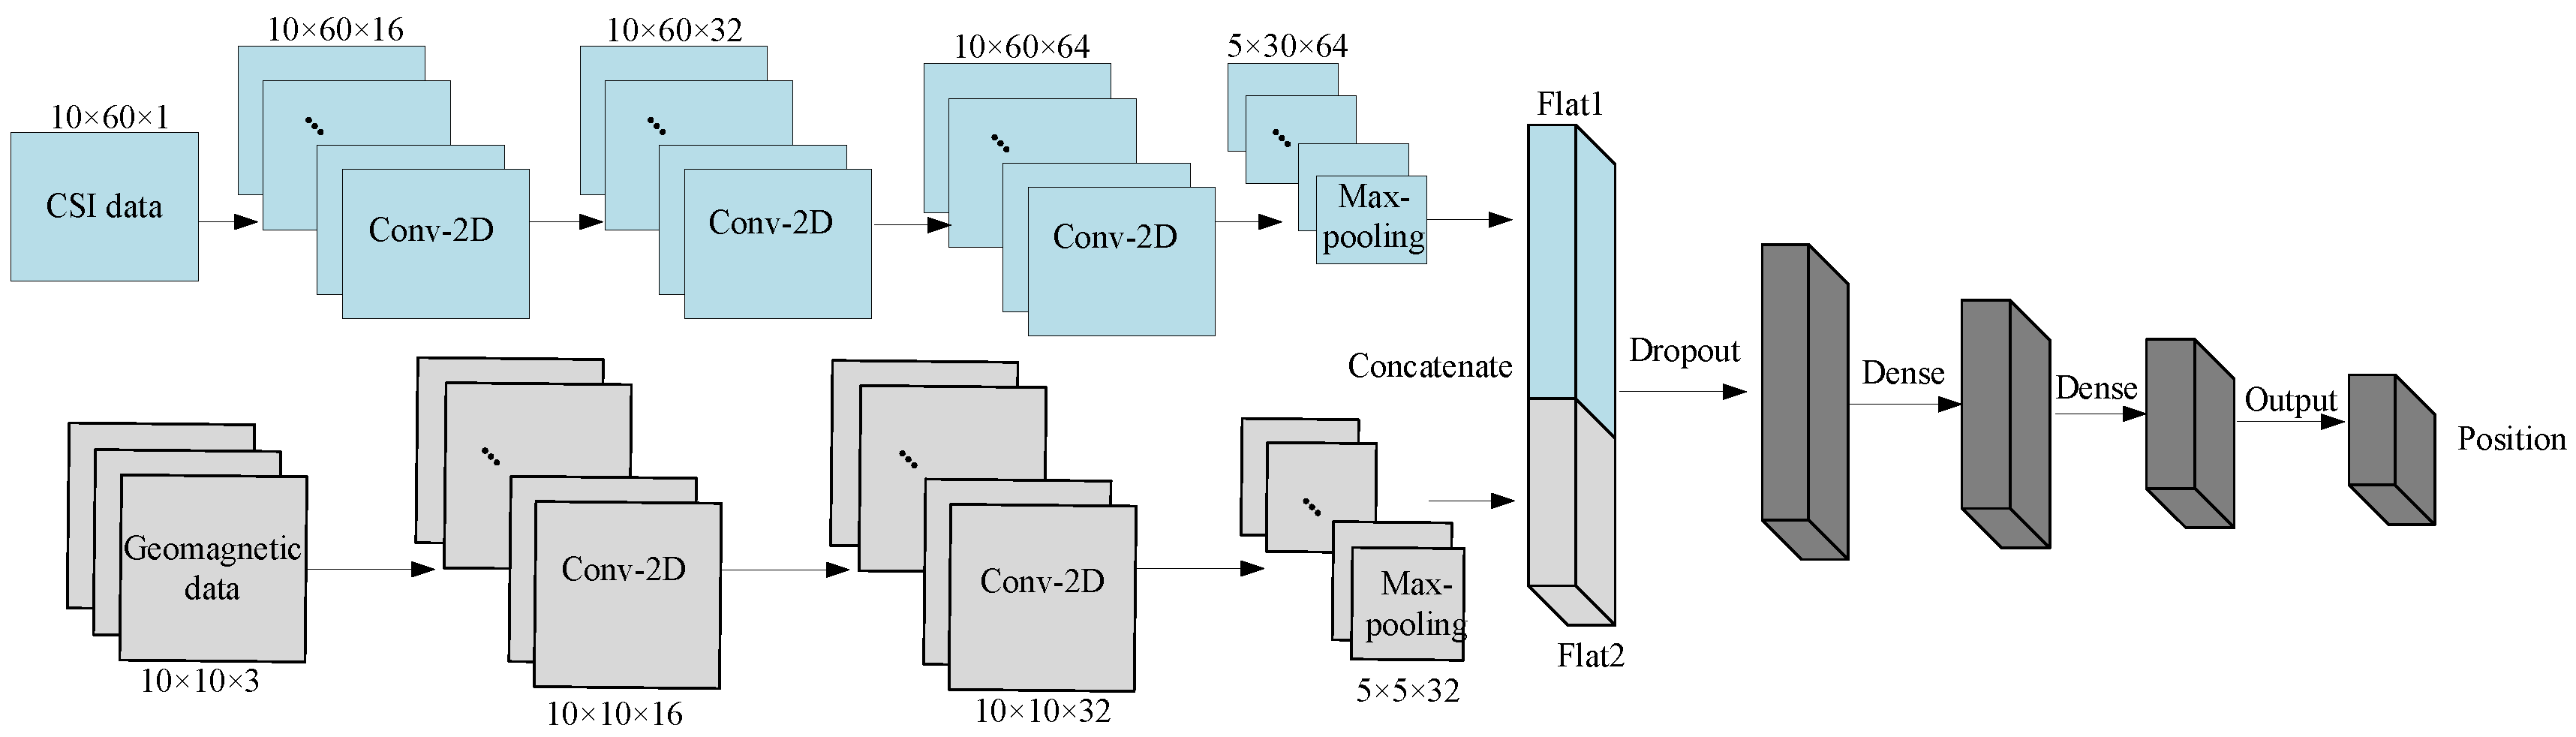
Figure 7.
Cumulative distribution of errors in indoor offices (The vertical is the cumulative distribution of errors, and the horizontal is the error).
Figure 7.
Cumulative distribution of errors in indoor offices (The vertical is the cumulative distribution of errors, and the horizontal is the error).
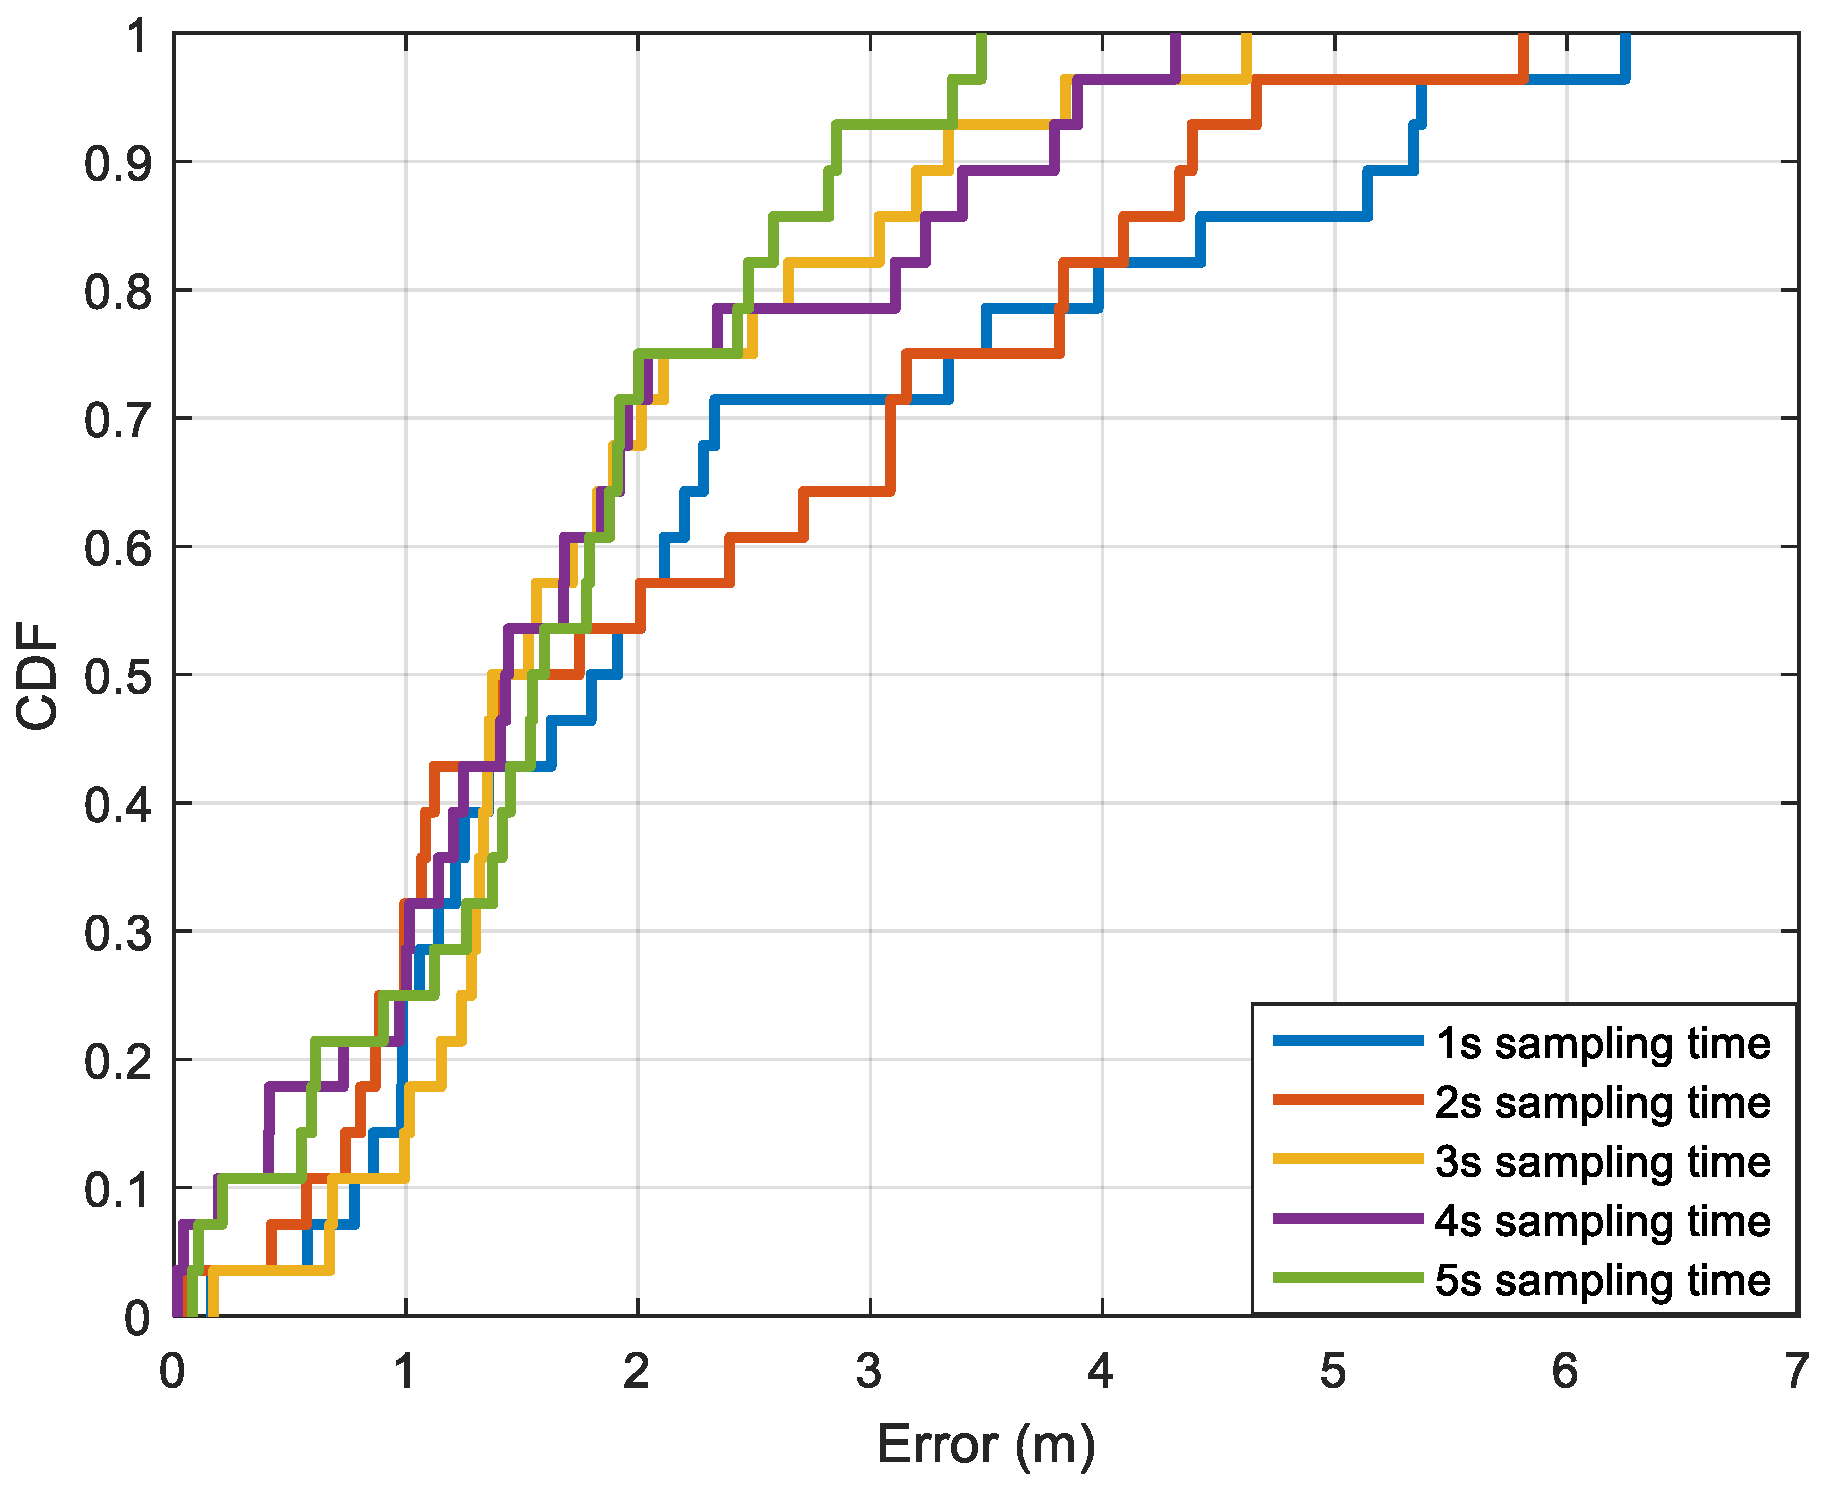
Figure 8.
CDF of different methods (red for APD-WKNN, orange for PSO-BPNN, yellow for single-input AARes-CNN, blue for Multi-CNN).
Figure 8.
CDF of different methods (red for APD-WKNN, orange for PSO-BPNN, yellow for single-input AARes-CNN, blue for Multi-CNN).

Figure 9.
Heat map of point errors of different positioning methods.
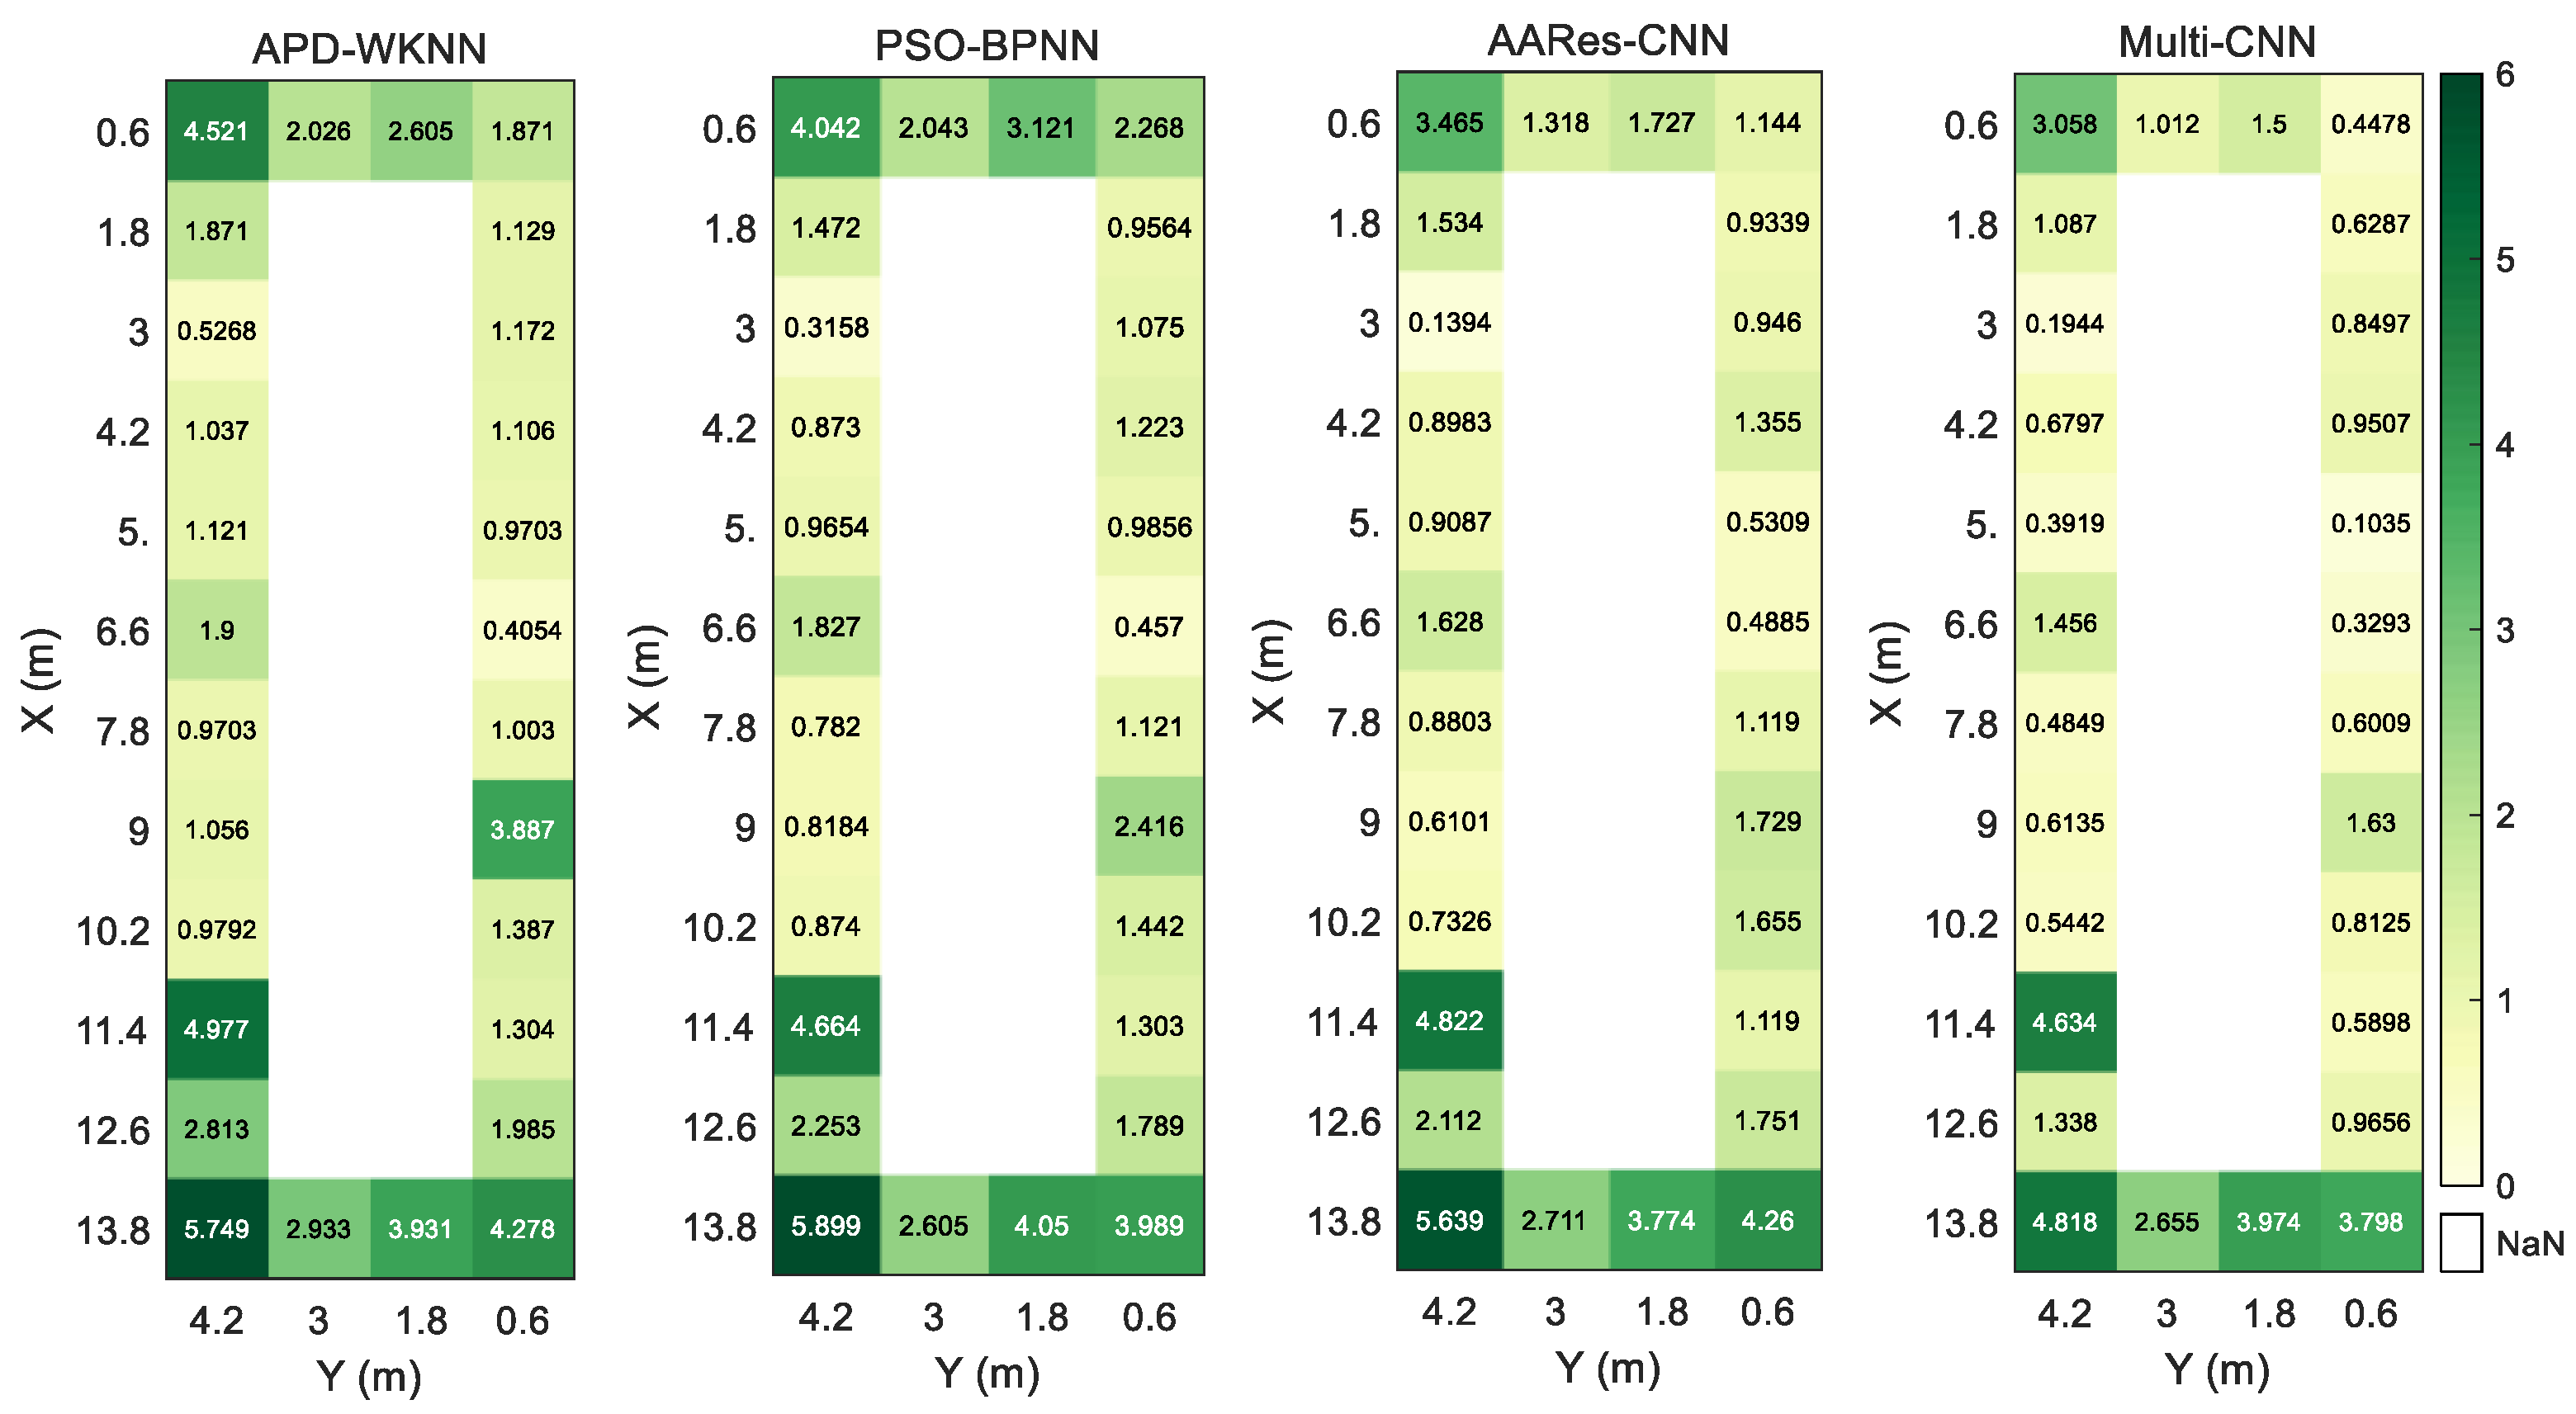
Figure 10.
CDF of different methods (red for APD-WKNN, orange for PSO-BPNN, yellow for single-input AARes-CNN, blue for Multi-CNN).
Figure 10.
CDF of different methods (red for APD-WKNN, orange for PSO-BPNN, yellow for single-input AARes-CNN, blue for Multi-CNN).
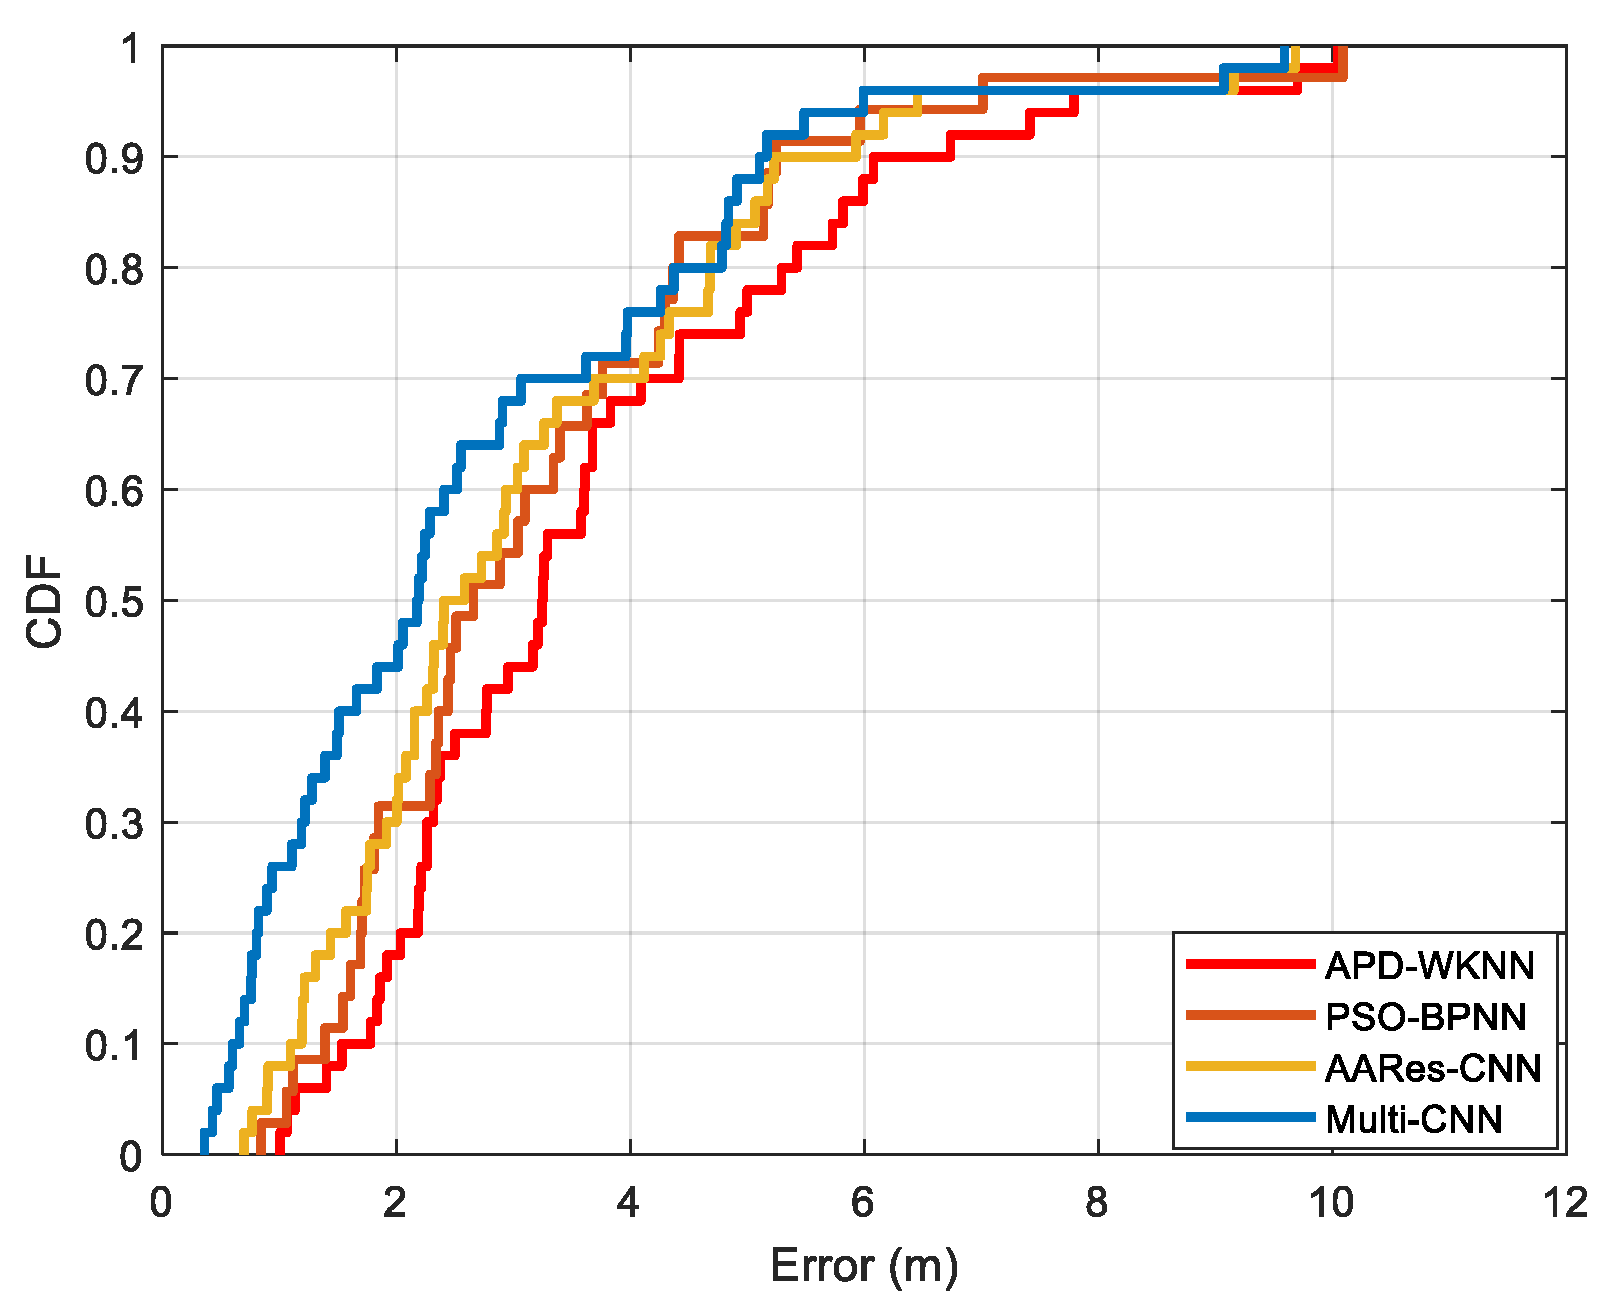
Figure 11.
Heat map of point errors of different positioning methods.
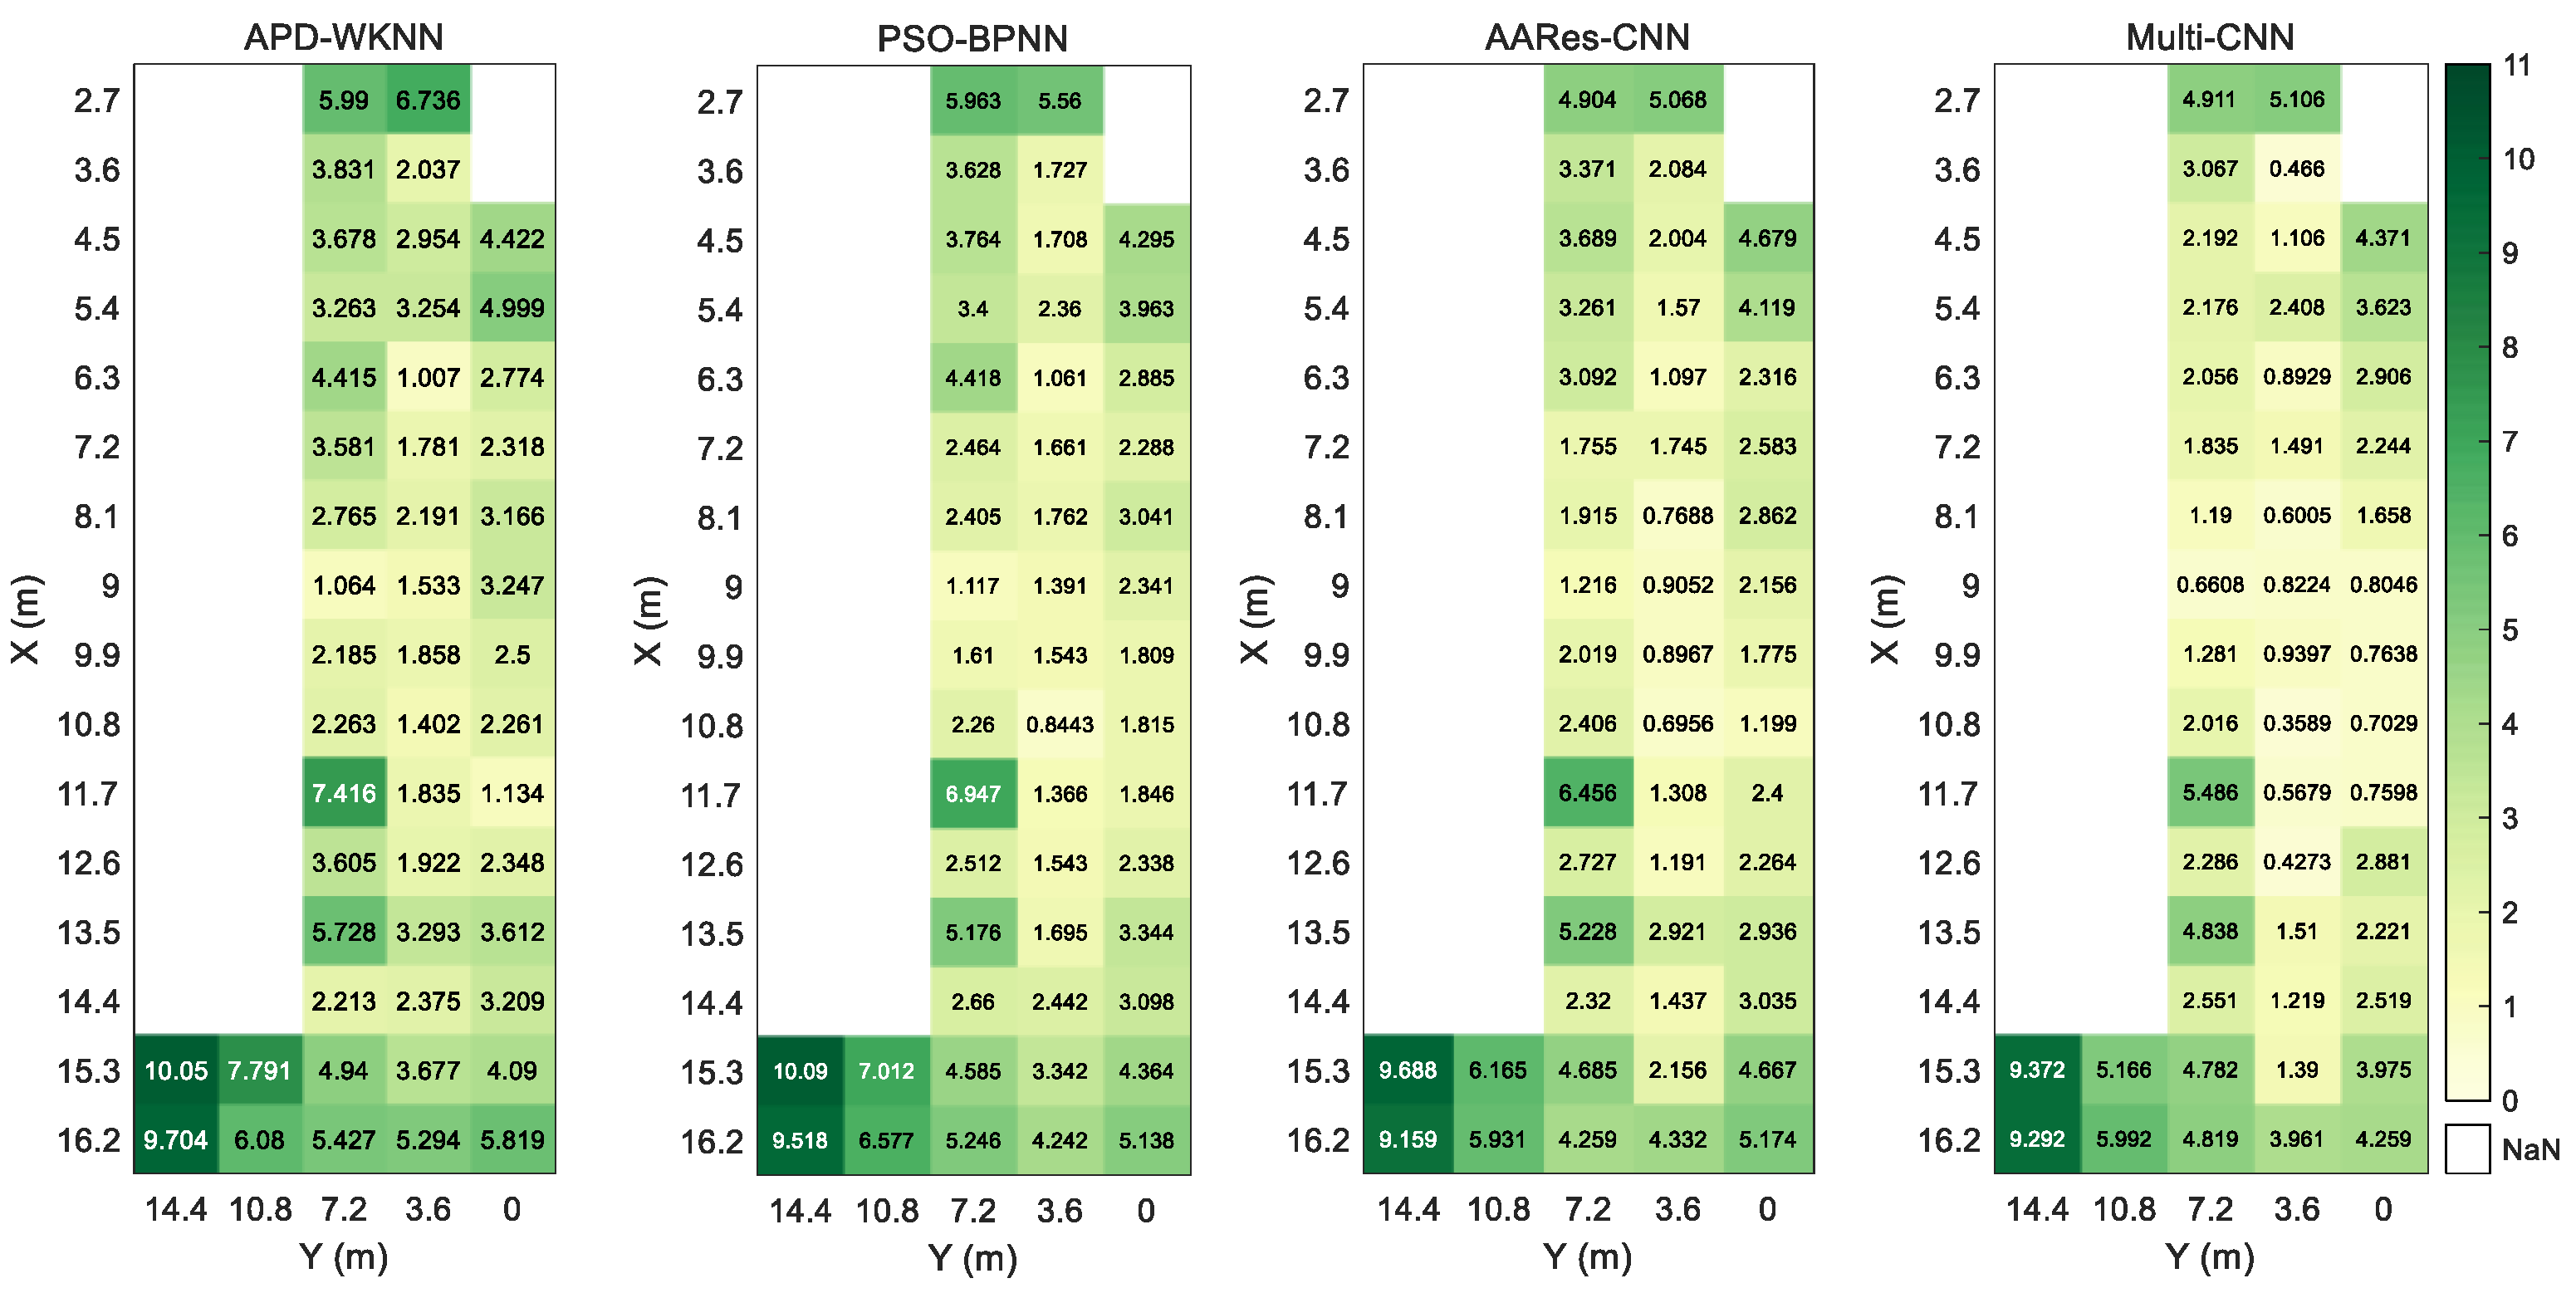
Table 2.
Experimental equipment parameters.
| Name | Type | |
| Magnetometer | Wit-motion HWT901B-232 | Output frequency: 100 Hz |
| Accuracy: 1 μT | ||
| 5G Receiver | LWB210XT | Output frequency: 50 Hz |
| Sub-carriers: 60 | ||
| Receiver antenna: 1 Transmitter antenna: 2 |
Table 3.
Statistical errors of different combinations.
| Sampling time (s) | Mean error (m) | Maximum error (m) | Minimum error (m) |
| 1 | 2.31 | 6.25 | 0.16 |
| 2 | 2.20 | 5.81 | 0.04 |
| 3 | 1.83 | 4.62 | 0.17 |
| 4 | 1.71 | 4.31 | 0.02 |
| 5 | 1.63 | 3.48 | 0.08 |
Disclaimer/Publisher’s Note: The statements, opinions and data contained in all publications are solely those of the individual author(s) and contributor(s) and not of MDPI and/or the editor(s). MDPI and/or the editor(s) disclaim responsibility for any injury to people or property resulting from any ideas, methods, instructions or products referred to in the content. |
© 2024 by the authors. Licensee MDPI, Basel, Switzerland. This article is an open access article distributed under the terms and conditions of the Creative Commons Attribution (CC BY) license (http://creativecommons.org/licenses/by/4.0/).
Copyright: This open access article is published under a Creative Commons CC BY 4.0 license, which permit the free download, distribution, and reuse, provided that the author and preprint are cited in any reuse.


