Submitted:
08 October 2025
Posted:
09 October 2025
You are already at the latest version
Abstract
The rapid growth of on-demand services in Sub-Saharan Africa has intensified reliance on internal combustion engine (ICE) motorcycles for last-mile delivery, with Cape Town exemplifying both the opportunities and challenges of this trend. While motorcycles provide affordable and flexible mobility, their disproportionate emissions, high operating costs, and exposure to volatile fuel prices create pressing economic and environmental concerns. This paper investigates the implications of electrifying Cape Town’s last-mile delivery fleet by modelling the operational dynamics of nearly 39,000 delivery trips performed by 385 motorcycles. Using empirical data, the study simulates fleet electrification under two battery-swapping scenarios – daytime swapping only and a hybrid swapping plus overnight charging model – while testing unmanaged and managed charging strategies. Results show that fleet optimisation could reduce system resources by more than 50%, lowering capital and grid burdens, with managed charging offering long-term operational savings. Managed charging approaches, particularly off-peak balancing and solar-following, successfully mitigate grid strain and enhance solar utilisation, though they demand larger battery pools, a trade-off quantified by a techno-economic analysis. Crucially, pairing electrification with decentralised solar generation demonstrates the potential for a resilient, net-zero system insulated from load shedding. The findings provide a transferable framework for African cities to decarbonise urban logistics while safeguarding rider livelihoods and grid stability.
Keywords:
electric motorbikes
; boda boda
; last-mile delivery
; sub-Saharan Africa
; grid impact
; battery swapping
; sustainable transport
1. Introduction
The rapid expansion of the digital economy across Sub-Saharan Africa has fuelled a dramatic increase in on-demand services, with the last-mile delivery sector at its forefront. In cities like Cape Town, motorcycles have become the backbone of this logistics network, offering a nimble and cost-effective solution to urban congestion [1]. However, this reliance on conventional internal combustion engine (ICE) motorcycles has introduced substantial negative externalities. The average internal combustion engine (ICE) based ICE motorcycle is ten times more polluting per km than a passenger vehicle, contributing to severe urban air pollution and associated health crises [2]. Furthermore, the operational costs, driven by volatile fuel prices and maintenance, place a considerable burden on the riders, many of whom operate within the informal economy in the region [3]. Broadly, this final step of the delivery process is considered the most critical, least efficient, and most expensive element of the logistics supply chain [4].
1.1. The Necessity of Research in a Sub-Saharan African Context
The last-mile delivery market in Africa is not merely growing; it is undergoing rapid expansion. Valued at USD 1.45 billion in 2024, it is projected to reach USD 3.02 billion by 2033, expanding at a compound annual growth rate (CAGR) of 8.45% [1]. This growth is intrinsically linked to the proliferation of commercial motorcycles, colloquially known as boda bodas or motos in other parts of the continent. In cities like Kampala, these motorcycle taxis have become an indispensable part of the urban mobility system, often filling gaps in service left by formal collective public transport [12]. These vehicles are a primary source of employment for millions of young people, providing essential income-generating opportunities in urban centres characterised by high unemployment [5]. In South Africa alone, the two-wheeler market is forecast to grow at a CAGR of 19% between 2025 and 2029 [6].
However, this growth comes at a steep environmental and social cost. The transport sector is a major contributor to greenhouse gas emissions in South Africa, and the surge in motorcycle numbers exacerbates this problem [7]. The reliance on imported fossil fuels also creates economic vulnerability, with riders directly exposed to global oil price fluctuations [3]. South Africa’s nascent motorcycle market is expected to electrify at an annual rate of 6% from 2024 to 2030 [6].
A primary concern for any large-scale electrification strategy in South Africa is the state of the national electricity grid, from generation to distribution networks. The country faces a persistent energy crisis, managed by the national utility, Eskom, through a system of rotational blackouts known as “load shedding” [15]. These generation challenges are exacerbated by ageing infrastructure. This unreliability presents a significant obstacle to at-scale EV charging, which requires a stable and consistent power supply. Introducing a substantial new demand from a fleet of electric motorcycles without careful planning could further strain the fragile grid [16].
Research on the electrification of this sector is therefore not an academic exercise but a critical necessity. It addresses the urgent need to decouple economic growth and job creation from environmental degradation and economic precarity. Understanding the specific operational dynamics, economic models, and policy levers applicable to Cape Town is crucial for developing a scalable and sustainable e-mobility ecosystem that can serve as a model for other African cities.
1.2. Existing Research on E-Motorcycle Adoption in Africa
While the Northern Hemisphere has seen extensive research into electric vehicles, academic inquiry into the electrification of motorcycles in the African context is an emerging, yet rapidly growing, field. Early studies focused on the potential for local manufacturing and the broad economic benefits of shifting to e-mobility [8]. More recent research has become increasingly granular, leveraging empirical data to analyse real-world performance and impacts. For instance, an impact assessment in Kampala, Uganda, provided a foundational analysis of the environmental and social effects of introducing electric motorcycles, establishing the clear benefits and challenges of such a transition [14].
A recent study conducted in Nairobi, Kenya, provides a robust comparative dataset tracking the performance of both fuel and electric motorcycles under actual transit conditions [9]. Building on this, further research in Nairobi quantified the tangible benefits observed in a pilot program, demonstrating that electric motorcycles could reduce daily carbon dioxide emissions by 85%, despite the country’s reliance on renewable sources of energy. The study also highlighted the critical role of charging infrastructure, finding that a battery swapping model is significantly more effective at managing grid load compared to individual home charging, and is particularly well-suited for integration with solar power [10]. These findings from Nairobi are highly relevant to Cape Town, as both cities share similar challenges of urban congestion and a growing on-demand delivery market.
1.3. Environmental Benefits of Electrification
The most immediate benefit of electrification in sub-Saharan Africa is the drastic improvement in urban air quality. Electric motorcycles produce zero tailpipe emissions, eliminating pollutants such as particulate matter that are responsible for respiratory illnesses and other public health issues [2]. A full-scale transition in a city like Cape Town would lead to a measurable reduction in urban smog and a healthier environment for its citizens. Furthermore, on a national level, it contributes to South Africa’s climate commitments under its Just Energy Transition (JET) Partnership by decarbonising a significant and growing segment of the transport sector [11].
1.3.1. Battery Swapping Systems
Instead of plugging the motorcycle directly into the grid for several hours, battery swapping allows riders to exchange a depleted battery for a fully charged one in a matter of minutes at a dedicated station [10]. This model has several advantages. Firstly, it decouples the act of charging from the vehicle’s operational time, eliminating downtime for riders. Secondly, the batteries at the swapping stations can be charged strategically during off-peak hours or when renewable energy is abundant, thereby helping to balance the grid rather than strain it.
1.3.2. Solar Offsetting and Decentralised Generation
The most promising solution is to pair charging infrastructure with decentralised renewable energy, particularly solar photovoltaics (PV). South Africa has abundant solar resources, and the cost of solar PV has fallen dramatically [17]. Charging stations, especially battery swapping hubs, can be equipped with their own solar panel arrays and battery storage systems. This creates a resilient, off-grid or grid-tied charging network that is immune to load shedding. The specific technology used at these hubs can range from conventional plug-in chargers to advanced wireless power transfer systems, whose efficiency often depends on the design of their underlying compensation networks [18]. Research from the Nairobi context suggests that battery swapping models are exceptionally well-complemented by solar, allowing for up to 51% of the required energy to be harnessed directly from solar PV without the use of smart battery charging systems [10]. This potential is being demonstrated in South Africa, with companies like Zero Carbon Charge planning a national network of completely off-grid, solar-powered charging stations [19]. Another example of the feasibility of this was showcased when a Roam Air electric motorcycle travelled from Nairobi, Kenya, to Stellenbosch, South Africa, powered exclusively by portable solar panels, proving the concept of solar-powered e-mobility on the continent [20].
1.4. The Importance of Planning for Electrification
The transition to electric mobility is not merely a technological substitution but a systemic change that requires deliberate and strategic planning. The Western Cape government has already signalled its commitment to this transition through its EV framework and the introduction of electric vehicles into its own fleet, but a specific focus on the two-wheeler sector is paramount [21].
Effective planning must create a supportive ecosystem. This includes developing clear technical standards for batteries and charging equipment to ensure interoperability and prevent market fragmentation. Financial planning is also crucial. While the total cost of ownership (TCO) is lower, the upfront purchase price of an electric motorcycle can be a significant barrier for low-income riders. Government policies such as tax incentives, subsidies, or public-private partnerships to finance battery swapping infrastructure can help overcome this hurdle [22]. South Africa’s Automotive Masterplan 2035 provides a framework for stimulating local production, which could be leveraged to develop a domestic industry for manufacturing electric motorcycles and their components, creating green jobs and adding value to the local economy [23]. Finally, planning must ensure a “just transition” by providing pathways for retraining and inclusion in the new e-mobility value chain, considering both the impacts on existing mechanics and fuel station operators [11] and the need to create equitable, gender-transformative opportunities for women [13].
The electrification of last-mile delivery motorcycles in Cape Town represents a critical sequence of opportunity for sustainable urban development. The combination of a rapidly growing on-demand economy and the urgent need for climate action makes this transition both timely and necessary. Existing research provides compelling evidence of substantial environmental and economic benefits, including dramatic reductions in emissions and lower operational costs for riders [24]. While South Africa’s constrained electrical grid presents a formidable challenge, it is not insurmountable. Innovative solutions centred on battery swapping systems and decentralised solar power generation offer a viable path toward a resilient and sustainable charging infrastructure that can operate independently of the national grid’s instabilities.
1.5. Research Gap
While the aforementioned studies in Nairobi and Kampala provide invaluable foundational insights into e-motorcycle performance and the benefits of battery swapping, a critical research gap remains. No study to date has developed a data-driven model to evaluate the specific operational and grid-level impacts of electrifying a commercial last-mile delivery fleet within the unique context of Cape Town, South Africa. Previous work has not explicitly accounted for the dual pressures of a rapidly growing delivery market and a severely constrained national grid subject to routine load shedding. Furthermore, while technical feasibility is often assessed, there is a lack of detailed techno-economic analysis quantifying the capital and operational trade-offs of different charging strategies. The sensitivity of these systems to real-world operational variables also remains underexplored.
This raises a central question: what are the specific resource requirements (in terms of bike fleet size, battery fleet size, and number of chargers) for electrifying such a fleet, and what would be the subsequent impact on the grid? Also, what are the sensitivities to they key metrics of the input parameters?
Through a data-driven simulation model, this study tests and validates the hypothesis that a transition to electric motorcycles is not only feasible but can be strategically managed to align with South Africa’s constrained electrical grid and renewable energy potential. To validate this hypothesis, this study evaluates the effects of electrification by: (1) quantifying the required system resources and resultant grid impact; (2) assessing the viability of mitigation strategies, including managed charging and solar integration; (3) evaluating the robustness of the findings through a sensitivity analysis of key operational parameters; and (4) conducting a techno-economic analysis to compare the capital and operational expenditures of each scenario. Finally, the results are contextualised by comparing them to a previous study in Nairobi, providing a tangible, evidence-based framework for commercial operators and policymakers across different African urban environments.
2. Methodology
This study aims to quantify the implications of electrifying an existing fleet of ICE last-mile delivery motorcycles. This fundamentally empirical, data-driven analysis focuses on the resulting grid impact and the required system resources (the number of bikes, batteries, and chargers). Furthermore, it evaluates optimisation techniques, including solar offsetting and strategic charging, to enhance the feasibility of electrification. The experimental workflow of the simulation process is visualised in Figure 1.
2.1. Data Preparation
The analysis is based on operational data from a last-mile delivery service provider in Cape Town, covering orders completed by ICE motorcycles in the Gardens and Rondebosch suburbs. While the dataset lacks exact geographical coordinates, it contains the following key attributes: Driver Number, Order Number, Order Date, Order Time, Leg Failed Reason, Collect Distance, Delivery Distance, and Restaurant Delay Time. To model operational timelines, the duration of each delivery trip was estimated using an assumed average speed of 20 km/h [25] and a fixed two-minute stop time at the delivery location [26].
The dataset spans 14 days and comprises 39,005 trips conducted by a fleet of 385 unique motorcycles. To evaluate the potential for fleet efficiency improvements, a secondary, optimised dataset was generated. This dataset preserves the original order demand but reallocates trips to the minimum required number of motorcycles, reducing the fleet size to 125 bikes with an average of 93 active bikes per day. A summary of the key differences between the original and optimised datasets is provided in Table 1.
A key metric for this study is the bike-day, defined as the complete set of trips performed by a single motorcycle on a single day. Daily trip data were aggregated by bike-day to analyse daily travel patterns. The distribution of daily distances for both the actual and optimised scenarios is visualised in Figure 2a. All scripts developed for data preparation and analysis are openly available in a GitHub repository [27].
2.2. Electrification of the Fleet
To model the grid impact of electrification, the trip data were analysed to establish the daily, half-hourly, and minute-by-minute operational patterns of the fleet. Analysis of trip order times reveals distinct demand peaks during lunchtime (12:00–13:30) and a more pronounced peak during dinnertime (17:30–19:00), as shown in Figure 2c.
At its highest point, the demand reaches nearly 200 orders within a 30-minute interval. The distribution of total trip distances (collection and delivery) is presented in Figure 2b, showing the mean trip distance of 3.41km.
2.2.1. Battery Swapping Approaches
The simulation of an electrified fleet was based on a battery-swapping model. The timing of each swap was determined by simulating two distinct operational swapping approaches:
- Swapping Only: In this model, riders rely exclusively on battery swap stations. A swap is triggered whenever a motorcycle’s current state of charge (SOC) is insufficient for its next scheduled trip. The motorcycle is assumed to carry a single battery.
- Swapping and Overnight Charging: This hybrid model allows riders to swap batteries at stations during the day and also to recharge their battery at a central depot overnight. This ensures every motorcycle begins its daily operations with a fully charged battery.
For both approaches, the additional distance required to travel to a swap station was modelled by randomly sampling from the existing trip distance distribution shown in Figure 2b. Energy consumption was calculated based on a constant efficiency, derived from the specifications of the Roam Air electric motorcycle (Table 2).
The simulation tracked each motorcycle’s battery SOC on a per-trip basis. A swap event was triggered when the remaining range was insufficient for the next trip. At this point, the depleted battery’s SOC was recorded, and it was replaced with a fully charged one, restoring the motorcycle’s range to 75 km. For the Swapping and Overnight Charging scenario, a final charge event was initiated when a motorcycle completed its last trip of the day without replacement of the battery. These simulations produced datasets of charge start events, detailing the time of day, initial SOC, and the projected time to full charge for each battery.
2.3. Battery Charging
The battery charger specifications were configurable within the simulation. The primary results were generated using a charging rate of 0.5C, which corresponds to the manufacturer’s claimed charging time of 3 hours and 45 minutes [28]. The charging process follows a standard Constant Current-Constant Voltage (CC-CV) profile [29], with a charger efficiency of 95%. As the batteries operate between 20% and 100% SOC, the maximum energy transferred in a single charge is 2.592 kWh. The functions defining the grid load and energy transfer are detailed in Appendix A of [10], and the source code is available publicly [30].
2.3.1. Simulating Grid Impact
The aggregate grid impact was simulated using a queued method based on the charge start event data. When a battery was placed on charge, its load profile was added to the cumulative grid load and tracked on a minute-by-minute basis until it reached 100% SOC. This method provides an accurate representation of the total load from all batteries charging simultaneously, allowing for the identification of the magnitude and timing of peak demand for each operational approach.
2.3.2. Solar Offsetting
The potential for solar power to offset the fleet’s grid impact was a key component of this study. Solar radiation data for Cape Town (coordinates: -33.922497, 18.420296) were obtained from the National Solar Radiation Database (NSRDB) [31]. These data were used in the System Advisor Model (SAM) [32] to simulate the generation profile of a 1 kWp solar PV system (5.263) for the study period. The average daily energy generation profile for a 1 kWp system over a full year was then scaled to match the fleet’s average daily energy demand, thereby determining the total PV system size required to achieve a net-zero grid impact on over the entire year. The average daily energy generated by the 1 kWp plant during the winter experimental period was 2.28 kWh with the average for the entire year at 5.53 kWh. The annual average along with the daily average energy use for the fleet of was used to scale the required solar capacity for the system.
2.4. Optimisation
2.4.1. Bike Allocation
As noted previously, the actual fleet allocation presented an opportunity for optimisation. To determine the minimum viable fleet size, trips were treated as a time-sensitive demand to be met by an incrementally expanding pool of motorcycles. The peak number of concurrently active motorcycles determined the minimum fleet size required to satisfy the total mobility demand. While this calculation relies on the estimated trip durations, the substantial reduction in the required fleet size demonstrates ample room for improving resource utilisation. The daily active bikes for both the actual and optimal bike allocations are visualised in Figure 3. The benefits of this become particularly evident when considering the subsequent reduction in battery and charger requirements for a fleet that serves the same demand. This will be investigated further in Section 3.3.
2.4.2. Charging Approaches
Beyond fleet size, battery recharging itself can be optimised through managed charging strategies executed by a smart charging system. The effectiveness of these strategies is compared against a baseline unmanaged charging approach. The three approaches analysed are:
- Unmanaged Charging: This baseline approach represents the simplest charging logic. A depleted battery is placed on charge immediately upon its arrival at a swap station or depot, without consideration for grid conditions or electricity tariffs.
- Solar-Following: This managed strategy prioritises the use of available solar energy. The charging load is shaped to match the solar generation profile as closely as possible. Any batteries that are not fully charged by sunset are topped up using off-peak grid electricity (22:00–06:00).
- Off-Peak Balancing: This managed strategy aims to avoid drawing power during expensive peak and standard tariff periods entirely. All batteries are charged exclusively during the off-peak window (22:00–06:00) to meet the anticipated demand for the following day.
2.5. Simulation Parameters and Sensitivity Analysis
The simulation is based on key operational and technical parameters. The operational parameters are derived directly from the empirical trip data, while the technical specifications are based on the Roam Air motorcycle, as detailed below.
- Demand: An average of 2,786 daily orders, derived from the dataset of 39,005 trips over 14 days.
- Average Speed: 20 km/h, used to estimate trip durations and, in turn, the optimised fleet size.
- Bike Efficiency: 28.94 km/kWh.
- Battery Capacity: 3.24 kWh, with a usable capacity of 2.592 kWh (operating between 20–100% SOC).
2.5.1. Sensitivity Analysis
To evaluate the robustness of our fleet-sizing and peak-load conclusions, a sensitivity analysis was conducted. This analysis tests the model’s conclusions against uncertainty in the baseline assumptions and simulates the impact of broader operational variabilities. The following parameter ranges were investigated:
- Demand (±20%): Scaling the number of daily orders serves as a proxy for seasonality and other market fluctuations, allowing for an assessment of the impact on peak charging loads.
- Average Speed (±5 km/h): This variation accounts for uncertainty in the assumed speed and models the effect of different traffic conditions or service areas, directly testing the robustness of the fleet size calculation.
- Bike Efficiency (±20%): This range accounts for different e-motorcycle specifications and performance variations due to factors like ambient temperature, rider behaviour, and payload.
- Battery Capacity (±20%): This variation models the effect of using different battery technologies and simulates degradation over the battery’s lifespan (SOH) and the impact of partial-charge behaviour.
2.6. Techno-Economic Trade-Off Analysis
To quantify the financial trade-offs between the simulated scenarios, this section presents a techno-economic analysis. The evaluation of capital expenditure (CAPEX) and annual operating expenditure (OPEX) is based on a set of fixed cost assumptions for the required system assets.
The cost for a single battery is set at $1000 (R17,270), which aligns with current market prices for batteries of a similar capacity to the one specified in Table 2 [33]. The price for each charger is fixed at $100 (R1,727), based on chargers with comparable specifications [34]. The baseline price of a Roam Air motorcycle was $1500 in 2022 [35]; applying a 5.7% average annual interest rate yields an estimated current price of $1872 (R32,330) per motorcycle [36], with an additional annual maintenance cost of $300 (R5186) per bike [37]. The electricity tariffs used for OPEX calculations are detailed in Table 3. For the Solar-Following scenarios, the solar plant is scaled to 66kWp with an estimated cost of $0.90 (R15.56) per watt [38], and the cost of a compatible inverter is added as a once-off $3200 (R55317), including installation [39].
The total upfront capital expenditure is calculated using the following equation:
where:
- are the number of bikes, batteries, and chargers.
- are the costs per bike, battery, and charger.
- is the total cost of the solar PV system, including panels and inverter. This term only applies to the Solar-Following scenarios.
The annual operating expenditure is the sum of the annual maintenance and energy costs:
The annual maintenance cost is given by:
The annual energy cost is calculated based on electricity drawn from the grid, weighted by seasonal tariffs. The calculation simplifies the non-off-peak cost by assuming all energy is drawn at the more expensive peak tariff. The seasonally-weighted average tariffs are defined as:
The annual energy cost is then given by:
where:
- is the annual maintenance cost per bike.
- is the average daily energy drawn from the grid (kWh). For non-solar scenarios, . For Solar-Following scenarios, , where is the daily solar yield.
- is the percentage of charging conducted during off-peak hours.
- and are the weighted average off-peak and peak tariffs (R/kWh).
Break-even Analysis. The break-even period in years is calculated to determine how long it takes for the operational savings of a managed approach to offset its higher initial capital cost, relative to its corresponding Unmanaged baseline. The formula is:
The results of this analysis are discussed in Section 3.5.
3. Results
This section presents the results of the electrification simulation, organised into two main parts: grid impact and system resource requirements (the number of bikes, batteries, and chargers). The analysis evaluates the effects of electrifying the fleet, as described in Section 2.2, under both unmanaged and optimised charging scenarios. The objective is to quantify the potential for managed charging strategies to mitigate grid strain, reduce capital outlay, and improve long-term financial and environmental sustainability.
3.1. Grid Impact
3.1.1. Unmanaged Charging
The aggregate grid impact is determined by two primary factors: the number of batteries charging concurrently and their initial state of charge upon commencing a charging cycle. As defined in Section 2.2.1, the two distinct operational models, Swapping Only and Swapping and Overnight Charging, produce different daily grid load profiles. Figure 4 compares the resulting grid loads for each operational model, analysed for both the actual and optimised fleet allocation datasets. While the primary y-axis of the plots shows the grid load per active bike, a metric that varies significantly between the two datasets due to differing daily travel distances (Figure 2a), the secondary y-axis provides a direct comparison of the total fleet grid load.
As shown in Figure 4a, the unmanaged charging of the actual fleet produces high variance in grid load between the two operational approaches.
- The Swapping Only approach results in a flattened, dual-peaked grid load, with an initial peak around 13:00 and a more prominent one between 19:00 and 20:00. The average load peaks at just under 0.2 kW/bike, with a maximum load exceeding 0.7 kW/bike.
- The Swapping and Overnight Charging approach creates a single, significant peak shortly after 20:00. This occurs because the average daily distance (35.58 km) is well below the motorcycle’s 75 km range, meaning very few riders are forced to swap batteries mid-shift (see Figure 2a). Consequently, most riders place their batteries on charge at the depot around the same time, causing a concentrated spike in demand. The average grid load peaks at around 0.43 kW/bike, with the maximum reaching over 0.6 kW/bike.
In contrast, Figure 4b reveals the grid loads for the optimised fleet.
- The Swapping Only profile again shows a distinct double peak at approximately 13:00 and 19:00, with an average peak closer to 0.5 kW/bike and a maximum reaching almost 1.6 kW/bike.
- The Swapping and Overnight Charging approach produces two nearly equal peaks, one around 19:00 and another just before 22:00. This load profile is a direct consequence of the higher average daily travel distance (102.56 km), which now exceeds the 75 km battery range. This operational dynamic necessitates that most motorcycles perform at least one battery swap during their daily shifts. Since riders start the day with a full battery, these swaps tend to occur during or after the evening demand peak (17:30–19:00). The second peak emerges as riders end their shifts and place batteries with varying states of charge on depot chargers. While the resulting twin peaks represent a naturally balanced load for an unmanaged system, this profile can be further optimised by shifting the load to off-peak hours.
Finally, a comparison of Figure 4a and Figure 4b demonstrates that the oversized fleet in the actual dataset results in a substantially more volatile and unpredictable grid load. The wide variance between peak and off-peak demand increases the risk of grid strain. Given that a real-world electrified fleet would be scaled to meet demand efficiently, the remainder of this analysis will focus exclusively on the optimised bike allocation data.
3.2. Managed Charging (Optimised Bike Allocation Only)
The unmanaged grid load profiles can be strategically reshaped to reduce peak demand and align with external factors like electricity tariffs or solar availability. While this offers significant benefits, it also introduces specific system challenges, particularly regarding resource requirements.
3.2.1. Off-Peak Balancing
A primary objective of managed charging is to shift electricity consumption to off-peak periods to minimize energy costs. The Off-Peak Balancing strategy achieves this by charging all batteries exclusively during off-peak tariff hours (22:00–06:00). This ensures enough batteries are pre-charged to sustain the fleet’s operations throughout the subsequent day, which is dominated by higher-cost standard and peak tariff periods (06:00–22:00) that align with operational demand (Figure 2c). While this approach may require a larger pool of batteries, as detailed in Section 3.3, it significantly reduces operating expenditure by procuring energy at the lowest possible tariff.
This strategy is most effectively applied to the `Swapping and Overnight Charging’ operational model. Its goal is to transform the unmanaged, dual-peaked grid load into a single, controlled load profile confined to the off-peak window. Figure 5 illustrates this transformation by comparing the unmanaged load profile against the managed Off-Peak Balancing profile.
As established in the analysis of Figure 4b, the unmanaged load profile has an average peak of just over 0.8 kW/bike and a maximum peak of just under 1.6 kW/bike. In stark contrast, the Off-Peak Balancing strategy produces a stable, flat load profile with an average peak of just 0.6 kW/bike and a maximum of less than 0.8 kW/bike. This represents a reduction of over 20% in the average peak load and 50% in the maximum peak load. The simulation shows that the charging queue is typically serviced by 04:00, allowing the grid load to taper to zero well before the morning peak tariff period begins at 06:00. As summarised in Table 4, this managed approach successfully shifts 99.88% of its energy consumption to off-peak hours, a significant improvement over the 12.21% achieved by the unmanaged approach.
3.2.2. Solar-Following
The second managed strategy, Solar-Following, leverages on-site solar PV generation to further reduce grid dependency and energy costs. The objective is to align the charging load with the solar generation profile, storing as much solar energy as possible during daylight hours. Any remaining energy deficit is met by charging batteries during the overnight off-peak tariff period. The target solar generation profile is derived using the method described in Section 2.3.2. This strategy is applied to the Swapping Only operational model, and its performance is compared against its unmanaged counterpart from Figure 4b. Figure 6a visualises this comparison, contrasting the unmanaged grid load with the Solar-Following profile for the experimental date range and Figure 6b visualises this for the average day.
The unmanaged Swapping Only approach, previously shown in Figure 4b, results in an average load peak of just over 0.5 kW/bike and a maximum of around 0.9 kW/bike. As illustrated in Figure 6a, implementing the Solar-Following strategy during the winter data period shifts this load, with the managed profile peaking at just 0.35 kW/bike and reaching a maximum of 0.45 kW/bike during off-peak hours. Critically, the managed approach increases the utilisation of generated solar power from 82.61% to 98.56%.
It is important to note that these results reflect the low solar irradiance conditions of the data collection period (late May to early June). To illustrate the strategy’s full potential, Figure 6b simulates the system’s performance on an average day for Cape Town. In this scenario, the Solar-Following strategy yields a zero effective grid load during daylight hours, as the fleet is sustained entirely by solar power. This average-day scenario serves as the benchmark for sizing the PV system to achieve net-zero operation (as described in Section 2.3.2). In this optimised case, solar energy utilisation reaches 99.47%, with no grid consumption required during daylight hours.
3.3. System Resources
The preceding analysis demonstrates the effectiveness of managed charging in reshaping the grid load to capitalise on solar generation and off-peak tariffs. However, these strategies introduce a critical trade-off: the benefits of a managed grid load often come at the cost of increased system resource requirements compared to a simple unmanaged approach.
Table 4 provides a comprehensive summary of these trade-offs across all simulated scenarios. The table compares key metrics, including required system resources (bikes, batteries, and chargers), the percentage of solar energy harnessed, and the percentage of charging conducted during off-peak hours. The results are presented for both the actual and optimal fleet allocations. For each allocation, the two swapping approaches are analysed, contrasting the performance of the unmanaged and managed charging strategies. To provide a more representative view of solar potential, the results for the optimal fleet also include an average day scenario.
3.3.1. Actual Bike Allocation
For the actual fleet allocation, an analysis of the Swapping Only approach reveals key trade-offs. While the total battery pool remains similar for both unmanaged and managed charging (around 600 batteries), the required charging infrastructure is substantially reduced with the Solar-Following strategy, which lowers the charger requirement from 210 to 113, a 46% reduction. This is a direct result of the flattened load profile achieved through controlled charging. The managed approach also increases solar energy utilisation by approximately 16% and shifts an additional 53% of charging to off-peak hours.
Under the Swapping and Overnight Charging model for the actual fleet, the Off-Peak Balancing strategy, while successful in shifting 99.88% of the load to off-peak hours and reducing charger needs by 41%, becomes impractical. Its high resource demand of 735 batteries makes it far less feasible than the unmanaged approach, which requires only 420 batteries.
3.3.2. Optimal Bike Allocation
Analysis of the optimal fleet allocation confirms that downscaling the fleet leads to a substantial reduction in required system resources. Across all scenarios, the total battery pool size is reduced by an average of over 50%, making all approaches significantly more feasible.
For the Swapping Only approach during the winter data period, the managed Solar-Following strategy increases battery requirements by 31% (from 229 to 301). However, it reduces the necessary charging infrastructure by 28% to just 72 chargers, the lowest of any scenario. As expected, solar energy utilisation also improves, reaching 98.95%.
The performance of the Solar-Following approach is highly sensitive to seasonality. A simulation for an average day with higher solar yield highlights the inadequacy of the unmanaged approach, which harnesses only 40.69% of available solar energy compared to 99.47% for the managed strategy. Consistent with the winter results, the managed approach requires a larger battery pool (a 37% increase) but fewer chargers (a 10% decrease), demonstrating a stable trade-off profile irrespective of solar yield.
Finally, for the Swapping & Overnight model, the managed Off-Peak Balancing strategy again increases battery demand significantly (by 52%) while offering only a modest 11% reduction in charger requirements. Although this strategy successfully shifts 99.78% of energy consumption to off-peak hours (up from 13.23%), the substantial capital outlay for the larger battery pool calls its economic viability into question when weighed against the operational savings from lower energy tariffs.
3.4. Sensitivity Analysis
The sensitivity of the system to variations in key operational parameters was evaluated, with the results visualised in Figure 7. This analysis reveals which parameters most significantly influence resource requirements and grid impact, and how these impacts differ across the four charging strategies. The tornado plots illustrate the percentage deviation from the baseline scenario for each metric, providing a clear comparison of the magnitude and direction of the effects.
3.4.1. Impact of Demand and Average Speed
As shown in Figure 7a, the required fleet size is exclusively determined by demand and average speed, as these are the primary inputs for the fleet-sizing calculation. A 20% increase in demand necessitates a corresponding ~26% increase in fleet size to maintain service levels, while a 20% decrease allows for an ~18% reduction. Average speed has an inverse effect: a 5 km/h increase (from 20 to 25 km/h) improves asset utilisation, allowing for an 18% fleet reduction, whereas a 5 km/h decrease in speed necessitates a nearly 30% larger fleet to cover the same number of trips.
These two parameters are the most influential across almost all metrics. For instance, in Figure 7d, a 20% increase in demand leads to a peak load increase of between 26–32% for unmanaged and solar-following strategies. Similarly, a decrease in average speed, which increases the total time bikes are on the road, elevates the number of concurrent charging events, increasing the peak load by 5–11%.
3.4.2. Impact on Battery and Charger Infrastructure
The required number of batteries and chargers is sensitive to all tested parameters. As seen in Figure 7b, reducing the usable battery capacity by 20% (simulating degradation) increases the required battery pool by 7–18%, as swaps become more frequent. Conversely, a 20% increase in capacity has a less pronounced effect, reducing the required pool by 4–11%. This asymmetrical impact highlights the diminishing returns of simply adding larger batteries.
Bike efficiency also shows an asymmetrical impact, particularly on the required number of chargers (Figure 7c). A 20% decrease in efficiency (e.g., due to heavier payloads or colder weather) increases the need for chargers by up to 22% for the solar-following strategy, as more energy is consumed and must be replenished within the solar window. However, a 20% improvement in efficiency reduces the charger requirement by a more modest 4–11%.
3.4.3. Impact on Energy Consumption
The total daily energy consumption, shown in Figure 7e, is most sensitive to demand and bike efficiency, as expected. A 20% change in demand results in a proportional ~20% change in energy use. Similarly, a 20% reduction in bike efficiency increases energy consumption by ~25% across all strategies, as more energy is required to cover the same distance. Notably, variations in average speed and battery capacity have a negligible impact on the total energy consumed, affecting only the timing and intensity of the load, not the total volume.
3.5. Techno-Economic Comparison
Based on the methodology outlined in Section 2.6 and the results from Table 4, a techno-economic comparison was performed. This analysis calculated the capital expenditure (CAPEX), operating expenditure (OPEX), and the break-even period for managed strategies relative to their unmanaged counterparts. The comprehensive results are presented in Table 5.
The larger fleet (385 bikes) clearly requires a higher capital expenditure, with its lowest initial expense being just over $1.1 million for the Unmanaged Swapping & Overnight approach. For this fleet size, the lowest annual operating expenditure is $115,500, achieved with the Solar-Following strategy. Transitioning to the optimised fleet (125 bikes) yields significant savings, reducing average capital expenditure by $788,045 (58.9%) and average annual operating expenditure by $77,316 (60.4%).
When comparing unmanaged approaches to their managed counterparts, a clear trade-off emerges. On average, implementing a managed strategy increases CAPEX by $146,475 (16.8%) in exchange for an average annual OPEX reduction of $14,464 (15.0%). However, this effect varies widely depending on the specific scenario:
- The highest CAPEX increase is +27.9% for the 125-bike Swapping Only fleet, while the lowest is just +1.9% for the 385-bike Swapping Only fleet.
- The greatest OPEX savings are -35.1% for the 125-bike Swapping Only fleet, while the smallest savings are -5.5% for the 385-bike Swapping & Overnight fleet.
The break-even analysis, which determines the time required for OPEX savings to offset the higher initial CAPEX of a managed strategy, reveals a wide range of outcomes. The payback period is as short as 1.2 years for the 385-bike fleet with the Solar-Following approach, but extends to an impractical 40.9 years for the same fleet using Off-Peak Balancing. For the optimised 125-bike fleet, the break-even periods are more moderate at 6.5 and 12.5 years, indicating that the long-term financial viability of a managed approach is highly dependent on the specific strategy implemented.
From a long-term financial perspective, the most effective strategy combines the optimised 125-bike fleet with the Solar-Following approach. The initial fleet optimisation provides the most substantial cost savings, while the Solar-Following strategy yields the greatest ongoing OPEX reduction (-35.1%) for this fleet size. Its 6.5-year break-even period represents a practical payback time frame, making it a superior long-term investment compared to other managed options.
3.6. Comparison of Results to Previous Studies
The findings from this study on Cape Town’s last-mile delivery fleet can be further contextualised through a comparison with a similar analysis conducted on electrifying “boda boda” motorcycle taxis in Nairobi, Kenya [10]. While both studies conclude that electrification is feasible and that battery swapping is a superior model for managing grid load, several key differences in their operational dynamics lead to distinct outcomes regarding energy consumption and grid impact.
A primary distinction lies in the operational intensity and structure of the two fleets. The optimised last-mile delivery fleet in Cape Town exhibited a higher average daily travel distance of 103 km per bike, compared to the 85 km per bike recorded for the Nairobi boda boda fleet. This divergence is likely attributable to the nature of the services provided. The Cape Town fleet operates within a structured, high-demand last-mile delivery market with concentrated operational periods, whereas the Nairobi fleet provides general-purpose taxi services with more varied and less predictable travel patterns. Consequently, the daily energy consumption per vehicle in Cape Town is higher, at approximately 3.75 kWh, compared to Nairobi’s 3.11 kWh.
These operational differences directly influence the resulting grid impact. In an unmanaged charging scenario, the peak load per bike in Cape Town was substantially higher (over 0.8 kW/bike) than in Nairobi (approximately 0.58 kW/bike). This disparity can be explained by the synchronised demand patterns inherent in last-mile delivery. The pronounced lunch and dinner peaks in Cape Town (Figure 2c) lead to a concentration of battery swaps and charging events within narrow time windows, creating a more intense, consolidated grid load. In contrast, the more distributed and individualised trip patterns of Nairobi’s boda bodas result in a more naturally staggered charging demand throughout the day, leading to a lower and more spread-out peak load.
Finally, a key finding unique to this study is the significant potential for fleet optimisation. The analysis revealed that the actual Cape Town fleet was oversized by more than 50%, a factor not investigated in the Nairobi study. This suggests that the last-mile delivery market in Cape Town may be more saturated or less efficiently coordinated compared to Nairobi’s boda boda ecosystem, where riders may operate more independently in response to fluctuating demand. Therefore, while both studies affirm the benefits of managed, solar-integrated electrification, this research adds a critical insight: operational optimisation is a foundational prerequisite for minimising capital expenditure and mitigating grid strain in a commercial fleet context.
4. Conclusions
The electrification of last-mile delivery motorcycles in Cape Town, a sector critical to the city’s rapidly expanding app-based delivery market, presents a viable pathway to mitigate the negative environmental and economic externalities of conventional fleets. Through a data-driven simulation model, this study tests and validates the hypothesis that a transition to electric motorcycles is not only feasible but can be strategically managed to align with South Africa’s constrained electrical grid and renewable energy potential. Our analysis yields several key conclusions that can inform policy and operational planning.
First, fleet optimisation is a foundational prerequisite for a cost-effective transition. The results demonstrate that scaling the fleet to match demand reduces the required system resources (batteries and chargers) by over 50%. This initial step is paramount, as it drastically lowers the capital investment by nearly 60% and reduces long-term operational costs proportionally, making the entire proposition more financially attainable.
Second, managed charging is essential for mitigating grid impact, but it introduces a critical strategic trade-off. While unmanaged charging creates volatile and high-peaking loads, managed strategies like Off-Peak Balancing and Solar-Following successfully shift demand to more desirable periods. However, this control comes at the cost of requiring a larger battery pool. This highlights a key decision for operators: a higher upfront investment in batteries can significantly reduce long-term operational costs. Our analysis shows this can lead to break-even periods as short as 6.5 years for a solar-integrated strategy, justifying the initial capital outlay.
Third, our sensitivity analysis reveals that system requirements and grid impact are most sensitive to variations in demand and average travel speed. This indicates that accurate demand forecasting and efficient route management are the most critical operational factors for successfully planning and scaling an electric fleet, more so than marginal gains in vehicle or battery efficiency.
The comparison with a similar study in Nairobi highlights the importance of local context. The higher operational intensity and synchronised demand peaks of Cape Town’s last-mile delivery market result in a more concentrated grid load than Nairobi’s boda boda taxi fleet. This underscores that while the electrification framework is transferable, solutions must be tailored to the specific operational dynamics of each city.
Finally, solar offsetting offers a clear path to sustainable, grid-resilient operations. The analysis shows that a carefully sized solar PV system, particularly when paired with a Solar-Following charging strategy, can sustain the entire fleet’s energy needs on an average day, effectively creating a net-zero system that is insulated from load shedding.
By combining operational efficiency through fleet optimisation with intelligent, solar-integrated charging infrastructure, Cape Town can decarbonise its vital last-mile delivery sector, improve urban air quality, and enhance the economic stability of its riders. The validated simulation model and its findings constitute a transferable framework for other African cities, charting a data-driven course towards sustainable urban logistics.
Funding
This research received funding from the Western Cape Government Motorised Transport department.
Data Availability Statement
The data used for this research can be made available on request.
Acknowledgments
During the preparation of this manuscript/study, the author(s) used Gemini Pro 2.5 for the purposes of data visualisation enhancements and grammar/spelling correction. The authors have reviewed and edited the output and take full responsibility for the content of this publication.
Conflicts of Interest
The authors declare no conflicts of interest.
Abbreviations
The following abbreviations are used in this manuscript:
| CAGR | Compound Annual Growth Rate |
| CAPEX | Capital Expenditure |
| CC-CV | Constant Current-Constant Voltage |
| EV | Electric Vehicle |
| ICE | Internal Combustion Engine |
| JET | Just Energy Transition |
| NSRDB | National Solar Radiation Database |
| OPEX | Operating Expenditure |
| PV | Photovoltaic |
| SAM | System Advisor Model |
| SOC | State of Charge |
| SOH | State of Health (Battery) |
References
- Straits Research. Africa Last-Mile Delivery Market. Straits Research, 2023. Available online: https://straitsresearch.com/report/africa-last-mile-delivery-market (accessed on 10 August 2025).
- United Nations Environment Programme. Kenya gets a breather, courtesy of electric motorcycles. UNEP, 2021. Available online: https://www.unep.org/news-and-stories/story/kenya-gets-breather-courtesy-electric-motorcycles (accessed on 10 August 2025).
- Intro.Africa. E-Mobility in Africa. Available online: https://intro.africa/story/e-mobility-in-africa/ (accessed on 22 August 2025).
- Zhu, X.; Cai, L.; Lai, P.L.; Wang, X.; Ma, F. Evolution, challenges, and opportunities of transportation methods in the last-mile delivery process. Systems, 2023, 11, 509. [CrossRef]
- Aladegbola, I. A. The political economy of ’Okada’ transport business as an employment strategy in Nigeria. Journal of African Political Economy and Development, 2018, 3. Available online: https://www.afec-japed.org/sites/default/files/2019-12/2.Vol_.3-2018-%20Aladegbola.pdf (accessed on 22 August 2025).
- Mordor Intelligence. South Africa Two-Wheeler Market Size & Share Analysis. Mordor Intelligence, 2024. Available online: https://www.mordorintelligence.com/industry-reports/south-africa-two-wheeler-market (accessed on 10 August 2025).
- Masikane, S., Dube, L. & Mtshali, S. Transitioning to electric mobility in South Africa: A consumer-centric, multi-stakeholder approach. South African Journal of Science, 2024, 120(3/4). Available online: https://sajs.co.za/article/view/21845/24066 (accessed on 22 August 2025).
- Policy Research in International Services and Manufacturing (PRISM). The Case for Electric Two-Wheeler Vehicles in Africa. University of Cape Town, 2019. Available online: https://commerce.uct.ac.za/sites/default/files/content_migration/commerce_uct_ac_za/869/files/PRISM-WorkingPaper%25202019-1.pdf (accessed on 10 August 2025).
- Mbutura, A., Kitetu, M., Stratford, H. & Booysen, M. J. Nairobi Motorcycle Transit Comparison Dataset: Fuel vs. Electric Vehicle Performance Tracking. Data in Brief, 2023, 51. [CrossRef]
- Stratford, H.; Booysen, M.J. The Impact of Electrifying Last-Mile Delivery Motorcycles on the Grid in an African City. World Electric Vehicle Journal, 2025. [CrossRef]
- Just Energy Transition Partnership. South Africa Just Energy Transition Investment Plan. JETP, 2022. Available online: https://justenergytransition.co.za/wp-content/uploads/2024/10/South-Africas-Just-Energy-Transition-Investment-Plan-JET-IP-2023-2027-FINAL-1.pdf (accessed on 10 August 2025).
- Saddier, S. Are motorcycle taxis competing with collective public transport? Analyzing the role of boda-bodas in Kampala’s urban mobility system. Research in Transportation Economics, 2025, 101562. [CrossRef]
- Nakijoba, S., Courtright, T. & Said, T. E-Mobility as a Driver for Change: Towards a Gender Transformative and Just Transition to Electric Mobility. UN Environment Programme, African E-Mobility Alliance, 2024. Available online: https://sustmob.org/EMOB/pdf/EMOB_Uganda_GenderReport.pdf (accessed on 12 August 2025).
- Calzavara, J., Courtright, T. & Park, J. Environmental and Social Impact Assessment of Electric Motorcycles in Kampala, Uganda. University of Michigan, 2021.
- EcoFlow. What Is Load Shedding? EcoFlow, 2025. Available online: https://www.ecoflow.com/za/blog/what-is-load-shedding (accessed on 25 August 2025).
- Pretorius, B.G., Strauss, J.M. & Booysen, M.J. Grid and mobility interdependence in the eventual electrification of operational minibus taxis in cities in sub-Saharan Africa. Energy for Sustainable Development, 2024, 80, 101438. Available online: https://www.sciencedirect.com/science/article/pii/S0973082624000371 (accessed on 20 August 2025).
- GreenCape. 2023 Market Intelligence Report: Energy Services. GreenCape, 2023. Available online: https://greencape.co.za/wp-content/uploads/2025/04/Energy-Services-2025.pdf (accessed on 10 August 2025).
- Wang, H. S.; Cheng, K. W. E.; Hu, J. F. An Investigation of Compensation Networks for Three-coil Wireless Power Transfer. In Proceedings of the 2020 8th International Conference on Power Electronics Systems and Applications (PESA), Hong Kong, China, 7–10 December 2020; pp. 1–6.
- Zero Carbon Charge. About Us. Zero Carbon Charge, 2023. Available online: https://charge.co.za/wp-content/uploads/2025/03/CHARGE-A5Booklet.-Edition5-V4.digital-March-2025.pdf (accessed on 11 August 2025).
- CBN. Electric motorcycle developed in Africa successfully completes 6000km journey from Nairobi to Stellenbosch using only solar power. CBN, 2024. Available online: https://cbn.co.za/featured/electric-motorcycle-developed-in-africa-successfully-completes-6000km-journey-from-nairobi-to-stellenbosch-using-only-solar-power/ (accessed on 25 August 2025).
- South African Government. Western Cape Mobility initiatives introduce electric vehicles. SA Gov, 2023. Available online: https://www.gov.za/news/media-statements/western-cape-mobility-initiatives-introduce-electric-vehicles-06-apr-2025 (accessed on 10 August 2025).
- Department of Trade, Industry and Competition. Electric Vehicle White Paper for South Africa. Government of South Africa, 2023. Available online: https://www.thedtic.gov.za/wp-content/uploads/EV-White-Paper.pdf (accessed on 18 August 2025).
- Department of Trade, Industry and Competition. South Africa Automotive Masterplan 2035. DTIC, 2021. Available online: https://www.thedtic.gov.za/wp-content/uploads/Masterplan-Automotive_Industry.pdf (accessed on 10 August 2025).
- GreenCape. 2023 Market Intelligence Report: Electric Vehicles. GreenCape, 2023. Available online: https://greencape.co.za/wp-content/uploads/2025/04/Electric-vehicles-2025.pdf (accessed on 10 August 2025).
- TomTom. Cape Town Traffic Index. TomTom, 2025. Available online: https://www.tomtom.com/traffic-index/cape-town-traffic/ (accessed on 25 August 2025).
- The Larry vs Harry Team. Last Mile Delivery Study. Larry vs Harry, 2023. Available online: https://larryvsharry.com/blogs/business-stories/last-mile-delivery-study (accessed on 21 August 2025).
- Stratford, H. Cape Town Electric Motorcycle Last-Mile Delivery Comparison Scripts. Available online: https://github.com/HallyStrats/cpt_impact_study (accessed on 12 July 2025).
- Roam. Motorcycles: Roam Air. Available online: https://www.roam-electric.com/motorcycles (accessed on 12 June 2025).
- Kristiansen, T. E.; Nordgård-Hansen, E.; Hoff, K. A. Electric Vehicles: Battery Capacity, Charger Power, Access to Charging and the Impacts on Distribution Networks. Preprint, 2020. Available online: https://www.researchgate.net/publication/341262399_Electric_vehicles_Battery_capacity_charger_power_access_to_charging_and_the_impacts_on_distribution_networks (accessed on 12 June 2025).
- HallyStrats. Li-ion charging profile source code. Available online: https://github.com/HallyStrats/li-ion_charging_profile (accessed on 12 June 2025).
- National Solar Radiation Database. Data Viewer. Available online: https://nsrdb.nrel.gov/data-viewer (accessed on 13 May 2025).
- System Advisor Model. SAM: System Advisor Model. Available online: https://sam.nrel.gov/ (accessed on 13 May 2025).
- LeapTrend. How Much Does An Electric Motorcycle Battery Cost. LeapTrend, 2023. Available online: https://leaptrend.com/blogs/news/how-much-does-an-electric-motorcycle-battery-cost#:~:text= Capacity%20(kWh):,performance%20models):%20$4%2C500%E2%80%93$7%2C000 (accessed on 29 August 2025).
- Amazon. Battery Charger Aluminum Durable Connector. Amazon, 2023. Available online: https://www.amazon.com/Battery-Charger-Aluminum-Durable-Connector/dp/B0BQDSKSH4 (accessed on 29 August 2025).
- Business Day. Roam Air is a made-in-Africa electric motorcycle. Business Day, 2022. Available online: https://www.businesslive.co.za/bd/life/motoring/2022-08-04-roam-air-is-a-made-in-africa-electric-motorcycle/ (accessed on 29 September 2025).
- Statistics South Africa. Headline CPI (All urban areas) Annual inflation rate. Statistics South Africa, 2025. Available online: https://www.statssa.gov.za/wp-content/uploads/2025/01/cpi3.jpg (accessed on 29 September 2025).
- HappyRun Sports. What Are The Maintenance Costs Of An Electric Motorcycle? HappyRun Sports, 2024. Available online: https://www.happyrunsports.com/blogs/electric-motorcycle/what-are-the-maintenance-costs-of-an-electric-motorcycle (accessed on 30 September 2025).
- GoSolr. Solar System Prices in South Africa 2024. GoSolr, 2024. Available online: https://www.gosolr.co.za/enlighten/articles/solar-system-prices (accessed on 30 September 2025).
- SP Energy. Deye 60kW Inverter Grid-Tied 3 Phase. SP Energy, 2024. Available online: https://sp-energy.co.za/product/deye-60kw-inverter-grid-tied-3-phase/ (accessed on 30 September 2025).
Figure 1.
Experimental workflow.
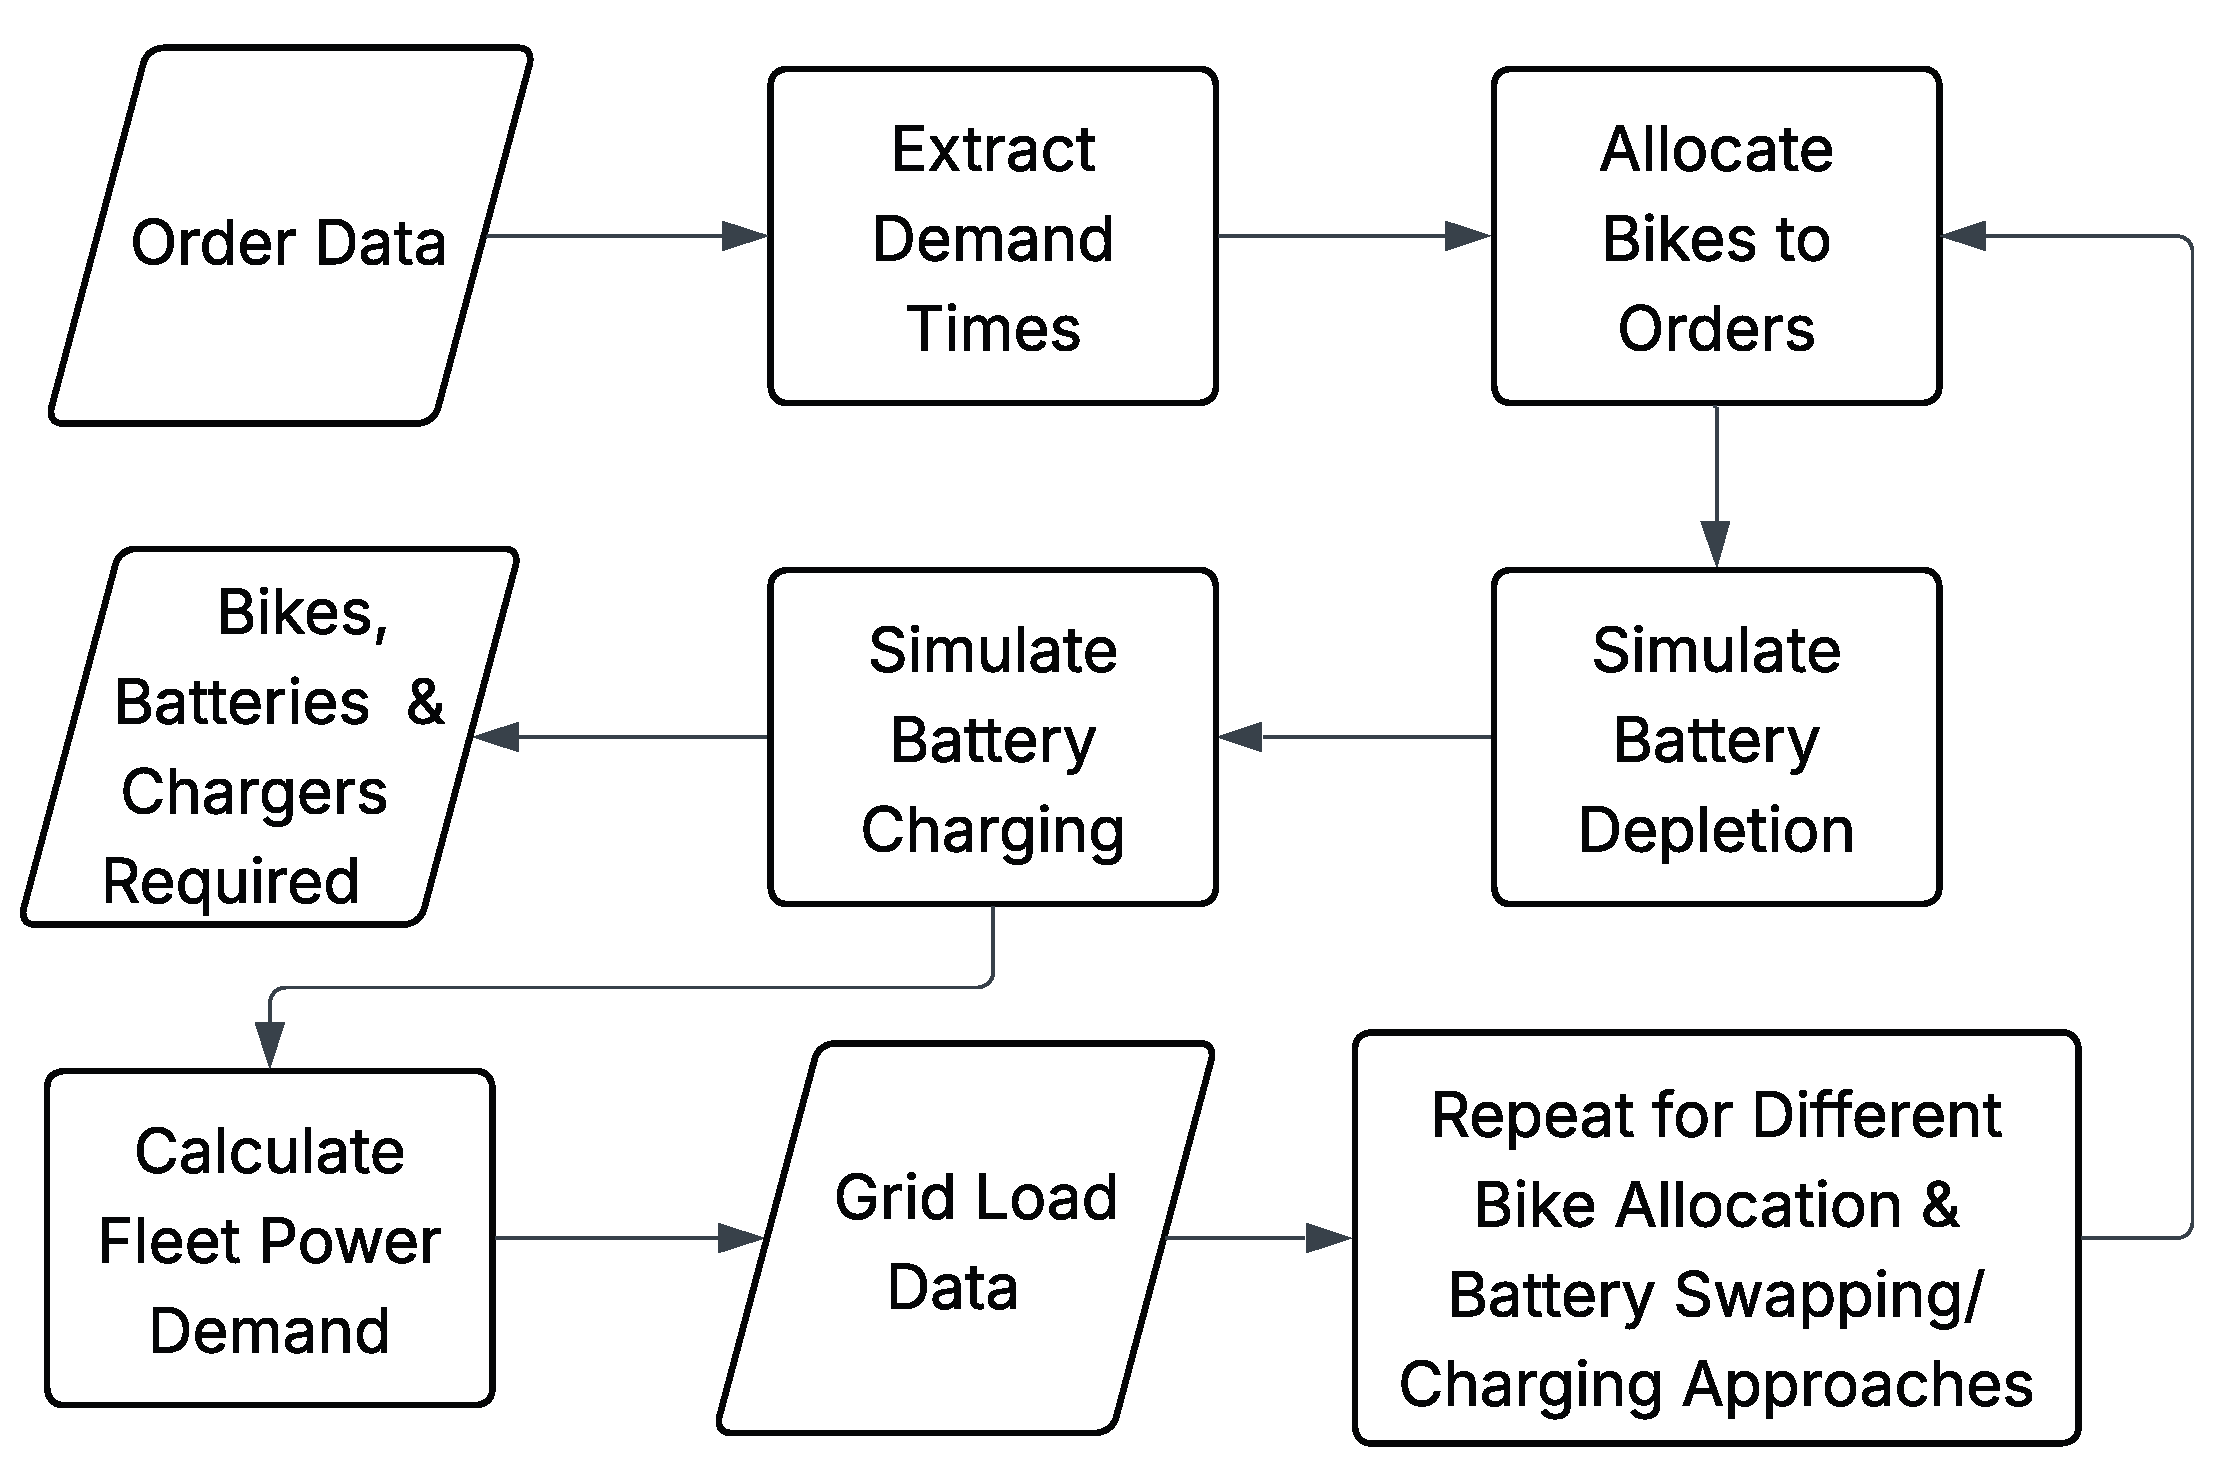
Figure 2.
Operational data distributions showing (a) total daily distance per bike, (b) individual trip distances, and (c) trip order times revealing demand peaks.
Figure 2.
Operational data distributions showing (a) total daily distance per bike, (b) individual trip distances, and (c) trip order times revealing demand peaks.
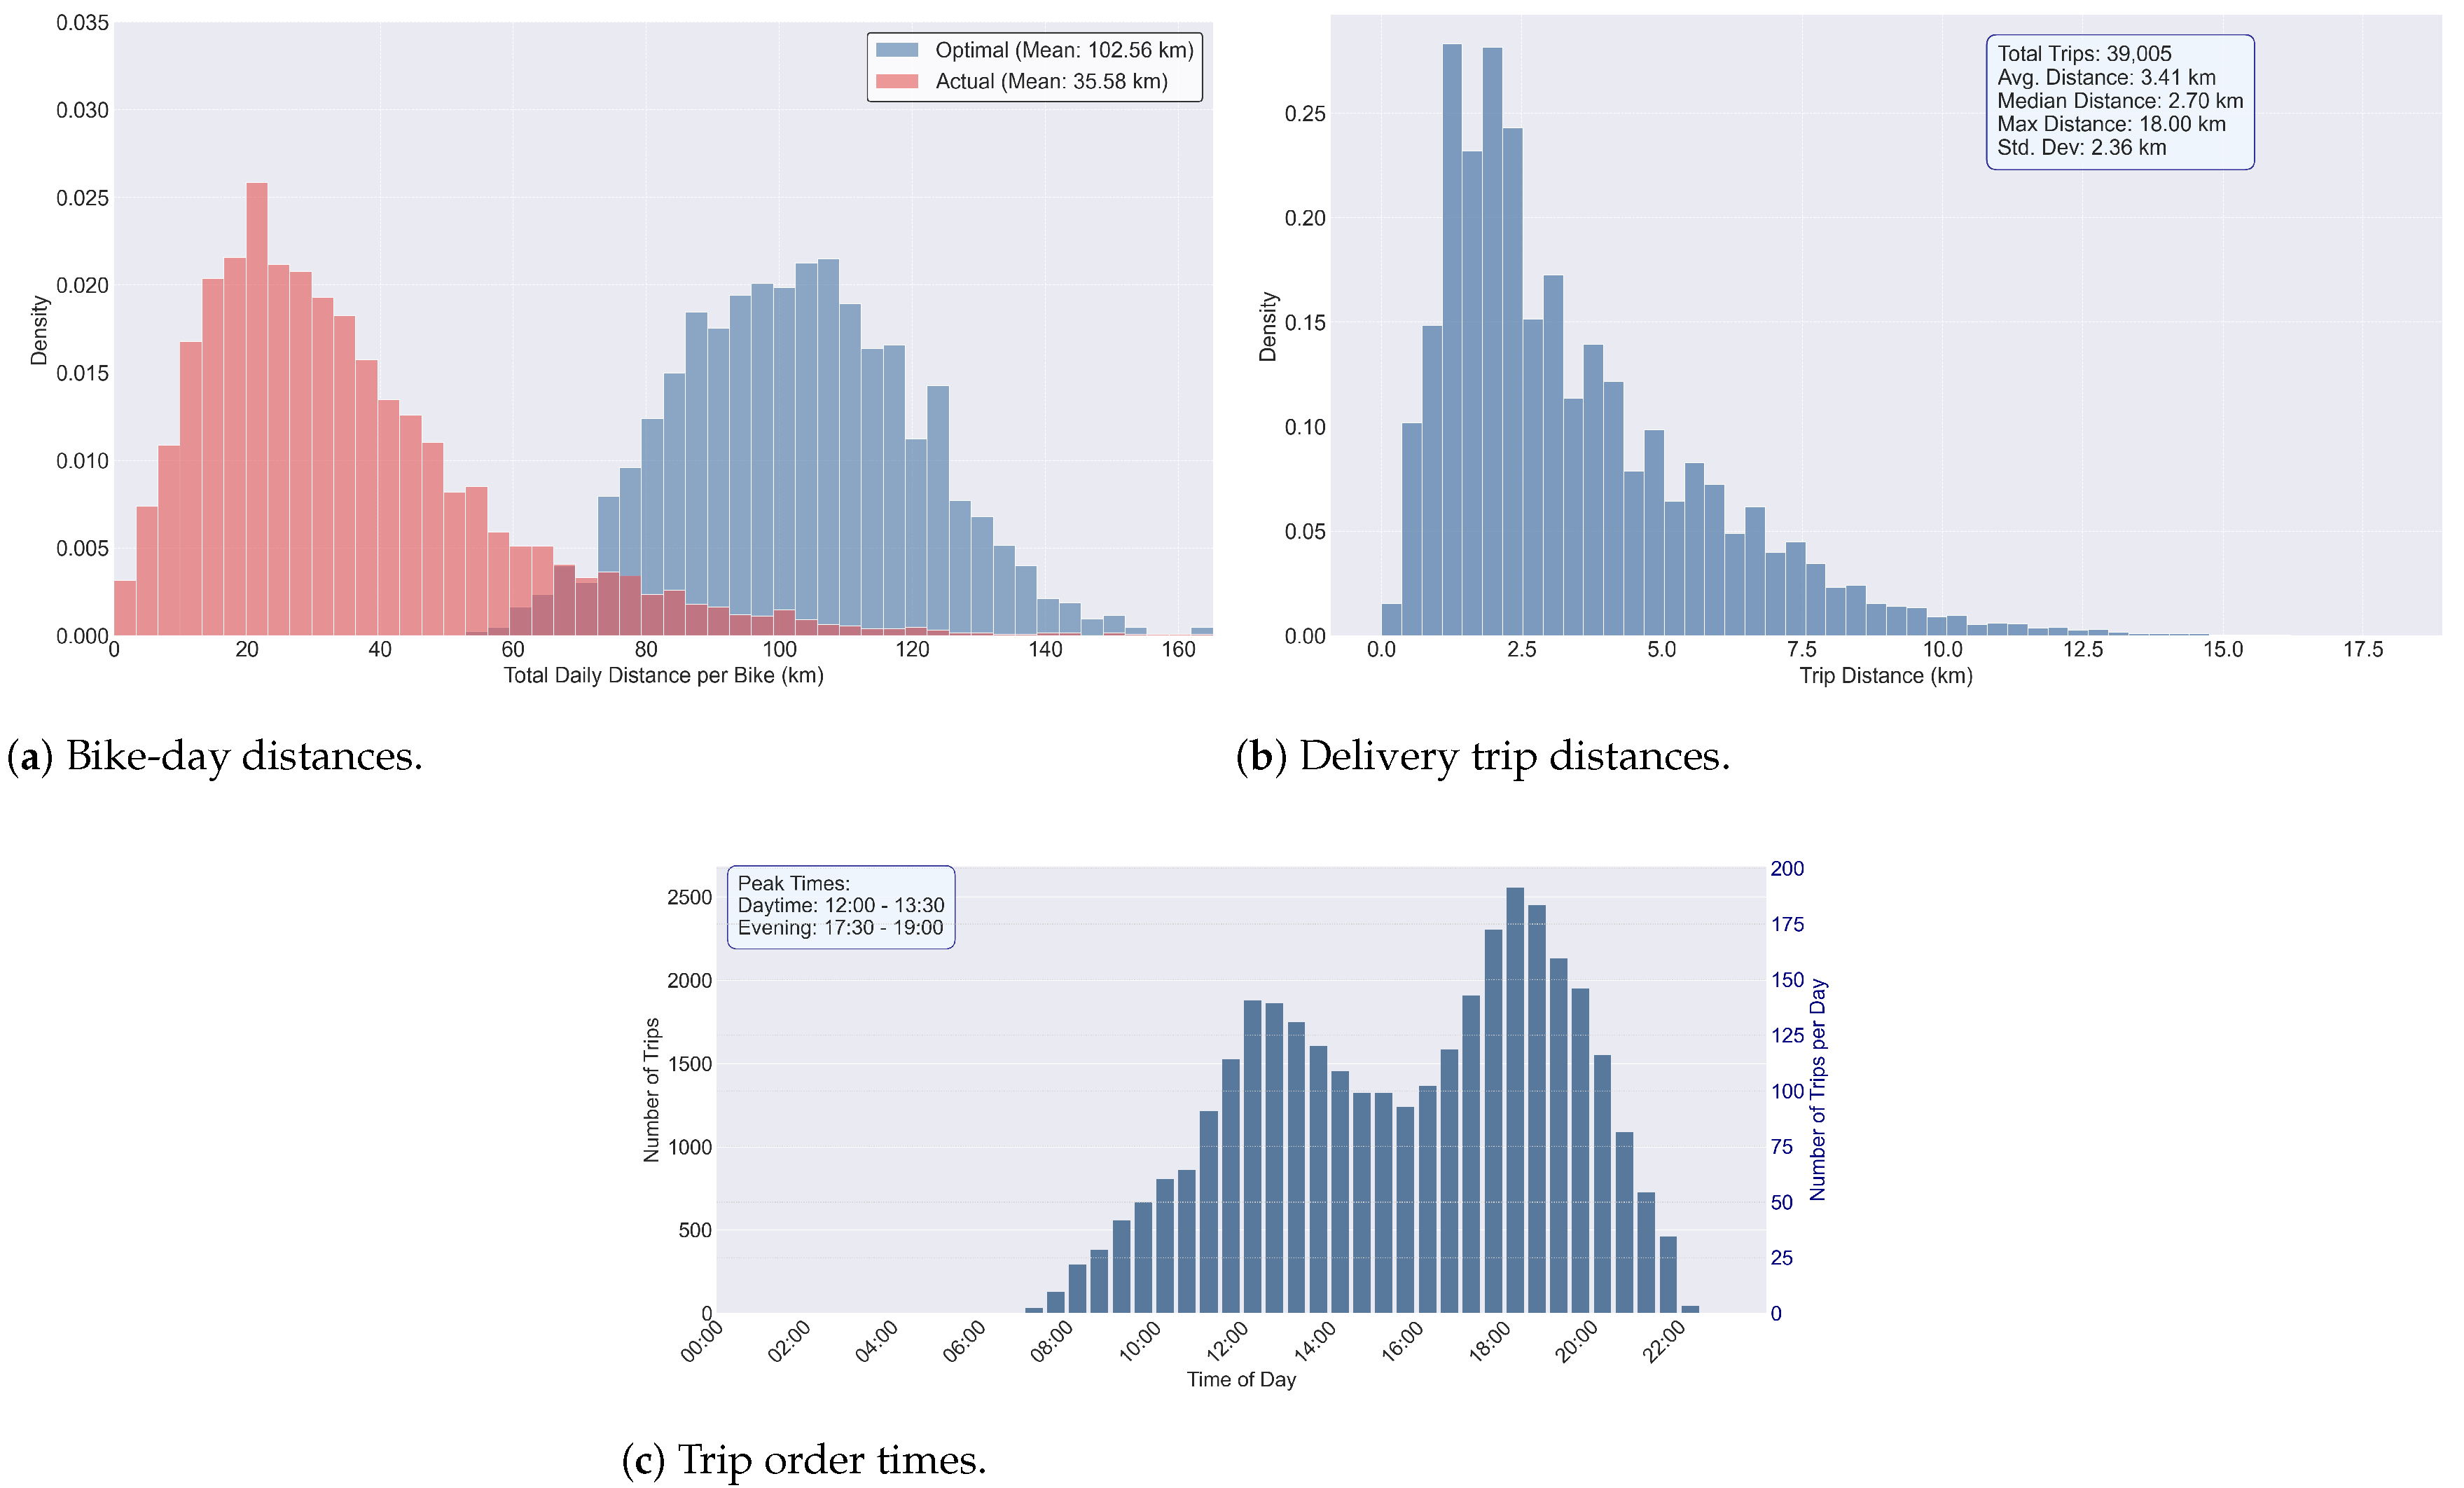
Figure 3.
Plot showing daily active bikes for actual and optimal bike allocation.
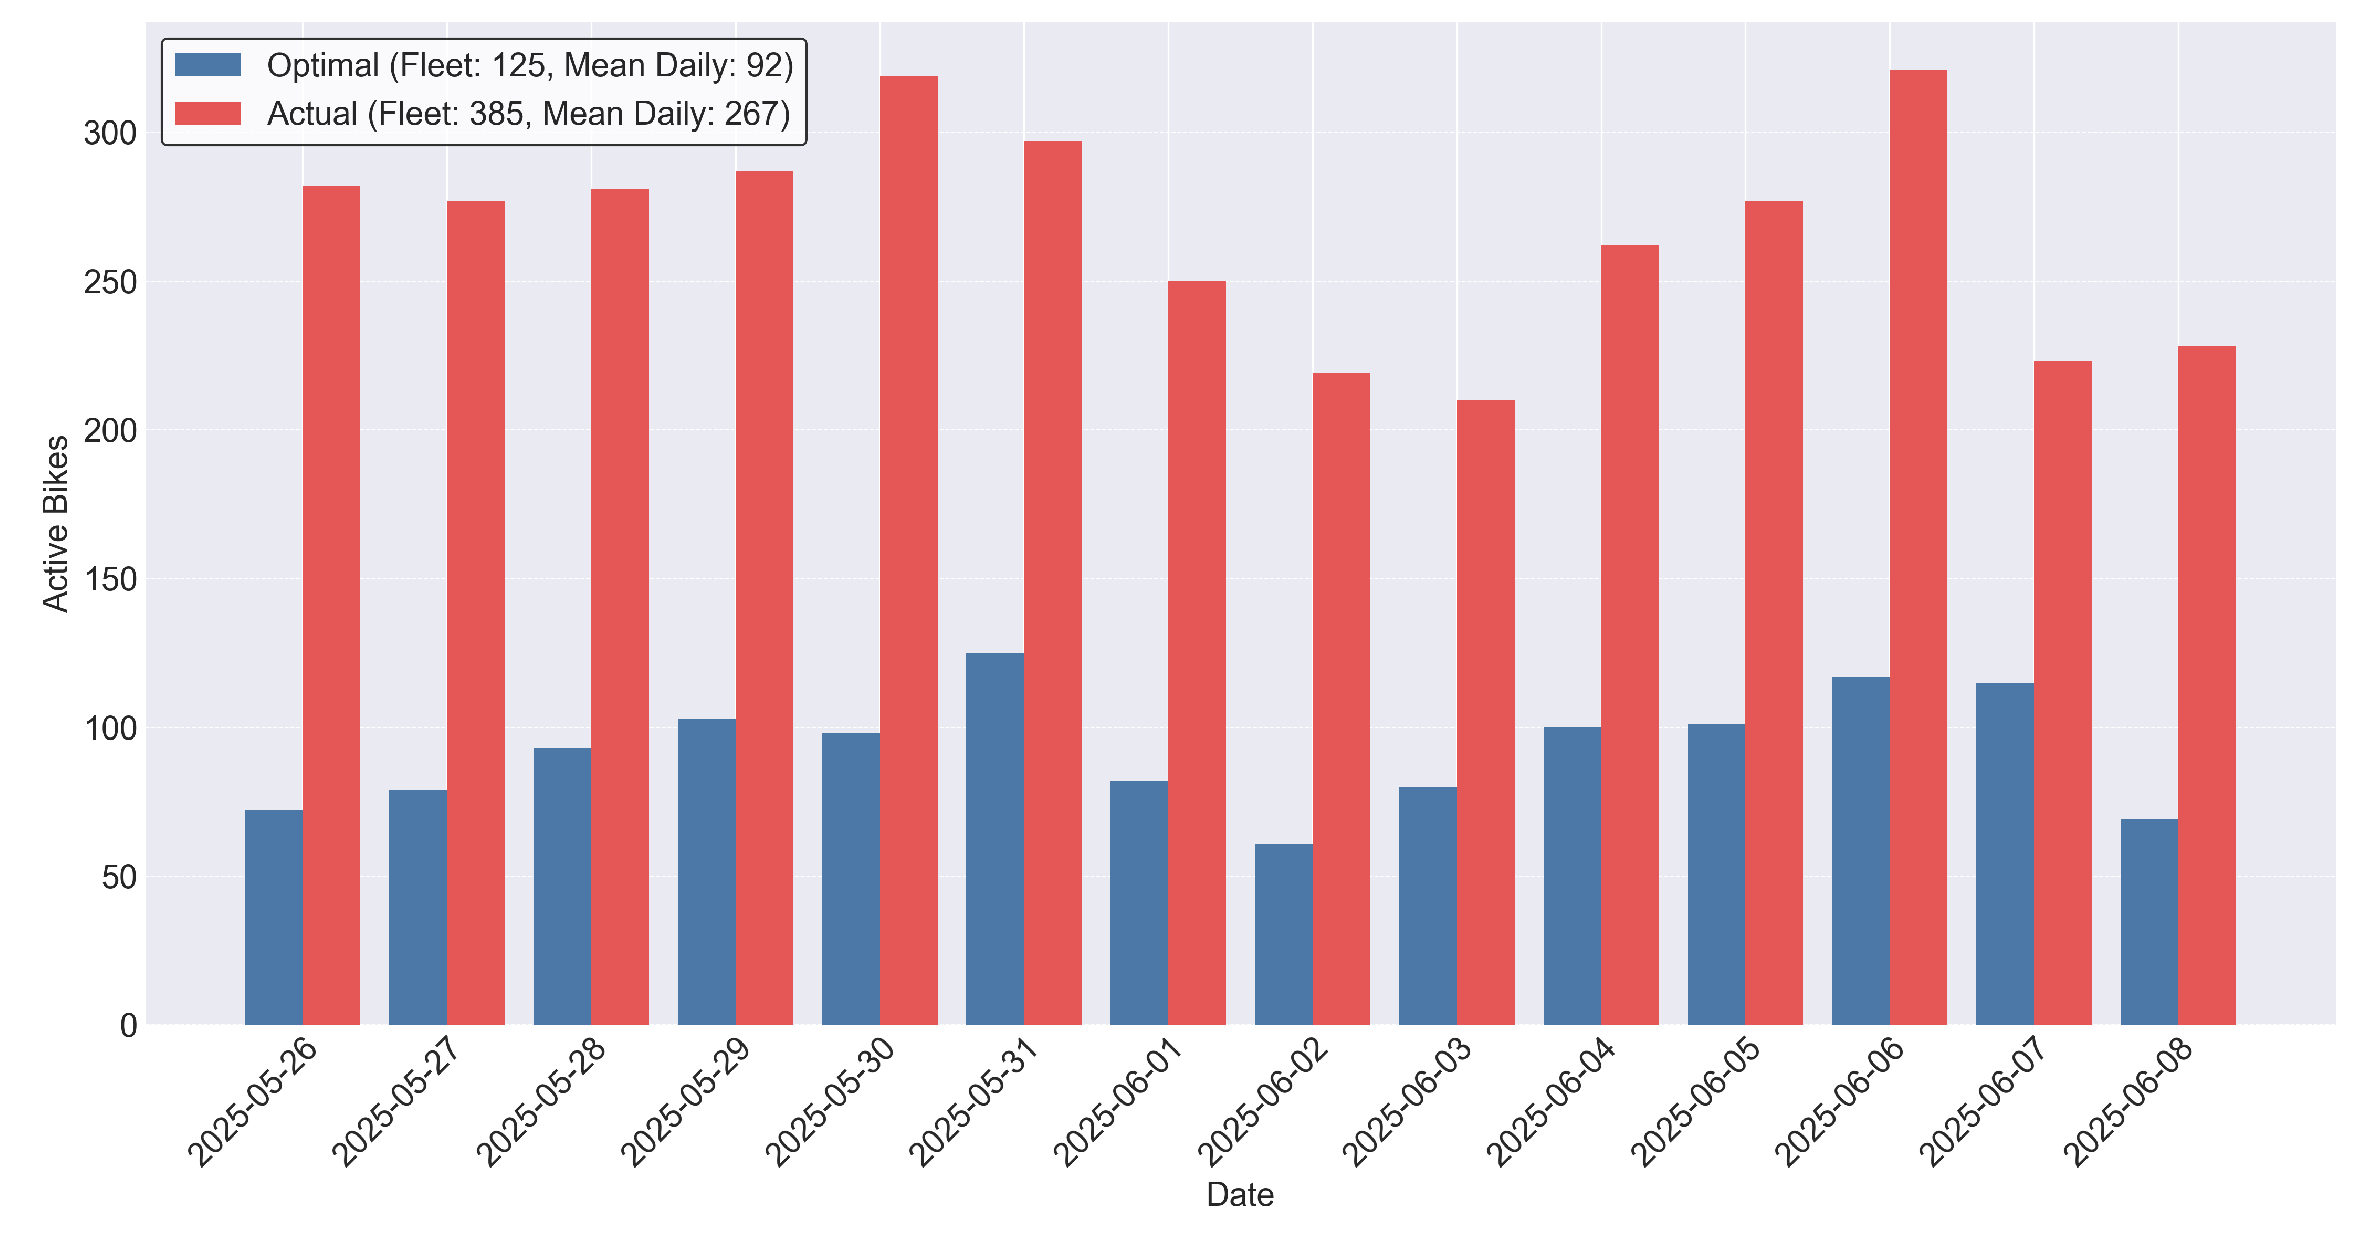
Figure 4.
Side-by-side comparison of grid load for actual versus optimal bike allocation strategies. Note the difference in scaling on the primary vertical axes, scaling of the secondary vertical axes are the same.
Figure 4.
Side-by-side comparison of grid load for actual versus optimal bike allocation strategies. Note the difference in scaling on the primary vertical axes, scaling of the secondary vertical axes are the same.
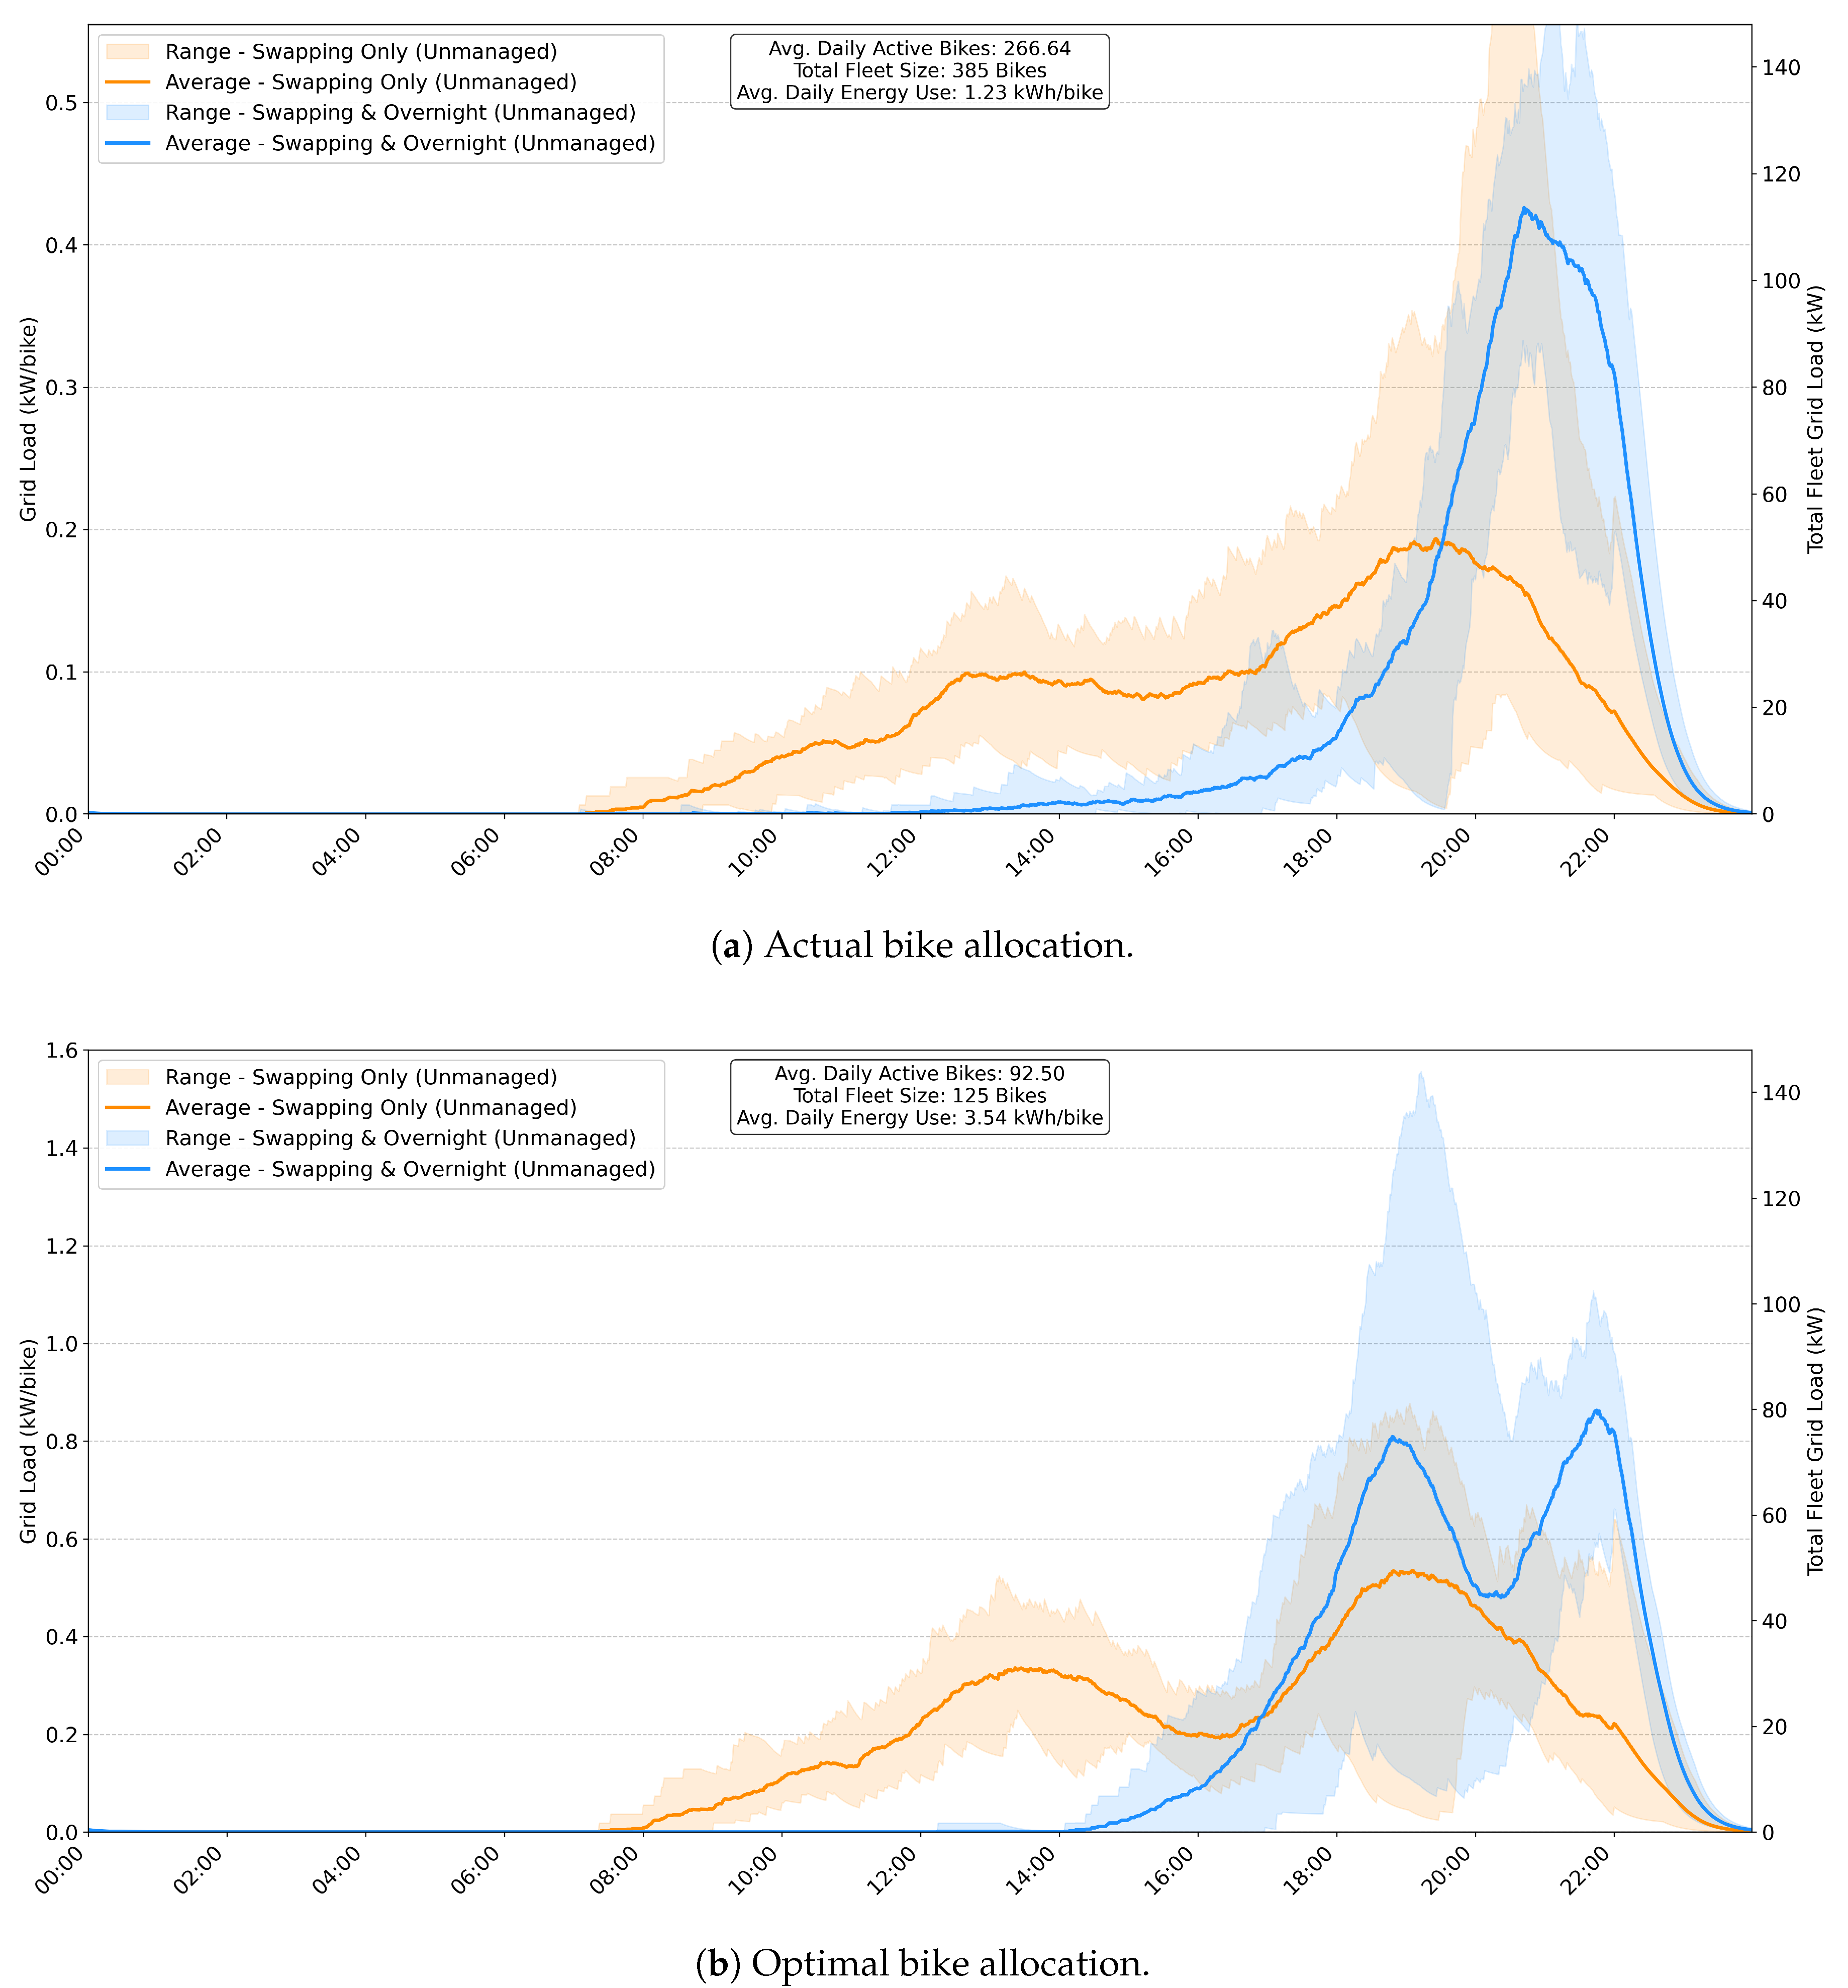
Figure 5.
Grid load for Swapping and Overnight Charging with optimal bike allocation comparing unmanaged and off-peak balancing charging approaches.
Figure 5.
Grid load for Swapping and Overnight Charging with optimal bike allocation comparing unmanaged and off-peak balancing charging approaches.
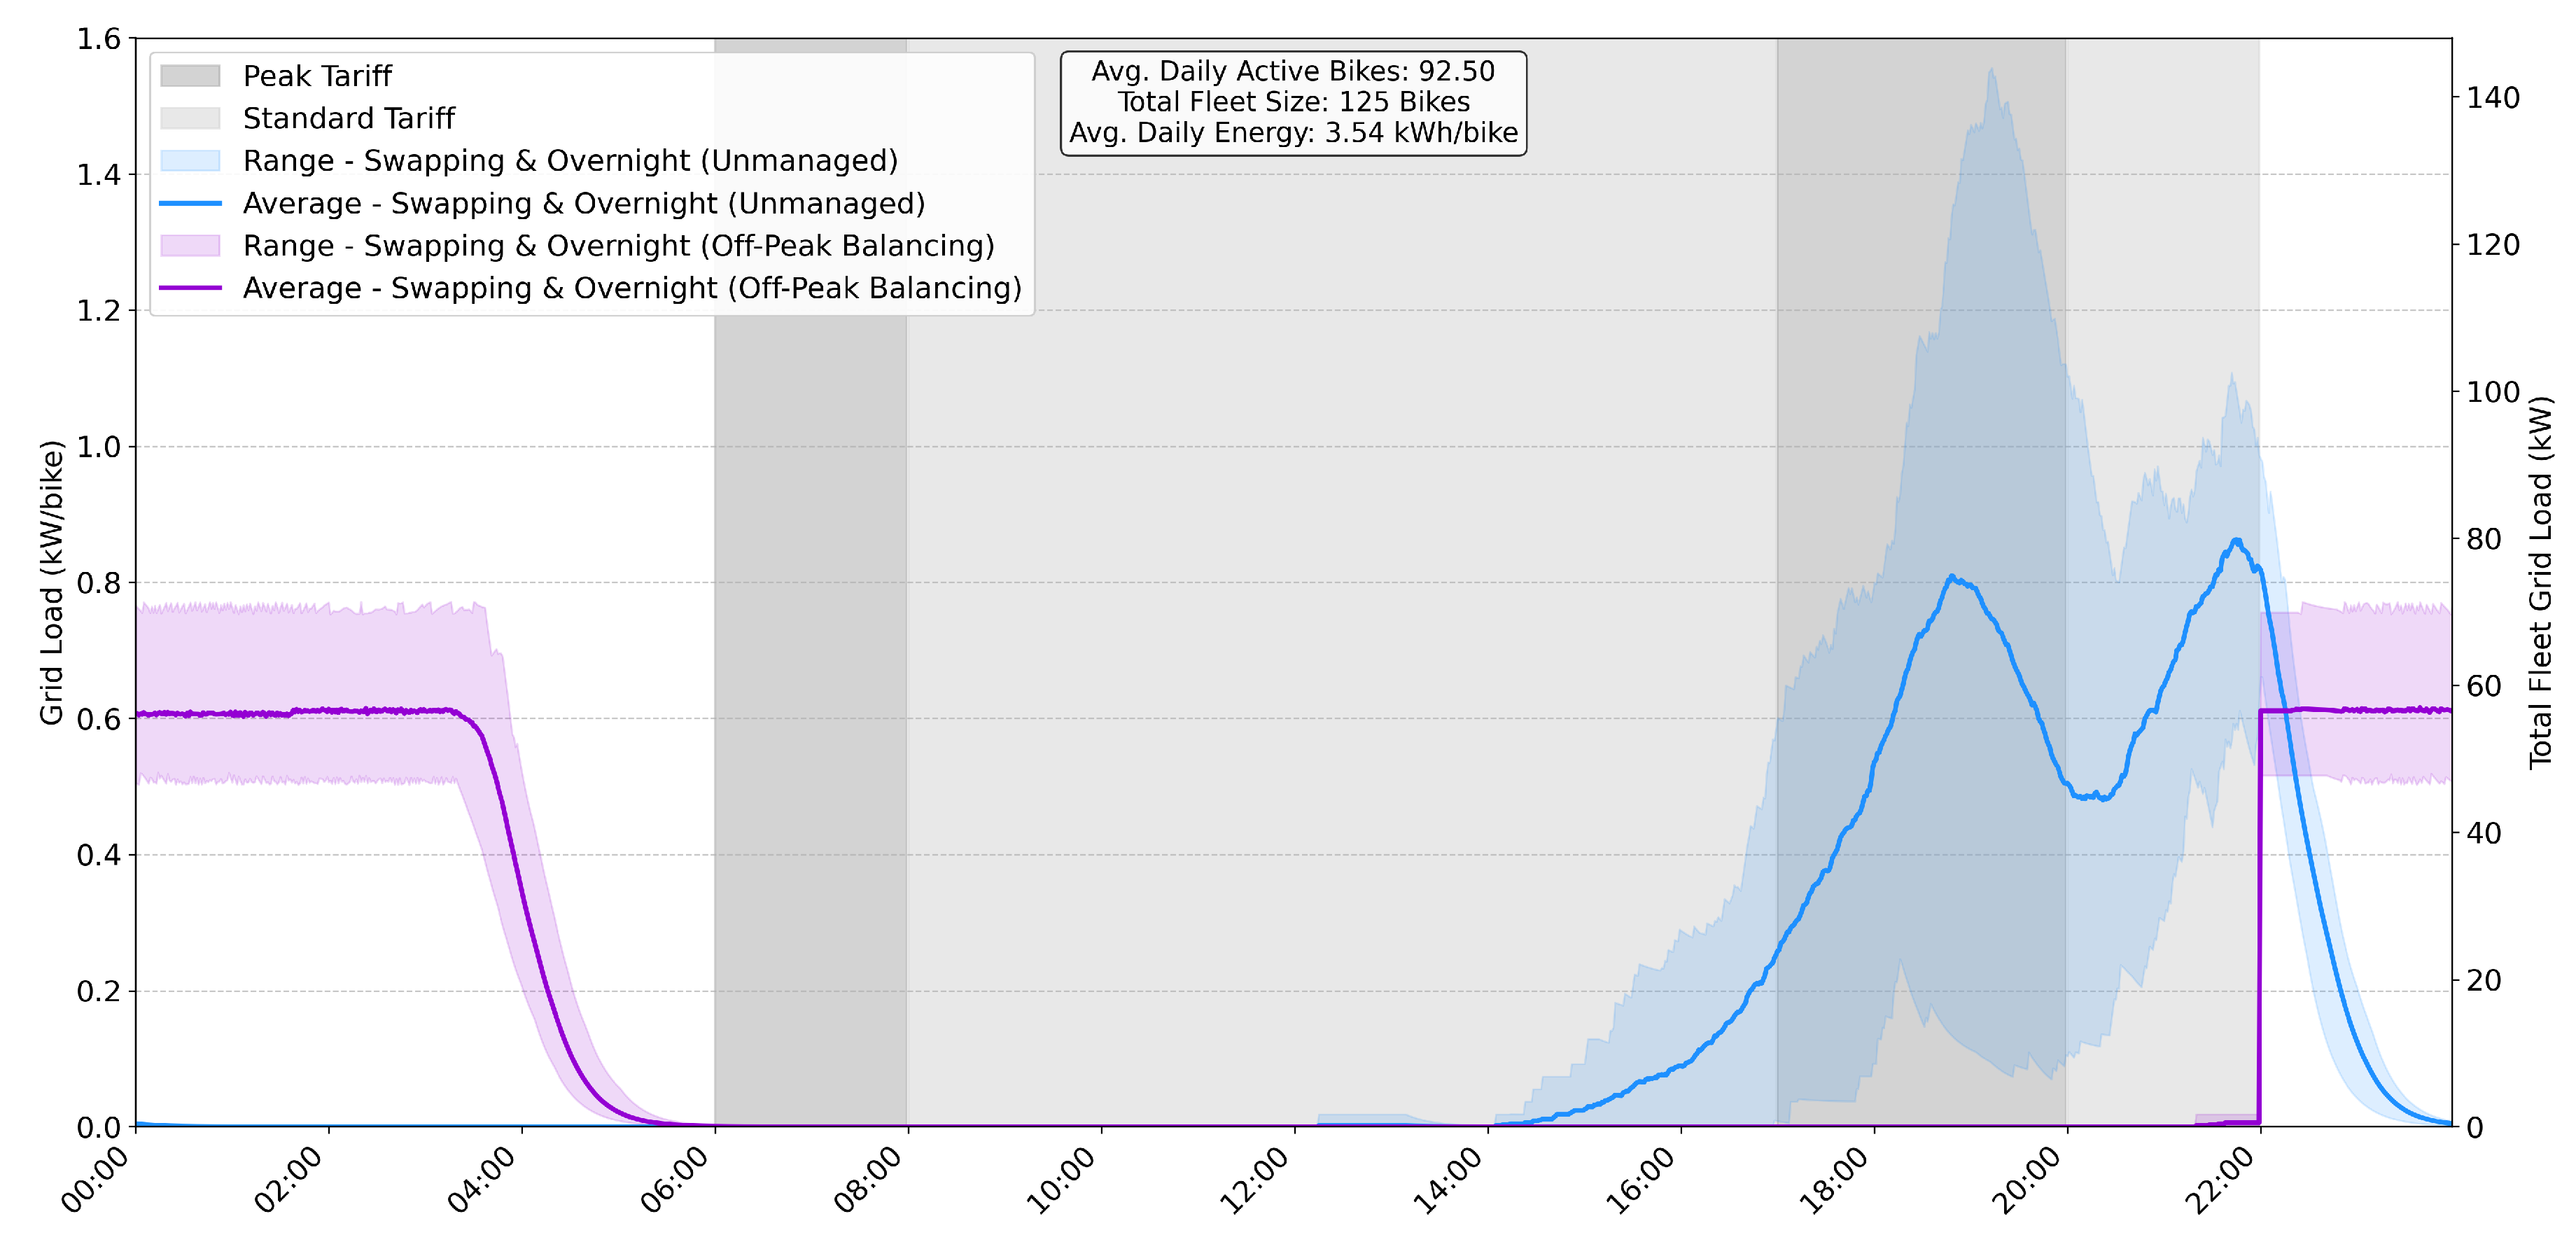
Figure 6.
Grid load for swapping only with optimal bike allocation, comparing unmanaged and solar-following charging approaches for the winter period (left) and an average day (right).
Figure 6.
Grid load for swapping only with optimal bike allocation, comparing unmanaged and solar-following charging approaches for the winter period (left) and an average day (right).
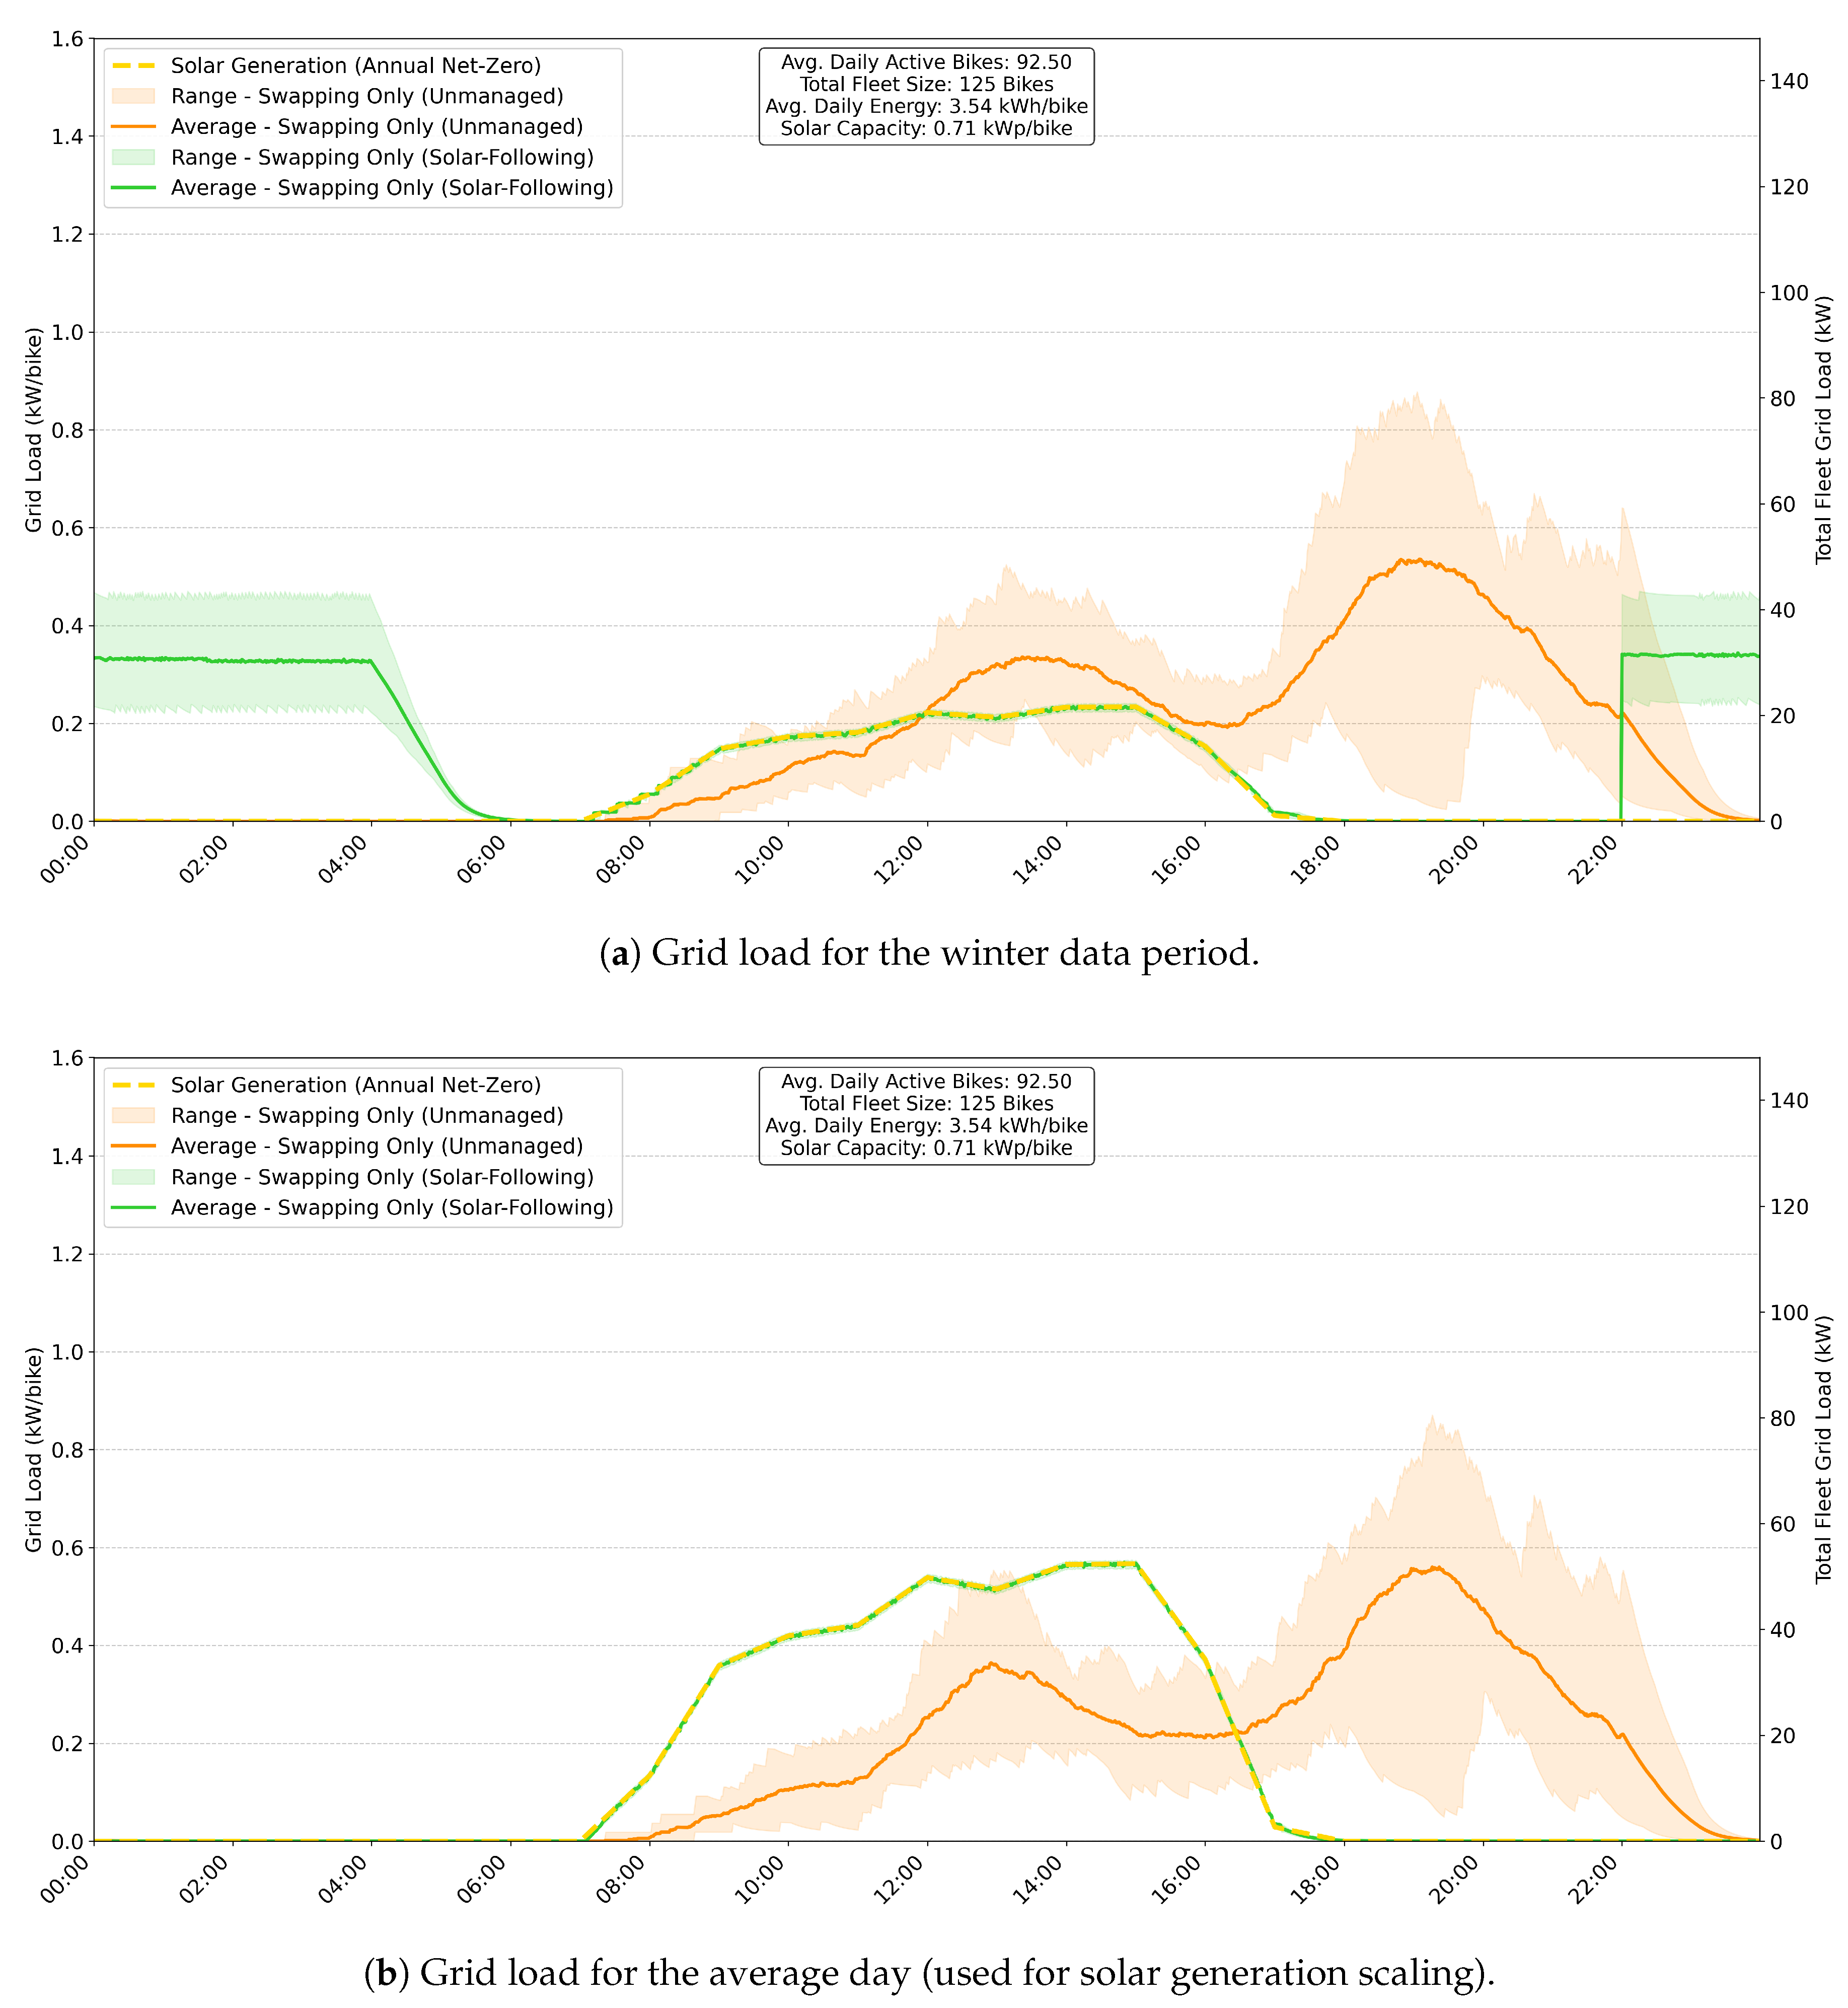
Figure 7.
Percentage deviation of key metrics from baseline under a sensitivity analysis of demand, speed, efficiency, and battery capacity.
Figure 7.
Percentage deviation of key metrics from baseline under a sensitivity analysis of demand, speed, efficiency, and battery capacity.
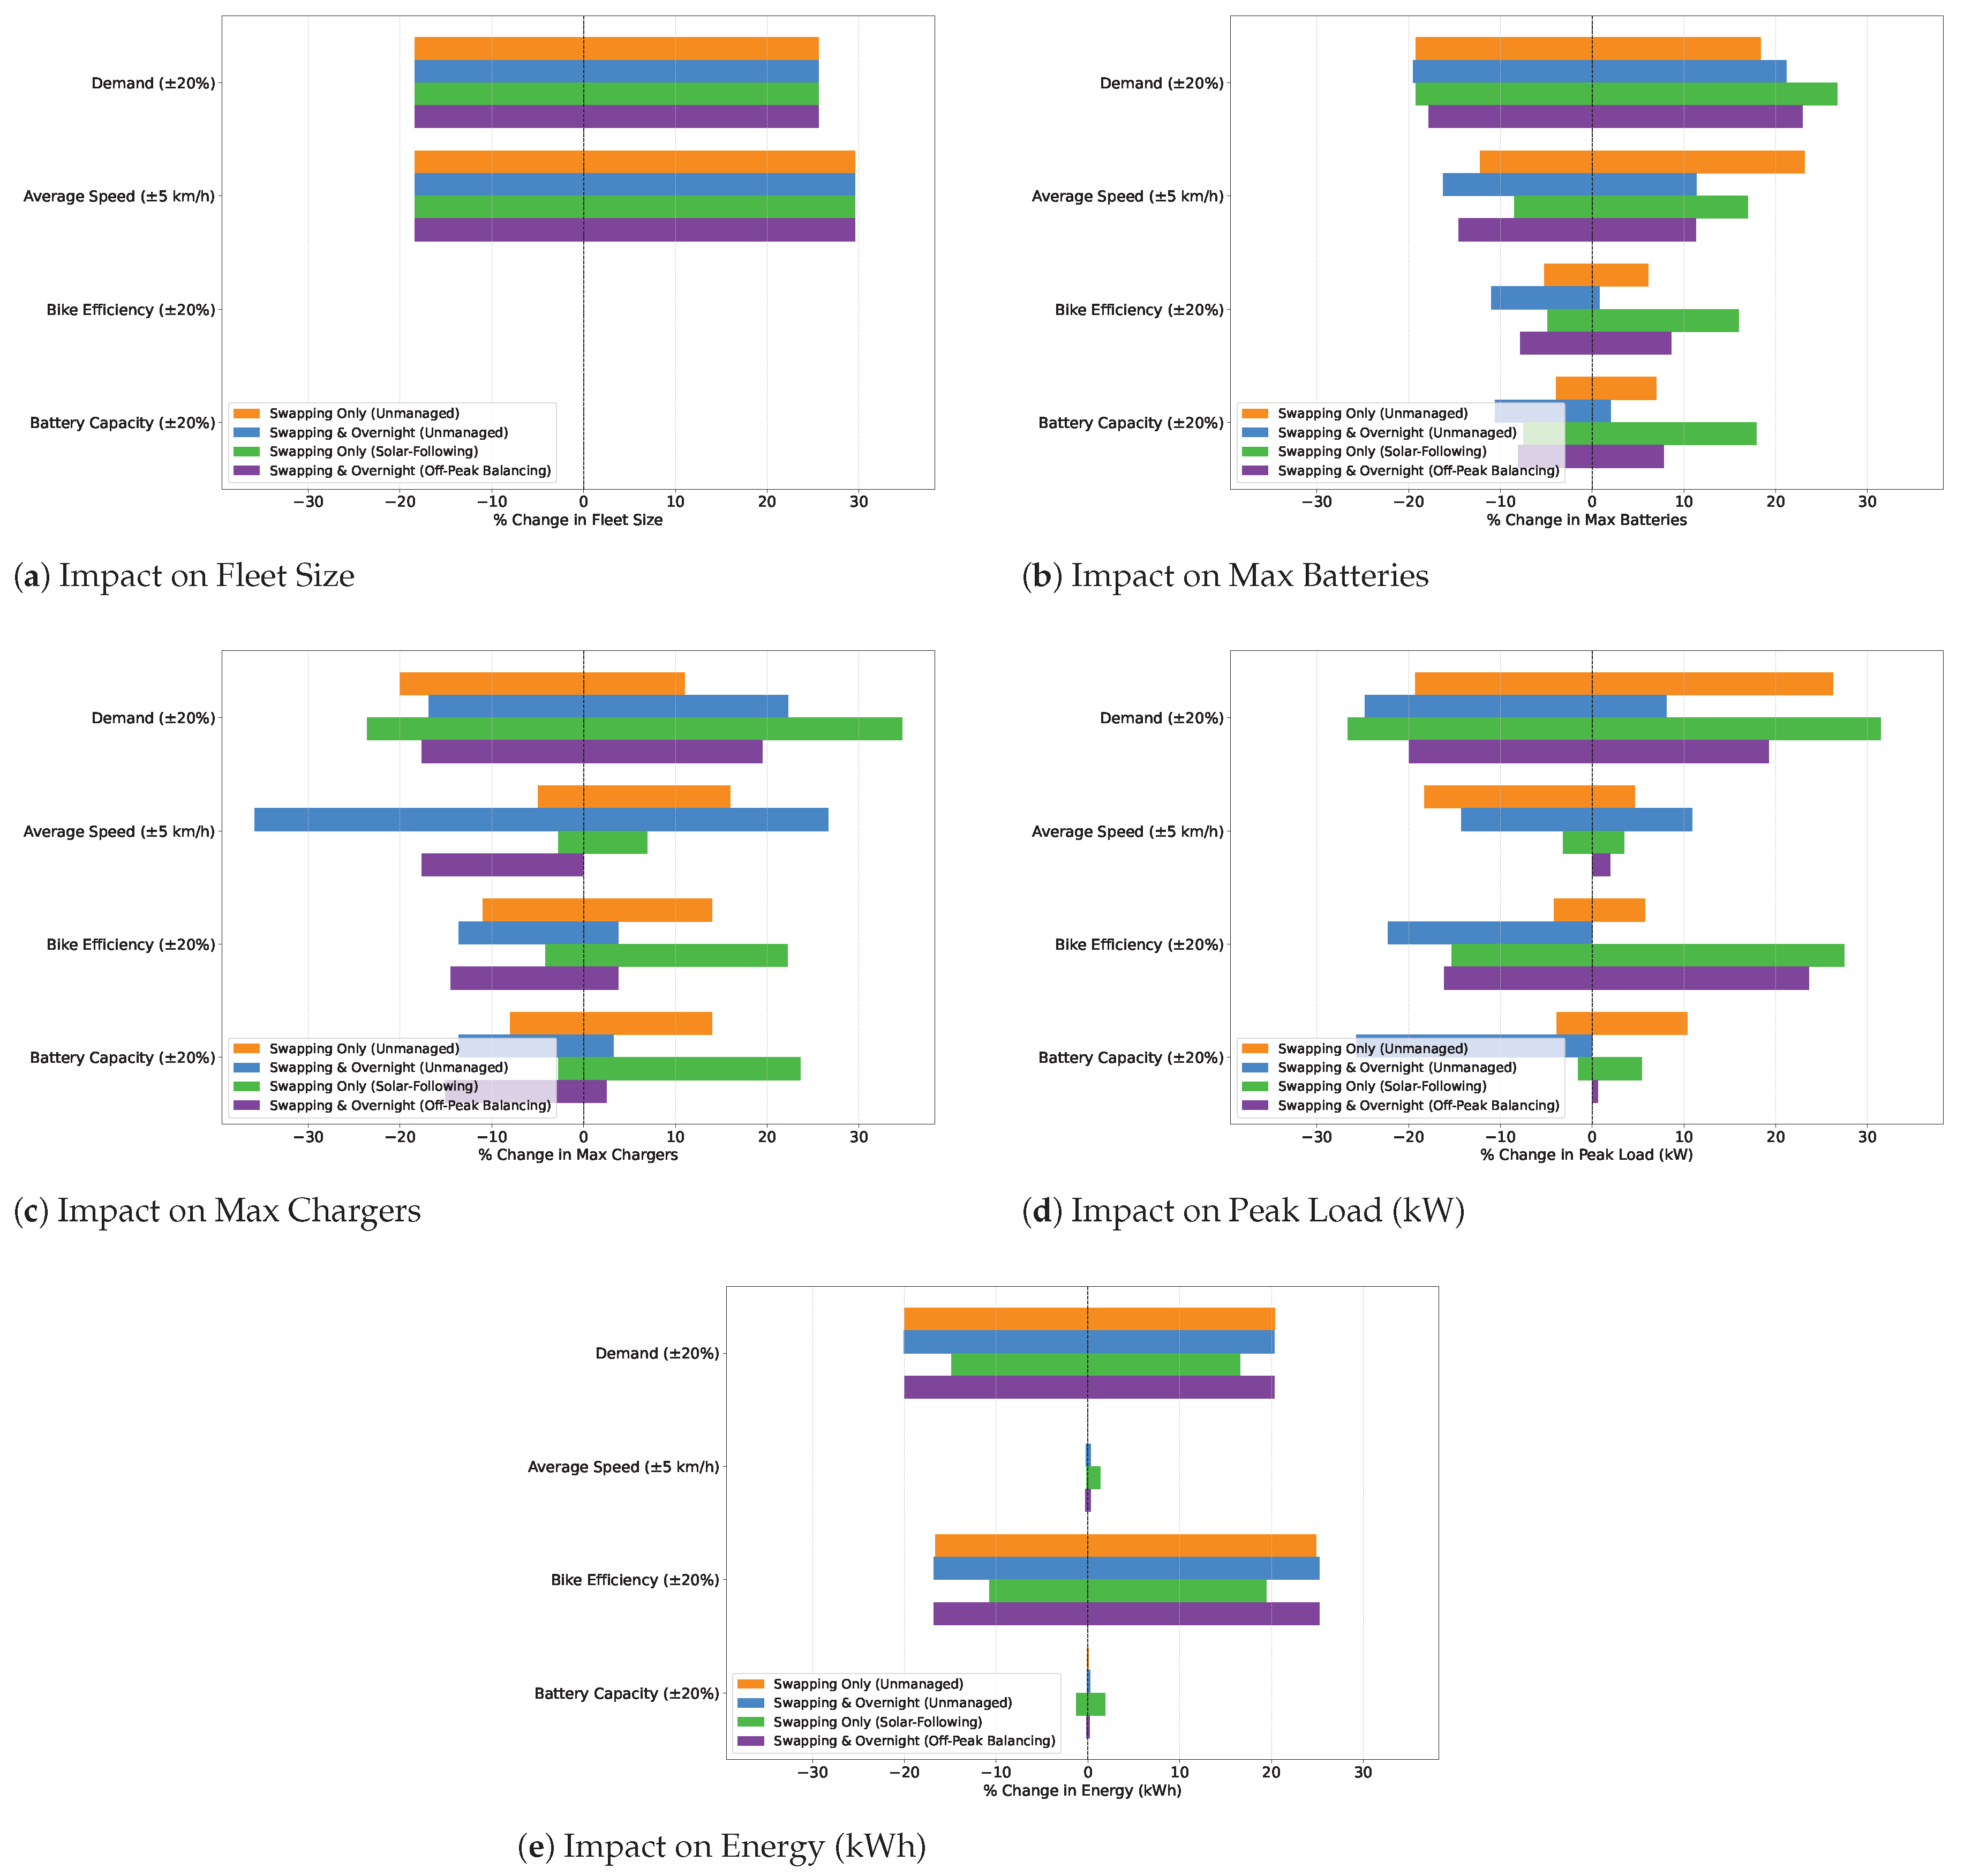

Table 1.
Daily data summary.
| Metric | Actual | Optimal |
|---|---|---|
| Fleet size | 385 | 125 |
| Average daily active bikes | 267 | 93 |
| Average daily distance per bike (km) | 36 | 103 |
Table 2.
Specifications for the motorcycle used, based on the Roam Air [28].
Table 2.
Specifications for the motorcycle used, based on the Roam Air [28].
| Specification | Roam Air |
|---|---|
| Energy Efficiency | 28.94 km/kWh |
| Battery Capacity | 3.24 kWh (2.592 kWh*) |
| Range | 75 km per battery |
*Operates only between 20% and 100% SOC.
Table 3.
Cape Town Energy Tariffs 2024/25.
| Demand Season | Period | 2024/25 Tariffs* |
|---|---|---|
| High Demand (June – August) | Peak | 7.7773 |
| Standard | 2.7371 | |
| Off Peak | 1.7365 | |
| Low Demand (September – May) | Peak | 2.9054 |
| Standard | 2.1706 | |
| Off Peak | 1.5768 |
All rates are VAT inclusive and in South African Rand per kilowatt-hour (R/kWh).
Table 4.
Comparison of different approaches.
| Fleet Size | Swapping Approach |
Charging Approach | Max Batteries Needed | Max Chargers Needed | Solar Harnessed (%) | Off-Peak Charging (%) | Peak Charging (%) |
|---|---|---|---|---|---|---|---|
| 385 (actual) |
Swapping Only |
Unmanaged | 601 | 210 | 82.6 | 3.4 | 34.6 |
| Solar-Following | 573 | 113 | 98.9 | 56.8 | 1.9 | ||
| Swapping & Overnight |
Unmanaged | 420 | 265 | 8.6 | 12.2 | 25.7 | |
| Off-Peak Balancing | 735 | 157 | 0.1 | 99.9 | 0.0 | ||
| 125 (optimal) |
Swapping Only |
Unmanaged | 229 | 100 | 81.3 | 3.7 | 35.9 |
| Solar-Following | 301 | 72 | 98.9 | 57.4 | 2.0 | ||
| Unmanaged (average day) | 226 | 98 | 40.7 | 3.4 | 36.2 | ||
| Solar-Following (average day) | 310 | 89 | 99.5 | 0.0 | 1.9 | ||
| Swapping & Overnight |
Unmanaged | 245 | 180 | 9.4 | 13.2 | 46.6 | |
| Off-Peak Balancing | 372 | 160 | 0.2 | 99.8 | 0.1 |
Table 5.
Techno-economic comparison of different approaches.
| Fleet Size |
Swapping Approach |
Charging Approach | Total CAPEX ($) |
Annual OPEX ($) |
Break-even (years) |
|---|---|---|---|---|---|
| 385 (actual) |
Swapping Only |
Unmanaged | 1,342,720 | 135,646 | - |
| Solar-Following | 1,367,620 | 115,500 | 1.2 | ||
| Swapping & Overnight |
Unmanaged | 1,167,220 | 134,110 | - | |
| Off-Peak Balancing | 1,471,420 | 126,678 | 40.9 | ||
| 125 (optimal) |
Swapping Only |
Unmanaged | 473,000 | 57,795 | - |
| Solar-Following | 604,800 | 37,500 | 6.5 | ||
| Swapping & Overnight |
Unmanaged | 497,000 | 58,679 | - | |
| Off-Peak Balancing | 622,000 | 48,696 | 12.5 |
Disclaimer/Publisher’s Note: The statements, opinions and data contained in all publications are solely those of the individual author(s) and contributor(s) and not of MDPI and/or the editor(s). MDPI and/or the editor(s) disclaim responsibility for any injury to people or property resulting from any ideas, methods, instructions or products referred to in the content. |
© 2025 by the authors. Licensee MDPI, Basel, Switzerland. This article is an open access article distributed under the terms and conditions of the Creative Commons Attribution (CC BY) license (http://creativecommons.org/licenses/by/4.0/).
Copyright: This open access article is published under a Creative Commons CC BY 4.0 license, which permit the free download, distribution, and reuse, provided that the author and preprint are cited in any reuse.


