1. Introduction
Breast cancer (BCa) remains the most frequently diagnosed malignancy and a leading cause of cancer-related death among women worldwide, accounting for over 2.3 million new cases annually (Dessie and Zewotir, 2025). Among molecular subtypes, HER2/ERBB2-positive tumors represent approximately 15–30% of cases and are characterized by aggressive clinical behavior but susceptibility to HER2-targeted therapies, including monoclonal antibodies such as trastuzumab and, more recently, antibody–drug conjugates (ADCs) like trastuzumab–deruxtecan (T-DXd) [
2,
3,
4]. Despite these advances, intrinsic and acquired resistance remain major clinical challenges, partly reflecting the limited predictive power of conventional two-dimensional (2D) monolayer cultures to reproduce the spatial and biochemical complexity of solid tumors [
5,
6]. Three-dimensional (3D) culture models, including multicellular spheroids, offer a more physiologically relevant platform that recapitulates key features of the tumor microenvironment, such as cell–cell and cell–matrix interactions, nutrient and oxygen gradients, and regional heterogeneity in proliferation and signaling [
7,
8,
9]. Importantly, 3D organization can modulate receptor accessibility, endocytic trafficking, and downstream signaling, parameters that are particularly critical for the efficacy of ADCs and other targeted therapies [
8,
10,
11,
12]. Previous studies have shown that HER2+ BCa cell lines display markedly different morphologies and growth behaviors in 3D culture: BT474 cells form highly compact spheroids, whereas SKBR3 cells generate looser, grape-like aggregates [
9,
11]. However, most available reports focus primarily on drug sensitivity or viability endpoints, with limited integration of morphological, ultrastructural, and biochemical profiling.
Here, we systematically characterized and compared spheroids derived from SKBR3 and BT474 cells using a multimodal approach including live/dead viability assays, confocal microscopy, immunofluorescence on cryosections, transmission electron microscopy (TEM), and Western blotting. Unlike most previous studies, which have focused mainly on drug sensitivity or gross viability endpoints, we provide an integrated spatial and biochemical profiling of HER2 in 3D, quantitatively mapping its peripheral-to-core gradients and linking them to downstream activation (pHER2/pAKT) in two distinct HER2+ BCa models. We further relate epithelial adhesion and mesenchymal markers (EpCAM, E-cadherins, N-cadherins) to spheroid compactness and highlight early mitochondrial remodeling as a structural correlate of 3D adaptation. By integrating morphological, ultrastructural, and signaling data, this study establishes a reproducible agarose-microwell platform for investigating architecture-dependent receptor regulation and offers a robust platform for future preclinical studies on drug response and targeted delivery in HER2+ breast cancer.
2. Materials and Methods
2.1. Cell Culture
ERBB2+ overexpressing BCa cell lines SKBR-3 and BT474 were obtained from Banca Biologica and Cell Factory in IRCCS Ospedale Policlinico San Martino belonging to the European Culture Collection’s Organization (Porton Down, Wiltshire, UK). Both cell lines were cultured in DMEM high glucose medium supplemented with 10% heat-inactivated fetal bovine serum, 1% glutamine, penicillin, and streptomycin (Euroclone S.p.A., Milan, Italy). 2D cell cultures were conducted by cell seeding at 100,000 cells/well in 6-well plates or onto glass coverslip for the imaging. Spheroids were made using a non-adherent agarose substrate, with U-shaped wells with a diameter of 550 µm, in each of which ~20,000 cells were seeded. The substrate was created using the replica-molding technique by 3D printing the negative cast, into which a hot agarose solution (1% w/v) was poured, allowed to solidify and subsequently removed and sterilized by exposure to UV light [
13,
14]. Samples were kept inside the well for the entire culture time, replacing 75% of the culture medium every 2 days.
2.2. Optical Microscopy
Brightfield optical microscopy was employed for daily monitoring of spheroids development. The growth profile over time in culture of the samples in terms of diameter and circularity was evaluated using ImageJ software (ImageJ, U. S. National Institutes of Health, Bethesda, Maryland, USA). The viability of the spheroids was assessed by live/dead staining (NUCLEAR-ID® Blue/Red cell viability reagent - GFP-CERTIFIED, Enzo Life Science, Farmingdale, USA) at the last day in culture (DIV4). Spheroids were stained and incubated for 45 minutes before being observed under the microscope, consequently samples were disassembled to single cell by trypsinization to perform a numerical assessment of viability. Brightfield and live/dead fluorescent images acquisition was performed using an Olympus IX70 (Olympus Corporation, Tokyo, Japan) wide field microscope equipped with Hamamatsu camera Orca-Flash 4.0 V3/LT+ (Hamamatsu, Japan), and 10x and 20x non-immersion objective. Full-thickness spheroids immunostaining was performed by fixing cells in 3.3% paraformaldehyde (PFA) in phosphate-buffered saline (PBS) pH 7.4 for 40 min and then quenching with 30 mM NH4Cl. Cell permeabilization was performed by exposure for 10 min to a PBS diluted solution of Saponin from Quillaja Bark (0.2% w/v, Sigma-Aldrich). Afterwards, samples were incubated with an Alexa Fluor 594 Phalloidin (Thermofisher Scientific, Waltham, MA, USA) and mouse anti-ErbB2 9G6 (Santa Cruz Biotechnology, Dallas, TX, USA) both 1:400 diluted in 0.1% w/v Saponin solution for 40 min. Subsequently, cells were washed 3 times with PBS and incubated with secondary antibody conjugated to Alexa Fluor 488 (Thermofisher Scientific, Waltham, MA, USA) and DAPI for additional 40 minutes. Finally, samples were washed with PBS, transferred to a bottom glass petri dish (3 cm) and observed with Leica DMi8 widefield microscope equipped with x20 non immersion objective. Images were processed with the Leica Thunder computational clearing method (LAS X).
2.3. Immunofluorescence and Histological Analysis of Spheroids Formed by HER2+ BCa Cell Lines
To prepare cryosections, spheroids were washed in PBS, fixed with 4% PFA 1 hour at 4°C, resuspended in Bio-agar (Bio – Optica, Milano, Italy) and after a further 3-hour fixation in 4% PFA, they were dehydrated with 30% (w/v) sucrose overnight (ON). The next day samples were frozen in O.C.T. Compound (Bio – Optica) and were stored at -80°C. Then, 6 µm thick cryo-sections were cut, dried ON at room temperature (RT) and were used for histological examination, using hematoxylin, and immunofluorescence characterization. For immunofluorescence analysis, spheroids cryo-sections were blocked and permeabilized in 0.5% FCS (fetal calf serum) and 0.1% Triton X-100 in PBS for 1 hour RT. Then, sections were incubated with the following primary antibodies at RT for 1 hour: anti-Ki-67 (2 µg\ml, clone 30.9, Ventana Medical Systems, Inc. Tucson, AZ, USA), anti-E-cadherin (5 µg\ml, 67A4, Santa Cruz Biotechnology, Dallas, TX, USA), anti-N-cadherin (10 µg\ml, 8C11, Santa Cruz), anti-HER2 (0.5 µg\ml, 9G6, Santa Cruz), anti-EpCAM (5 µg\ml, HEA125, Santa Cruz). After 30 minutes of incubation with Alexa-Fluor-conjugated isotype-specific secondary antibody at RT, sections were mounted with ProLong™ Diamond Antifade Mountant containing DAPI (Thermo Fisher Scientific, Waltham, MA, USA) for nuclear staining. Digital images were acquired using the Aperio VERSA Brightfield, Fluorescence & FISH Digital Pathology Scanner (Leica Biosystems, Milano, Italy), with a 20× or a 40× objectives.
2.4. Electron Microscopy
For ultrastructural analysis, SKBR3 and BT474 cells were washed out twice in 0.1 M cacodylate buffer (Sigma-Aldrich, St. Louis, MI, USA) and fixed in 0.1 M cacodylate buffer containing 2.5% glutaraldehyde (Electron Microscopy Science, Hatfield, PA, USA) or 1 h at room temperature. The cells were postfixed in 1% osmium tetroxide for 10 min (VWR International, PA, USA) and 1% aqueous uranyl acetate (SERVA Electrophoresis GmbH, Heidelberg Germany) for 1 h. Subsequently, samples were dehydrated through a graded ethanol series (Merck, Darmstadt, Germany) and flat embedded in epoxy resin (Poly-Bed; Polysciences, Inc., Warrington, PA) for 24 h at 60 ◦C (25). Ultrathin sections (50 nm) were cut parallel to the cell monolayer and counterstained with 5% uranyl acetate in 50% ethanol. Electron micrographs were acquired using a Hitachi 7800 120Kv electron microscope (Hitachi, Tokyo, Japan) equipped with a Megaview G3 digital camera and Radius software (EMSIS, Muenster, Germany) [
15]. For EM morphometry, 20 whole cells were scored for mitochondria and measured with line tool of Radius 2.0 software (N = 3 independent experiments).
2.5. Western Blotting
For western blotting analysis, SKBR-3 and BT474 cells were lysed using lysis buffer ((Hepes pH 7.4 20 mM, NaCl 150 mM, 10% Glycerol, 1% Triton X-100) supplemented with protease inhibitors cocktail Complete (Roche Applied Science, Penzberg, Germany) and sodium orthovanadate and PhosStop (Roche, Roche Holding AG, Basel Switzerland). While for 2D cultures, the lysis occurred directly on the plate, the spheroids were collected and centrifuged at 375 g for 5 min at 4 °C. Proteins were resolved on SDS-polyacrylamide gel electrophoresis (Thermo Fisher Scientific Inc. Waltham, MA, USA) and blotted on nitrocellulose (GE Healthcare Life Science, Amersham Buckinghamshire, UK) or PVDF (Merck Millipore, Darmstadt, Germany) membranes. Detection was performed using an ECL Detection Reagent (BIORAD, Hercules, CA, USA) according to manufacturer’s protocol. ECL signals were detected, recorded, and measured with the Uvitec Cambridge gel doc system and software (UVITEC Cambridge Ltd. Innovation Centre, Cambridge, Cambridge, UK). Antibodies to pan-AKT (clone 40D4, #2920) and pERK1/2 (#9101), p-AKT1/2/3 (SER473, D9E, 4060), were purchased from Cell Signaling technology (Danvers, MA, USA). Antibodies to ERK1/2 (MK1, sc-135900) were purchased from Santa Cruz Biotechnology (Dallas, TX, USA). ERBB2 was detected with anti-ERBB2 N-terminal (Ab-20, Thermo Scientific Inc. Waltham, MA, USA), Rabbit polyclonal anti-Phospho-HER2 (Y1248) (#2247, Cell Signaling Technology, Danvers, MA, USA). Anti-actin antibody (#4967, Cell Signaling, Danvers, MA, USA) was used as a loading control.
2.6. Statistical Analysis
All in vitro experiments were repeated at least three times. The data were analyzed using GraphPad Prism 8 (GraphPad Software, San Diego, CA, USA). Statistical differences in the average among two or more groups were compared using Student t test or Analysis of Variance (ANOVA), *p < 0.05, **p < 0.01, ***p < 0.001, ****p < 0.0001.
3. Results
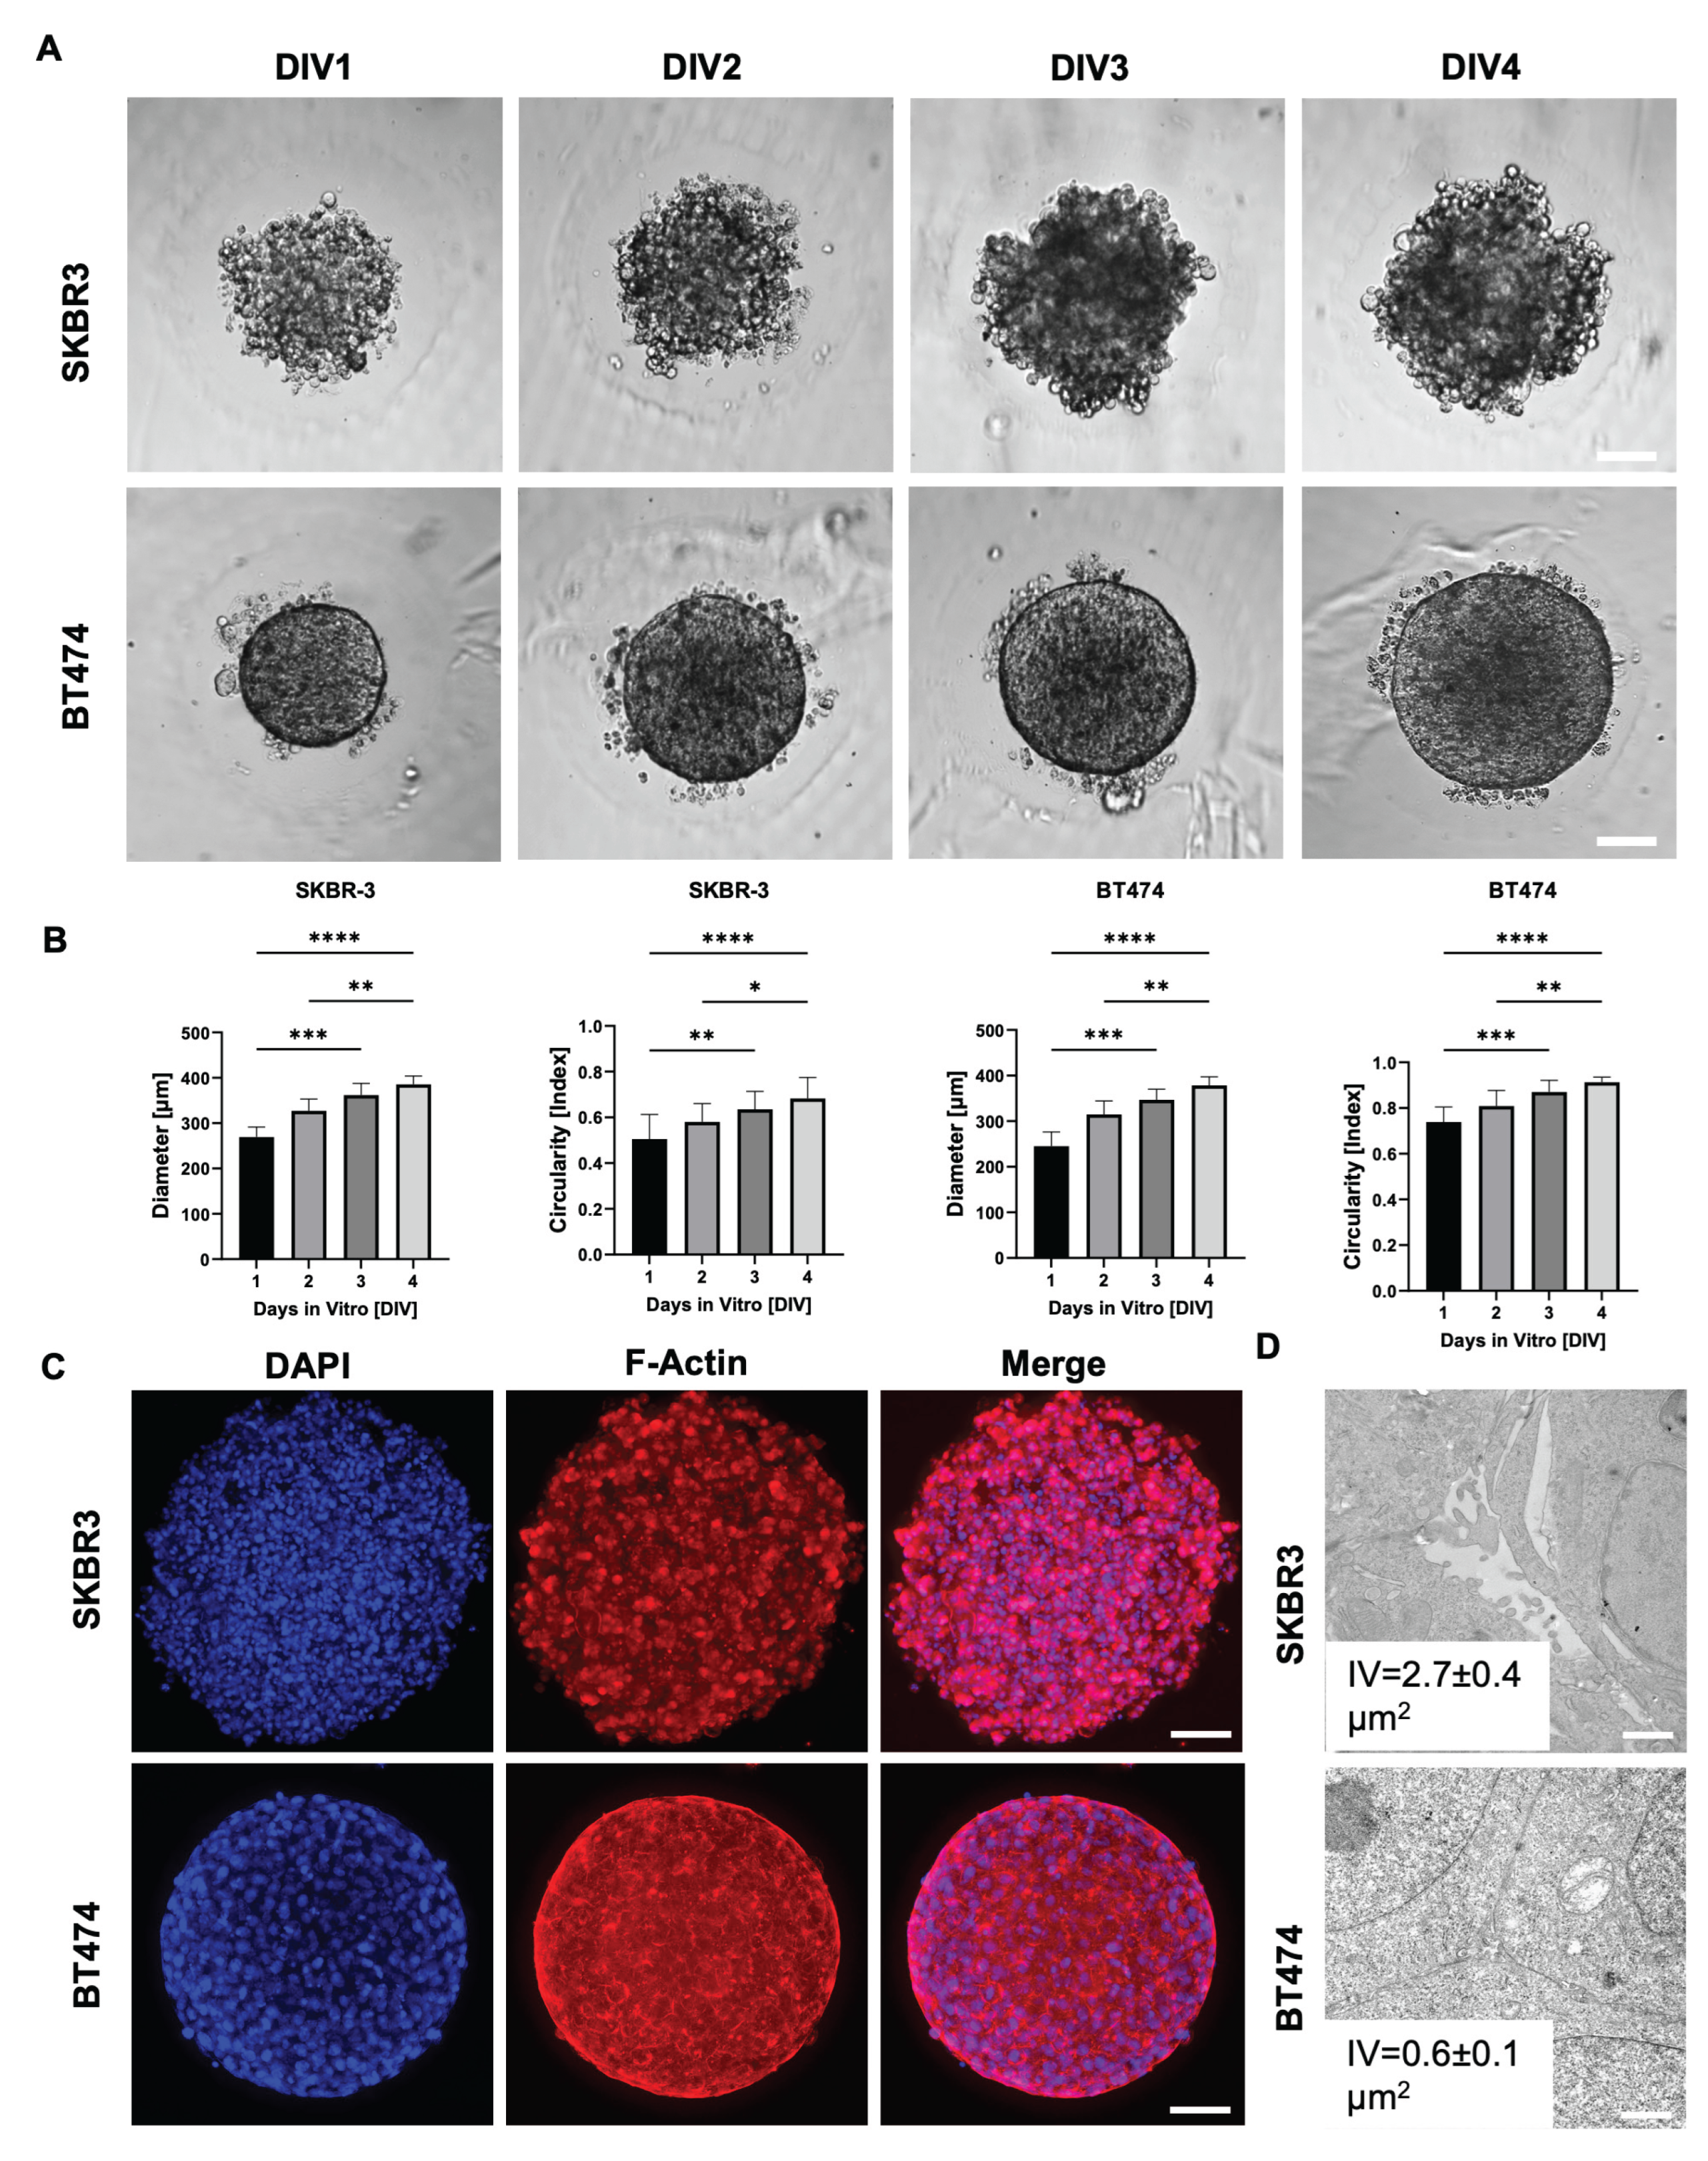
3.1. Distinct Morphologies and 3D Organization of HER2+ Breast Cancer Spheroids
To evaluate spheroid formation efficiency and morphological consistency, we monitored SKBR3 and BT474 spheroids over four days at four different initial cell seeding densities. Both cell lines reproducibly formed spheroids, with a progressive size increase over time (
Figure 1A, B). Notably, BT474 spheroids were more compact than SKBR3 spheroids, reflecting intrinsic differences between the two models: SKBR3 cells typically proliferate and spread until confluence under 2D conditions, whereas BT474 cells display a strong propensity to form multilayered aggregates. We next quantified spheroid circularity as a measure of structural homogeneity (
Figure 1B) (Sharma et al., 2025). SKBR3 spheroids displayed irregular shapes and greater variability in circularity during the four-day culture period. In contrast, BT474 spheroids rapidly achieved a near-perfect spherical shape (circularity ≈ 1) as early as day 1, maintaining this geometry with minimal fluctuation throughout the observation period. To further characterize spheroid architecture, we performed immunofluorescence imaging at day 4 using phalloidin staining to visualize filamentous actin (F-actin) [
17]. Phalloidin staining delineated the cortical actin cytoskeleton, allowing visualization of cell shape and spatial arrangement within the spheroids. Confocal images acquired with the Leica Thunder system revealed that SKBR3 spheroids exhibited a looser architecture with visible intercellular spaces, whereas BT474 spheroids were denser and more cohesive (
Figure 1C). To validate these morphological observations at higher resolution, we performed ultrastructural analysis by transmission electron microscopy (TEM) [
18]. Thirty intercellular regions were randomly measured across three spheroids per cell line. SKBR3 spheroids displayed wide intercellular voids (IV) both in peripheral and central regions, while BT474 spheroids showed narrow spaces even at the periphery, confirming their tightly packed cellular arrangement (
Figure 1D).
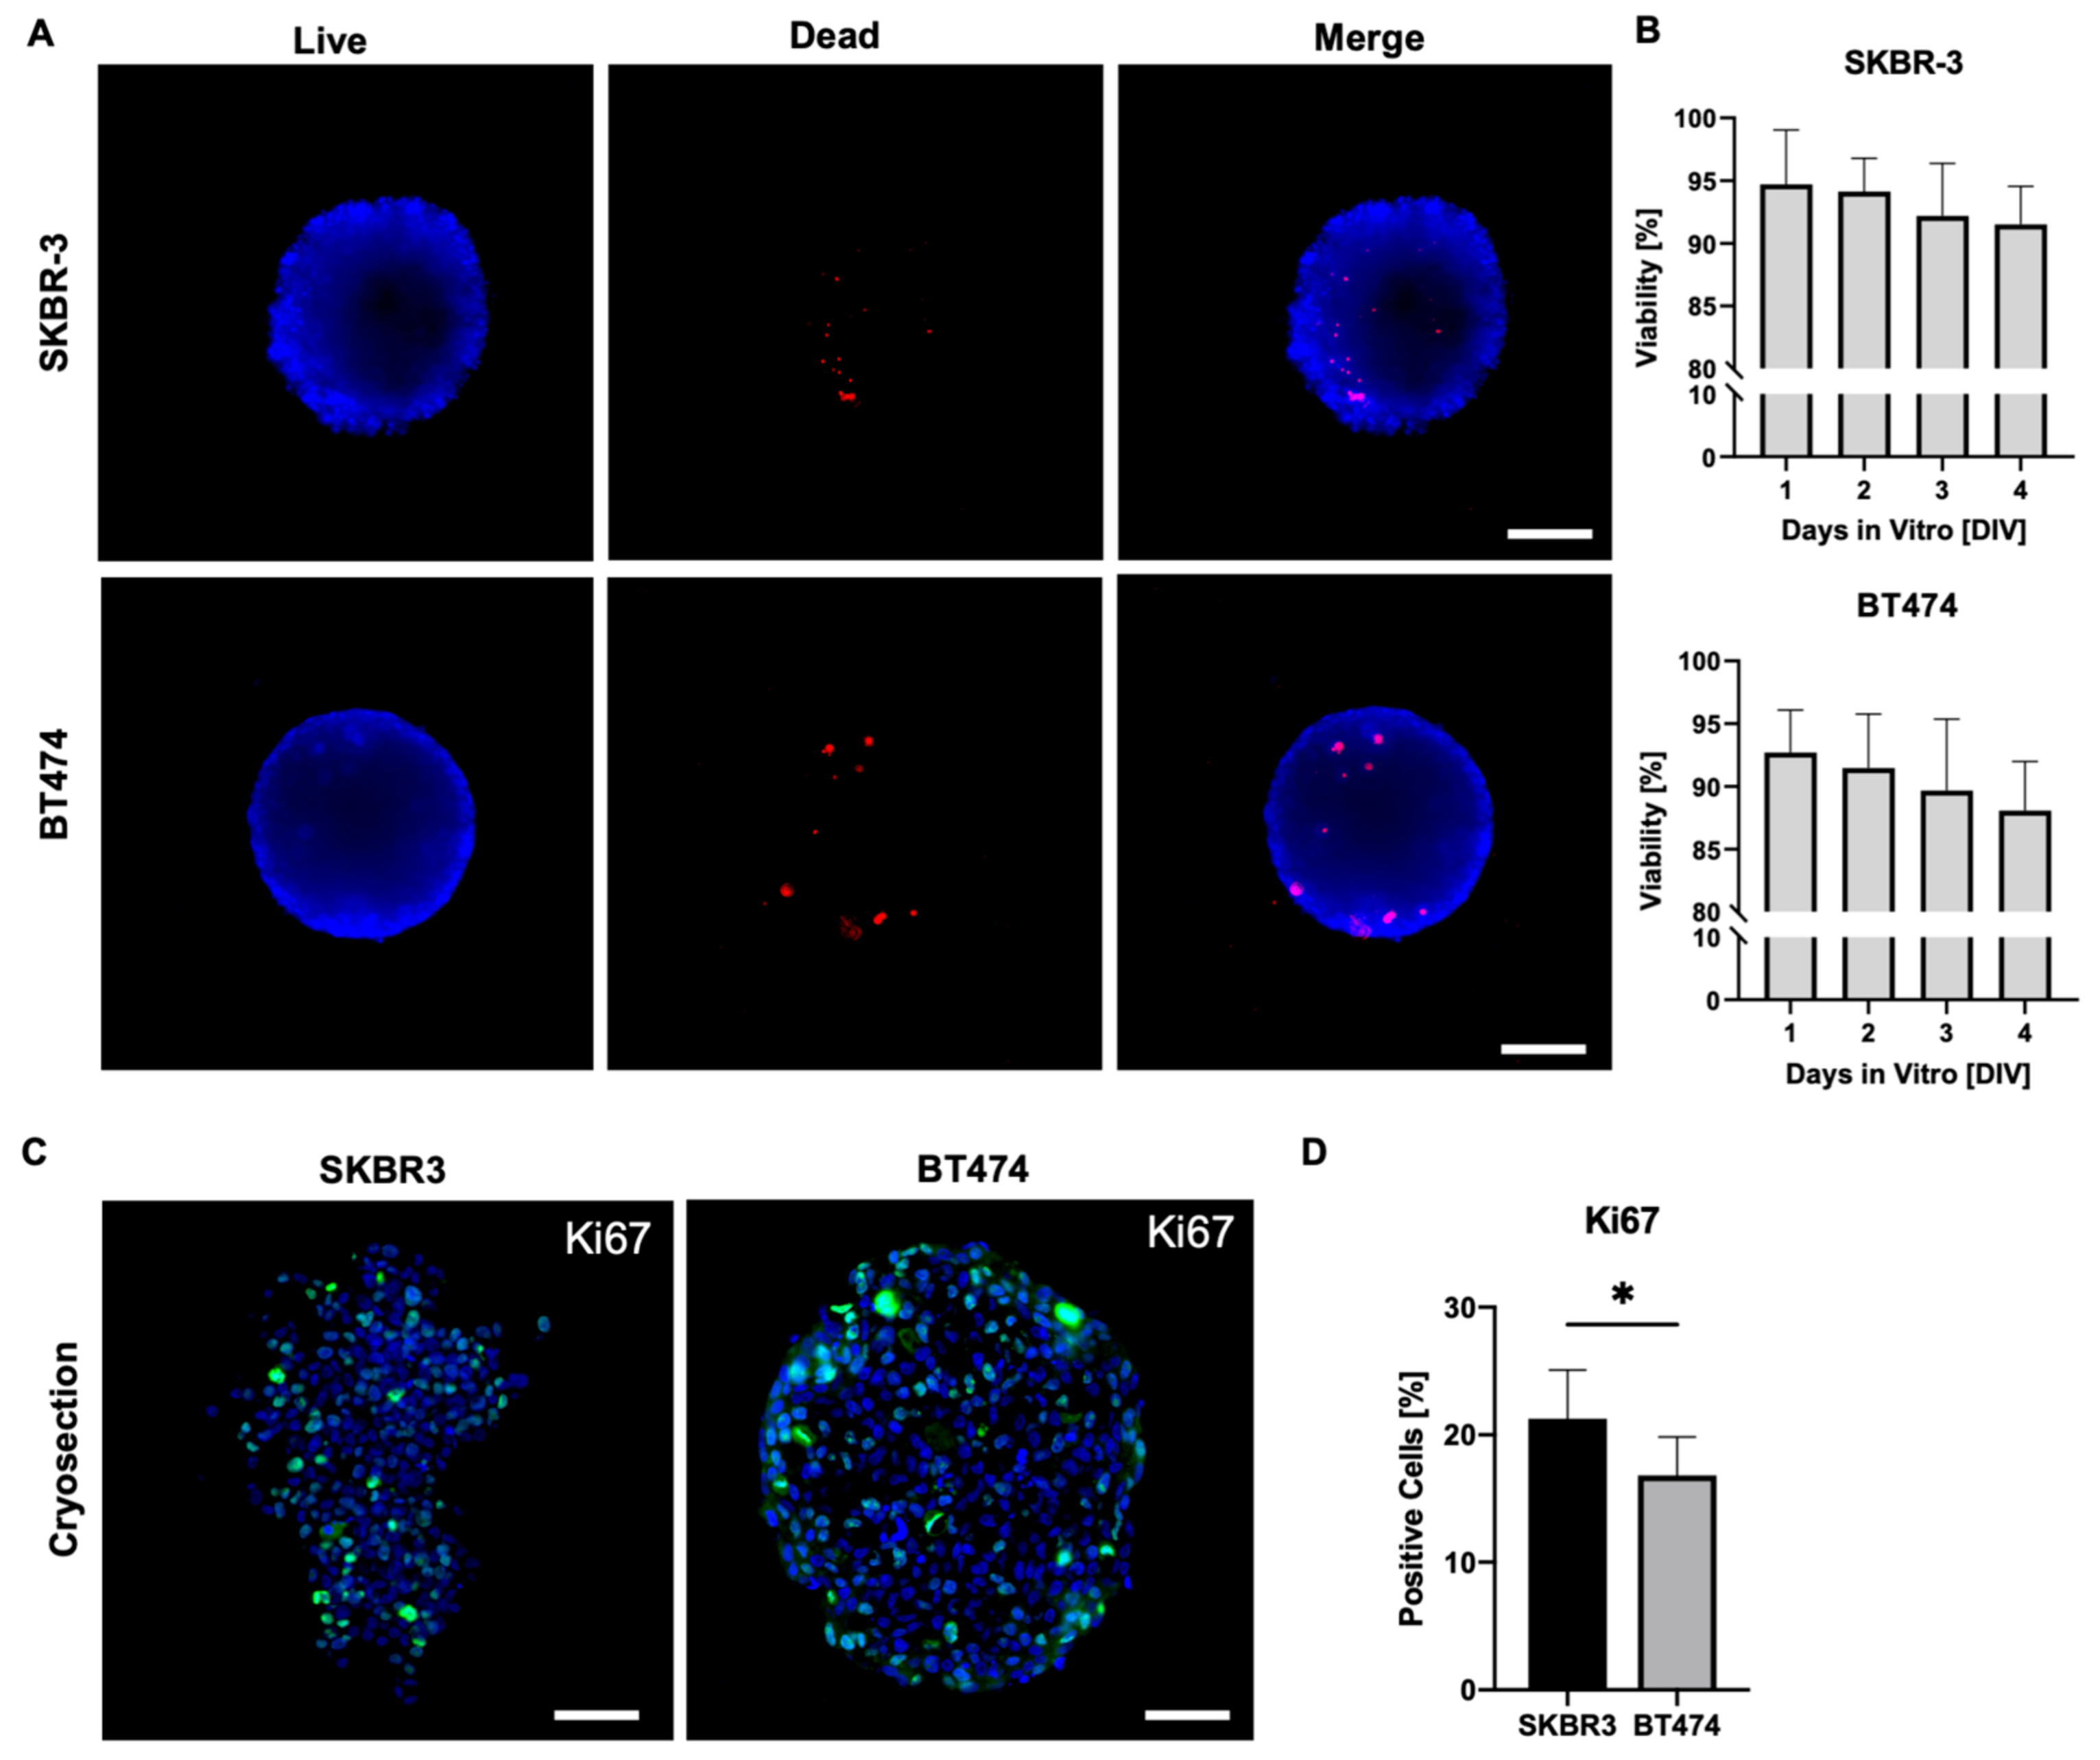
3.2. Assessment of Viability and Proliferation in HER2+ BCa Spheroids
On day 4 of culture, we assessed cell viability in SKBR3 and BT474 spheroids using a live/dead fluorescence assay(
Figure 2A) (Smart et al., 2013). Spheroids were stained with Nuclear-ID Blue/Red and imaged using an epifluorescence microscope on a single focal plane, acquiring signals in the blue channel to detect live cells and in the red channel to detect dead cells. Merged images were processed with ImageJ to evaluate the overall viability of the outer spheroid layers. This analysis provides a two-dimensional estimate of overall spheroid viability, mainly reflecting the outer cell layers captured in the focal plane. As shown in
Figure 2A–B, both SKBR3 and BT474 spheroids displayed predominantly viable outer layers, with dead cells representing <2% of the total area across all seeding densities. These results align with previous reports showing that the peripheral zone of spheroids remains viable and proliferative during early culture stages [
19,
20], consistent with the observed increase in spheroid diameter over time. To overcome the intrinsic limitation of wide-field imaging and better capture proliferative activity throughout the spheroid volume, we next performed Ki67 immunofluorescence staining on spheroid cryosections [
21]. Quantification of Ki67-positive nuclei revealed a significantly lower number of proliferating cells in BT474 spheroids compared with SKBR3 spheroids (
Figure 2C–D) [
22]. Qualitatively, BT474 spheroids displayed a clearer peripheral pattern, with Ki67 signal concentrated at the rim and markedly reduced in the inner regions. In contrast, SKBR3 spheroids exhibited a more heterogeneous distribution of Ki67-positive nuclei, without a consistently defined peripheral-to-core gradient.
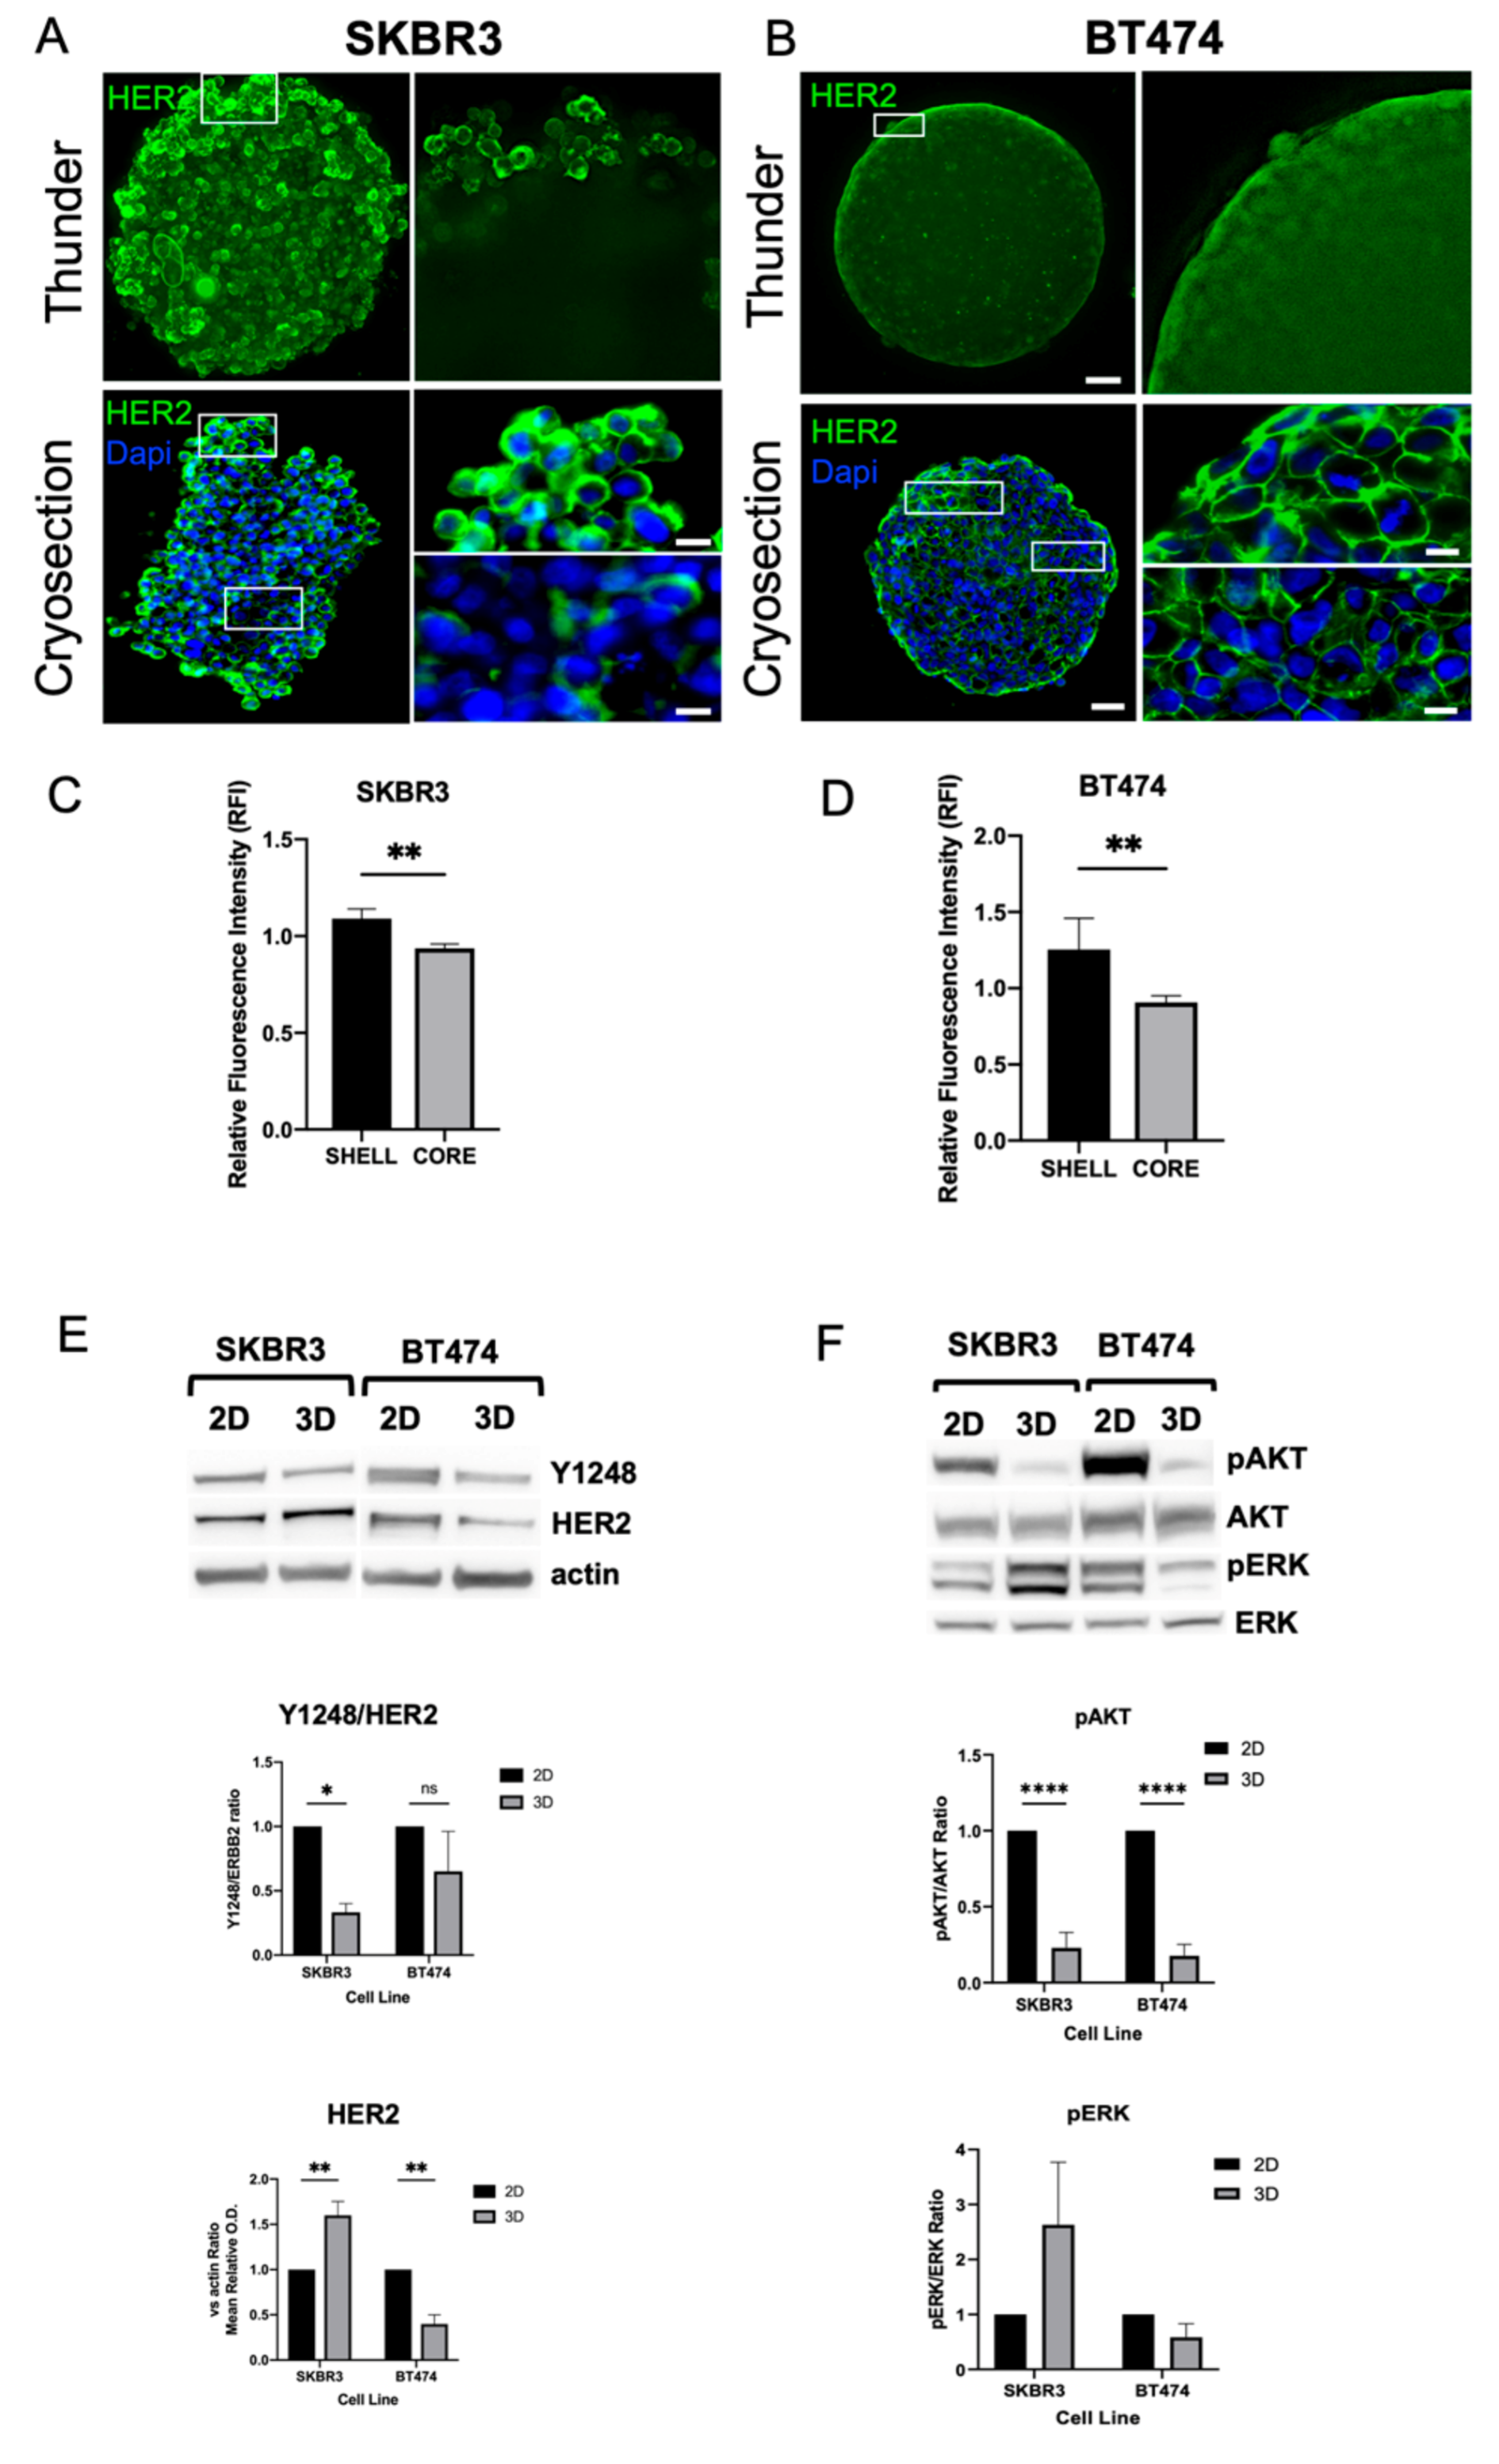
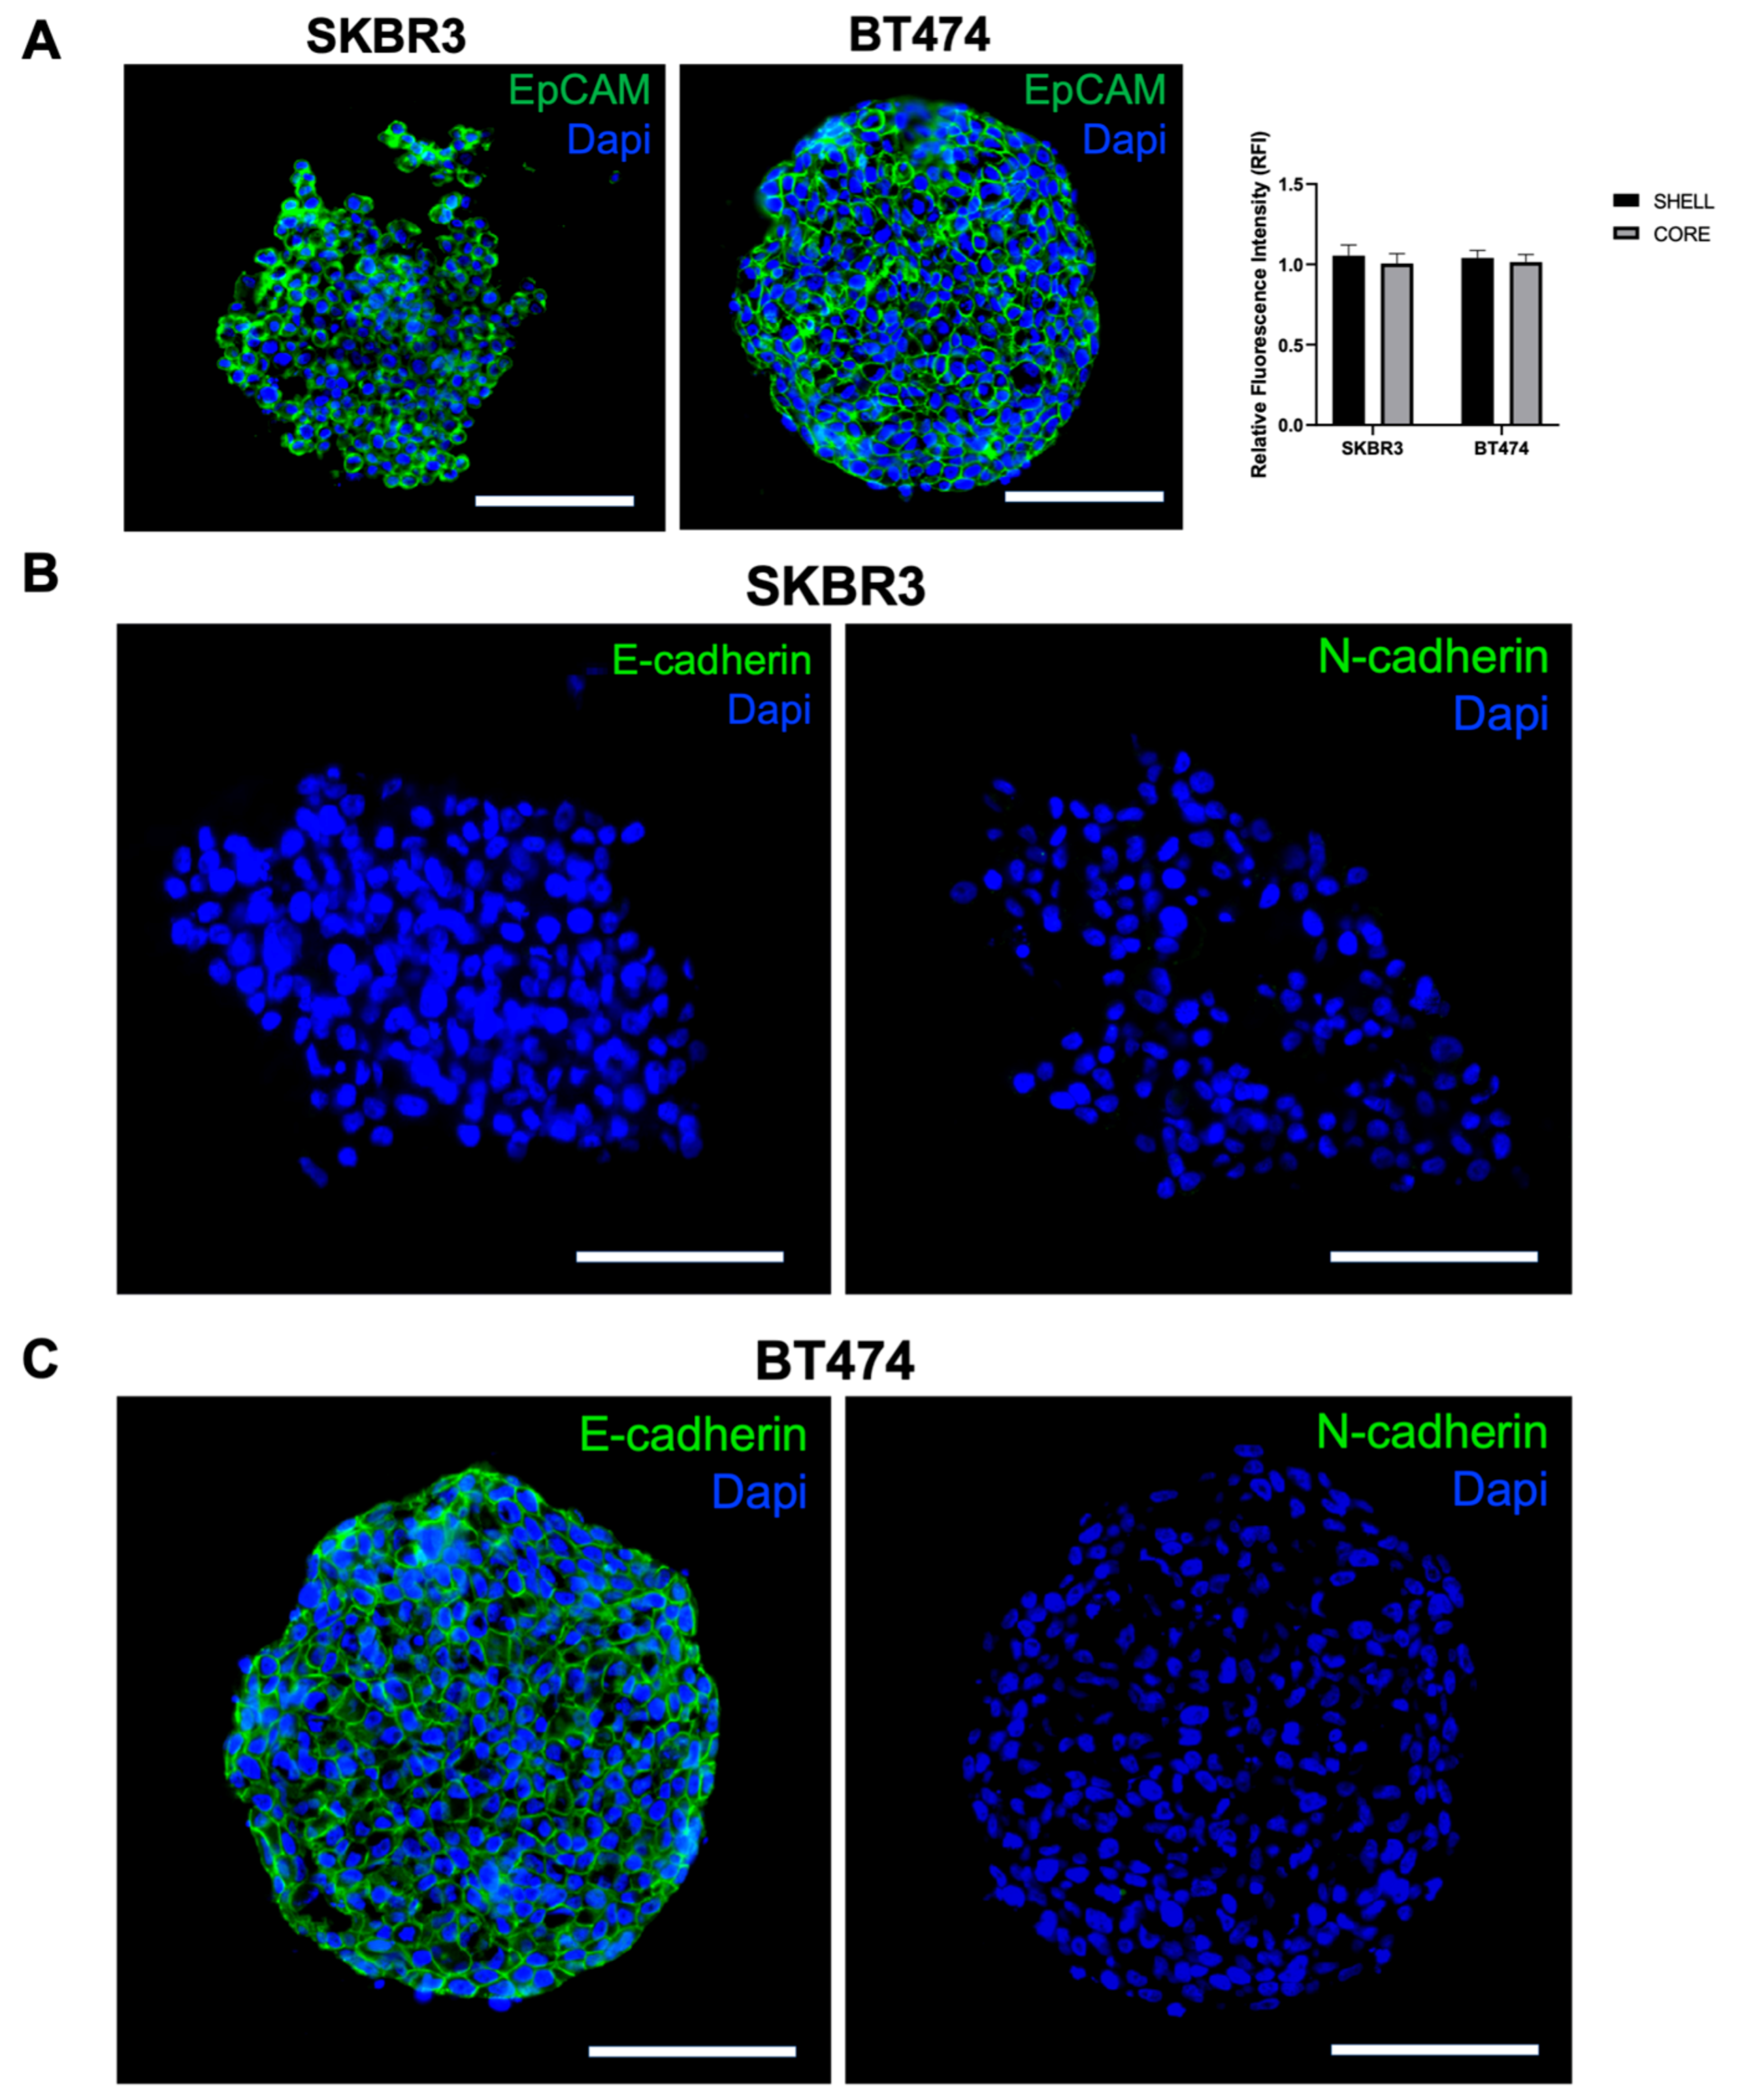
3.3. HER2 Distribution, Signaling, and Epithelial/EMT Markers in 3D Spheroids
HER2 expression was consistently detected at the plasma membrane in both SKBR3 and BT474 cells under 3D culture conditions [
23]. In 3D, confocal imaging of whole spheroids acquired with the Leica Thunder system revealed stronger HER2 signal at the periphery compared with the inner regions (
Figure 3A–B, top panels). To better visualize intratumoral gradients, we performed immunofluorescence staining on spheroid cryosections, which confirmed a progressive decrease of HER2 signal from the peripheral shell to the core (
Figure 3A–B, bottom panels). Quantitative fluorescence intensity profiling across spheroid regions confirmed the significant reduction in HER2 signal in the core compared to the periphery for both SKBR3 (
Figure 3C) and BT474 (
Figure 3D) spheroids. Next, to determine whether these differences reflected actual changes in protein abundance, we performed Western blot analysis of HER2 and downstream signaling components (
Figure 3E–F). SKBR3 spheroids showed a significant increase in total HER2 protein levels compared with 2D cultures but displayed reduced phosphorylation of AKT and HER2-Y1248. Conversely, BT474 spheroids exhibited a marked decrease in HER2 protein levels compared with 2D cultures, together with lower pAKT levels and HER2-Y1248. In both 2D and 3D models, ERK1/2 phosphorylation remained unchanged. Taken together, these results indicate that 3D architecture differentially regulates HER2 expression and downstream signaling across HER2+ BCa cell lines. In SKBR3 spheroids, HER2 accumulates at the membrane but is less active, suggesting altered receptor dynamics or impaired signaling competence in 3D. In contrast, BT474 spheroids show both reduced HER2 abundance and diminished AKT activity, which may reflect the stronger compaction and reduced proliferative state of this model [
24].
To further investigate spheroid organization and EMT characteristics, we performed immunofluorescence staining for EpCAM, E-cadherin, and N-cadherin on cryosections. EpCAM was uniformly expressed in both SKBR3 and BT474 spheroids [
25], with comparable intensity in peripheral and core regions (
Figure 4A, left panel and graph). In contrast, cadherins expression displayed a clear cell line–specific pattern: SKBR3 spheroids were negative for both E- and N-cadherin (
Figure 4 B), whereas BT474 spheroids expressed E-cadherin but lacked N-cadherin (
Figure 4C). The presence of E-cadherin in BT474 is consistent with their compact, cohesive epithelial morphology, while the absence of cadherin expression in SKBR3 may underlie their looser and less organized spheroid architecture [
26].
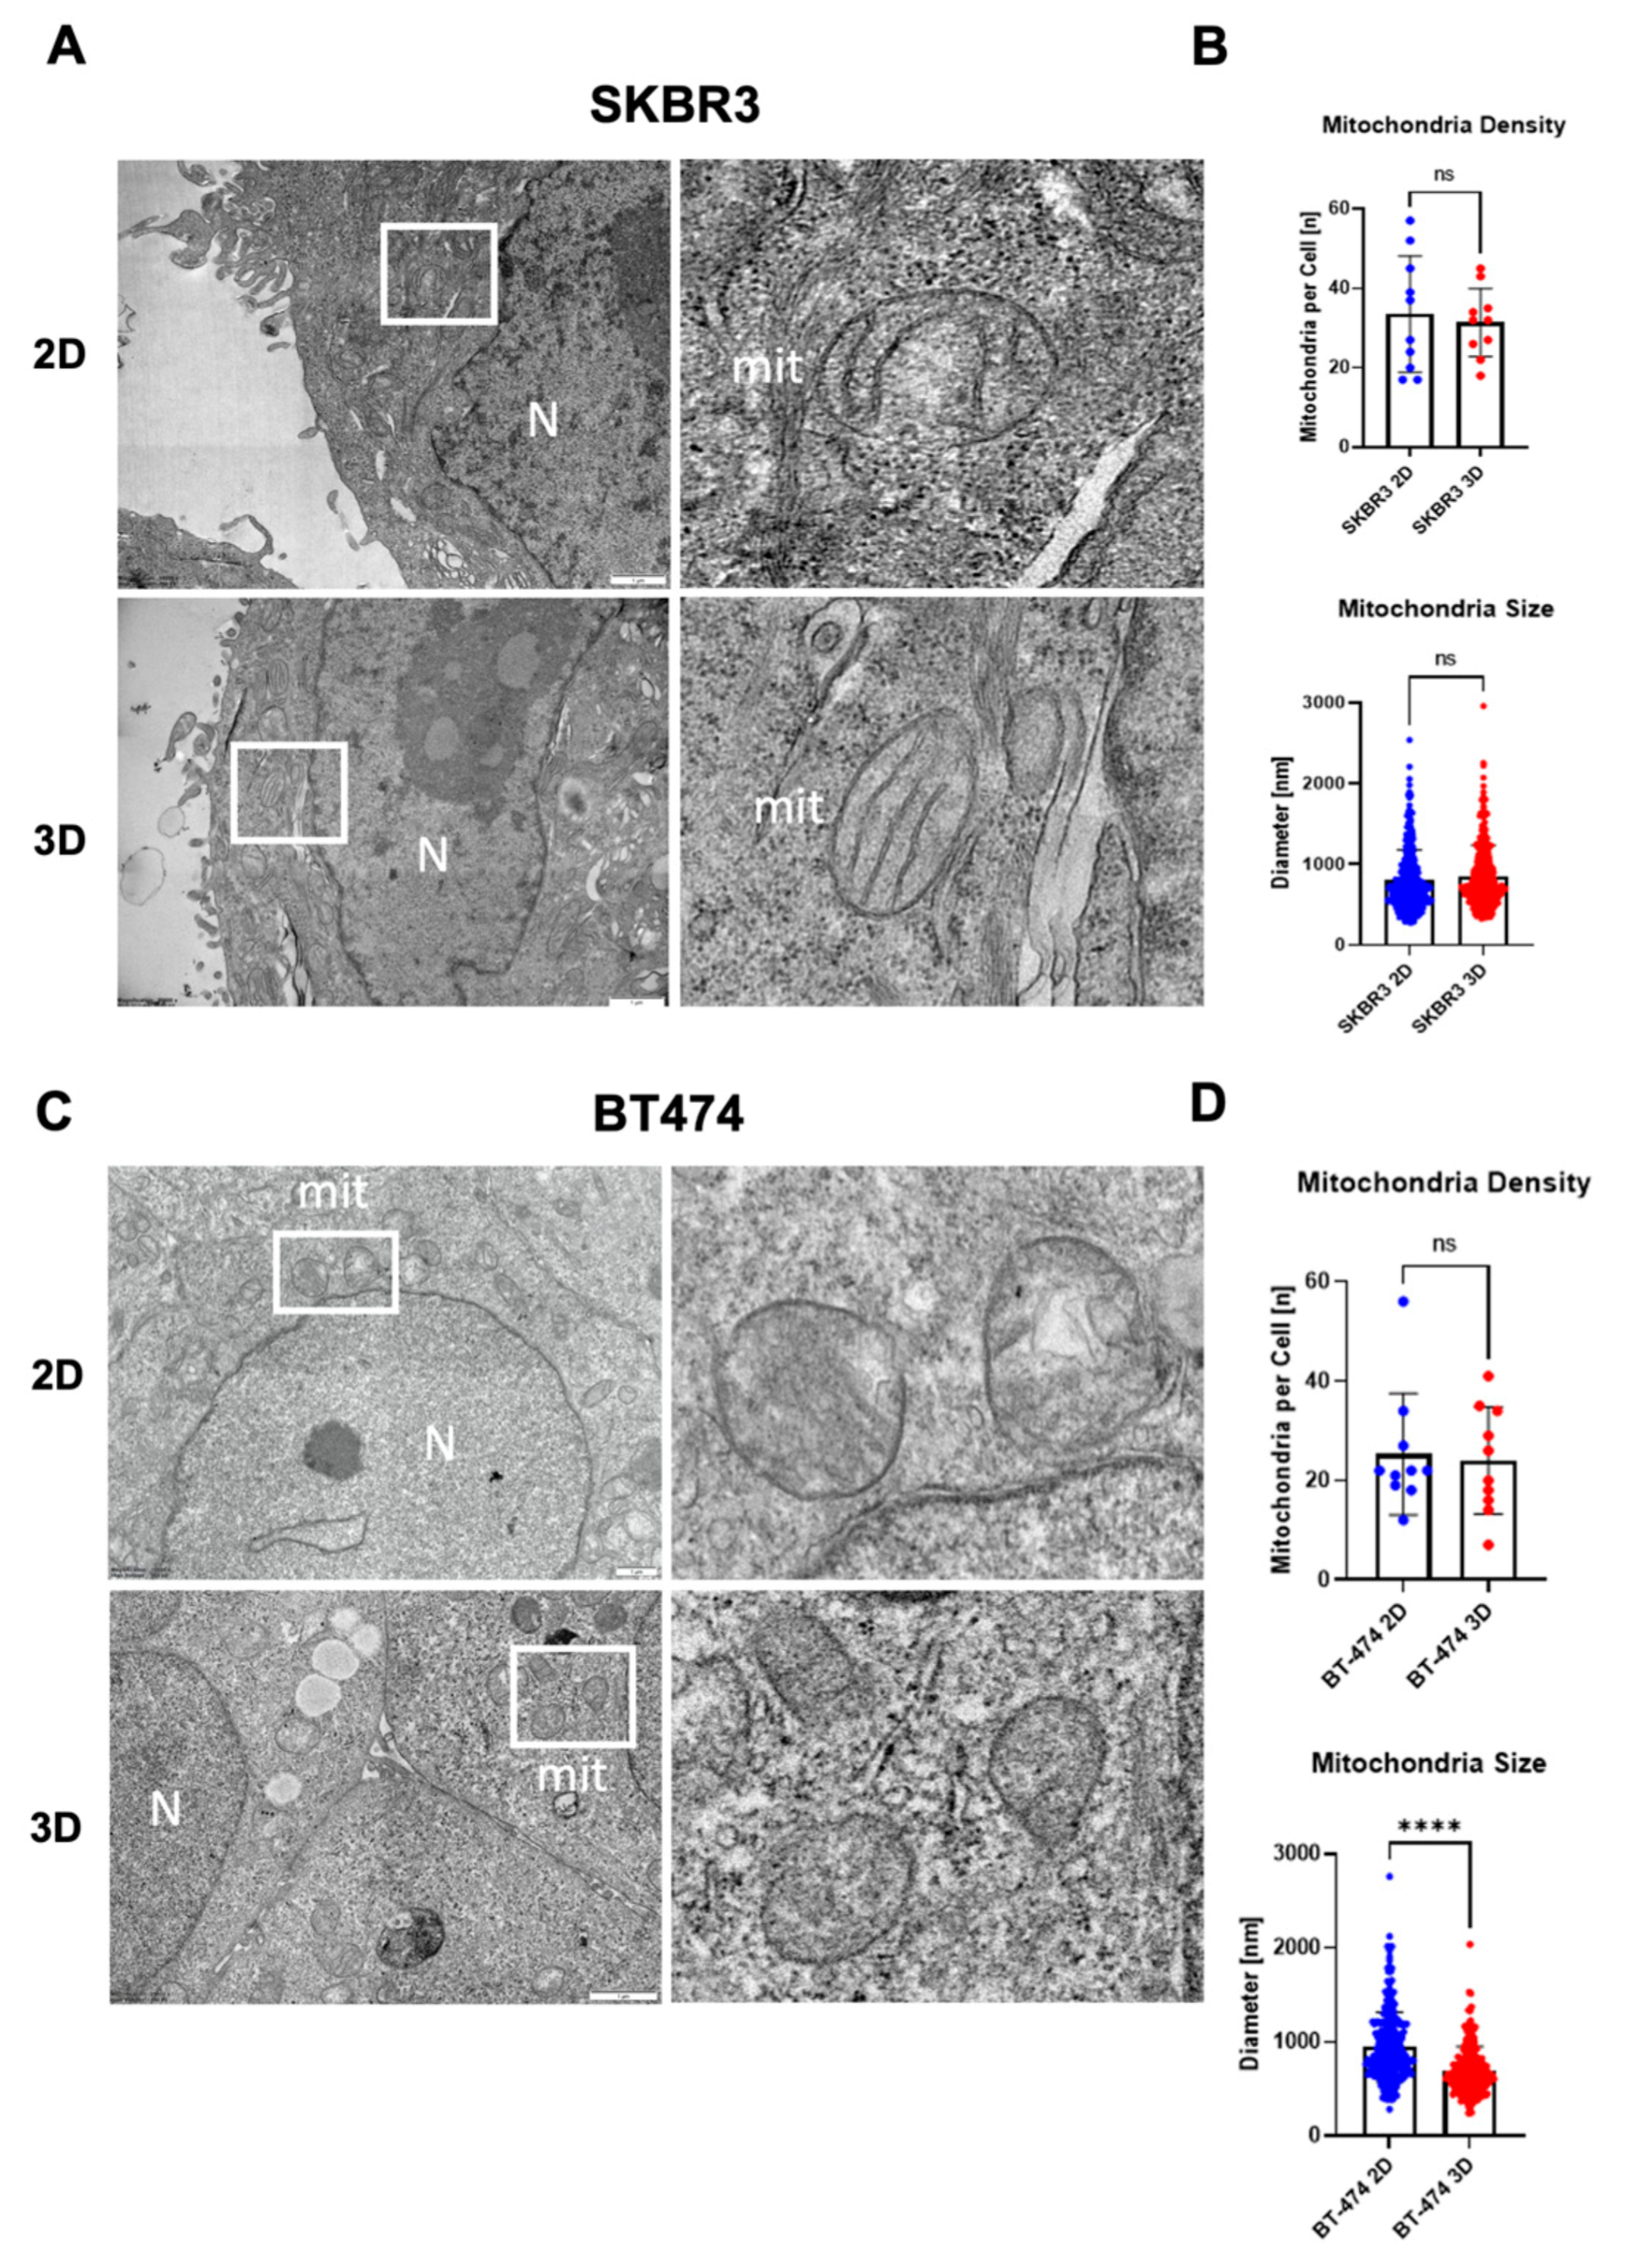
3.4. Ultrastructural Organization and Mitochondrial Remodeling in HER2+ BCa 2D/3D Models
To investigate the ultrastructural organization of spheroids, we performed transmission electron microscopy (TEM) on SKBR3 and BT474 cells grown in 2D monolayers or as 3D spheroids. TEM imaging provided high-resolution visualization of cellular architecture in spheroids, revealing preserved overall cell morphology and the absence of central necrosis after 4 days in both models (
Figure 5A,C). Mitochondria were evaluated as early indicators of subcellular adaptation to 3D culture, given their sensitivity to changes in oxygen and nutrient availability [
27]. A general trend toward reduced mitochondrial number per cell section was observed in 3D cultures, although not statistically significant (
Figure 5B,D). Quantitative analysis showed a significant decrease in mitochondrial diameter in BT474 spheroids compared with 2D cultures (****p < 0.0001, Mann–Whitney test), whereas SKBR3 cells displayed comparable mitochondrial size across both conditions (
Figure 5B–D). Qualitatively, mitochondria from BT474 spheroids appeared less electron-dense than those in 2D cultures, suggesting altered metabolic or structural state in the 3D context (5C).
4. Discussion
Three-dimensional (3D) spheroid cultures offer an intermediate level of complexity between 2D monolayers and in vivo tumor models, enabling a more physiologically relevant assessment of cancer cell organization, signaling, and therapeutic response [
28,
29,
30]. In this study, we systematically characterized and compared spheroids generated from two HER2-positive cell lines, SKBR3 and BT474, using an integrated approach combining wide-field and confocal imaging, cryosection-based immunofluorescence, biochemical analysis, and ultrastructural transmission electron microscopy (TEM). As previously reported by [
11] our results highlight pronounced differences between the two models. SKBR3 cells formed loose, irregularly shaped spheroids with heterogeneous Ki67 distribution, whereas BT474 cells generated compact, highly spherical aggregates with a well-defined proliferative rim and reduced Ki67 positivity overall. These findings are consistent with previous reports highlighting intrinsic differences in growth patterns and cell–cell adhesion between these lines and confirm the reproducibility of our spheroid-generation approach, previously applied by Arnaldi et al. to a spheroid model of NSC-34 cells (Arnaldi et al., 2024). In particular, our immunofluorescence analysis revealed that EpCAM was expressed in both models, confirming their epithelial identity, but only BT474 spheroids expressed the epithelial marker E-cadherin, whereas SKBR3 were negative for both. This observation is in line with prior reports linking E-cadherin to tight spheroid cohesion and helps explain the more compact architecture of BT474 spheroids compared with the looser SKBR3 aggregates [
31]. Loss of cadherin-mediated adhesion in SKBR3 may also contribute to their greater intercellular spacing observed by TEM and to the heterogeneity in Ki67 distribution. By combining cryosection immunofluorescence with quantitative profiling, we demonstrated a progressive decrease in HER2 signal from the spheroid periphery to the core in both cell lines, indicating architecture-dependent receptor distribution. Western blot analysis revealed a cell line–specific response to 3D culture: SKBR3 spheroids showed increased total HER2 levels but reduced phosphorylation of HER2-Y1248 and AKT, suggesting receptor accumulation without full activation. Conversely, BT474 spheroids displayed reduced HER2 expression together with suppressed pAKT, consistent with a less proliferative, compact state. These observations align with the notion that 3D structure modulates receptor dynamics and signaling, potentially affecting therapeutic susceptibility [
24,
32,
33]. Ultrastructural analysis further revealed structural remodeling in 3D cultures, particularly in BT474 spheroids, which displayed smaller and less electron-dense mitochondria compared with 2D cultures. Such changes likely represent early metabolic adaptations to the hypoxic and nutrient-limited conditions of dense spheroids, as described in other 3D tumor models [
34]. Notably, central necrosis was absent at day 4, supporting the use of this early time point for molecular and imaging studies without major confounding effects of cell death.
5. Conclusions
Collectively, our data demonstrate that 3D architecture amplifies intrinsic biological differences between HER2+ BCa cell lines, influencing cell–cell organization, receptor distribution, and downstream signaling. These results highlight the need to integrate morphological readouts with molecular analyses to fully capture architecture-dependent effects [
35]. In addition, our 3D systems provide a robust and reproducible platform to investigate receptor dynamics, drug penetration and trafficking, and therapeutic responses to HER2-targeted agents in a physiologically relevant context.
Author Contributions
P.A.: conceptualization; investigation; methodology; data curation; formal analysis; visualization; writing – original draft. V.D.Z., M.C.G. and G.B.: investigation; methodology. P.O.: supervision. P.C.: supervision, writing – review and editing. K.C.: conceptualization, supervision, resources, writing – original draft, review, and editing. All authors had seen and approved the manuscript and met the criteria for authorship.
Funding
This research was funded by University of Genova research grant funding (Fondi Ricerca Ateneo, 100008-2022-KC-FRA_ANATOMIA), by MUR (Ministero dell’Università e della Ricerca) PRIN2020PBS5MJ to KC and by Italian Ministry of Health (Ricerca Corrente 2025-2027) to IRCCS Ospedale Policlinico San Martino.
Institutional Review Board Statement
Not applicable
Informed Consent Statement
Not applicable
Data Availability Statement
All data generated or analysed during this study are included in this published article and its supplementary information files.
Acknowledgments
The authors thank the University of Genoa for funding the acquisition of the Hitachi 120 kV TEM microscope HT7800, (Grant D.R. 3404, Heavy Equipment) and Mario Passalacqua and Teresa Balbi for their support in imaging activities. Katia Cortese also wishes to thank a personal source of inspiration, whose legacy continues to inspire her dedication to creativity and integrity in science.
Conflicts of Interest
The authors declare no conflicts of interest.
Abbreviations
The following abbreviations are used in this manuscript:
|
2D – Two-dimensional |
|
3D – Three-dimensional |
|
ADC – Antibody–drug conjugate |
|
AKT – Protein kinase B |
|
BCa – Breast cancer |
|
BT474 – Human HER2⁺ breast cancer cell line BT-474 |
|
DAPI – 4′,6-diamidino-2-phenylindole |
|
DMEM – Dulbecco’s Modified Eagle Medium |
|
DIV – Days in vitro |
|
ECL – Enhanced chemiluminescence |
|
E-cadherin – Epithelial cadherin |
|
EM – Electron microscopy |
|
EMT – Epithelial–mesenchymal transition |
|
EpCAM – Epithelial cell adhesion molecule |
|
ERBB2 / HER2 – Human epidermal growth factor receptor 2 |
|
ERK – Extracellular signal–regulated kinase |
|
F-actin – Filamentous actin |
|
FBS – Fetal bovine serum |
|
FCS – Fetal calf serum |
|
IV – Intercellular voids |
|
Ki67 – Marker of proliferation Ki-67 |
|
NH₄Cl – Ammonium chloride |
|
O.C.T. – Optimal Cutting Temperature compound |
|
ON – Overnight |
|
PBS – Phosphate-buffered saline |
|
PFA – Paraformaldehyde |
|
PVDF – Polyvinylidene difluoride |
|
RT – Room temperature |
|
SKBR3 – Human HER2⁺ breast cancer cell line SK-BR-3 |
|
SDS-PAGE – Sodium dodecyl sulfate–polyacrylamide gel electrophoresis |
|
TEM – Transmission electron microscopy |
|
T-DXd – Trastuzumab–deruxtecan |
|
UV – Ultraviolet |
|
w/v – Weight/volume |
References
- Dessie, Z.G.; Zewotir, T. Global Determinants of Breast Cancer Mortality: A Comprehensive Meta-Analysis of Clinical, Demographic, and Lifestyle Risk Factors. BMC Public Health 2025, 25, 2640. [Google Scholar] [CrossRef] [PubMed]
- Loibl, S.; Gianni, L. HER2-Positive Breast Cancer. The Lancet 2017. [Google Scholar] [CrossRef]
- Cortés, J.; Kim, S.-B.; Chung, W.-P.; Im, S.-A.; Park, Y.H.; Hegg, R.; Kim, M.H.; Tseng, L.-M.; Petry, V.; Chung, C.-F.; et al. Trastuzumab Deruxtecan versus Trastuzumab Emtansine for Breast Cancer. New England Journal of Medicine 2022, 5, 393. [Google Scholar] [CrossRef]
- Bellese, G.; Tagliatti, E.; Gagliani, M.C.; Santamaria, S.; Arnaldi, P.; Falletta, P.; Rusmini, P.; Matteoli, M.; Castagnola, P.; Cortese, K. Neratinib Is a TFEB and TFE3 Activator That Potentiates Autophagy and Unbalances Energy Metabolism in ERBB2+ Breast Cancer Cells. Biochem Pharmacol 2023, 213, 115633. [Google Scholar] [CrossRef]
- Cordeiro, S.; Oliveira, B.B.; Valente, R.; Ferreira, D.; Luz, A.; Baptista, P.V.; Fernandes, A.R. Breaking the Mold: 3D Cell Cultures Reshaping the Future of Cancer Research. Front Cell Dev Biol 2024, 12. [Google Scholar] [CrossRef]
- Jubelin, C.; Muñoz-Garcia, J.; Griscom, L.; Cochonneau, D.; Ollivier, E.; Heymann, M.F.; Vallette, F.M.; Oliver, L.; Heymann, D. Three-Dimensional in Vitro Culture Models in Oncology Research. Cell Biosci 2022, 12, 1–28. [Google Scholar] [CrossRef]
- Breslin, S.; O’Driscoll, L. The Relevance of Using 3D Cell Cultures, in Addition to 2D Monolayer Cultures, When Evaluating Breast Cancer Drug Sensitivity and Resistance. Oncotarget 2016, 7, 45745–45756. [Google Scholar] [CrossRef] [PubMed]
- Fröhlich, E. The Variety of 3D Breast Cancer Models for the Study of Tumor Physiology and Drug Screening. Int J Mol Sci 2023, 24. [Google Scholar] [CrossRef] [PubMed]
- Han, S.J.; Kwon, S.; Kim, K.S. Challenges of Applying Multicellular Tumor Spheroids in Preclinical Phase. Cancer Cell Int 2021, 21, 152. [Google Scholar] [CrossRef]
- Pickl, M.; Ries, C.H. Comparison of 3D and 2D Tumor Models Reveals Enhanced HER2 Activation in 3D Associated with an Increased Response to Trastuzumab. Oncogene 2009, 28, 461–468. [Google Scholar] [CrossRef]
- Froehlich, K.; Haeger, J.D.; Heger, J.; Pastuschek, J.; Photini, S.M.; Yan, Y.; Lupp, A.; Pfarrer, C.; Mrowka, R.; Schleußner, E.; et al. Generation of Multicellular Breast Cancer Tumor Spheroids: Comparison of Different Protocols. J Mammary Gland Biol Neoplasia 2016, 21, 89–98. [Google Scholar] [CrossRef]
- Hongisto, V.; Jernström, S.; Fey, V.; Mpindi, J.-P.; Kleivi Sahlberg, K.; Kallioniemi, O.; Perälä, M. High-Throughput 3D Screening Reveals Differences in Drug Sensitivities between Culture Models of JIMT1 Breast Cancer Cells. PLoS ONE 2013, 8, e77232. [Google Scholar] [CrossRef]
- Arnaldi, P.; Casarotto, E.; Relucenti, M.; Bellese, G.; Gagliani, M.C.; Crippa, V.; Castagnola, P.; Cortese, K. A NSC-34 Cell Line-Derived Spheroid Model: Potential and Challenges for in Vitro Evaluation of Neurodegeneration. Microsc Res Tech 2024, 2785–2800. [Google Scholar] [CrossRef] [PubMed]
- Thongrom, B.; Tang, P.; Arora, S.; Haag, R. Polyglycerol-Based Hydrogel as Versatile Support Matrix for 3D Multicellular Tumor Spheroid Formation. 2023. [CrossRef]
- Santamaria, S.; Gagliani, M.C.; Bellese, G.; Marconi, S.; Lechiara, A.; Dameri, M.; Aiello, C.; Tagliatti, E.; Castagnola, P.; Cortese, K. Imaging of Endocytic Trafficking and Extracellular Vesicles Released Under Neratinib Treatment in ERBB2+ Breast Cancer Cells. Journal of Histochemistry and Cytochemistry 2021, 69, 461–473. [Google Scholar] [CrossRef]
- Sharma, S.; Agashe, A.; Hill, J.C.; Ganguly, K.; Sharma, P.; Richards, T.D.; Huang, W.; Kaczorowski, D.J.; Sanchez, P.G.; Kapania, R.; et al. Mechanical Cues Guide the Formation and Patterning of 3D Spheroids in Fibrous Environments. PNAS Nexus 2025, 4, pgaf263. [Google Scholar] [CrossRef]
- Wrzesinski, K.; Rogowska-Wrzesinska, A.; Kanlaya, R.; Borkowski, K.; Schwämmle, V.; Dai, J.; Joensen, K.E.; Wojdyla, K.; Carvalho, V.B.; Fey, S.J. The Cultural Divide: Exponential Growth in Classical 2D and Metabolic Equilibrium in 3D Environments. PLoS ONE 2014, 9, e106973. [Google Scholar] [CrossRef] [PubMed]
- Jaros, J.; Petrov, M.; Tesarova, M.; Hampl, A. Revealing 3D Ultrastructure and Morphology of Stem Cell Spheroids by Electron Microscopy. In 3D Cell Culture: Methods and Protocols; Koledova, Z., Ed.; Springer New York: New York, NY, 2017; pp. 417–431. ISBN 978-1-4939-7021-6. [Google Scholar]
- Smart, C.E.; Morrison, B.J.; Saunus, J.M.; Vargas, A.C.; Keith, P.; Reid, L.; Wockner, L.; Amiri, M.A.; Sarkar, D.; Simpson, P.T.; et al. In Vitro Analysis of Breast Cancer Cell Line Tumourspheres and Primary Human Breast Epithelia Mammospheres Demonstrates Inter- and Intrasphere Heterogeneity. PLoS ONE 2013, 8, e64388. [Google Scholar] [CrossRef]
- Ham, S.L.; Joshi, R.; Luker, G.D.; Tavana, H. Engineered Breast Cancer Cell Spheroids Reproduce Biologic Properties of Solid Tumors. Adv Healthc Mater 2016, 5, 2788–2798. [Google Scholar] [CrossRef]
- Uxa, S.; Castillo-Binder, P.; Kohler, R.; Stangner, K.; Müller, G.A.; Engeland, K. Ki-67 Gene Expression. Cell Death Differ 2021, 28, 3357–3370. [Google Scholar] [CrossRef]
- Azimi, T.; Loizidou, M.; Dwek, M. V Cancer Cells Grown in 3D under Fluid Flow Exhibit an Aggressive Phenotype and Reduced Responsiveness to the Anti-Cancer Treatment Doxorubicin. Sci Rep 2020, 10, 12020. [Google Scholar] [CrossRef]
- Daverey, A.; Mytty, A.; Kidambi, S. Topography Mediated Regulation of HER-2 Expression in Breast Cancer Cells. Nano Life 2012, 2. [Google Scholar] [CrossRef]
- Gangadhara, S.; Smith, C.; Barrett-Lee, P.; Hiscox, S. 3D Culture of Her2+ Breast Cancer Cells Promotes AKT to MAPK Switching and a Loss of Therapeutic Response. BMC Cancer 2016, 16. [Google Scholar] [CrossRef] [PubMed]
- Soysal, S.D.; Muenst, S.; Barbie, T.; Fleming, T.; Gao, F.; Spizzo, G.; Oertli, D.; Viehl, C.T.; Obermann, E.C.; Gillanders, W.E. EpCAM Expression Varies Significantly and Is Differentially Associated with Prognosis in the Luminal B HER2+, Basal-like, and HER2 Intrinsic Subtypes of Breast Cancer. Br J Cancer 2013. [CrossRef]
- Loh, C.Y.; Chai, J.Y.; Tang, T.F.; Wong, W.F.; Sethi, G.; Shanmugam, M.K.; Chong, P.P.; Looi, C.Y. The E-Cadherin and n-Cadherin Switch in Epithelial-to-Mesenchymal Transition: Signaling, Therapeutic Implications, and Challenges; 2019; Vol. 8; ISBN 6568737690.
- Arora, S.; Singh, S.; Mittal, A.; Desai, N.; Khatri, D.K.; Gugulothu, D.; Lather, V.; Pandita, D.; Vora, L.K. Spheroids in Cancer Research: Recent Advances and Opportunities. J Drug Deliv Sci Technol 2024, 100, 106033. [Google Scholar] [CrossRef]
- Nath, S.; Devi, G.R. Three-Dimensional Culture Systems in Cancer Research: Focus on Tumor Spheroid Model. Pharmacol Ther 2016, 163, 94–108. [Google Scholar] [CrossRef]
- Shahrivari, S.; Aminoroaya, N.; Ghods, R.; Latifi, H.; Afjei, S.A.; Saraygord-Afshari, N.; Bagheri, Z. Toxicity of Trastuzumab for Breast Cancer Spheroids: Application of a Novel on-a-Chip Concentration Gradient Generator. Biochem Eng J 2022, 187, 108590. [Google Scholar] [CrossRef]
- Muñoz-Galindo, L.; Melendez-Zajgla, J.; Pacheco-Fernández, T.; Rodriguez-Sosa, M.; Mandujano-Tinoco, E.A.; Vazquez-Santillan, K.; Castro-Oropeza, R.; Lizarraga, F.; Sanchez-Lopez, J.M.; Maldonado, V. Changes in the Transcriptome Profile of Breast Cancer Cells Grown as Spheroids. Biochem Biophys Res Commun 2019, 516, 1258–1264. [Google Scholar] [CrossRef]
- Manuel Iglesias, J.; Beloqui, I.; Garcia-Garcia, F.; Leis, O.; Vazquez-Martin, A.; Eguiara, A.; Cufi, S.; Pavon, A.; Menendez, J.A.; Dopazo, J.; et al. Mammosphere Formation in Breast Carcinoma Cell Lines Depends upon Expression of E-Cadherin. PLoS ONE 2013, 8, e77281. [Google Scholar] [CrossRef]
- Zheng Boyer, J.; Lewis Phillips, G.D.; Nitta, H.; Garsha, K.; Admire, B. ; Kraft, · Robert; Dennis, E. ; Vela, E.; Towne, · Penny Activity of Trastuzumab Emtansine (T-DM1) in 3D Cell Culture. 2021, 188, 65–75. [Google Scholar] [CrossRef]
- Tapia, I.J.; Perico, D.; Wolos, V.J.; Villaverde, M.S.; Abrigo, M.; Silvestre, D. Di; Mauri, P.; De Palma, A.; Fiszman, G.L. Proteomic Characterization of a 3D HER2+ Breast Cancer Model Reveals the Role of Mitochondrial Complex I in Acquired Resistance to Trastuzumab. 2024. [CrossRef]
- Relucenti, M.; Francescangeli, F.; De Angelis, M.L.; D’Andrea, V.; Miglietta, S.; Pilozzi, E.; Li, X.; Boe, A.; Chen, R.; Zeuner, A.; et al. The Ultrastructural Analysis of Human Colorectal Cancer Stem Cell-Derived Spheroids and Their Mouse Xenograft Shows That the Same Cells Types Have Different Ratios. Biology (Basel) 2021, 10. [Google Scholar] [CrossRef] [PubMed]
- Falletta, P.; Tagliatti, E.; Cortese, K. Seeing Structure, Losing Sight: The Case for Morphological Thinking in the Age of Integration. Anatomical Record 2025, 8–11. [Google Scholar] [CrossRef] [PubMed]
|
Disclaimer/Publisher’s Note: The statements, opinions and data contained in all publications are solely those of the individual author(s) and contributor(s) and not of MDPI and/or the editor(s). MDPI and/or the editor(s) disclaim responsibility for any injury to people or property resulting from any ideas, methods, instructions or products referred to in the content. |
© 2025 by the authors. Licensee MDPI, Basel, Switzerland. This article is an open access article distributed under the terms and conditions of the Creative Commons Attribution (CC BY) license (http://creativecommons.org/licenses/by/4.0/).