Submitted:
08 October 2025
Posted:
09 October 2025
You are already at the latest version
Abstract
Tree stability under wind loading is a critical concern for risk management in urban and natural environments. Despite advances in assessment methods, discrepancies persist between theoretical predictions and real-world tree behaviour. This study presents results from an extensive field investigation conducted at the University of Dundee Botanic Gardens to evaluate tree uprooting stability through non-destructive static, dynamic, and uprooting tests. This paper focusses on the programme of non-destructive and uprooting tests conducted across twenty-one trees of a variety of coniferous and deciduous species. Regarding the non-destructive tests, multiple tests were carried out on the same trees, varying both the pulling direction and the pulling height. Geotechnical properties, including shear strength, water content, soil-water retention behaviour and granulometry, were characterized to assess their role in root anchorage. Results revealed that the maximum overturning moment (ML) occurred between 1.6 and 2.9° inclination during uprooting for the partially-saturated ground conditions at the time of testing, irrespective of species or biometric parameters. The findings contribute to refining tree stability assessments, offering practical insights for arboriculture and urban planning.
Keywords:
tree stability
; uprooting
; field testing
1. Introduction
Trees are fundamental components of the urban landscape, valued not only for their aesthetic and cultural significance but also for the vital ecosystem services they provide. These services include temperature regulation, stormwater management, air purification, carbon sequestration, and noise attenuation [1]. Despite these benefits, trees can become sources of hazard in urban environments, particularly under high wind conditions. Storms and strong wind gusts—now more frequent and intense due to climate change—can lead to tree failure, resulting in structural damage, injuries, or even fatalities. Traditional qualitative assessments, such as the Visual Tree Assessment (VTA) method developed by [2], are still widely employed in arboriculture due to their simplicity and non-invasive nature. Despite the development of more quantitative techniques [3], VTA remains a practical first-line tool for identifying external signs of structural weakness and potential failure in trees.
Over the last two decades, various quantitative methodologies have been developed to evaluate tree stability under lateral loading, especially due to wind. A milestone in this field is the static pulling test, a non-destructive procedure introduced by [4,5,6,7]. This test estimates the tree's overturning moment by applying a controlled lateral force using a winch-and-rope system, while monitoring the resulting trunk rotation up to a defined elastic limit (typically 0.25°). The moment-rotation data is then interpreted through an empirical model, obtained from 400 tests, to extrapolate the tree's maximum load capacity. Several other authors in the literature have conducted winch tests, reporting soil type, tested tree species, tree height range, and the resulting range of failure moment and critical inclination angle [8,9,10,11]. Fraser & Gardiner conducted 368 pulling tests on Picea sitchensis, reporting a failure moment (ML) range of 16–53 kNm at a critical inclination angle range between 10° and 25°. Crook & Ennos performed 22 tests on Larix europea × japonica, obtaining ML values between 6–24 kNm at angles between 16° and 28°. Dèfossez et al. carried out 12 tests on Picea sitchensis, with ML values ranging from 8–16 kNm at inclination angles between 6° and 20°. Similarly, Urata performed 12 tests on Picea glehnii, recording ML values of 3–29 kNm and critical angles between 14° and 22°. It is evident that there is a fairly wide range of critical moments and critical inclination angles measured in the tests described. Other authors have focused on the relationship between root systems and soil. Nicoll et al., 2008 studied how root system architecture and soil conditions influence resistance to lateral forces. Achim & Nicoll (2009) proposed a resistance model that assumes a rigid root–soil plate and incorporates soil–root mechanical interaction. More recently, the macroelement approach, treating the root system as an equivalent embedded shallow foundation, has also been proposed to model root soil interaction of tree pull-over as a function of soil properties and the combination of loads/stress path applied [14,15,16,17] performed full-scale uprooting tests, capturing real failure moments and identifying significant deviations from theoretical predictions, especially under non-standard pulling configurations and complex root architectures. [18] demonstrated through centrifuge modelling that root morphology, soil moisture, and fine root content significantly affect tree overturning resistance and the rotation angle at which this occurs, revealing that traditional winching tests may overestimate stability for horizontal applications due to vertical confinement effects.
In this context, the present study investigates tree uprooting stability through a comprehensive experimental campaign conducted at the University of Dundee Botanic Gardens (Scotland, UK). A total of twenty-one mature trees, from both coniferous and deciduous species (Pinus nigra, Picea abies, Tsuga, Betula, Quercus, Acer platanoides, Nothofagus, Eucalyptus), were tested under varying loading configurations, an aspect that has not been explored before to the authors’ knowledge. Each tree was subjected to multiple static pulling tests, changing both the direction and angle of load application to simulate diverse wind scenarios as shown in Figure 1. Additionally, for a subset of the specimens, destructive uprooting tests were carried out to obtain full failure curves. The measured responses were then compared with those predicted using Wessolly’s (and other) extrapolation methods, with the aim of evaluating its reliability under variable loading directions and inclinations.
2. Materials and Methods
2.1. Site Details and Testing Summary
2.1.1. Overview
The University of Dundee Botanic Garden, established in October 1971, serves as an exemplary site where nature-based and community-focused solutions address climate adaptation and mitigation challenges [19]. Spanning 9.5 hectares and overlooking the River Tay, the garden hosts a diverse collection of plants, including both indigenous British species and significant specimens from around the world. Figure 2 highlights the site boundaries (indicated by the white line). Specific areas within the garden have been designated as outdoor laboratories for research purposes, including tree testing. Trees selected for testing were identified as healthy specimens, that nevertheless required removal as part of a broader renovation project designed to enhance biodiversity. Test trees and the specific testing conducted at each (as reported in this paper) are shown in Figure 3.
2.1.2. Geological Settings
The Dundee Formation, defined by [20], is composed mainly of cross-bedded sandstones with interbedded siltstone and mudstone, representing lacustro-deltaic to delta-front deposits. In the area of Dundee Botanic Garden, there are: i) raised marine deposits from the late glacial period including littoral sand, deltaic sand, silt, and subtidal clay; and ii) glacial meltwater deposits consisting of sand and gravel. The gardens are situated on a sloping terrace at the summit of an ice age cliff. The bedrock of the garden consists of sandstone at the lower levels and volcanic felsite at the higher levels (however, the boundary is not indicated). The superficial deposits in the area include sands, gravels, and clays from marine and glacial deposits during the ice age. This information suggests that the gardens have likely undergone significant landscaping, potentially involving the movement or importation of soil. Figure 4 shows images following some of the uprooting tests that will be described later. It is evident that there is potential for variations in the water content of the soil at different depths. Other visual evidence includes the presence of cobbles and plates of sandstone with varying thickness (2-5 cm in size).
2.1.2. Topsoil Characterization
A range of in-situ and laboratory testing was undertaken to characterise the topsoil where tree roots were located. This included:
- Corkscrew (CS) device testing, as described in [21,22]. The tool was rotated into the soil and extracted vertically at 100 mm/min using a lever system connected to a load cell, which recorded the force required for pull-out [22]. Shear stress was calculated from the measured force and the surface area of the sides of the soil cylinder encapsulated by the corkscrew. Tests were performed at four points around each tree, typically at one-meter distances in cardinal directions, and conducted sequentially with depth where possible (i.e. until refusal was reached).
- Vane shear testing (VST), as usually used for in-situ shear strength measurements in cohesive soils [23]. Tests were conducted at four cardinal points (N-E-S-W) around each tree, as well as additional positions, when necessary, as done with corkscrew.
- Water content measurements, using a ML2 Theta Probe (Delta-T, Cambridge, UK) employing capacitive technology to measure the soil's dielectric constant. Measurements were taken at four cardinal points (N-E-S-W) around each tree as done with corkscrew and vane test.
- Obtaining disturbed soil samples from the areas of Pinus nigra (258, 260, 268, 270), Acer platanoides (433, 434, 604), and Nothofagus (568, 606), which were used to determine the particle size distribution (PSD) curve using a combination of vibrational sieving and sedimentation techniques. For visualization, different zones have been identified within the Botanic Garden, within which the trees have been grouped (see Figure 3). Due to the high organic matter content, samples were wetted before sieving for the finest portion (silt-clay) and an automated Pario sedimentation analyzer (Meter Group, Washington, USA) was used. Sediment was shaken in distilled water for 60 seconds, allowed to settle for 2.5 hours, and analyzed to determine the grain size percentages. Combining these methods produced continuous PSD curves, which were consistent across two samples at each sampling location (Figure 5a). All samples were classified as sandy loam (Figure 5b).
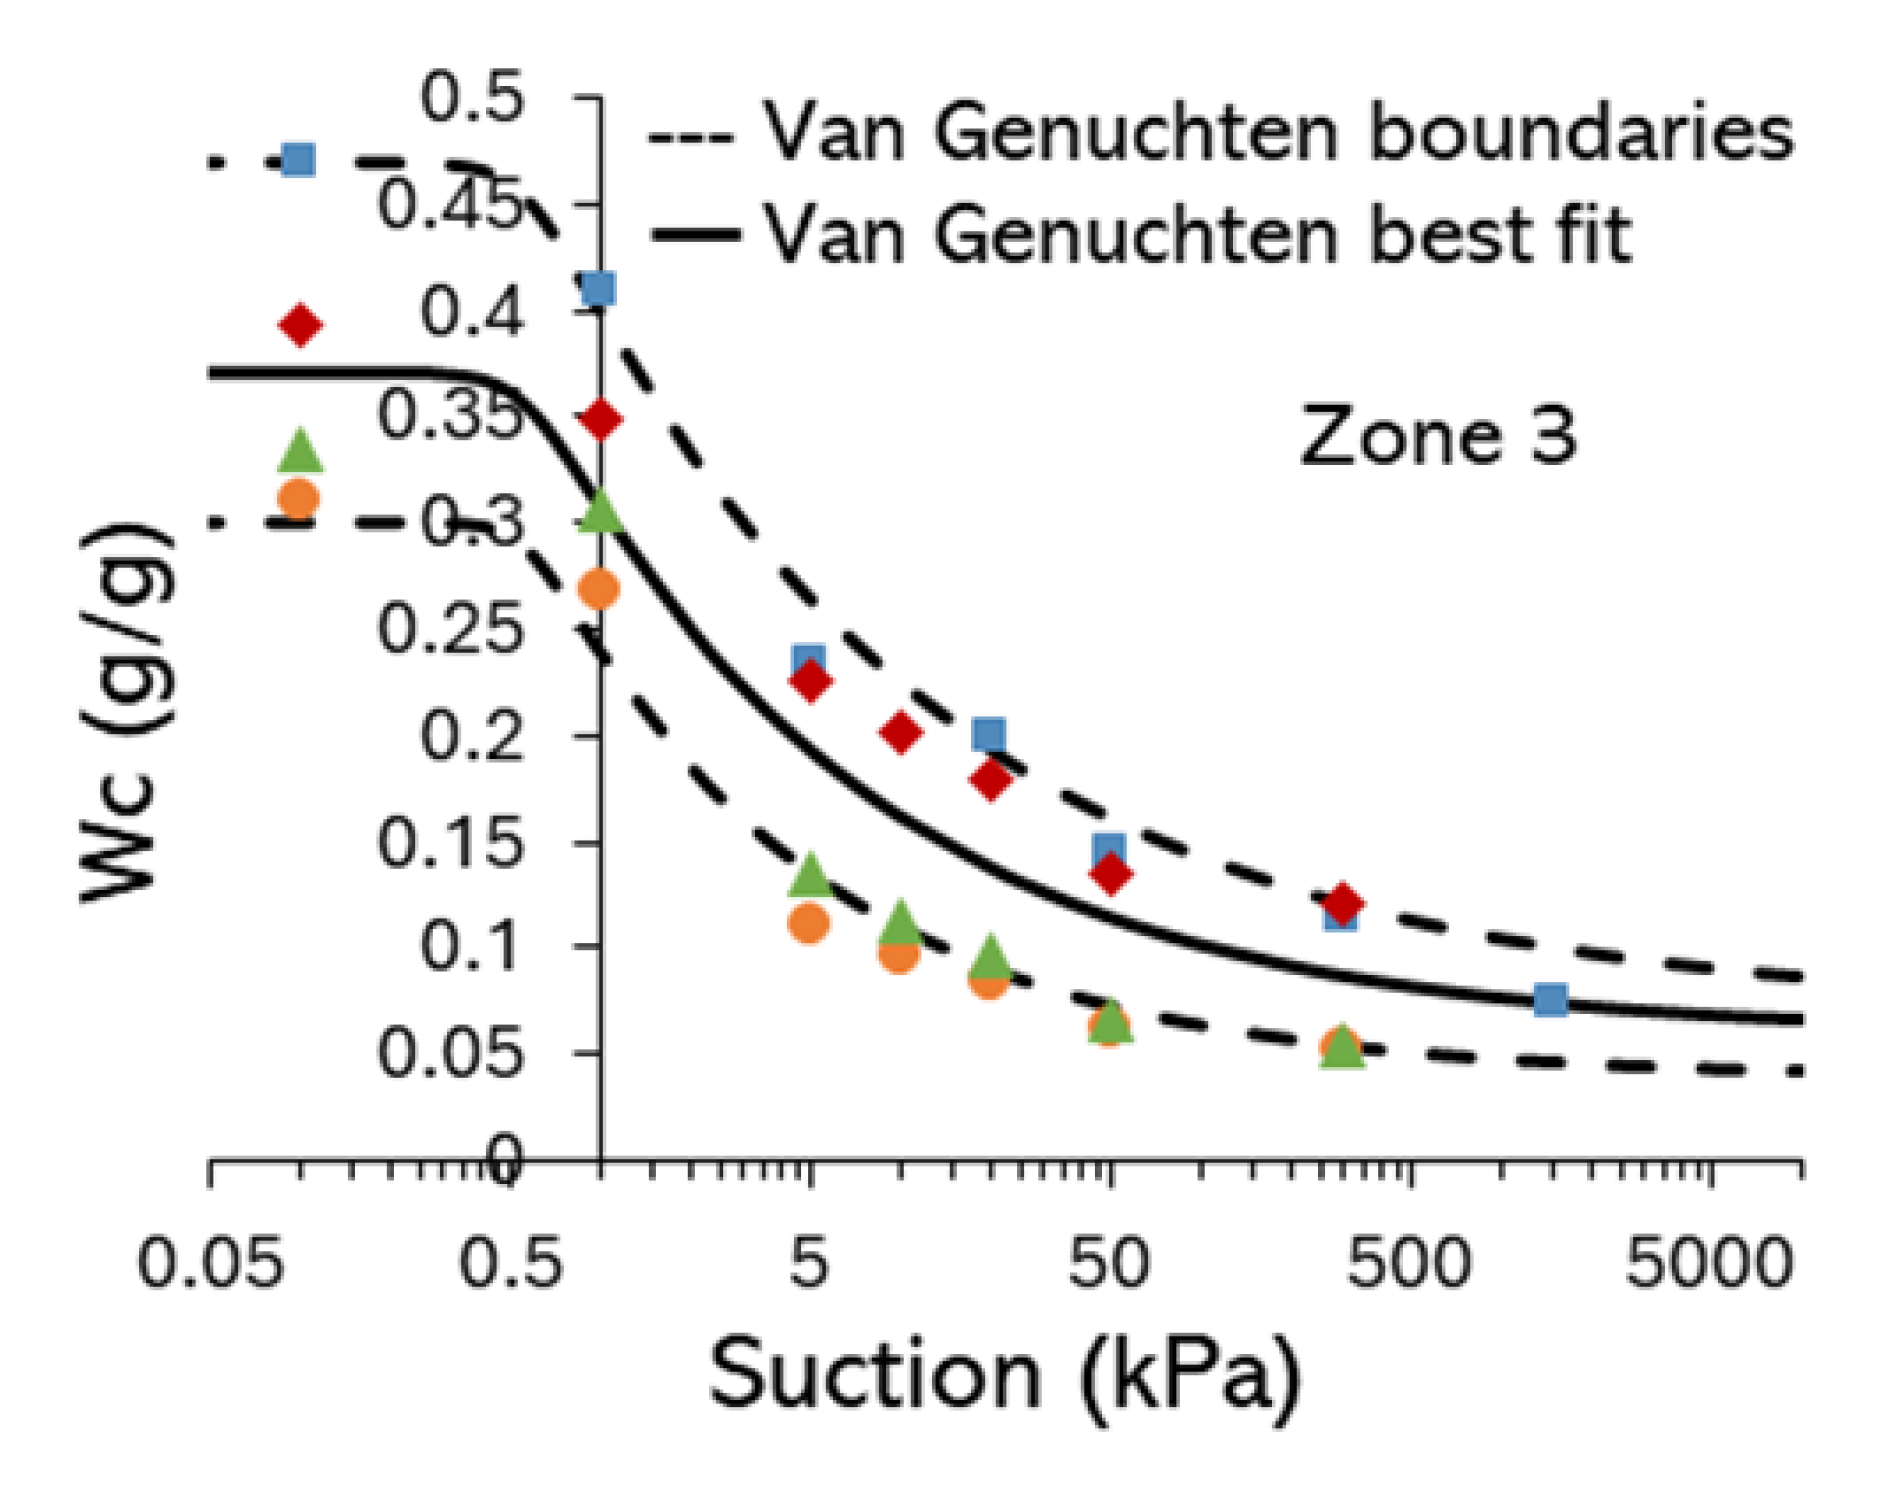
- Taking soil samples (50 mm diameter, 40 mm high) for soil-water retention curve (SWRC) determination. After 24-hour saturation in degassed water, the soil cores were placed on a ceramic plate with an air entry value (AEV) = 100 kPa (Soil moisture Equipment Corp, California, USA) to achieve hydraulic contact and suction equilibration at 1, 5, 20 and 50 kPa. A pressure plate apparatus (Soil moisture Equipment Corp, California, USA) was subsequently used to test in the range of 50 – 1500 kPa). The resulting data was fitted using the van-Genuchten curve [24]. Figure 6 shows the soil water retention curve for rich vegetated soil of zone 3 as an example. Data for the other zones can be found in the appendix.
Figure 6.
Example Soil Water Retention Curve for Botanic Garden topsoil (rich vegetated soil, zone 3, Figure 3). Dashed lines indicate upper and lower limits. The other zone in Appendix A.
Figure 6.
Example Soil Water Retention Curve for Botanic Garden topsoil (rich vegetated soil, zone 3, Figure 3). Dashed lines indicate upper and lower limits. The other zone in Appendix A.
- • Collection of three cylindrical soil samples (150 mm diameter, 300 mm high) from zones 2, 3 and 5 (see Figure 3). A custom metal tube was used for sampling, hammered into the soil with a protective rubber separator. After extraction with a lever system (the same used for corkscrew), the samples were transferred to pre-prepared plastic cylinders using a press to minimize disturbance and were otherwise sealed to avoid moisture content change. The plastic cylinders were divided into two parts (100 mm and 200 mm high) with separators to define the cutting surface, and a draining mesh was placed at the base. Direct shear tests were conducted using a specialized apparatus [25] at a shearing speed of 100 mm/min. Tests were performed on samples which were saturated for 24 hours and drained manually prior to sharing. Shear curves (Figure 7) lacked distinct peaks, likely due to visible roots enhancing soil shear strength [22].
Figure 7.
Large-sample direct shear apparatus (DSA) test curves.
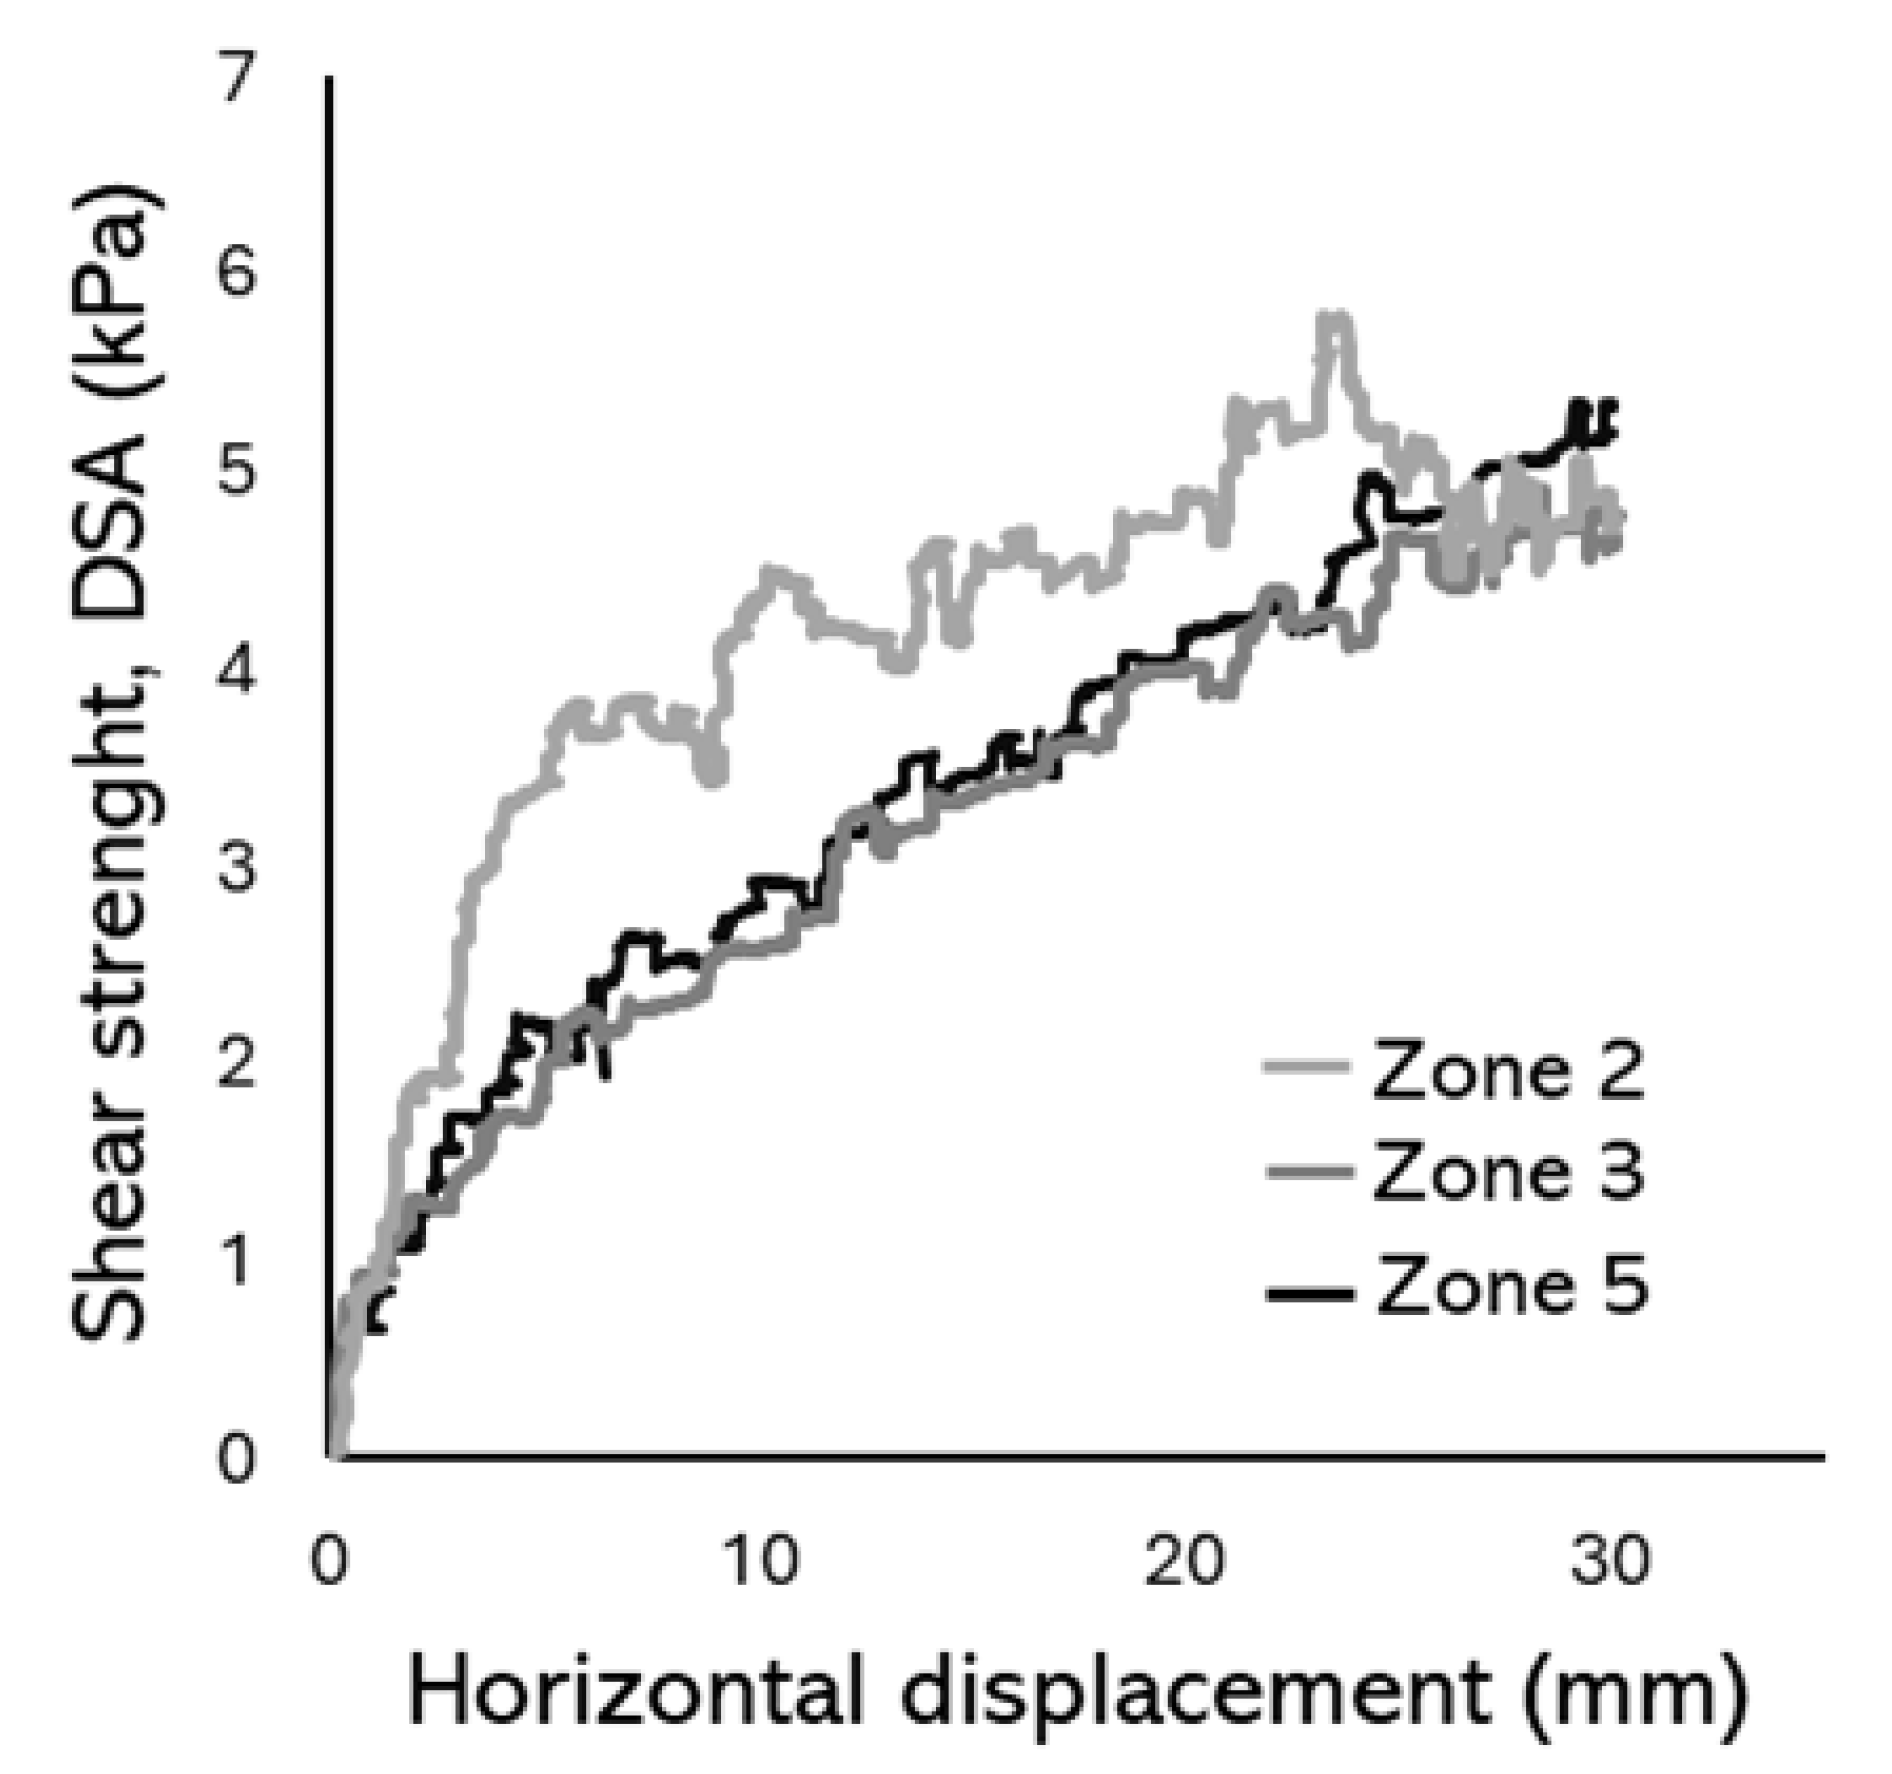
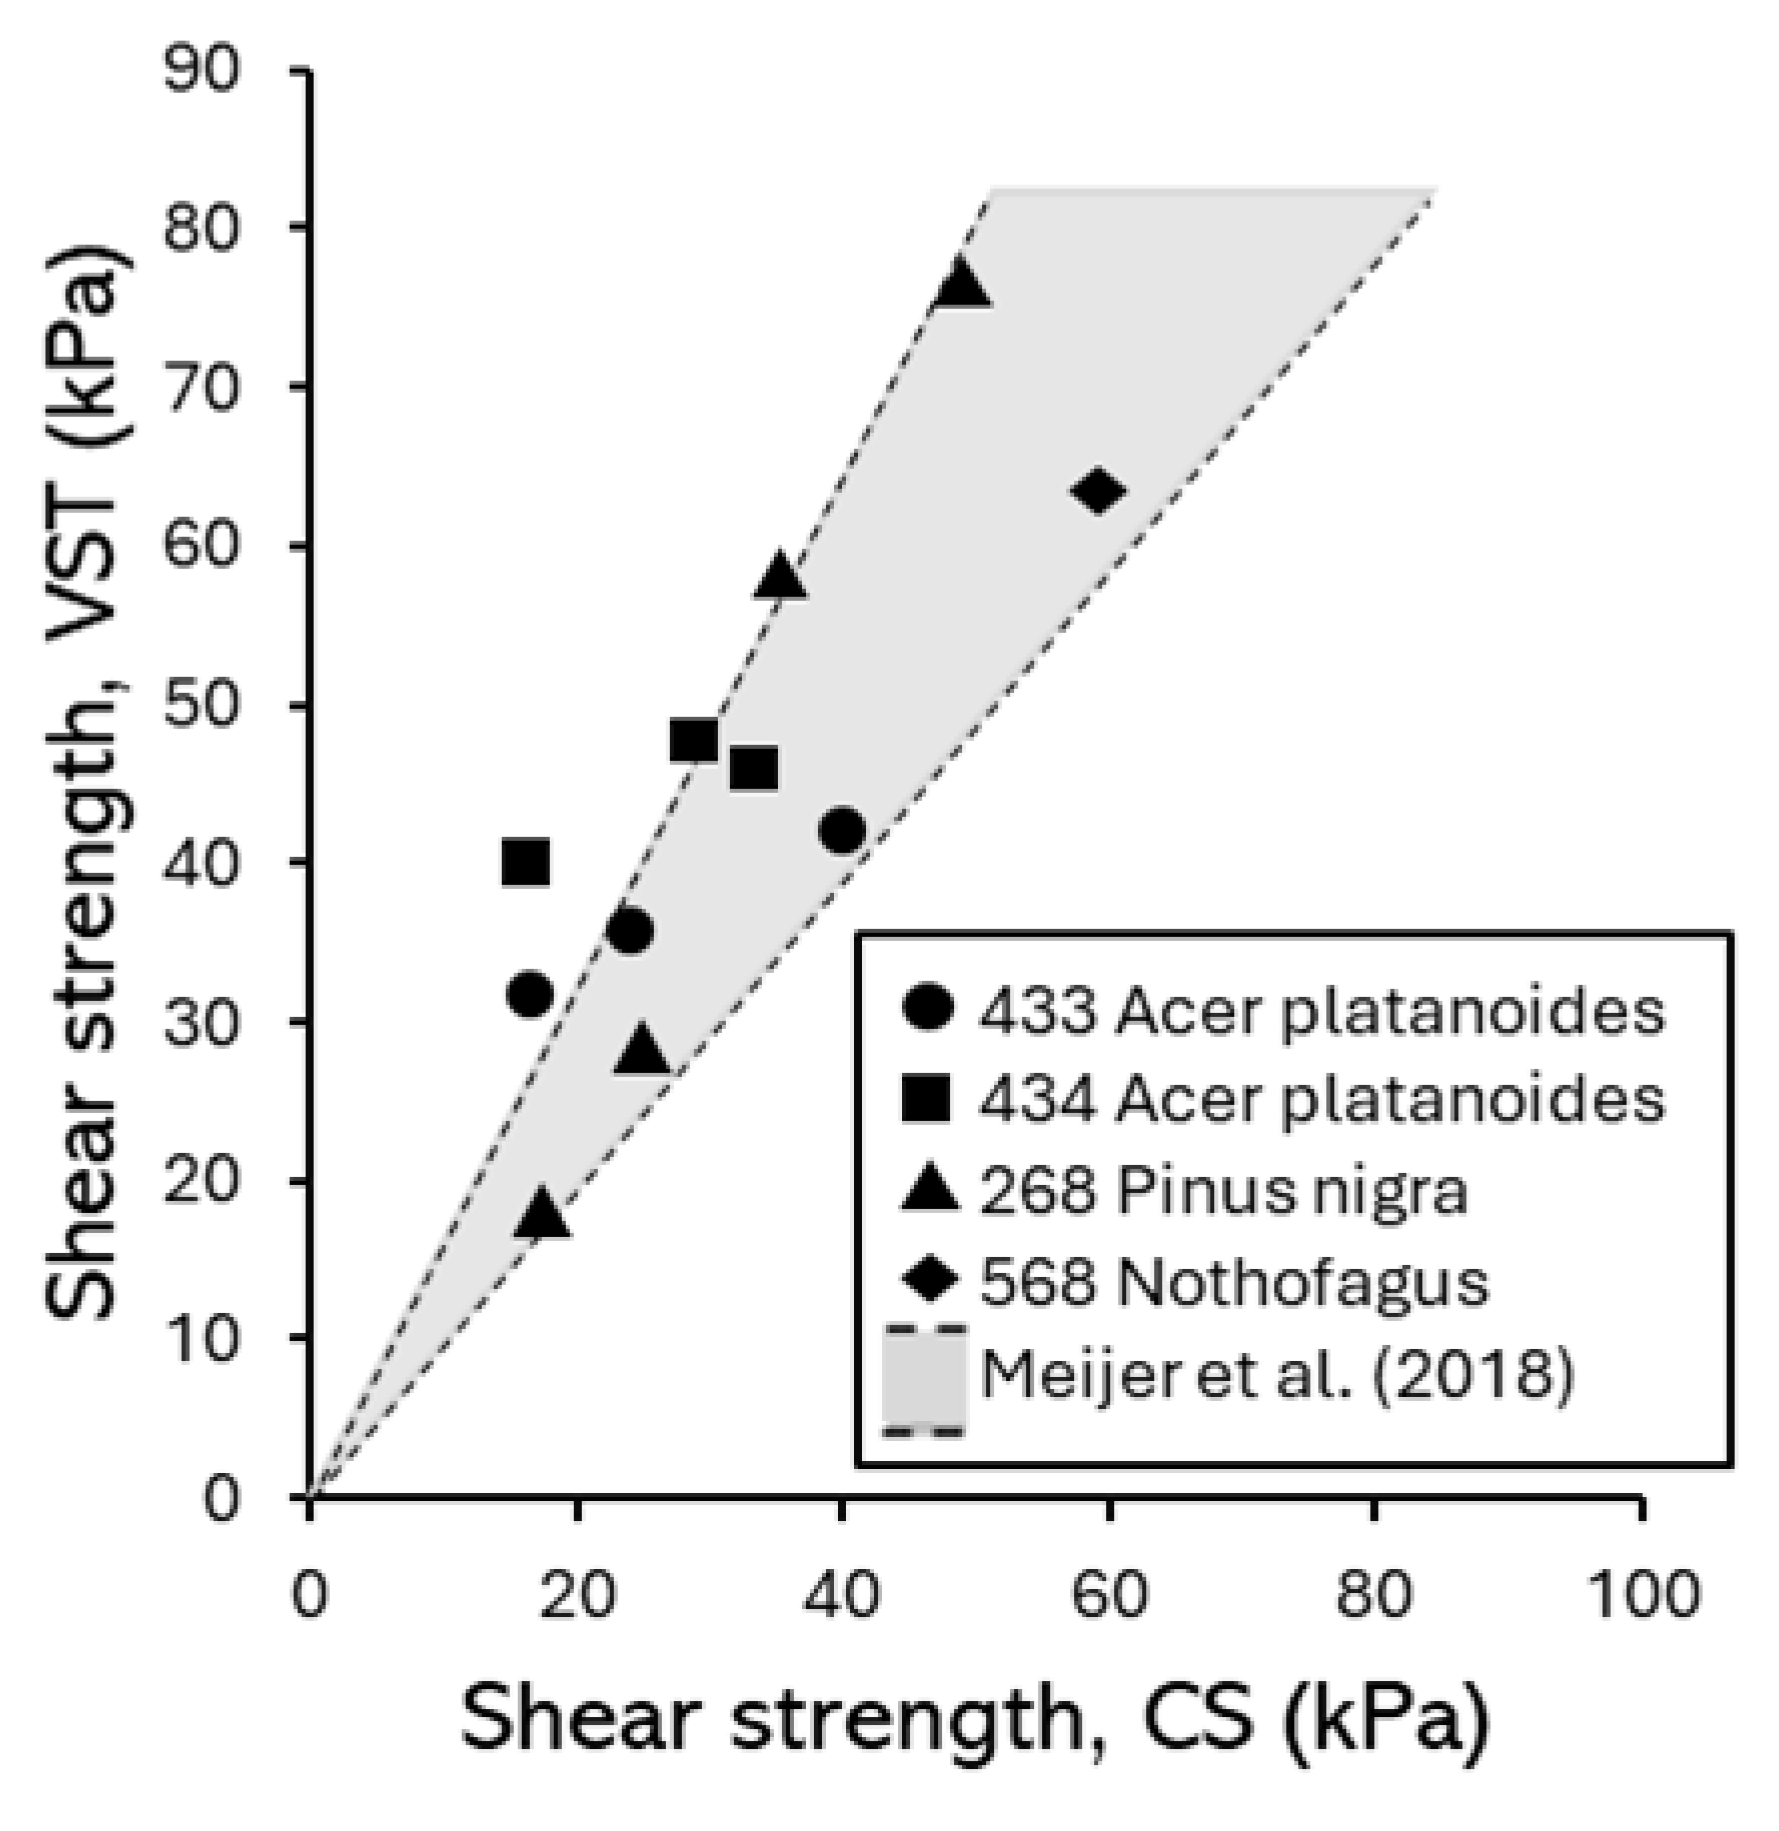
Figure 8 synthesizes the shear strength and water content measurements at a single location (268 Pinus nigra, zone 3). Similar synthesized data for the other zones can be found in the Appendix A. This shows that as depth increases, the shear strength of the soil decreases. This is not due to an increased level of saturation in the soil as the water content also decreases in depth (the soil is under-drained by the sandstone). The most plausible explanation is that the soil layer containing the root system (mainly the upper 0.4 m) exhibits higher shear strength due to the presence of the tree roots. This is supported by the variability in shear strength as a function of position around the tree within this upper layer, indicating different amounts of root material being encountered. The DSA test data on the un-rooted soil provides a lower bound to the shear strength data measured by the other techniques within the root bulb. In Figure 8, CS and VST data are correlated against each other and plotted by depth range. The VST measurements are consistently higher than those measured by the CS test, and this is consistent with the upper-bound of the range found by [22] based on testing around Picea stichensis grown in a sandy silt (see Figure 9).
Figure 8.
Comparative summary of soil state and strength data (Zone 3): (a) Shear strength from corkscrew (CS), vane shear tests (VST) and DSA; (b) Depth distribution of soil water content and suction inferred from Zone 3 SWRC; (c) Soil profile. Test data from different locations related to the trunk, where N, E, S, and W are cardinal directions, RP =root-plate and H = soil under root-plate.
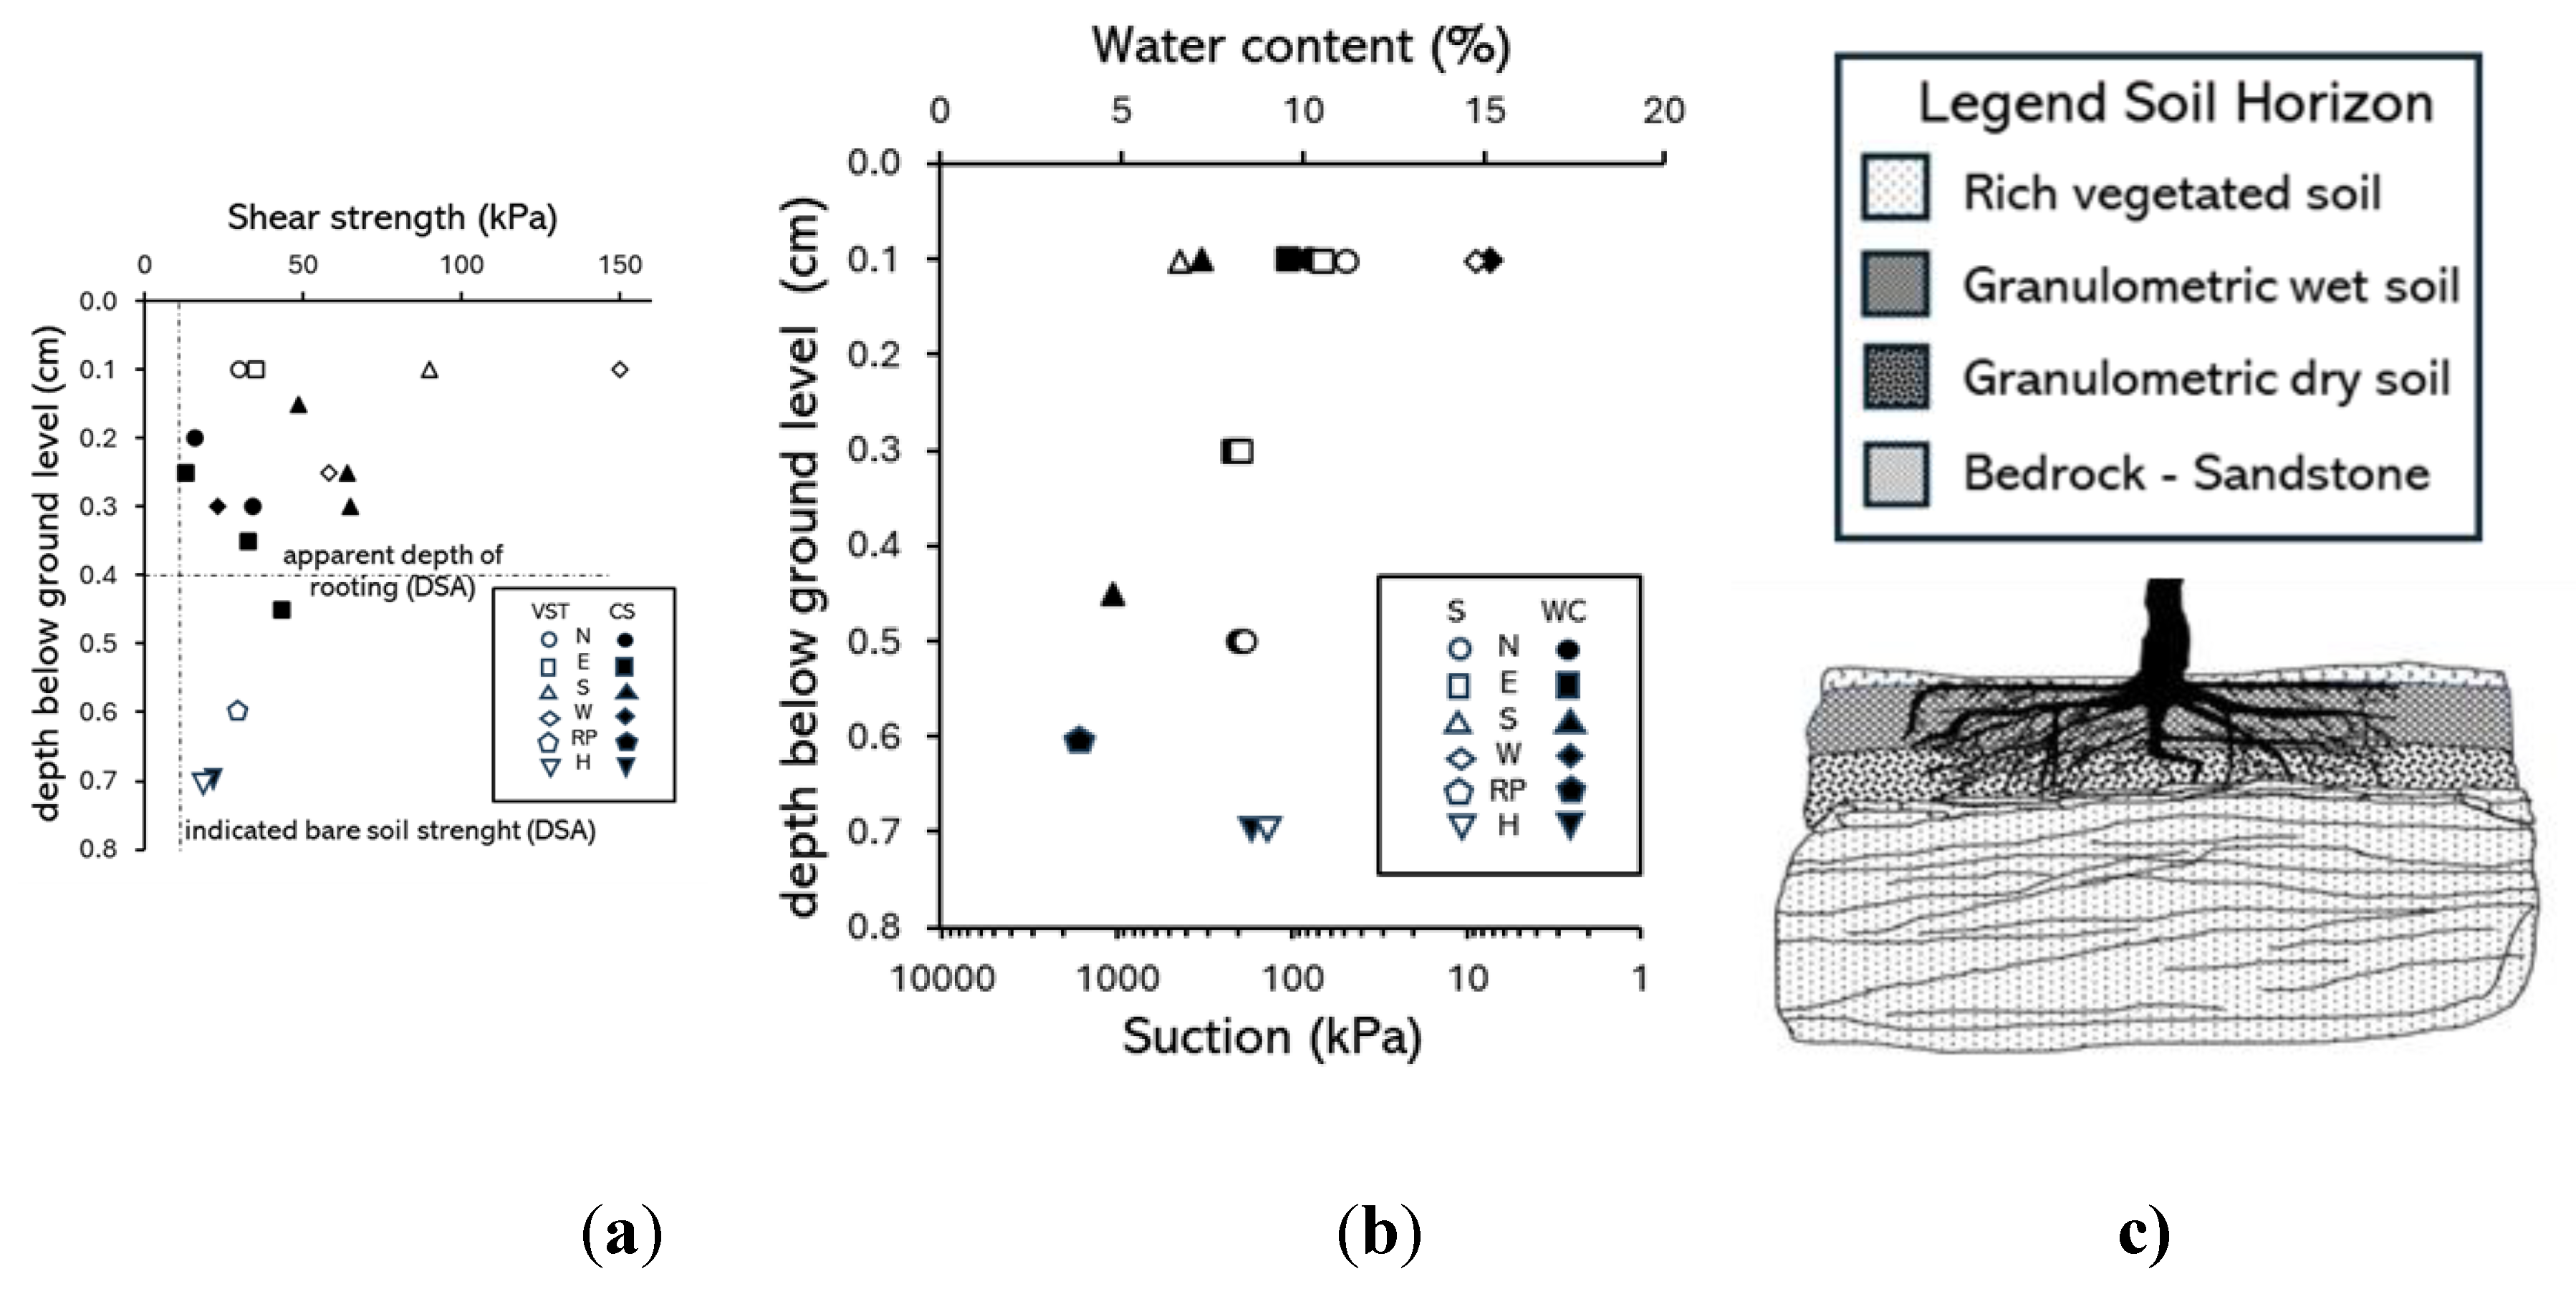
Figure 9.
Correlation between corkscrew (CS) and vane shear tests (VST) data and comparison to measurements in a similar soil type at an alternative site [22].
Figure 9.
Correlation between corkscrew (CS) and vane shear tests (VST) data and comparison to measurements in a similar soil type at an alternative site [22].
2.2. Winching Test Setup
Winching tests were conducted either to a serviceability limit state (0.25° rotation in the direction of pulling at the base of the trunk), hereafter referred to as ‘non-destructive’ or for uprooting (ultimate limit state). A rope was attached at a specified height on the test tree and tied through a winch to a nearby anchor tree (at its base). The winch was equipped with an in-line load cell (Kaliber 5 t force meter – Budapest (Hungary): working load limit 50 kN, resolution 10 N, sampling rate 1 Hz) to measure the tensile (pulling) force, while two perpendicular inclinometers (range +/-30°, resolution 0.001°, sampling rate 10 Hz; aligned parallel and perpendicular to the pulling direction; dual axis inclinometer of the DynaTree Root and Trunk Testing System - BtFakopp Enterprise Bt - Ágfalva (H 9423), Fenyo u. 26, Hungary) were attached horizontally at the tree base. Before testing, trees were pruned to avoid the rope snagging on branches and the distance between trees, rope anchor height on both trees, and initial tree dimensions were recorded. Tests were conducted for each tree in two perpendicular directions (predominantly N-S and E-W), where the dominant regional wind direction at the site was N-S. Tests were also conducted at varying rope connection heights to vary the ratio of vertical, horizontal and moment actions on the root system. During the larger deformation uprooting tests, inclinometers required periodic re-levelling due to excessive rotation. After reaching peak resistance, the residual resistance phase was recorded. Complete resistance loss was not observed as inclinometers were removed once significant rotation was visually apparent.
Figure 10.
Setup of non-destructive and uprooting tests.
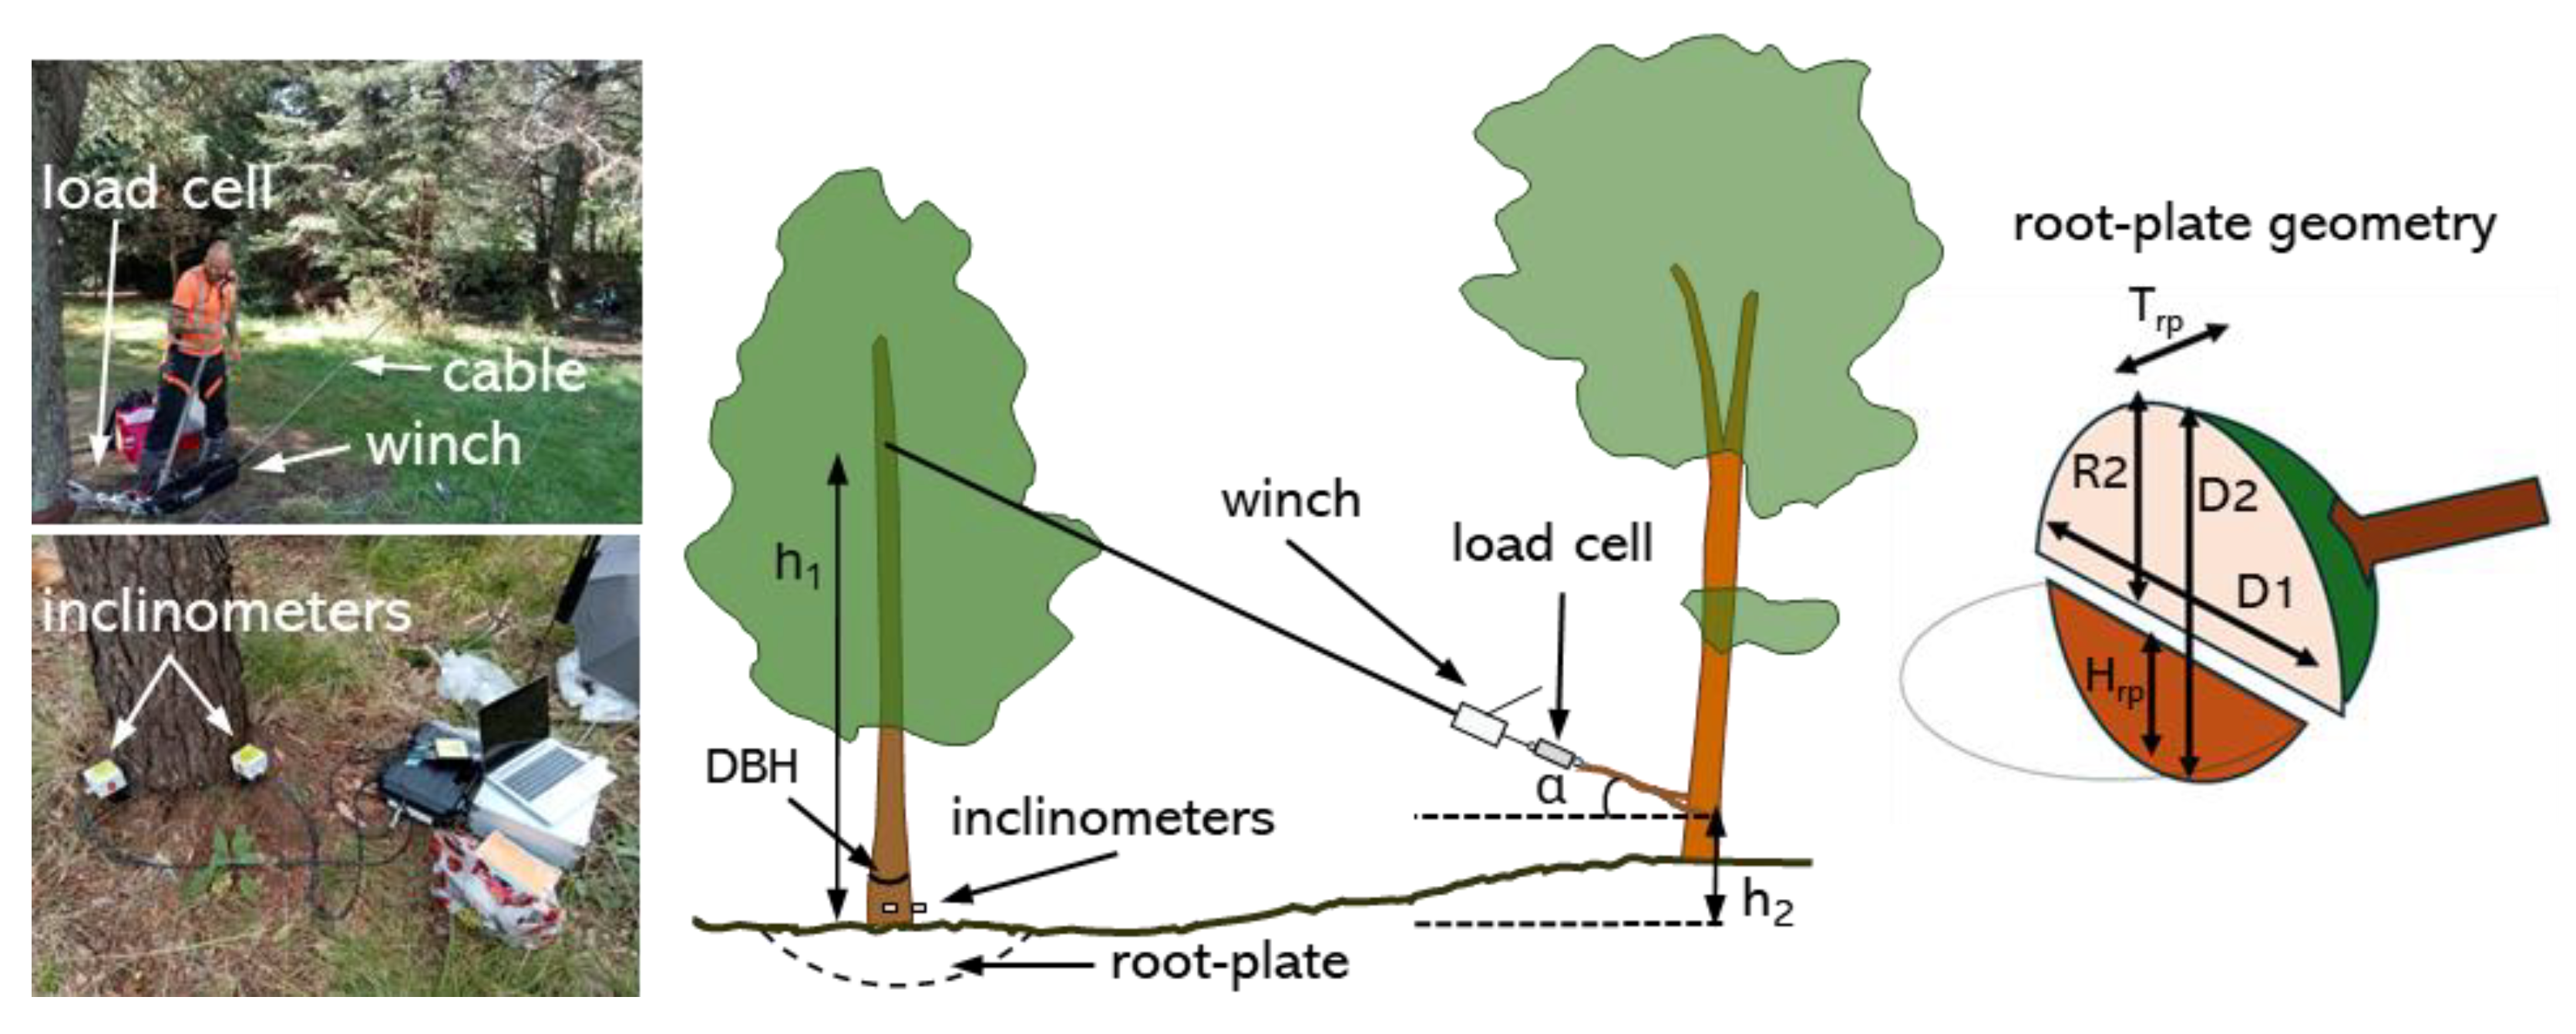
Figure 11 shows test location and directions of pulling for winching tests reported in this study. A total of 21 trees were tested, divided into conifers and deciduous species. The conifers included Pinus nigra, Picea abies, and Tsuga, while the deciduous species consisted of Acer platanoides, Nothofagus, Betula, Eucalyptus, and Quercus. Each tree was assigned a unique identification code (ID), codes used by curator of the Botanic Garden. Table 1 summaries the individual tree characteristics (height, H and diameter at breast height, DBH) and test types conducted at each location.
Trees were tested first under non-destructive conditions such that multiple tests (2 – 4 per tree, in all but two cases) could be conducted on the same tree under the same groundwater conditions. For some trees the direction of pull (in-plan) was varied with the pulling angle to the horizontal (α) kept as constant as possible within the constraints of finding suitable nearby trees for anchorage of the rope. These tests were subsequently used to evaluate whether stiffness and capacity were different in the predominant wind direction compared to the direction perpendicular to this. For other trees the plan direction was held constant and α was varied either by changing the attachment point on the tree (i.e. h1 in Figure 10) or by anchoring to a different nearby tree, changing the horizontal distance between the pulling and anchorage points. Fifteen of the twenty-one trees were subjected to uprooting tests after the programme of non-destructive tests was complete. The system configuration used for these tests was similar to that employed for the standard pulling test, but winching was continued until failure by uprooting. For safety reasons, the canopy was completely removed prior to the uprooting tests.
3. Results
3.1. Non-Destructive Tests
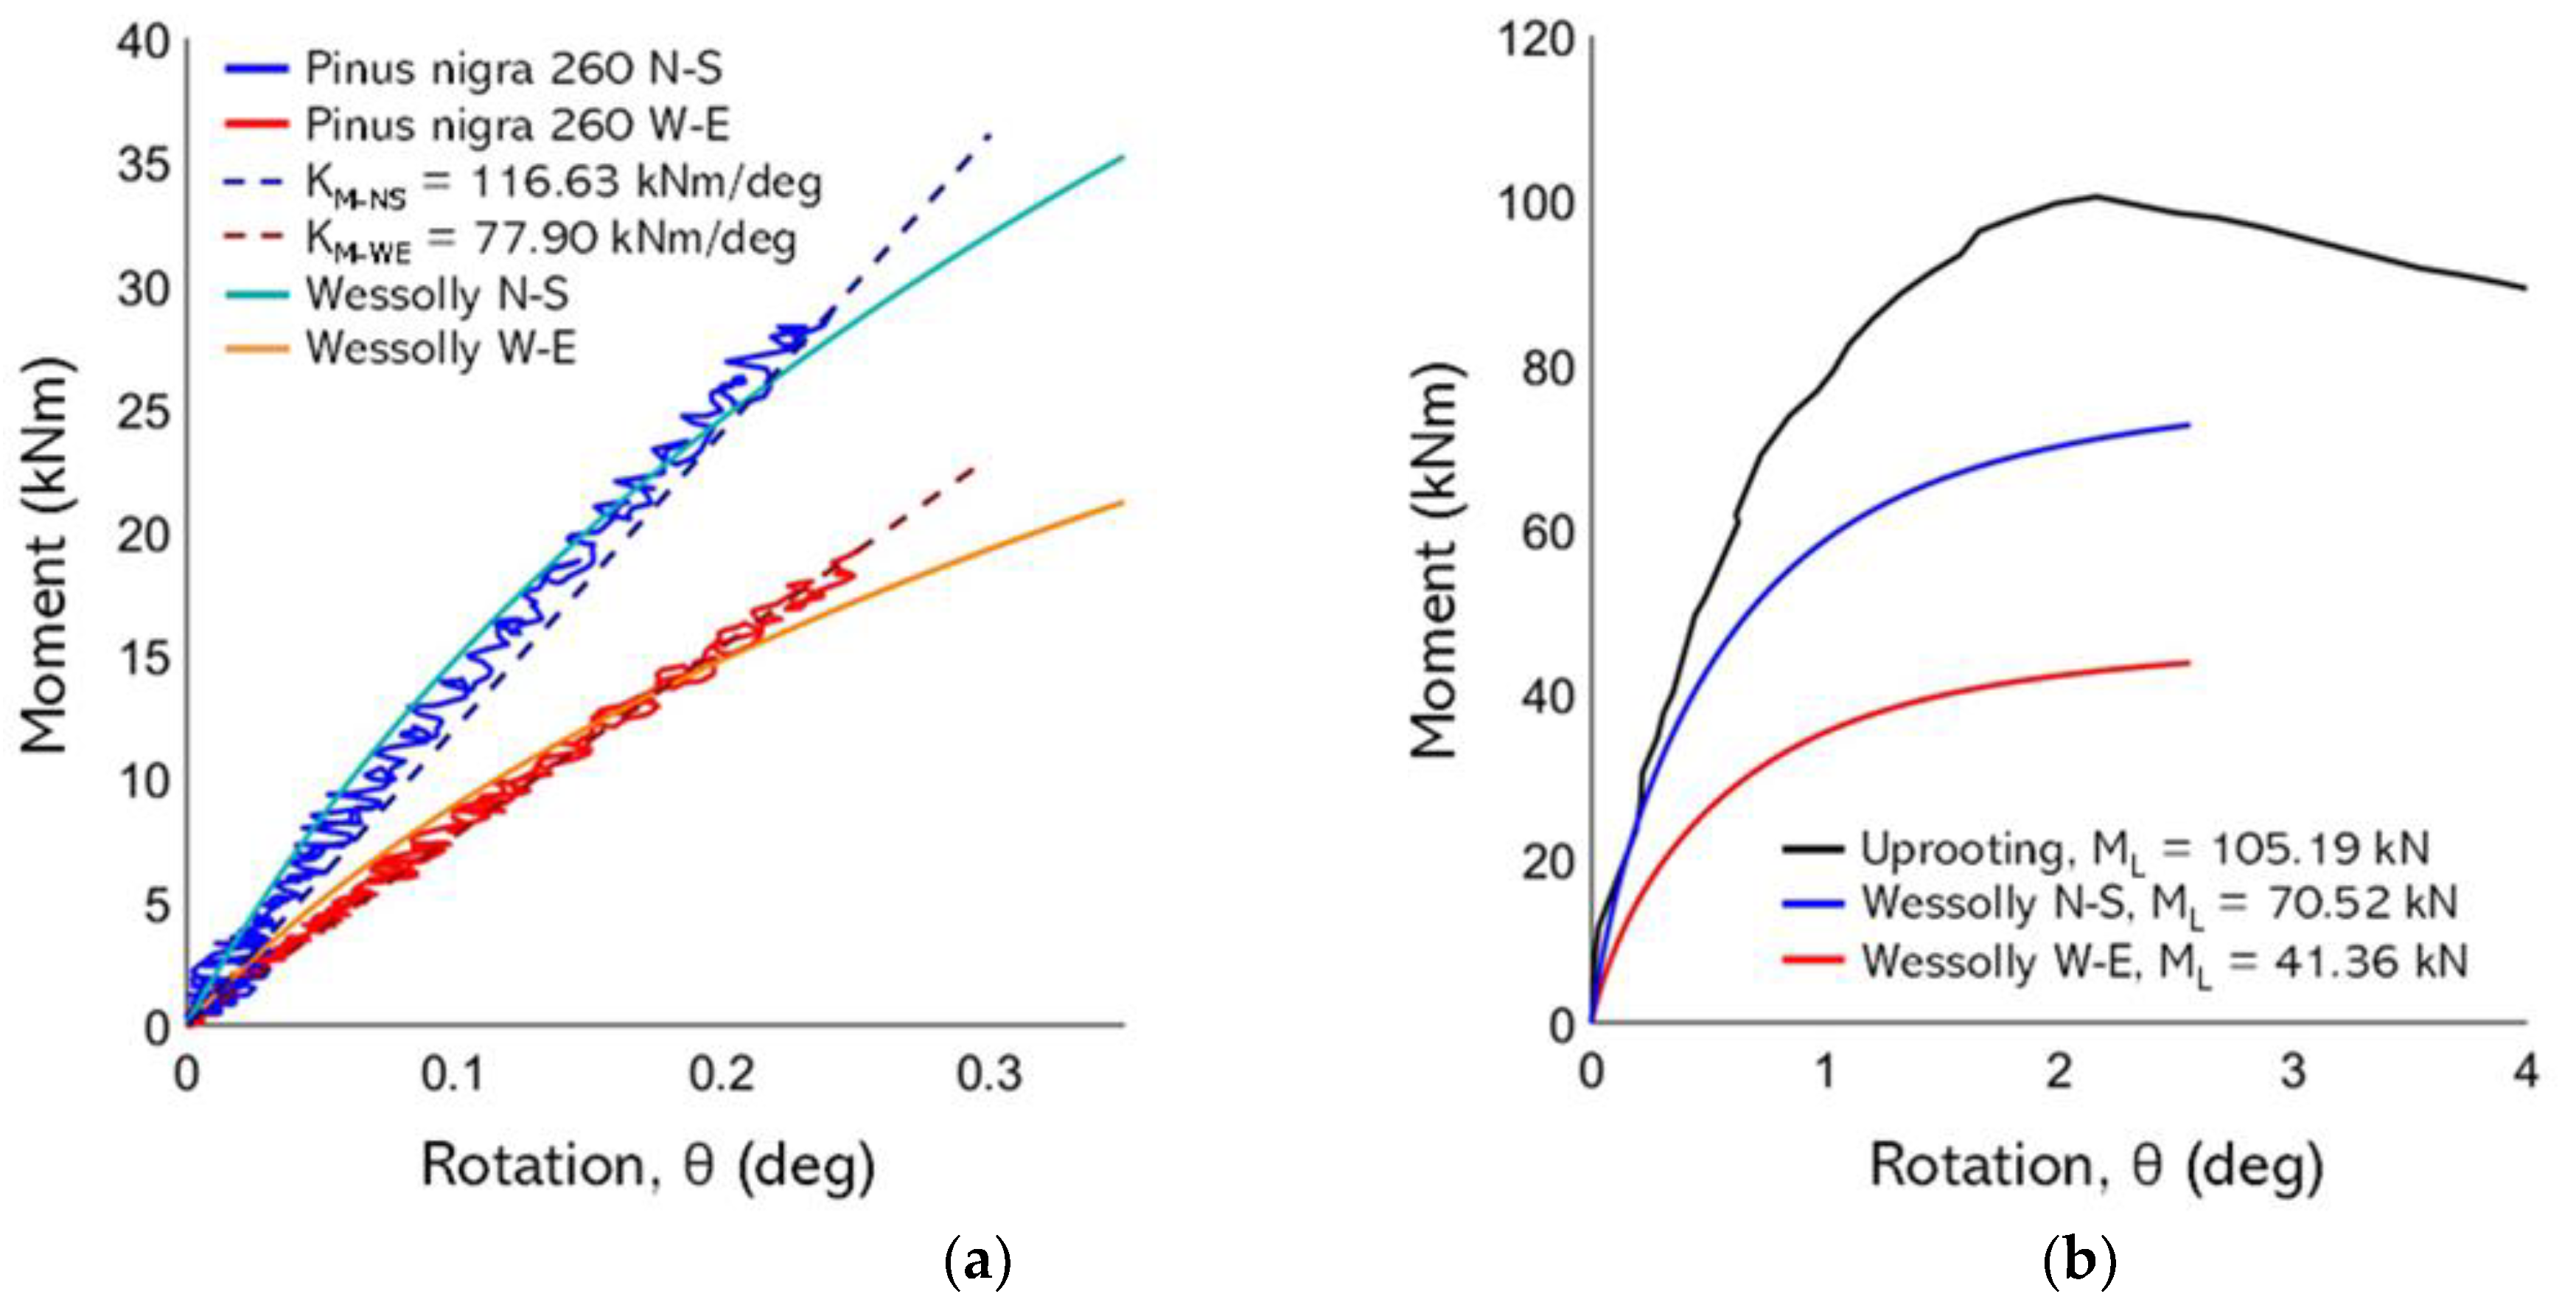
Non-destructive pulling test are conventionally used to estimate the maximum uprooting resistance of a tree by extrapolating the moment-rotation data up to 0.25° using the [7].
Figure 12.
(a) non-destructive test curves with Wessolly interpolation and stiffness; (b) Comparison of extrapolated Wessolly curves with uprooting test. 260 Pinus nigra.
Figure 12.
(a) non-destructive test curves with Wessolly interpolation and stiffness; (b) Comparison of extrapolated Wessolly curves with uprooting test. 260 Pinus nigra.
3.1. Uprooting Tests
Moment-rotation curves obtained from uprooting tests are shown in Figure 13. Table 3 summarises key data from the uprooting tests: h1, h2, α, and pull direction are as defined previously (see Figure 10) ML and θL (limit inclination) are measured from the test, and root plate measurements are also given as measured post-test. The results of the uprooting tests highlight that the peak rotations range between 1.59 and 2.93 degrees.
4. Discussion
4.1. Effect of Direction of Pull (in Plan)
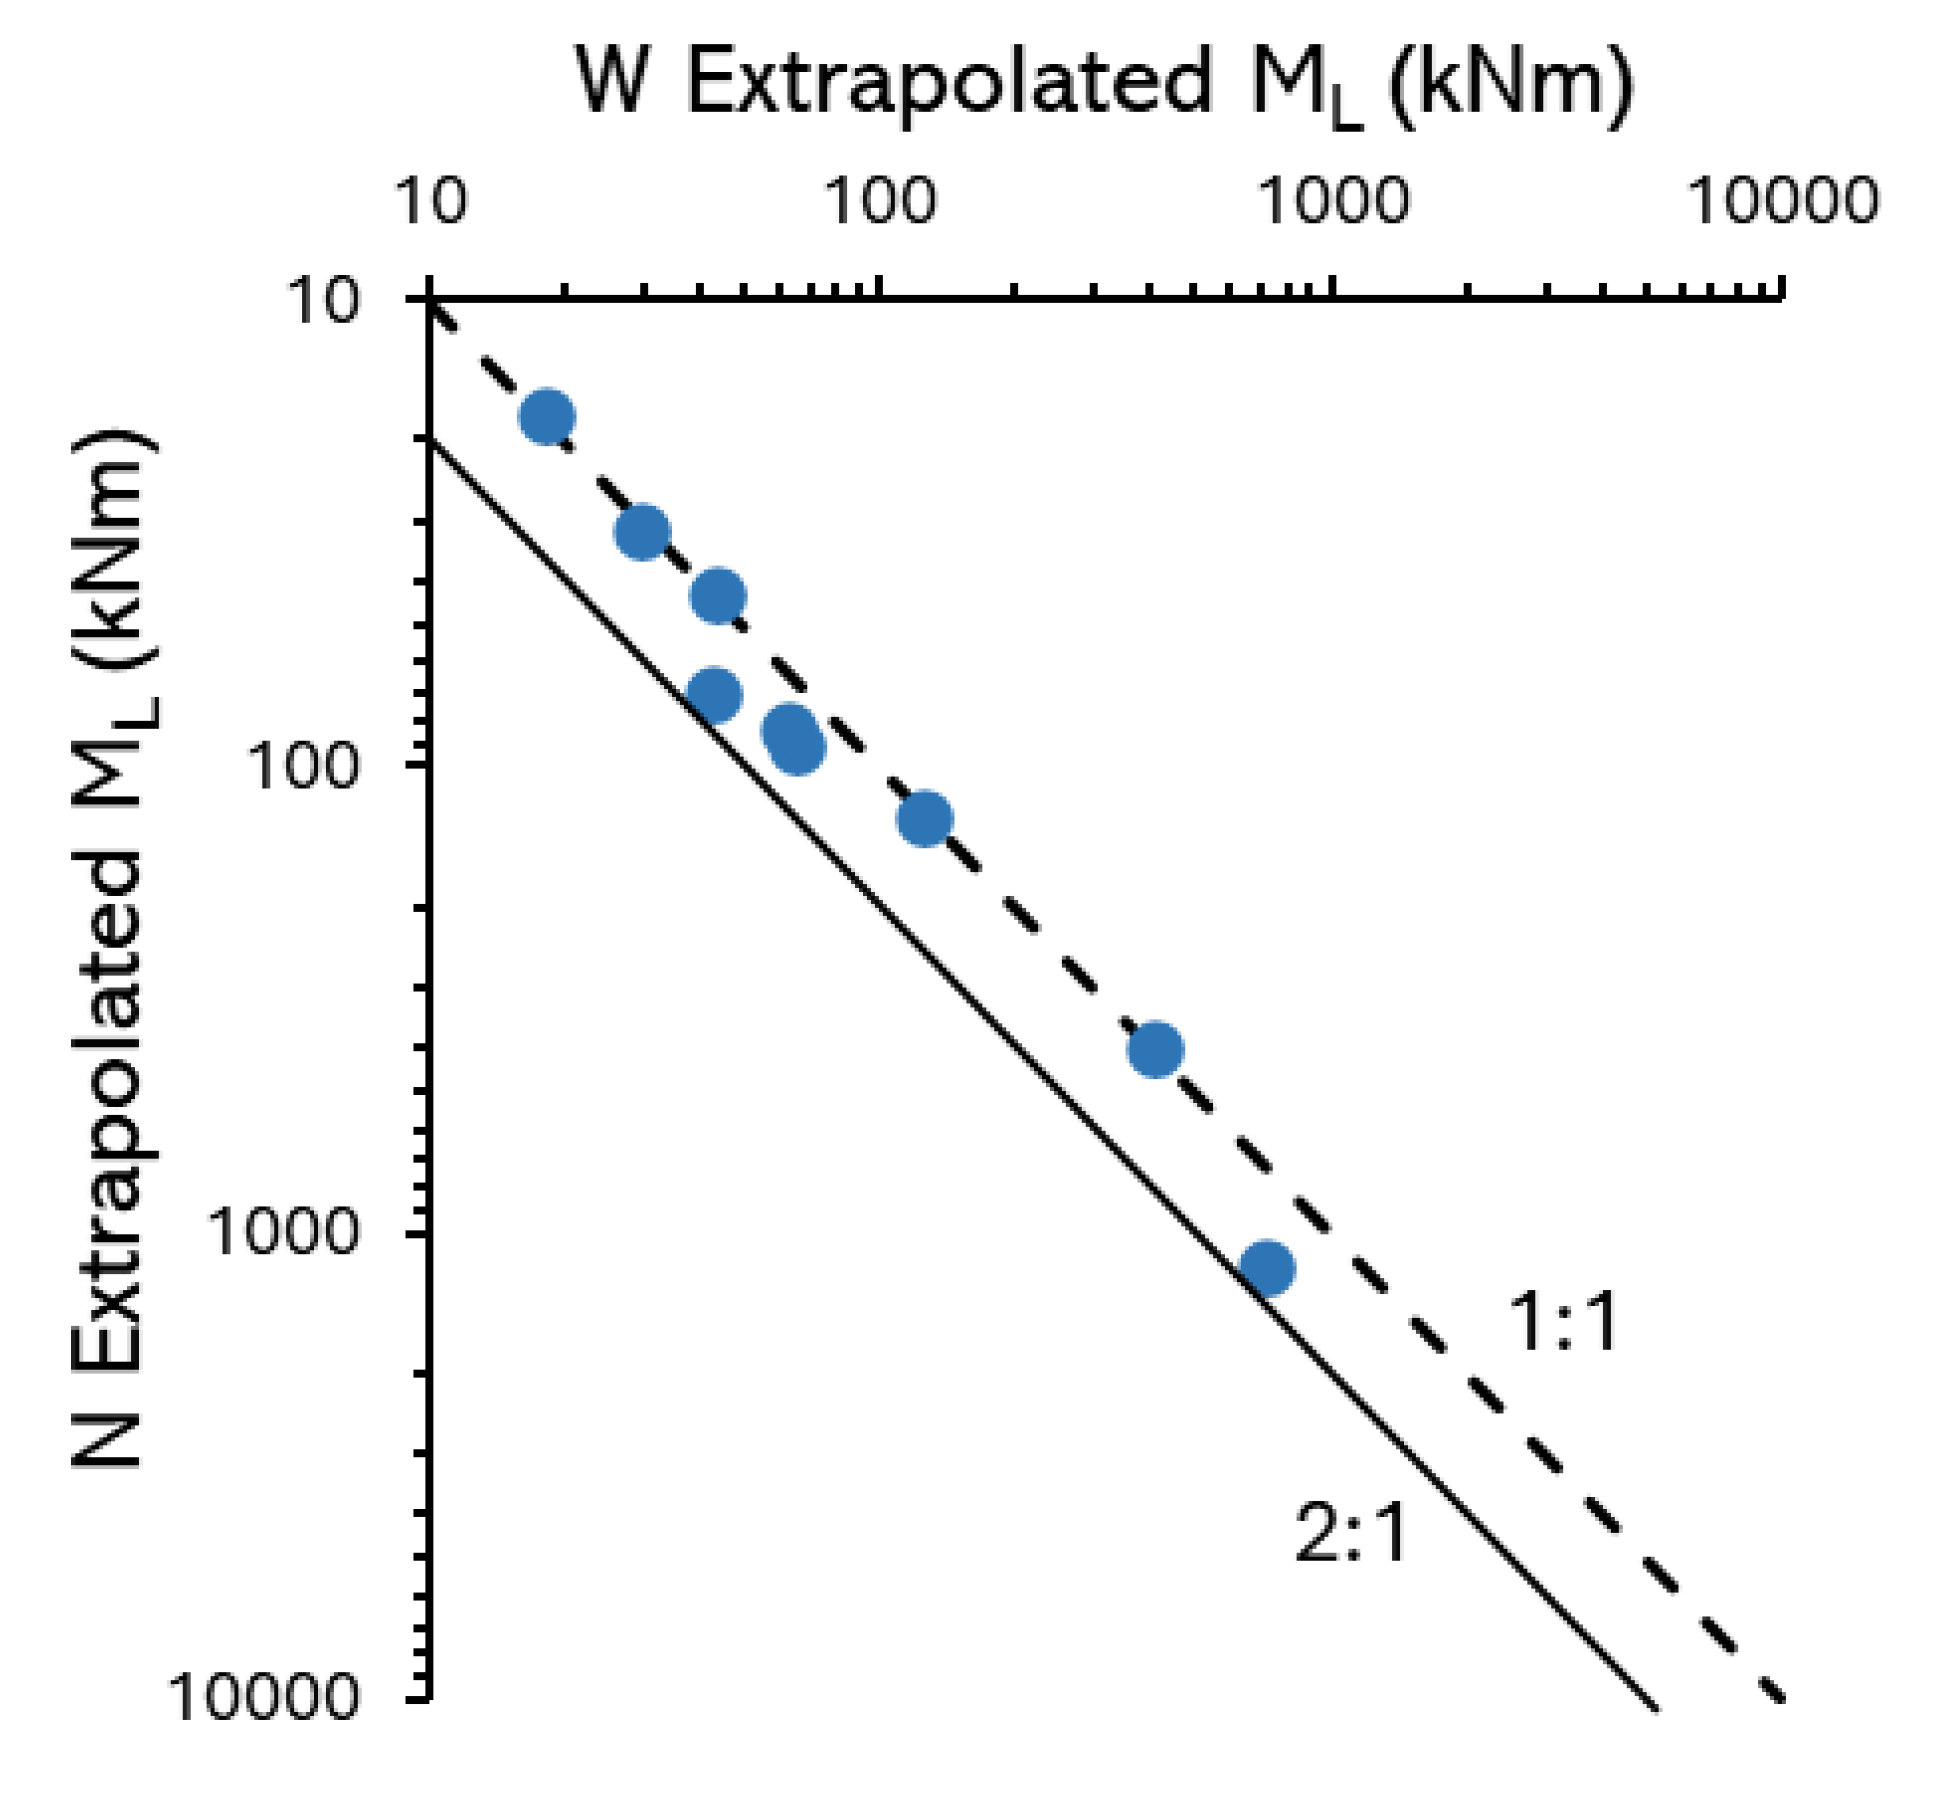
Regarding bias in overturning resistance in the predominant wind direction, Table 4 summarizes the data for the ten analysed trees along the West and North pulling directions and
Figure 14 shows the parity line (dashed), where the ratio between the extrapolated moments in the two directions is 1, and the solid line represents the threshold where the ratio between the moments extrapolated in the North and West directions is 2. Only three exhibited greater mechanical strength in the West (W) direction. In contrast, the remaining individuals were stronger in the North (N) direction, with differences reaching up to 66%. When considering the entire dataset, the root systems demonstrated an average increase in mechanical strength of 23% in the N direction, as inferred from the extrapolated maximum loading (ML) according to the Wessolly method. This directional asymmetry in anchorage capacity suggests a potential adaptive response to prevailing wind patterns, favoring enhanced stability along the dominant wind axis.
Figure 14.
Effect of loading direction on extrapolated limit moment.
4.2. Effect of Height of Pull (Angle of Pull in Elevation)
Table 5 summarizes the results from the non-destructive tests, first conducted at different pulling heights and then after uprooting (Deq is the average of dimensions D1 and D2 of the root-plate geometry; Figure 10). Moment capacity based on extrapolated values appears to be insensitive to even very large changes in the pulling angle as shown in Figure 15. Using a VHM yield surface approach [14]:
4.3. Suitability of Extrapolation Method for Non-Destructive Tests
In the destructive tests, peak bending moments were observed between 1.6 and 2.9° of rotation, which aligns reasonably well with the predictions of the Wessolly and Erb model (Eq.1). For 9 out of 15 trees, the percentage difference between the observed and estimated moment is within 20% (6 below 10% and 3 between 10–20%). For the remaining six trees, the percentage difference ranges from 35% up to a maximum of 107% (in the case of Pinus nigra 270). Only for 4 out of 15 trees was the predicted overturning moment capacity overestimated compared to the measured value with a maximum percentage difference of 4%. An alternative stiffness-based approach to determining capacity from non-destructive test data is based on the fact that for rotations from 0 to 0.25 degrees, the response falls within the elastic range, and therefore the moment–rotation curve can be approximated by a straight line. According to the Wessolly and Erb model, a rotation of 0.25° corresponds to 40% of the maximum moment, and thus the law is as follows:
It is noteworthy that for 11 out of 15 trees, the maximum overturning moment underestimated by either Eq.1 or Eq.6 represents an inherent safety factor. This finding supports the general applicability of both the moment-based and stiffness-based approaches for estimating tree anchorage capacity (Figure 16a), at least for the soil and groundwater conditions considered herein. The variability of the value of rotation when peak moment is reached can, in part, be explained by local soil conditions; for instance, Zhang et al. (2023) demonstrated that soil saturation levels significantly influence rotational behavior during winching tests, a parameter that is typically not recorded during field assessments. Water content and suction data for the different zones considered at the Botanic Gardens that is shown in the Appendix demonstrates local variation in groundwater conditions between zones. Alternative prediction approaches which do not utilize non-destructive test data, such as the root plate model proposed by [27], captures the general trend observed in the [26] dataset, albeit with considerable scatter (Figure 16b), However, when applied to the Botanical Garden dataset, the fit appears less satisfactory, especially when using the formulation where resistance is proportional to the square of the equivalent root plate diameter (Deq²). This discrepancy suggests that factors beyond root plate weight may be influencing anchorage capacity. In particular, it is plausible that structural roots extending beyond the conventional root plate contribute additional resistance, which is not adequately accounted for in simplified geometric models. It also demonstrates that there is additional value in conducting non-destructive tests to obtain improved predictions of capacity and therefore better estimates of risk.
5. Conclusions
In this work, static pulling tests were conducted to study the stability of mature trees. Specifically, non-destructive tests were performed, varying both the pulling directions and angles, as well as uprooting tests. Soil characteristics, such as shear strength, moisture content, suction, and particle size distribution, were analyzed to evaluate their influence on root anchorage. The tests were conducted on twenty-one trees from the Botanic Garden of Dundee University, belonging to eight different species (Pinus nigra, Picea abies, Tsuga, Betula, Quercus, Acer platanoides, Nothofagus, Eucalyptus). Fifteen out of the 21 trees were uprooted to determine the maximum overturning moment and compare it with the values estimated using the cited methods. The data collected and analyzed indicate that:
- As depth increases, the shear strength of the soil decreases. This is not due to an increased level of saturation, as the water content also decreases in depth (the soil is under-drained by the sandstone). The most plausible explanation is that the soil layer containing the root system.
- Regarding bias in overturning resistance in the predominant wind direction, among 10 trees tested along the North (main wind direction) and West directions, for 7 of them the predicted overturning moment was higher in the North direction compared to the West.
- Regarding the insensitivity of moment capacity to pull angle, the moment capacity appears unaffected by substantial changes in the pulling angle.
- Regarding the evaluation of existing methods for predicting overturning moment, only 4 out of 15 trees had their predicted overturning moment overestimated compared to the experimental values. For the remaining 11 trees, the maximum overturning moment underestimated by both models provides a safety margin. These results support the general applicability of both the moment-based and stiffness-based approaches for estimating tree anchorage capacity.
- Attempting to fit the data using the root-plate model, which assumes that the ultimate overturning resistance is proportional to the square of the root-plate diameter, did not yield satisfactory results. In contrast, a reasonable fit was obtained using the circular foundation root-plate model, where the stiffness is assumed to be proportional to the cube of the root-plate diameter.
- In conclusion, there is no correlation between the maximum overturning moment for uprooting and trees of the same species with similar biometric parameters. This suggests that overturning stability depends much more on the site-specific conditions of each individual tree.
Author Contributions
Conceptualization, MOC; methodology, MA, GM, AM, DB, MOC and JAK.; software, MOC, AM and MA.; validation, MA and GM; formal analysis, MA, MOC and JAK; investigation, MA, GM and AM; resources, MOC, RPC, DB; data curation, GM and MOC; writing—original draft preparation, MA, MOC and JAK; writing—review and editing, MA, GM, DB, MOC and JAK; visualization, MA, MOC and JAK.; supervision, MOC, RPC. All authors have read and agreed to the published version of the manuscript.
Funding
Scottish Research Partnership in Engineering (SRPe), SRPe-IDP/011 research grant Rural & Environment Science & Analytical Services Division of the Scottish Government (RESAS 22-27: “Achieving Multi-Purpose Nature-Based Solutions (JHI-D2-2)”, “Healthy Soils for a Green Recovery (JHI-D3-1)”; National Recovery and Resilience Plan (NRRP), Mission 4 Component 2 Investment 1.4 - Call for tender No. 3138 of 16 December 2021, rectified by Decree n.3175 of 18 December 2021 of Italian Ministry of University and Research funded by the European Union - NextGenerationEU, Project code CN_00000033, Concession Decree No. 1034 of 17 June 2022 adopted by the Italian Ministry of University and Research, CUP H43C22000530001, "National Biodiversity Future Center - NBFC".
Data Availability Statement
The original contributions presented in this study are included in the article. Further inquiries can be directed at the corresponding author.
Acknowledgments
The authors gratefully acknowledge Mr Kevin Frediani, former University of Dundee botanic Garden Curator, for all the support provided during the field-testing campaign. Brett done of Brett Bain Tree Services and Ian Barnes of Tree Diagnostics are also acknowledged for their service in the field testing.
Conflicts of Interest
The authors declare no conflicts of interest.
Abbreviations
The following abbreviations are used in this manuscript:
| KM | Stiffness |
| ML | Limit Moment |
| MLW | Limit Moment along west direction |
| MLN | Limit Moment along north direction |
| VTA | Visual Tree Assessment |
| θL | Limit rotation angle |
| Pn | Pinus nigra |
| Pa | Picea abies |
| Ts | Tsuga |
| Be | Betula |
| Qu | Quercus |
| Ap | Acer platanoides |
| Nt | Nothofagus |
| Eu | Eucalyptus |
| Cs | Corkscrew |
| VST | Vane Shear Test |
| PSD | Particle Size Distribution |
| SWRC | Soil Water Retention Curve |
| DBH | Diameter Breast Height |
| h1 | Winch height |
| h2 | Height between base of pulled tree and cable on constraining tree |
| R2 | Radius of root-plate visible after uprooting |
| D2 | Diameter of root-plate along uprooting direction |
| D1 | Diameter of root-plate along transverse of uprooting direction |
| Trp | Thickness of root-plate along uprooting direction |
| Hrp | Thickness of root-plate part inside soil after uprooting |
| α | Pulling angle inclination |
| ML-EXP | Experimental Limit Moment during uprooting |
| θL-EXP | Experimental Limit Rotation during uprooting |
| DEQ | Equivalent root-plate diameter |
| D | Diameter |
| G | Shear Modulus |
| ν | Poisson’s number |
Appendix A
Figure A1.
Example Soil Water Retention Curve for Botanic Garden topsoil (rich vegetated soil, zone 1, Figure 3). Dashed lines indicate upper and lower limits.
Figure A1.
Example Soil Water Retention Curve for Botanic Garden topsoil (rich vegetated soil, zone 1, Figure 3). Dashed lines indicate upper and lower limits.
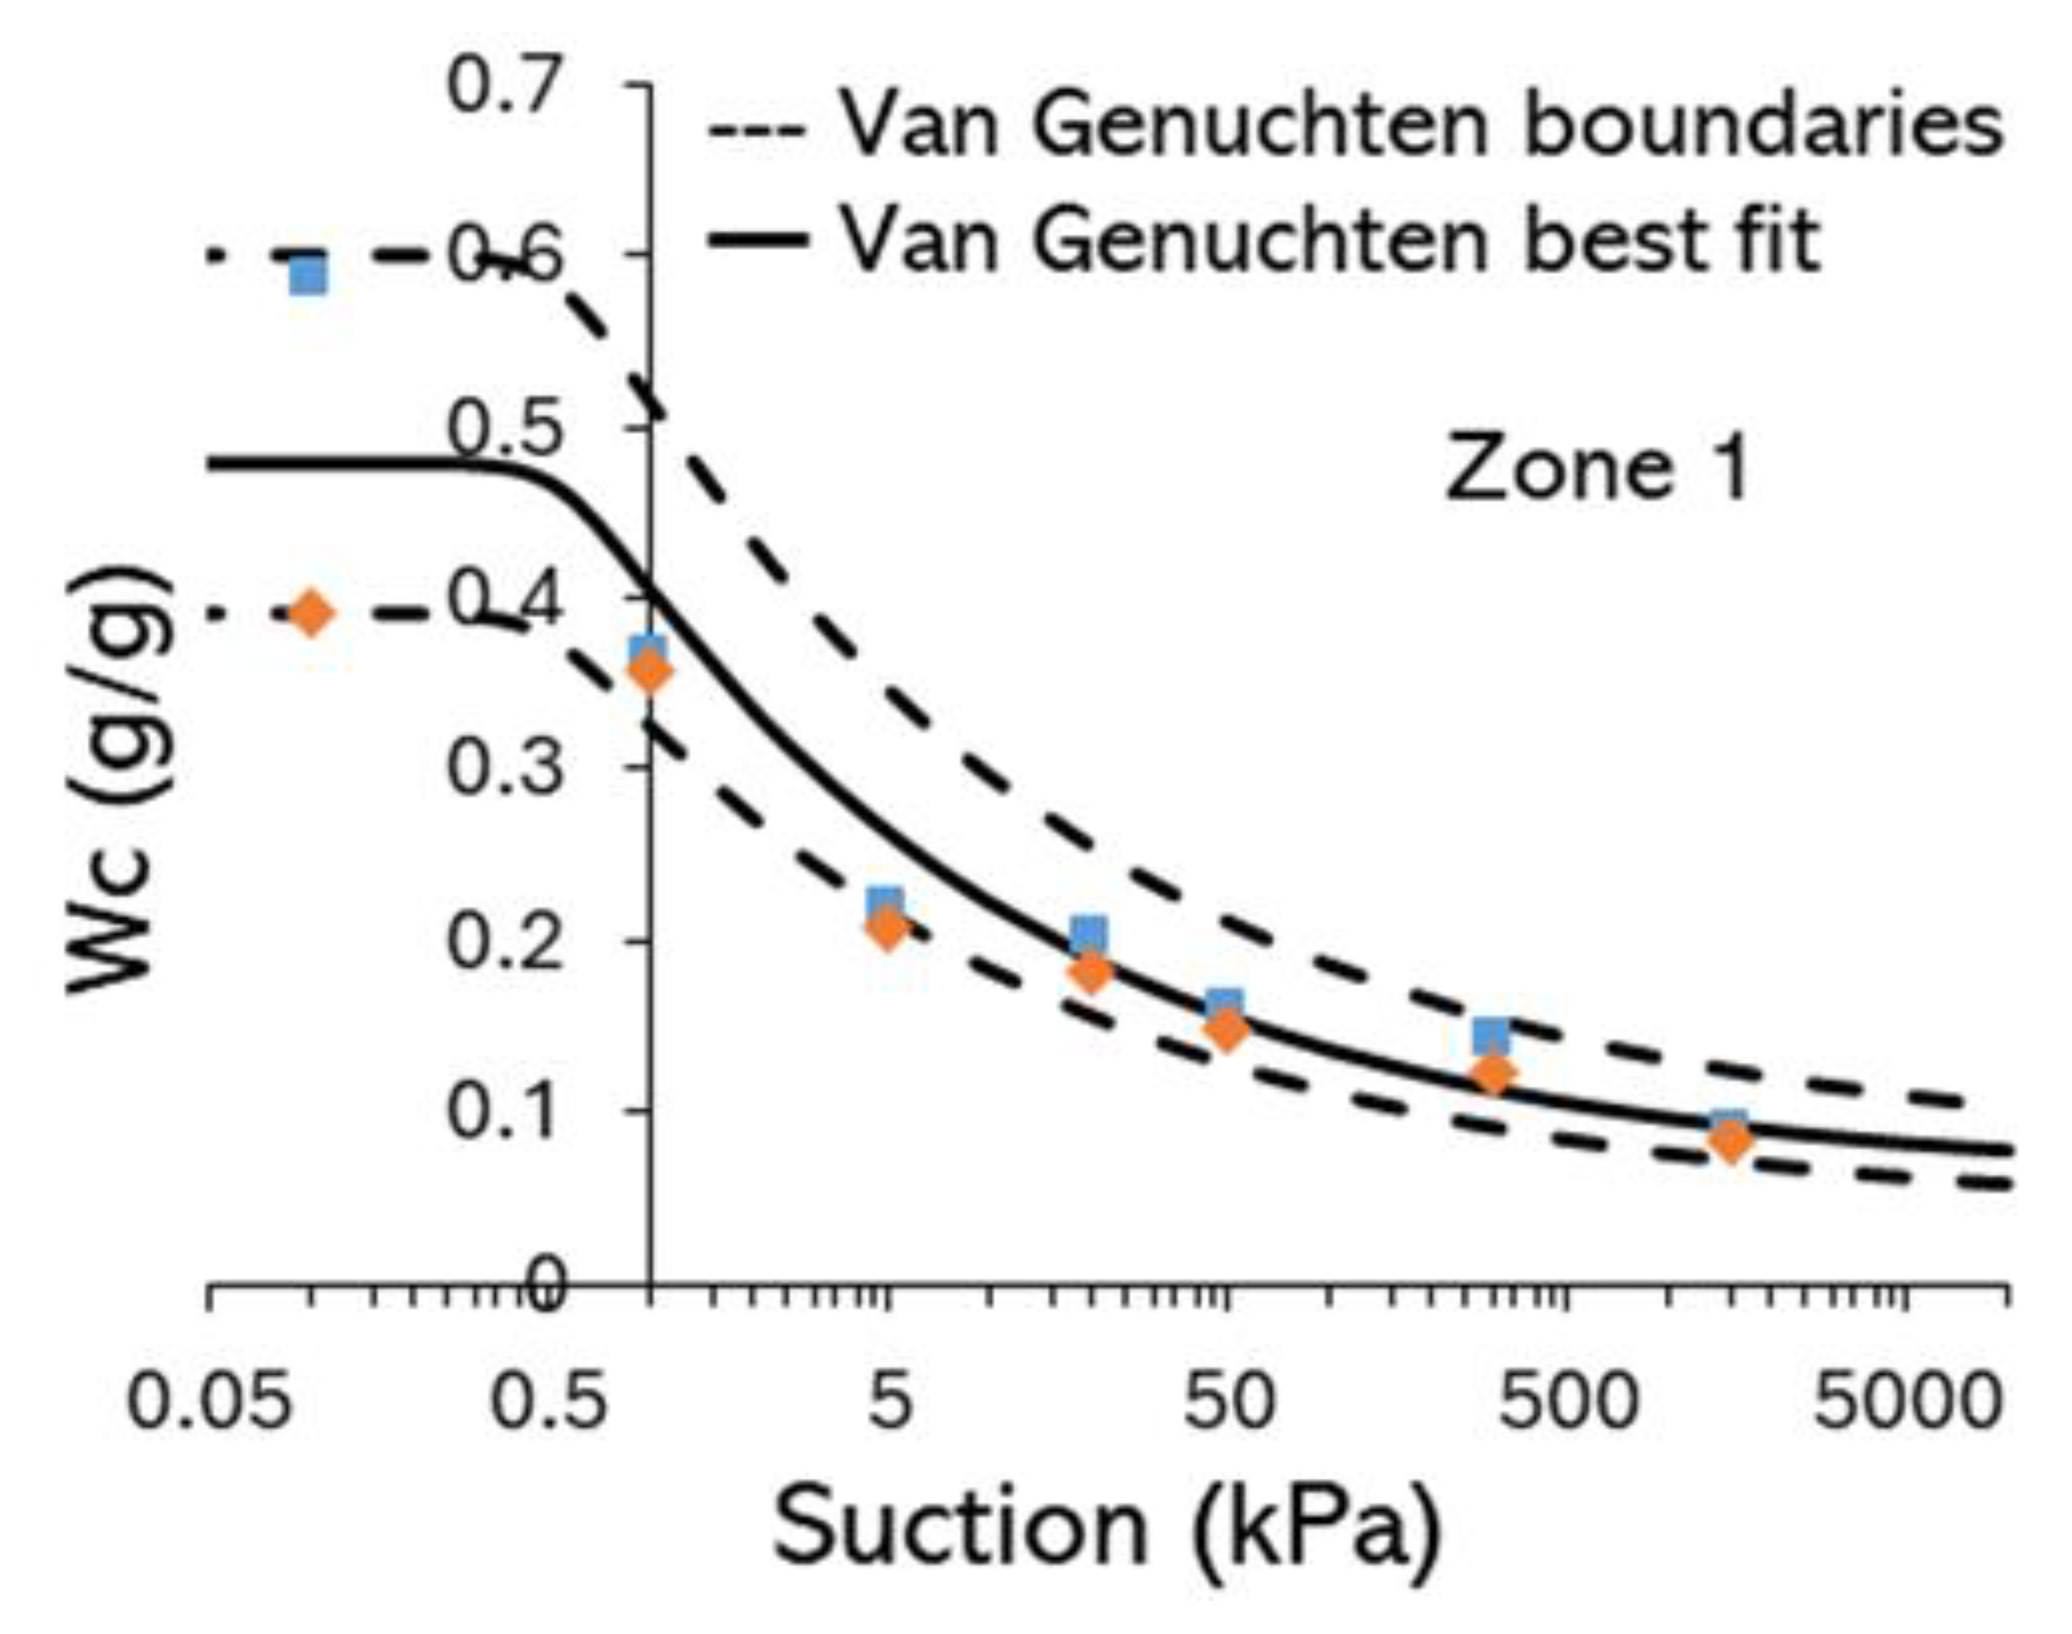
Figure A2.
Example Soil Water Retention Curve for Botanic Garden topsoil (rich vegetated soil, zone 2, Figure 3). Dashed lines indicate upper and lower limits.
Figure A2.
Example Soil Water Retention Curve for Botanic Garden topsoil (rich vegetated soil, zone 2, Figure 3). Dashed lines indicate upper and lower limits.
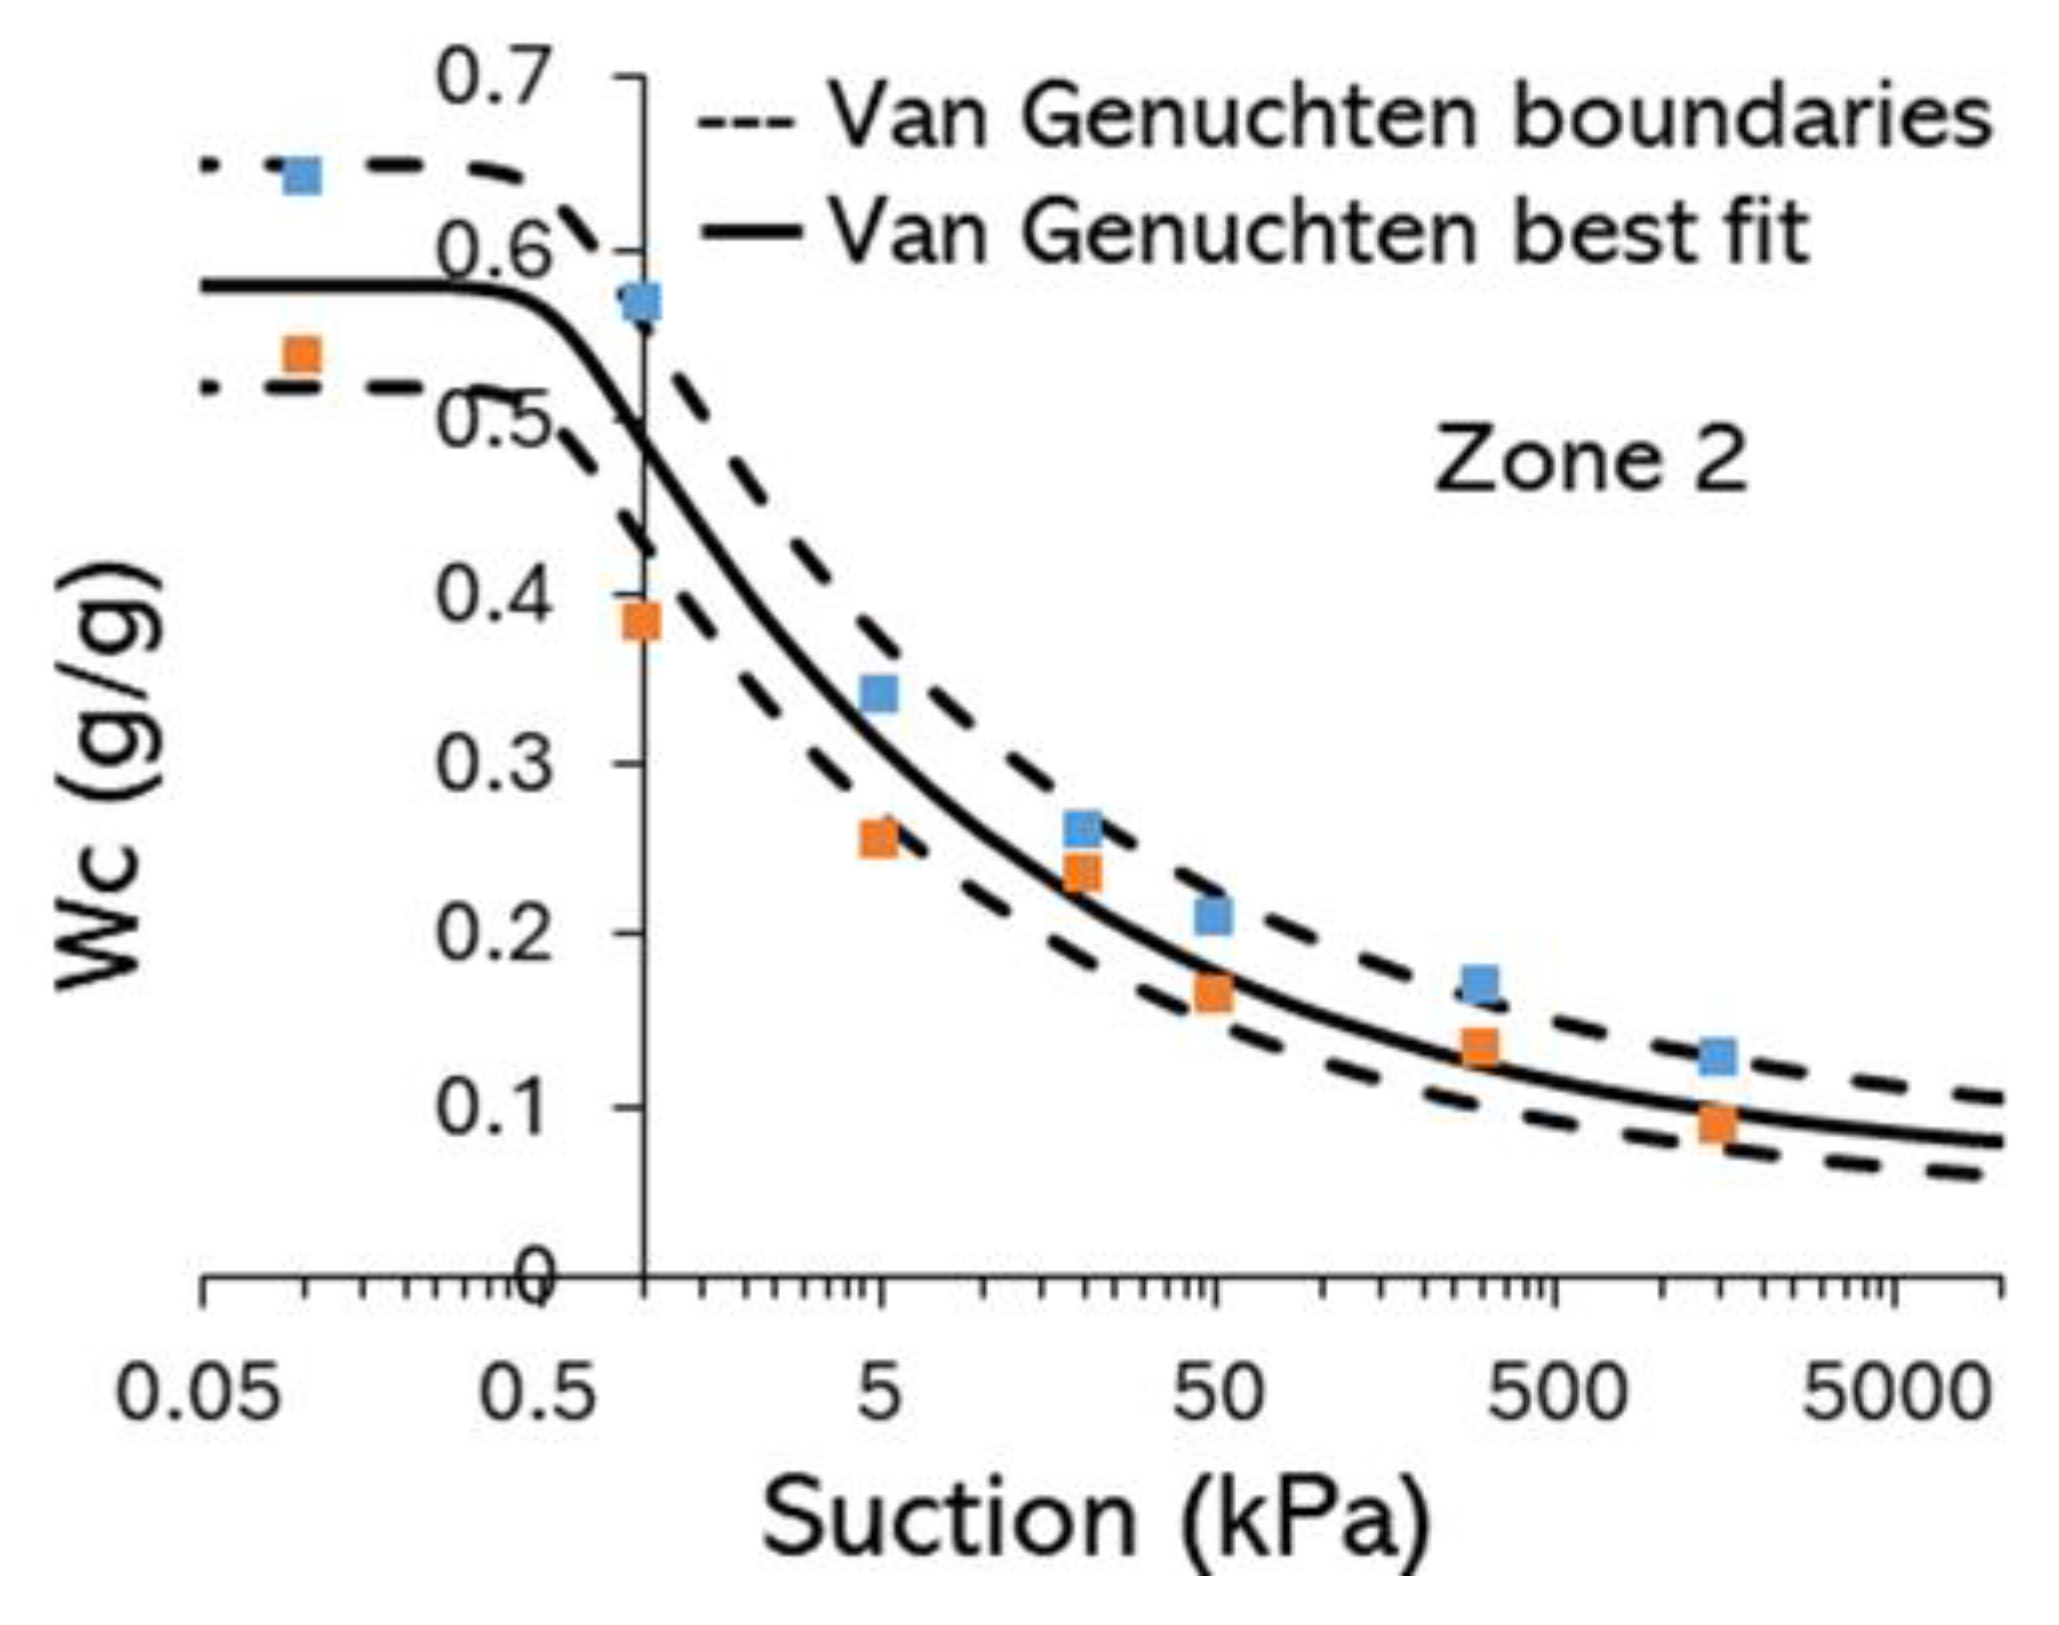
Figure A3.
Example Soil Water Retention Curve for Botanic Garden topsoil (rich vegetated soil, zone 4, Figure 3). Dashed lines indicate upper and lower limits.
Figure A3.
Example Soil Water Retention Curve for Botanic Garden topsoil (rich vegetated soil, zone 4, Figure 3). Dashed lines indicate upper and lower limits.
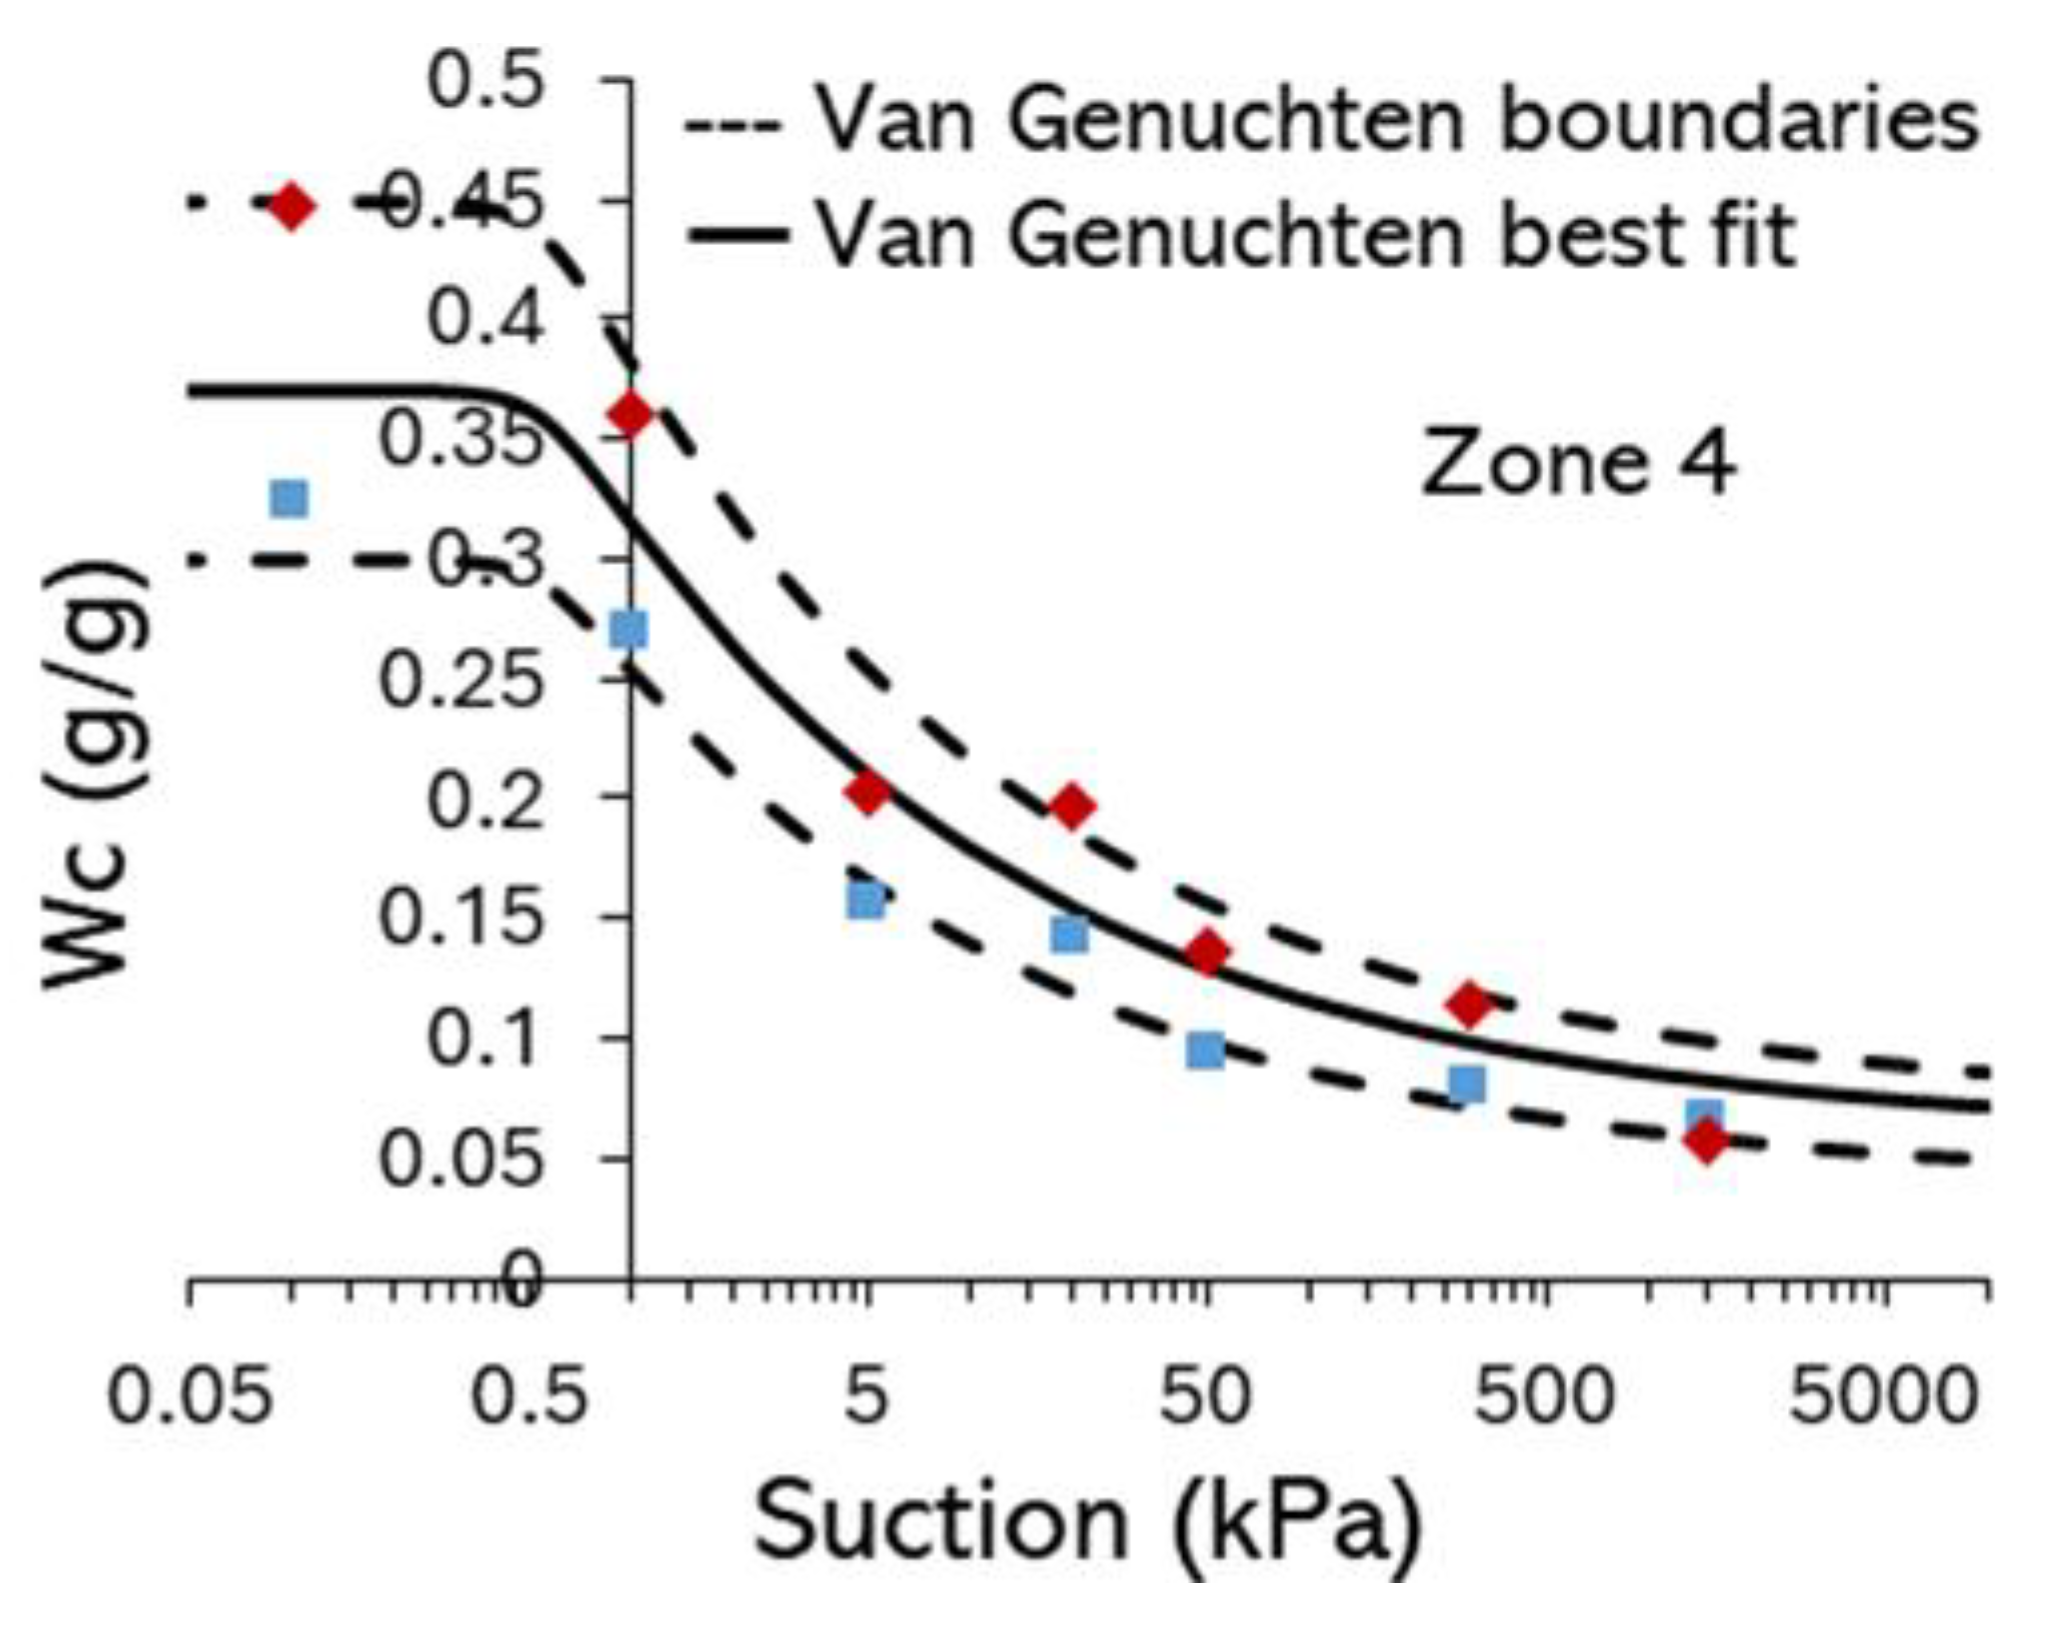
Figure A4.
Example Soil Water Retention Curve for Botanic Garden topsoil (rich vegetated soil, zone 5, Figure 3). Dashed lines indicate upper and lower limits.
Figure A4.
Example Soil Water Retention Curve for Botanic Garden topsoil (rich vegetated soil, zone 5, Figure 3). Dashed lines indicate upper and lower limits.
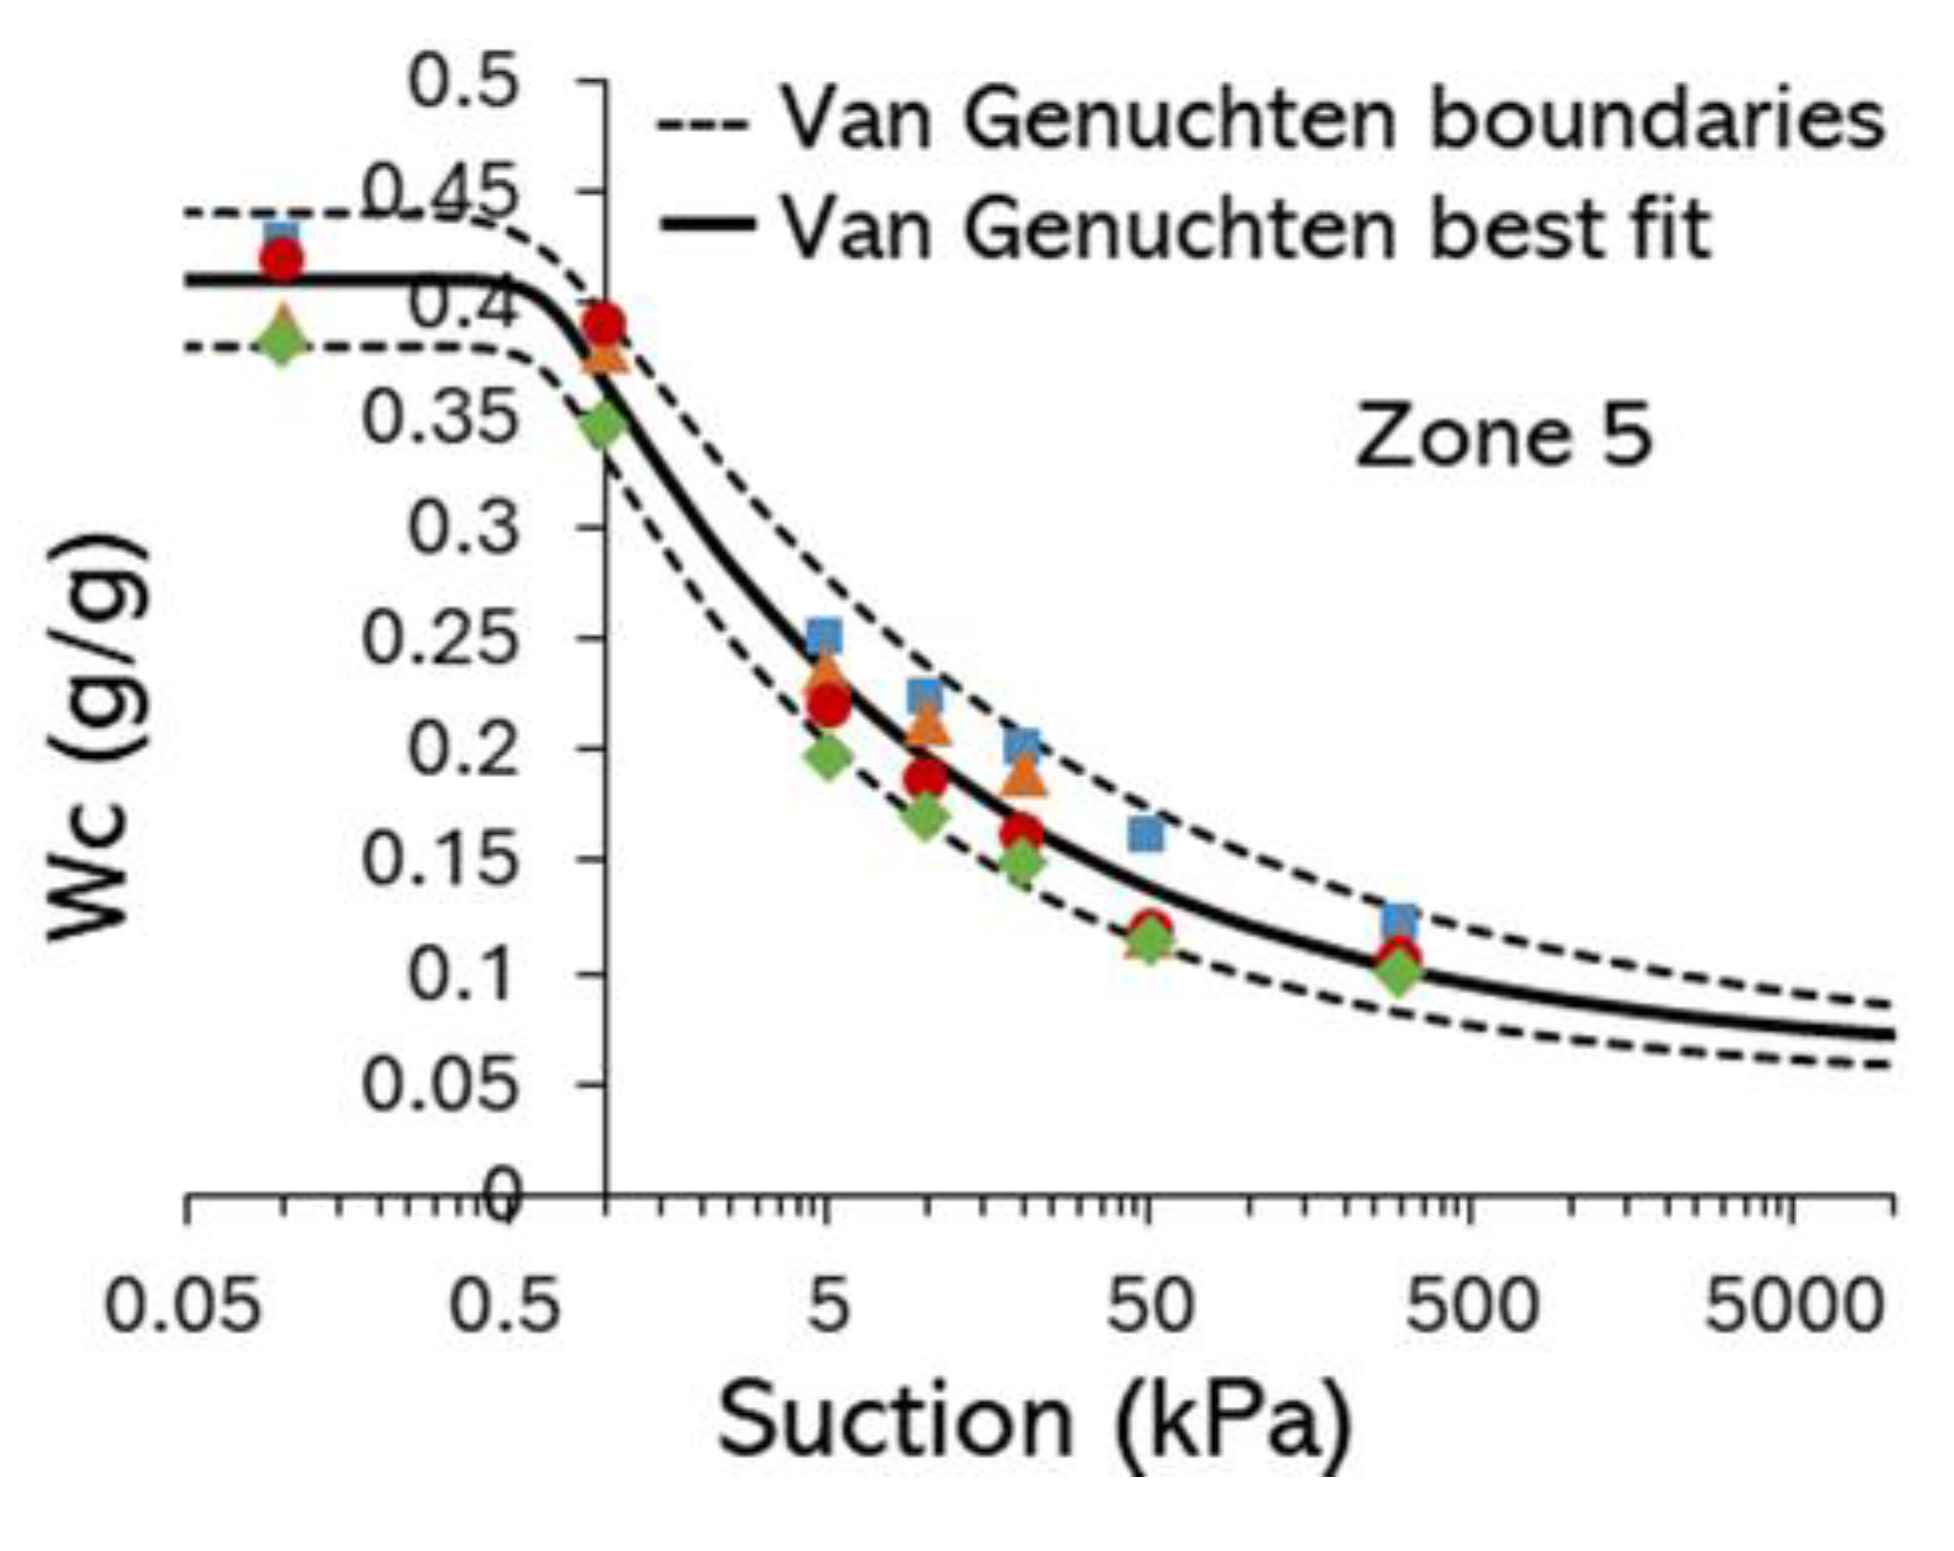
Figure A5.
Example Soil Water Retention Curve for Botanic Garden topsoil (rich vegetated soil, zone 6, Figure 3). Dashed lines indicate upper and lower limits.
Figure A5.
Example Soil Water Retention Curve for Botanic Garden topsoil (rich vegetated soil, zone 6, Figure 3). Dashed lines indicate upper and lower limits.
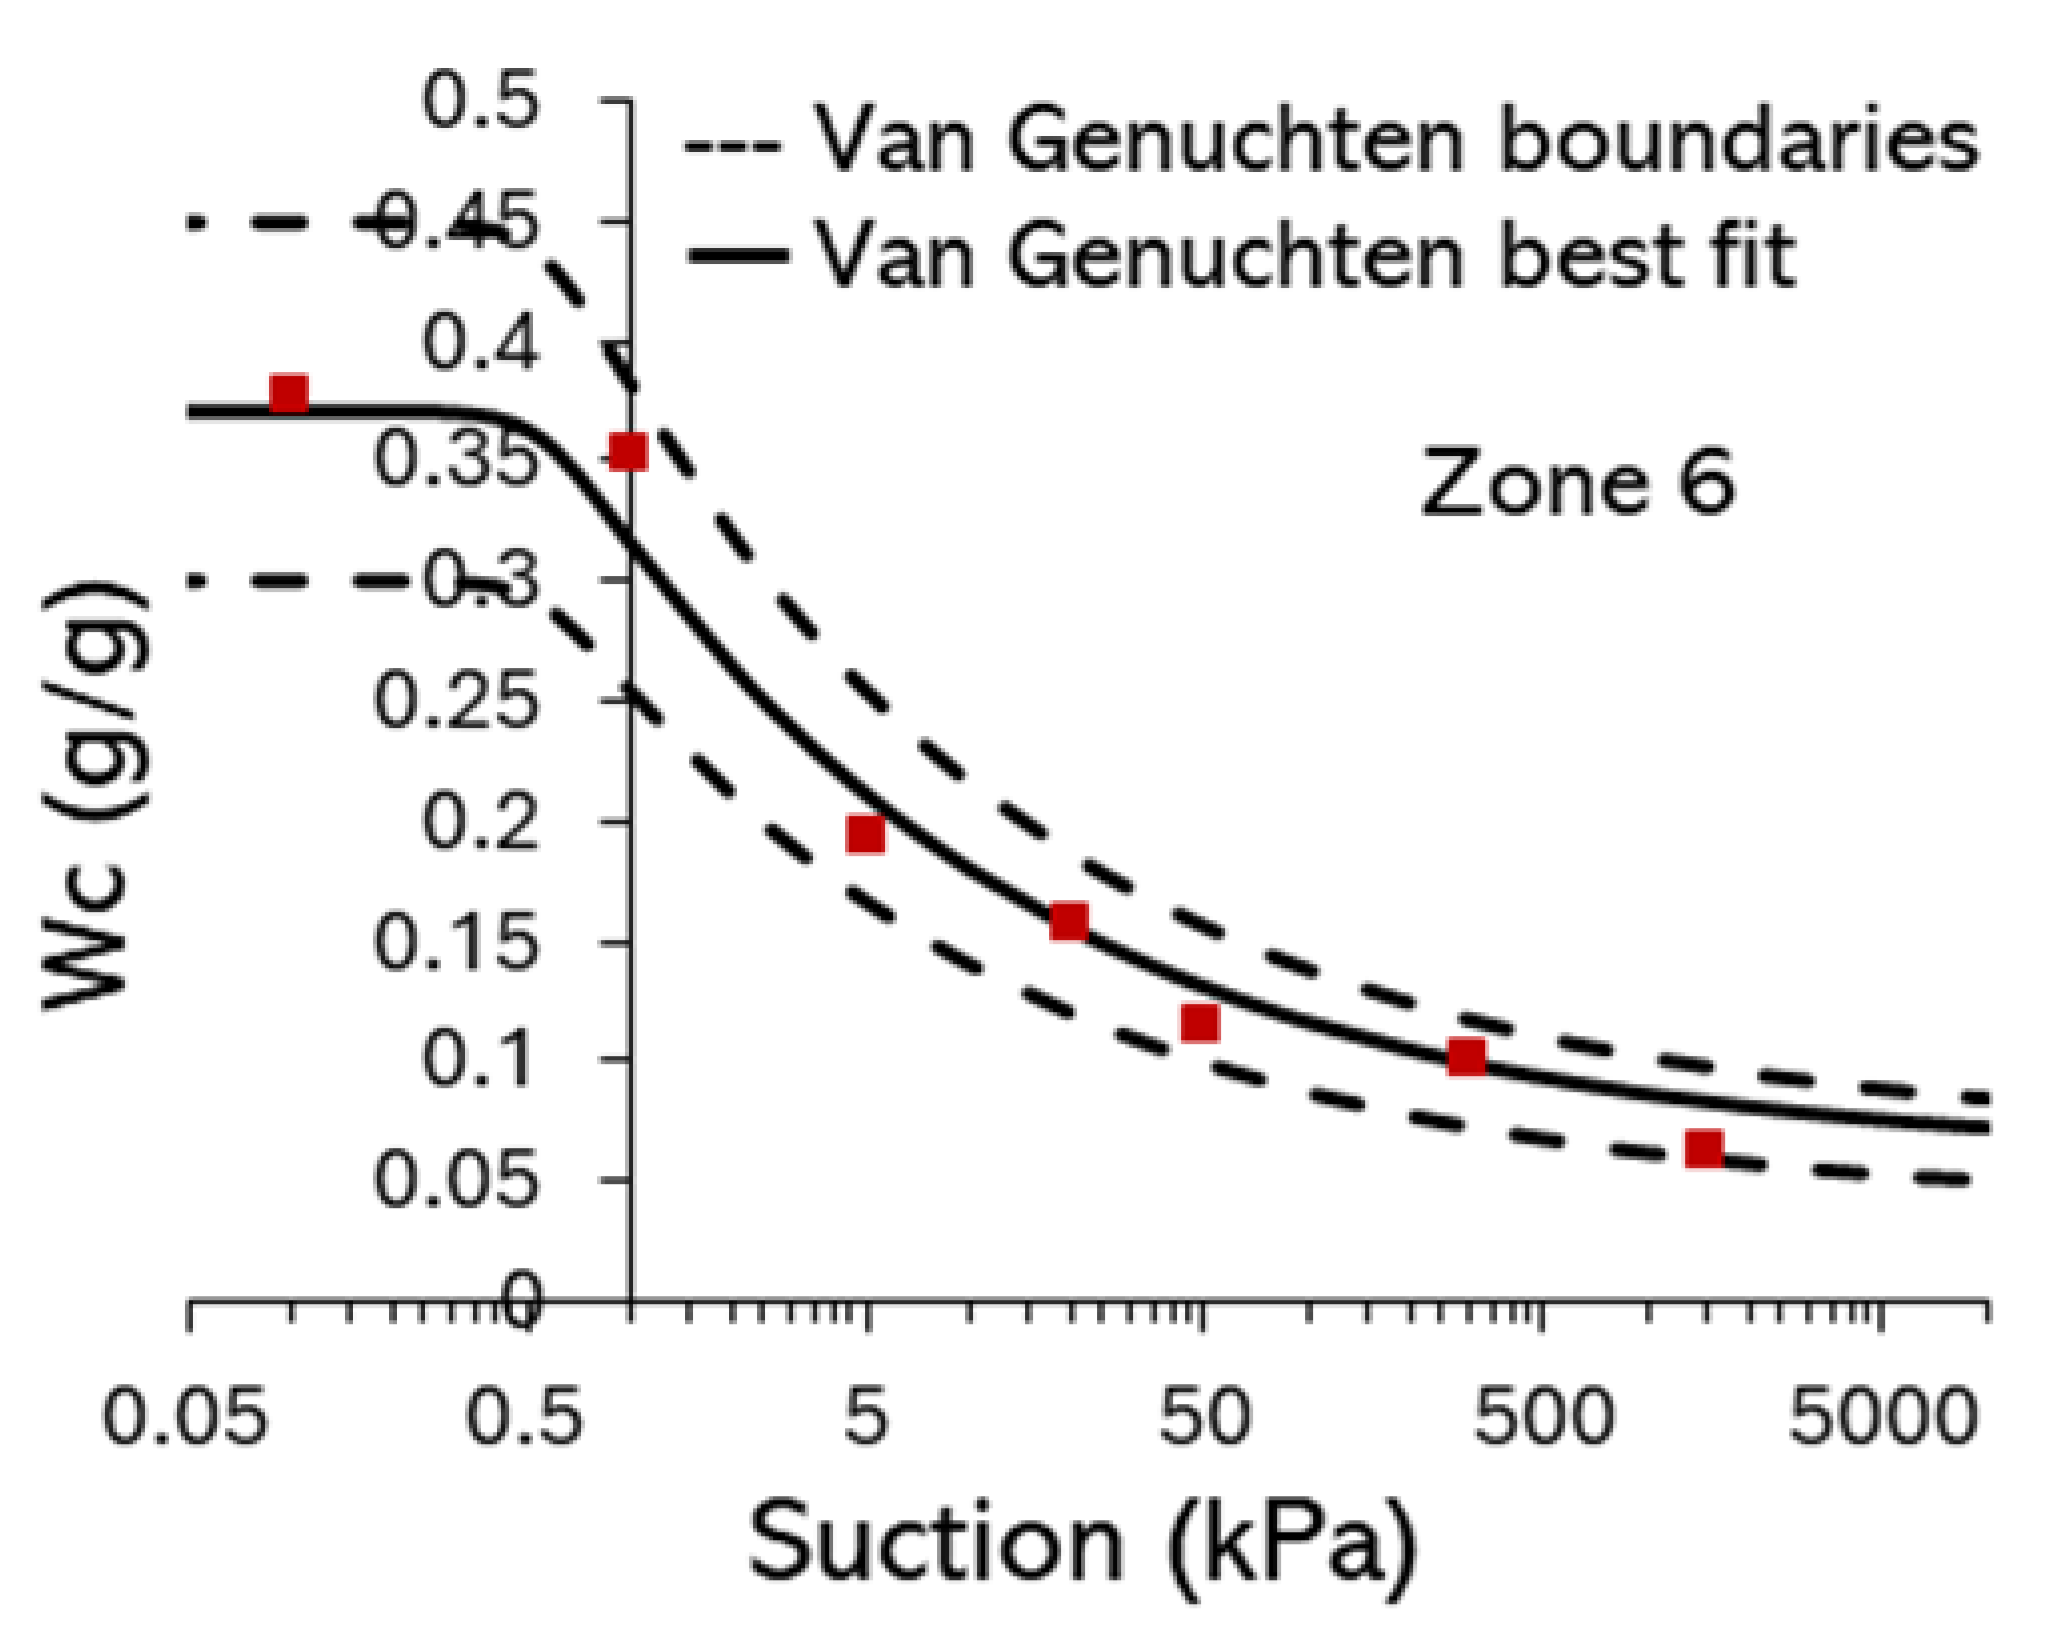
Figure A6.
Comparative summary of soil state and strength data (433 – Acer platanoides): (a) Shear strength from corkscrew (CS), vane shear tests (VST) and DSA; (b) Depth distribution of soil water content and suction inferred from Zone 3 SWRC; (c) Soil profile. Test data from different locations relative to the trunk, where N, E, S and W are cardinal directions, RP =root-plate and H = soil under root-plate.
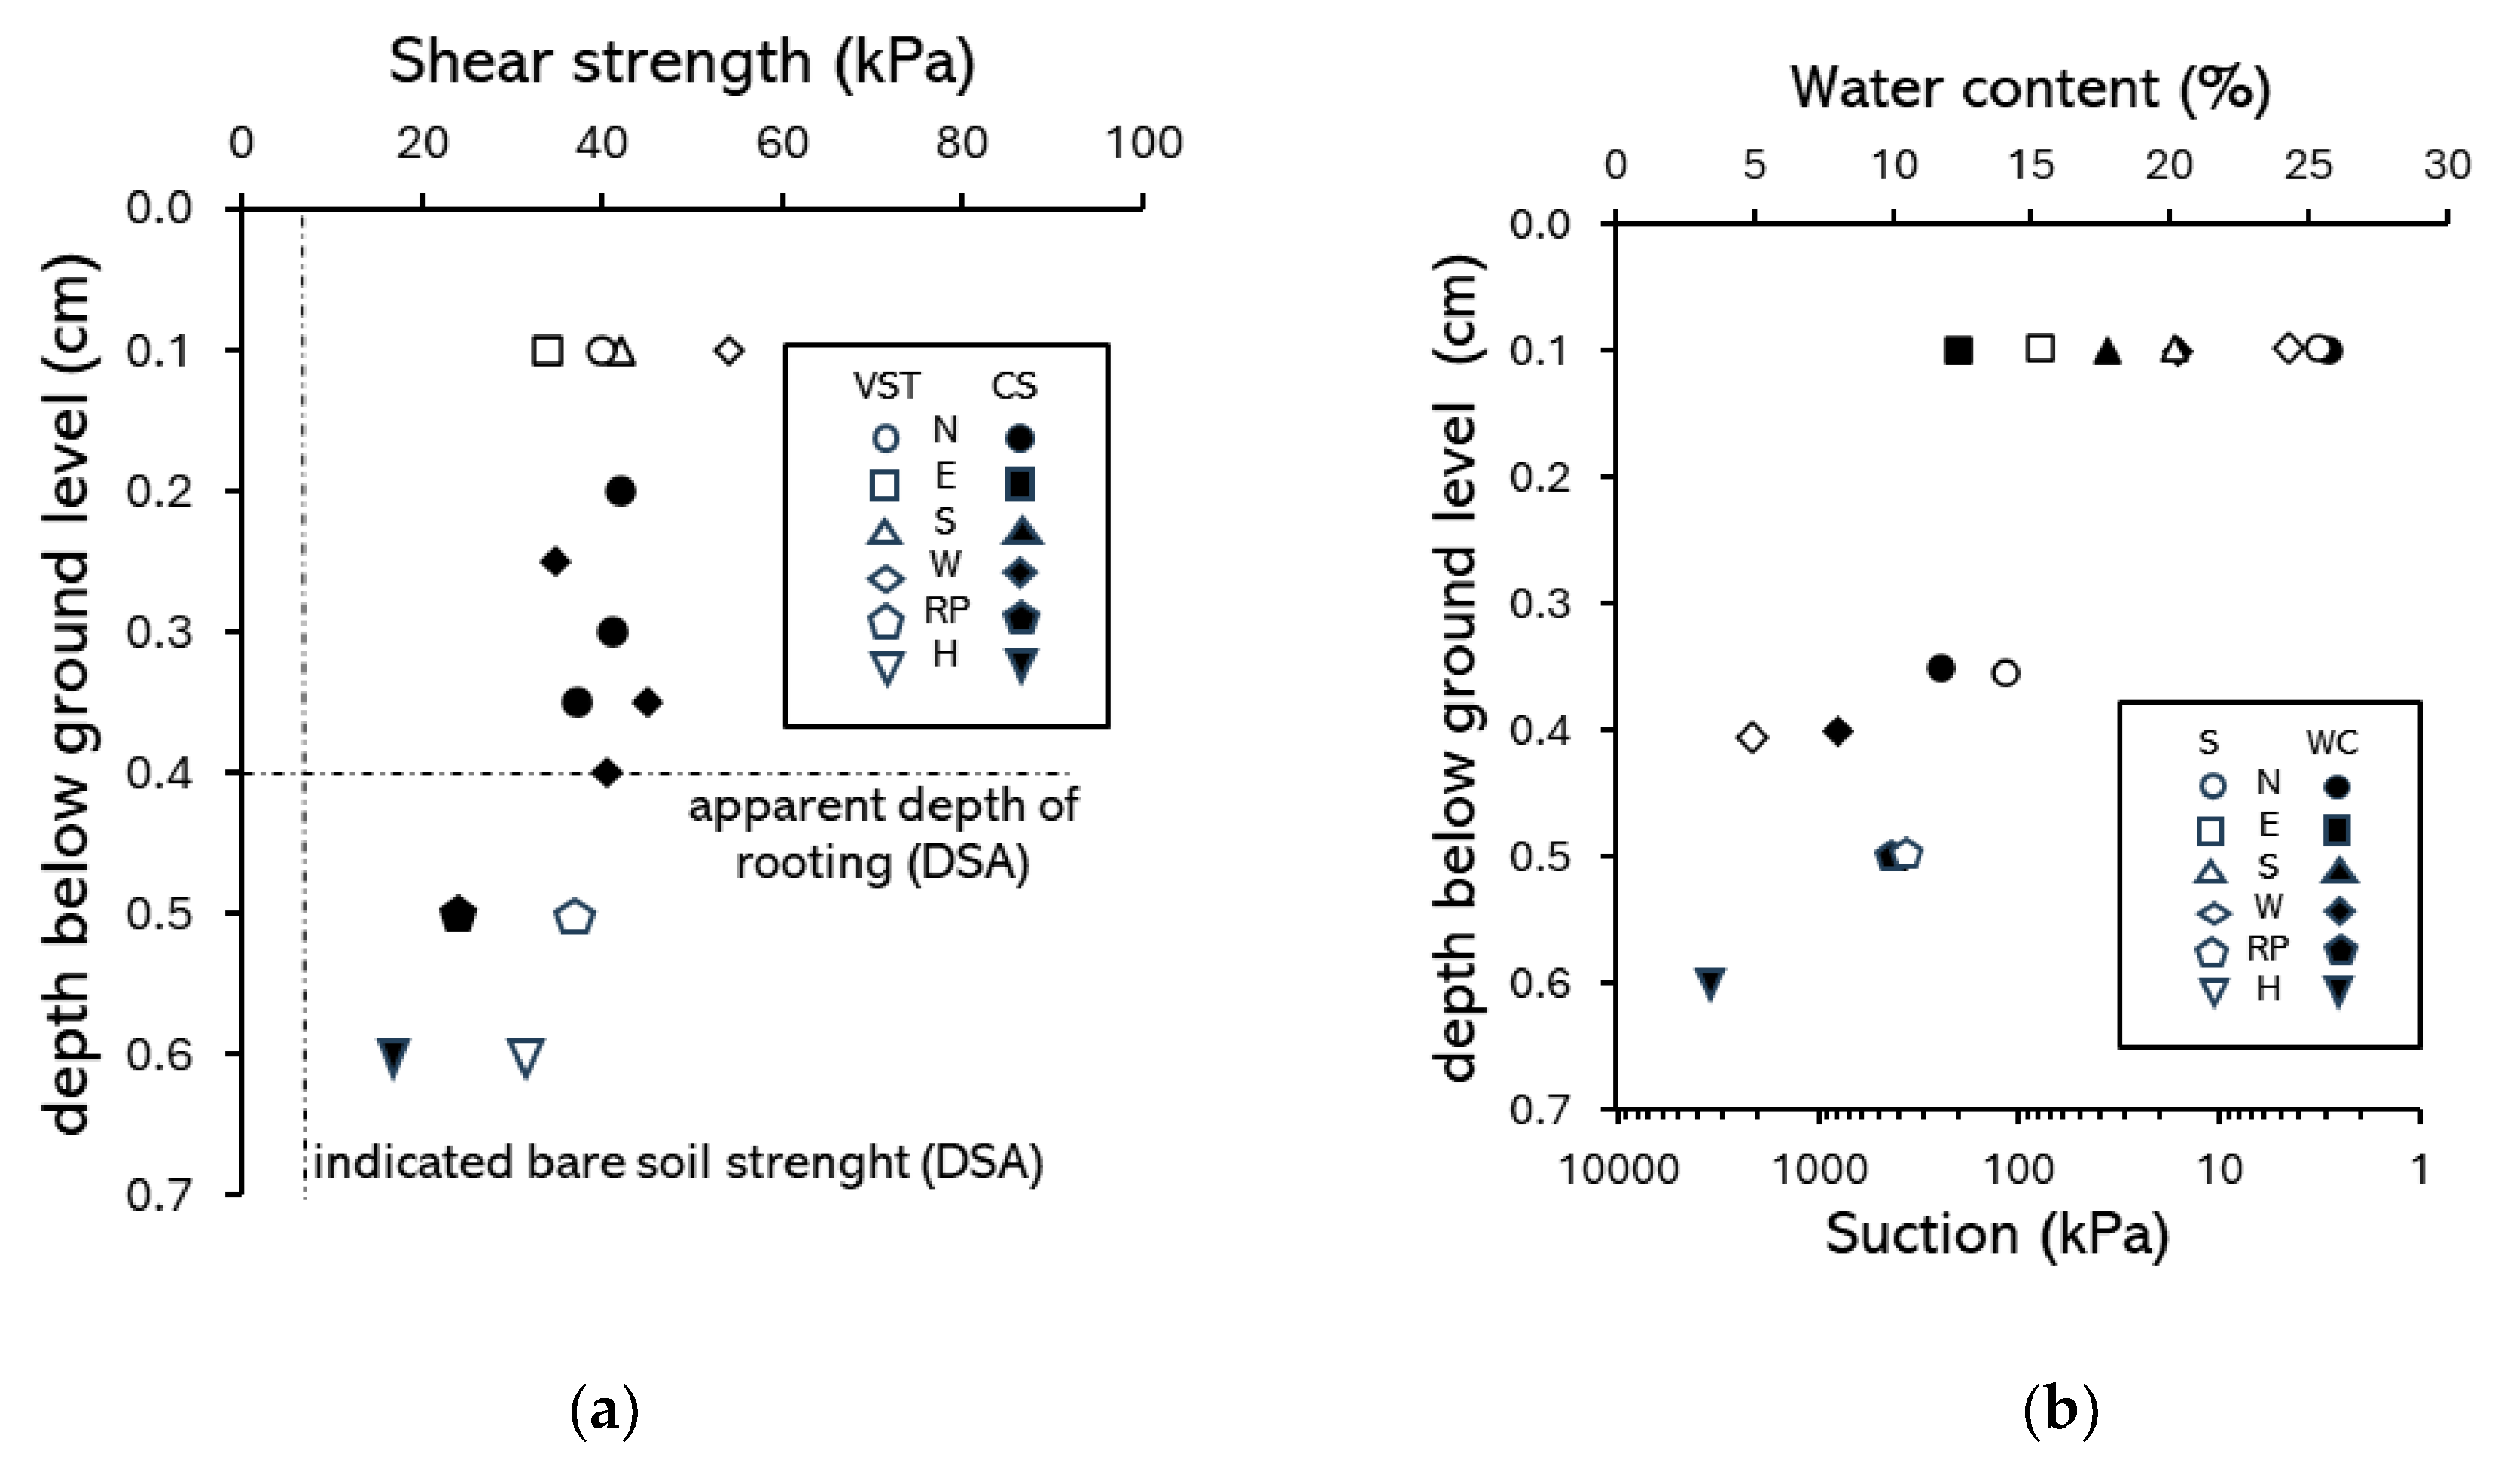
Figure A7.
Comparative summary of soil state and strength data (434 – Acer platanoides): (a) Shear strength from corkscrew (CS), vane shear tests (VST) and DSA; (b) Depth distribution of soil water content and suction inferred from Zone 3 SWRC; (c) Soil profile. Test data from different locations related to the trunk, where N, E, S, and W are cardinal directions, RP =root-plate and H = soil under root-plate.
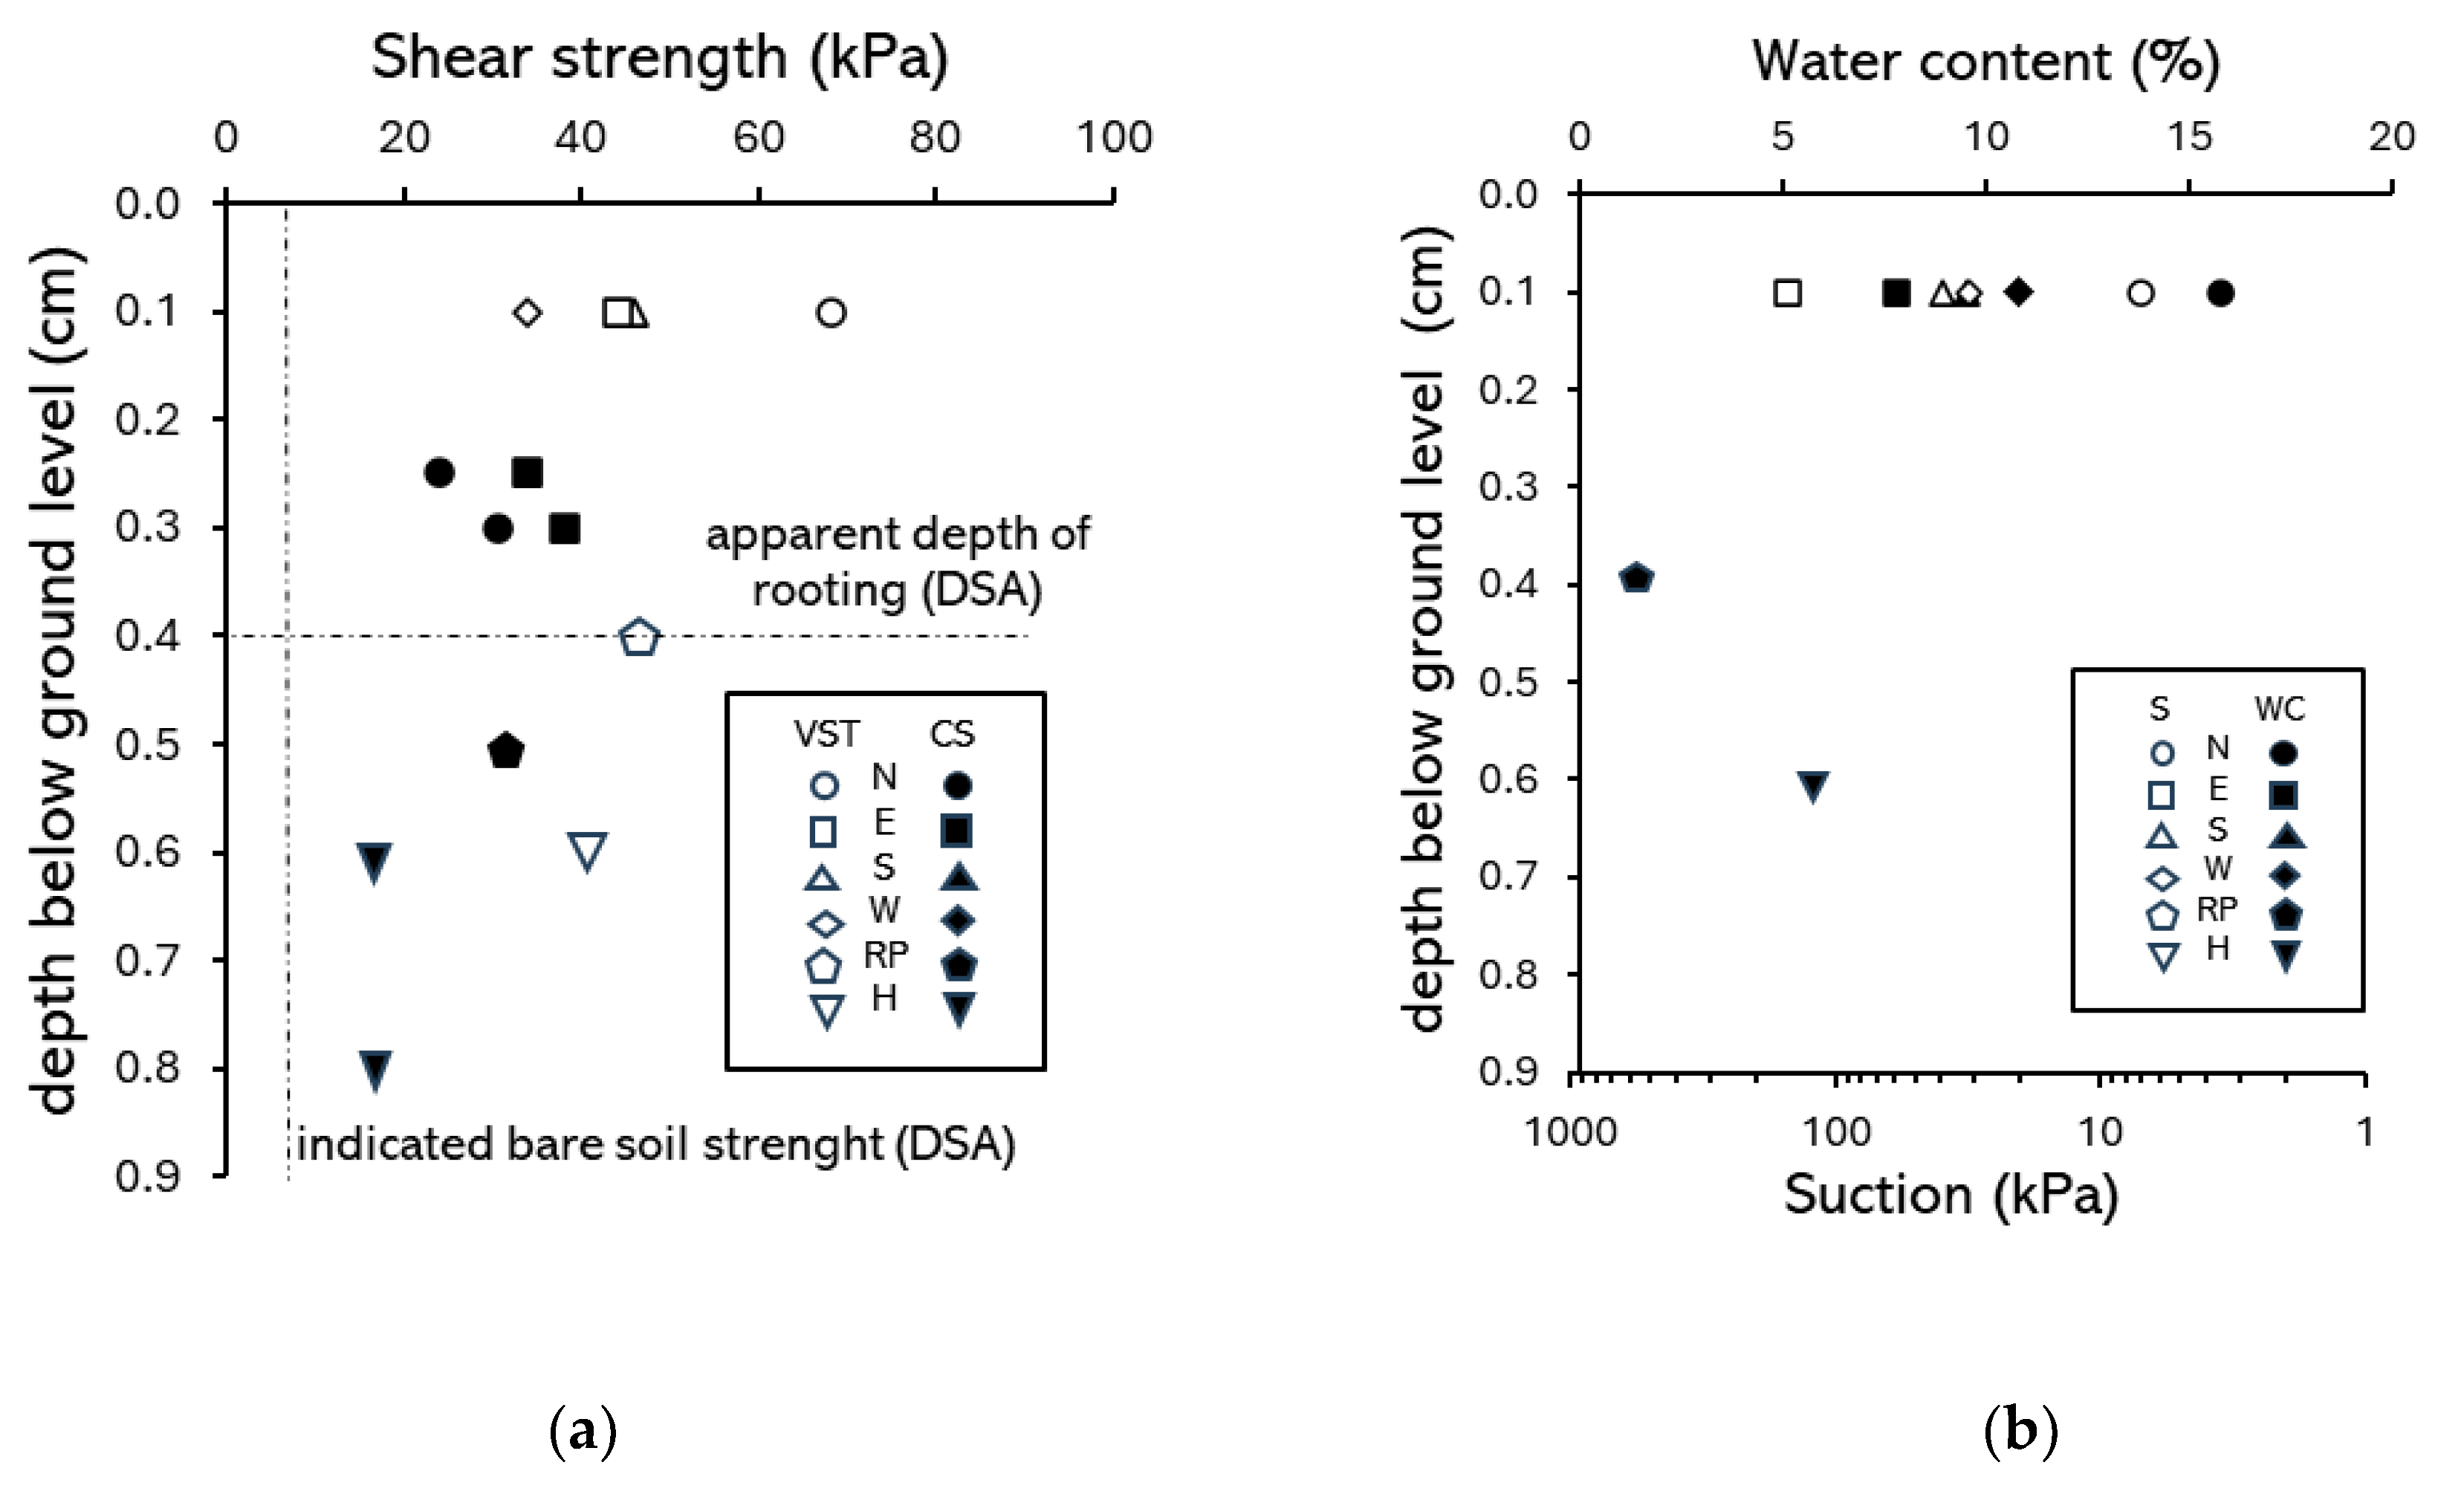
Figure A8.
Comparative summary of soil state and strength data (568 – Nothofagus): (a) Shear strength from corkscrew (CS), vane shear tests (VST) and DSA; (b) Depth distribution of soil water content and suction inferred from Zone 3 SWRC; (c) Soil profile. Test data from different locations related to the trunk, where N, E, S, and W are cardinal directions, RP =root-plate and H = soil under root-plate.

Appendix B
Figure B1.
non-destructive test curves with Wessolly interpolation and stiffness; (b) Comparison of extrapolated Wessolly curves with uprooting test. 433 Acer platanoides.
Figure B1.
non-destructive test curves with Wessolly interpolation and stiffness; (b) Comparison of extrapolated Wessolly curves with uprooting test. 433 Acer platanoides.
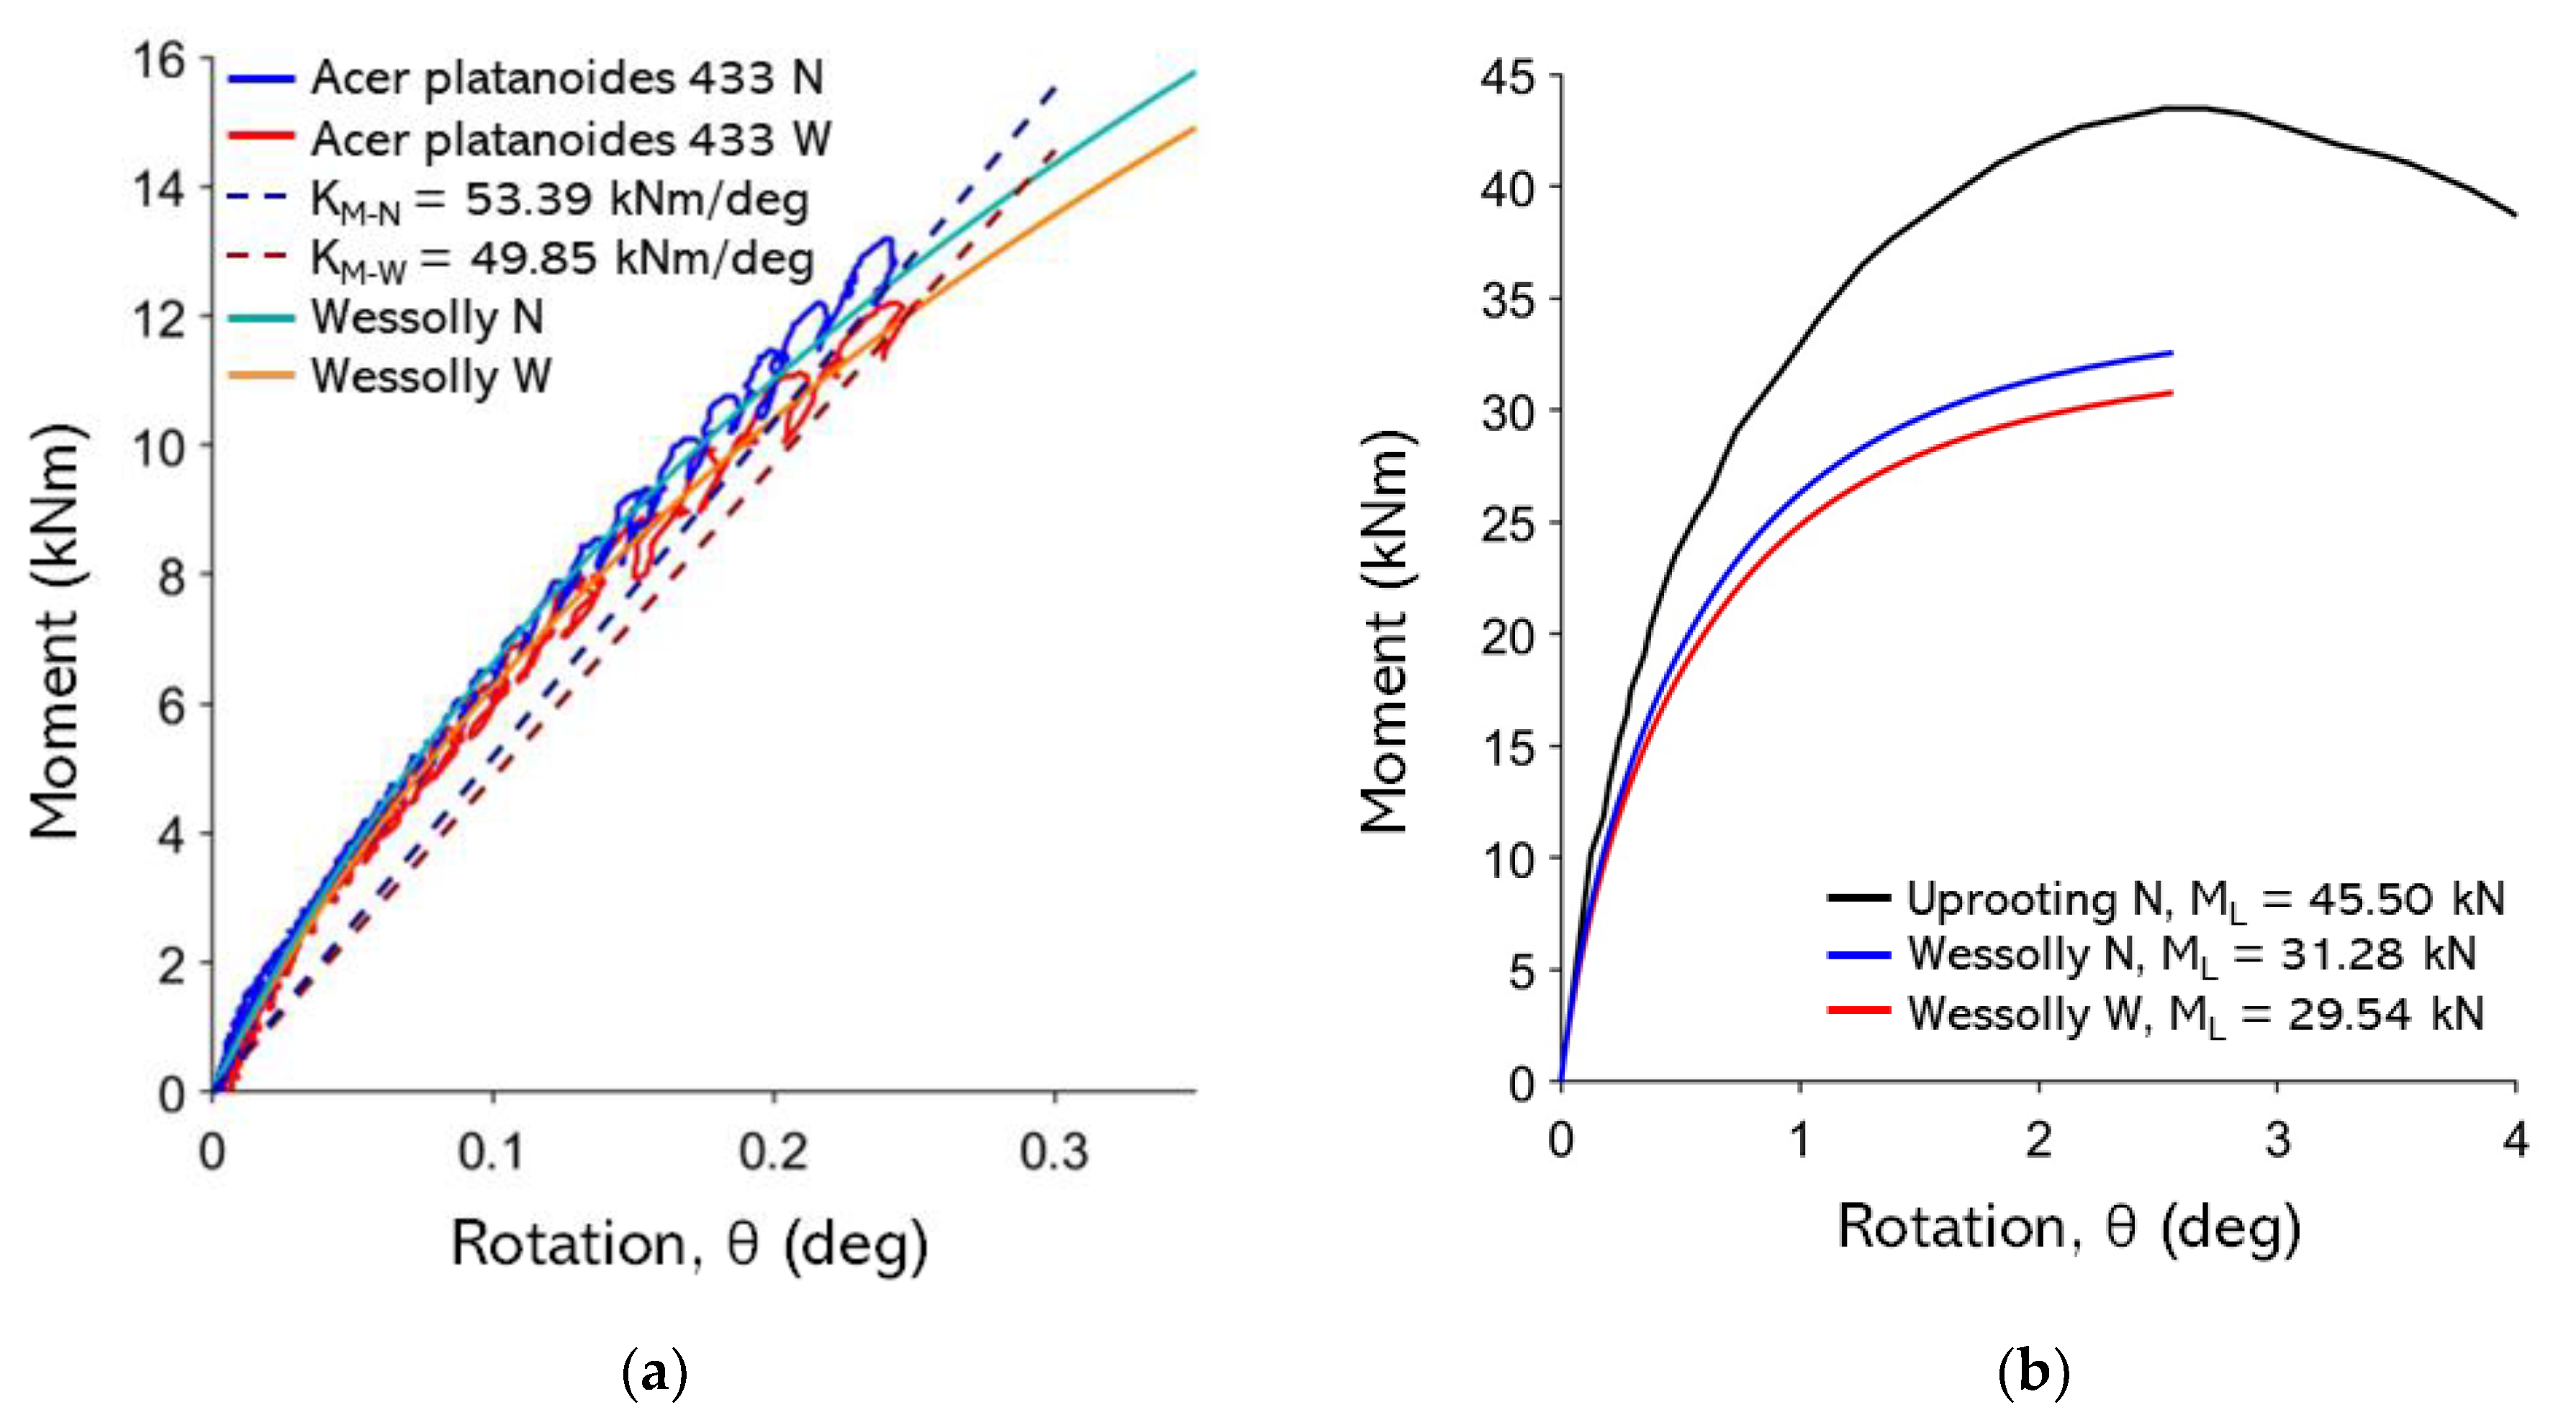
Figure B2.
non-destructive test curves with Wessolly interpolation and stiffness; (b) Comparison of extrapolated Wessolly curves with uprooting test. 434 Acer platanoides.
Figure B2.
non-destructive test curves with Wessolly interpolation and stiffness; (b) Comparison of extrapolated Wessolly curves with uprooting test. 434 Acer platanoides.
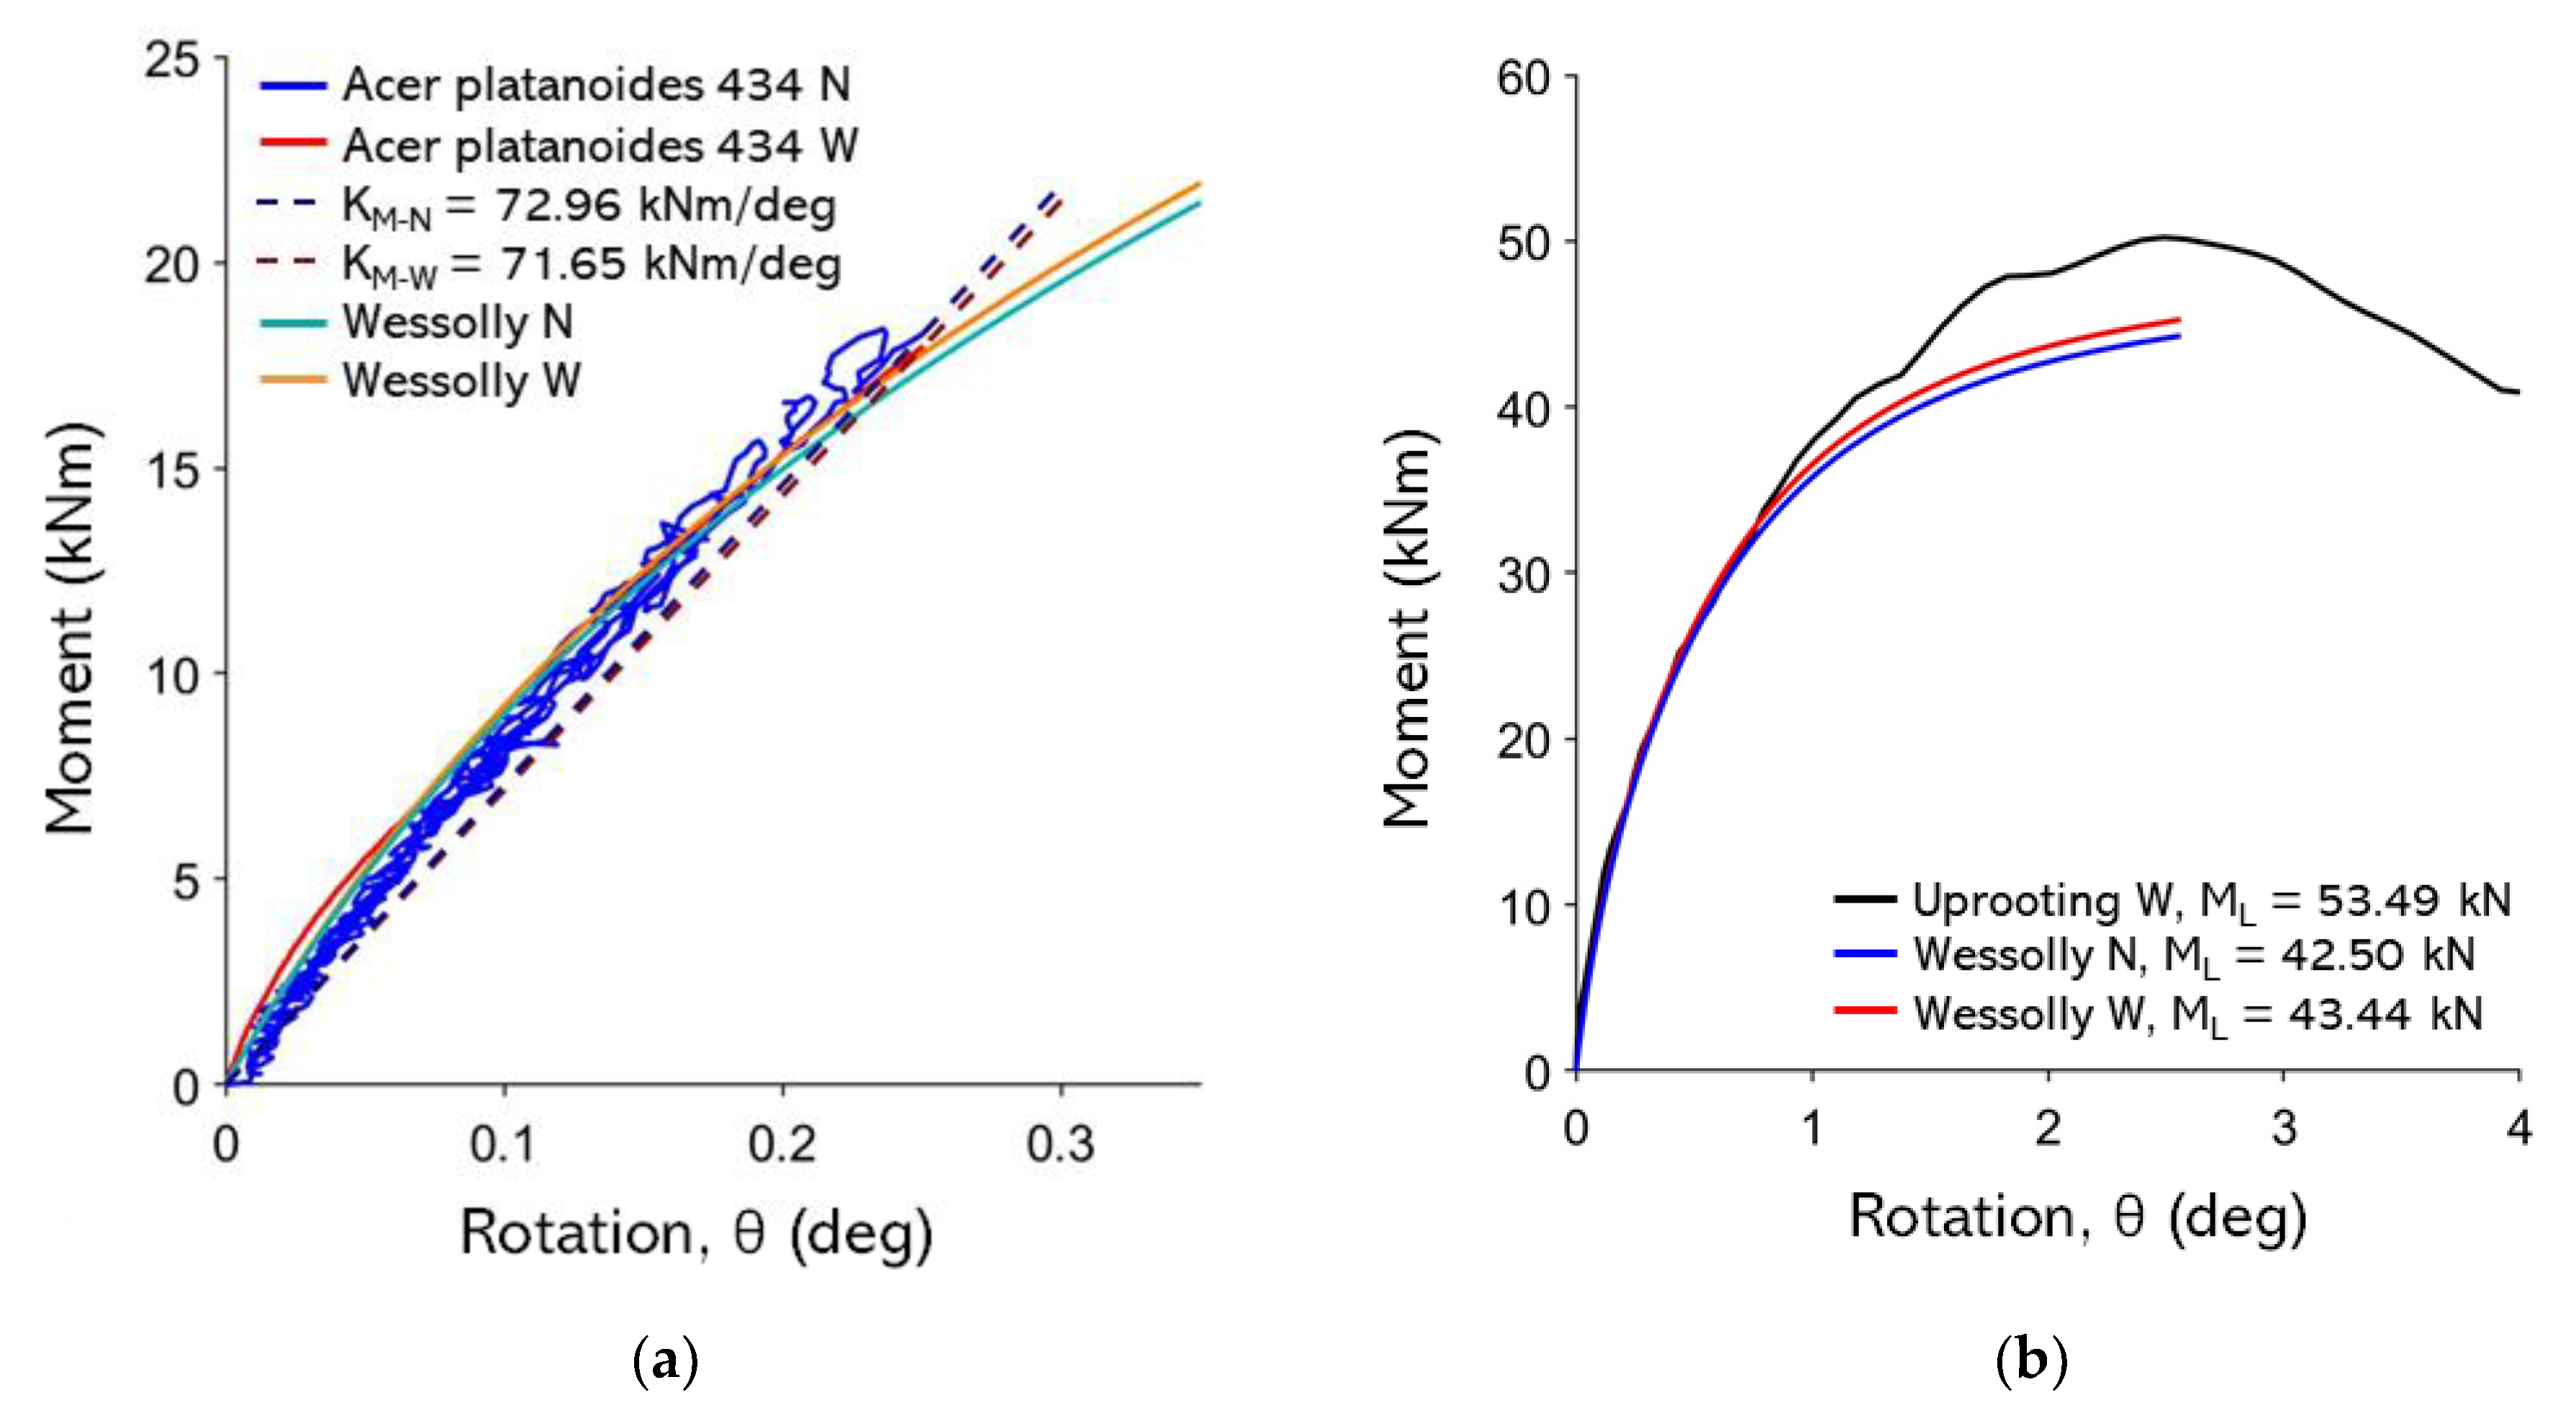
Figure B3.
non-destructive test curves with Wessolly interpolation and stiffness; (b) Comparison of extrapolated Wessolly curves with uprooting test. 682 Eucalyptus.
Figure B3.
non-destructive test curves with Wessolly interpolation and stiffness; (b) Comparison of extrapolated Wessolly curves with uprooting test. 682 Eucalyptus.
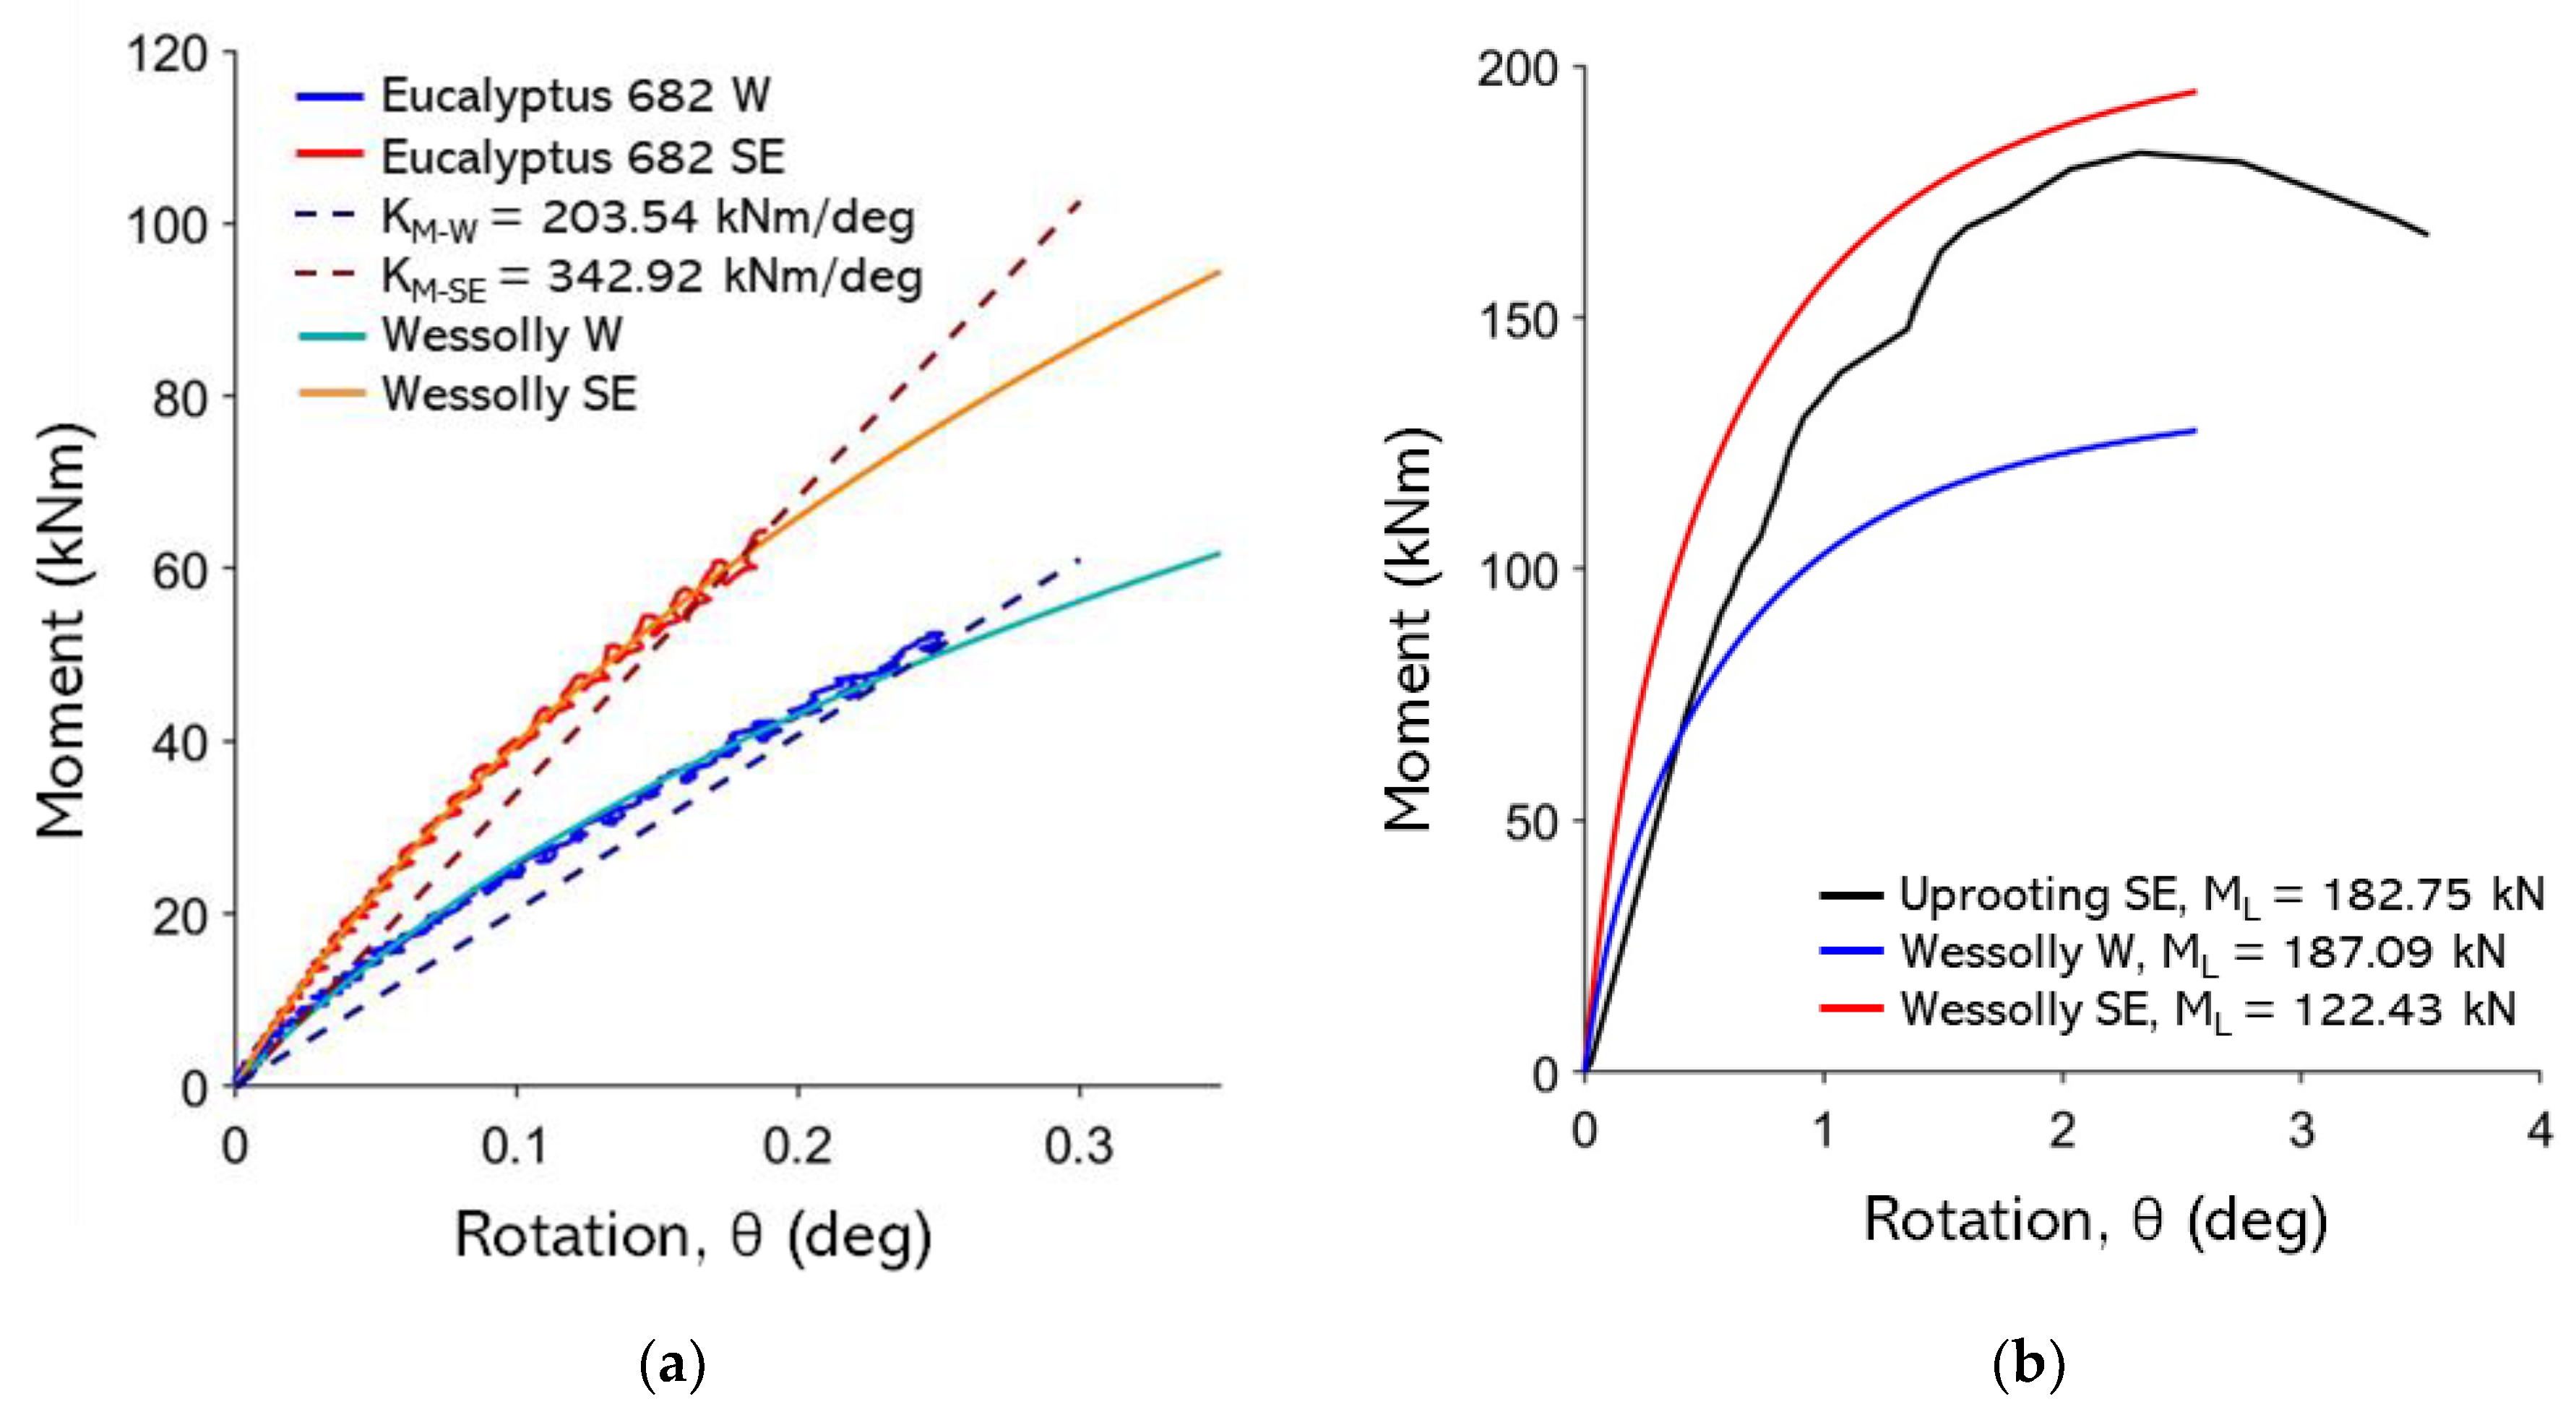
Figure B4.
non-destructive test curves with Wessolly interpolation and stiffness; (b) Comparison of extrapolated Wessolly curves with uprooting test. 683 Eucalyptus.
Figure B4.
non-destructive test curves with Wessolly interpolation and stiffness; (b) Comparison of extrapolated Wessolly curves with uprooting test. 683 Eucalyptus.
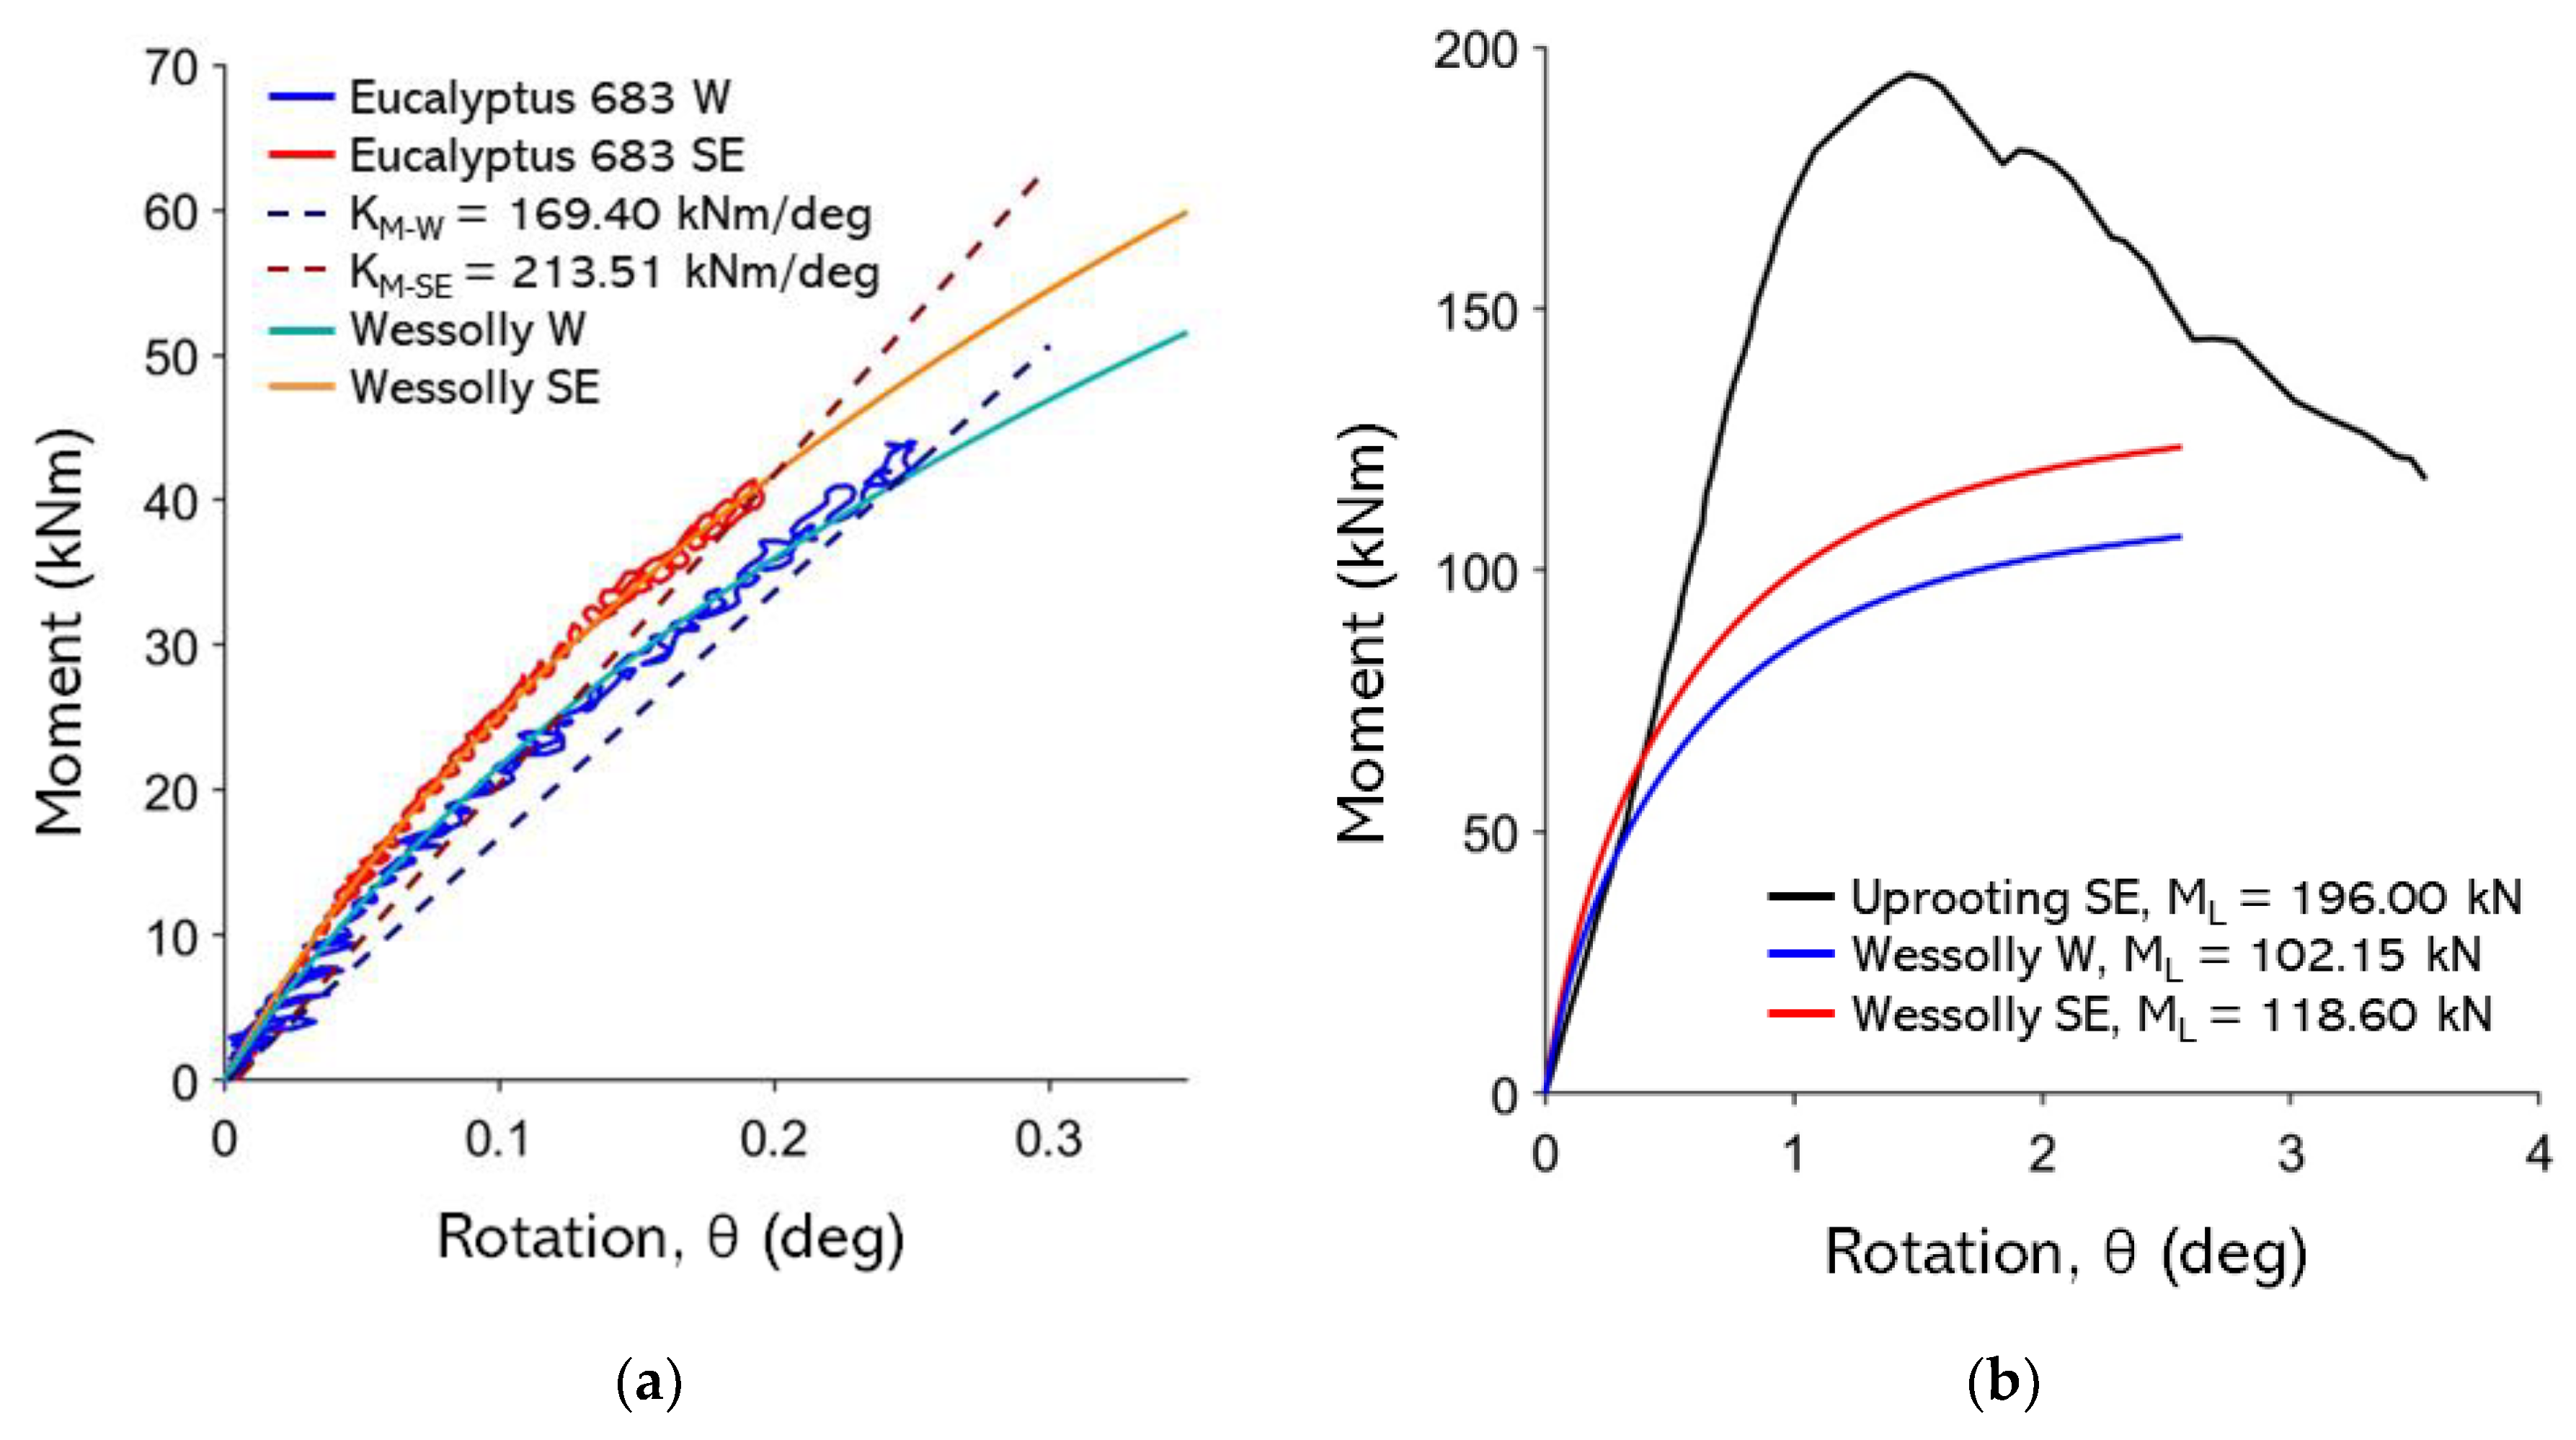
Figure B5.
non-destructive test curves with Wessolly interpolation and stiffness; (b) Comparison of extrapolated Wessolly curves with uprooting test. 383 Betula.
Figure B5.
non-destructive test curves with Wessolly interpolation and stiffness; (b) Comparison of extrapolated Wessolly curves with uprooting test. 383 Betula.
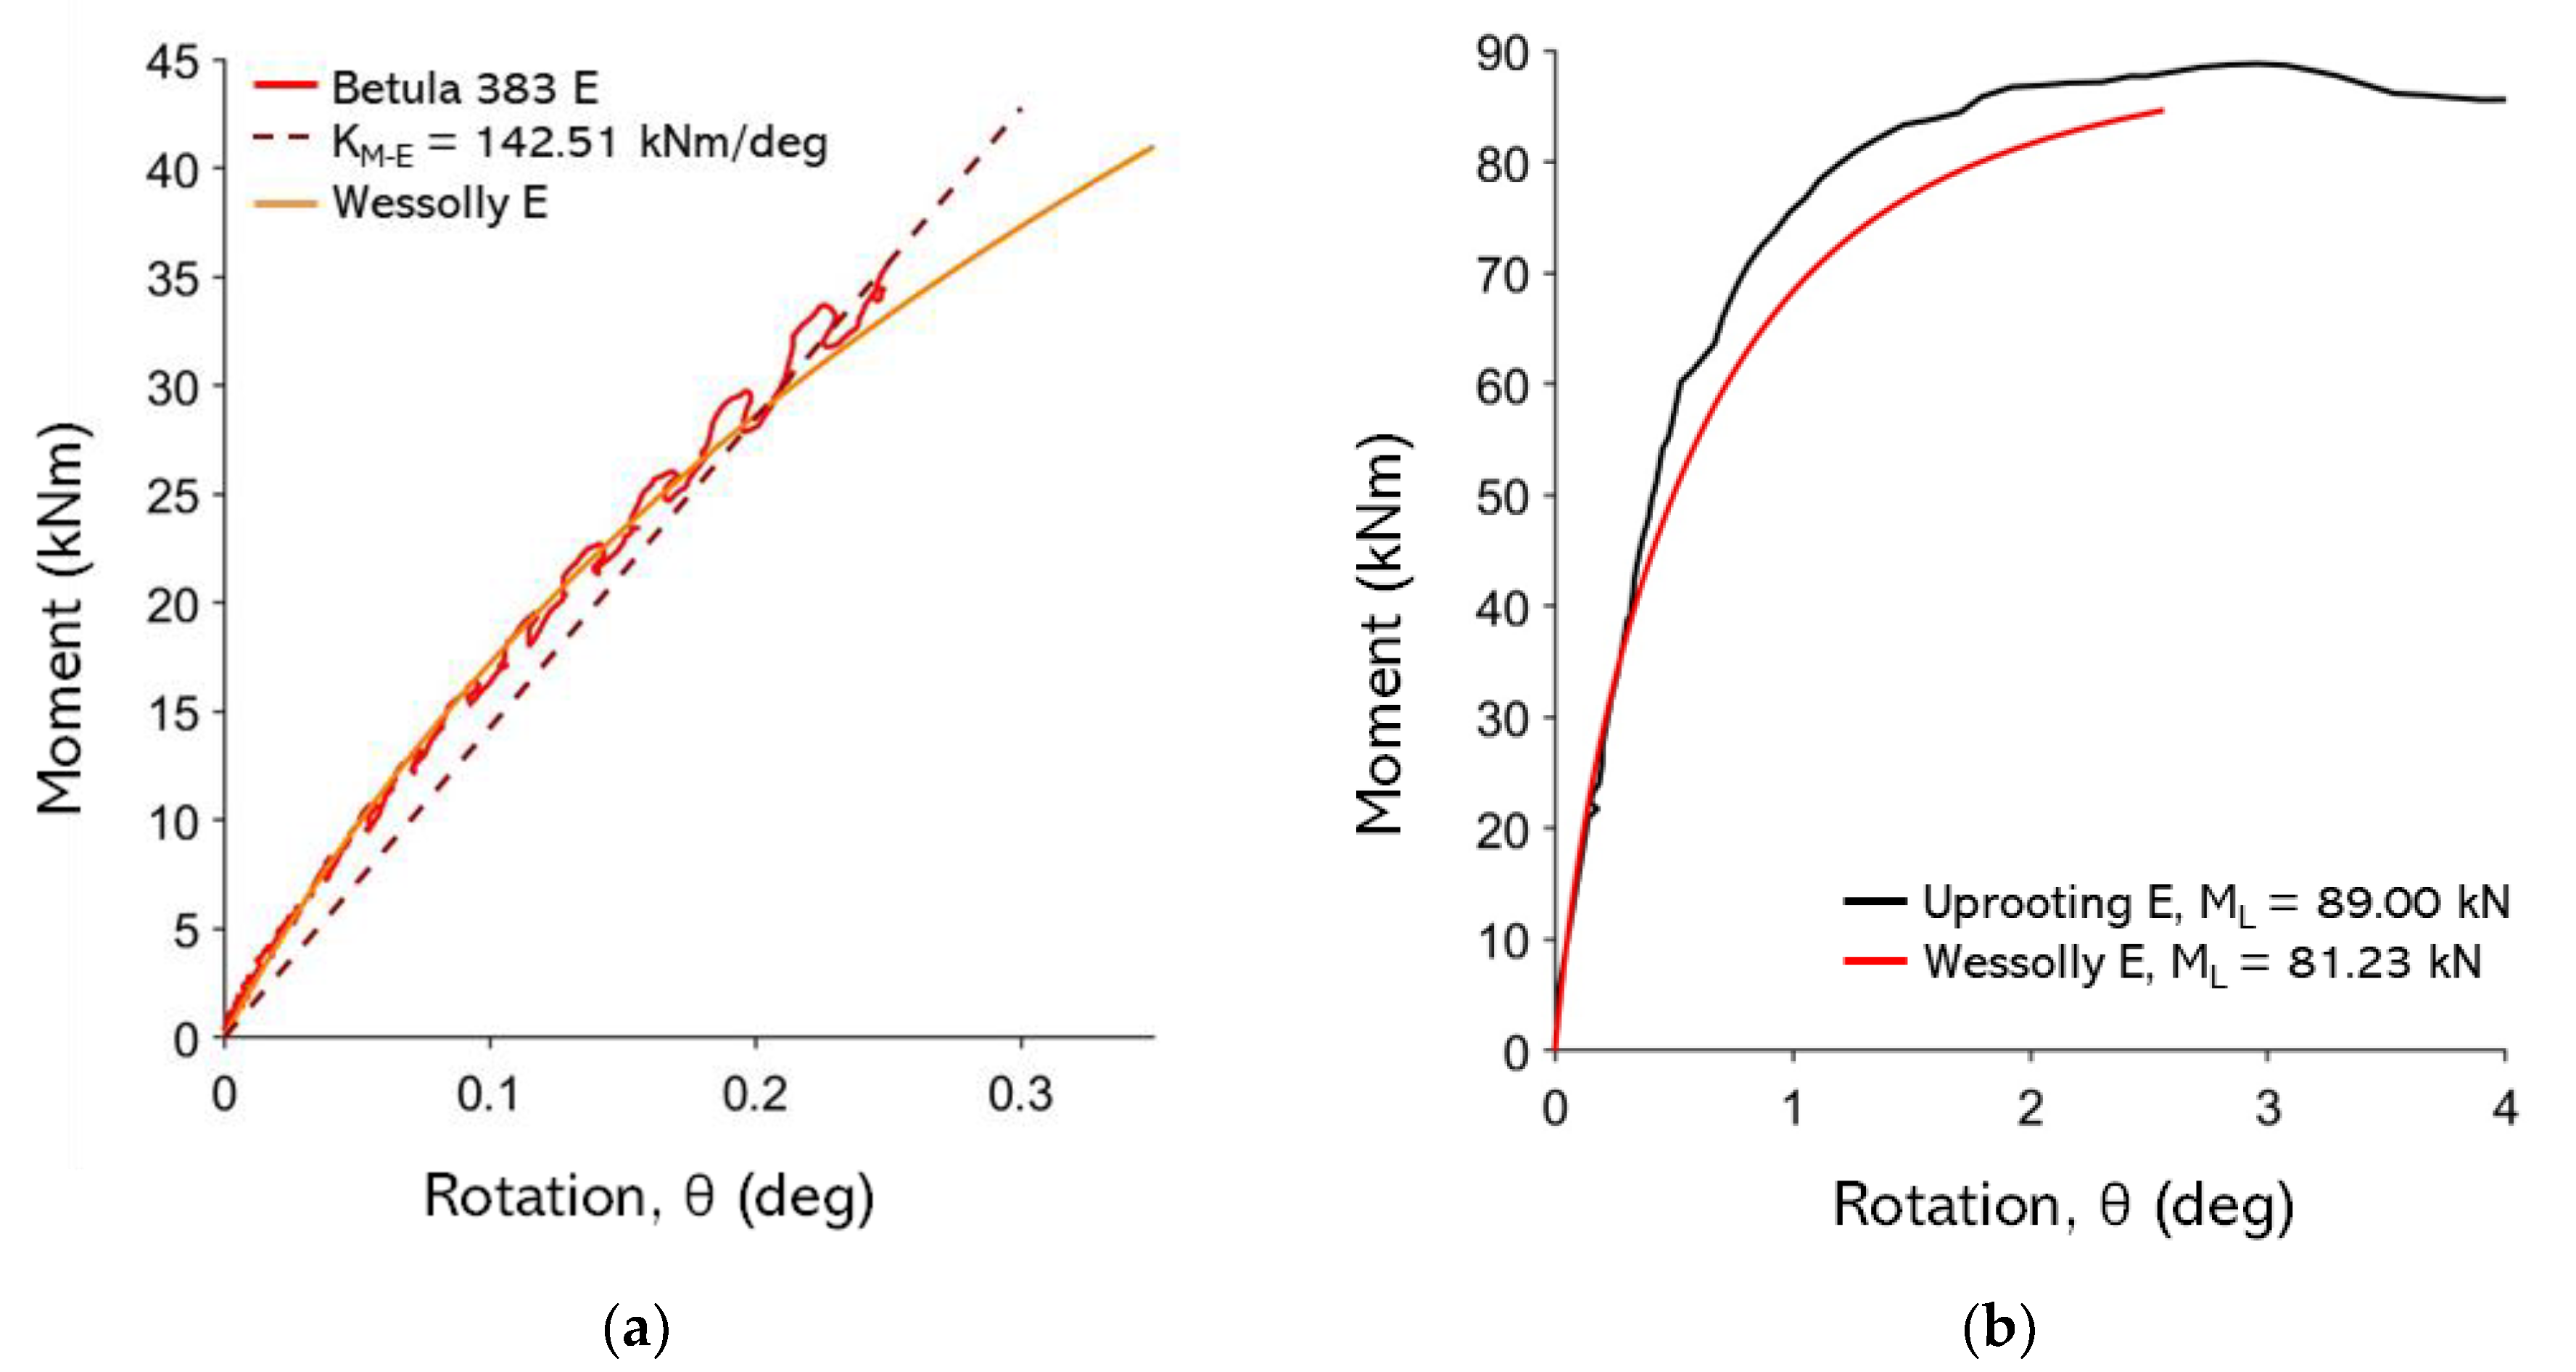
Figure B6.
non-destructive test curves with Wessolly interpolation and stiffness; (b) Comparison of extrapolated Wessolly curves with uprooting test. 143 Pinus nigra.
Figure B6.
non-destructive test curves with Wessolly interpolation and stiffness; (b) Comparison of extrapolated Wessolly curves with uprooting test. 143 Pinus nigra.
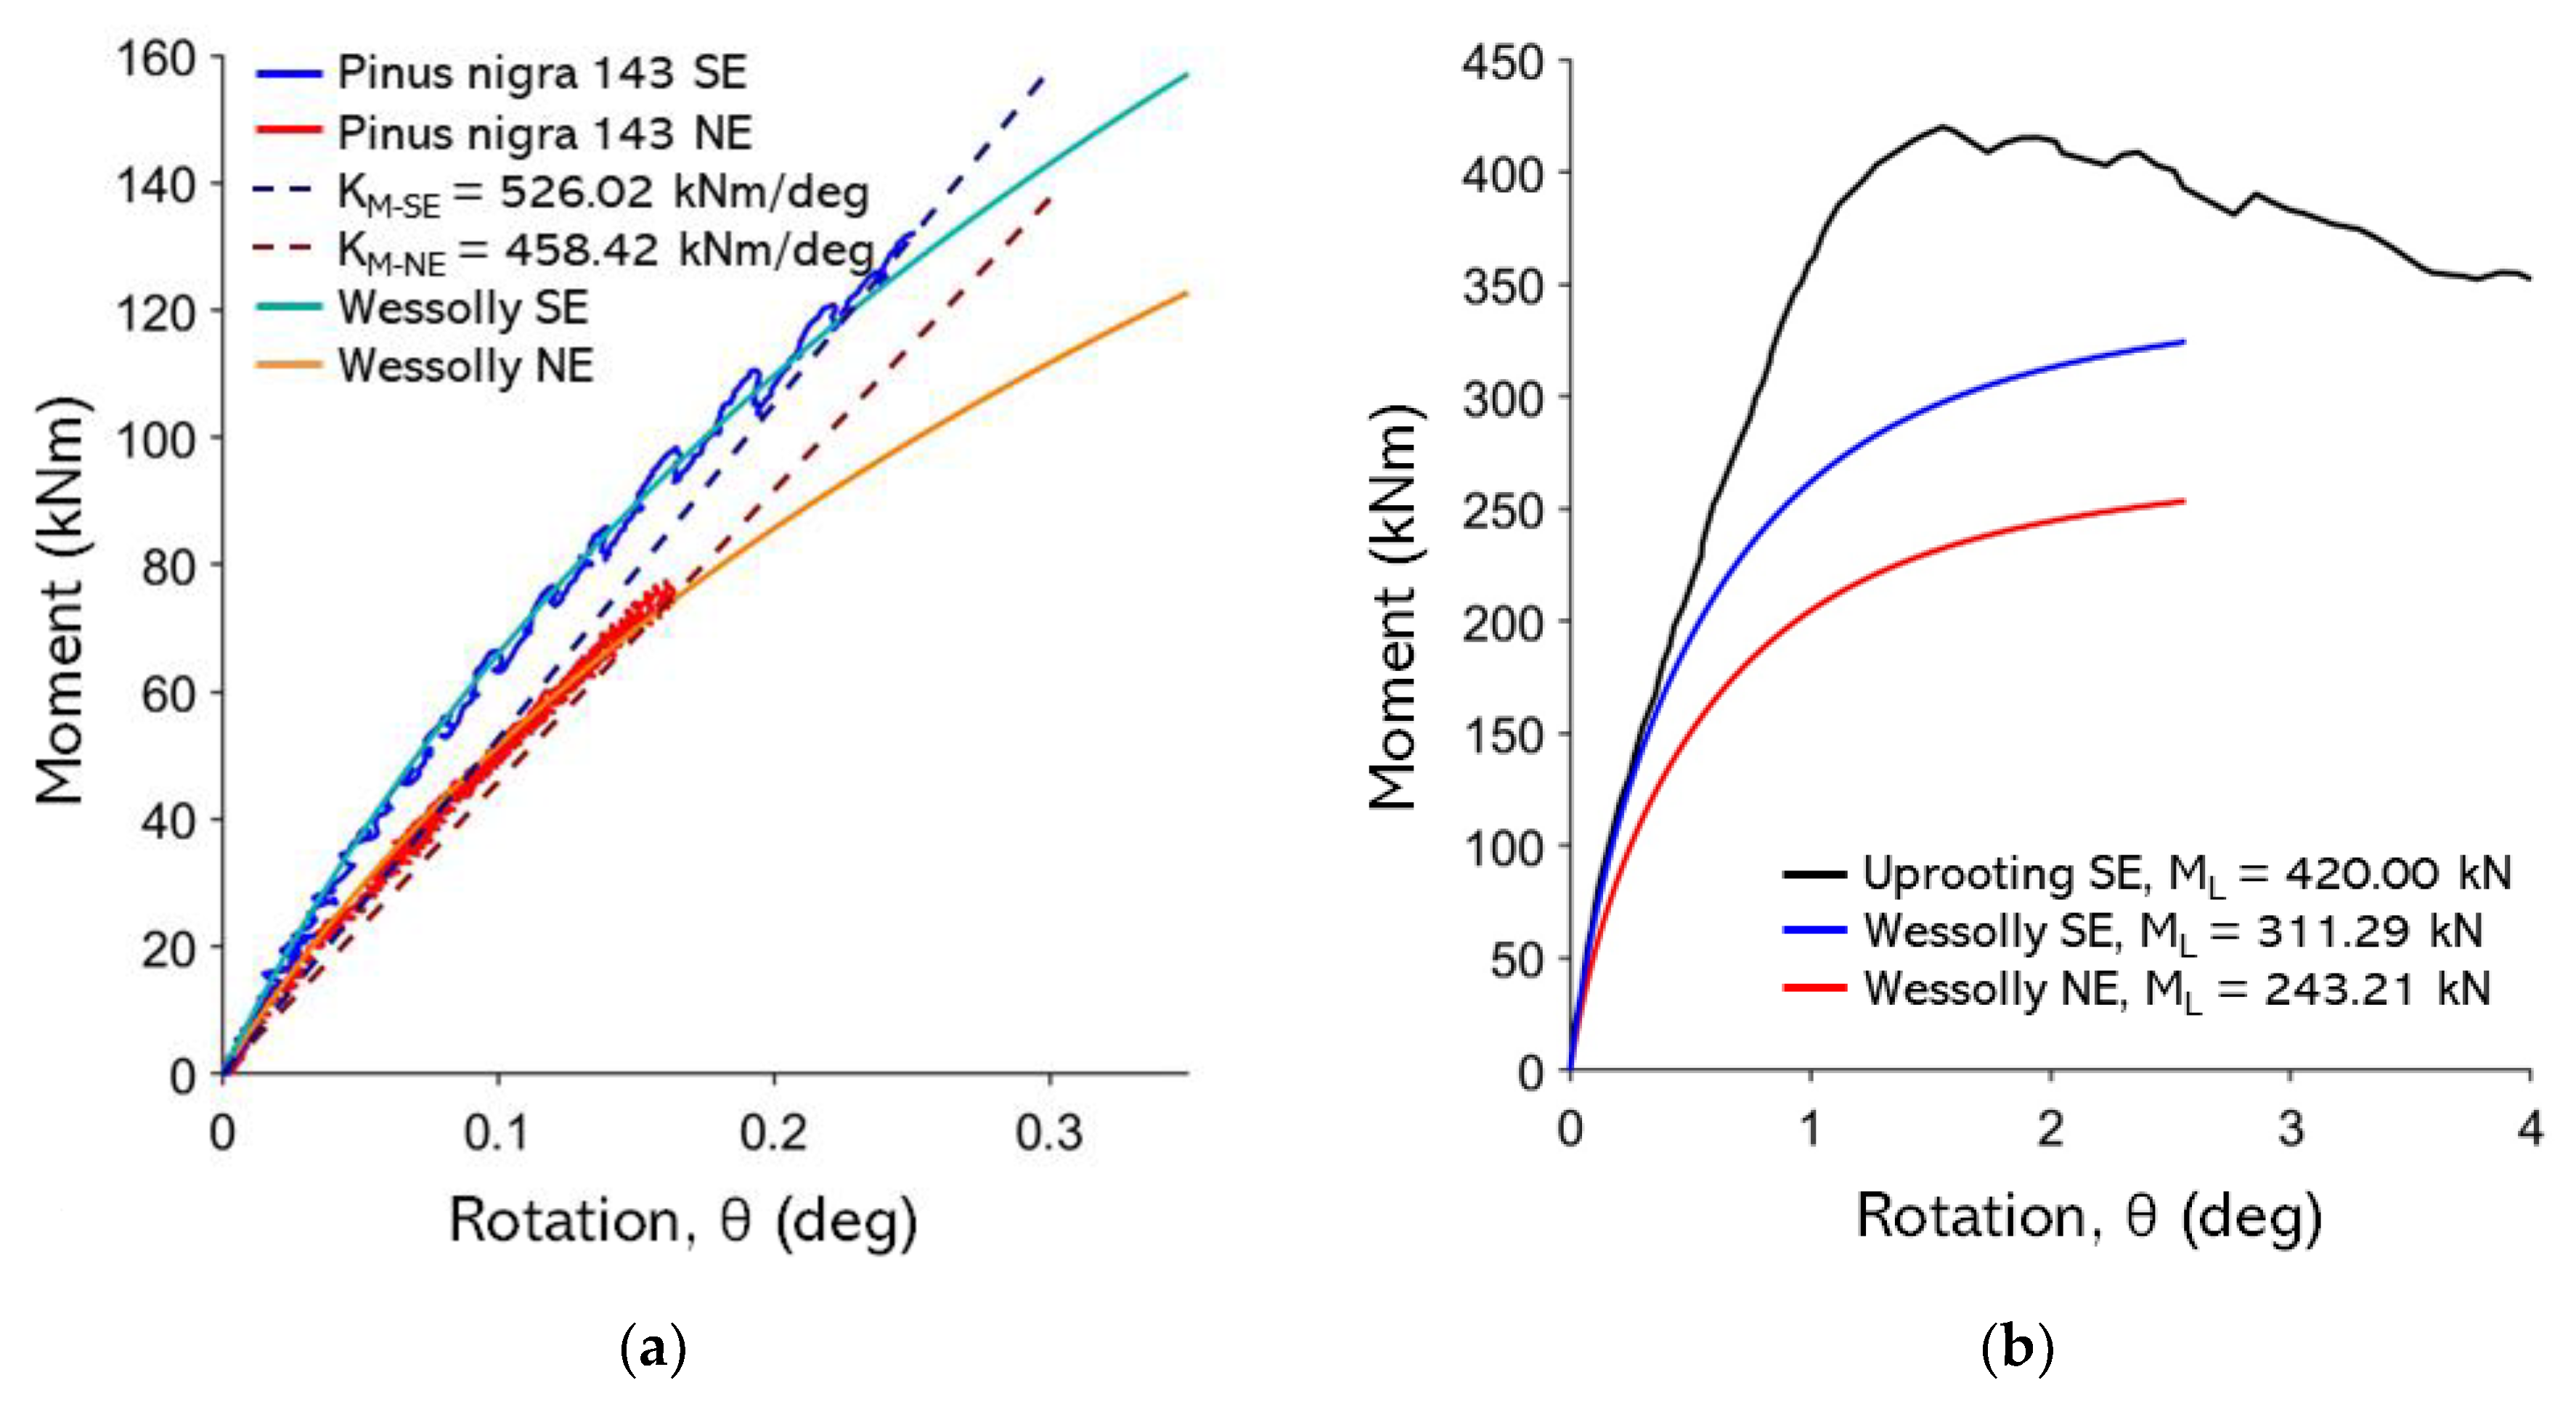
Figure B7.
non-destructive test curves with Wessolly interpolation and stiffness; (b) Comparison of extrapolated Wessolly curves with uprooting test. 234 Pinus nigra.
Figure B7.
non-destructive test curves with Wessolly interpolation and stiffness; (b) Comparison of extrapolated Wessolly curves with uprooting test. 234 Pinus nigra.
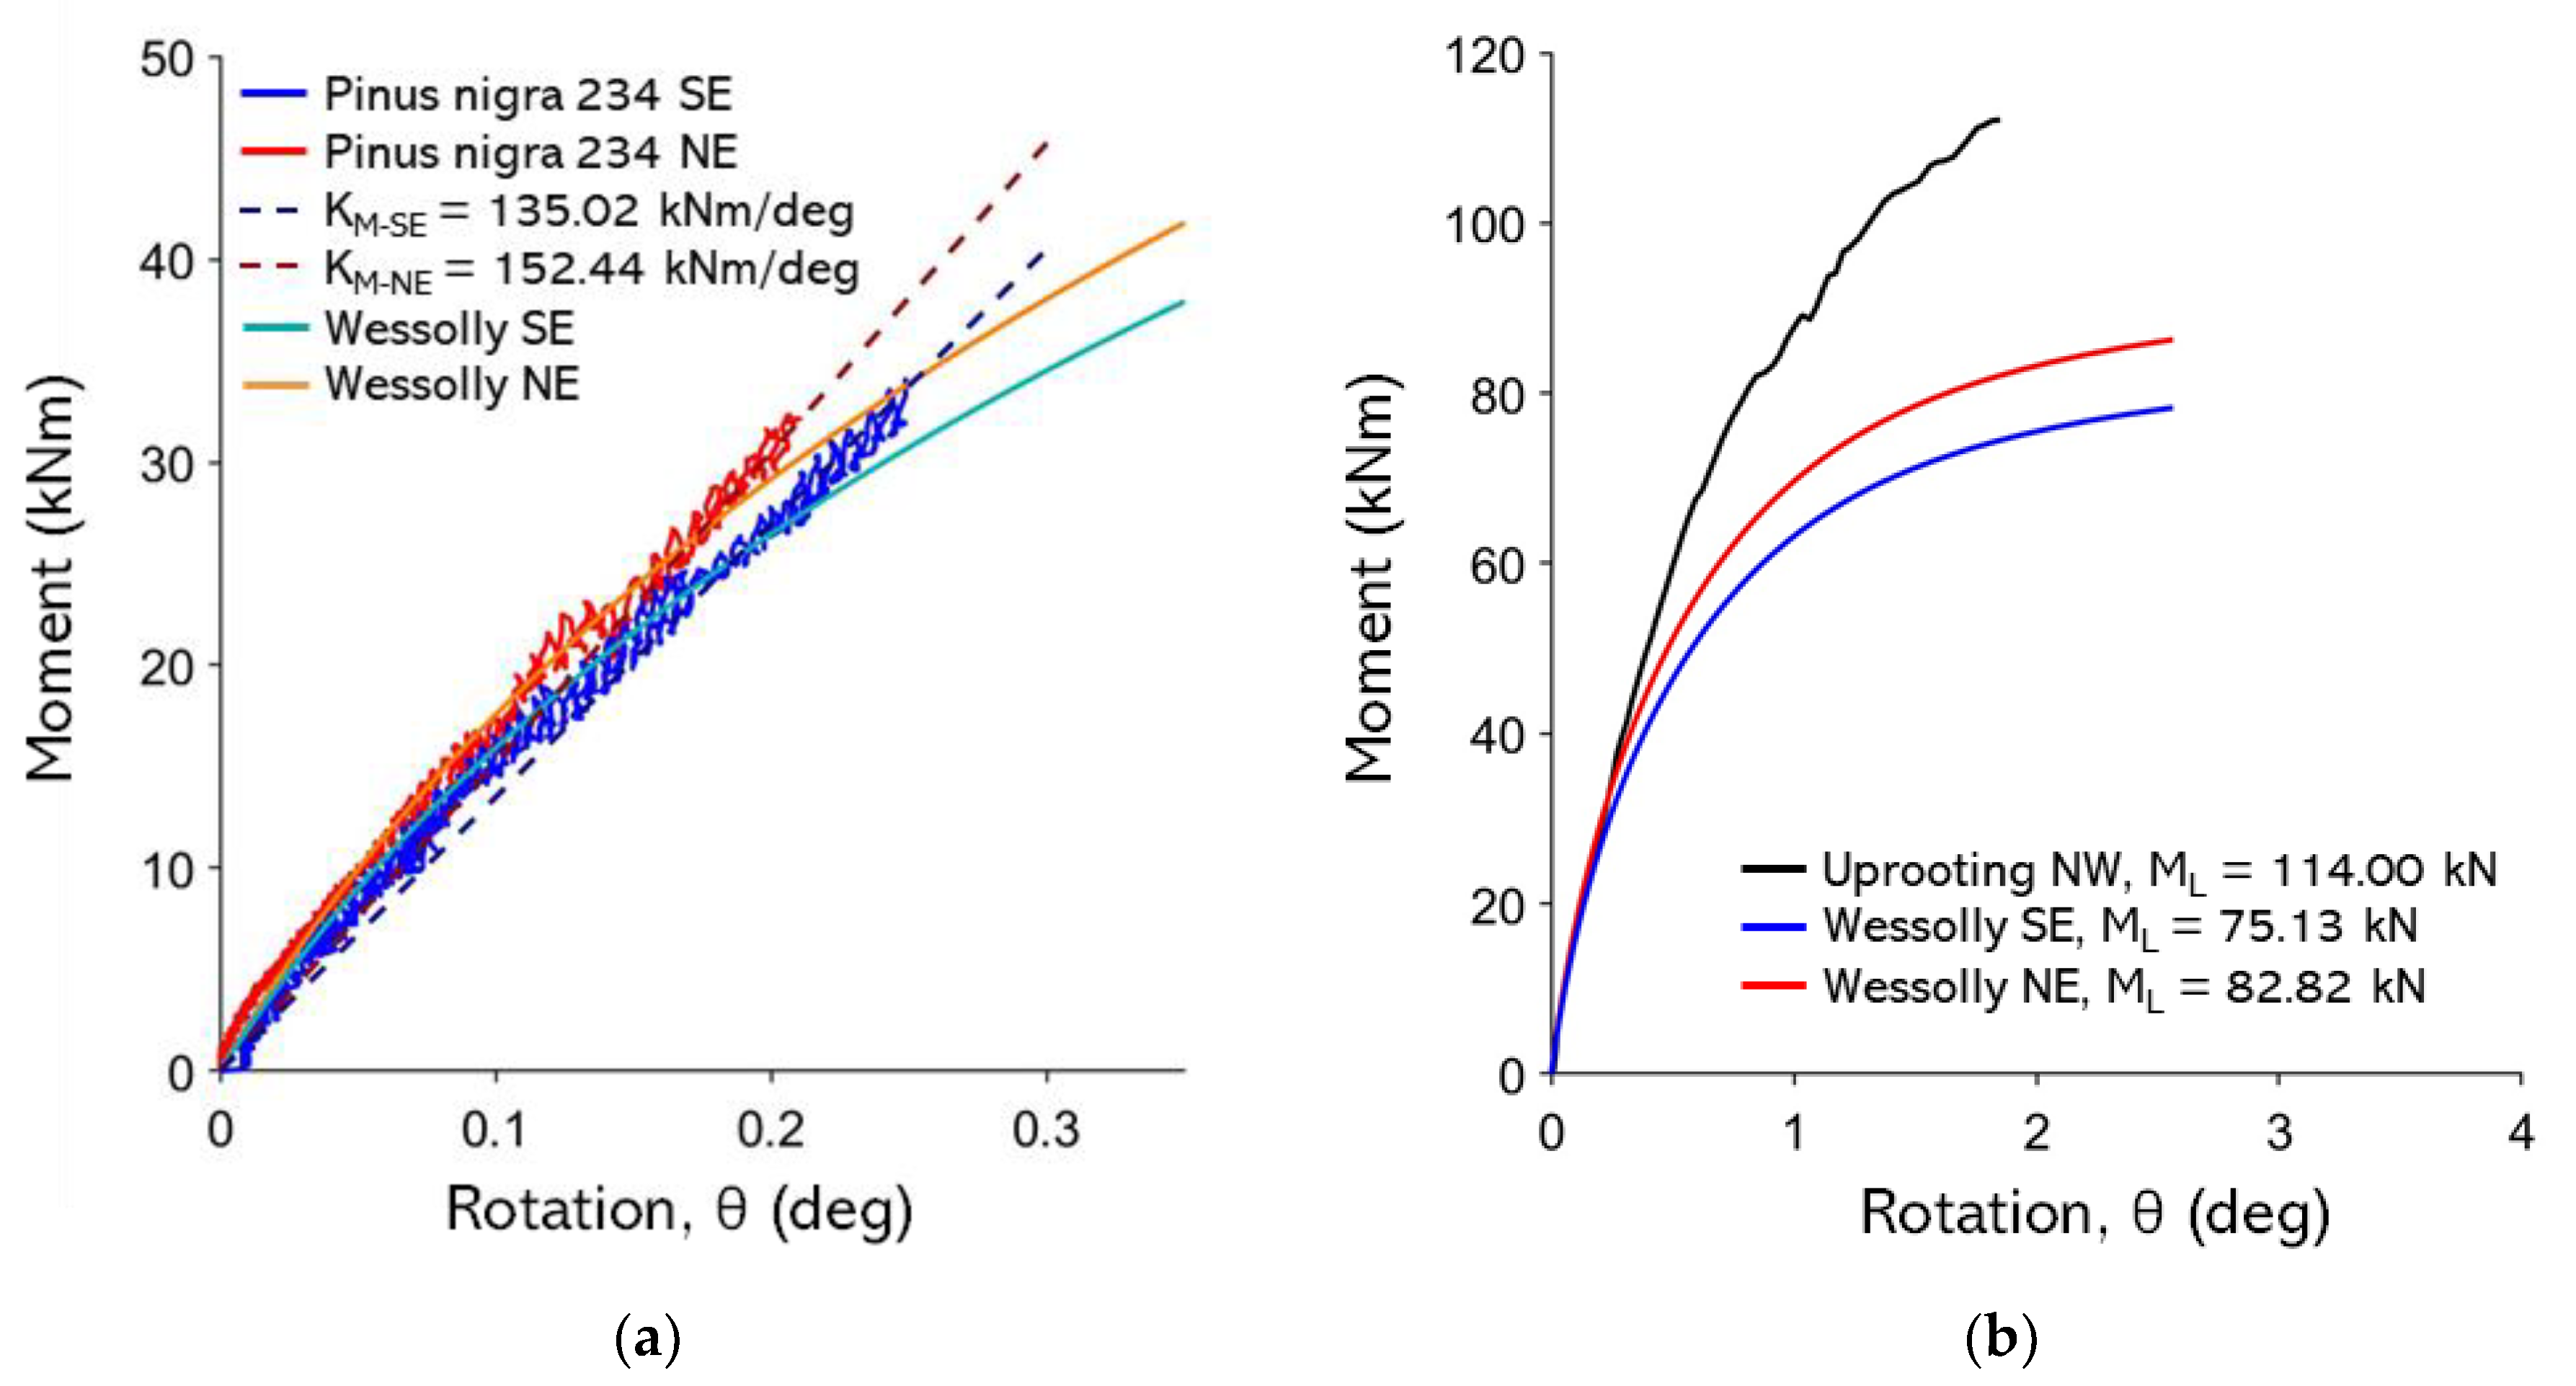
Figure B8.
non-destructive test curves with Wessolly interpolation and stiffness; (b) Comparison of extrapolated Wessolly curves with uprooting test. 243 Pinus nigra.
Figure B8.
non-destructive test curves with Wessolly interpolation and stiffness; (b) Comparison of extrapolated Wessolly curves with uprooting test. 243 Pinus nigra.
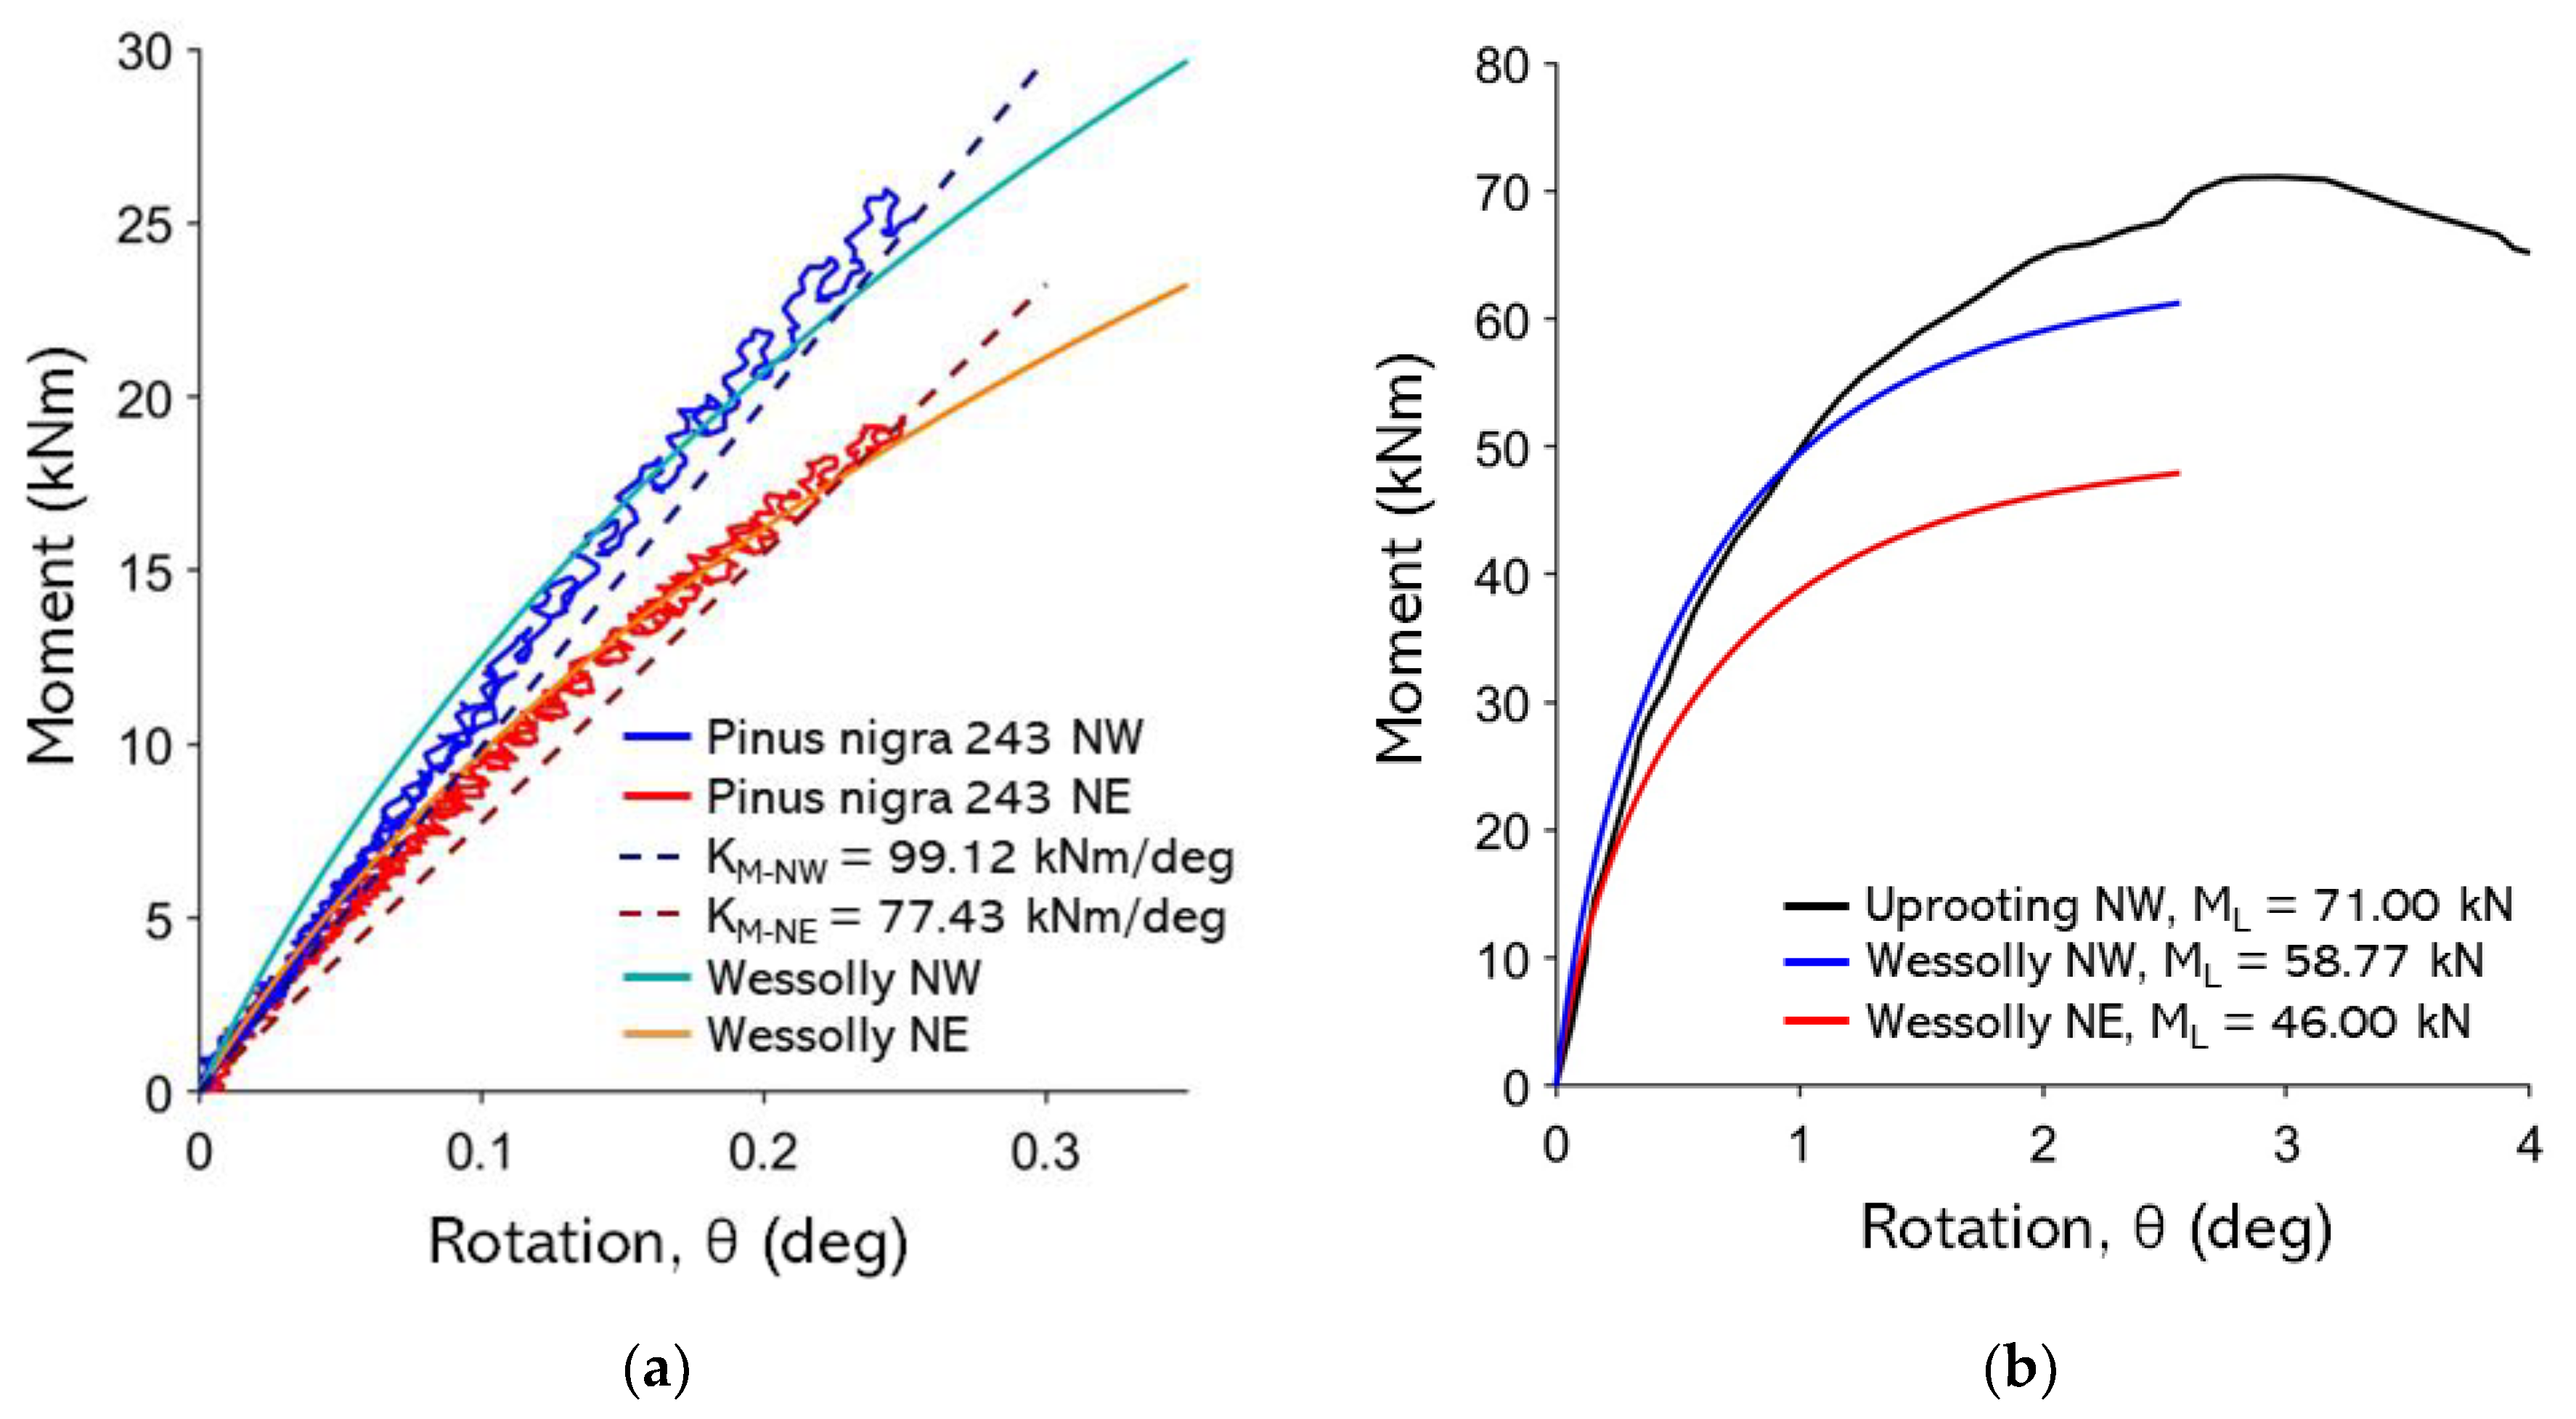
Figure B9.
non-destructive test curves with Wessolly interpolation and stiffness; (b) Comparison of extrapolated Wessolly curves with uprooting test. 268 Pinus nigra.
Figure B9.
non-destructive test curves with Wessolly interpolation and stiffness; (b) Comparison of extrapolated Wessolly curves with uprooting test. 268 Pinus nigra.
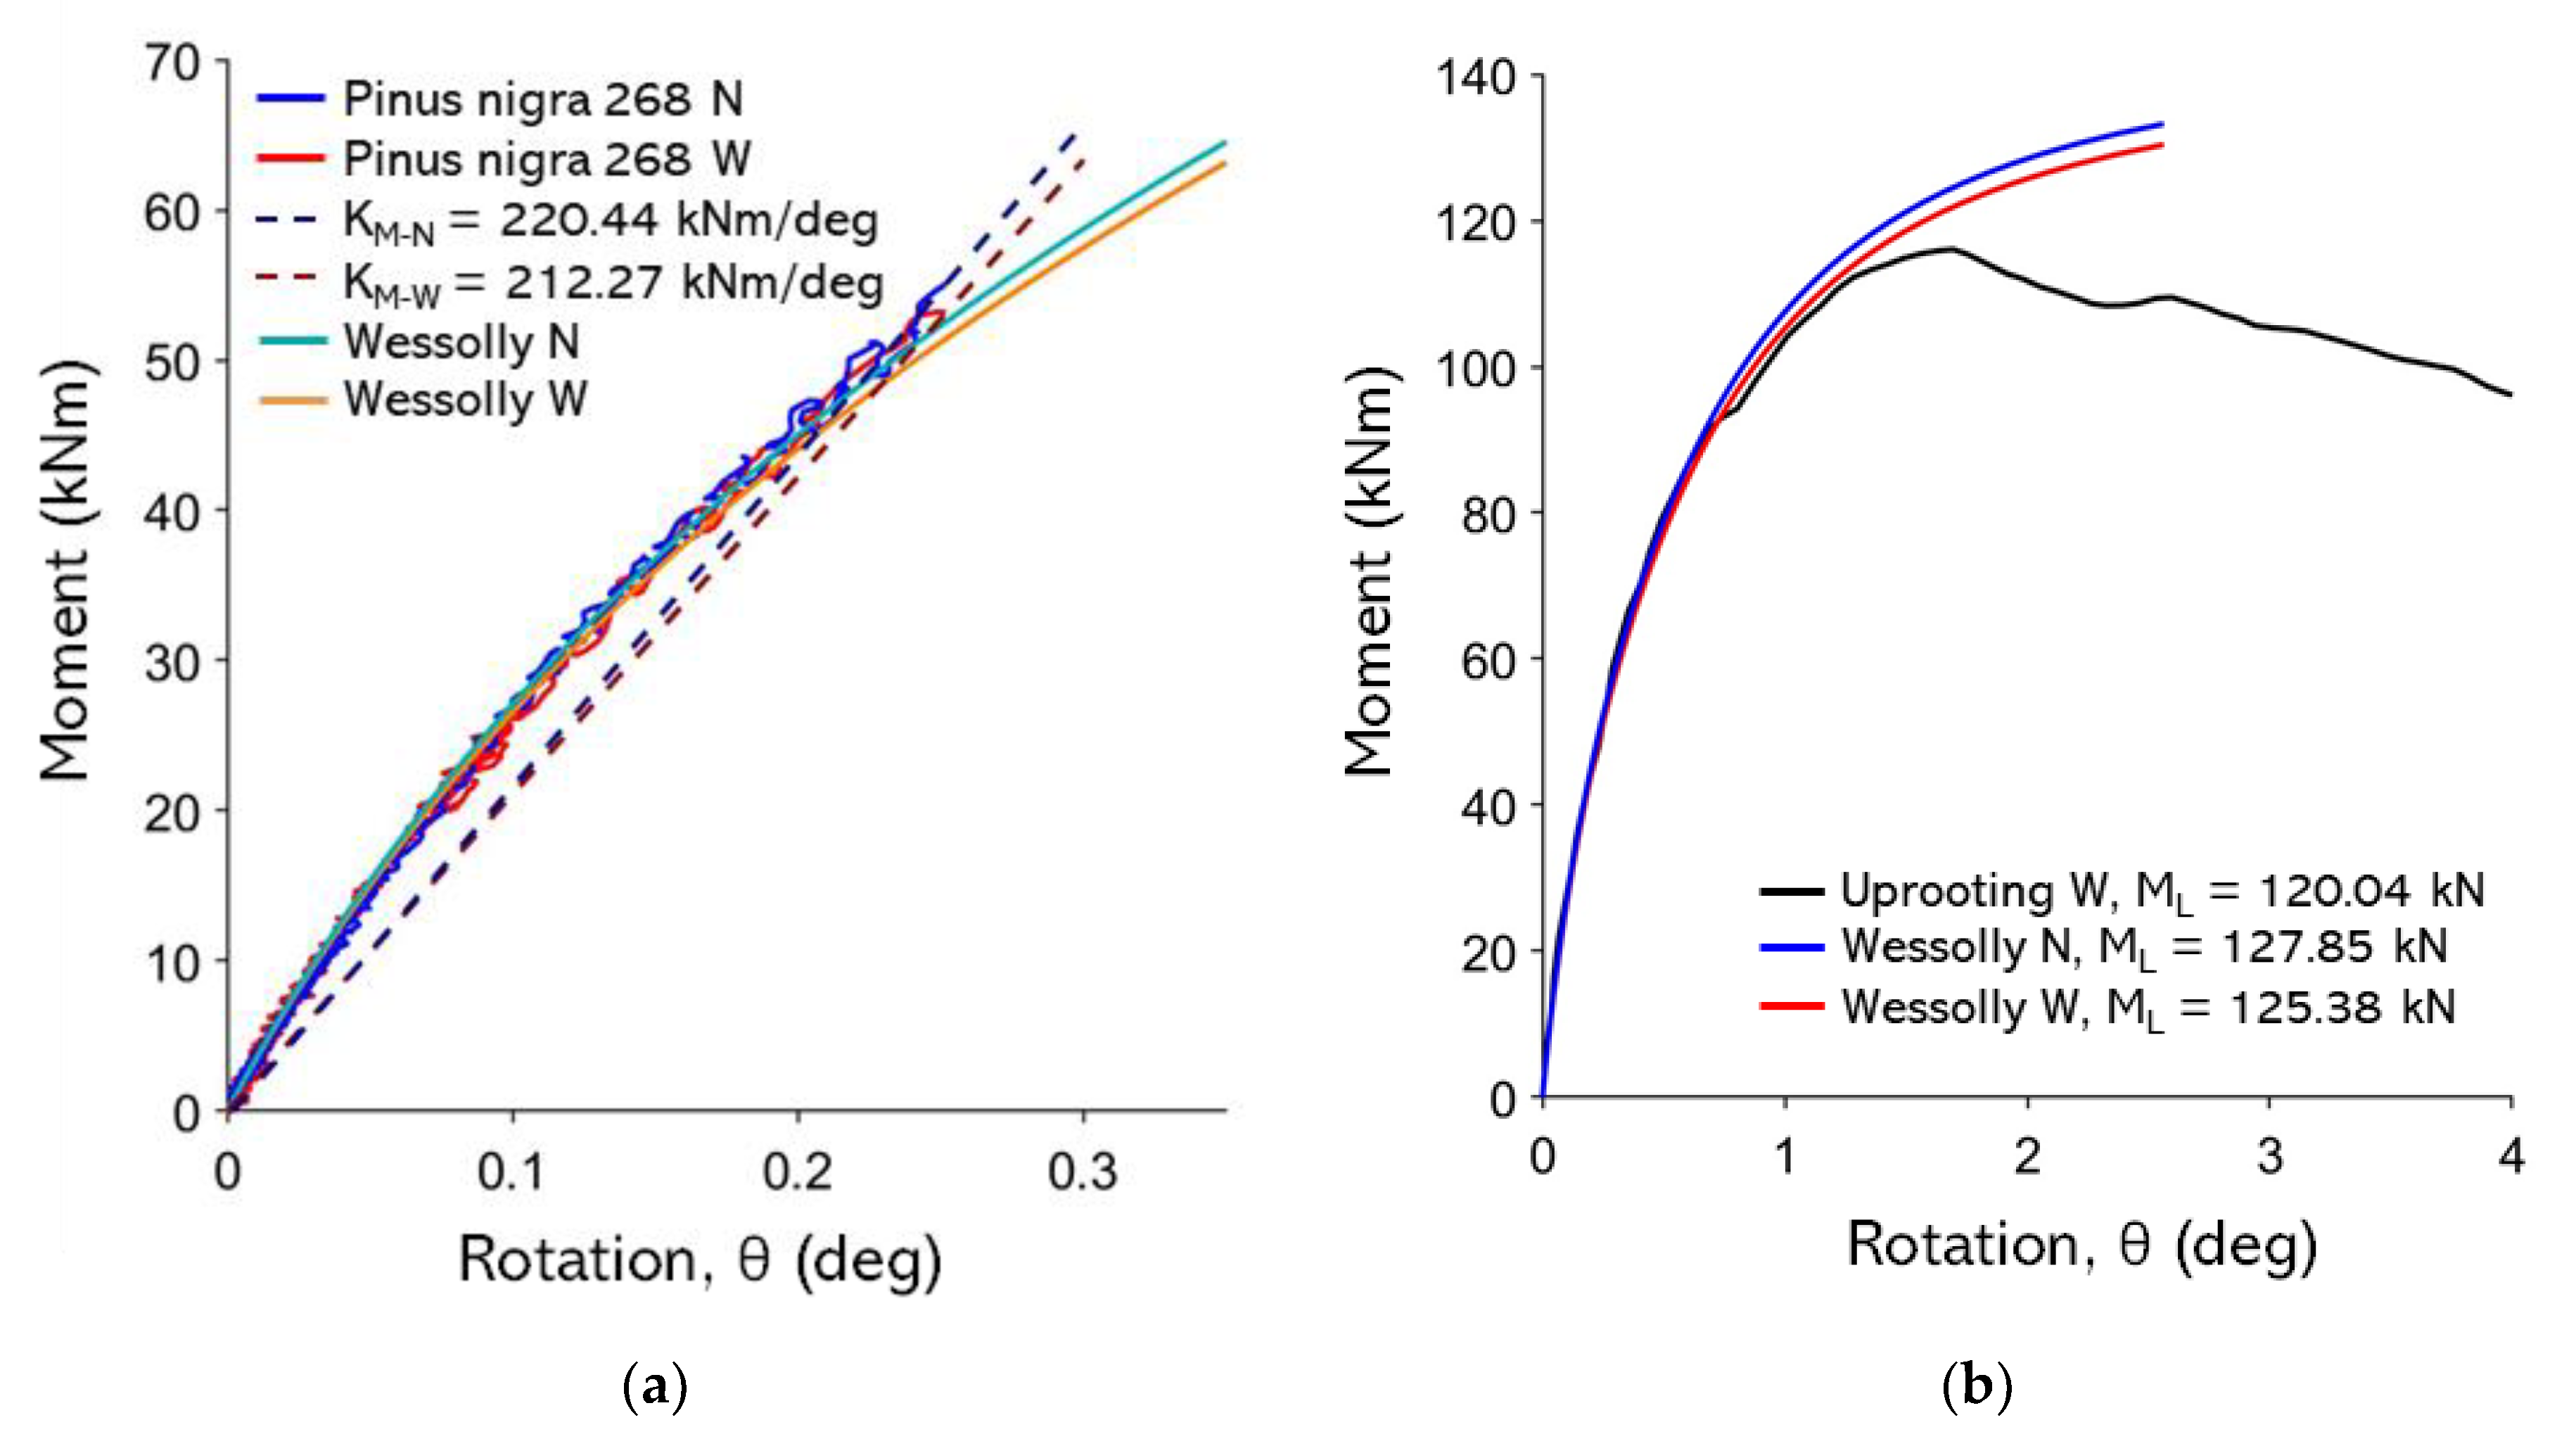
Figure B10.
non-destructive test curves with Wessolly interpolation and stiffness; (b) Comparison of extrapolated Wessolly curves with uprooting test. 971 Tsuga.
Figure B10.
non-destructive test curves with Wessolly interpolation and stiffness; (b) Comparison of extrapolated Wessolly curves with uprooting test. 971 Tsuga.
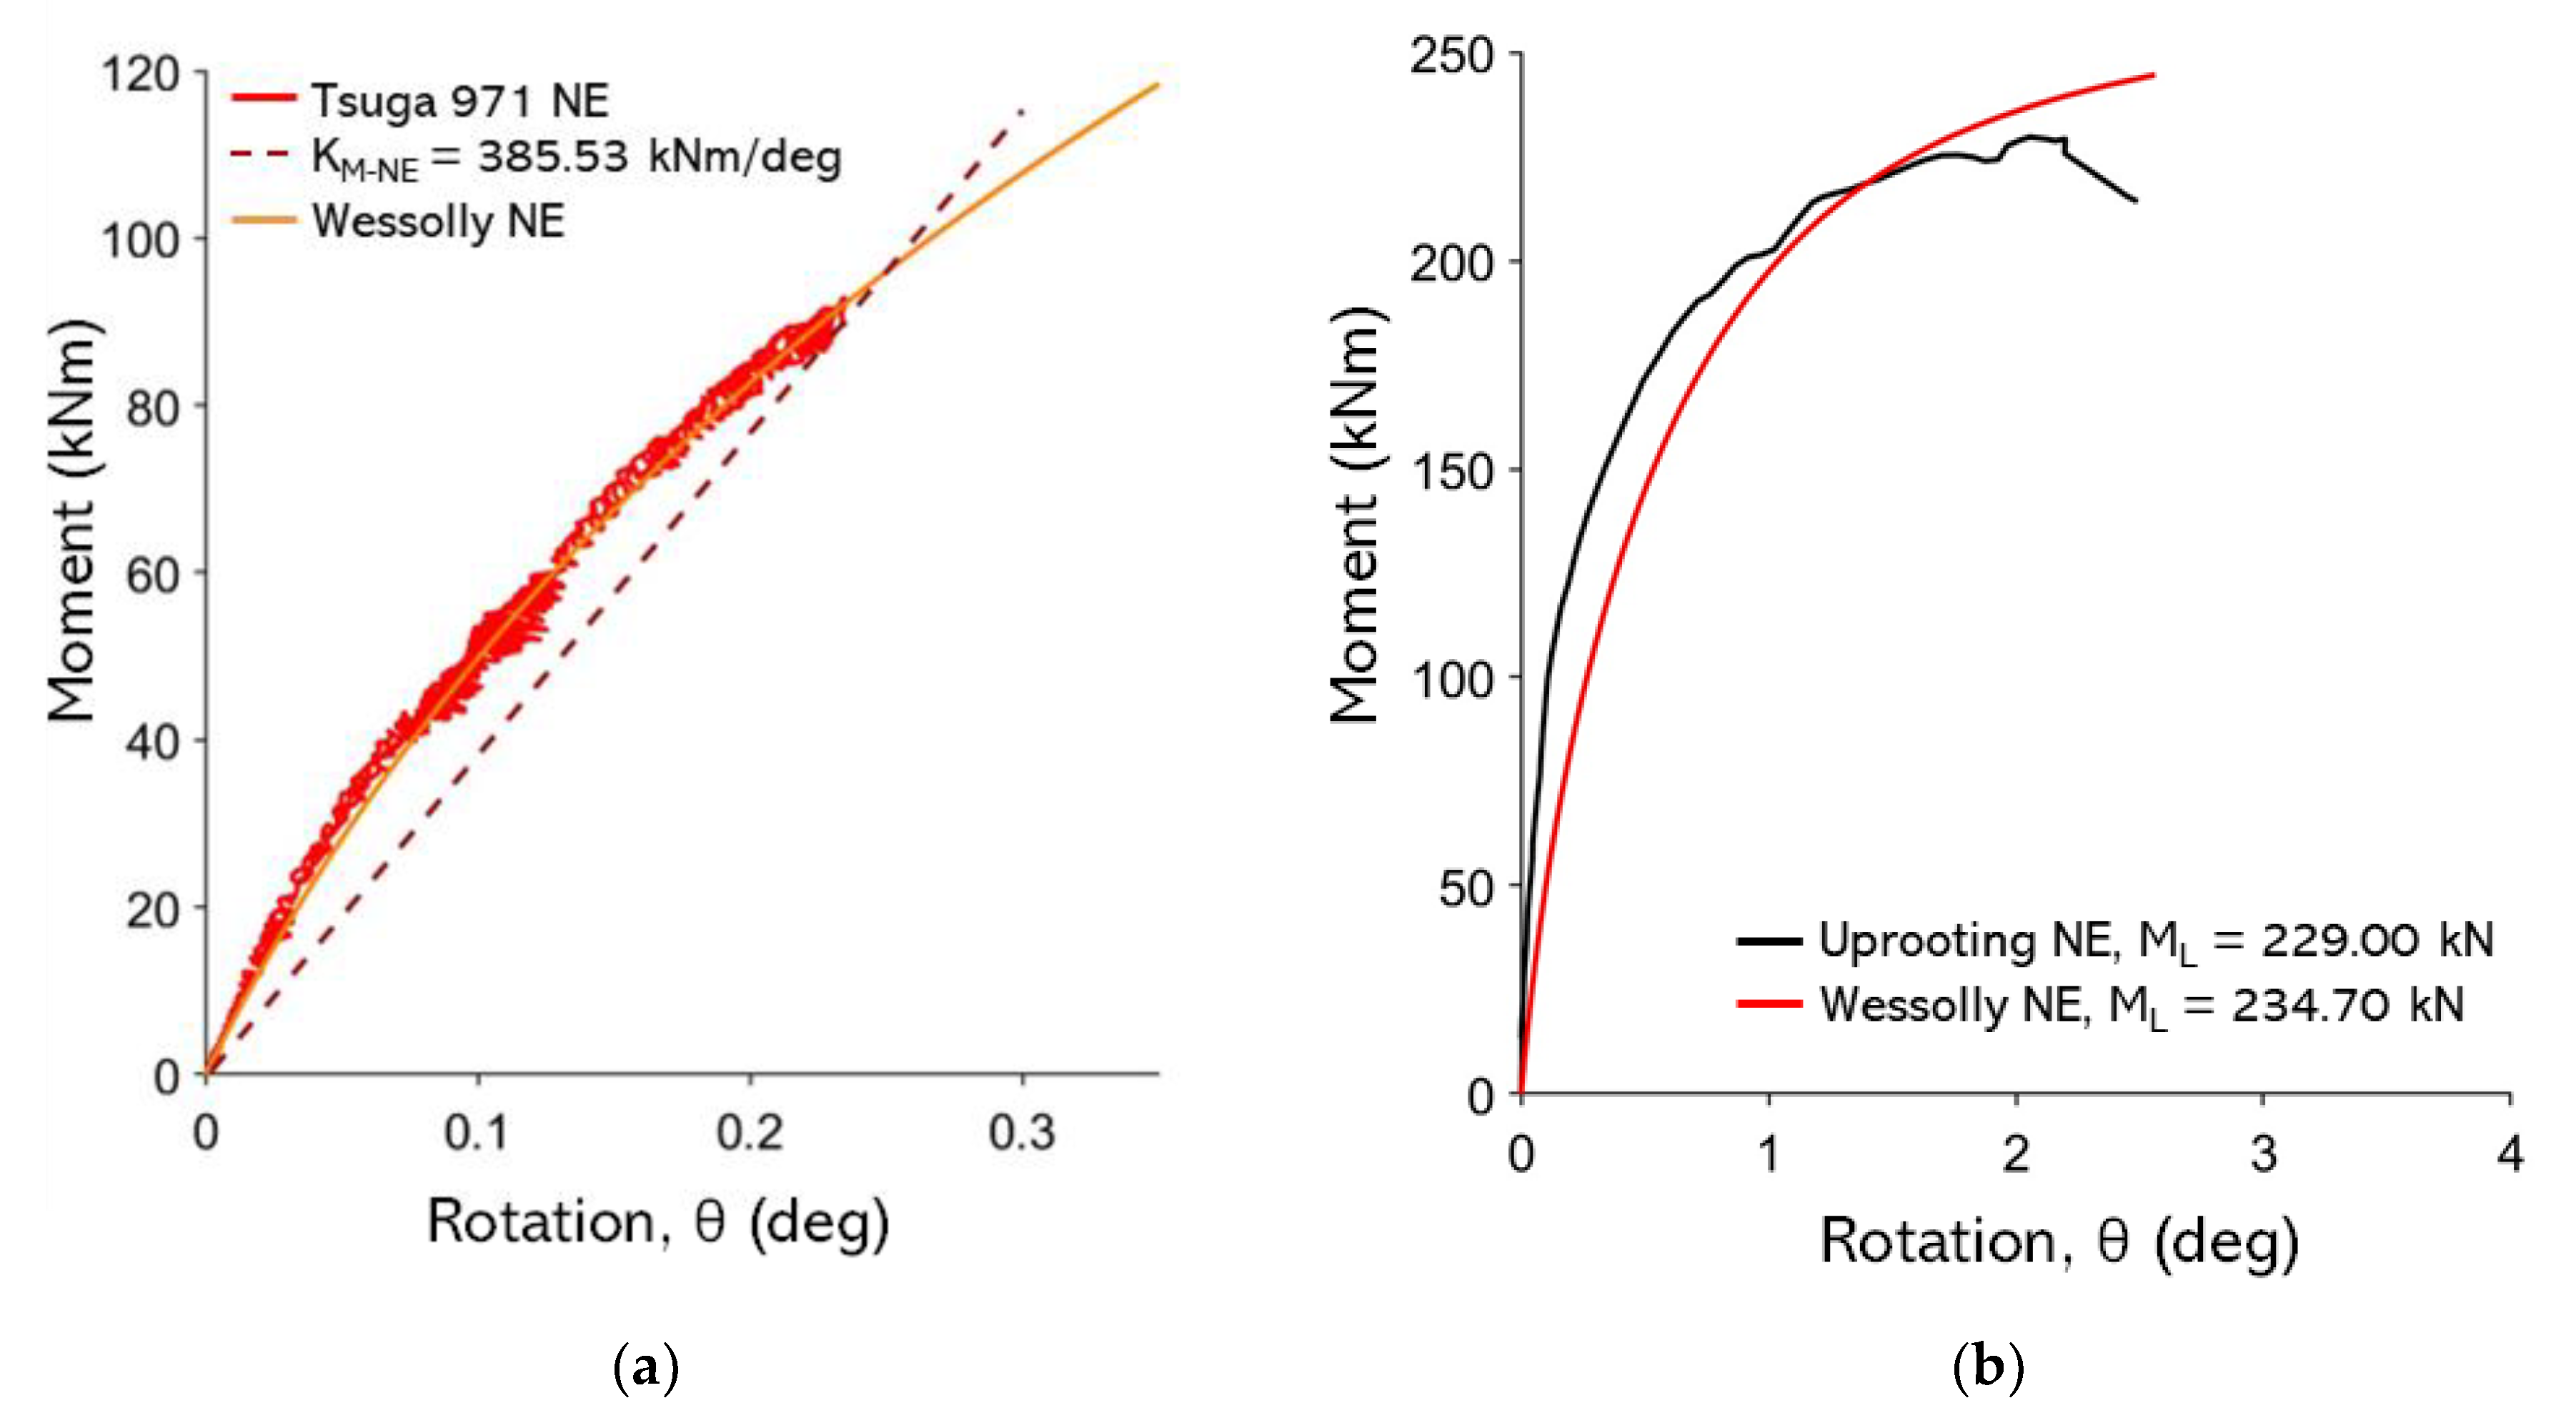
Figure B 11.
non-destructive test curves with Wessolly interpolation and stiffness; (b) Comparison of extrapolated Wessolly curves with uprooting test. 392 Quercus.
Figure B 11.
non-destructive test curves with Wessolly interpolation and stiffness; (b) Comparison of extrapolated Wessolly curves with uprooting test. 392 Quercus.
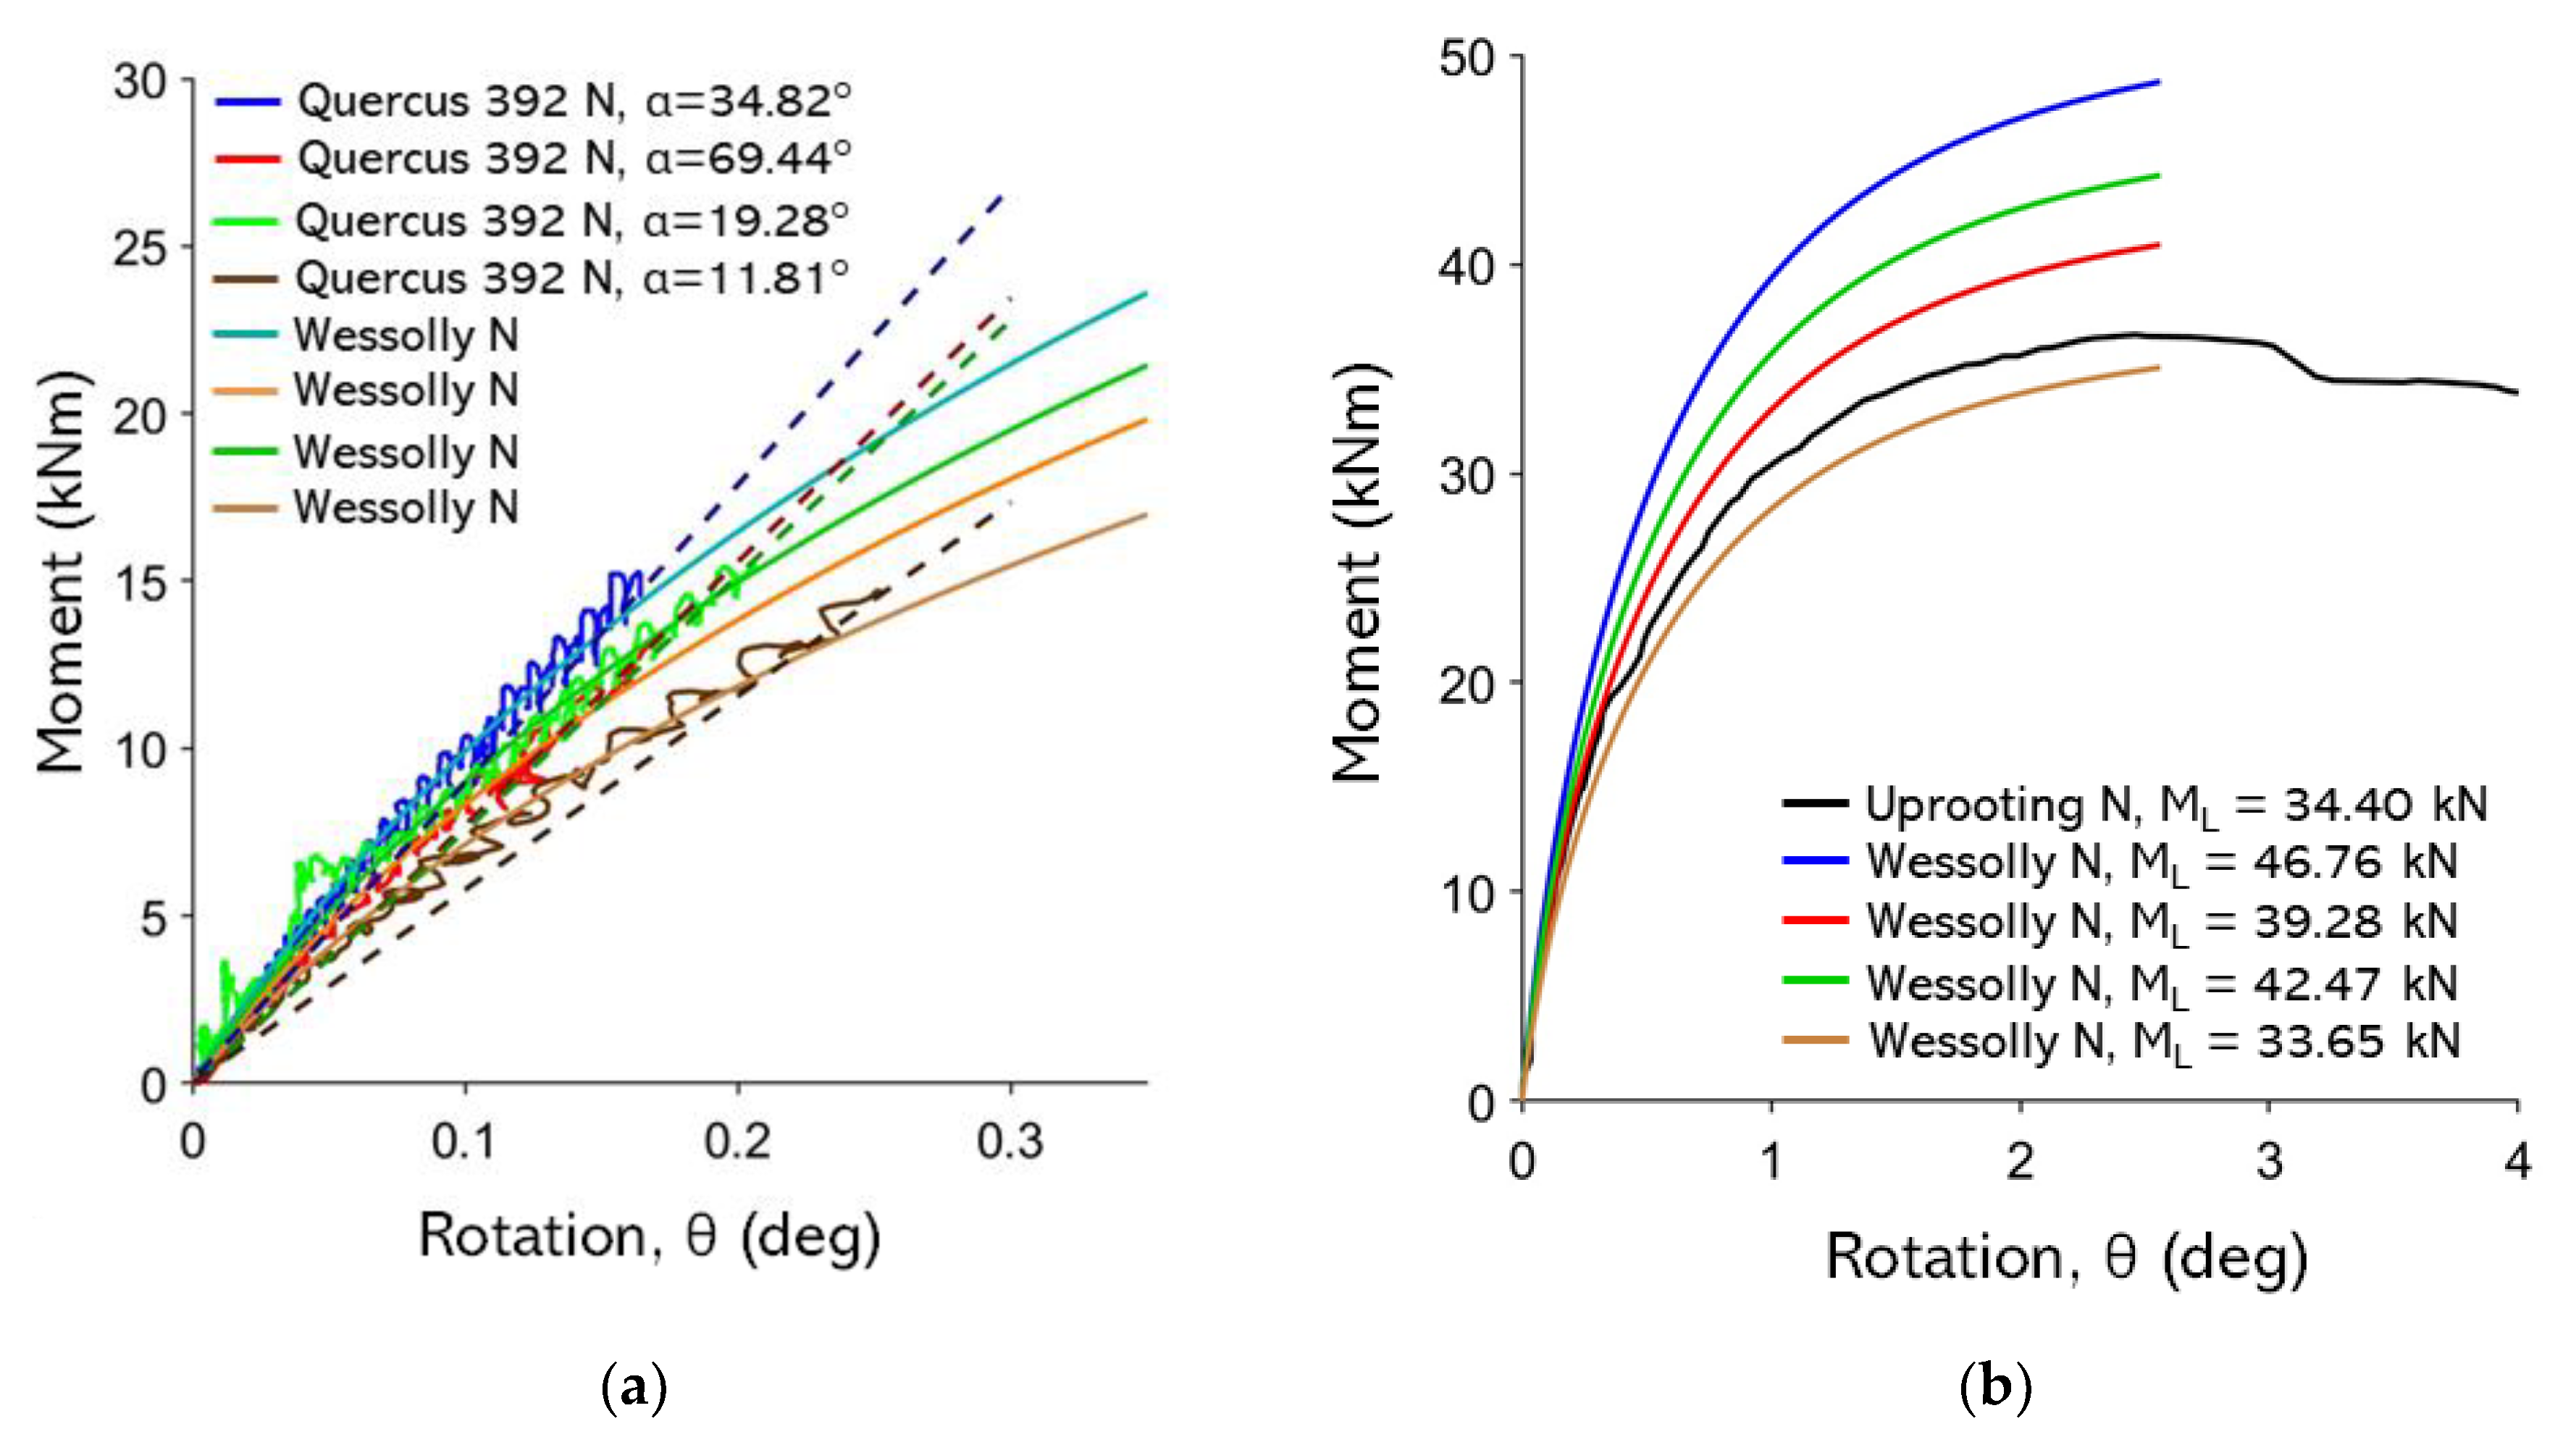
Figure B 12.
non-destructive test curves with Wessolly interpolation and stiffness; (b) Comparison of extrapolated Wessolly curves with uprooting test. 394 Quercus.
Figure B 12.
non-destructive test curves with Wessolly interpolation and stiffness; (b) Comparison of extrapolated Wessolly curves with uprooting test. 394 Quercus.
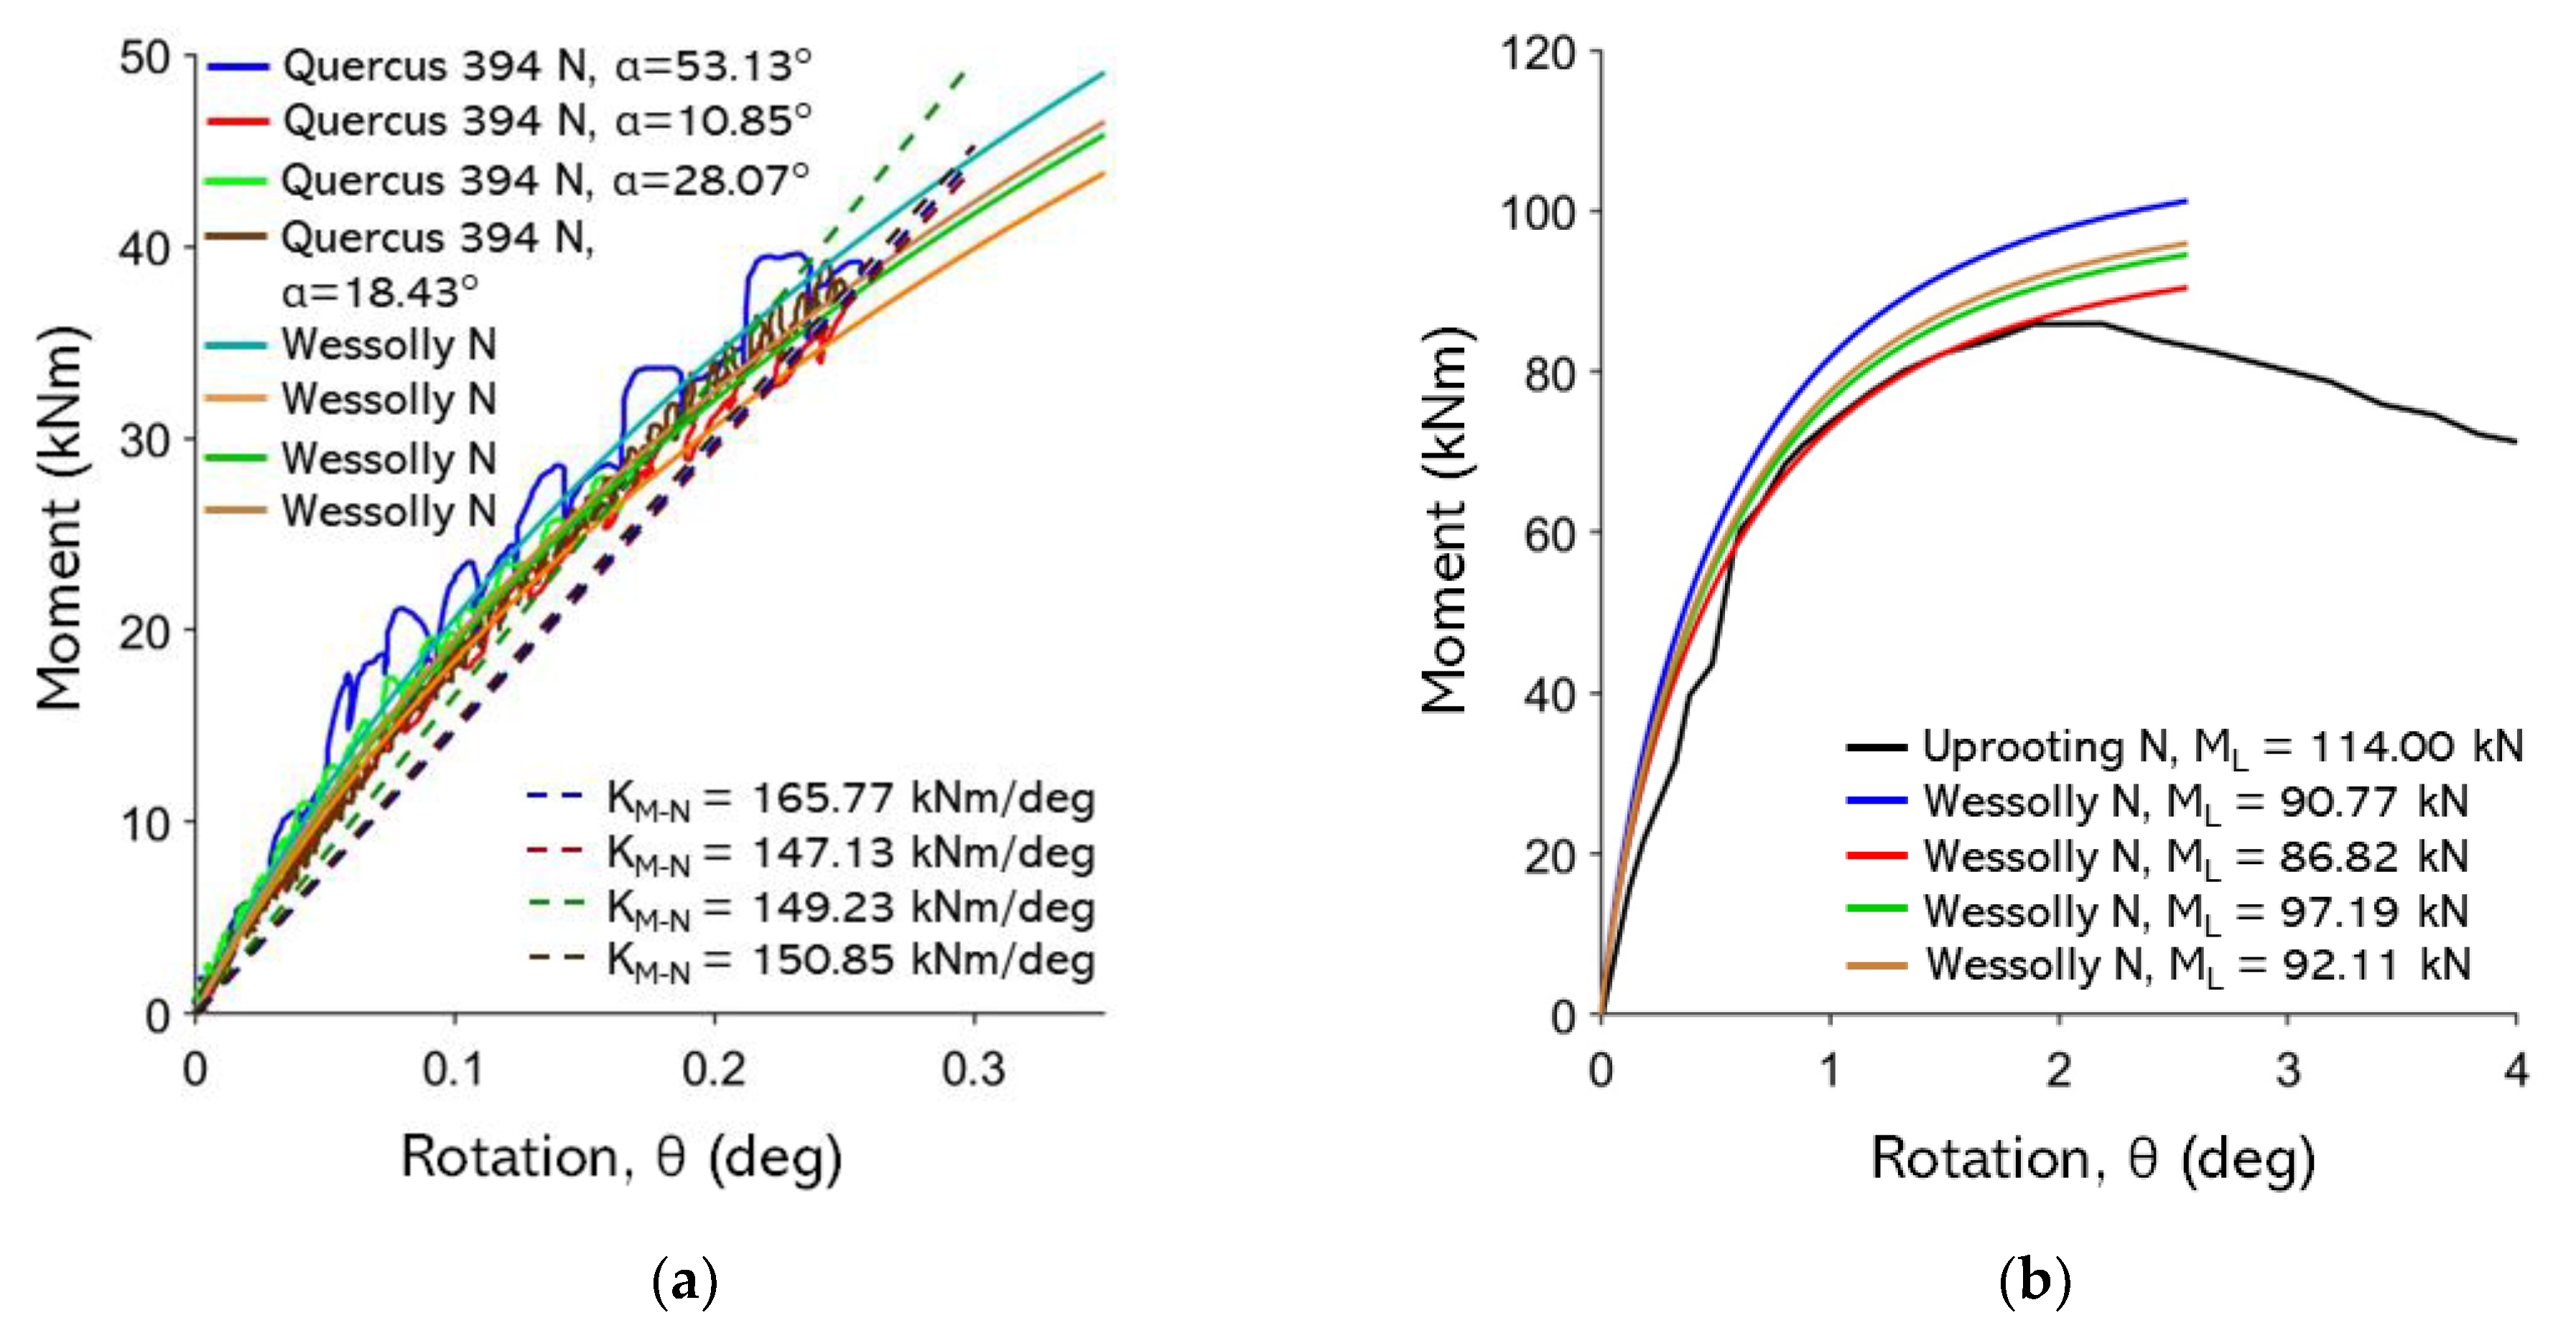
Figure B 13.
non-destructive test curves with Wessolly interpolation and stiffness; (b) Comparison of extrapolated Wessolly curves with uprooting test. 270 Pinus nigra.
Figure B 13.
non-destructive test curves with Wessolly interpolation and stiffness; (b) Comparison of extrapolated Wessolly curves with uprooting test. 270 Pinus nigra.
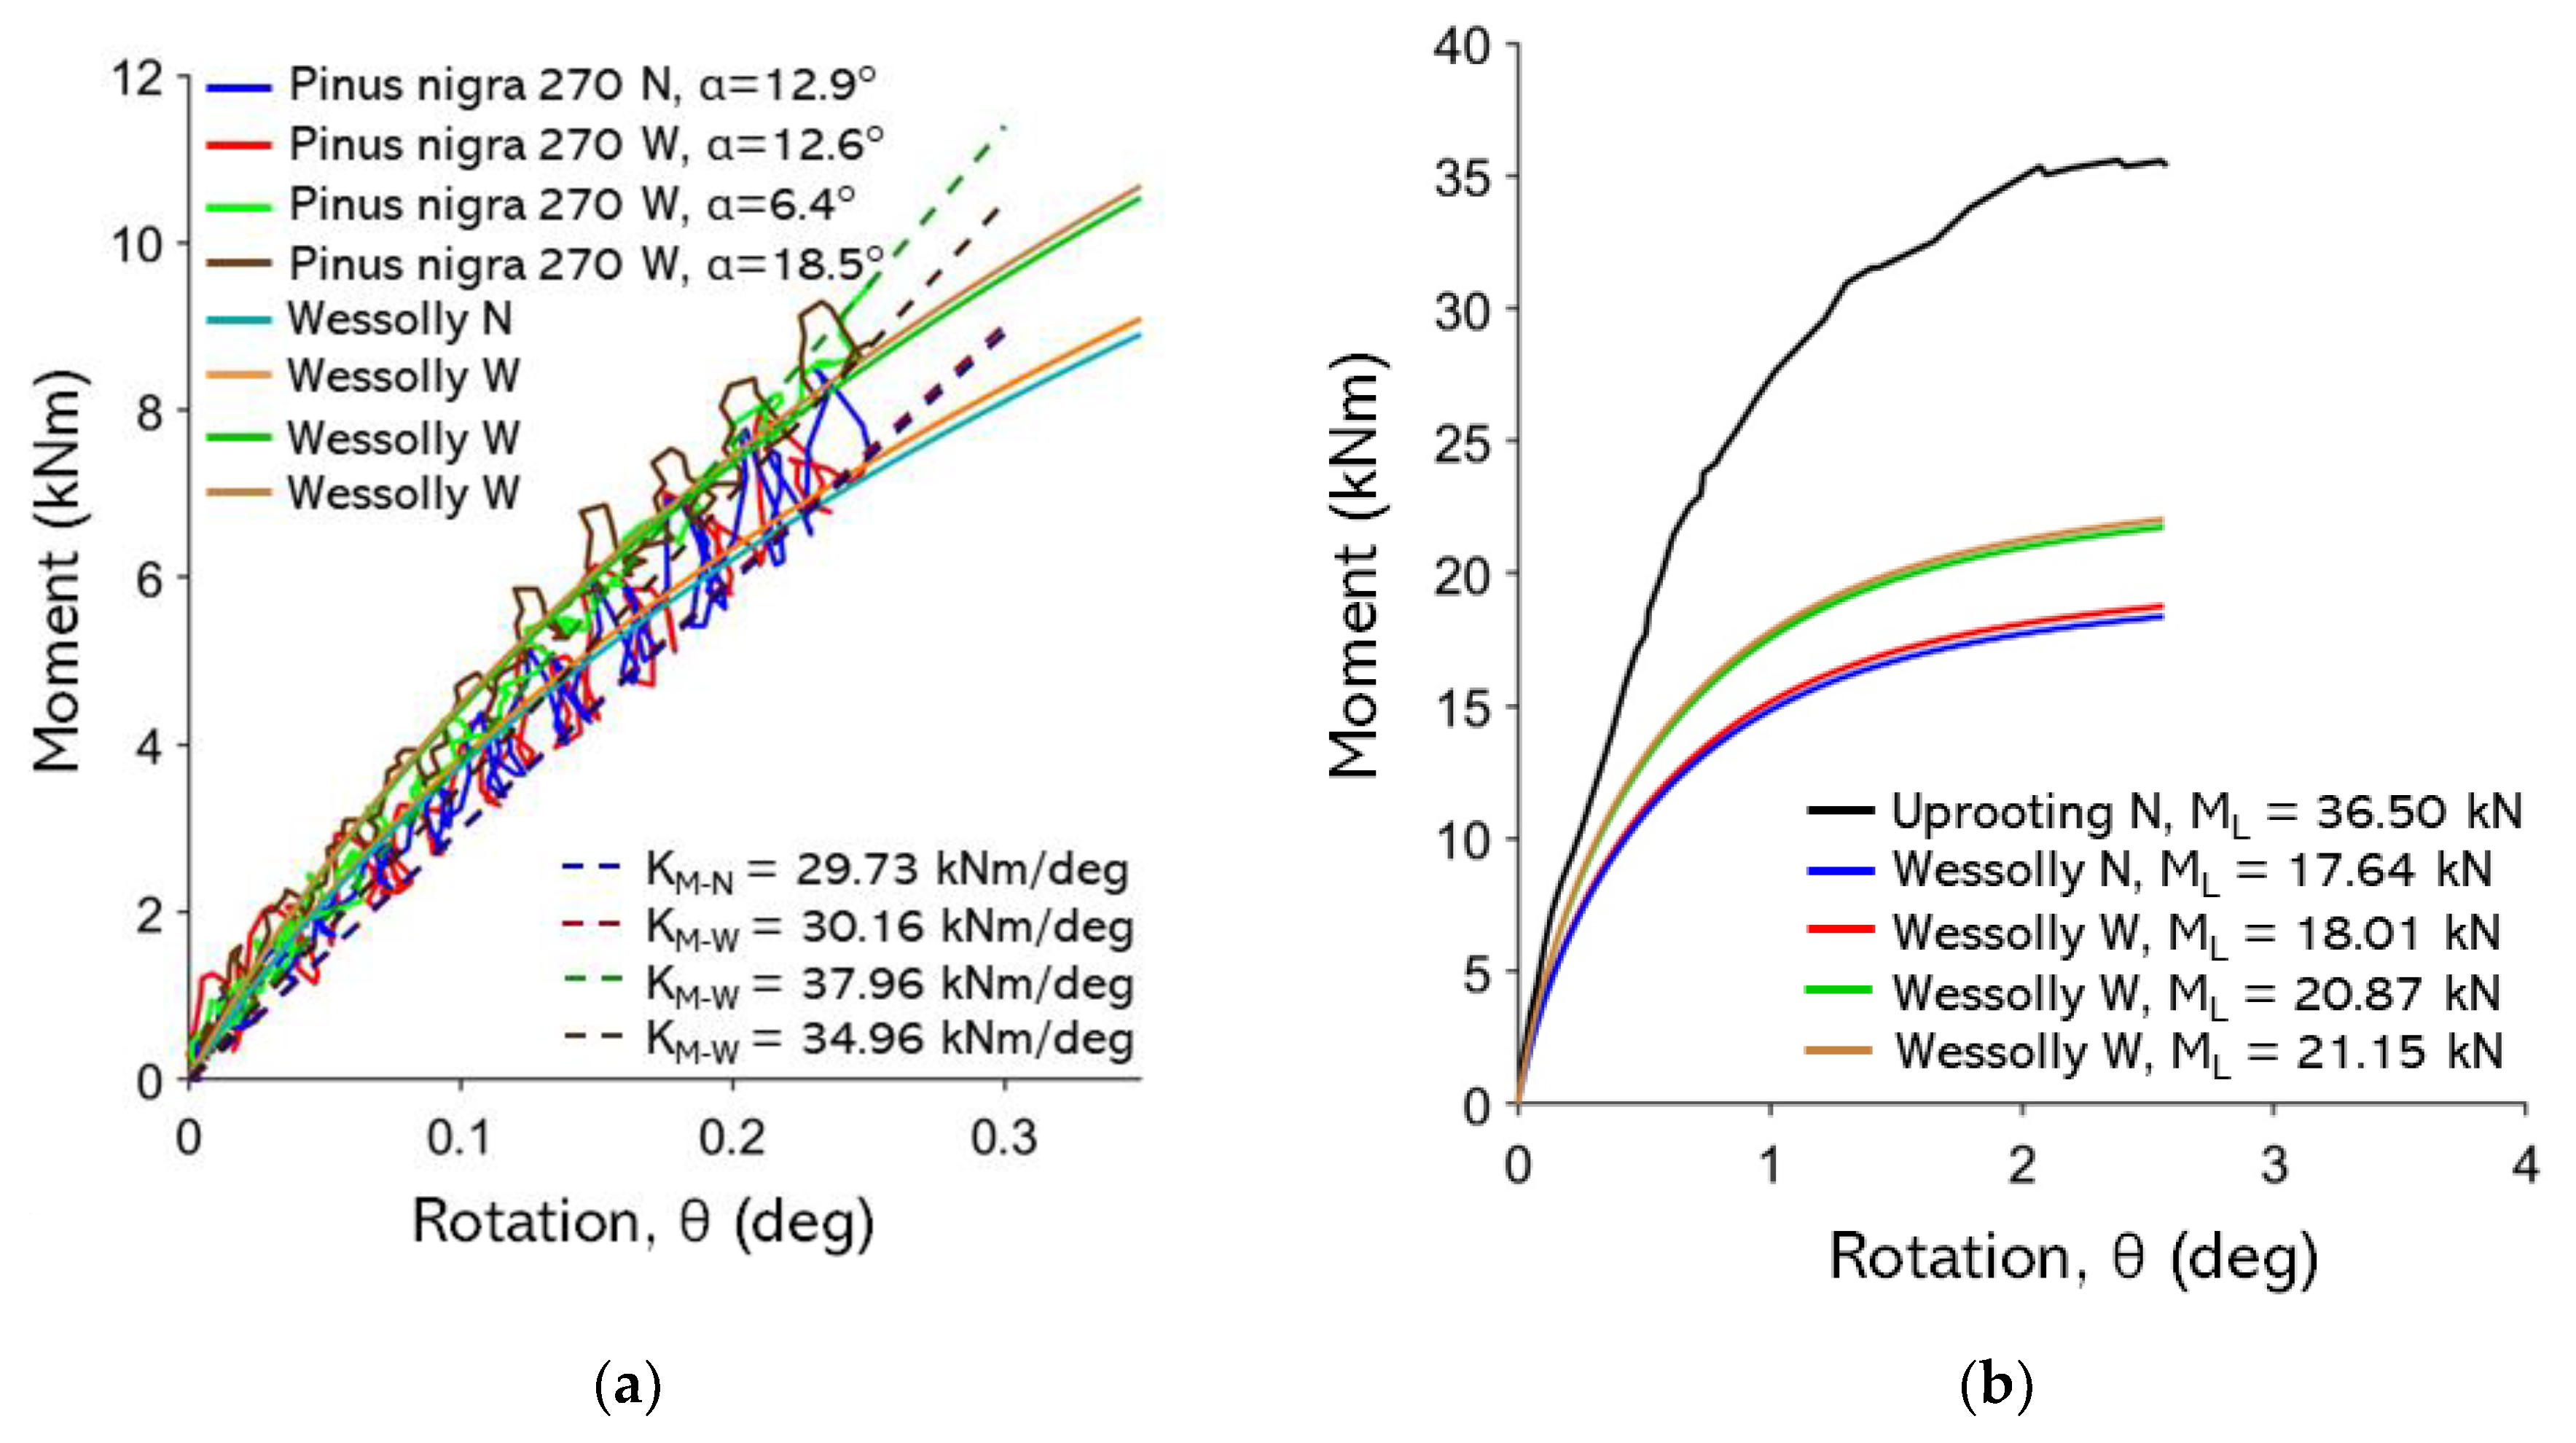
Figure B 14.
non-destructive test curves with Wessolly interpolation and stiffness; (b) Comparison of extrapolated Wessolly curves with uprooting test. 258 Pinus nigra.
Figure B 14.
non-destructive test curves with Wessolly interpolation and stiffness; (b) Comparison of extrapolated Wessolly curves with uprooting test. 258 Pinus nigra.
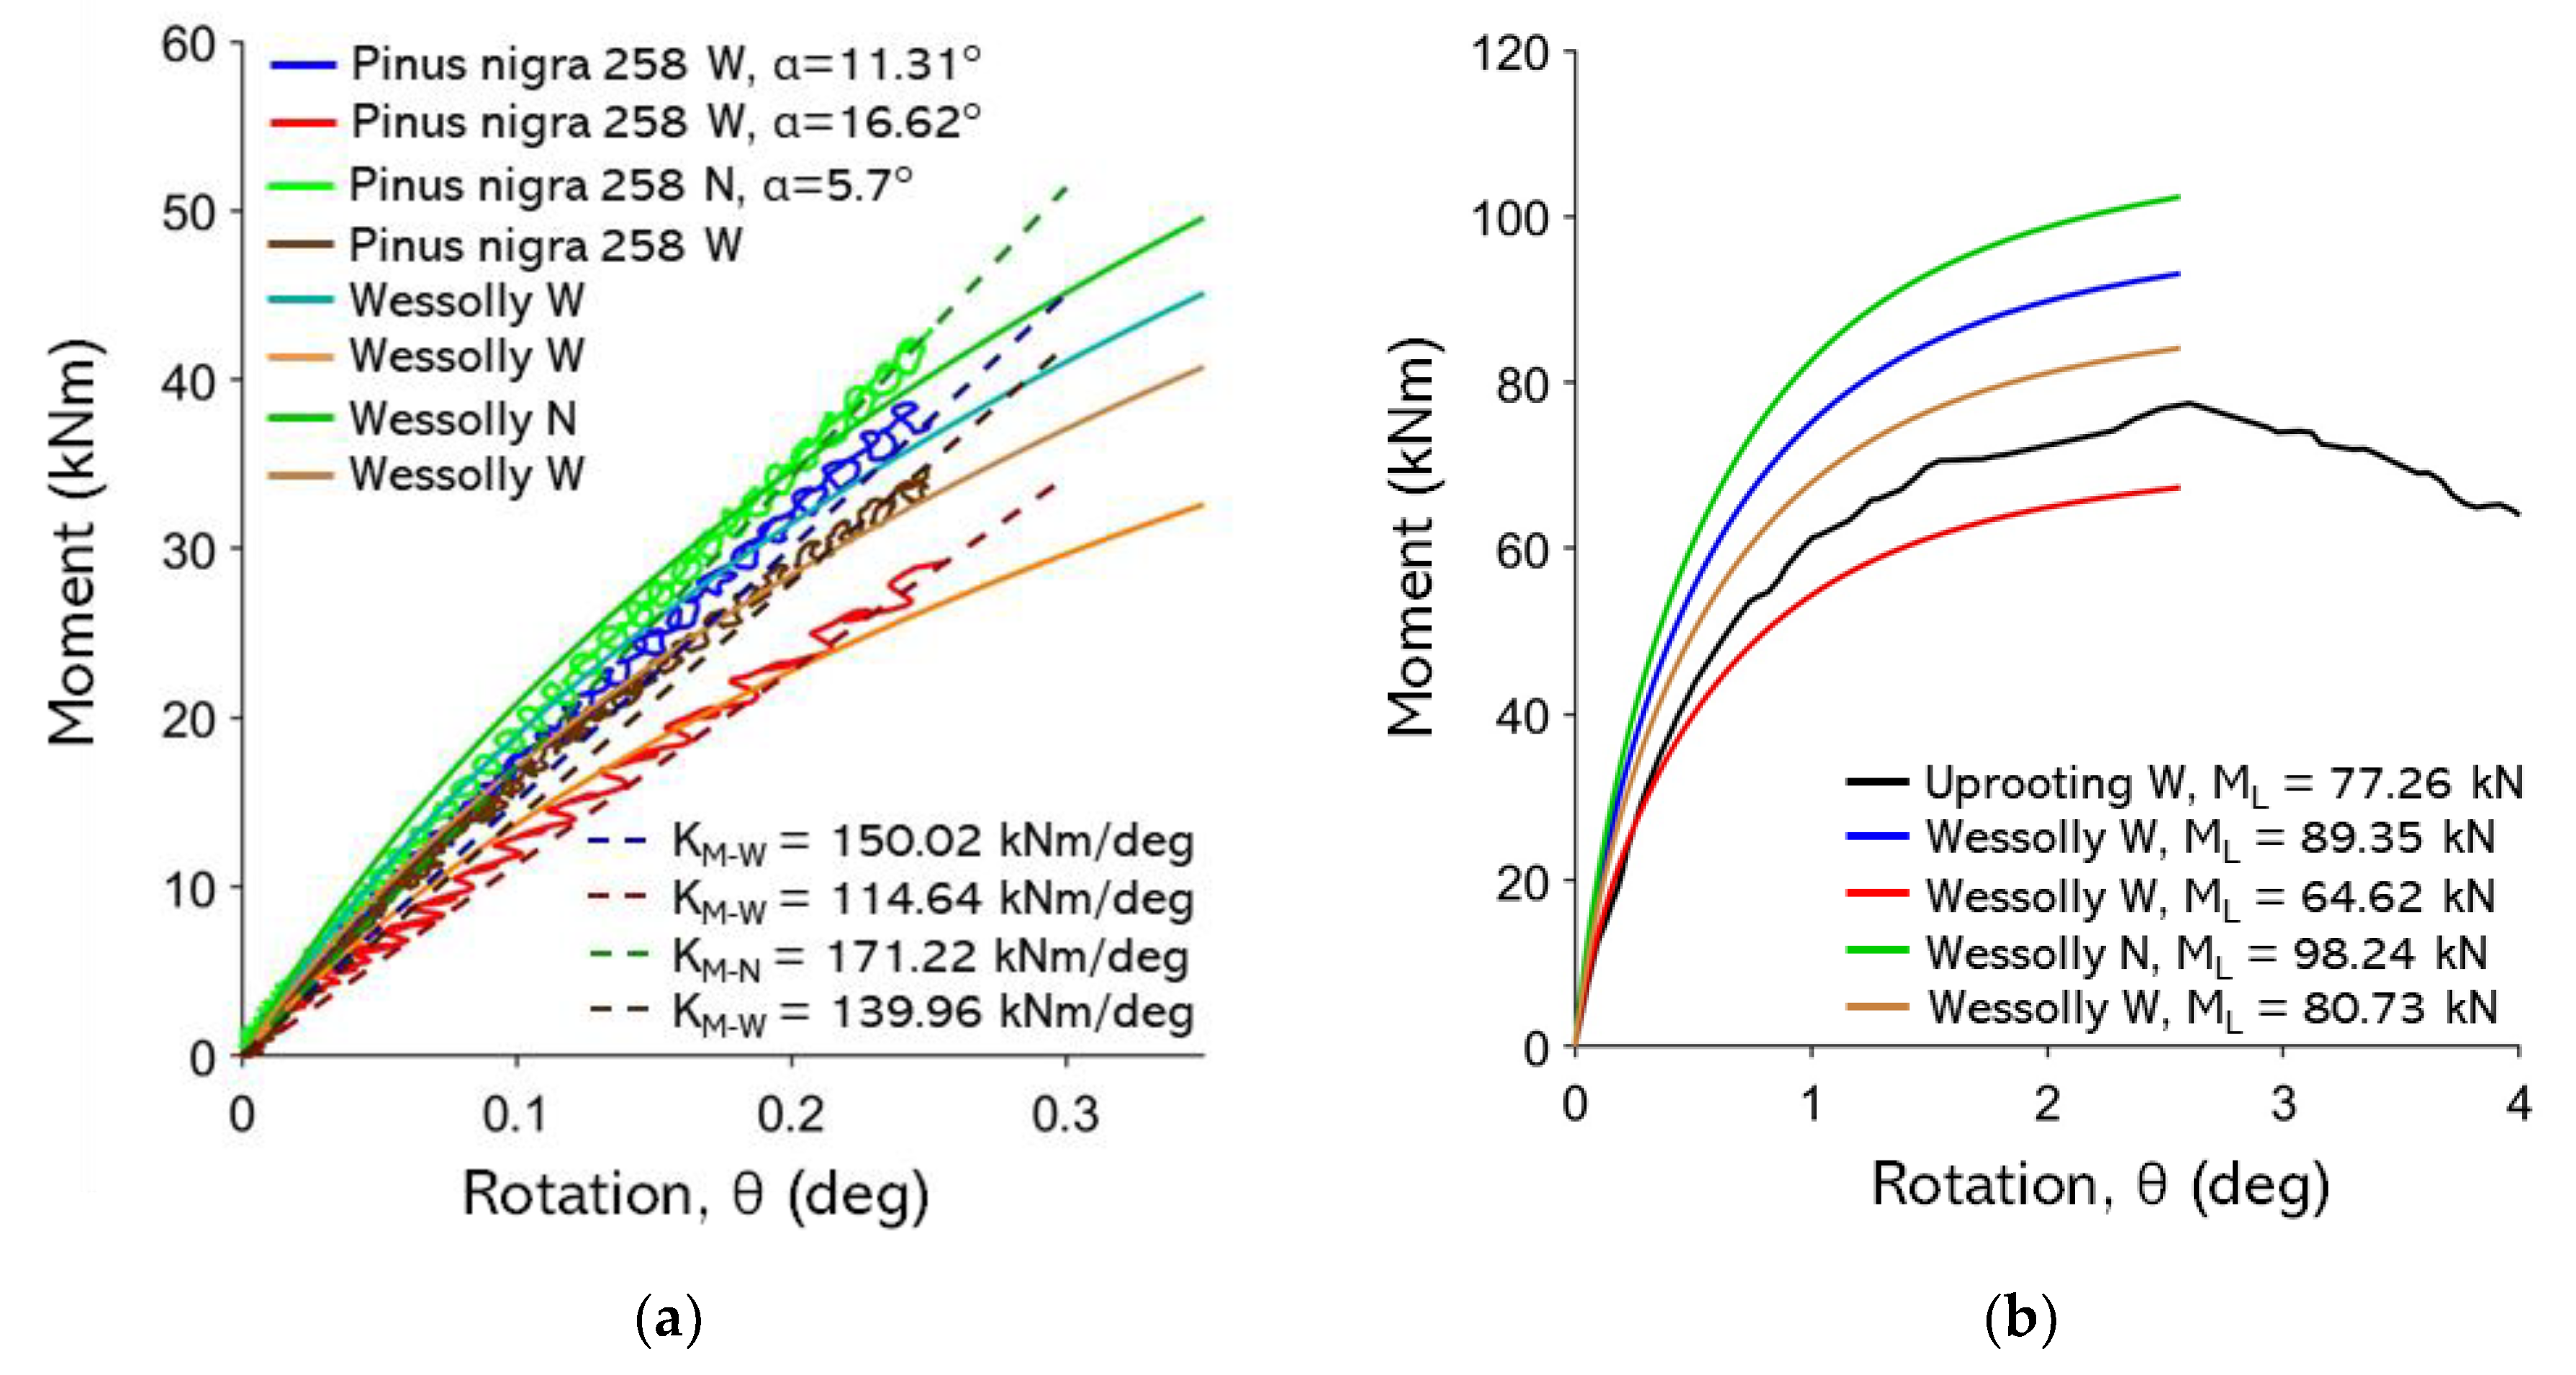
Figure B 15.
non-destructive test curves with Wessolly interpolation and stiffness; (b) Comparison of extrapolated Wessolly curves with uprooting test. 158 Picea abies.
Figure B 15.
non-destructive test curves with Wessolly interpolation and stiffness; (b) Comparison of extrapolated Wessolly curves with uprooting test. 158 Picea abies.
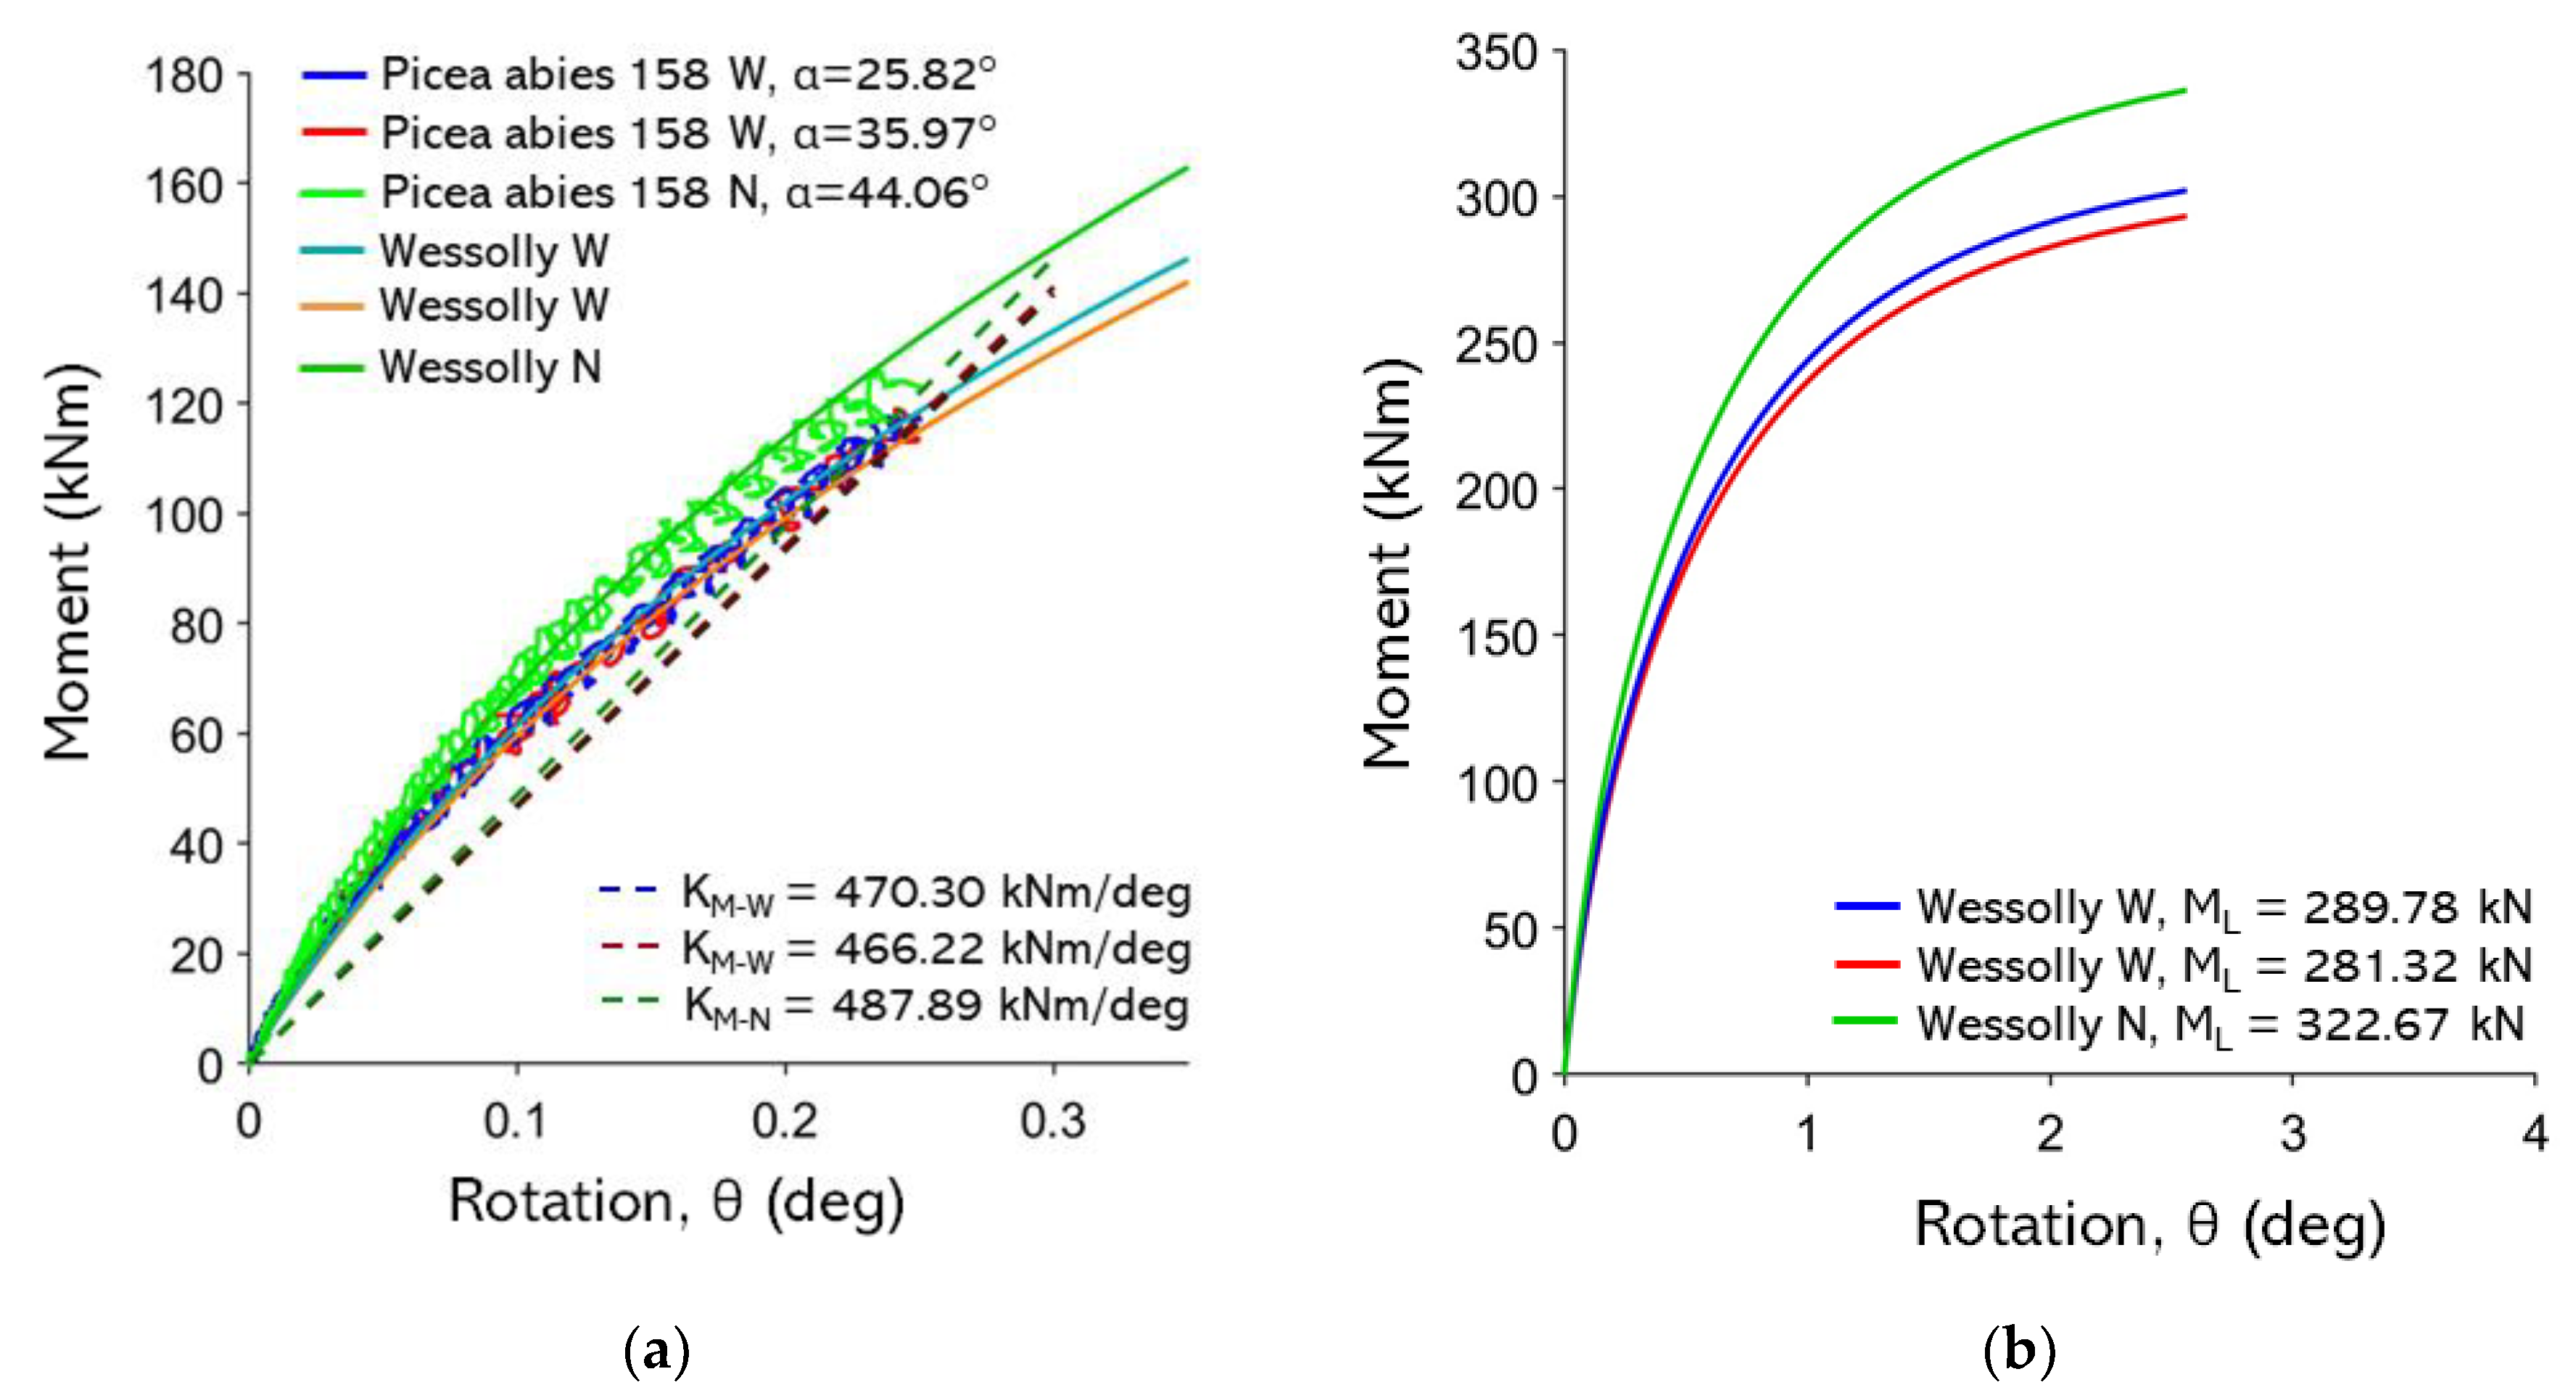
Figure B 16.
non-destructive test curves with Wessolly interpolation and stiffness; (b) Comparison of extrapolated Wessolly curves with uprooting test. 142 Pinus nigra.
Figure B 16.
non-destructive test curves with Wessolly interpolation and stiffness; (b) Comparison of extrapolated Wessolly curves with uprooting test. 142 Pinus nigra.
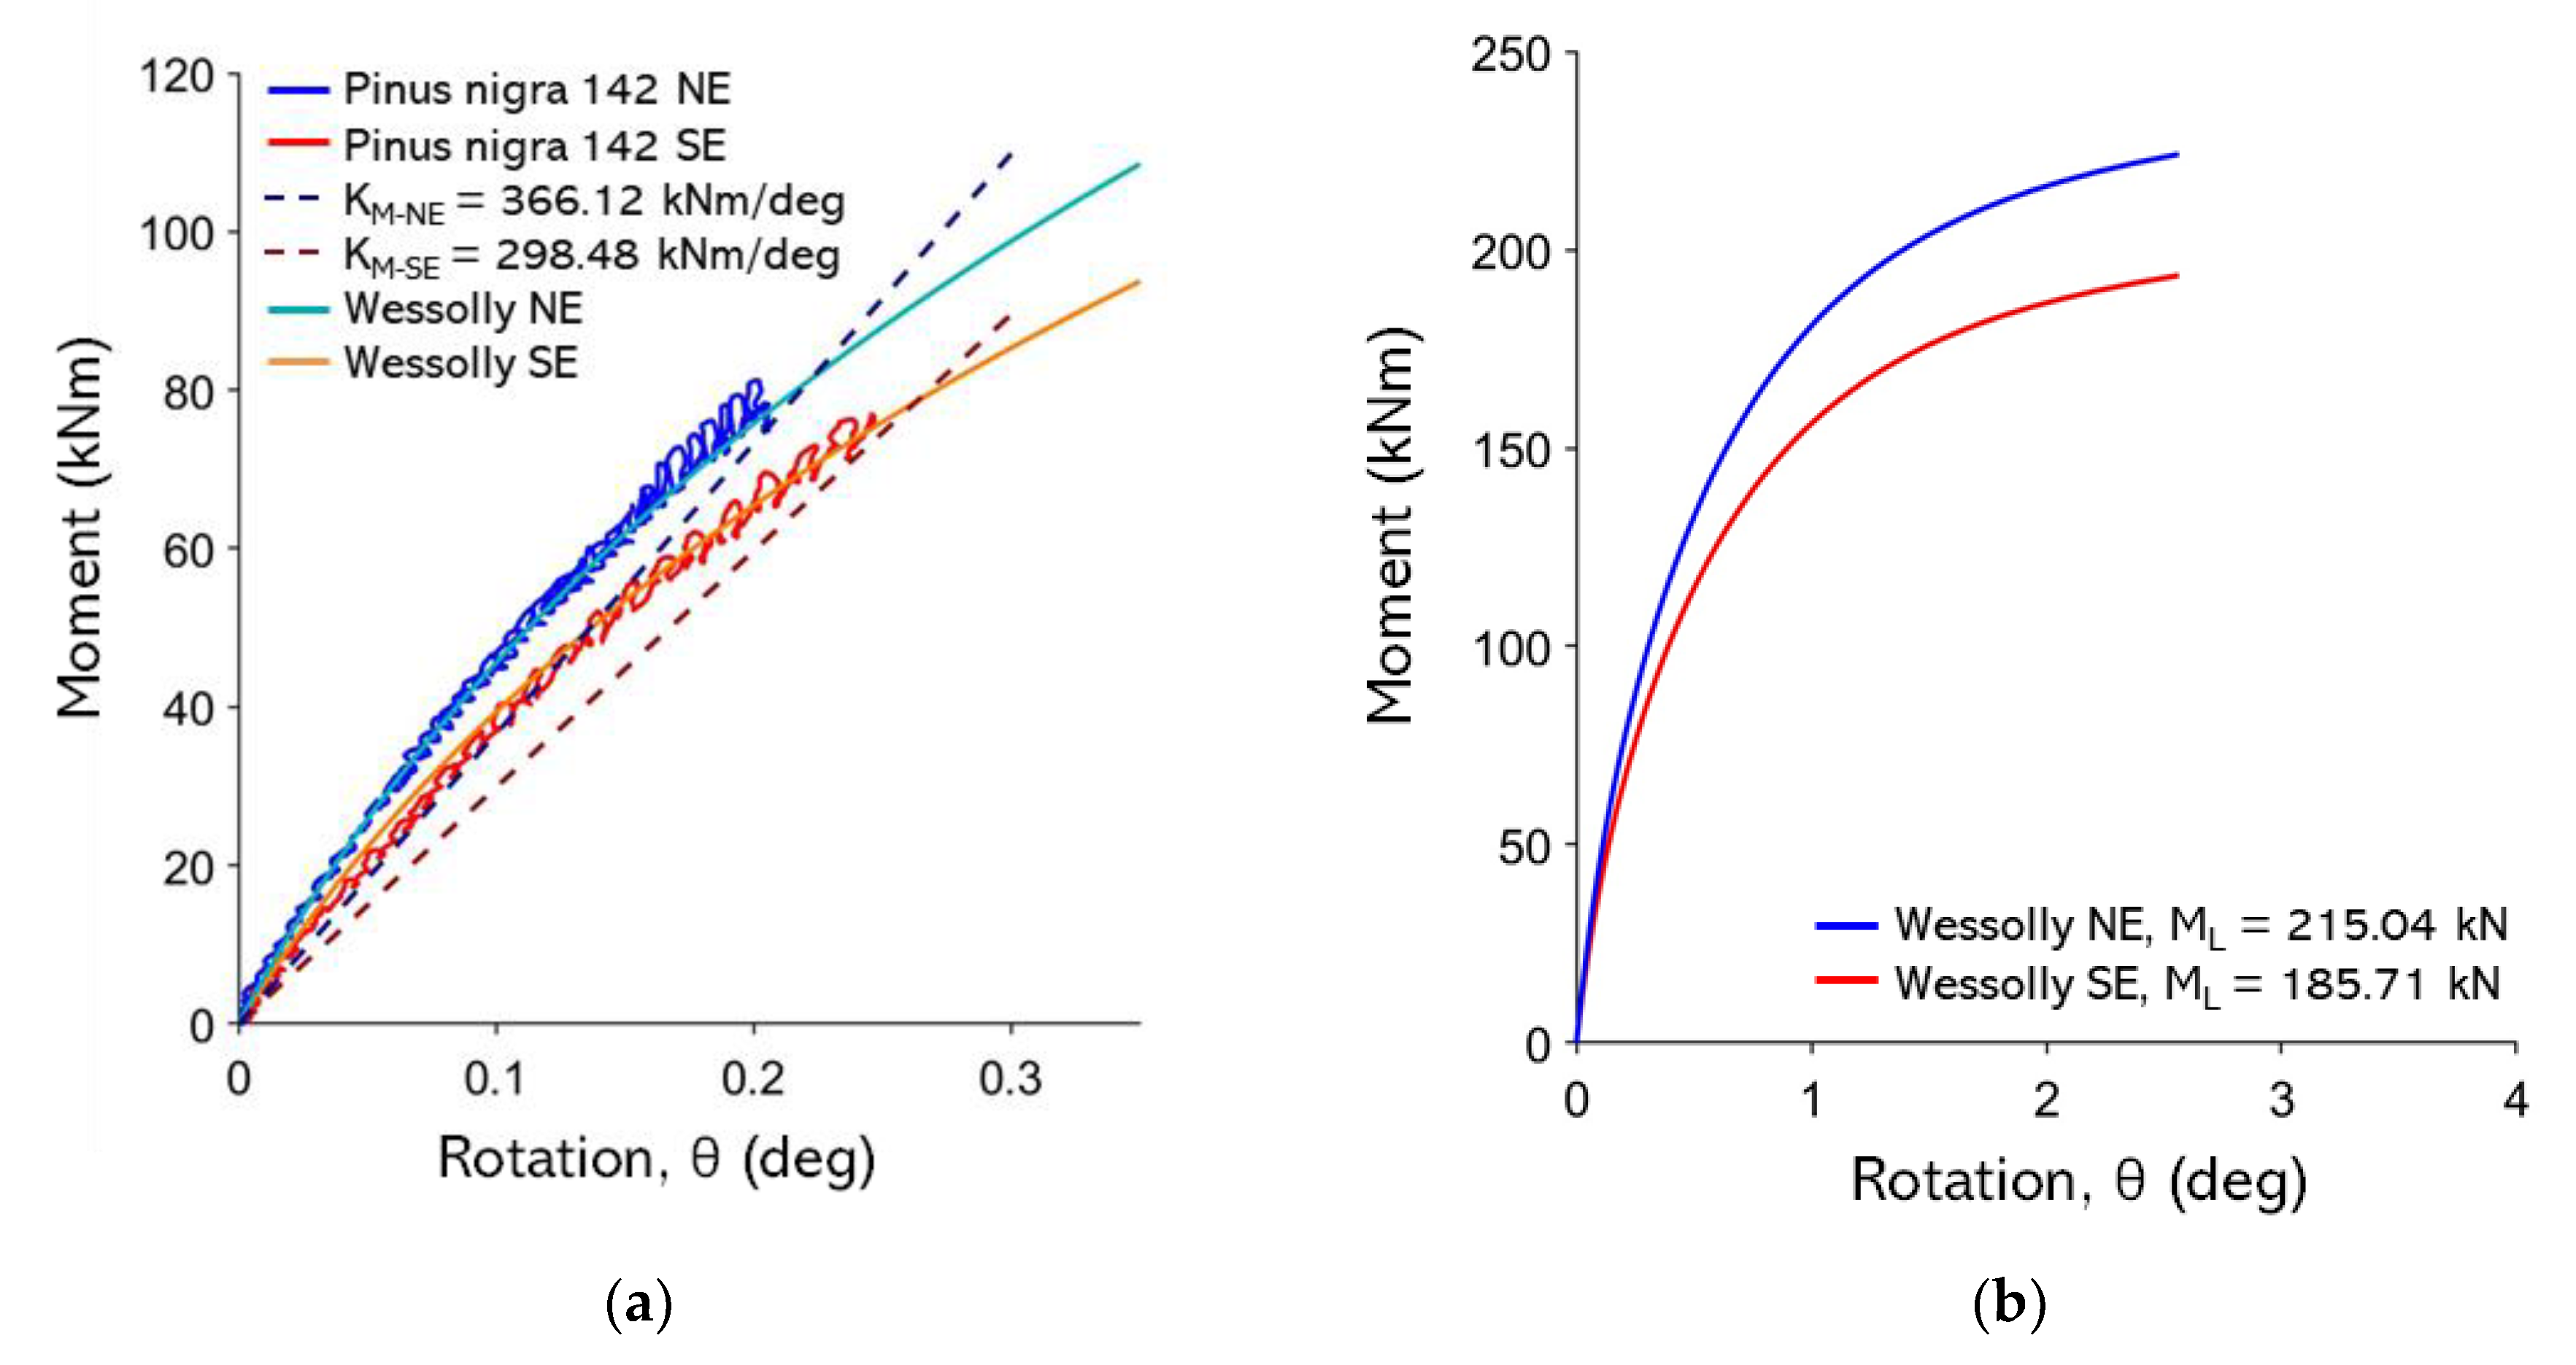
Figure B 17.
non-destructive test curves with Wessolly interpolation and stiffness; (b) Comparison of extrapolated Wessolly curves with uprooting test. 451 Acer platanoides.
Figure B 17.
non-destructive test curves with Wessolly interpolation and stiffness; (b) Comparison of extrapolated Wessolly curves with uprooting test. 451 Acer platanoides.
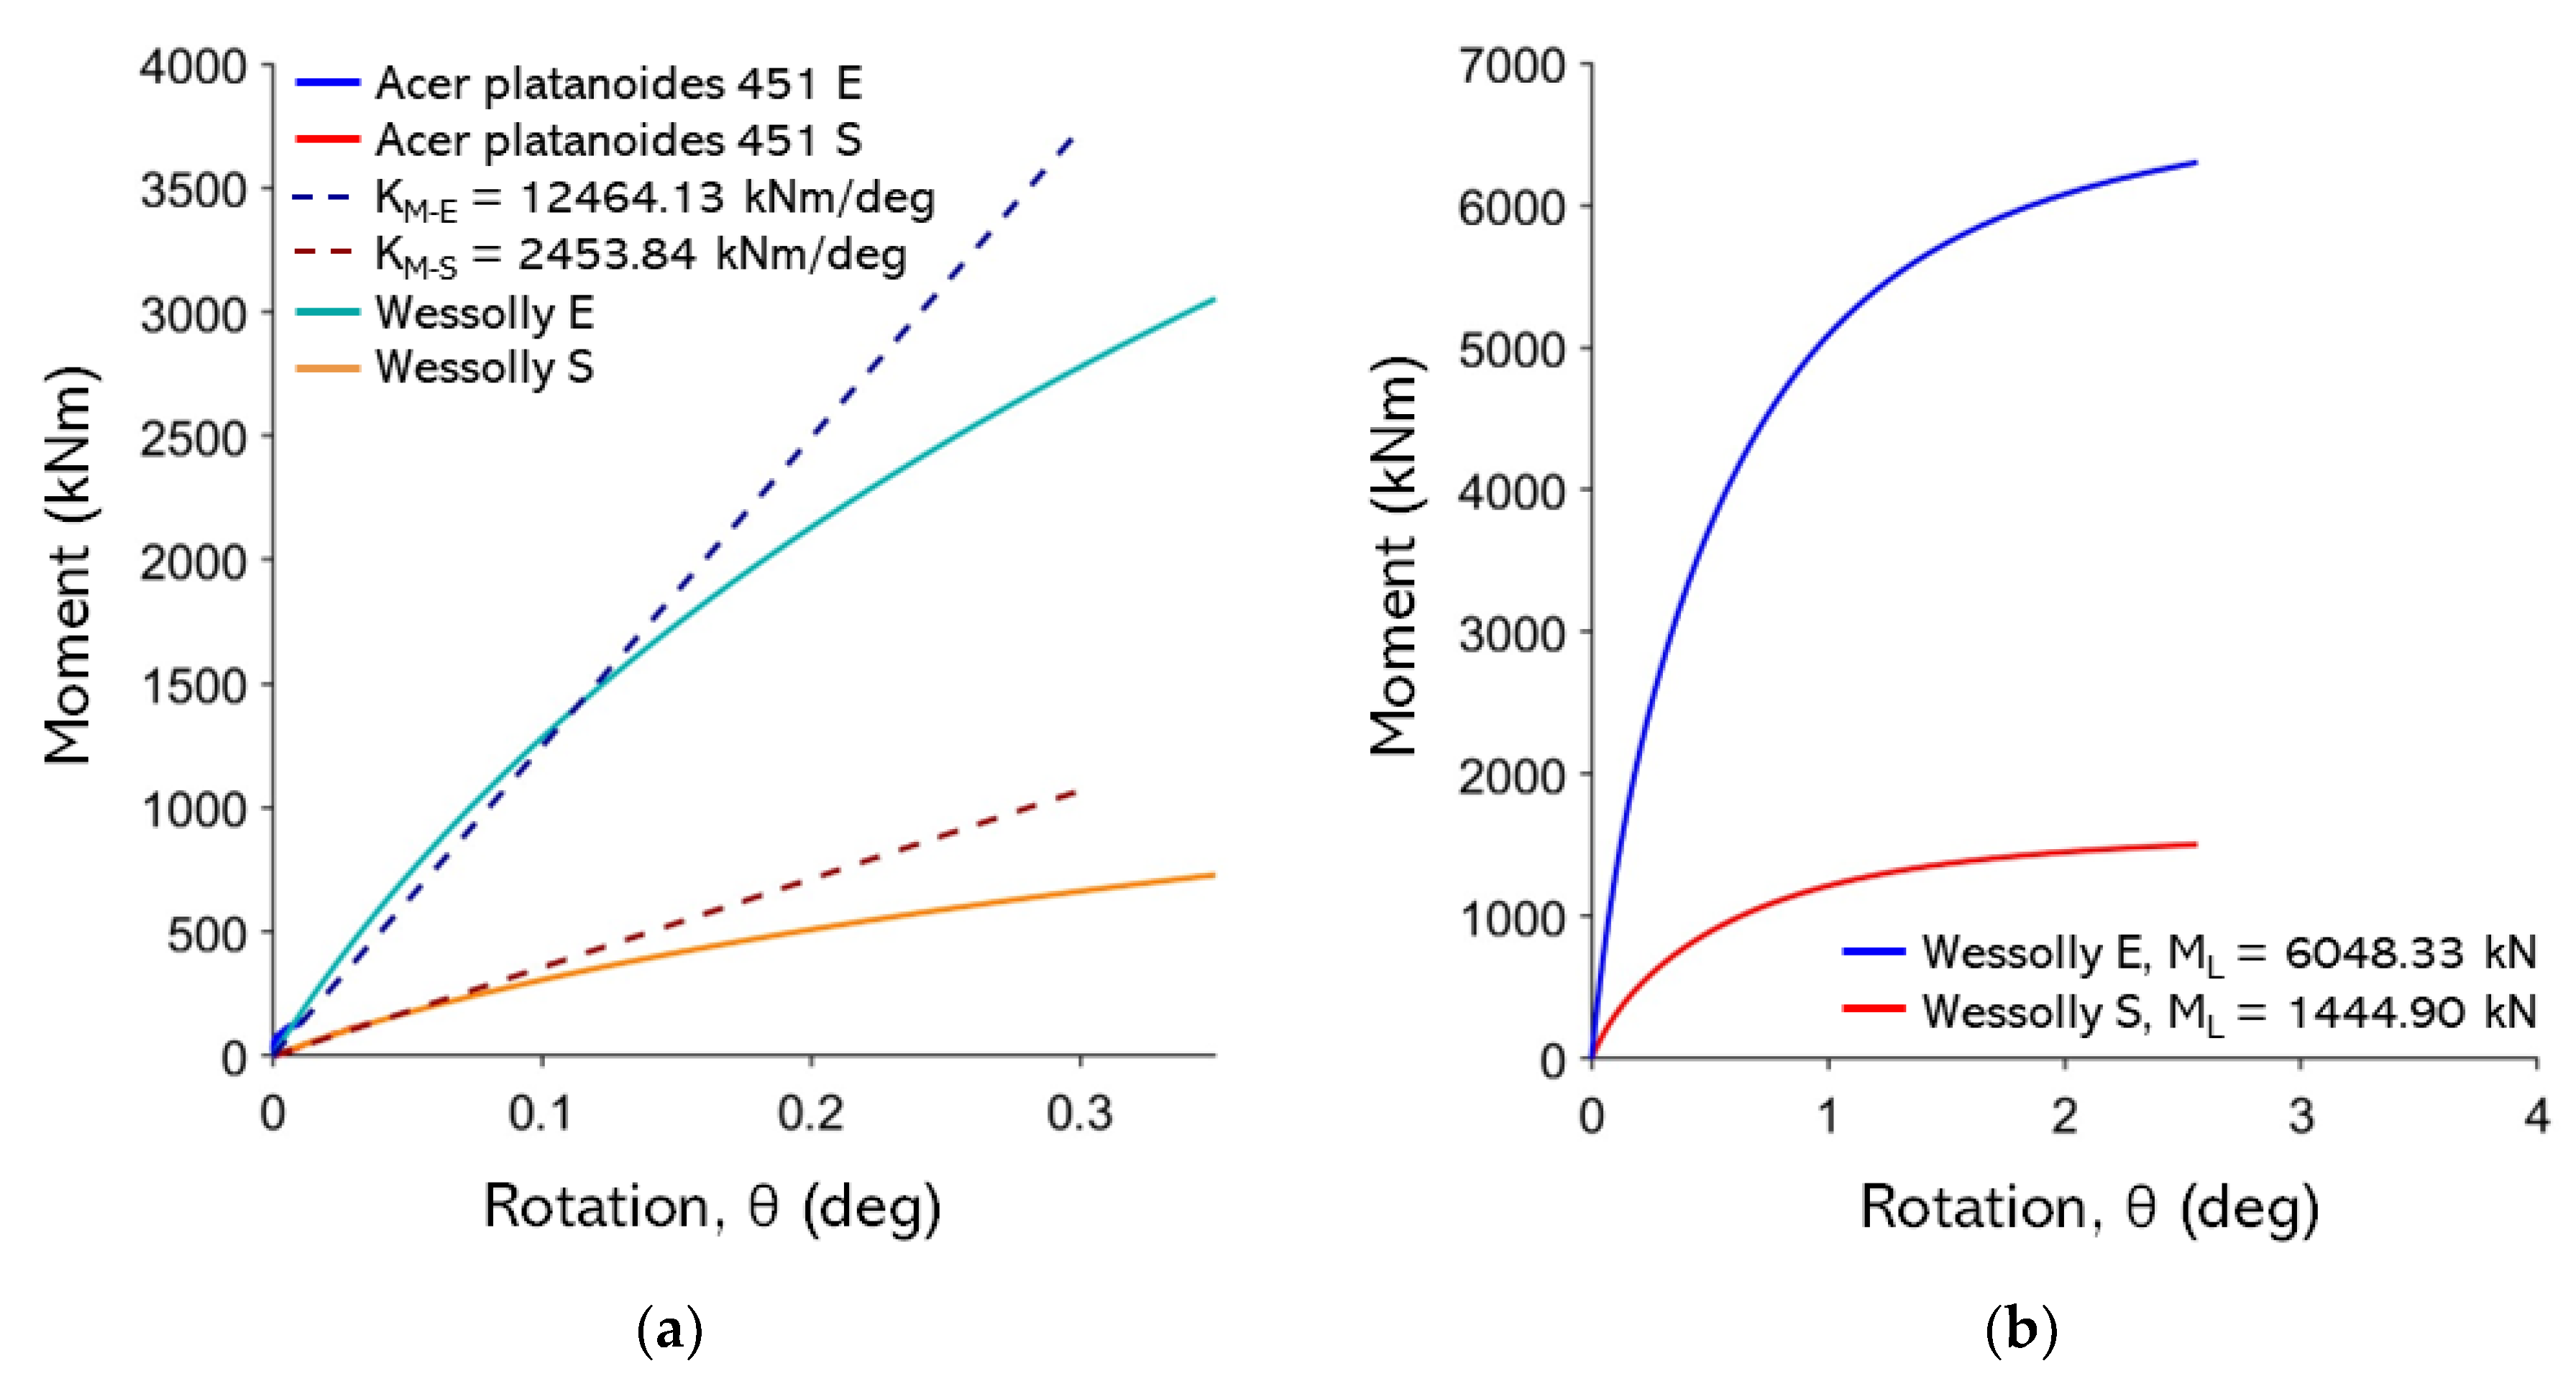
Figure B 18.
non-destructive test curves with Wessolly interpolation and stiffness; (b) Comparison of extrapolated Wessolly curves with uprooting test. 568 Nothofagus.
Figure B 18.
non-destructive test curves with Wessolly interpolation and stiffness; (b) Comparison of extrapolated Wessolly curves with uprooting test. 568 Nothofagus.
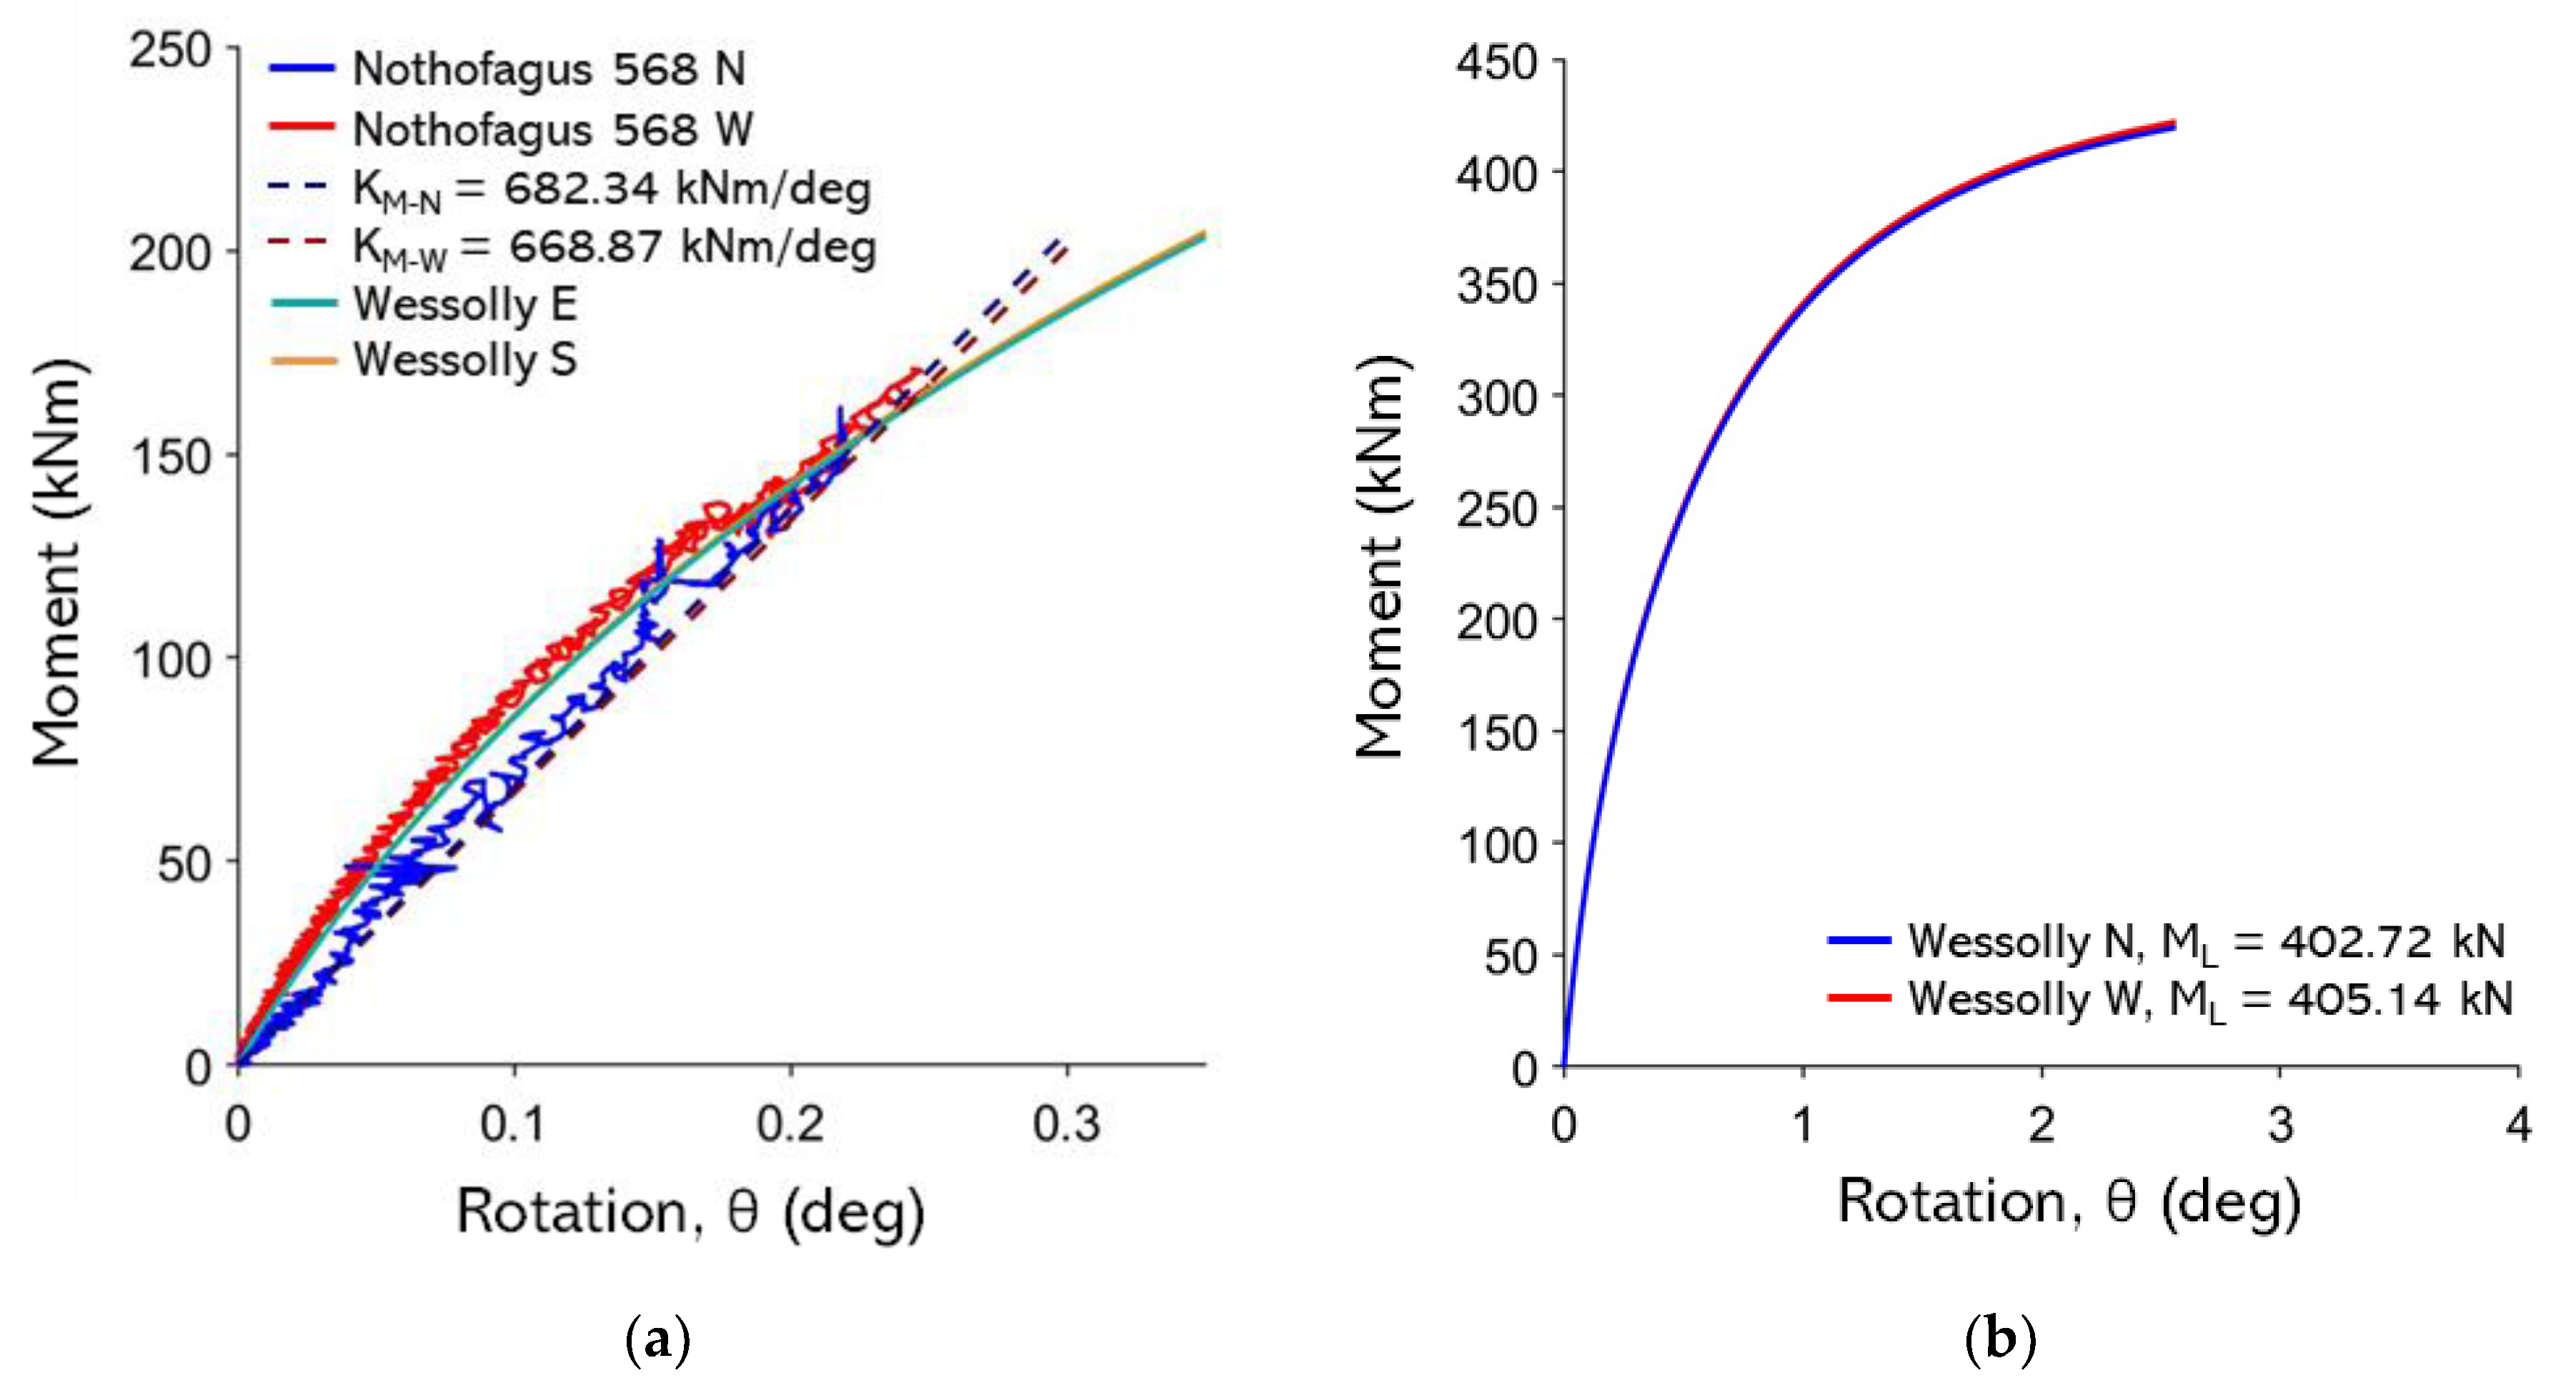
Figure B 19.
non-destructive test curves with Wessolly interpolation and stiffness; (b) Comparison of extrapolated Wessolly curves with uprooting test. 604 Acer platanoides.
Figure B 19.
non-destructive test curves with Wessolly interpolation and stiffness; (b) Comparison of extrapolated Wessolly curves with uprooting test. 604 Acer platanoides.
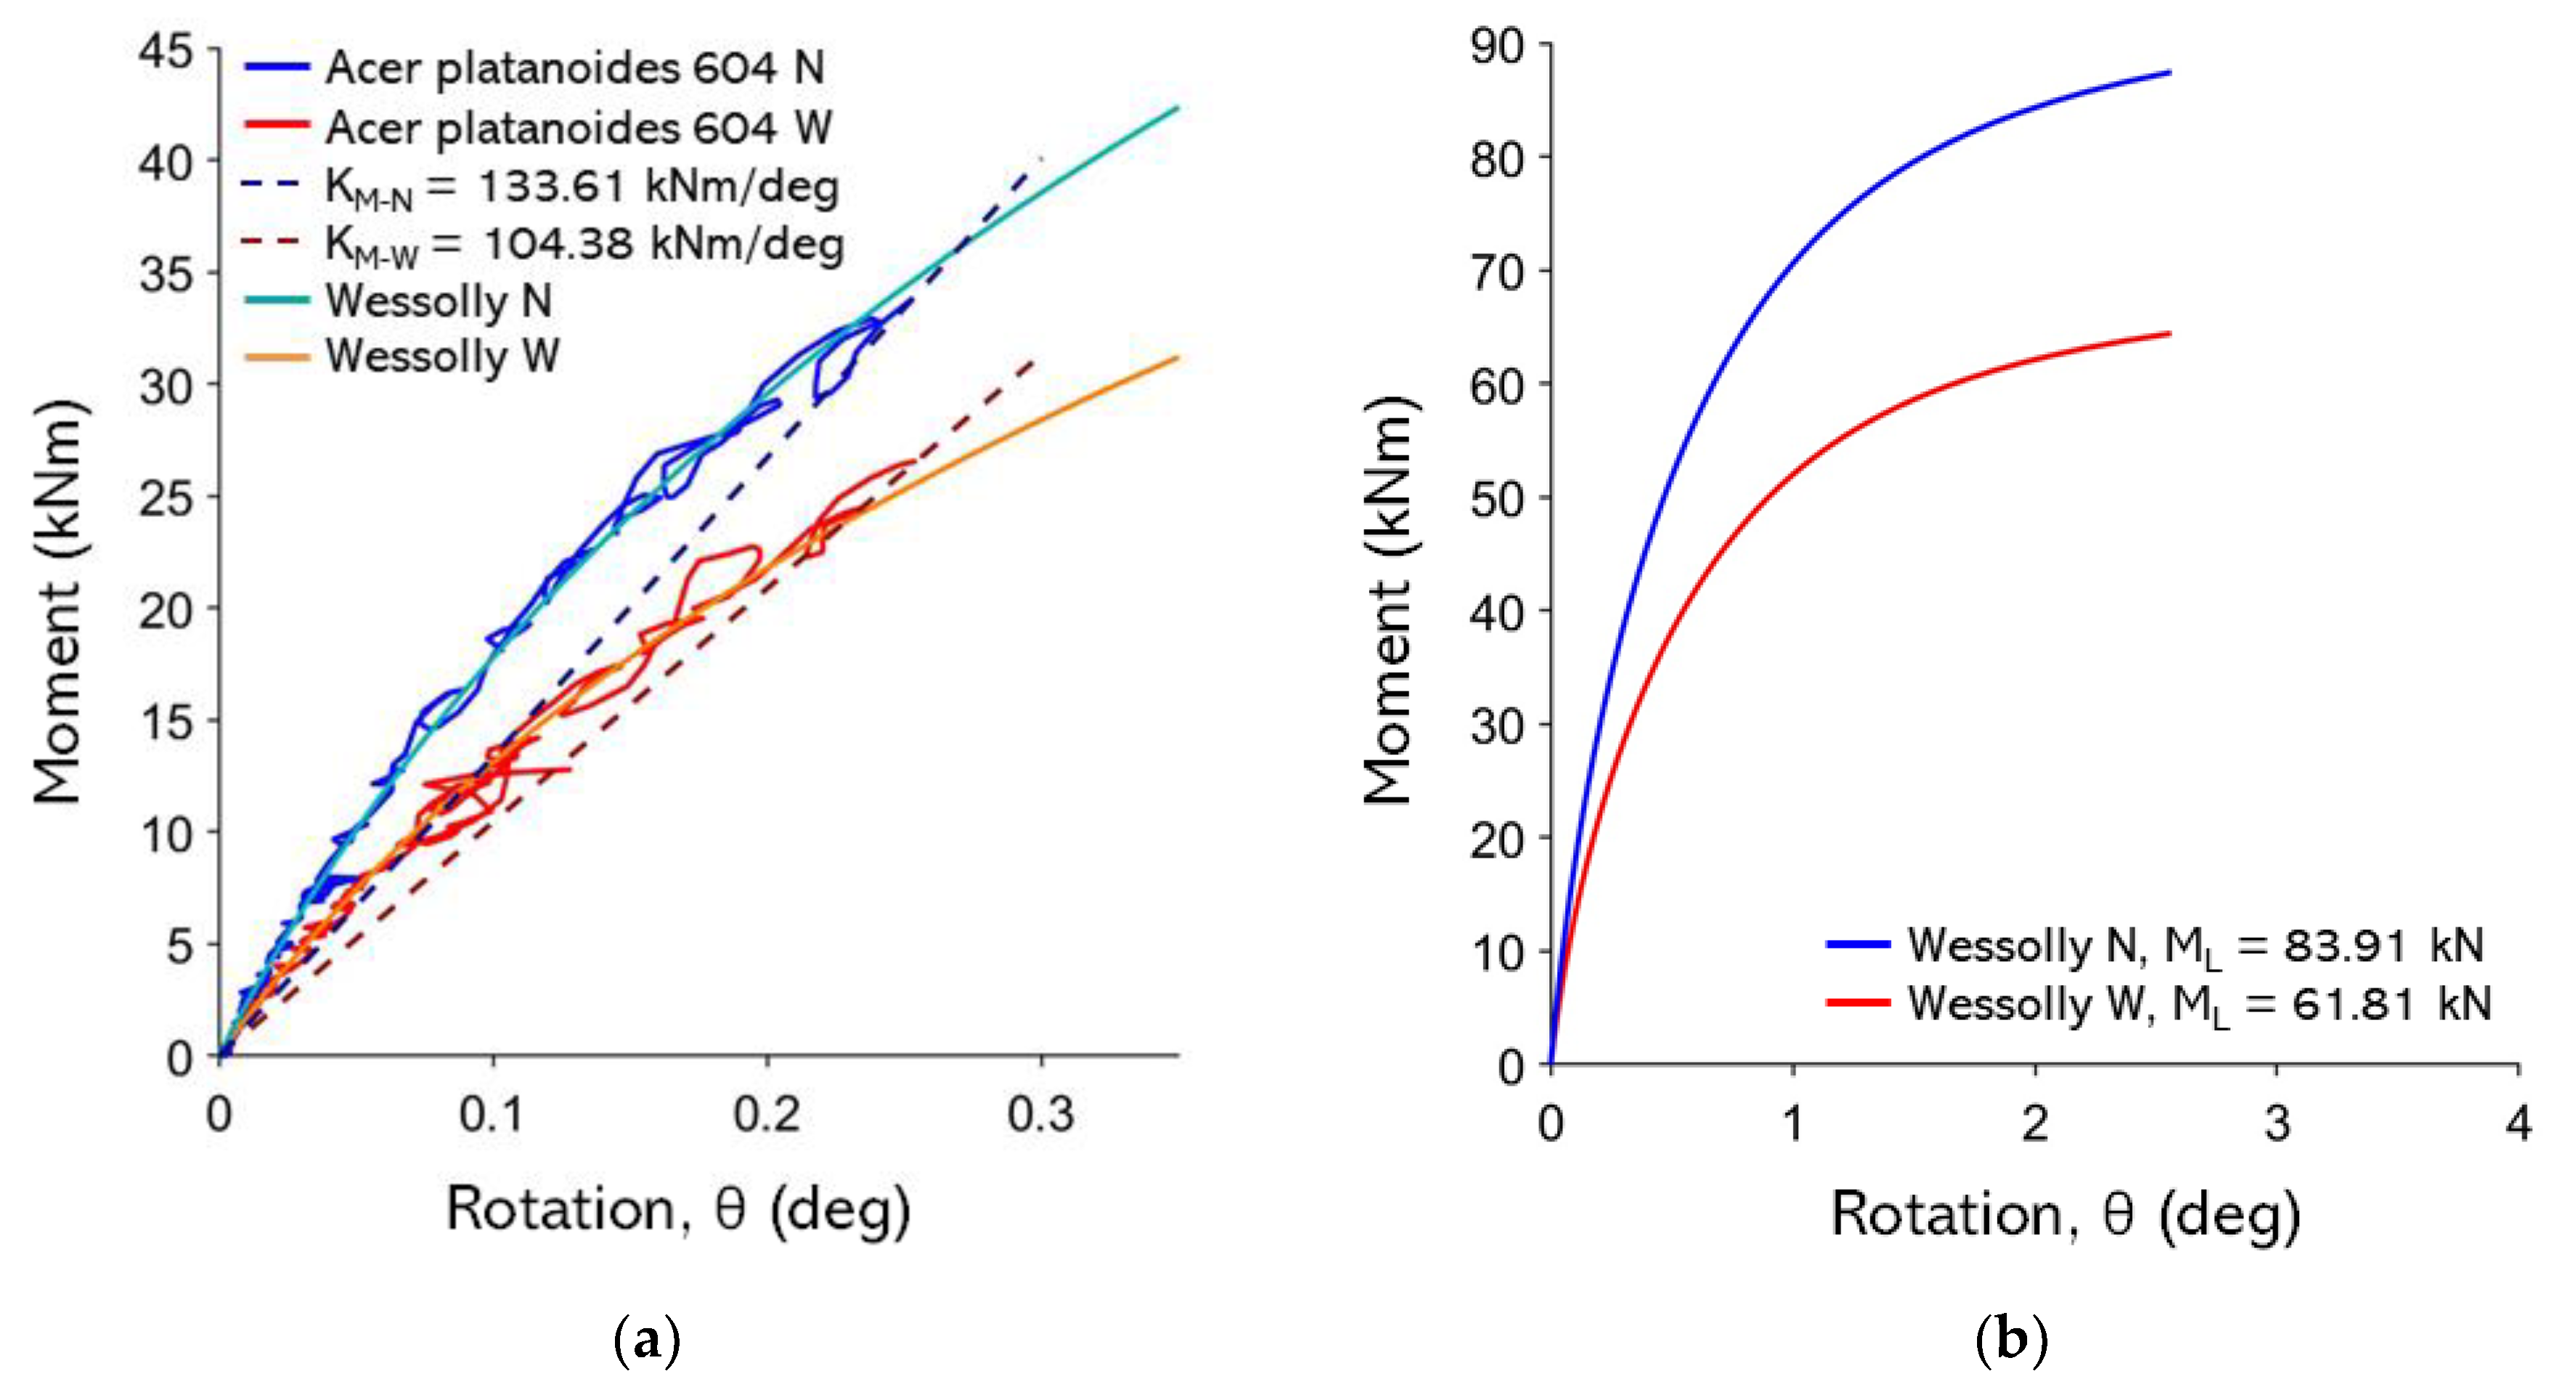
Figure B20.
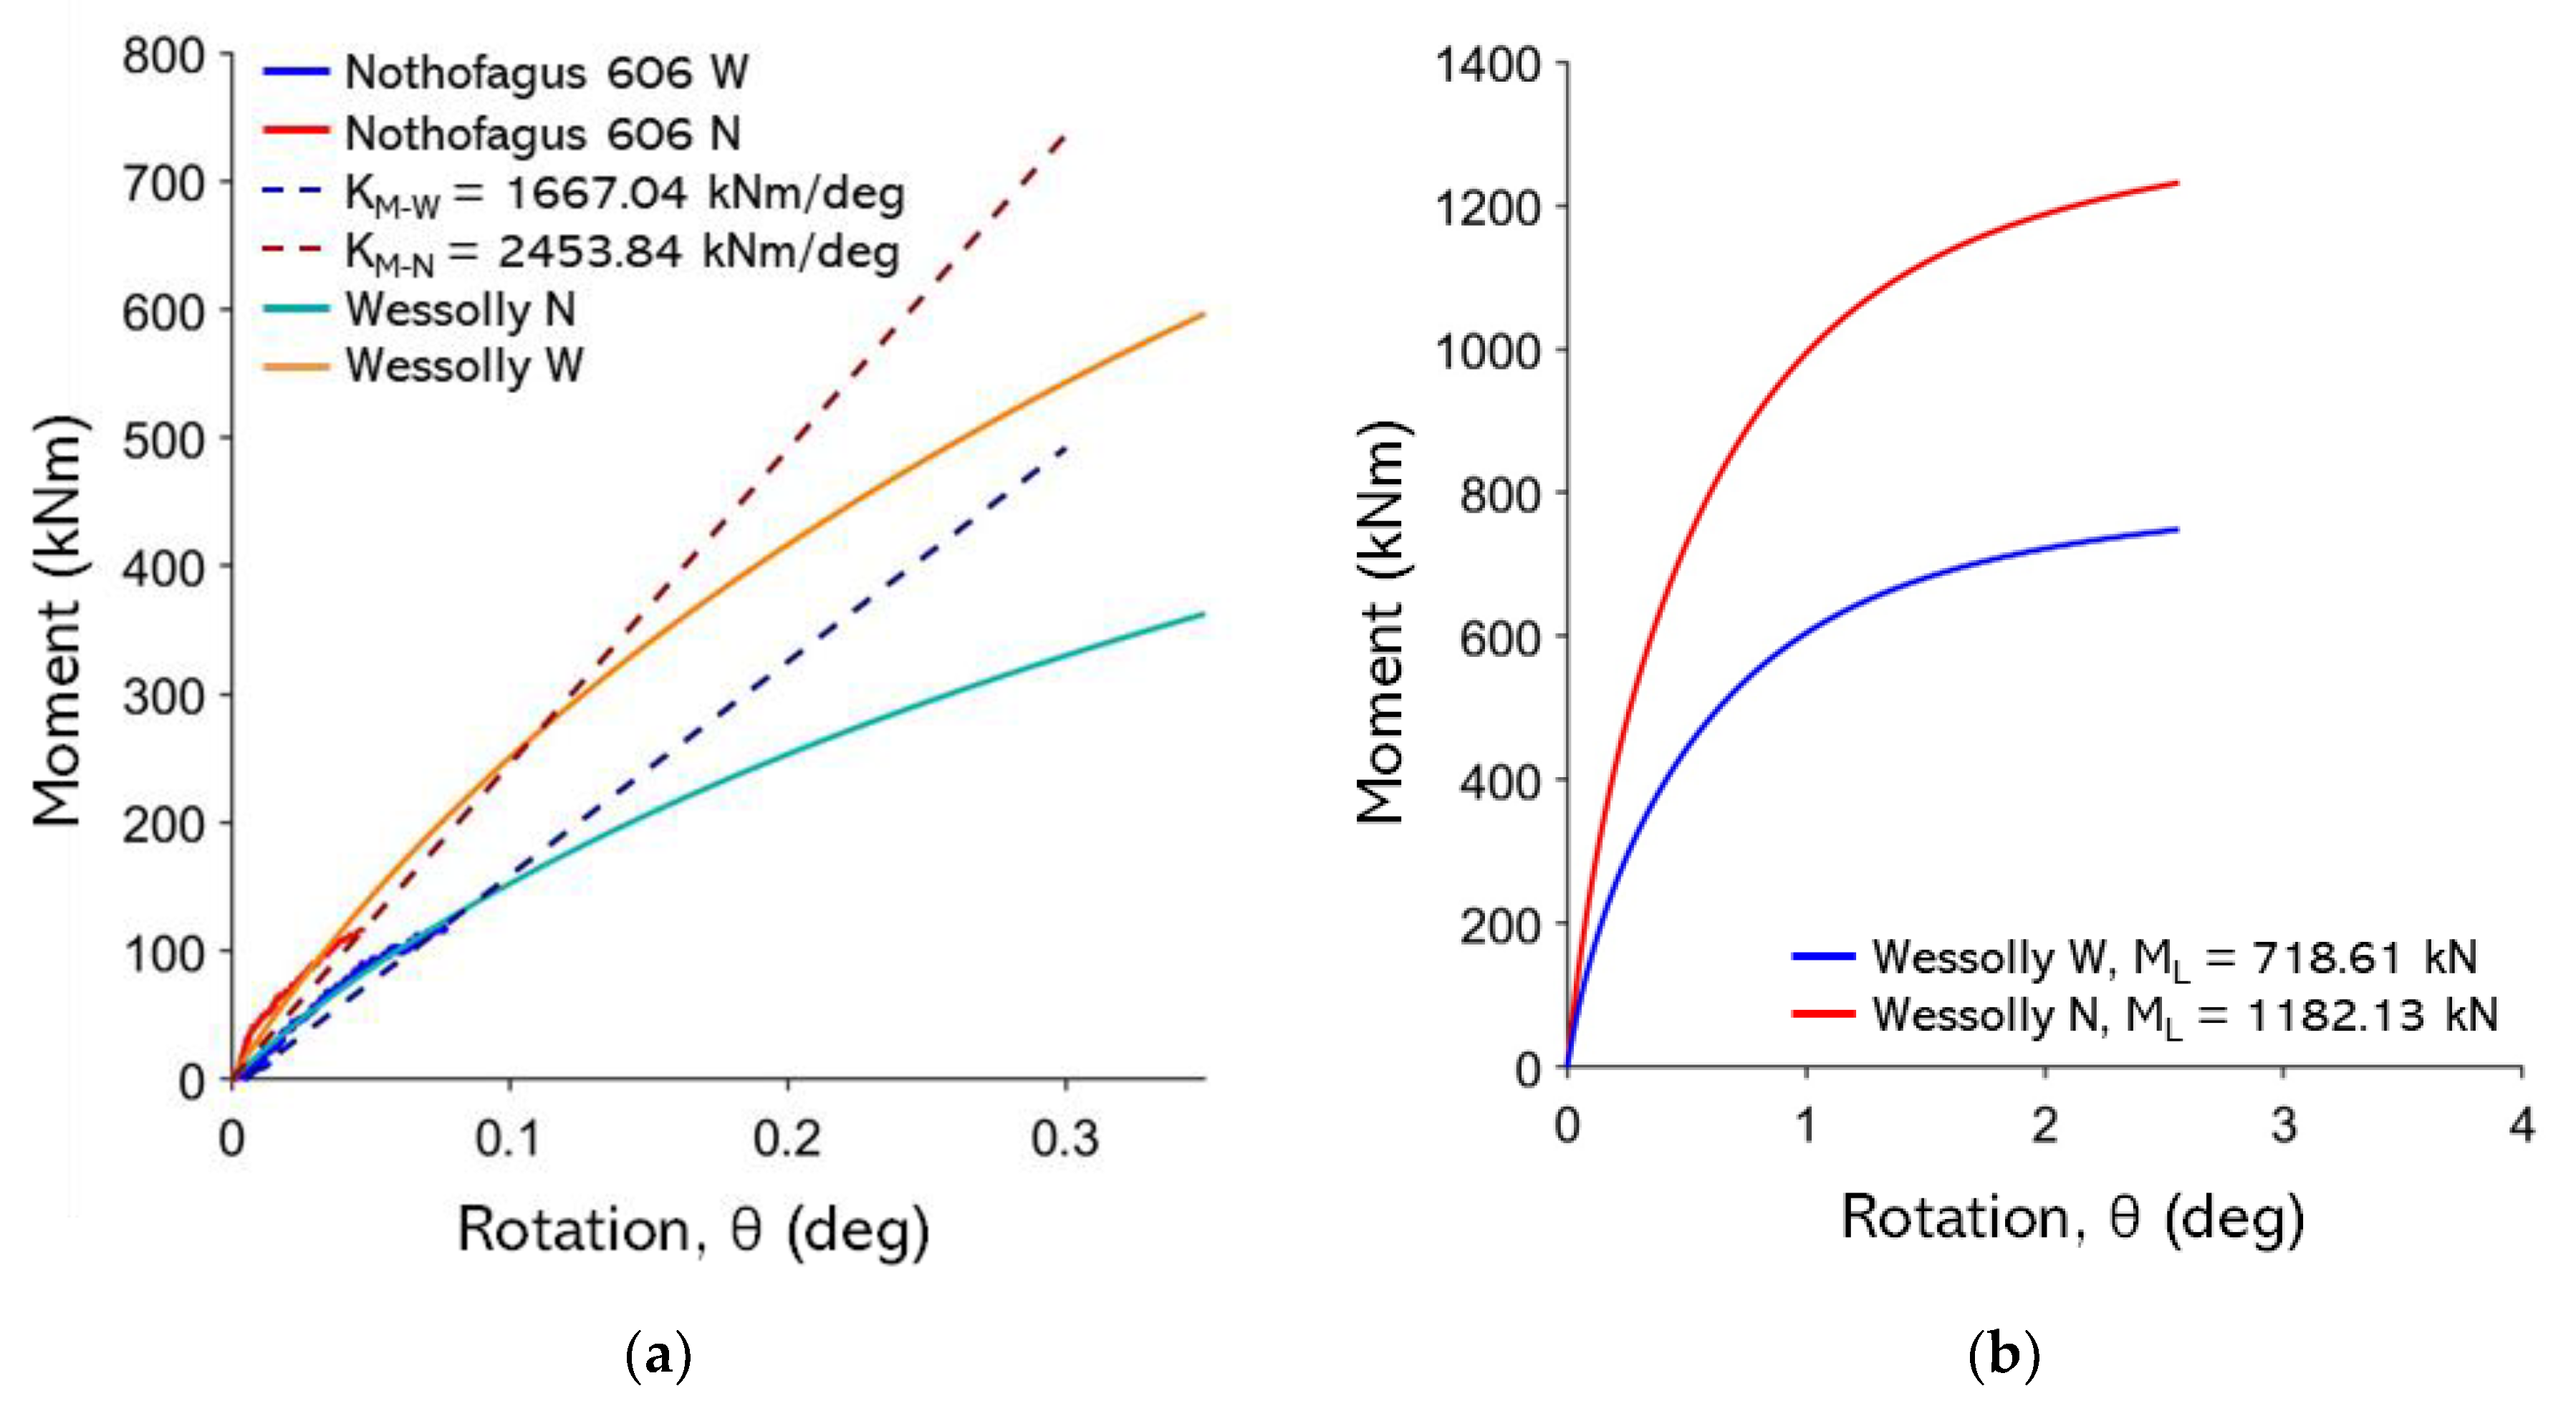
non-destructive test curves with Wessolly interpolation and stiffness; (b) Comparison of extrapolated Wessolly curves with uprooting test. 606 Nothofagus.
Figure B20.
non-destructive test curves with Wessolly interpolation and stiffness; (b) Comparison of extrapolated Wessolly curves with uprooting test. 606 Nothofagus.
References
- J. M. Cavender-Bares et al. The hidden value of trees: Quantifying the ecosystem services of tree lineages and their major threats across the contiguous US. PLOS Sustainability and Transformation 2022, 1. [CrossRef]
- C. Mattheck and H. Breloer. FIELD GUIDE FOR VISUAL TREE ASSESSMENT (VTA). Arboric J 1994, 18, 1–23. [Google Scholar] [CrossRef]
- A. Marsiglia, A. Galli, G. Marrazzo, R. Castellanza, and M. O. Ciantia. Uprooting Safety Factor of Trees from Static Pulling Tests and Dynamic Monitoring. Springer Series in Geomechanics and Geoengineering 2023, 218–225. [CrossRef]
- L. Wessolly. Fracture Diagnosis of Trees Part 1: Statics-Integrated Methods-Measurement with Tension Test The Expert’s Method. 1995.
- L. Wessolly. Fracture Diagnosis of Trees Part 2: Statics-Integrated Methods-Statically-Integrated Assessment (SIA) The Practitioner’s Method of Diagnosis.
- L. Wessolly. Stability of Trees Explanation of the Tipping Process. 1996.
- L. Wessolly and M. Erb, Handbuch der Baumstatik und Baumkontrolle. Berlin: Patzer Verlag. 1998.
- A. I. Fraser and J. B. H. Gardiner. Rooting and stability in Sitka spruce. 1967, Accessed: Oct. 01, 2025. [Online]. Available: https://cdn.forestresearch.gov.uk/1967/03/fcbu040.
- M. J. Crook and A. R. Ennos. The anchorage mechanics of deep rooted larch, Larix europea × L. japonica. J Exp Bot 1996, 47, 1509–1517. [Google Scholar] [CrossRef]
- P. Défossez et al. Impact of soil water content on the overturning resistance of young Pinus Pinaster in sandy soil. For Ecol Manage 2021, 480, 118614. [Google Scholar] [CrossRef]
- T. Urata, M. Shibuya, A. Koizumi, H. Torita, and J. Y. Cha. Both stem and crown mass affect tree resistance to uprooting. Journal of Forest Research 2012, 17, 65–71. [Google Scholar] [CrossRef]
- C. Nicoll, B. A. Gardiner, and A. J. Peace. Improvements in anchorage provided by the acclimation of forest trees to wind stress. Forestry 2008, 81, 389–398. [Google Scholar] [CrossRef]
- Achim and B., C. Nicoll. Modelling the anchorage of shallow-rooted trees. Forestry: An International Journal of Forest Research 2009, 82, 273–284. [Google Scholar] [CrossRef]
- G. Dattola et al. A Macroelement Approach for the Stability Assessment of Trees. Lecture Notes in Civil Engineering 2020, 40, 417–426. [Google Scholar] [CrossRef]
- M. A. Mansour, D. M. Rhee, T. Newson, C. Peterson, and F. T. Lombardo. Estimating wind damage in forested areas due to tornadoes. Forests 2021, 12, 1–22. [Google Scholar] [CrossRef]
- G. Marrazzo, M. O. Ciantia, T. Riccio, J. A. Knappett, and A. Galli. Multi-axis loading tests on a small-scale tree roots model. 2024. [CrossRef]
- A. Galli, C. Sala, R. Castellanza, A. Marsiglia, and M. O. Ciantia. Lesson learnt from static pulling tests on trees: an experimental study on toppling behaviour of complex foundations. Acta Geotech 2024, 19, 1477–1494. [Google Scholar] [CrossRef]
- X. Zhang, J. A. Knappett, A. K. Leung, M. O. Ciantia, T. Liang, and B. C. Nicoll. Centrifuge modelling of root-soil interaction of laterally loaded trees under different loading conditions. Geotechnique 2023, 73, 766–780. [Google Scholar] [CrossRef]
- Frediani, K. Botanic Garden and Grounds strategy. 2021.
- M. Armstrong and I. B. Paterson, The Lower Old Red Sandstone of the Strathmore Region. 1970.
- G. J. Meijer, A. G. Bengough, J. A. Knappett, K. W. Loades, and B. C. Nicoll. In situ measurement of root reinforcement using corkscrew extraction method. Canadian Geotechnical Journal 2018, 55, 1372–1390. [Google Scholar] [CrossRef]
- G. Meijer, G. G. Meijer, G. Bengough, J. Knappett, K. Loades, and B. Nicoll. Measuring the strength of root-reinforced soil on steep natural slopes using the corkscrew extraction method. Forests 2019, 10. [Google Scholar] [CrossRef]
- R. J. Chandler. The in-situ measurement of the undrained shear strength of clays using the field vane. Vane shear strength testing in soils: field and laboratory studies. 1988.
- M. Th. van Genuchten. A Closed-form Equation for Predicting the Hydraulic Conductivity of Unsaturated Soils. Soil Science Society of America Journal 1980, 44, 892–898. [Google Scholar] [CrossRef]
- T. Liang, J. A. Knappett, and N. Duckett. Modelling the seismic performance of rooted slopes from individual root-soil interaction to global slope behaviour. Geotechnique 2015, 65, 995–1009. [Google Scholar] [CrossRef]
- B. C. Nicoll, B. A. Gardiner, B. Rayner, and A. J. Peace. Anchorage of coniferous trees in relation to species, soil type, and rooting depth. Canadian Journal of Forest Research 2006, 36, 1871–1883. [Google Scholar] [CrossRef]
- A. Achim and B. C. Nicoll. Modelling the anchorage of shallow-rooted trees. Forestry: An International Journal of Forest Research 2009, 82, 273–284. [Google Scholar] [CrossRef]
Figure 1.
(a) plan and elevation views of a tree showing pulling direction (β), inclination angle (α), rotation at the root plate (θ), and pulling force (Fα,β); (b) schematic uprooting curves from different pulling directions and heights, showing definitions of limit moment and limit rotation angle (ML, θL), and stiffness KM.
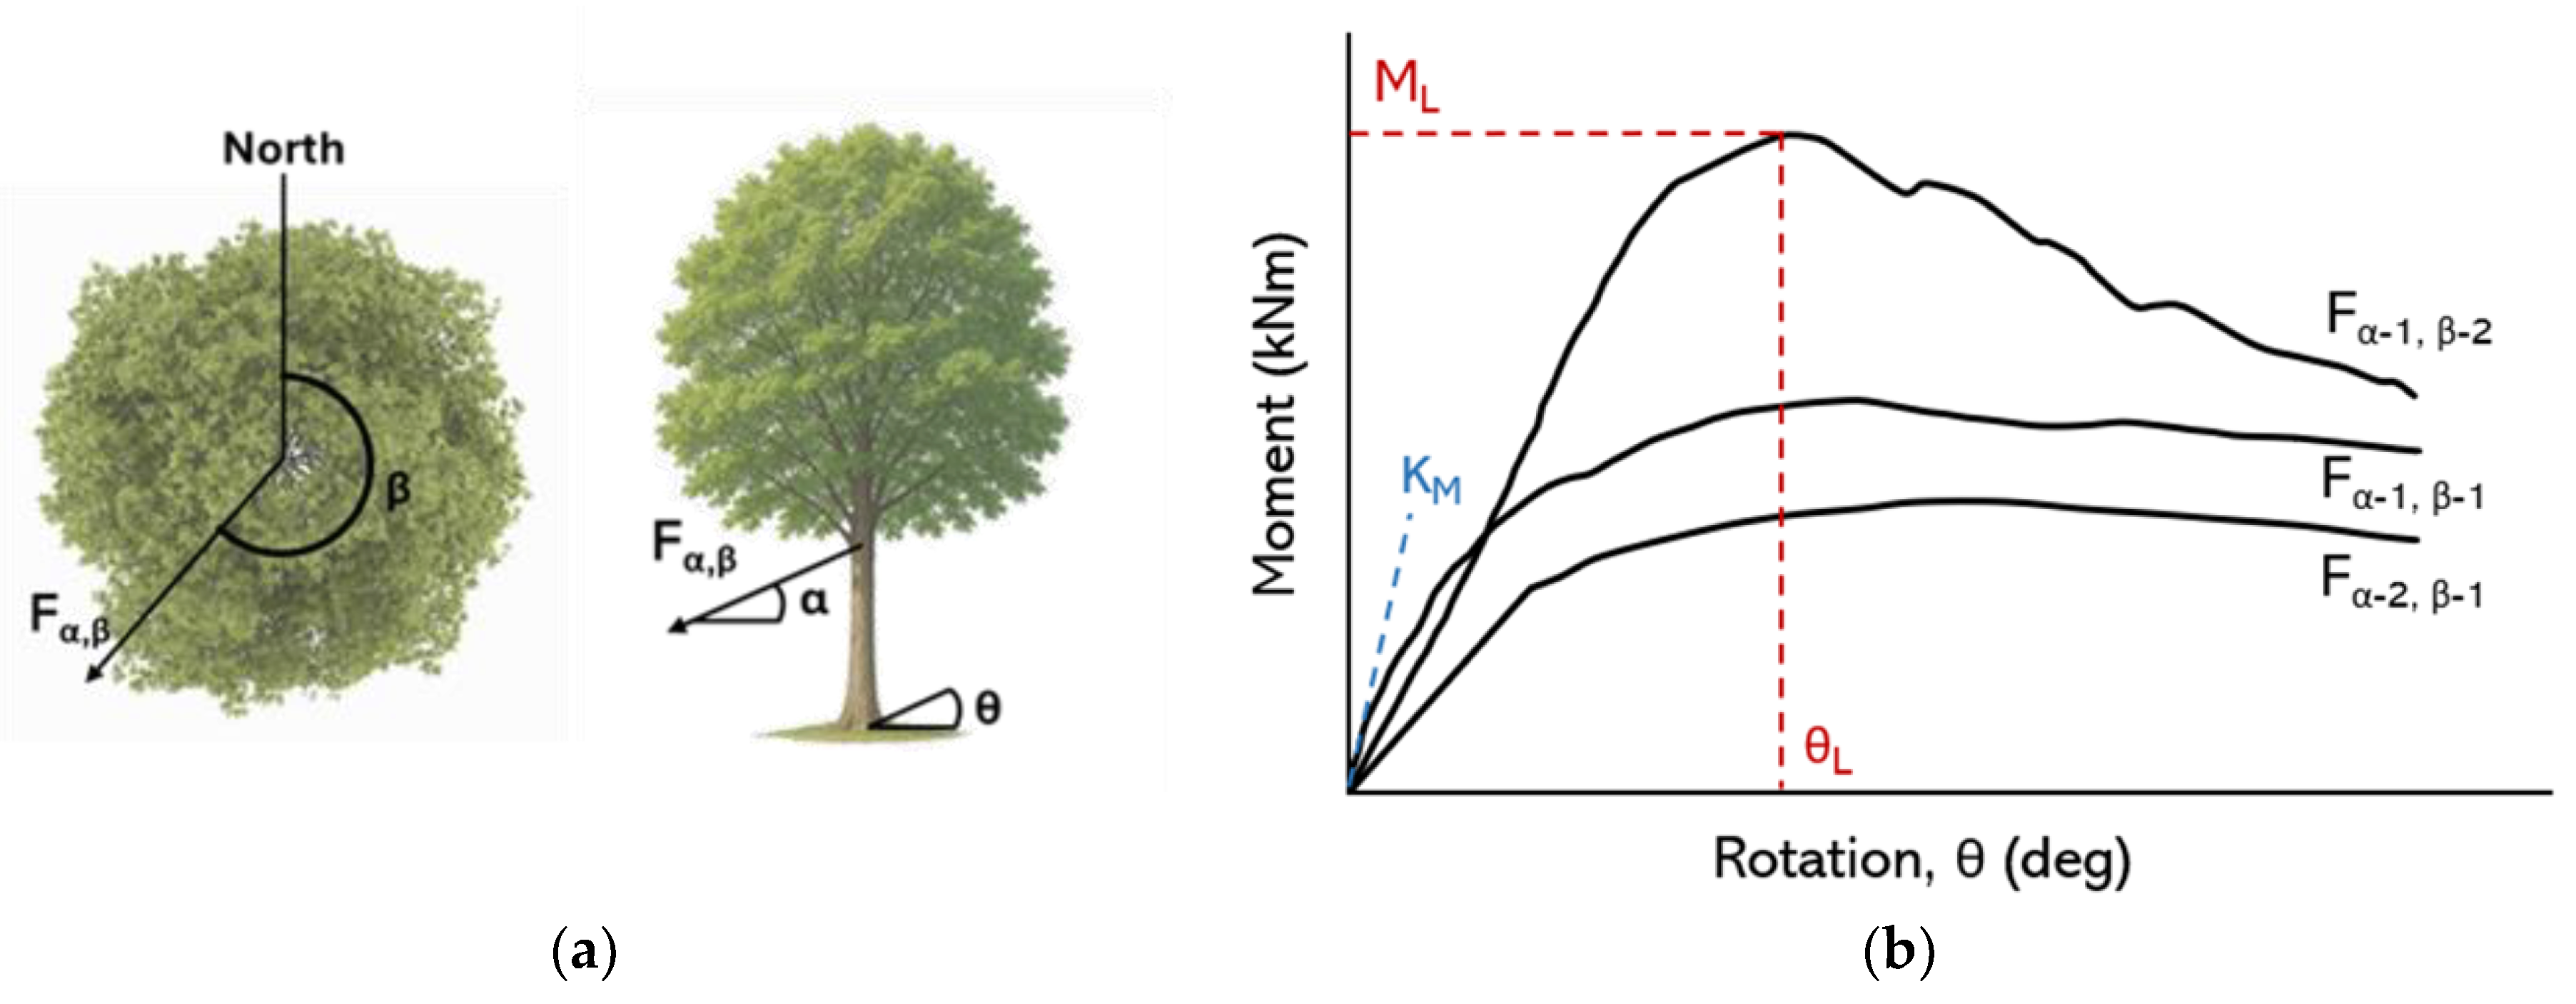
Figure 2.
University of Dundee Botanic Gardens – study area, western Dundee (UK, Scotland) and 365 m from the River Tay; 9.5 ha with about 5,000 trees.
Figure 2.
University of Dundee Botanic Gardens – study area, western Dundee (UK, Scotland) and 365 m from the River Tay; 9.5 ha with about 5,000 trees.
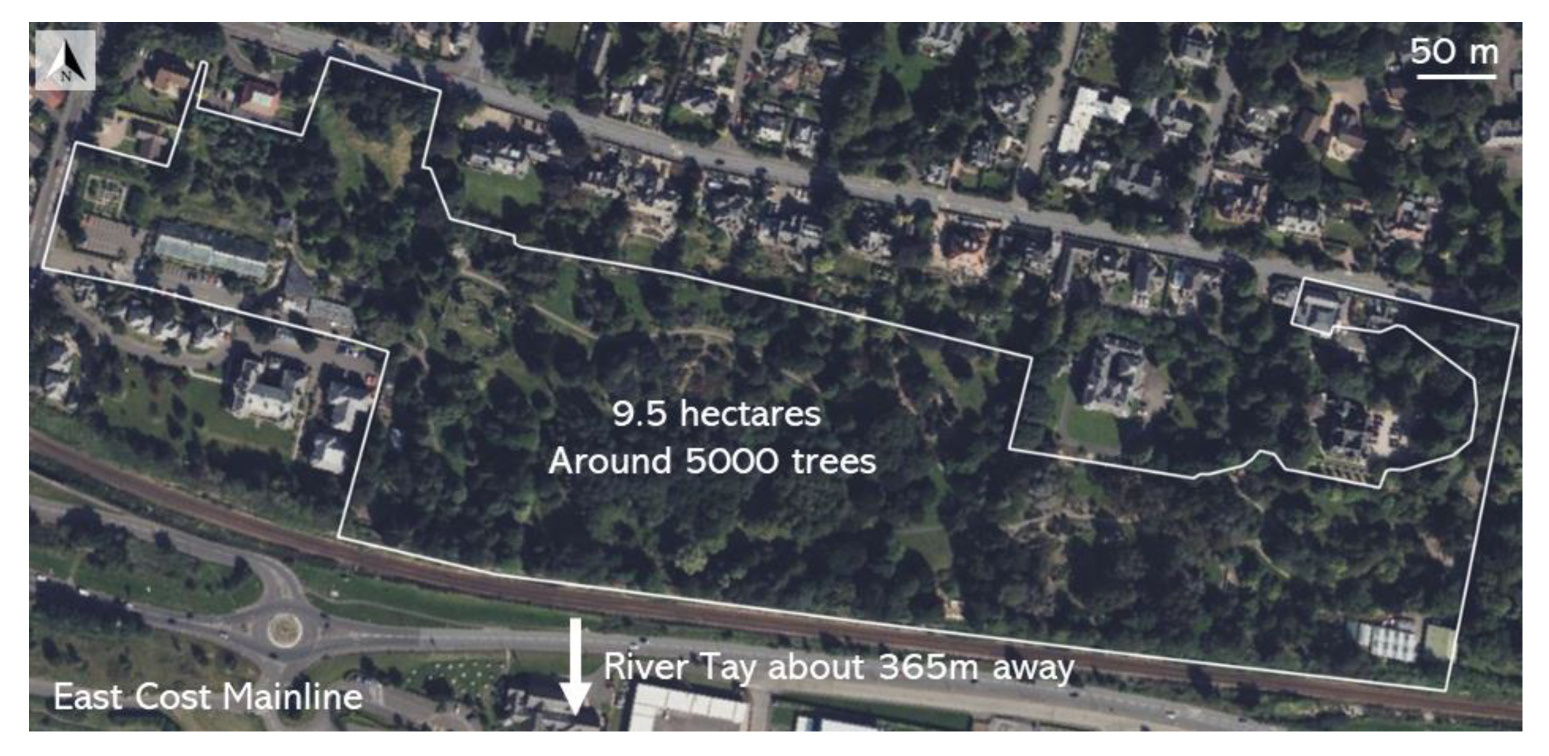
Figure 3.
Testing summary. The legend shows the symbols of the different tests performed on the trees, the stratigraphy, and the tree species.
Figure 3.
Testing summary. The legend shows the symbols of the different tests performed on the trees, the stratigraphy, and the tree species.
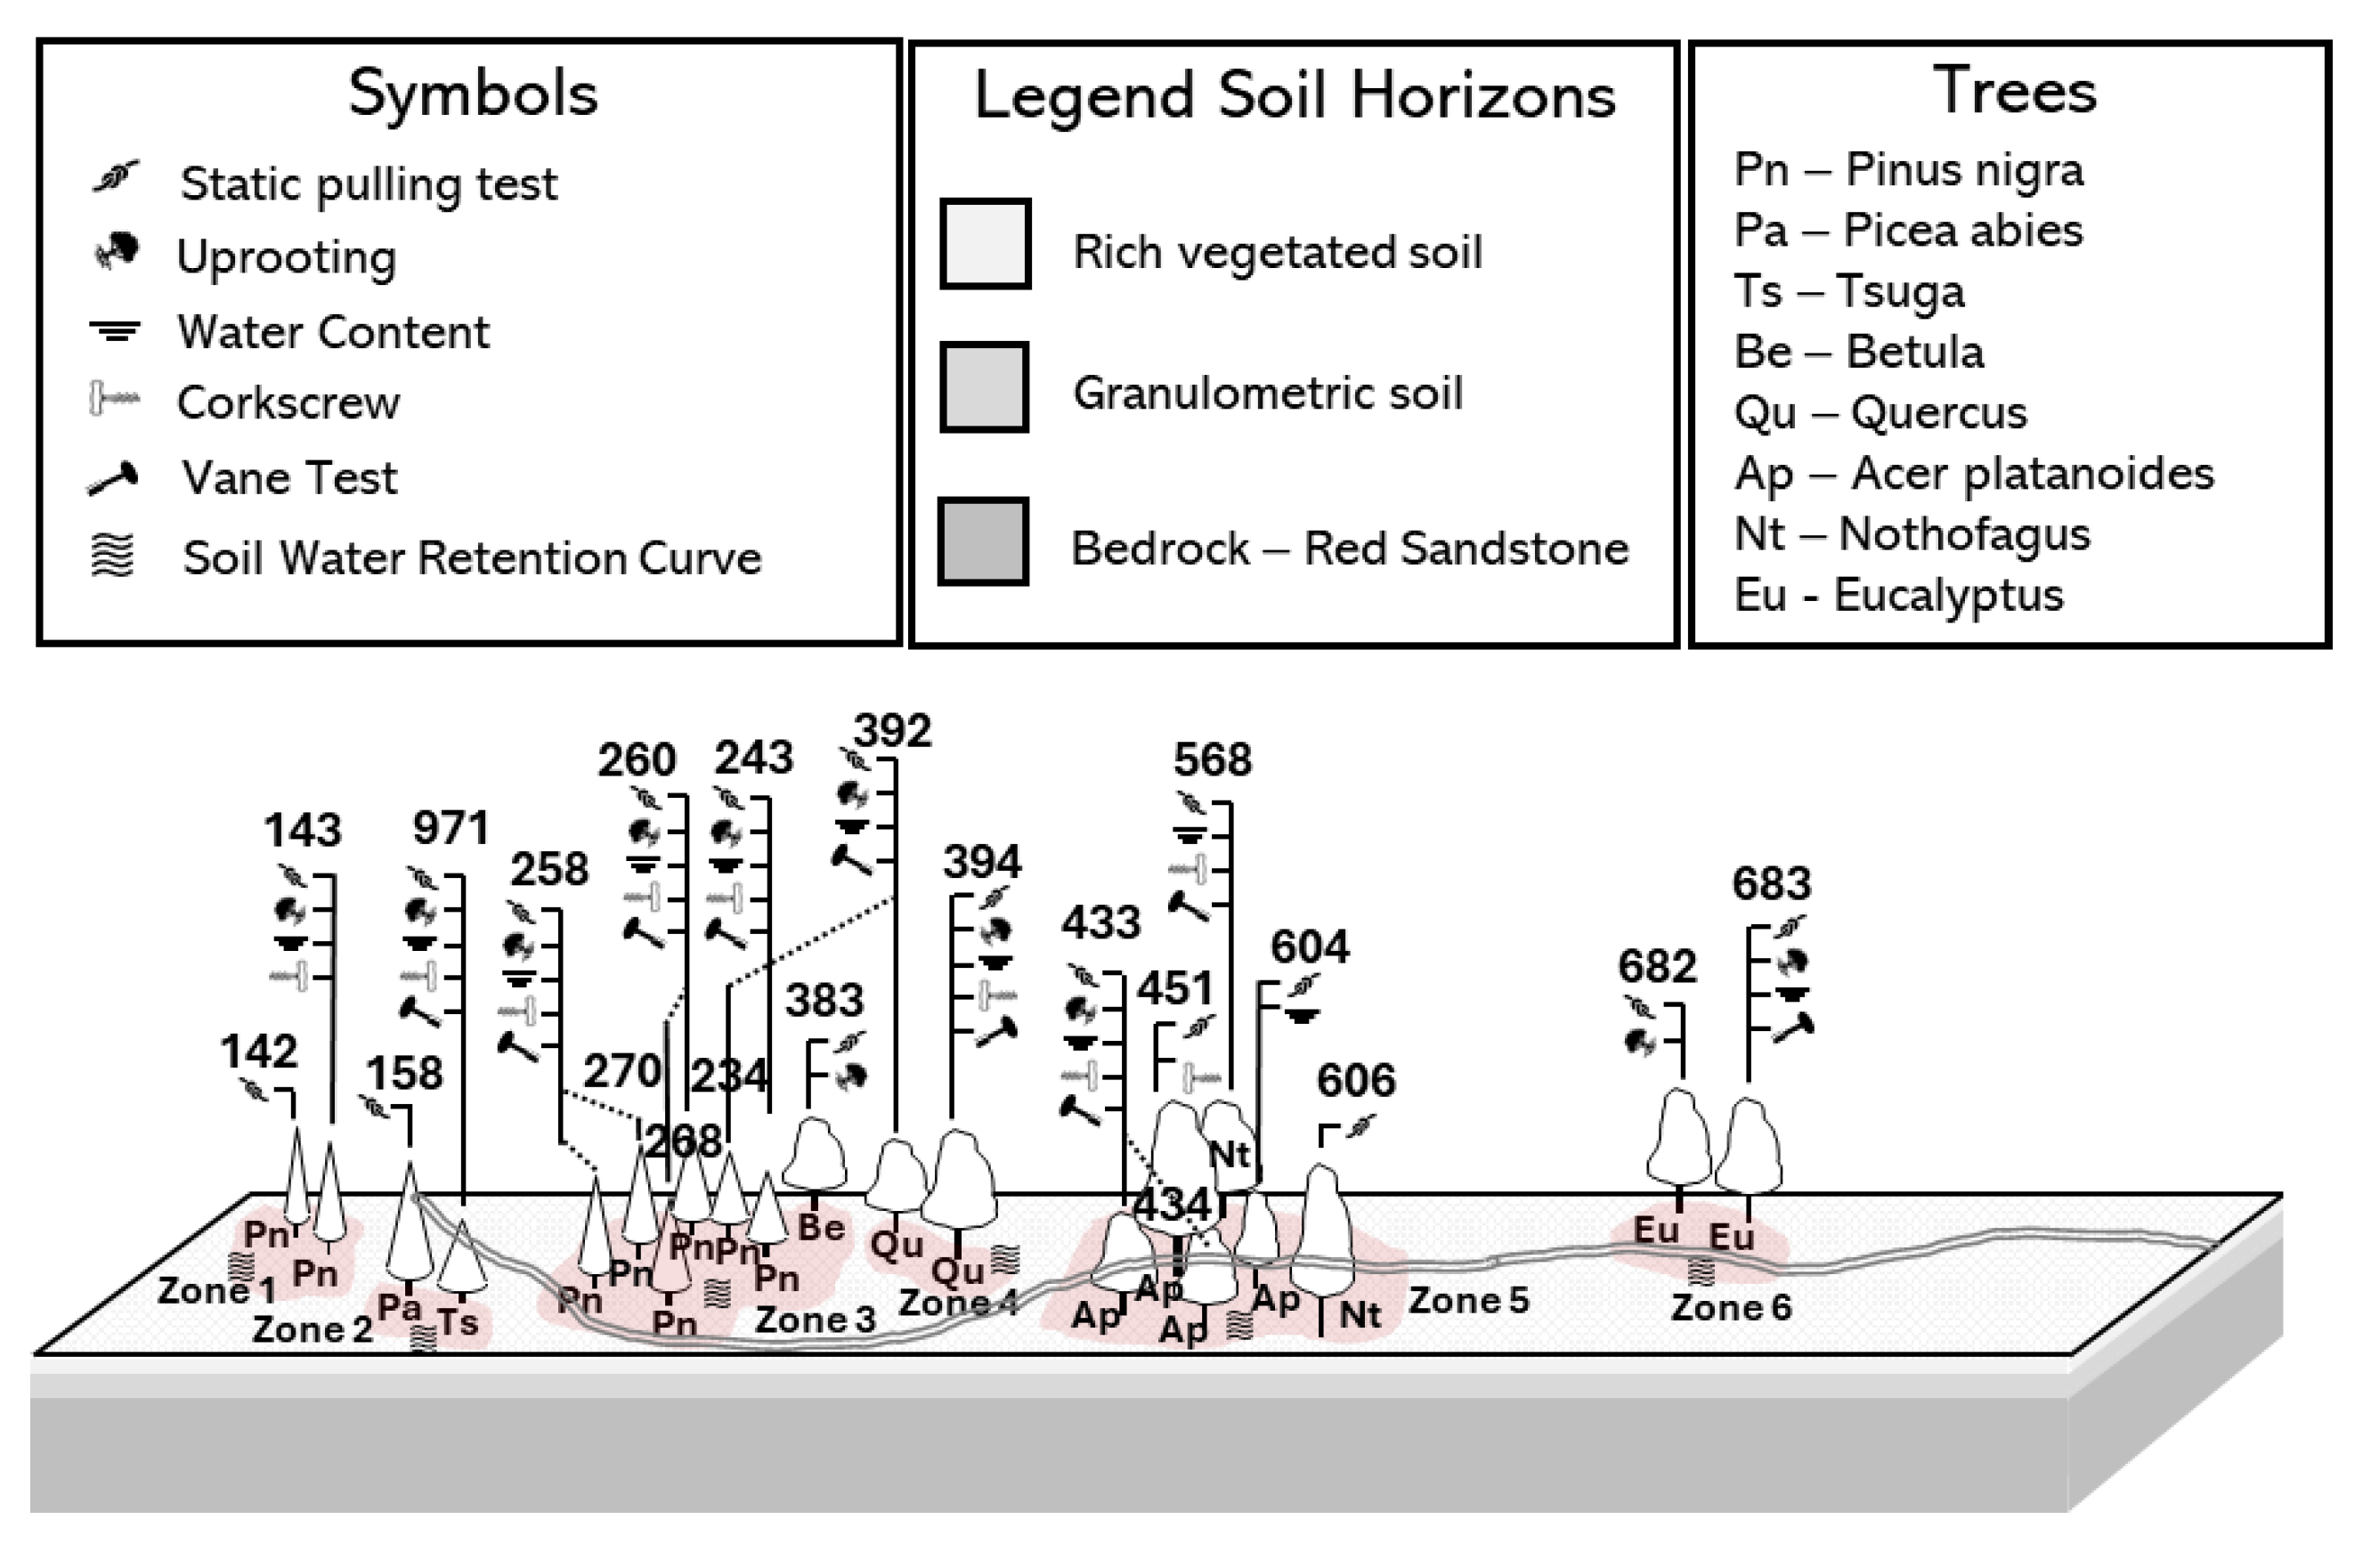
Figure 4.
Visual evidence of ground conditions following uprooting tests.
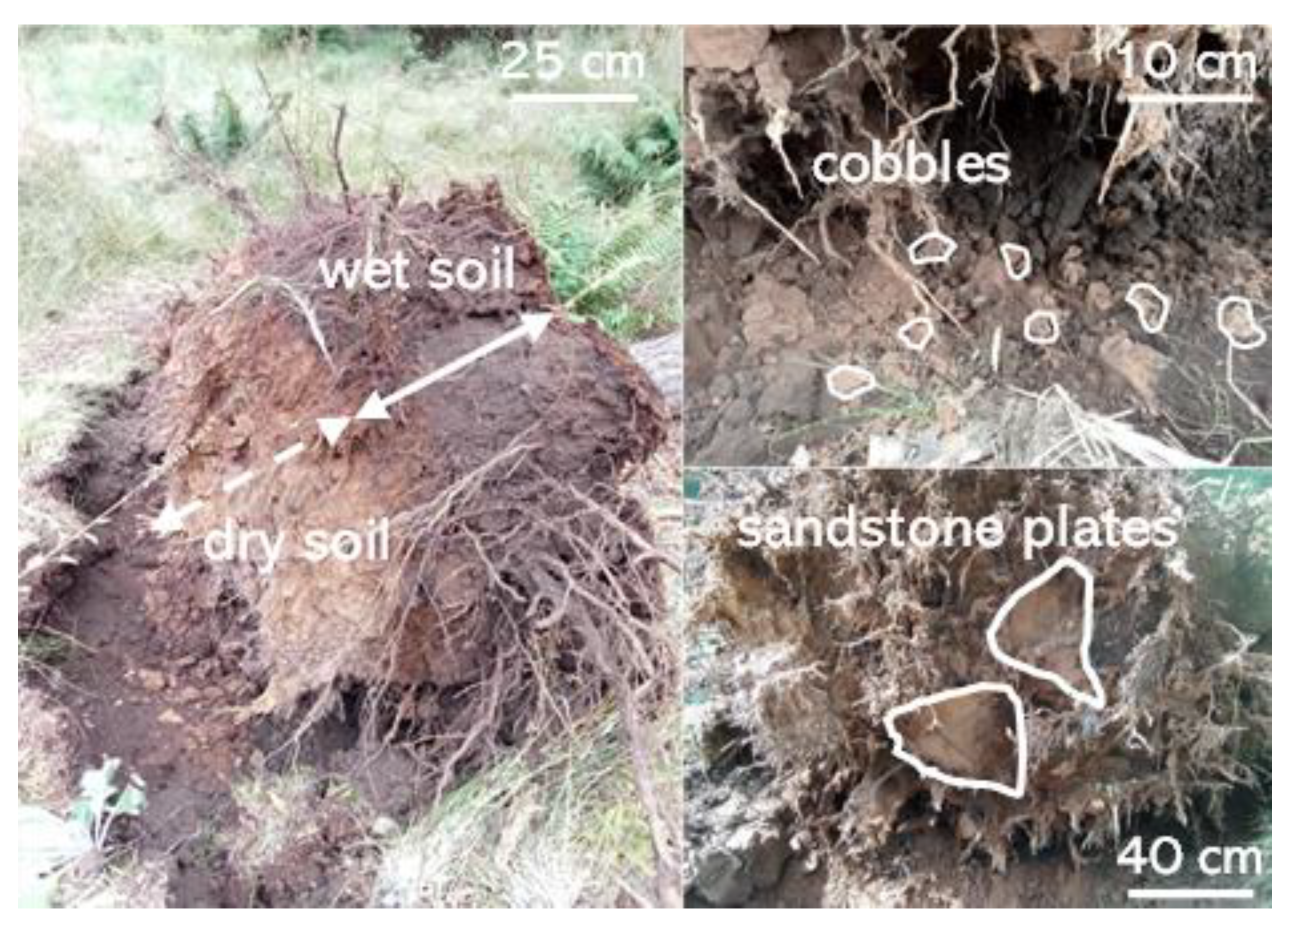
Figure 5.
(a) Particle Size Distribution curves; (b) soil texture.
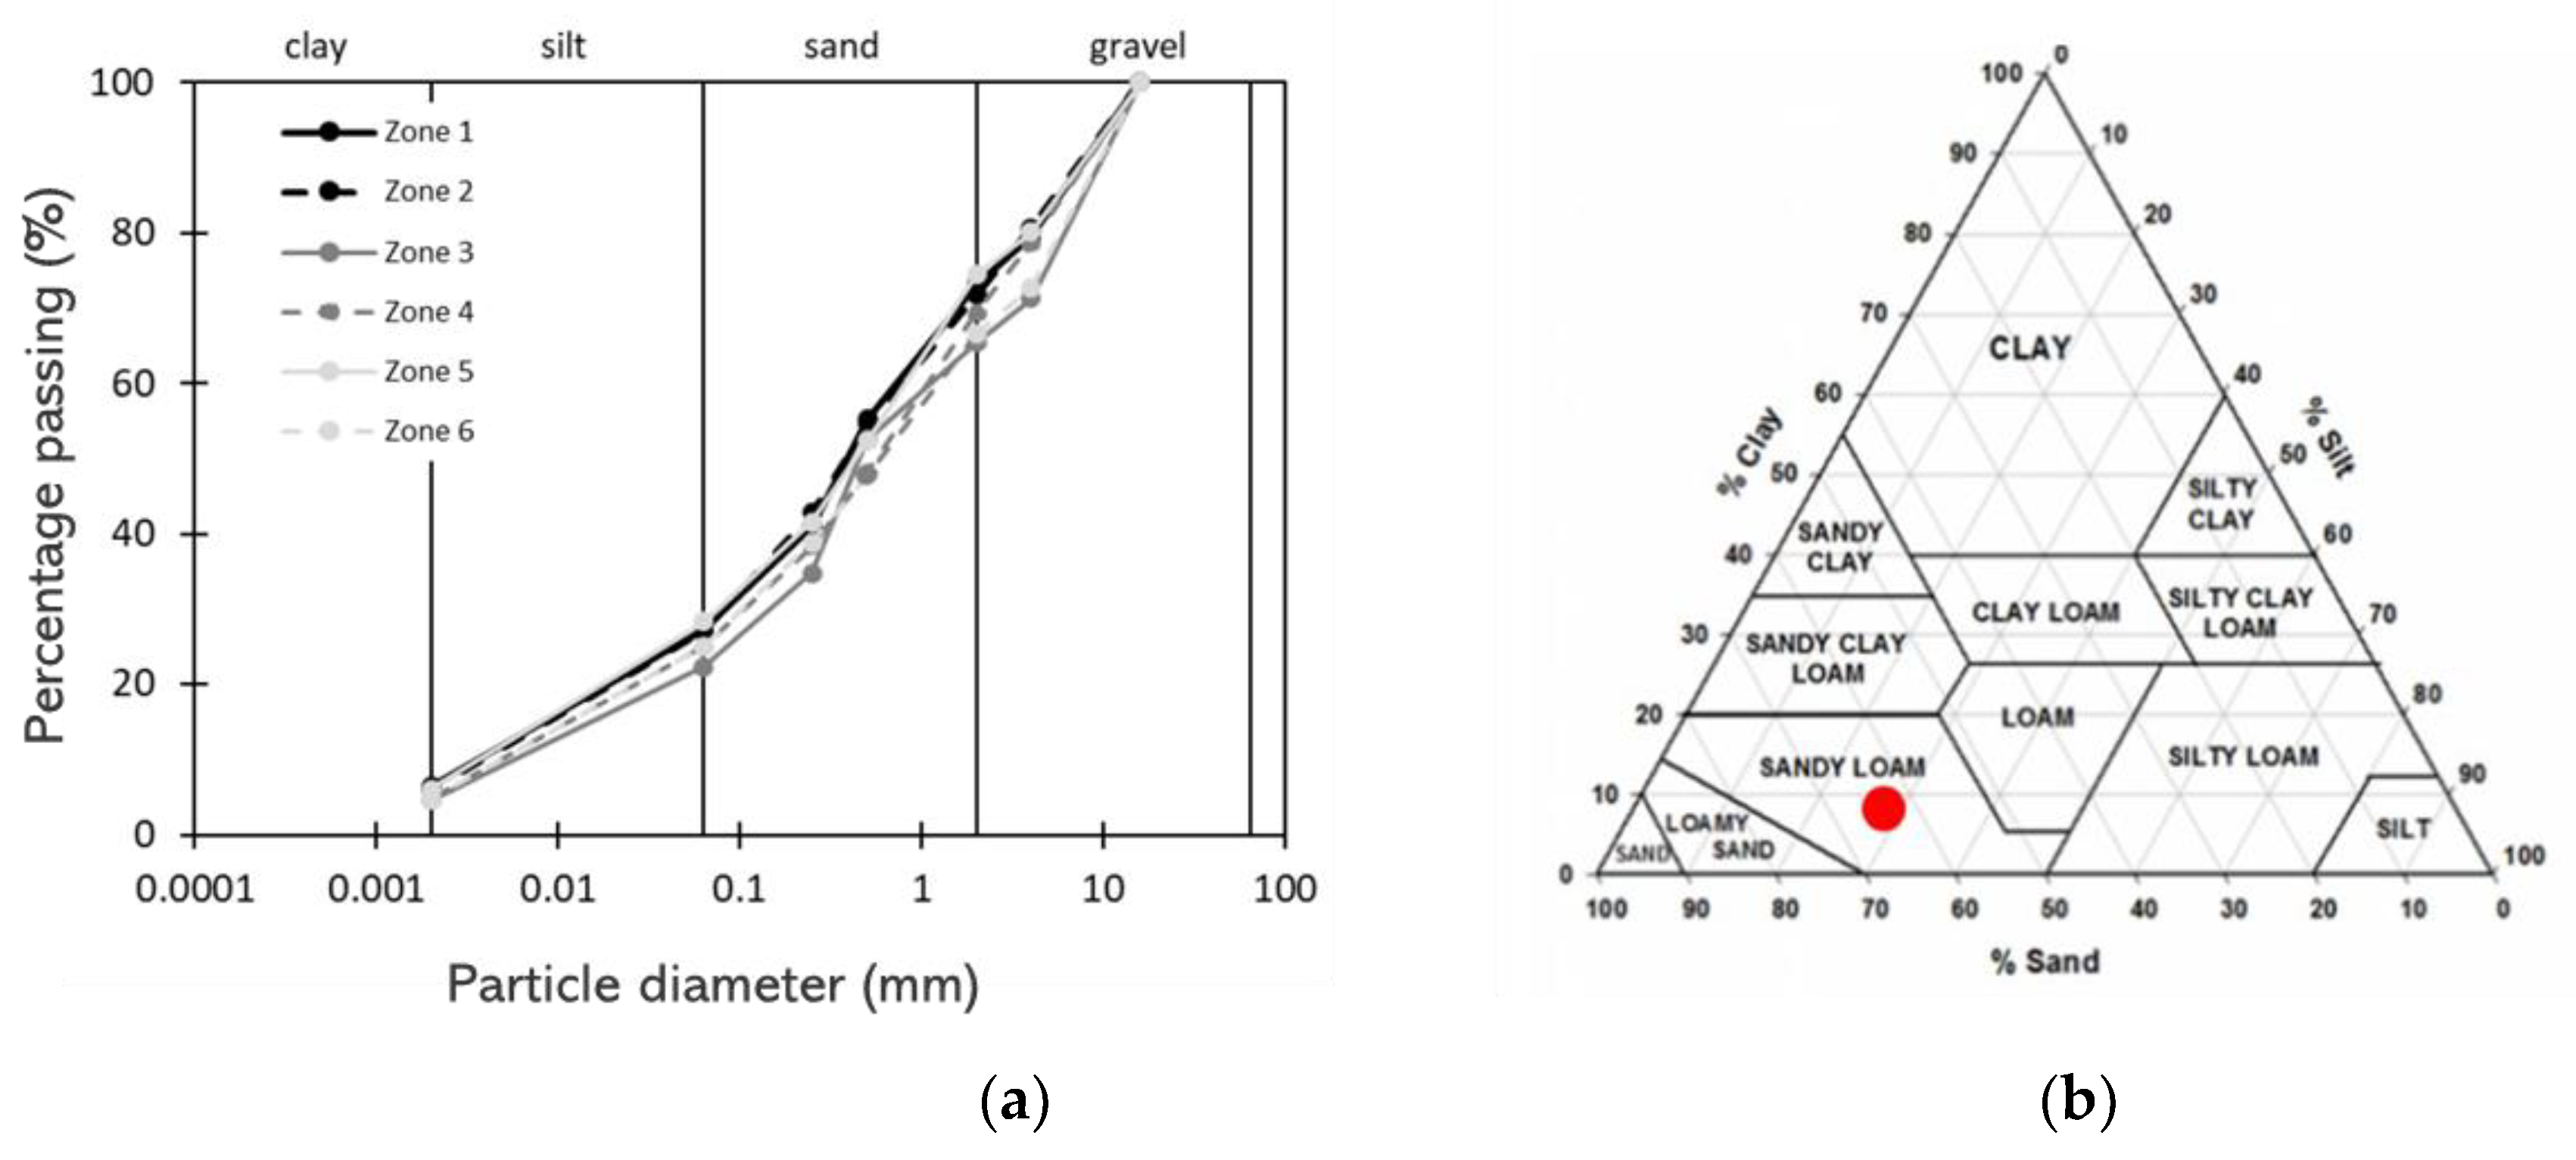
Figure 11.
Summary of different pulling tests, indicating pulling directions.
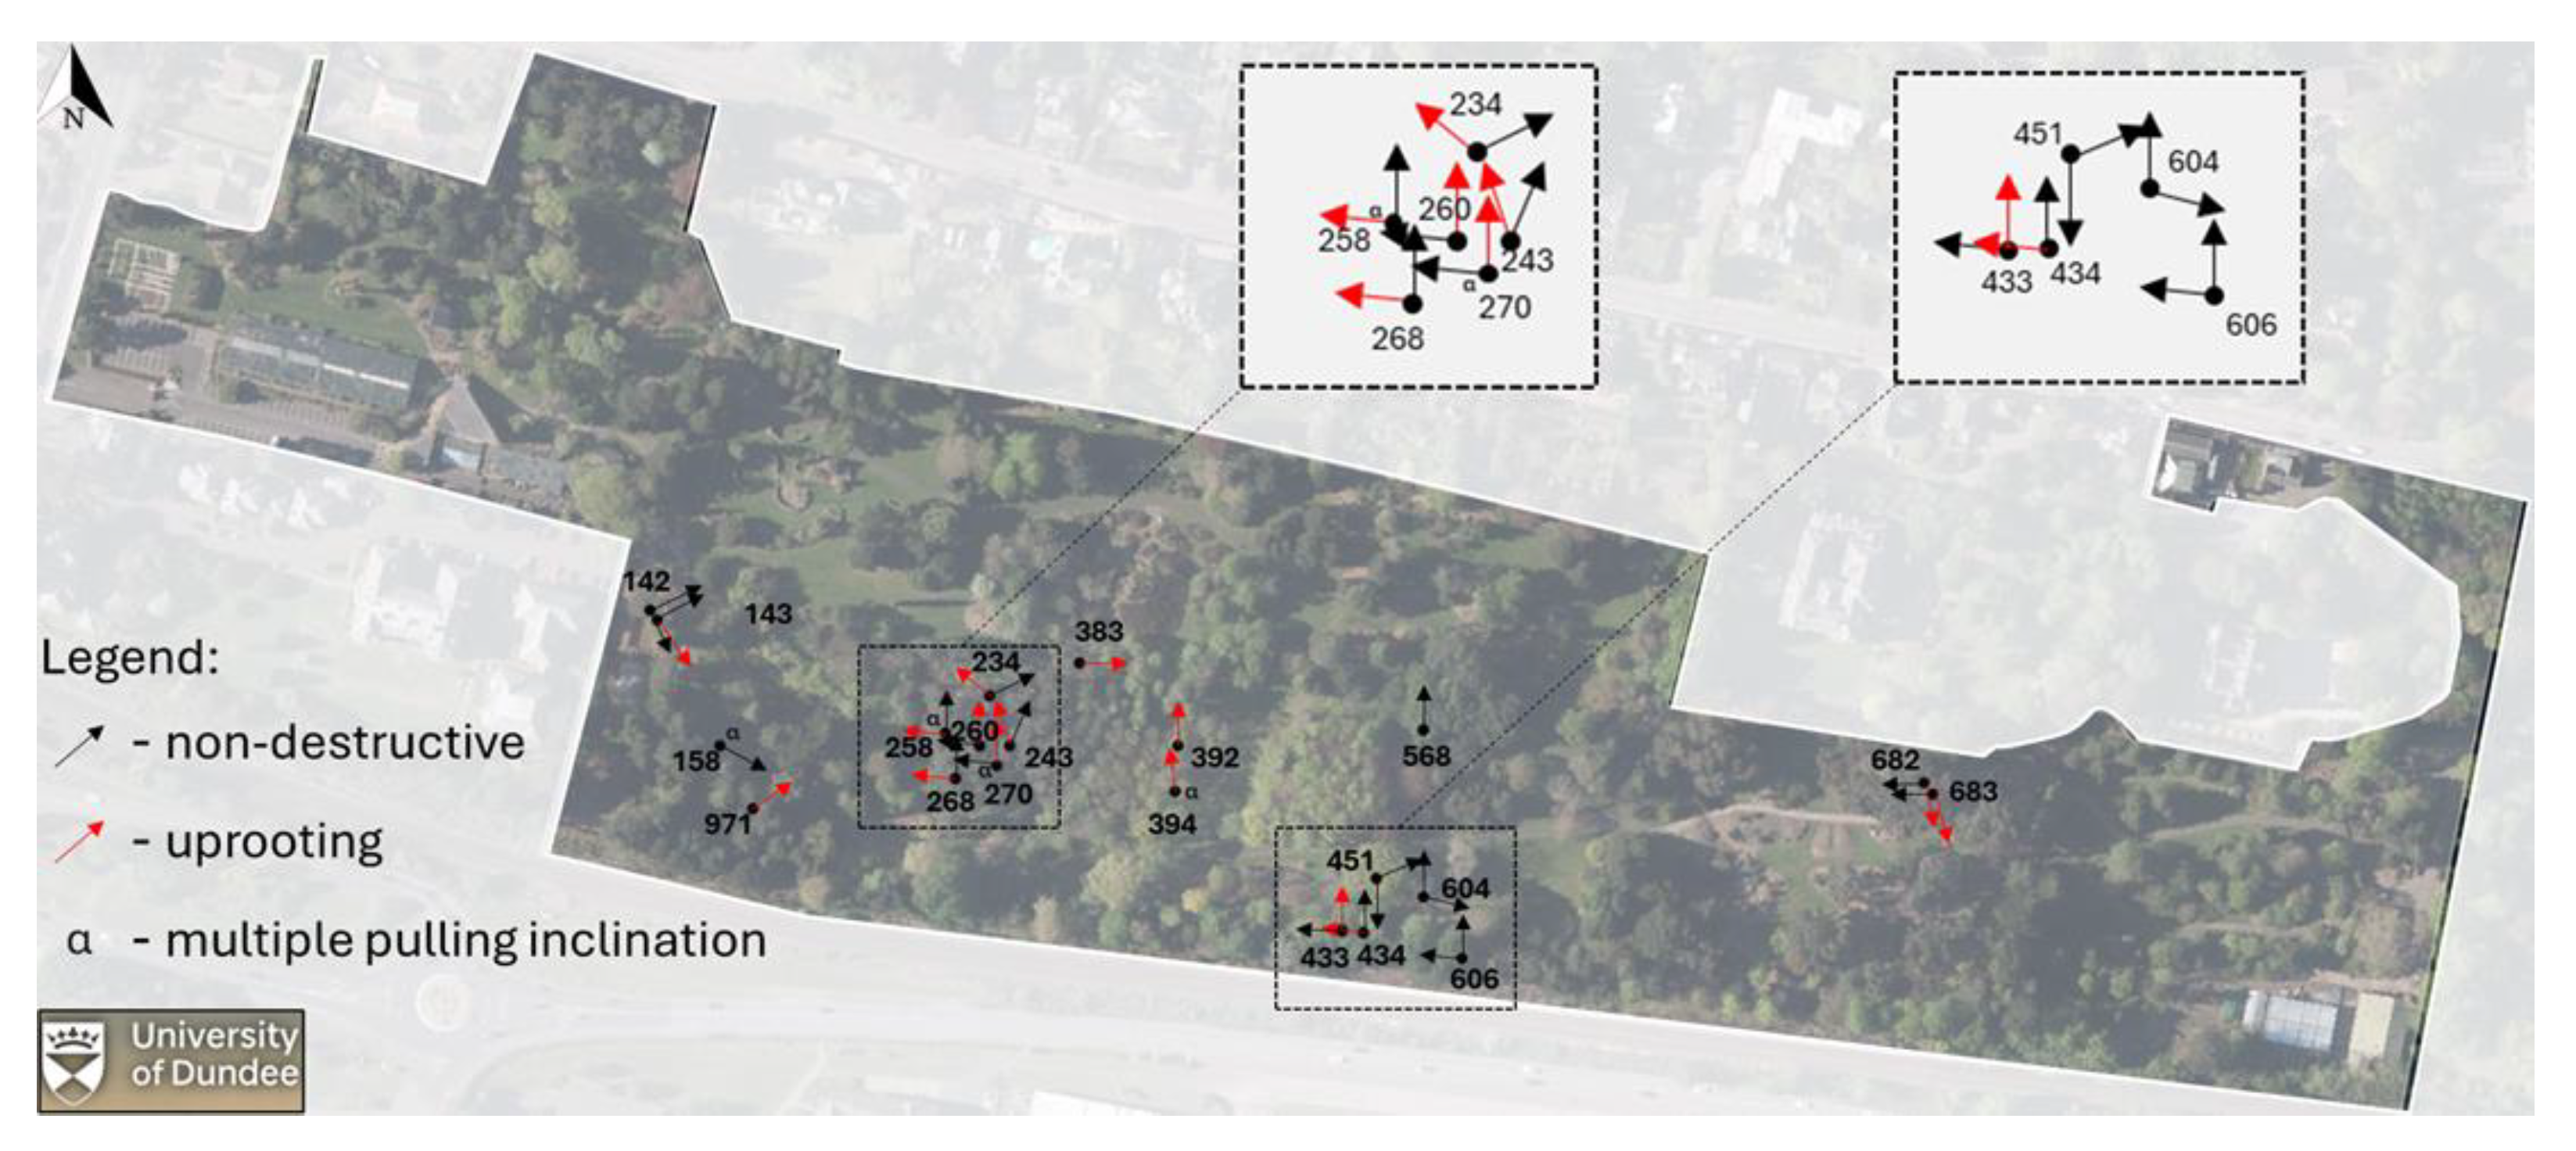
Figure 13.
Summary of moment–rotation curves from uprooting tests.
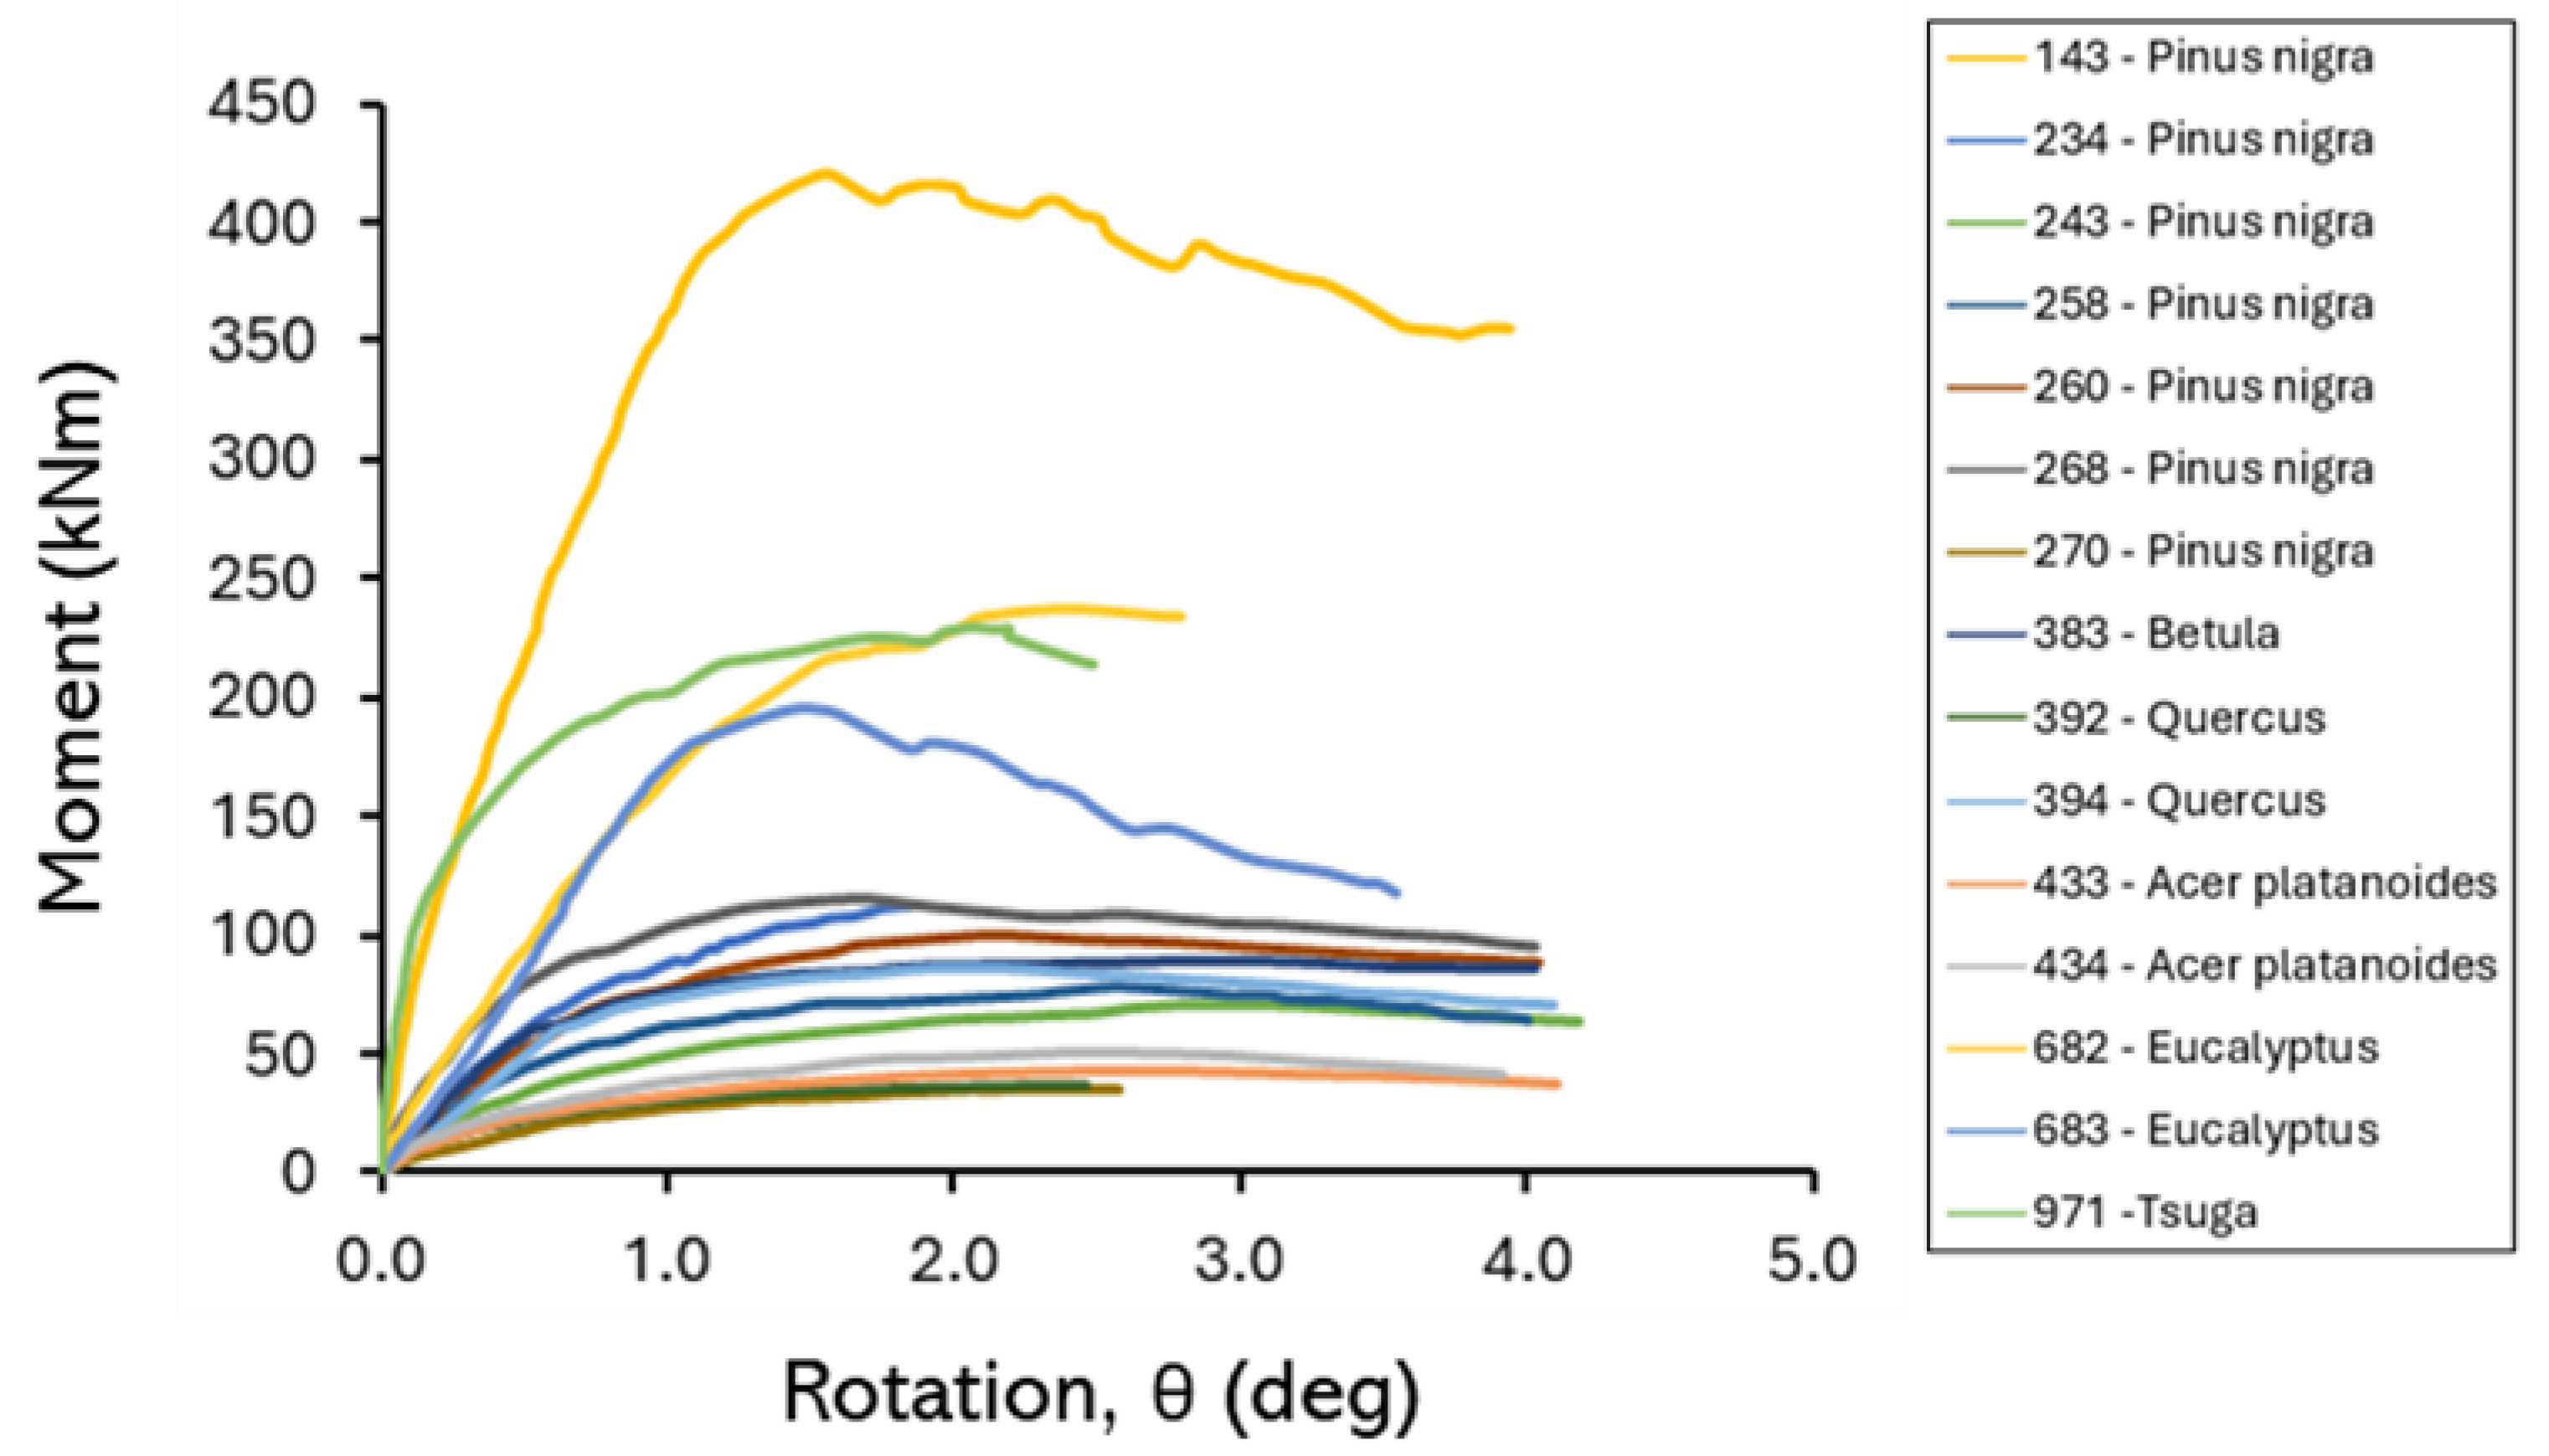
Figure 15.
Insensitivity of extrapolated limit moment to pulling angle (α). Data from a large UK uprooting test database [26] shown for context.
Figure 15.
Insensitivity of extrapolated limit moment to pulling angle (α). Data from a large UK uprooting test database [26] shown for context.
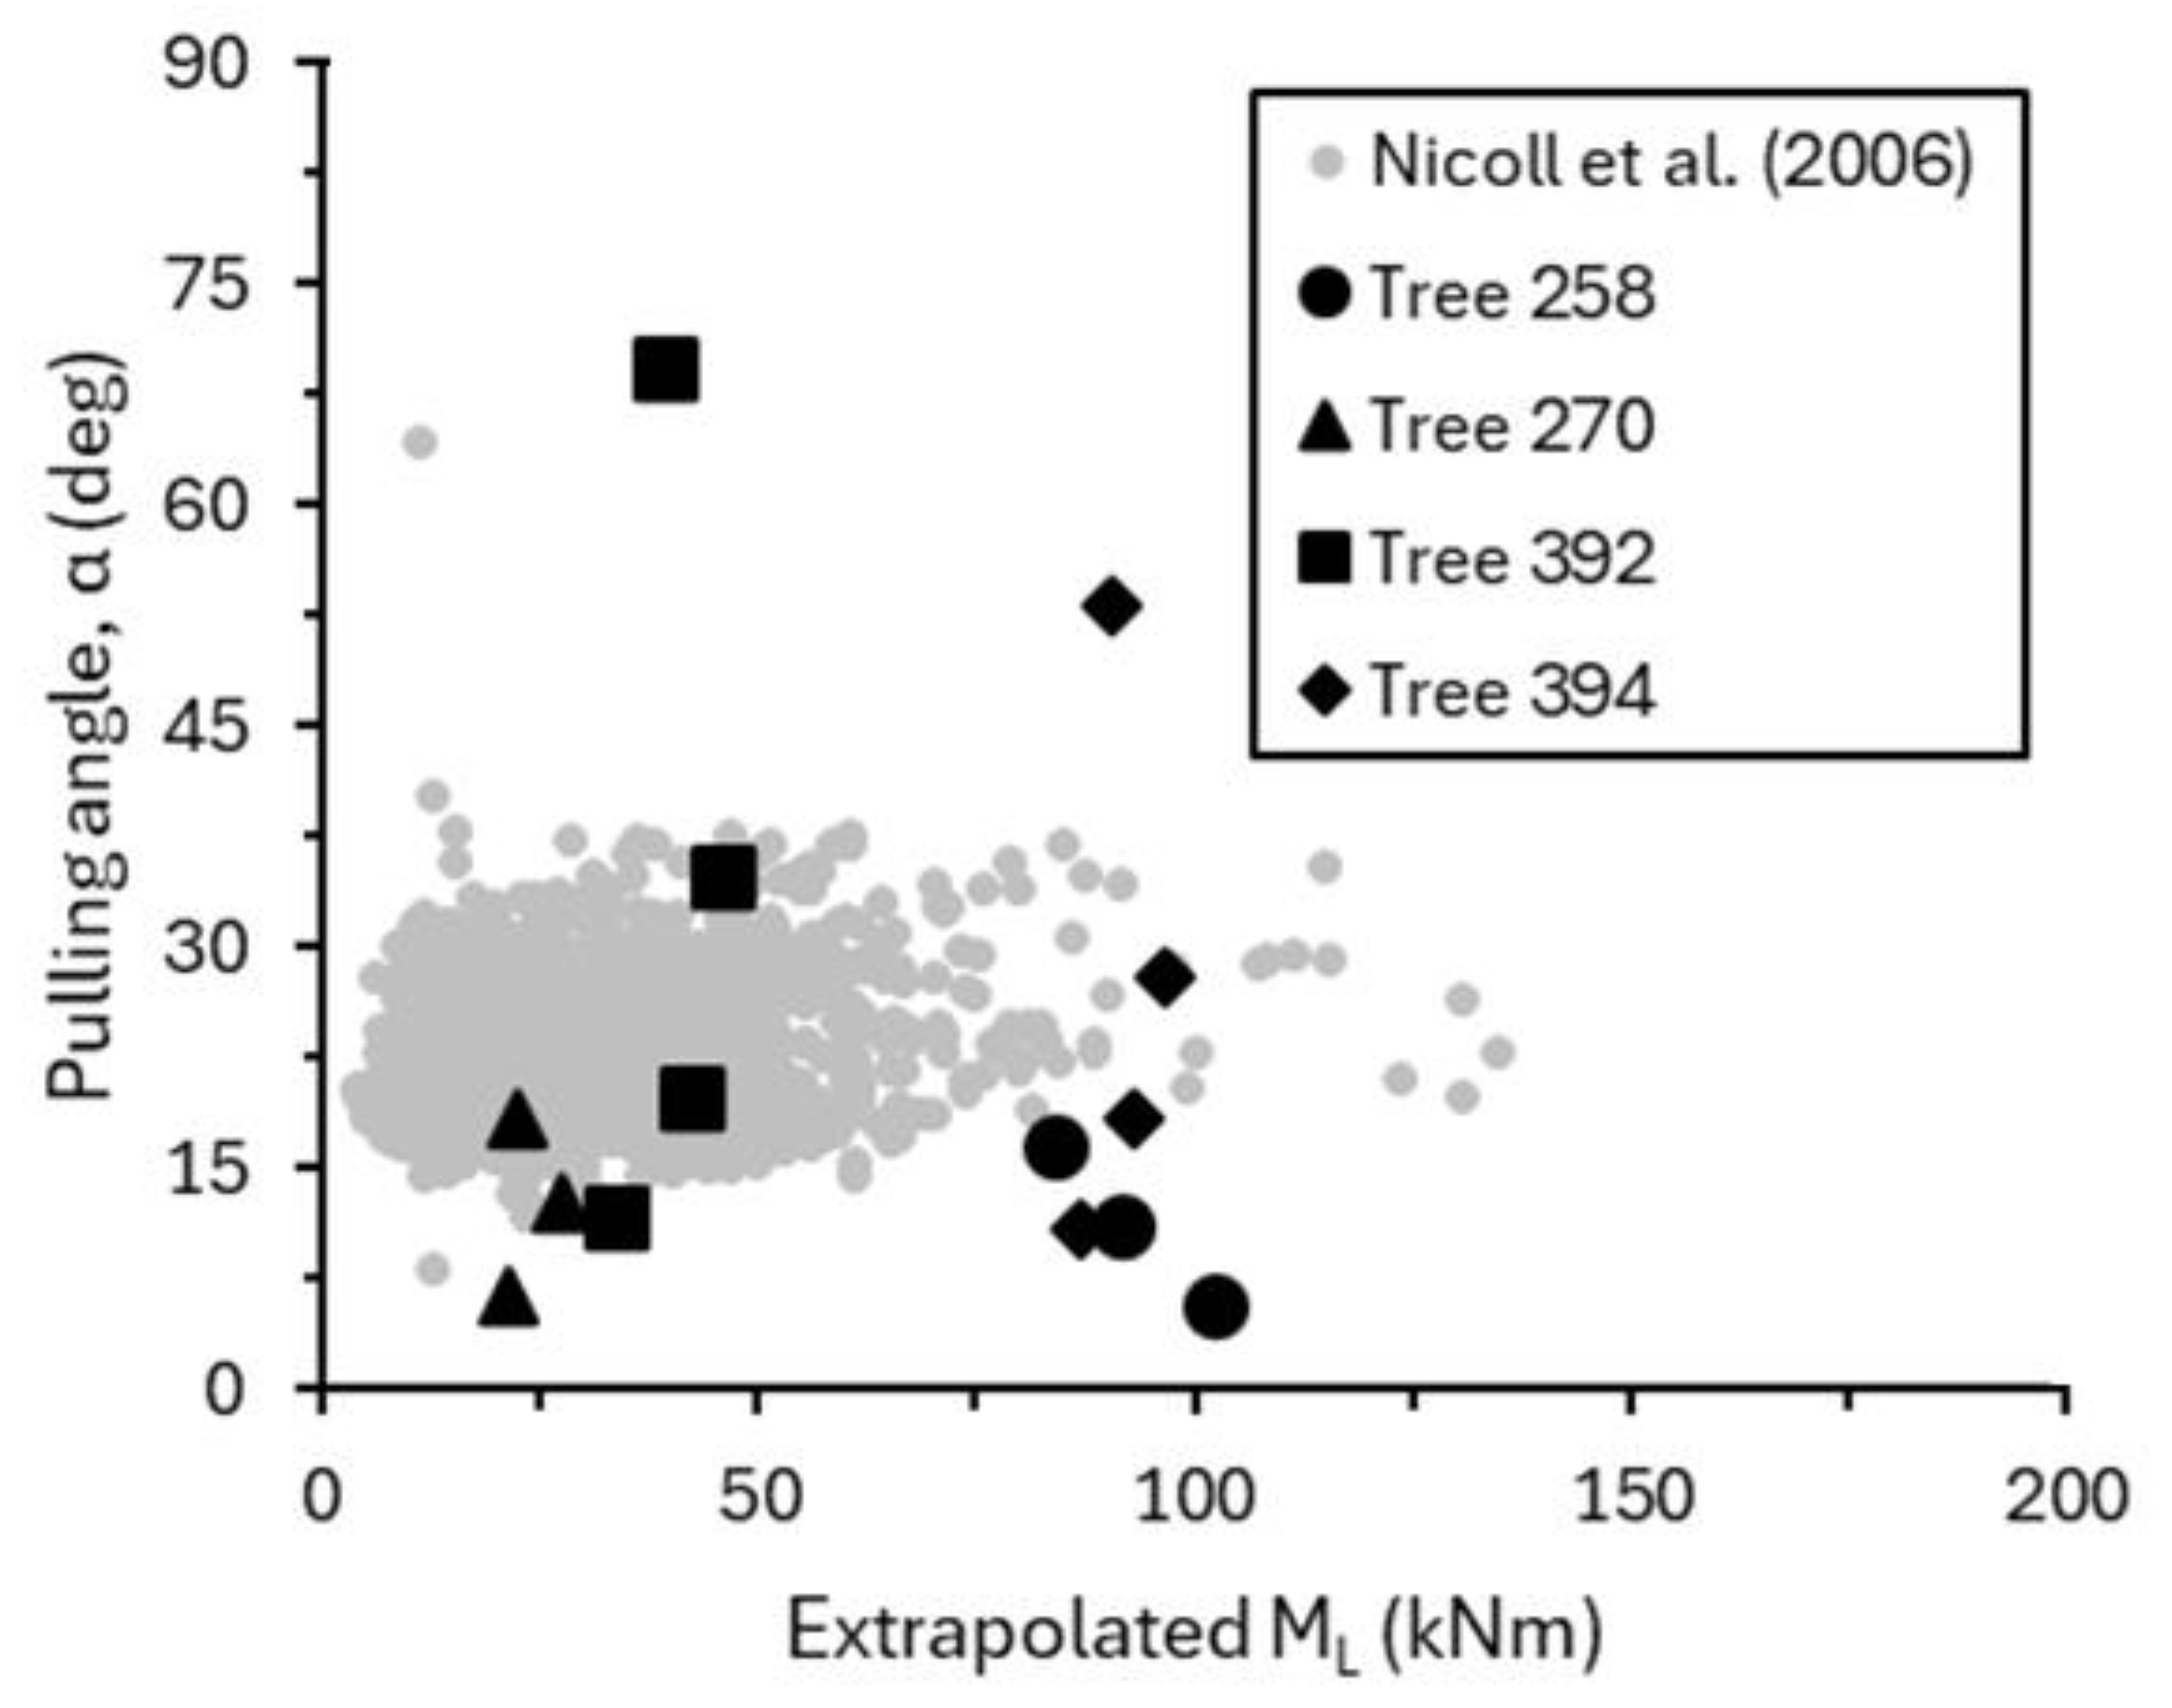
Figure 16.
(a) Comparison between measured limit moment and extrapolated values using the Wessolly and Erb and a stiffness-based approach; (b) effect of measured root plate diameter on measured limit moment. Data from a large UK uprooting test database [26] shown for context.
Figure 16.
(a) Comparison between measured limit moment and extrapolated values using the Wessolly and Erb and a stiffness-based approach; (b) effect of measured root plate diameter on measured limit moment. Data from a large UK uprooting test database [26] shown for context.
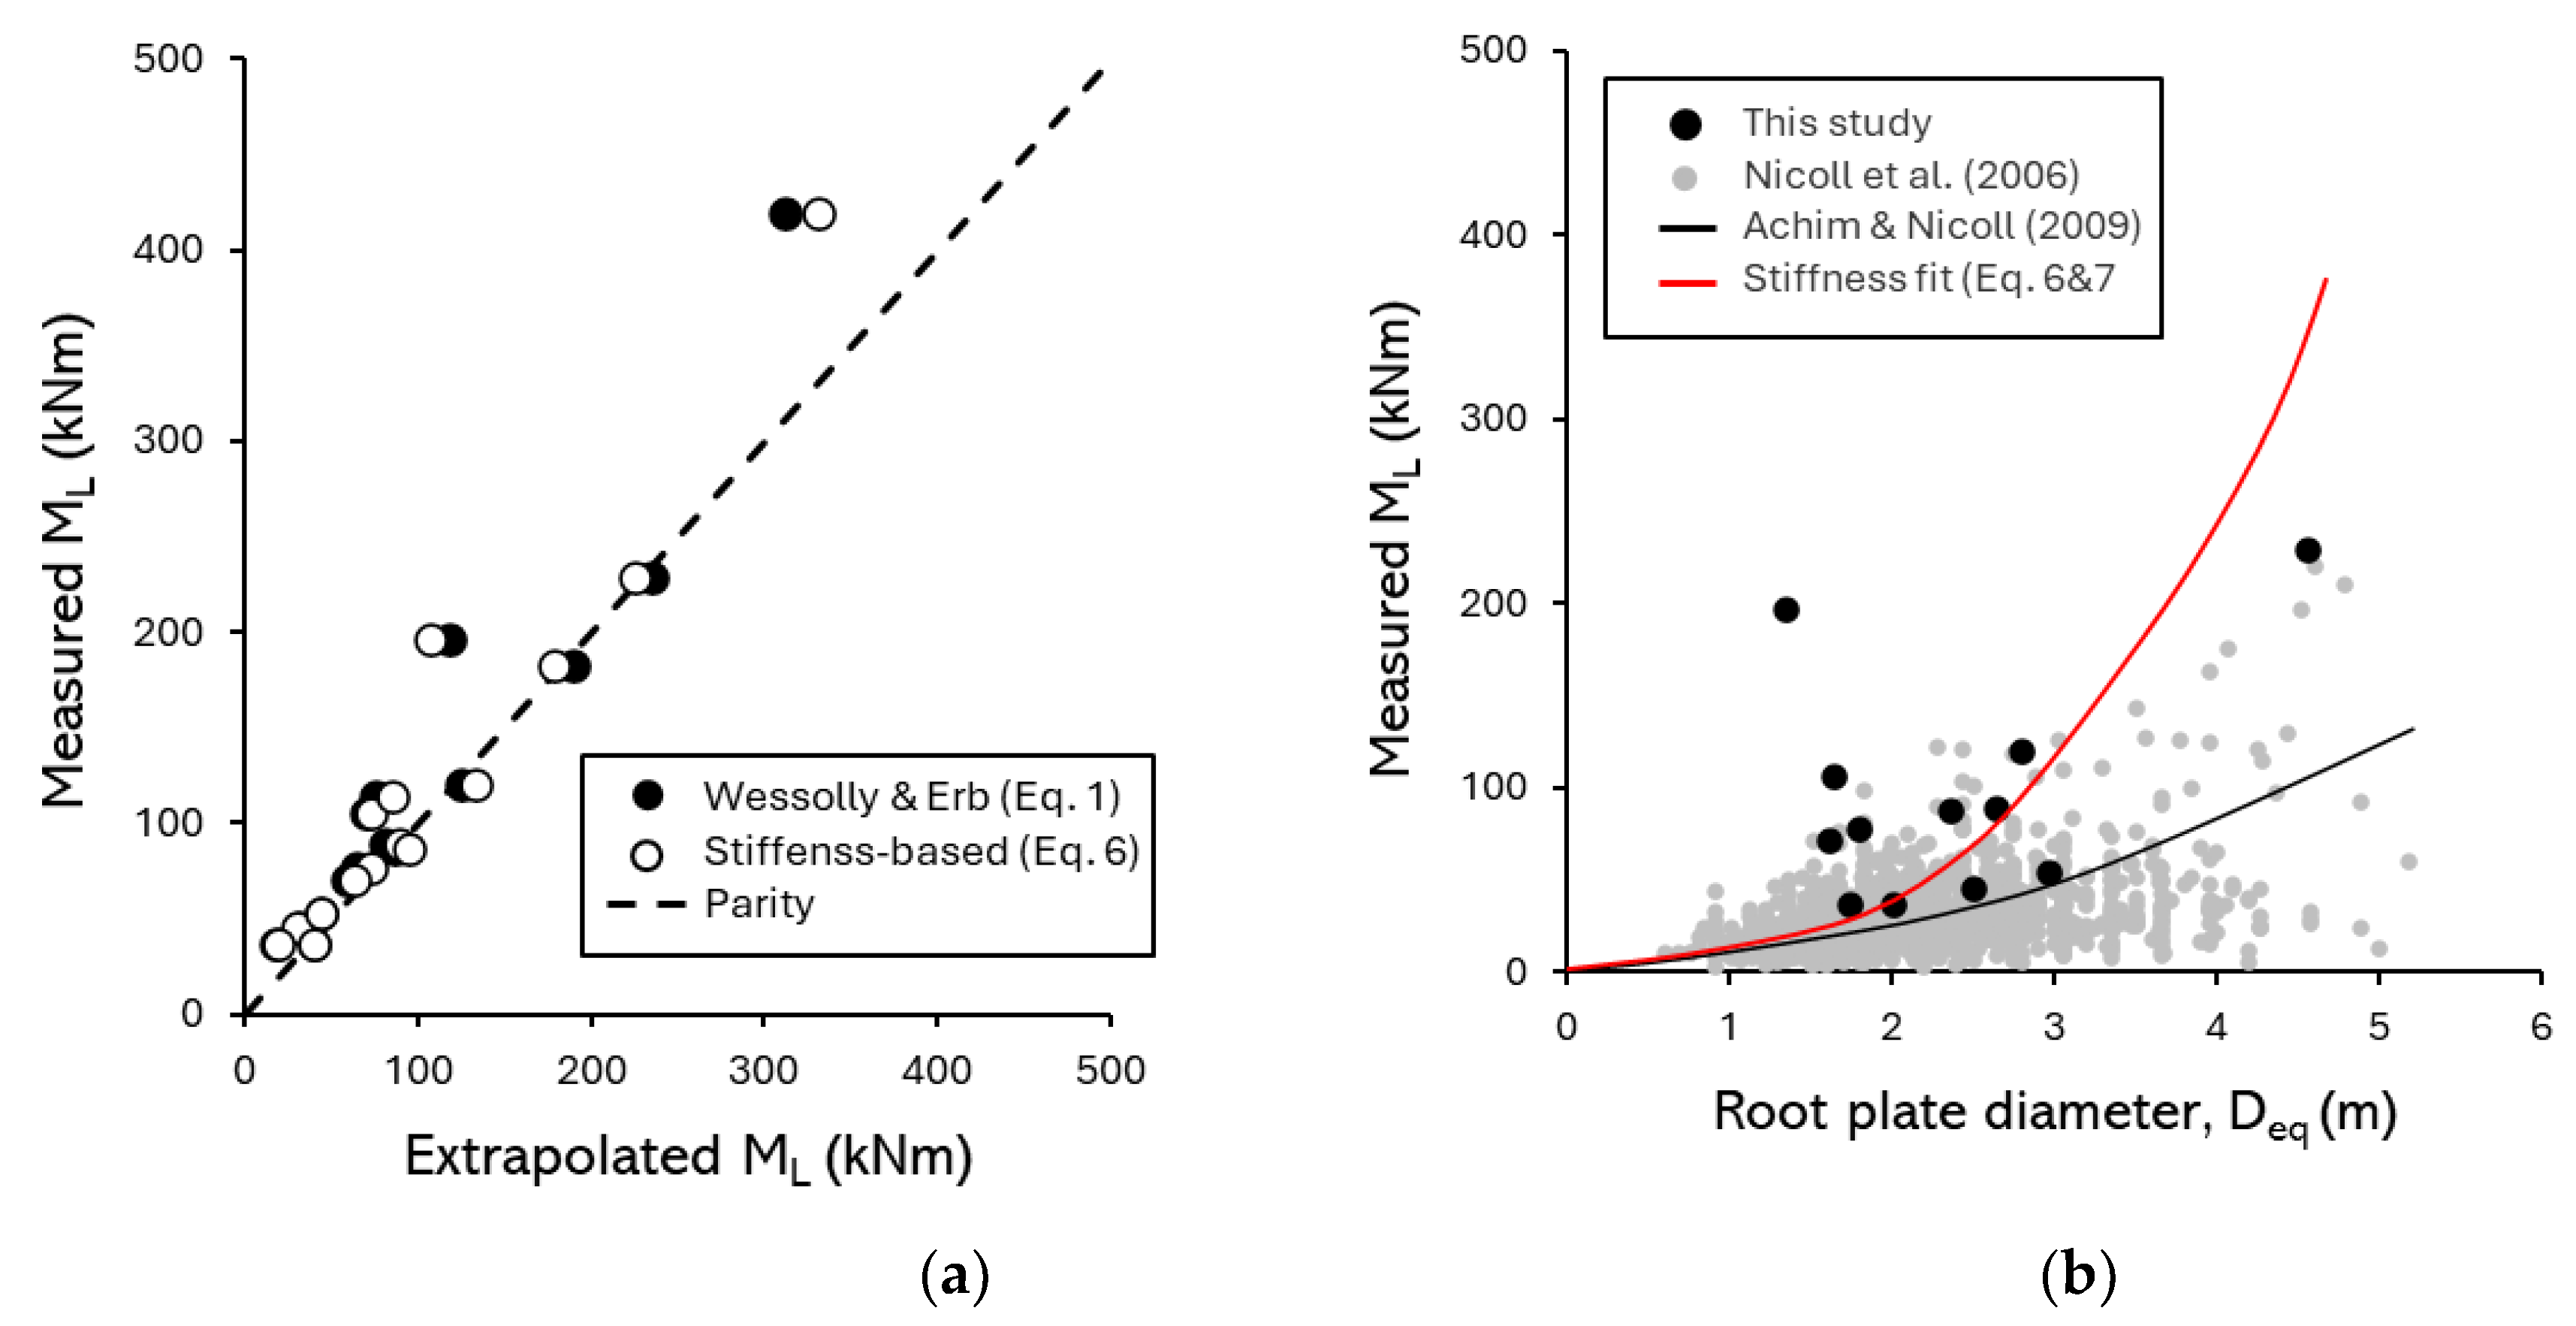
Figure 17.
a) Effect of measured root plate diameter on measured stiffness from uprooting tests and comparison to an equivalent circular footing of diameter Deq.
Figure 17.
a) Effect of measured root plate diameter on measured stiffness from uprooting tests and comparison to an equivalent circular footing of diameter Deq.
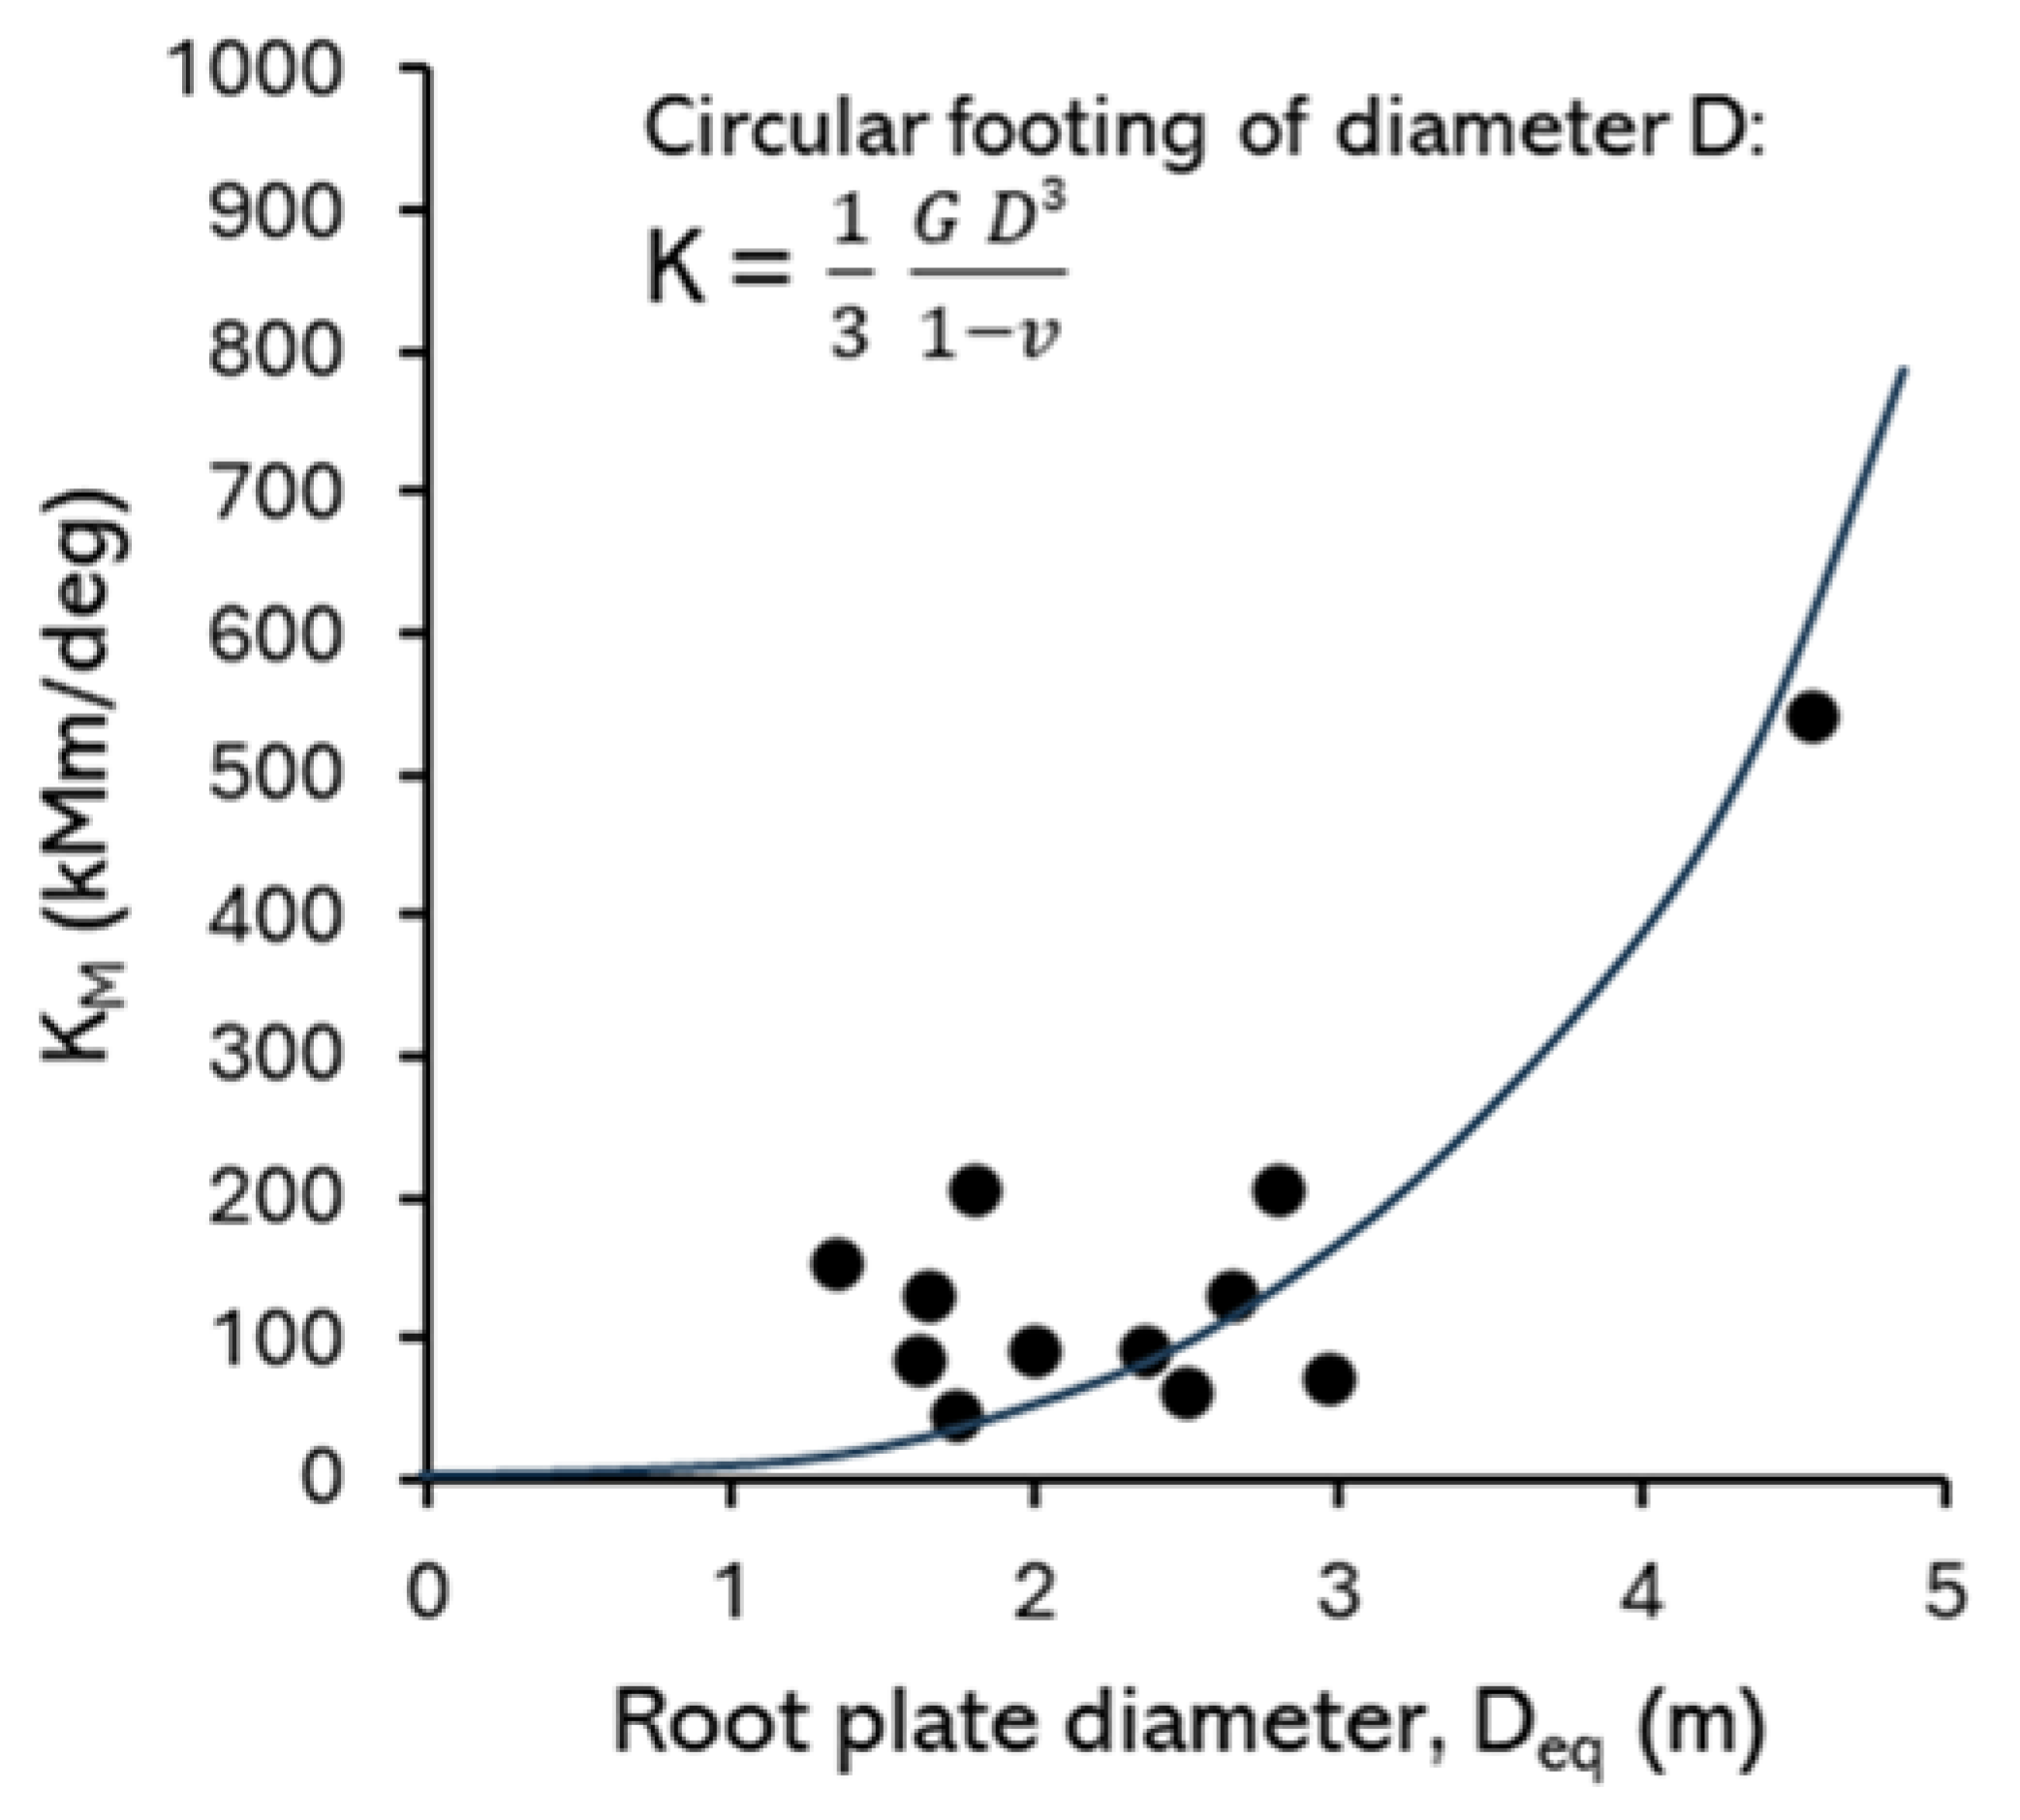

Table 1.
Summary of the individuals tree characteristics and test types conducted at each location.
| Tree-ID | Zone | Ground characterization |
Test type | Species | DBH (cm) | H (m) | ||||||
|---|---|---|---|---|---|---|---|---|---|---|---|---|
| Corkscrew | Vane test | Water content | SWRC | PSD | Non-destructive | Uproot | Multiple α | |||||
| 433 | 5 | x | x | x | x | x | x | x | Acer platanoides | 23.24 | 13.5 | |
| 434 | 5 | x | x | x | x | x | x | x | Acer platanoides | 27.06 | 13.2 | |
| 260 | 3 | x | x | x | x | x | x | x | Pinus nigra | 37.56 | 16.2 | |
| 268 | 3 | x | x | x | x | x | x | x | Pinus nigra | 44.56 | 16.5 | |
| 568 | 5 | x | x | x | x | x | x | Nothofagus | 50.93 | 15.6 | ||
| 258 | 3 | x | x | x | x | Pinus nigra | 35.65 | 17.0 | ||||
| 270 | 3 | x | x | x | x | Pinus nigra | 28.65 | 17.6 | ||||
| 158 | 2 | x | x | Picea abies | 54.11 | 20.0 | ||||||
| 604 | 5 | x | Acer platanoides | 41.38 | 9.3 | |||||||
| 451 | 5 | x | x | Acer platanoides | 120.00 | 27.0 | ||||||
| 606 | 5 | x | Nothofagus | 85.00 | 25.0 | |||||||
| 142 | 1 | x | Pinus | 53.00 | 18.0 | |||||||
| 383 | 3 | x | x | x | Betula | 52.00 | 13.0 | |||||
| 682 | 6 | x | x | Eucalyptus | 72.00 | 16.0 | ||||||
| 683 | 6 | x | x | x | x | x | x | Eucalyptus | 69.00 | 15.0 | ||
| 143 | 1 | x | x | x | x | x | x | x | Pinus | 51.00 | 17.7 | |
| 234 | 3 | x | x | x | x | x | x | Pinus | 48.00 | 12.7 | ||
| 243 | 3 | x | x | x | x | x | x | Pinus | 53.00 | 12.3 | ||
| 392 | 4 | x | x | x | x | x | x | Quercus | 22.60 | 13.0 | ||
| 394 | 4 | x | x | x | x | x | x | x | Quercus | 37.00 | 17.0 | |
| 971 | 2 | x | x | x | x | x | x | x | Tsuga | 78.00 | 12.7 | |
Table 3.
Key data from the uprooting tests.
| Tree-ID | h1 (m) | h1 (m) | α (deg) | Uproot direction | KM (kNm/deg) | ML-EXP (kNm) | θL-exp (deg) | Root plate geometry | ||||
|---|---|---|---|---|---|---|---|---|---|---|---|---|
| D1 (m) | D2 (m) | R2 (m) | Hrp (m) | Trp (m) | ||||||||
| 433 | 5.90 | 0.00 | 17.60 | N | 62.4 | 45.50 | 2.61 | 2.40 | 2.60 | - | 0.50 | - |
| 434 | 7.40 | 0.00 | 22.34 | W | 72.58 | 53.49 | 2.93 | 3.00 | 2.70 | - | 0.50 | - |
| 260 | 6.00 | 0.00 | 16.62 | N | 129.97 | 105.19 | 2.15 | 1.30 | 2.00 | - | 0.70 | - |
| 268 | 6.00 | 0.00 | 16.31 | W | 206.6 | 120.04 | 1.59 | 2.60 | 3.00 | - | 0.60 | - |
| 258 | 6.00 | 0.00 | 16.62 | W | 107.16 | 77.26 | 2.61 | 2.20 | 1.40 | - | 0.90 | - |
| 270 | 6.00 | 0.00 | 12.85 | N | 43.66 | 36.50 | 2.40 | 2.00 | 1.50 | - | 0.80 | - |
| 383 | 6.20 | 0.45 | 20.81 | E | 130.84 | 89.00 | 2.90 | 3 | 2.3 | 1.5 | 0.7 | - |
| 682 | 5.50 | 0.00 | 14.04 | SE | 219.5 | 182.75 | 2.30 | - | - | - | - | |
| 683 | 6.00 | 0.00 | 17.53 | SE | 153.14 | 196.00 | 1.80 | 1.6 | 1.1 | - | 1.2 | 1 |
| 143 | 11.70 | 0.50 | 35.67 | SE | 578 | 420.00 | 1.60 | 2.7 | 1.5 | 0.51 | 0.8 | 0.4 |
| 234 | 11.00 | 0.00 | 12.00 | NW | 131.51 | 114.00 | 1.85 | - | - | - | - | - |
| 243 | 10.00 | 0.00 | 11.00 | NW | 85.96 | 71.00 | 2.96 | 1.7 | 1.53 | 1.03 | 0.63 | 1.15 |
| 392 | 4.60 | 0.00 | 11.81 | N | 89.57 | 36.40 | 2.46 | 2.47 | 1.55 | 0.93 | 1.65 | 0.61 |
| 394 | 4.60 | 0.00 | 10.85 | N | 92.34 | 86.90 | 1.95 | 3.01 | 1.7 | 0.89 | 0.5 | 0.64 |
| 971 | 8.00 | 0.85 | 12.99 | NE | 542.45 | 229.00 | 2.20 | 4.54 | 4.57 | - | 0.52 | 0.45 |
Table 2.
Non-destructive pulling tests results. h1 and h2 are the heights as indicated in Figure 10. KM is the stiffness, and ML is the maximum moment predicted by Eq. (1).
Table 2.
Non-destructive pulling tests results. h1 and h2 are the heights as indicated in Figure 10. KM is the stiffness, and ML is the maximum moment predicted by Eq. (1).
| Tree-ID |
h1 (m) |
h2 (m) | α (deg) | Pull direction |
KM (kNm/deg) |
ML (Wessolly) (kNm) |
| 433 | 5.90 | 0.00 | 17.60 | N | 53.39 | 31.28 |
| 5.90 | 0.00 | 21.87 | W | 49.85 | 29.54 | |
| 434 | 7.40 | 0.00 | 23.40 | N | 72.96 | 42.50 |
| 7.40 | 0.00 | 21.25 | W | 71.65 | 43.44 | |
| 260 | 6.00 | 0.00 | 16.62 | N | 120.63 | 69.79 |
| 6.00 | 0.00 | 17.79 | W | 76.77 | 42.04 | |
| 268 | 6.00 | 0.00 | 11.77 | N | 220.44 | 127.85 |
| 6.00 | 0.00 | 16.31 | W | 212.27 | 125.38 | |
| 568 | 6.50 | -1.50 | 20.85 | N | 682.34 | 402.72 |
| 6.50 | -1.50 | 20.24 | W | 668.87 | 405.14 | |
| 258 | 3.00 | 0.00 | 5.71 | N | 171.22 | 98.24 |
| 6.00 | 0.00 | 11.31 | N | 150.02 | 89.35 | |
| 9.00 | 0.00 | 16.70 | N | 139.96 | 80.73 | |
| 6.00 | 0.00 | 16.62 | W | 114.64 | 64.62 | |
| 270 | 6.00 | 0.00 | 12.85 | N | 29.73 | 17.64 |
| 3.00 | 0.00 | 6.36 | W | 37.96 | 20.87 | |
| 6.00 | 0.00 | 12.57 | W | 30.16 | 18.01 | |
| 9.00 | 0.00 | 18.50 | W | 34.96 | 21.15 | |
| 158 | 6.00 | 0.00 | 25.82 | W | 470.30 | 289.78 |
| 9.00 | 0.00 | 35.97 | W | 466.22 | 281.32 | |
| 12.00 | 0.00 | 44.06 | W | 487.89 | 322.67 | |
| 604 | 3.00 | 0.00 | 17.70 | N | 133.61 | 83.91 |
| 3.00 | 0.00 | 15.17 | W | 104.38 | 61.81 | |
| 451 | 7.90 | -1.00 | 16.04 | E | 3566.48 | 1444.90 |
| 7.90 | 0.00 | 26.28 | S | 12464.13 | 6048.33 | |
| 606 | 12.00 | -0.45 | 24.80 | N | 2453.84 | 1182.13 |
| 12.00 | 0.00 | 25.20 | W | 1667.04 | 718.61 | |
| 142 | 9.60 | 0.30 | 25.67 | SE | 298.48 | 185.71 |
| 9.60 | -0.40 | 20.20 | NE | 366.12 | 215.04 | |
| 383 | 6.20 | 0.45 | 20.81 | E | 142.51 | 81.23 |
| 682 | 5.50 | 0.00 | 14.04 | SE | 342.92 | 187.09 |
| 5.50 | 0.00 | 9.90 | W | 203.54 | 122.37 | |
| 683 | 5.00 | 0.00 | 14.04 | SE | 213.51 | 118.60 |
| 5.00 | 0.00 | 11.77 | W | 169.40 | 102.15 | |
| 143 | 11.70 | 0.50 | 35.67 | SE | 526.02 | 311.29 |
| 11.70 | -0.50 | 24.13 | NE | 458.42 | 243.21 | |
| 234 | 11.00 | 0.00 | 19.54 | NW | 135.02 | 75.13 |
| 11.00 | 0.00 | 33.22 | NE | 152.44 | 82.82 | |
| 243 | 10.00 | 0.00 | 25.46 | NE | 77.43 | 46.00 |
| 10.00 | 0.50 | 33.23 | NW | 99.12 | 58.77 | |
| 392 | 8.00 | 0.00 | 19.98 | N | 78.68 | 42.47 |
| 8.00 | 0.00 | 34.82 | N | 89.00 | 46.76 | |
| 8.00 | 0.00 | 69.44 | N | 76.22 | 39.28 | |
| 4.60 | 0.00 | 11.81 | N | 57.84 | 33.65 | |
| 394 | 4.60 | 0.00 | 10.85 | N | 147.13 | 86.82 |
| 8.00 | 0.00 | 18.43 | N | 150.85 | 92.11 | |
| 8.00 | 0.00 | 28.07 | N | 149.23 | 97.19 | |
| 8.00 | 0.00 | 53.13 | N | 165.77 | 90.77 | |
| 971 | 8.00 | -0.85 | 11.55 | NE | 385.53 | 234.70 |
Table 4.
Comparison between extrapolated limit moment in west (MLW) and north (MLN) directions.
| Tree-ID | MLW (kNm) | MLN (kNm) | N / W |
| 433 | 29.54 | 31.28 | 1.06 |
| 434 | 43.44 | 42.5 | 0.98 |
| 260 | 42.04 | 69.79 | 1.66 |
| 260 | 125.38 | 127.85 | 1.02 |
| 568 | 405.14 | 402.72 | 0.99 |
| 258 | 64.62 | 89.35 | 1.38 |
| 270 | 18.01 | 17.64 | 0.98 |
| 604 | 61.81 | 83.91 | 1.36 |
| 606 | 718.61 | 1182.13 | 1.65 |
| average = | 1.23 |
Table 5.
Comparison of extrapolated limit moments for different pull angles with measured limit moments from uprooting tests.
Table 5.
Comparison of extrapolated limit moments for different pull angles with measured limit moments from uprooting tests.
| Non-destructive | Uprooting | |||
| Tree - ID | α (deg) | ML (kNm) | ML (kNm) | Deq (m) |
| 258 | 5.71 | 98.24 | 77.26 | 1.8 |
| 11.31 | 89.35 | |||
| 16.7 | 80.73 | |||
| 270 | 6.36 | 20.87 | 36.50 | 1.75 |
| 12.57 | 18.01 | |||
| 18.5 | 21.15 | |||
| 392 | 19.98 | 42.47 | 36.40 | 2.01 |
| 34.82 | 46.76 | |||
| 69.44 | 39.28 | |||
| 11.81 | 33.65 | |||
| 394 | 10.85 | 86.82 | 86.90 | 2.36 |
| 18.43 | 92.11 | |||
| 28.07 | 97.19 | |||
| 53.13 | 90.77 | |||
Disclaimer/Publisher’s Note: The statements, opinions and data contained in all publications are solely those of the individual author(s) and contributor(s) and not of MDPI and/or the editor(s). MDPI and/or the editor(s) disclaim responsibility for any injury to people or property resulting from any ideas, methods, instructions or products referred to in the content. |
© 2025 by the authors. Licensee MDPI, Basel, Switzerland. This article is an open access article distributed under the terms and conditions of the Creative Commons Attribution (CC BY) license (http://creativecommons.org/licenses/by/4.0/).
Copyright: This open access article is published under a Creative Commons CC BY 4.0 license, which permit the free download, distribution, and reuse, provided that the author and preprint are cited in any reuse.


