Submitted:
08 October 2025
Posted:
08 October 2025
You are already at the latest version
Abstract
Urban sustainability has become a central theme in contemporary city planning and pol-icy-making, reflecting the growing need to address complex environmental, social, and economic challenges. However, the range of metrics used to measure sustainability often results in fragmentation and inconsistency, limiting their practical application. The pre-sent study aims to analyze and systematize the urban sustainability indicators most commonly found in literature and employed at the international level. The research seeks to develop a comprehensive framework of economic, environmental, and social indica-tors, providing a more coherent and standardized tool to support informed and effective urban regeneration strategies. In particular, in this work a critical examination of the in-dicators is carried out, highlighting inherent limitations, potential distortions, and the standardizability level. To ensure more reliable and transparent measurement tools, the outcome of the analysis is the definition of a structured abacus of key urban sustainability indicators, classified across three main domains (economic, environmental, and social), able to orient the choices processes to promote sustainable cities development.
Keywords:
urban sustainability
; indicators
; economic sustainability
; environmental sustainability
; social sustainability
; urban policies
; sustainable urban development
1. Introduction
One of the most frequently recurring keywords in the language of public policy, territorial planning and international development programs is “sustainability.” Its growing centrality reflects the urgency of addressing a global crisis that simultaneously involves climate change, biodiversity, social equity and the resilience of local economies. In this context, sustainability is not conceived as a condition to be achieved, but rather as a dynamic process that requires informed political choices, based on actual and effective data and consistent assessment tools capable of translating principles into concrete and measurable parameters, adaptable to different territories [1].
From this perspective, the 2030 Agenda – adopted in 2015 by the United Nations [2] – has provided a global framework based on 17 Sustainable Development Goals (SDGs), along with a set of economic, environmental, and social indicators related to sustainability to measure and monitor the progress level of each country towards the proposed SDGs achieved [3]. In fact, to each SDG is associated a framework of indicators to assess the performance and the effectiveness of the policies and actions undertaken to reach the objectives.
The practical use of these economic, environmental and social sustainability indicators is essential for transforming theoretical data into operational tools, intended as instruments to support public and private decision-making, and to guide administrative and planning strategies [4]. In particular, in territorial governance, the indicators make it possible to more effectively address intervention plans starting from objective and quantitative information. These tools allow for i) comparison between different territorial and socioeconomic contexts, supporting the identification of critical issues and best practices and ii) the definition of targeted development measures, based on the specific characteristics of each local area.
In this regard, sustainability indicators play an active role in developing urban strategical operations, going beyond their descriptive function to become an essential part of territory management. The increasing availability of data and the use of advanced technologies, such as Geographic Information Systems (GIS) and big data, are fundamental for expanding analytical abilities. As demonstrated by Morano, Locurcio et al.(2020) [5], the GIS models implementation allows the integration of spatial data with economic, environmental, and social indicators, enhancing sustainability analysis in both the real estate sector and urban planning. Batty [6] also highlights the emerging role of big data in smart city management, indicating how the combination of new technologies can make measurement tools more precise and adaptable to the needs of policymakers and local communities.
These notions are being translated into practical tools able to support urban policies in numerous cities: one of the most significant examples is Copenhagen (Denmark), which has joined sustainability indicators to improve city mobility and reduce environmental impact. Monitoring CO₂ emissions — both per capita and in relation to the percentage of renewable energy in the urban energy mix — has allowed the Danish capital to reduce these emissions by 42% between 2005 and 2020 [7]. At the same time, through the use of sustainable mobility indicators, it has been possible to optimize the existing cycling infrastructure, resulting in 49% of residents using bicycles as their main means of transport. The strategic use of environmental and social indicators has enabled the city of Copenhagen to set the goal of becoming carbon-neutral by 2025, thus attesting the effectiveness of a data-driven approach in urban planning [4].
Another case of successful integration between sustainability indicators comes from Germany, which has identified environmental measurement tools targeted at the transition to renewable energy. By monitoring the share of renewable energy in total national production, the country has increased the percentage of electricity produced from clean sources from 6% in 2000 to 50% in 2022 [8]. The policies promoting photovoltaic and wind energy, supported by the use of environmental indicators, have helped the reduction of CO₂ emissions by 35% between 1990 and 2020 and have strengthened the use of the Energiewende model [9].
Beijing (China), one of the cities with the highest levels of air pollution, applies the environmental indicators to monitor air quality: data on fine particulate matter (PM2.5) emissions are employed to guide municipal programs and plans [10]. Additionally, the Chinese government publishes daily air quality updates to limit the release of harmful substances: thanks to this measure, between 2013 and 2020, Beijing has reduced PM2.5 concentration by 35%, showing how the use of indicators can provide effective responses to environmental emergencies [11].
Furthermore, Cape Town (South Africa) monitors the water resource management through the utilization of sustainability indicators: during the severe water crisis in 2018, the city has used per capita water consumption data to introduce appropriate restrictions and implement rationing strategies [12]. Daily consumption has been reduced from 250 liters in 2015 to less than 50 liters in 2018, setting a replicable model for other cities facing water stress [3].
In this framework, it should be highlighted that, despite progress shown in some cities and the mentioned positive examples, the practical applicability of indicators — especially at the urban scale — remains complex due to the variety of local contexts, fragmentation of accessible data and the need to adapt global tools to heterogeneous territories [9]. Faced with these challenges, a growing need to adopt a more holistic vision of sustainability that transcends sectoral approaches and captures the complexity of the relationships between economy, environment and society in urban contexts, is pointed out.
Such a perspective requires not only more integrated tools but also a significant change in measurement modalities: it is not enough to have data, it is crucial that these are interpreted within coherent analytical frameworks that can reflect territorial specificities without giving up comparative readability at a global scale [12,13,14].
Within this scenario, cities — as decision-intensive spaces — need indicators capable of adequately analyzing the dynamic interaction between environmental, economic, and social components. In recent years, an increasing development of evaluation tools designed to support public action in pursuing sustainability goals and assessing their impact over time. Nevertheless, structural challenges remain: the proposed indicators are often heterogeneous in terms of methodology, scale and sources. Their construction involves arbitrary choices, including variable selection, weighting, normalization methods and aggregation criteria [15]. Moreover, excessive use of comparative rankings can lead to misleading simplifications, reducing the ability to take into account local specificities and, sometimes, turning the assessment tool into a communication driven rather than a transformational one. For this reason, the sustainability evaluation must be assumed not only as a technical operation but as a transformative process, helping cities define shared priorities, actively involve local stakeholders, and design more equitable and resilient strategies in the long term [16].
2. Aim
The aim of the present study is to analyze and systematize the urban sustainability indicators found in the literature and ordinarily used at the international level. The research pursues to overcome the fragmentation caused by the multitude of indicators and to ensure a more coherent and standardized approach to support urban regeneration policies, that, based on the detection and measurement of these indicators, should be oriented toward territorial interventions consistent with them.
This work does not merely catalog the existing urban sustainability indicators but also analyzes their effectiveness, highlighting limitations, distortions and potential improvements to guarantee more reliable and transparent measurement tools [17]. Critical aspects of current indicators and prospects for upgrading are examined, with particular attention to the integration of new technologies to support political, economic, and urban decision-making [18]. Therefore, the capacity to transform available data into operational tools is fundamental to ensuring cities sustainable development programs and to prevent indicators from becoming exclusively marketing Instruments or regulatory compliance checklists [19].
To the described scope, this research highlights the central role of the urban sustainability indicators, which allow for i) evaluating the potential of a specific site, ii) identifying areas requiring urgent intervention, and iii) guiding planned actions for urban enhancement and transformation.
The output of the critical analysis carried out is an abacus that includes the main sustainability indicators, classified according to their reference domain (economic, environmental and social indicators). This systematic overview represents a useful tool for decision-makers during: i) the assessment of the current state of territories; ii) the selection of interventions to be implemented.
The following part of the work is structured into three sections. The Section 3 concerns the illustration of the methodology adopted for the analysis and classification of indicators, with attention to sources, selection criteria, and the setup of the final abacus. The Section 4 is dedicated to discussing the results, organized around the three main dimensions addressed (namely economic, environmental and social sustainability): for each sphere, the most relevant indicators, emerging trends, as well as limitations and operational potential in the context of urban regeneration are highlighted. Finally, the Section 5 presents conclusions and future developments, reflecting on the overall effectiveness of the proposed indicators systematic overview and recommendations for their more conscious and strategic application in planning urban transformations.
3. Methodology
The methodology adopted in the present study aims to provide a solid and up-to-date analytical framework of economic, environmental and social sustainability indicators in order to guide the definition of interventions applied at the territorial and urban scale. The research has been carried out through a systematic review of reference academic and scientific literature, as well as the main current institutional and regulatory sources, to build a structured abacus capable of proposing a classification of indicators according to clear and standardized criteria.
The methodological approach has been articulated into three phases:
- Collection of the most commonly used urban sustainability indicators at the international level and identification of information sources.
This phase has involved the analysis of the most relevant literature and the institutional and official documents in the field of sustainability measurement to collect adequate indicators to be included in the proposed set. The following have been considered:
• academic research articles, consulted through scientific databases such as Scopus and Google Scholar, that are focused on different methodologies for defining urban sustainability indicators;
• official reports from international organizations;
• global guidelines: the main International Organization for Standardization (ISO) standards applied to sustainability measurement have been considered to ensure methodological consistency among countries, i.e. to guarantee that selected indicators are developed according to internationally shared criteria, enabling comparison across different sectors and integration between heterogeneous sources.
Following the carried out surveys, in total 71 indicators have been selected.
- 2.
- Systematization of the identified indicators.
Once consolidated urban sustainability indicators - that are those widely used in the literature and institutional sources - have been recognized, a structured and systematized abacus has been developed to summarize and classify the information. The analytic framework includes:
- category of each indicator based on classification into economic (22), environmental (31), and social (18) indicators;
- denomination of the indicator;
- brief description clarifying the indicator function and meaning;
- calculation formula to specify the elaboration methodology;
- utility of the indicator with reference to its practical applications in decision-making processes;
- standardizability level, i.e. the possibility of applying the indicator in local, national, and global contexts;
- reference source for each indicator to ensure scientific traceability;
- geographic scale of applicability, distinguishing indicators usable at urban, regional, national, or global levels.
The definition of the systematic overview of the collected urban sustainability indicators has been essential to identify similar indicators, methodological gaps in the construction procedure, and areas for improvement, contributing to a more complete and coherent outline for assessing economic, environmental, and social sustainability compared to the heterogeneity of currently existing and consulted sources.
- 3.
- Analysis of the critical issues and strengths points of the identified indicators.
In this phase, each collected indicator has been investigated to assess its effectiveness and applicability across the different sustainability domains (economic, environmental, and social). Key aspects examined include:
- the ability of indicators to capture multidimensional dynamics;
- possible distortions arising from the impossibility of generalizing the applicability of the indicator as it is strongly connected to the local specificities of the context in which it has been developed;
- difficulties in data collection and standardization;
Figure 1 shows the three phases that constitute the methodological approach implemented in the present research for the identification and analysis of urban sustainability indicators.
4. Discussion of the Results
With reference to the identified 72 urban sustainability indicators, a systematic analysis has been carried out for each selected thematic category (economic, environmental and social) to outline their main distinctive and functional aspects. In particular, the investigation has been performed by taking into account five fundamental dimensions: i) the unit of measurement used for quantifying the indicator, ii) the underlying calculation formula, iii) the degree of usefulness with respect to the study’s objectives, iv) the level of standardizability enabling comparative investigation across different contexts, and finally, v) the geographic scale of reference to which the indicator is applicable. This integrated approach (i.e. that simultaneously considers different elements of the same indicator) has allowed not only a systematic description of each indicator but also an evaluation of its methodological coherence, practical relevance and potential contribution within decision-making processes.
Figure 2 reports a comprehensive summary of the 72 indicators examined in this research, appropriately classified according to their respective thematic category. It should be pointed out that the denominations of the collected indicators derive from official sources and reference literature and are those generally used and consolidated regarding the reference to the specific indicator.
4.1. Economic Indicators
The abacus of economic indicators (Table S1: Economic indicators in the Supplementary File) shows a set of essential metrics suitable for analyzing the economic sustainability of a national territory, not only in terms of productive growth but also as a measure of social well-being.
Among the 22 selected economic indicators, the Gross Domestic Product (GDP) per capita is the most consolidated over time, as it represents the average wealth produced by a country in a given period, usually one year. GDP is widely used to provide a clear and easily understandable indication of a nation's economic condition, which is the main reason for which it is broadly adopted by institutions such as the World Bank and the International Monetary Fund (IMF) [20]. Its high standardizability allows for direct and immediate comparisons between states and over time. However, as noted by Aldo Eduardo Carra [21], GDP per capita has significant limitations because it does not account for wealth distribution within the country nor the environmental impact of economic growth. In fact, for a nation with a high GDP but considerable social inequalities or serious environmental issues, this indicator would be less representative of the actual well-being of its citizens, as it is essentially aimed at evaluating the specific and unique wealth domain.
To address these shortcomings, the Human Development Index (HDI), that is defined as a macroeconomic development indicator introducing a broader perspective on national wealth through the integration of parameters related to health and education. In particular, the HDI aggregates four parameters: i) life expectancy at birth which represents the average expected lifespan of a newborn based on the mortality rates recorded in the year considered), ii) mean years of schooling, i.e. the average number of years of education received by individuals aged 25 and over, Iii) expected years of schooling, i.e. the average number of years of education that a child entering the first grade is expected to receive based on current enrollment rates and Iv) Gross National Income per capita at purchasing power parity.
This index - as reported by the article of Baumann [22] - allows a more realistic evaluation of quality of life and shows a high degree of comparability, since it is calculated uniformly for all countries. Nevertheless, there is some subjectivity in assessing the input factors for the calculation: for example, the weight assigned to education field compared to health one can significantly influence the final result and raise questions about the actual comparability between nations with very different socio-economic contexts [23].
A further step towards a more holistic vision of economic development is the Genuine Progress Indicator (GPI). The GPI differs from GDP because it subtracts the social and environmental costs associated with growth [24]. However, the GPI struggles to gain global acceptance due to the lack of a unique and shared methodology, which limits its comparability and adoption by institutions [25].
Similarly, the Genuine Savings indicator, developed by the World Bank [26], measures the long-term economic sustainability by considering net savings, investments in human capital and depreciation of natural resources over time. According to Mori and Christodoulou [27], this approach helps understand whether a nation is consuming its resources sustainably. Nevertheless, as with the GPI, international comparability remains a critical issue due to methodological difficulties and differences among national economic systems, which reduce the comparative effectiveness of these indicators.
When focusing on wealth distribution within a state, the Gini Index is a consolidated and reliable tool for assessing economic inequality how to demonstrate by Pellegrino [28]. It ranges from 0 (perfect equality) to 1 (maximum inequality). This index facilitates effective comparisons but does not explain the causes of inequality nor differentiate between various forms of economic disparity (e.g., disparities among regions, productive sectors, or age groups) [29]. To overcome these limitations, the Gini Index is often combined with other economic indicators, such as the poverty rate, which provides relevant information on the proportion of the population living below a minimum income threshold [30]. Its comparability across national contexts is widely recognized, but the income factor alone does not capture the complexity of real economic conditions. Access to essential services, housing quality, local cost of living, and social support networks can vary significantly even with similar incomes, making an integrated approach to well-being assessment necessary [31].
Closely related to income distribution is the employment rate, which measures the capacity of an economic system to absorb the labor force. While a high employment rate is generally interpreted positively, high attention is needed because the aggregate data include precarious, poorly paid, or involuntary part-time jobs, which do not guarantee stability or improved individual economic conditions. Although the indicator is standardized and shared by institutions such as the Organization for Economic Co-operation and Development (OECD), the International Labour Organization (ILO), and the World Bank, its "isolated" interpretation (not combined with other data) may be misleading regarding the overall quality of offered employment [32].
In addition to these metrics, indicators related to specific productive sectors provide useful clues to understand current economic dynamics. Tourism, for example, represents a significant component of the economy in many parts of the world. Its impact is estimated through the economic multiplier, i.e. a coefficient used to evaluate the induced effect of tourist spending on the local system [33]. The methodology proposed by the United Nations [34] ensures a good level of standardization; however, the indicator remains sensitive to cyclical fluctuations and territorial policies that affect its comparative reliability.
In summary, economic performance over time continues to be measured primarily by the GDP growth rate, a parameter widely adopted by the IMF, OECD and World Bank [20,35]. This standard metric quantifies the annual expansion of gross domestic product and allows coherent comparisons between economic systems. However, as emphasized by Shakir Hanna and Cesaretti [36], high growth alone does not guarantee improved well-being. Economic expansion can coincide with increasing wealth concentration, declining stable employment, or environmental degradation. These ambiguities make it increasingly necessary to integrate growth rates with indicators that reflect the quality and sustainability of development.
In this regard, economic tools aimed to measuring ecological transition, such as the number of investments in renewable energy, are relevant. This indicator indicates the degree of transformation of the productive system towards low-emission models and serves as a strategic signal of the willingness to pursue sustainable reconversion paths [37]. Nevertheless, international comparability remains limited due to market dynamics, public policies, and fiscal incentives that vary across countries [38].
A broader measure of environmental finance is the Green Investment Ratio, which expresses the percentage of capital allocated to projects with eco-compatible objectives. Despite growing attention from governments and companies towards such investments, the lack of uniform criteria to define what truly qualifies as “green” limits the indicator's comparative effectiveness. Differences in environmental reporting practices across countries and sectors contribute to reducing the clarity of the information provided. Moreover, this indicator is designed at the national scale and is difficult to apply at the urban scale [39].
Finally, within the economic pillar of sustainability, the Environmental Impact Cost estimates the economic amount necessary to compensate for or mitigate environmental damages related to an urban intervention. It includes expenses for remediation, cleanup, emissions trading mechanisms and other balancing measures [40,41]. This metric is crucial to internalize negative environmental effects within economic evaluations, but its large-scale application remains complex. Damage quantification is often uncertain and highly dependent on the regulatory and technical context [42].
In the field of economic investment evaluation, the analyzed literature highlights a series of ‘traditional’ indicators capable of estimating the profitability and financial sustainability of both public and private projects. The Return on Investment (ROI) is one of the most commonly used indicators in the business field: it measures the profitability of an investment relative to the capital employed, providing easily interpretable data [43]. Its standardized formula makes it suitable for direct comparisons between different projects. However, ROI does not consider the risk associated with the investment and can be strongly influenced by contextual factors such as market volatility or macroeconomic conditions [44].
To broaden the evaluation to include benefits not only economic but also environmental and social, the Social Return on Investment (SROI) has been introduced. It assigns a monetary value to the positive impacts generated by a project in terms of collective well-being. This indicator is particularly useful for assessing initiatives in the social or environmental sectors, but its applicability remains limited due to the absence of a unique methodology and the variability of criteria adopted in different contexts [45,46].
In financial terms (i.e. from the private investor - initiative promoter point of view), the Payback Period (PbP) provides immediate information on the time required to recover the invested capital: although a simple and intuitive measure, it does not consider the time value of money and does not evaluate the overall profitability of an investment in the long term [47]. To partly overcome these limitations, the Payback Period can be integrated with other indicators such as the Internal Rate of Return (IRR). The IRR is widely used in project evaluation, as it represents the discount rate that nullifies the Net Present Value (NPV) of the investment. As noted by Damodaran [48], the IRR allows comparisons between projects of different scales and irregular cash flows and is extensively used in both public and private sectors. However, like the PbP, the IRR presents interpretative limits in the presence of multiple cash flow and sign changes, which can create ambiguity in identifying the correct value.
Complementary to the IRR, the NPV calculates the difference between expected benefits and costs of a project discounted to present value (in fact it is defined as discounted sum of the cash flows generated by the investment). This indicator, broadly used in corporate finance, while allowing the determination of an intervention's economic convenience, is heavily influenced by the choice of discount rate how to demonstrate by Arjunan [49]. A related tool is the Cost-Benefit Ratio, expressing the ratio between expected benefits and overall costs of an intervention. Mainly used to evaluate public interventions, this indicator has been adopted, among others, by Atkinson [50] and Mourato [41] to analyze the economic and environmental sustainability of infrastructure and environmental policies. The main limitation lies in the subjective component related to benefit monetization, which can introduce uncertainty margins in the final assessment.
In investment management, it is also fundamental to consider the Cost of Capital, which represents the overall financing cost of a project, including both debt and equity components. This parameter is central to corporate decisions and is influenced by financial market conditions and specific characteristics of the company or promoting entity [44].
Finally, Capital Productivity indicator measures the efficiency with which capital is used to generate economic value [51,52]. Improving this indicator is considered a priority objective to ensure stable and sustainable economic growth, especially in contexts where financial and natural resources face increasingly stringent constraints. At the territorial level, the real estate market value is particularly relevant, as it reflects both the perceived quality of the built environment and expectations for future development. As noted by Des Rosiers [53], property values integrate numerous economic, environmental, and infrastructural variables, thus representing a synthetic indicator of an area's livability. Its evolution over time can provide indirect indications about the effectiveness of public policies, regeneration projects, or environmental mitigation interventions. For proper interpretation, advanced statistical tools such as hedonic analysis or spatial regression models should be adopted to isolate the effect of single factors [54,55].
In this framework, the market risks provide a measure of the economic instability associated with urban investments, especially in contexts prone to speculation. As highlighted by Orsi [56], these risks may contribute to triggering unsustainable long-term dynamics such as real estate bubbles or excessive asset value fluctuations. Although difficult to predict exactly, monitoring these risks is essential to prevent systemic imbalances.
4.2. Environmental Indicators
The overview of environmental indicators (Table S2: Environmental indicators in the Supplementary File) shows a framework of the metrics used to assess the environmental sustainability and the impact that human activities determine on ecosystems. These tools are essential for monitoring the consumption of natural resources in a specific site, the energy efficiency of assets, air and water quality, waste management and the level of accessibility to infrastructure. However, their effectiveness depends on the comparability level across countries, the availability of reliable data, and their applicability in strategic environmental and urban planning contexts. In the present analysis, 32 indicators belonging to this thematic category have been identified. To facilitate reading, the indicators are divided into topic subcategories: energy and emissions, transportation, land use, waste, water resources, biodiversity, environmental quality and digital technologies.
Within the energy and emissions group, one of the most critical aspects of environmental qualification of interventions in a specific site is CO₂ productions, which measure the amount of carbon dioxide released into the atmosphere due to industrial activities, transportation and energy production. This data, detected and monitored by institutions such as the European Environment Agency (EEA) and the International Energy Agency (IEA) how to demonstrate by Bărbulescu [57] and Dincer [58] , is highly standardized and used to track governments’ progress towards emission reduction. However, this does not allow understanding the overall global energy consumption of a nation; for this reason, other indicators are applied, such as carbon productivity, which relates GDP to CO₂ emissions, thereby evaluating the economic value generated for each ton of carbon emitted [59]. This indicator is useful for comparing the sustainability of global economies but does not account for the phenomenon of production offshoring, which could reduce internal emissions of a specific country at the expense of another [60].
Detailed analysis of the environmental impact of energy production is generally carried out through the indicator of carbon emissions per unit of power produced, which relates CO₂ emissions to energy generated. This value is significant for comparing different energy generation technologies and monitoring the transition towards renewable sources in different geographical contexts [61,62].
To improve energy efficiency and decrease emissions, it is essential to promote the most sustainable technologies through incentives. To this end, the usage rate of high energy-efficiency appliances evaluates the spread of low-consumption devices, although - as reported by Tol [63], and Ringel et al. [64] -, despite being a highly comparable indicator, it does not consider economic barriers limiting consumer access to these technologies and, as noted for other indicators, it has more of a regional than urban dimension.
In the field of energy transition, some very useful indicators are the proportion of renewable electricity—i.e., the ratio between electricity generated from sustainable sources compared to total production—and the percentage of renewable energy, which instead considers the entire energy consumption of the country (including industrial and transport sectors). Both indicators are essential for monitoring decarbonization [65,66], although they do not take into account the variability of renewable sources and issues related to energy storage [67].
In the context of environmental indicators, the transport sector plays an important role, having a significant impact on environmental sustainability. The number of buses per capita and cars per capita provide information on dependency on private transport and the actual availability of public transport means in a given territory. As reported in different studies [68,69,70], even if these data are extremely comparable, they do not provide information on the quality and coverage of transport networks and should be used to compare very similar contexts.
Within this topic area, the indicator of energy consumed per passenger-kilometer allows analysis of the energy efficiency of different means of transport in relation to actual mobility. As indicated in the reports of the Higher Institute for Environmental Protection and Research (ISPRA) [71,72], this Indicator helps plan sustainable systems, but its interpretation should consider vehicle load capacity and current occupancy rates.
The indicator of the average distance between public transport and residential buildings Is useful for evaluating accessibility of public transport services and identifying areas where existing infrastructure systems need improvement. However, its methodological comparability is more complex since it requires detailed georeferenced data, often not available in an organized way. As indicated by the Protocol of the Institute for Innovation and Transparency in Procurement and Environmental Compatibility (ITACA) [73,74], this environmental indicator represents a key concept for sustainable urban planning and for implementing urban policies consistent with existing conditions.
In addition, the development of Information and Communication Technologies (ICT) infrastructure is closely linked to economic growth and environmental development. Measuring the ICT infrastructure development indicator is crucial to estimate the degree of digitalization and the environmental impact of transport and industrial activities, aiming to reduce it through appropriate choice processes [75]. However, its standardization is moderate, as measurement methodologies vary between countries and depend on development strategies linked to national policies [76].
Regarding waste management issue, the per capita waste production measures the amount of waste generated by each individual, while the percentage of separate collection provides information on the effectiveness of recycling policies adopted in each territorial area. While the first parameter (waste production) is a well-harmonized indicator, the second one (separate collection) varies significantly between countries due to different classification approaches, but it is more significant when referring to neighboring territories.
As demonstrated in studies by Ogbonna et al. [77] and Marinello et al. [78], the waste management involves relevant environmental problems, influencing soil, air and water quality, as well as the balance of climate-altering emissions. The choice of collection, disposal and recycling systems directly influences the sustainability of the material cycle and the capacity of cities to reduce overall environmental impact [79,80].
In the mentioned framework and in current environmental contingence, managing water resources is central, since water consumption is a key indicator for territorial planning. Studies by Corona [81] compare international trends in environmental indicators and highlight water consumption dynamics. indicators related to drinking water quality, per capita wastewater production, and water reuse recycling are the most reliable and are all basic elements for measuring water management sustainability [82,83,84,85,86].
Land use also represents a fundamental aspect of environmental sustainability. Per capita cultivated agricultural area measures the amount of agricultural land available per inhabitant; it also provides indications about a nation’s self-sufficiency capacity and the balance between agriculture and urbanization. As reported in the study of Valmori et al. [87], this indicator is widely used for implementing agricultural and demographic policies but can be influenced by climatic conditions and soil quality [88].
On the other hand, the level of urbanization controls the growth of urban areas and migration flows from rural to urban areas, with related implications on natural resource management and infrastructure sustainability. In this sense, the urbanization rate is a synthetic indicator measuring the percentage of the population residing in urban areas relative to the national total. It is commonly used to evaluate settlement dynamics, ecosystem pressure, and the capacity of cities to absorb migration flows. As highlighted by Mwanza [89] and Salvini [90], a rising rate can reflect economic and infrastructural development but often leads to increased land consumption and territorial inequalities, requiring careful urban planning. Despite its widespread applicability, a certain heterogeneity critical issue in the statistical definition of “urban area” among different countries is attested.
Another structural indicator is the area occupied by urban uses, which quantifies the territorial extent dedicated to buildings, infrastructure, and urban functions. This indicator is fundamental for monitoring city expansion and the degree of soil artificialization and is frequently used in land take and soil consumption studies [91]. Its measurement is useful for evaluations of urban density, land use efficiency and the sustainability of urban growth. However, classification methods for urban uses may vary significantly depending on local databases and planning regulations, making international comparability complex. In this framework, research by Ronchi et al. [92] provide historical data and analyses on urbanization dynamics in Italy and major European countries, highlighting differences in cities development models and land management. It is clear that urbanization has a significant impact on the natural environment and can be monitored through a set of indicators capable of quantifying urban surface occupied, per capita territorial area dedicated to roads, and green spaces per inhabitant. Although these indicators provide essential information on quality of life and anthropic pressure on the territory, their standardization shows the difficulties due to different methodologies in classifying urban areas.
Furthermore, the greenfield/brownfield ratio supports the assessment of the environmental impact of urban development, highlighting natural land consumption versus redevelopment of already urbanized areas. Studies by Passalacqua and Pozzo [93] and Battisti et al. [94] indicate methodological approaches to balance financial and environmental sustainability in urban redevelopment projects as well as the containment of uncontrolled urban expansion, promoting more coherent and sustainable land use.
In this perspective, urban sprawl provides information on population distribution and infrastructure sustainability. According to Merola’s analysis [95], this indicator is fundamental for estimating settlement dynamics and their impact on urban resources [96]. Moreover, the presence of abandoned buildings may be linked to urban decay phenomenon and the identification of potential areas for redevelopment represents a crucial step in the definition of effective urban transformation operations to be carried out: the studies of Armondi [97], as well as models developed by Bianchi [98], provide interesting tools to detect environmental criticalities in urban areas and to determine the intervention priorities from a regenerative ecological and functional point of view.
During the last decades, the question of ecosystem health has triggered an increasing scientific debate. This environmental is generally monitored through the biodiversity index, which compares the number of current species with those historically present in a given habitat. In particular, the indicator makes it possible the evaluation of conservation policies’ effectiveness, but its comparability is currently challenging, as data quality varies by region and monitoring tools used. Within the reference literature, for example, Campo [99] explore methodologies to assess biodiversity from ecological and economic perspectives and highlight the need for standardized frameworks that integrate diverse data sources to improve the accuracy and comparability of biodiversity assessments across different territories [100].
Another fundamental component for estimating the environmental sustainability is the soil quality analysis, which depends on several factors such as heavy metal concentration, soil biodiversity and erosion index [101,102].
The environmental health is also influenced by the air quality: this indicator can be highly standardized thanks to guidelines issued by the World Health Organization (WHO) [103] that that provide clear thresholds and measurement protocols to ensure consistent and reliable assessment across different regions [104].
By considering the global environmental impact - that is the overall strain placed on ecosystems by communities through resource consumption and waste production - one of the most relevant indicators is the ecological footprint, which measures human demand for natural resources against the Earth’s capacity to regenerate them. Although it is a widely recognized concept, its standardization is still moderate, as calculation approaches can vary between nations [105,106].
With reference to the energy topic, a parameter closely linked to sustainability is the energy consumption, which evaluates the efficiency of energy resource use and their environmental impact. Thanks to standardization provided by institutions such as the International Energy Agency (IEA) [107] , as well as studies by Ballucchi [108], it is possible to compare consumption levels between countries, despite having to consider disparities in national energy mixes.
Innovative technologies adopted in the building sector are also monitored through the number of smart buildings, an indicator that reflects the level of innovation and sustainability of constructions. As described in studies by Agrosi [109], smart buildings represent a key element of the transition toward more sustainable cities. Notwithstanding the existence of standards such as Leadership in Energy and Environmental Design (LEED) [110] that provide certification criteria, there is still not a globally uniform methodology to define smart buildings.
The balance between urban development and sustainability is also assessed through the carrying capacity indicator that measures the pressure exerted by human activities on a given ecosystem. This aspect is essential to ensure that economic growth, urbanization, and tourism expansion do not exceed natural resource limits and aims to prevent overexploitation of ecosystems and excessive burden on infrastructure [111,112]. However, the comparability of this value is complex since the parameters to be considered vary depending on environmental context and geographical specificities.
4.3. Social Indicators
The analysis of social indicators (reported in Table S3: Social indicators in the Supplementary File) allows for a comprehensive understanding of territorial sustainability, by complementing economic and environmental aspects through the measurement of variables that reflect quality of life, equity in access to resources, community cohesion, and the resilience of urban systems. The 18 selected social indicators provide a multidimensional overview of well-being, highlighting both the material conditions of living and the relational, cultural and perceptual dynamics that determine its sustainability over time.
As with urban environmental sustainability, the access to public transportation represents a cross-cutting factor in the social field: while in the former context (environmental one) it contributes to emission reductions and focuses on energy efficiency, in the social sphere it assumes a different meaning, linked to the number of stops, the distance, the frequency and the percentage of the population served by the existing system [113,114]. The ease of reaching essential services such as schools, hospitals and workplaces directly impacts the socio-territorial inclusion levels. However, its comparability is often limited, as the measurement indicators vary significantly between urban contexts and countries.
Connected to this dimension, the indicator of sustainable mobility is used to i) monitor the reduction of greenhouse gas emissions, ii) identify areas for improvement in urban and interurban transport networks and iii) measure the current and planned accessibility level following the implementation of specific and targeted measures. Its standardization is moderate, as official data from censuses, reports and Geographic Information Systems (GIS) can be utilized, but calculation methodologies may vary depending on the factors included and local priorities [115,116].
The indicators related to cultural life also play a significant role. To measure the level of access and participation in cultural activities, the indicator regarding the promotion of cultural events (number of events organized annually compared to the inhabitants’ number) is often used. It is useful for monitoring investments in culture within a specific geographic context and for identifying opportunities to improve the cultural offerings. However, its international comparability is limited, as data collection mainly occurs through local authorities and event organizers, with variations in calculation approaches [117]. According to Landmann [118], this parameter represents a key starting point for evaluating cultural policies useful for defining new initiatives and implementing those already carried out.
An Indicator directly connected to cultural inclusion of a city is the accessibility to public educational and cultural services, which calculates the number of services per inhabitant. This is relevant for assessing the accessibility level of essential facilities and supporting the planning of investments in the specific (educational and cultural) sectors. Its uniformity is high since data can be gathered from local administrations and institutions such as the OECD [119] or the United Nations Educational, Scientific and Cultural Organization (UNESCO) [120], which provide standardized quality criteria.
From the economic point of view, the indicator related to the commercial services estimates the number of them per inhabitant, monitors the balance between demand and supply, and identifies possible shortages or overcrowding. It is highly standardized, as Input data are available through business registries and commercial censuses and, moreover, the calculation methodology is unique and applicable across multiple geographic contexts. As highlighted by ISTAT [121], measuring commercial services is strictly associated with quality of urban life, as it considers the presence of economic activities that meet the daily needs of the population, reducing the requirement for travel and contributing to the economic and social vitality of the neighborhood [122].
The indicator on community projects aims to evaluate the effectiveness of public policies and private initiatives focused on collective well-being. Measured in terms of the number of projects completed per 1,000 inhabitants, it facilitates monitoring community Involvement and supports the strategic definition of targeted interventions [123,124]. Its replicability is generally moderate, as Information collection depends on public reports, municipal budgets, and documentation from promoting organizations. In addition, the methodologies may vary depending on the specific objectives of each project that are strongly connected to the context specificities in which the initiative has been developed. According to the “Obiettivo Europa” portal, this indicator allows to assess the success of social and community initiatives, providing a real indication of communities’ participation, the impact of interventions on the territory, and the effectiveness in addressing citizens’ needs.
The access to healthcare services and the number of healthcare workers per 1,000 inhabitants are two highly standardized indicators that allow evaluation of the globality of the healthcare system and identification of regional disparities or structural deficiencies [125,126]. Similar to the investments in renewable energy in the environmental field, the presence of a widespread healthcare network represents a tangible signal of the commitment to guarantee fundamental collective rights [127,128].
In parallel, the gender equality highlights persistent inequalities in critical areas such as employment, education, and political sector. Analogous to the Gini coefficient for wealth, the equality index offers a concise but meaningful reading of gaps between social groups, acting as a catalyst for targeted interventions [129,130].
Alongside structural aspects, the human capital is evaluated through indicators such as the literacy rate, which constitutes an essential measure of cultural inclusion and the capacity for active citizen participation [131]. The quality of education is reflected in the access to professional opportunities and in the spread of essential skills to face contemporary challenges, including digital and environmental transitions [132].
Furthermore, the access to green spaces, already relevant from an environmental perspective, assumes a social function in the social field, as it is closely linked to psycho-physical health and quality of urban life. As observed for smart buildings in the environmental domain, the presence of accessible and well-maintained public spaces helps strengthen community ties and the sense of belonging [133].
In territories characterized by sudden and critical shocks, such as environmental disasters, economic crises, or pandemics, the concept of social resilience - understood as the collective capacity to adapt and respond - becomes central [134]. The vulnerability indicator is associated with this framework and it is useful for identifying the areas most exposed to environmental or socio-economic risks and for calibrating mitigation policies. Although less standardized than other parameters, these indicators assume a growing role in integrated planning, especially in urban and territorial contexts. Studies by Graziano et al. [135] and Cutter et al. [136] point out how the territorial resilience is currently a strategic focus for risk management and strengthening social capital.
Complementary to this dimension, the analysis of demographic structure of a city is represented by indicators such as the population density or the age group composition. In highly urbanized territories, these data guide the distribution of public services, whereas in peripheral or marginal areas, they allow the counteracting depopulation and promoting social cohesion. With reference to their assessment phases, the availability of data through censuses and local registries ensures a high level of comparability [137,138].
The urban safety, both objectively and subjectively, constitutes another central dimension of collective well-being. The crime rate, based on official data, offers a standardized measurement of recorded incidents; alongside it, the perception of safety provides a more subjective but equally relevant reading of levels of trust, fear and everyday life quality for the community. According to the Safety Perceptions Index 2023 [139], the gap between actual and perceived data can significantly influence the urban space planning and the effectiveness of local targeted policies [140].
Still on safety, the road accidents, expressed in absolute value or rate per inhabitants, evaluates the infrastructure efficiency and orient the prevention policies to be implemented. As with other aspects of urban quality, for the Italian context the data analysis provided by ISTAT [141] and law enforcement agencies allows reliable monitoring over time [142,143,144].
With regards to the transition toward a digital society topic, an additional dimension of social sustainability has been introduced during the last decades. The internet access, measured by the proportion of the connected population, is today an indispensable Indicator for assessing informational inclusion and the ability to use online services. Moreover, the perception of users regarding technology capacity, which investigates the perceived adequacy of digital solutions in relation to daily needs, is analyzed. As noted in the ISTAT Citizens [145] and ICT reports [146], this indicator helps identify cultural, cognitive or infrastructural barriers that hinder digital equity, that is a new frontier of social justice.
Taken together, the mentioned indicators provide a complex and integrated framework of social well-being in territories, intertwining material and immaterial, structural and perceptual dimensions. While some of them, such as literacy or access to healthcare, are already consolidated in comparative analysis, others, such as social resilience or safety perception, determine new methodological challenges but, at the same time, offer decisive insights for territorial planning and the inclusive policies definition [147,148]. Their integrated and combined use, in synergy with economic and environmental indicators, allows progress toward truly multidimensional sustainability models, that achieve a holistic and not sectoral and fragmented vision of the contemporary cities.
5. Conclusions and Future Developments
In light of the growing international interest in the measurement of urban sustainability and the strategic role that economic, environmental and social indicators play in supporting effective territorial policies, the present research has attempted to systematize and critically analyze the most recurrent evaluation metrics used to assess the urban sustainability at a global level. In particular, the aim of the study has concerned the proposal of an organic and multidimensional overview of the economic, environmental and social indicators (i.e. the three main pillars of the sustainability concept), Investigating their concrete ability to orient the urban regeneration processes and the policy decisions. The analysis has highlighted how the integrated use of the detected indicators is currently essential to address the challenges of urban sustainability. However, their effectiveness does not lie solely in the availability of reliable data, but also in the capacity to interpret them within coherent analytical frameworks that overcome the sectoral approach and translate them into strategic tools for the planning and evaluation of public strategies. The information synthesis and consistency, the methodological transparency and the data accessibility thus emerge as essential prerequisites to ensure a responsible and transformative use of these tools [149].
A significant critical aspect that characterized the urban economic, environmental and social sustainability indicators regards the technological evolution of measurement approaches. The expansion of real-time data and the artificial intelligence and machine learning techniques spread now offer opportunities to make indicators more dynamic, predictive and adaptive. Advanced tools such as digital twins, forecast models and GIS systems can i) support simulations of future scenarios, ii) identify latent criticalities of planning alternatives and iii) guide urban governance towards more proactive and resilient approaches. For this potential to be translated into effective practices, however, a paradigm shift in urban sustainability governance is needed. A structured and continuous involvement of local stakeholders - institutions, businesses, communities - is required so that the construction and use of indicators become participatory processes. The measurement is never neutral: it reflects political priorities, methodological choices and visions of the future. Particular attention should be paid to disaggregated data - by gender, age, social vulnerability - in order to ensure more inclusive readings and guide more equitable policies. Only through a methodological evolution capable of grasping the complexity of urban contexts will it be possible to build truly effective evaluation tools in the transition towards sustainable, resilient and just cities. In this sense, future research developments may focus on proposing an innovative methodological approach aimed at defining a multicriteria composite indicator. This indicator will be able to integrate and combine various measured indicators in order to construct a synthetic and evaluative parameter of urban sustainability [150]. Therefore, the developed assessment tool will effectively synthesize the multiple dimensions of sustainability, providing a comprehensive and comparable measure that supports more informed decision-making processes for a more effective urban governance and sustainable city development.
Supplementary Materials
The following supporting information can be downloaded at: https://www.mdpi.com/article/doi/s1, Table S1: Economic indicators, Table S2: Environmental indicators, Table S3: Social indicators.
Author Contributions
Conceptualization, F.D.L, M.L. and P.M.; methodology, F.D.L., M.L. and F.F.; validation, M.L. and P.M.; formal analysis, F.D.L. and P.M.; investigation, F.F.; data curation, F.D.L, M.L. and F.F.; writing—original draft preparation, F.D.L, M.L., P.M. and F.F.; writing—review and editing, F.D.L, M.L., P.M. and F.F.; visualization, F.F.; supervision, P.M. All authors have read and agreed to the published version of the manuscript.
Funding
This research received no external funding.
Conflicts of Interest
The authors declare no conflicts of interest.
References
- Sachs JD. The age of sustainable development. New York: Columbia University Press; 2015.
- United Nations Habitat. Envisaging the future of cities. World Cities Report. 2022;:42.
- De Siqueira JH, Mtewa AG, Fabriz DC. United Nations Development Programme (UNDP). In: Cuyckens H, Ferstman C, Tanaka A, editors. International Conflict and Security Law: A Research Handbook. The Hague: TMC Asser Press; 2022, pag. 761–777.
- Canton H. Organisation for Economic Co-operation and Development—OECD. In: Europa Directory of International Organizations 2021. London: Routledge; 2021, pag. 677–687.
- Morano P, Locurcio M, Tajani F, Di Liddo F. An innovative GIS-based territorial information tool for the evaluation of corporate properties. Sustainability. 2020. [CrossRef]
- Batty M. Inventing future cities. Cambridge (MA): MIT Press; 2021.
- Lytras MD, Şerban AC. E-government insights to smart cities research: European Union (EU) study and the role of regulations. IEEE Access. 2020;8:65313–65326. [CrossRef]
- Owusu-Peprah NT. World Development Report 2022: Finance for an equitable recovery. Washington (DC): World Bank Publications; 2022. [CrossRef]
- Aalbers HL. A territorial approach to the Sustainable Development Goals: Synthesis report. OECD Urban Policy Reviews. Paris: OECD Publishing; 2020.
- Meadows D. Limits to growth: The 30 year update. White River Junction (VT): Sustainability Institute; 2004.
- Moraliyska M. Measuring the justness of the European green transition. Coll Pap New Econ. 2023;1.1:30–41.
- Saltelli A, et al. Five ways to ensure that models serve society: a manifesto. Nature. 2020;582(7813):482–484. [CrossRef]
- Giampietro ME, Mayumi K. Multi-scale integrated analysis of societal and ecosystem metabolism (MuSIASEM). In: Farley J, editor. Dictionary of Ecological Economics. Cheltenham: Edward Elgar Publishing; 2023, pag. 362–363.
- JPI Urban Europe. Strategic research and innovation agenda 2.0. Vienna: JPI Urban Europe; 2019.
- Riedel H, et al. SDG-Indikatoren für Kommunen. Indikatoren zur Abbildung der Sustainable Development Goals der Vereinten Nationen in deutschen Kommunen. 2020.
- Hussain S, et al. Navigating the impact of climate change in India: a perspective on climate action (SDG13) and sustainable cities and communities (SDG11). Front Sustain Cities. 2024;5:1308684. [CrossRef]
- Stiglitz JE, Sen A, Fitoussi J. Report by the commission on the measurement of economic performance and social progress. Paris: Commission on the Measurement of Economic Performance and Social Progress; 2009.
- United Nations General Assembly. Transforming our world: the 2030 Agenda for Sustainable Development. New York: UN; 2015.
- Johnstone I. Organisation for Economic Co-operation and Development (OECD). Yearb Int Environ Law. 2023;34.1:yvae026.
- Wade RH. The world development report 2022: Finance for an equitable recovery in the context of the international debt crisis. Dev Change. 2023;54.5:1354–1373. [CrossRef]
- Carra AE. Oltre il PIL, un’altra economia – Nuovi indicatori per una società del ben-essere. Roma: Ediesse; 2010.
- Baumann F. The next frontier—human development and the anthropocene: UNDP human development report 2020. Environ Sci Policy Sustain Dev. 2021;63.3:34–40. [CrossRef]
- United Nations General Assembly. Transforming our world: the 2030 Agenda for Sustainable Development. 2015.
- Talberth J, Cobb C, Slattery N. The Genuine Progress Indicator 2006. Oakland (CA): Redefining Progress; 2007.
- Hamilton C, Saddler H. The Genuine Progress Indicator. A new index of changes in well-being in Australia. 1997;14.
- Lange GM, Wodon Q, Carey K. The changing wealth of nations 2018: Building a sustainable future. Washington (DC): World Bank Publications; 2018.
- Mori K, Christodoulou A. Review of sustainability indices and indicators: Towards a new City Sustainability Index (CSI). Environ Impact Assess Rev. 2012;32.1:94–106. [CrossRef]
- Pellegrino S. Il coefficiente di Gini: le origini. Milano: Società Italiana di Economia Pubblica; 2020.
- Zenga M. Proposta per un indice di concentrazione basato sui rapporti fra quantili di popolazione e quantili di reddito. Giorn degli Econ Ann Econ. 1984;:301–326.
- Di Pasquale E, Tronchin C, Della Puppa F. Talenti e competenze nell’Europa del futuro. I dati del XIII rapporto annuale sull’economia dell’immigrazione. Quaderni di Ricerca sull’Artigianato. 2023;11.3:359–384.
- Cadum E, Costa G, Biggeri A, Martuzzi M. Deprivazione e mortalità: un indice di deprivazione per l’analisi delle disuguaglianze su base geografica. Epidemiol Prev. 1999;23.3:175–187.
- Scarpetta S, Di Noia C. Pensions at a glance 2023: OECD and G20 indicators. Paris: OECD Publishing; 2023.
- Paniccia P, Silvestrelli P, Valeri M, editori. Economia e management delle attività turistiche e culturali. Destinazione, impresa, esperienza. Vol. 11. Torino: Giappichelli; 2010.
- United Nations. Statistical Division. International recommendations for tourism statistics 2008. No. 83. New York: UN; 2010.
- Navigating Global Divergences. World economic outlook. World Economic Outlook. 2023.
- Shakir Hanna SH, Cesaretti GP. Crescita economica e sostenibilità. Roma: Donzelli; 2019.
- Indriastuti M, Chariri A. The role of green investment and corporate social responsibility investment on sustainable performance. Cogent Bus Manag. 2021;8.1:1960120. [CrossRef]
- Bruno M. Applicazione di metodologie e indicatori di sostenibilità ambientale per la valutazione di nuovi sistemi di produzione di energia da fonti rinnovabili. 2023.
- Rizzello A. Green investing: Changing paradigms and future directions. Cham: Springer Nature; 2022.
- Li F, Cao X, Sheng P. Impact of pollution-related punitive measures on the adoption of cleaner production technology: Simulation based on an evolutionary game model. J Clean Prod. 2022;339:130703. [CrossRef]
- Atkinson G, Mourato S. Environmental cost-benefit analysis. Annu Rev Environ Resour. 2008;33.1:317–344.
- Hamidi E, et al. Computational study of heat transfer enhancement using porous foams with phase change materials: A comparative review. Renew Sustain Energy Rev. 2023;176:113196. [CrossRef]
- Gallo A. A refresher on internal rate of return. Harv Bus Rev Digit Artic. 2016;2.
- Pratt S, Grabowski R. Cost of capital: Applications and examples. 2008.
- Then V, et al. Social return on investment analysis. In: Palgrave Studies in Impact Finance. Cham: Palgrave Macmillan; 2017.
- Wilson KE. Social impact investment: The impact imperative for sustainable development. 2019.
- Osborne MJ. A resolution to the NPV–IRR debate?. Q Rev Econ Finance. 2010;50.2:234–239.
- Damodaran A. Applied corporate finance. 3rd ed. Hoboken (NJ): John Wiley & Sons; 2014.
- Arjunan K. A new method to estimate NPV and IRR from the capital amortization schedule and the advantages of the new method. Australas Account Bus Finance J. 2022;16.6. [CrossRef]
- Atkinson G. Cost benefit analysis and the environment: further developments and policy use. 2018.
- Qin X, et al. Exploring driving forces of green growth: Empirical analysis on China’s iron and steel industry. Sustainability. 2019;11.4:1122. [CrossRef]
- Schreyer P, Pilat D. Measuring productivity. OECD Econ Stud. 2001;33.2:127–170.
- Des Rosiers F, et al. Does an improved urban bus service affect house values?. Int J Sustain Transp. 2010;4.6:321–346.
- Di Liddo F, et al. A data analysis of the relationship between life quality indicators and the real estate market in Italian provincial capitals. Real Estate. 2025;2.2:4.
- Locurcio M, et al. An innovative GIS-based territorial information tool for the evaluation of corporate properties: An application to the Italian context. Sustainability. 2020;12.14:5836. [CrossRef]
- Orsi F. Misurazione del rischio di mercato. 2009;:1–104.
- Bărbulescu A. Modeling the greenhouse gases data series in Europe during 1990–2021. Toxics. 2023;11.9:726. [CrossRef]
- Dincer I, et al. Progress in clean energy. In: Novel Systems and Applications. Vol. 2. Cham: Springer; 2015.
- Çağlar M. Examining green growth conditions and achievements of the OECD countries: A descriptive analytical approach. Marmara Üniversitesi İktisadi ve İdari Bilimler Dergisi. 2024;:1–17.
- Khan A. Soil health and fertility: modern approaches to enhancing soil quality. Front Agric. 2024;1.2:283–324.
- Sovacool BK. Valuing the greenhouse gas emissions from nuclear power: A critical survey. Energy Policy. 2008;36.8:2950–2963. [CrossRef]
- Marzouk OA. Summary of the 2023 report of TCEP (Tracking Clean Energy Progress) by the International Energy Agency (IEA), and proposed process for computing a single aggregate rating. E3S Web Conf. 2025;601.
- Tol RSJ. The economic effects of climate change. J Econ. 2014.
- Ringel M, Knodt M. The governance of the European Energy Union: Efficiency, effectiveness and acceptance of the Winter Package 2016. Energy Policy. 2018;112:209–220. [CrossRef]
- Cosentino SL, et al. Le colture da biomassa per energia: il loro contributo alla sostenibilità agricola, energetica ed ambientale. Italus Hortus. 2014;21:29–58.
- Kammen DM. The rise of renewable energy. Sci Am. 2006;295.3:84–93. [CrossRef]
- Firdaus A, et al. Global renewable energy potential and installed capacity. Indones J Eng Sci. 2024;5.3:135–139. [CrossRef]
- Teresi G. Open Sustainability-Mobility Management: Un approccio integrato per l’efficienza e la sostenibilità dei sistemi di trasporto. Torino: Politecnico di Torino; 2024. Tesi di dottorato.
- Eiro L, et al. National Programme for Sustainable Growth in the Transport Sector 2021–2023. 2022.
- Laroche PCSJ, et al. Assessing the contribution of mobility in the European Union to rubber expansion. Ambio. 2022;51.3:770–783.
- Coraggioso G. La sostenibilità del trasporto intermodale ed il calcolo delle emissioni inquinanti. 2023.
- Rapson D, Muehlegger E. Global transportation decarbonization. J Econ Perspect. 2023;37.3:163–188.
- Burlando F. La sostenibilità ambientale nel settore Real Estate. Torino: Politecnico di Torino; 2022. Tesi di laurea.
- Citaristi I. United Nations Human Settlements Programme—UN-Habitat. In: Europa Directory of International Organizations 2022. London: Routledge; 2022, pag. 240–243.
- EA Perugia, Roma. La percezione della qualità della vita nelle città italiane: un confronto europeo. 2023.
- Masoura M, Malefaki S. Evolution of the Digital Economy and Society Index in the European Union: A Socioeconomic Perspective. TalTech J Eur Stud. 2023;13.2. [CrossRef]
- Ogbonna DN, Amangabara GT, Ekere TO. Urban solid waste generation in Port Harcourt metropolis and its implications for waste management. Manag Environ Qual Int J. 2007;18.1:71–88. [CrossRef]
- Marinello S, Lolli F, Gamberini R. Waste management and COVID-19: What does the scientific literature suggest?. Proc 10th Int Conf Informatics, Environ, Energy Appl. 2021.
- Magrini C, D’Addato F, Bonoli A. Municipal solid waste prevention: A review of market-based instruments in six European Union countries. Waste Manag Res. 2020;38.1_suppl:3–22. [CrossRef]
- Testa E. Strategie di comunicazione nella raccolta differenziata. 2011.
- Corona P. Indicatori ambientali e pianificazione territoriale. 1995.
- D’Angelis E, Grassi M. La nuova civiltà dell’acqua: il Piano Nazionale per la sicurezza idrica e idrogeologica e l’adattamento al cambiamento climatico. 2024;:1–398.
- Procházková M, et al. Industrial wastewater in the context of European Union water reuse legislation and goals. J Clean Prod. 2023;426:139037. [CrossRef]
- Brillanti C. Processi di urbanizzazione e implicazioni ambientali. Uno sguardo storico sulle peculiarità del caso Roma. In: Nuove storie. Milano: Mimesis; 2024, pag. 143–156.
- Ramm K, Smol M. Water reuse—analysis of the possibility of using reclaimed water depending on the quality class in the European countries. Sustainability. 2023;15.17:12781. [CrossRef]
- Viola J. Metodi di rilevamento delle perdite idriche lungo la rete di distribuzione del sistema acquedottistico italiano.
- Valmori I, Spadoni C. Agricoltura digitale: innovazioni e tecnologie per l'agricoltura sostenibile di oggi e domani. 2023;:1–271.
- Boerger V, et al. The state of the world’s land and water resources for food and agriculture – Systems at breaking point. Synthesis report 2021. FAO; 2021.
- Mwanza C. United Nations Human Settlements Programme: Recruitment, equitable geographical distribution and gender. 2023.
- Salvini MS. Evoluzione dell’urbanizzazione. Storia e sviluppo delle città nel mondo. Roma: Gruppo Albatros Il Filo; 2024.
- Munafò M. Consumo di suolo, dinamiche territoriali e servizi ecosistemici. Edizione 2022. Report SNPA 32/22. Roma: Sistema Nazionale per la Protezione dell’Ambiente; 2022.
- Ronchi S, Anghinelli S, Lodrini S. Riflessioni critiche sull'efficacia della VAS nel rispondere alle sfide della città contemporanea in Italia. Territorio. 2023;106.4:111–120. [CrossRef]
- Passalacqua M, Pozzo B. Diritto e rigenerazione dei brownfields. Amministrazione, obblighi civilistici, tutele. 2019.
- Battisti L, Dansero E, Di Gioia A. Riqualificazione delle periferie dal passato industriale: il ruolo delle nature-based solutions a Torino. Doc Geogr. 2023;2:279–303.
- Merola M. Misurare la sostenibilità urbana. Sistemi di indicatori a confronto e l’esperienza di ecosistema urbano. 2013.
- European Commission. OECD Regional Development Studies. Applying the Degree of Urbanisation: A Methodological Manual to Define Cities, Towns and Rural Areas for International Comparisons. Paris: OECD Publishing; 2021.
- Armondi S. Quali spazialità nelle politiche per la manifattura urbana? Scelte pubbliche e implicazioni geografiche. Geostoria Territ. 2021;:73–82.
- Bianchi A. La rigenerazione urbana per una nuova urbanistica. Riv Econ Mezzog. 2023;37.1–2:108–144.
- Campo P. Report Urban Nature 2019: Biodiversità urbana. Percorsi e proposte in campo. 2019.
- Brooks TM, et al. Global biodiversity conservation priorities. Science. 2006;313.5783:58–61.
- Erdogan HE, et al. Soil conservation and sustainable development goals (SDGs) achievement in Europe and Central Asia: Which role for the European soil partnership?. Int Soil Water Conserv Res. 2021;9.3:360–369. [CrossRef]
- Munafò M, et al. ISPRA land and soil monitoring, mapping, and assessment activities. In: Dazzi C, editor. Soil Science in Italy: 1861 to 2024. Cham: Springer International Publishing; 2024, pag. 607–619.
- World Health Organization. WHO global air quality guidelines: particulate matter (PM2.5 and PM10), ozone, nitrogen dioxide, sulfur dioxide and carbon monoxide. Geneva: WHO; 2021.
- Turner MC, et al. Clean air in Europe for all! Taking stock of the proposed revision to the ambient air quality directives: a joint ERS, HEI and ISEE workshop report. Eur Respir J. 2023;62.4. [CrossRef]
- Global Footprint Network. Global footprint network, ecological footprint. 2023.
- Amrhein S, Reiser D. Ecological footprint. In: Idowu SO, Del Baldo M, Capaldi N, editors. Encyclopedia of Sustainable Management. Cham: Springer International Publishing; 2023, pag. 1234–1240.
- Dechamps P. The IEA World Energy Outlook 2022 – A brief analysis and implications. Eur Energy Climate J. 2023;11.3:100–103. [CrossRef]
- Balluchi F. La valutazione delle performance socio-ambientali: indicatori e modelli interpretativi. Torino: Giappichelli Editore; 2013.
- Agrosì G, ed. La Smart City e la città comoda: una nuova realtà futurista “Smartiana”. Milano: Mimesis; 2022.
- US Green Building Council. LEED v4 for building design and construction. Washington (DC): USGBC Inc; 2014.
- Mustonen T, et al. The role of indigenous knowledge and local knowledge in understanding and adapting to climate change. In: IPCC Climate Change. 2022:2021–2030.
- Telišman-Košuta N, Ivandić N. Collaborative destination management based on carrying capacity assessment from resident and visitor perspectives: A case study of Crikvenica-Vinodol Riviera, Croatia. In: Petrosillo I, editor. Mediterranean Protected Areas in the Era of Overtourism: Challenges and Solutions. Cham: Springer International Publishing; 2021, pag. 175–192.
- Lucas K, Van Wee B, Maat K. A method to evaluate equitable accessibility: combining ethical theories and accessibility-based approaches. Transp. 2016;43.3:473–490. [CrossRef]
- Currie G. Quantifying spatial gaps in public transport supply based on social needs. J Transp Geogr. 2010;18.1:31–41. [CrossRef]
- Litman T. Evaluating transportation equity. Victoria (BC): Victoria Transport Policy Institute; 2017.
- Myrovali G, Morfoulaki M. Sustainable urban mobility. In: Urban Sustainability: A Game-Based Approach. Cham: Springer International Publishing; 2021, pag. 39–80.
- Cerquetti M, Sánchez-Mesa Martínez L, Vitale C. The management of cultural heritage and landscape in inner areas. 2019.
- Landmann T. Cultural security within the European Union in terms of selected conditions of the cultural economics. Sci J Military Univ Land Forces. 2021;53. [CrossRef]
- Pilipchuk NV, et al. Transformation of the higher education services market: Comparative analysis by OECD countries. In: Innovative Trends in International Business and Sustainable Management. Singapore: Springer Nature Singapore; 2022, pag. 321–332.
- Citaristi I. United Nations Educational, Scientific and Cultural Organization—UNESCO. In: Europa Directory of International Organizations 2022. London: Routledge; 2022, pag. 369–375.
- ISTAT. Le innovazioni nella rilevazione: la conduzione della raccolta dei dati nel censimento delle istituzioni pubbliche. Roma: Istituto Nazionale di Statistica; 2024.
- Turok I, Visagie J. Inclusive urban development in South Africa: what does it mean and how can it be measured?. Brighton: Institute of Development Studies; 2018.
- Mulgan G, Tucker S, Ali R, Sanders B. Social innovation: what it is, why it matters and how it can be accelerated. Oxford: Young Foundation; 2007.
- Servi M. Gestione sostenibile dei beni naturali Patrimonio dell'Umanità: il modello del Tourism Business Ecosystem applicato al Parco Nazionale dei Laghi di Plitvice. 2024.
- World Health Organization. Monitoring the building blocks of health systems: a handbook of indicators. Geneva: WHO Document Production Services; 2010.
- Vandenbroucke F. Working together to advance resilient health systems across the OECD. Lancet. 2024;403.10425:415–416. [CrossRef]
- World Health Organization. Global Strategy on Human Resources for Health: Workforce 2030. Geneva: WHO; 2016.
- Liu JX, Goryakin Y, Maeda A, Bruckner T, Scheffler RM. Global health workforce labor market projections for 2030. Hum Resour Health. 2017;15.1:11.
- Di Bella E, Suter C. The main indicators of gender (in)equality. In: Marcuzzo MC, editor. Measuring Gender Equality. Milano: FrancoAngeli; 2023, pag. 61.
- UN Women. Progress on the sustainable development goals: the gender snapshot 2022. 2022.
- Antoninis M, et al. Global Education Monitoring Report 2023: Technology in education: a tool on whose terms?. Paris: UNESCO; 2023.
- Klapper L, Lusardi A, Van Oudheusden P. Financial literacy around the world. Washington (DC): World Bank; 2015.
- World Health Organization. Urban green spaces and health: a review of evidence. Copenhagen: WHO Regional Office for Europe; 2016.
- Kabisch N, Qureshi S, Haase D. Human–environment interactions in urban green spaces: a systematic review of contemporary issues and prospects for future research. Environ Impact Assess Rev. 2015;50:25–34. [CrossRef]
- Graziano P, Rizzi P. Resilienza e vulnerabilità nelle regioni europee. Scienze Regionali. 2020;19.1:91–118.
- Cutter SL, Boruff BJ, Shirley WL. Social vulnerability to environmental hazards. In: Moser SC, editor. Hazards, Vulnerability and Environmental Justice. London: Routledge; 2012, pag. 115–132. [CrossRef]
- Bigini M, Sacchi A. Crisi demografica, composizione della spesa pubblica e crescita economica: il caso italiano. Argomenti. 2024;28.
- Bongaarts J. United Nations Department of Economic and Social Affairs, Population Division. World Family Planning 2020: Highlights. New York: United Nations Publications; 2020. [CrossRef]
- Hayes BE, Perander J, Smecko T, Trask J. Measuring perceptions of workplace safety: development and validation of the Work Safety Scale. J Saf Res. 1998;29.3:145–161. [CrossRef]
- McDaniels TL, Kamlet MS, Fischer GW. Risk perception and the value of safety. Risk Anal. 1992;12.4:495–503.
- Ivaldi E, Bonatti G, Soliani R. Composite index for quality of life in Italian cities: an application to URBES indicators. Rev Econ Finance. 2014;4:18–32.
- Carter DL. Law enforcement intelligence: a guide for state, local, and tribal law enforcement agencies. Vol. 16. Washington (DC): US Department of Justice, Office of Community Oriented Policing Services; 2004.
- McElreath DH, et al. Introduction to law enforcement. Boca Raton (FL): CRC Press; 2013.
- Nicholson-Crotty S, O'Toole LJ Jr. Public management and organizational performance: the case of law enforcement agencies. J Public Adm Res Theory. 2004;14.1:1–18. [CrossRef]
- Campagna D, Caperna G, Montalto V. Does culture make a better citizen? Exploring the relationship between cultural and civic participation in Italy. Soc Indic Res. 2020;149.2:657–686. [CrossRef]
- Balanskat A, Blamire R, Kefala S. The ICT impact report. Brussels: European Schoolnet; 2006.
- Rodela R. Decision support for inclusive spatial planning in the European geographical context. Plan Pract Res. 2025;40.2:406–420. [CrossRef]
- Pylypenko V, et al. Social inclusion in driving sustainable growth within United Territorial Communities. Grassroots J Nat Resour. 2024;7.3:420–457. [CrossRef]
- Guarini, M.R., Battisti, F. Social housing and redevelopment of building complexes on brownfield sites: The financial sustainability of residential projects for vulnerable social groups, Advanced Materials ResearchOpen source preview, 2014, 869-870, pp. 3–13. [CrossRef]
- Guarini, M.R., Battisti, F., Evaluation and management of land-development processes based on the public-private partnership, Advanced Materials ResearchOpen source preview, 2014, 869-870, pp. 154–161. [CrossRef]
Figure 1.
Flowchart of the methodological approach applied for the selection and exam of urban sustainability indicators.
Figure 1.
Flowchart of the methodological approach applied for the selection and exam of urban sustainability indicators.
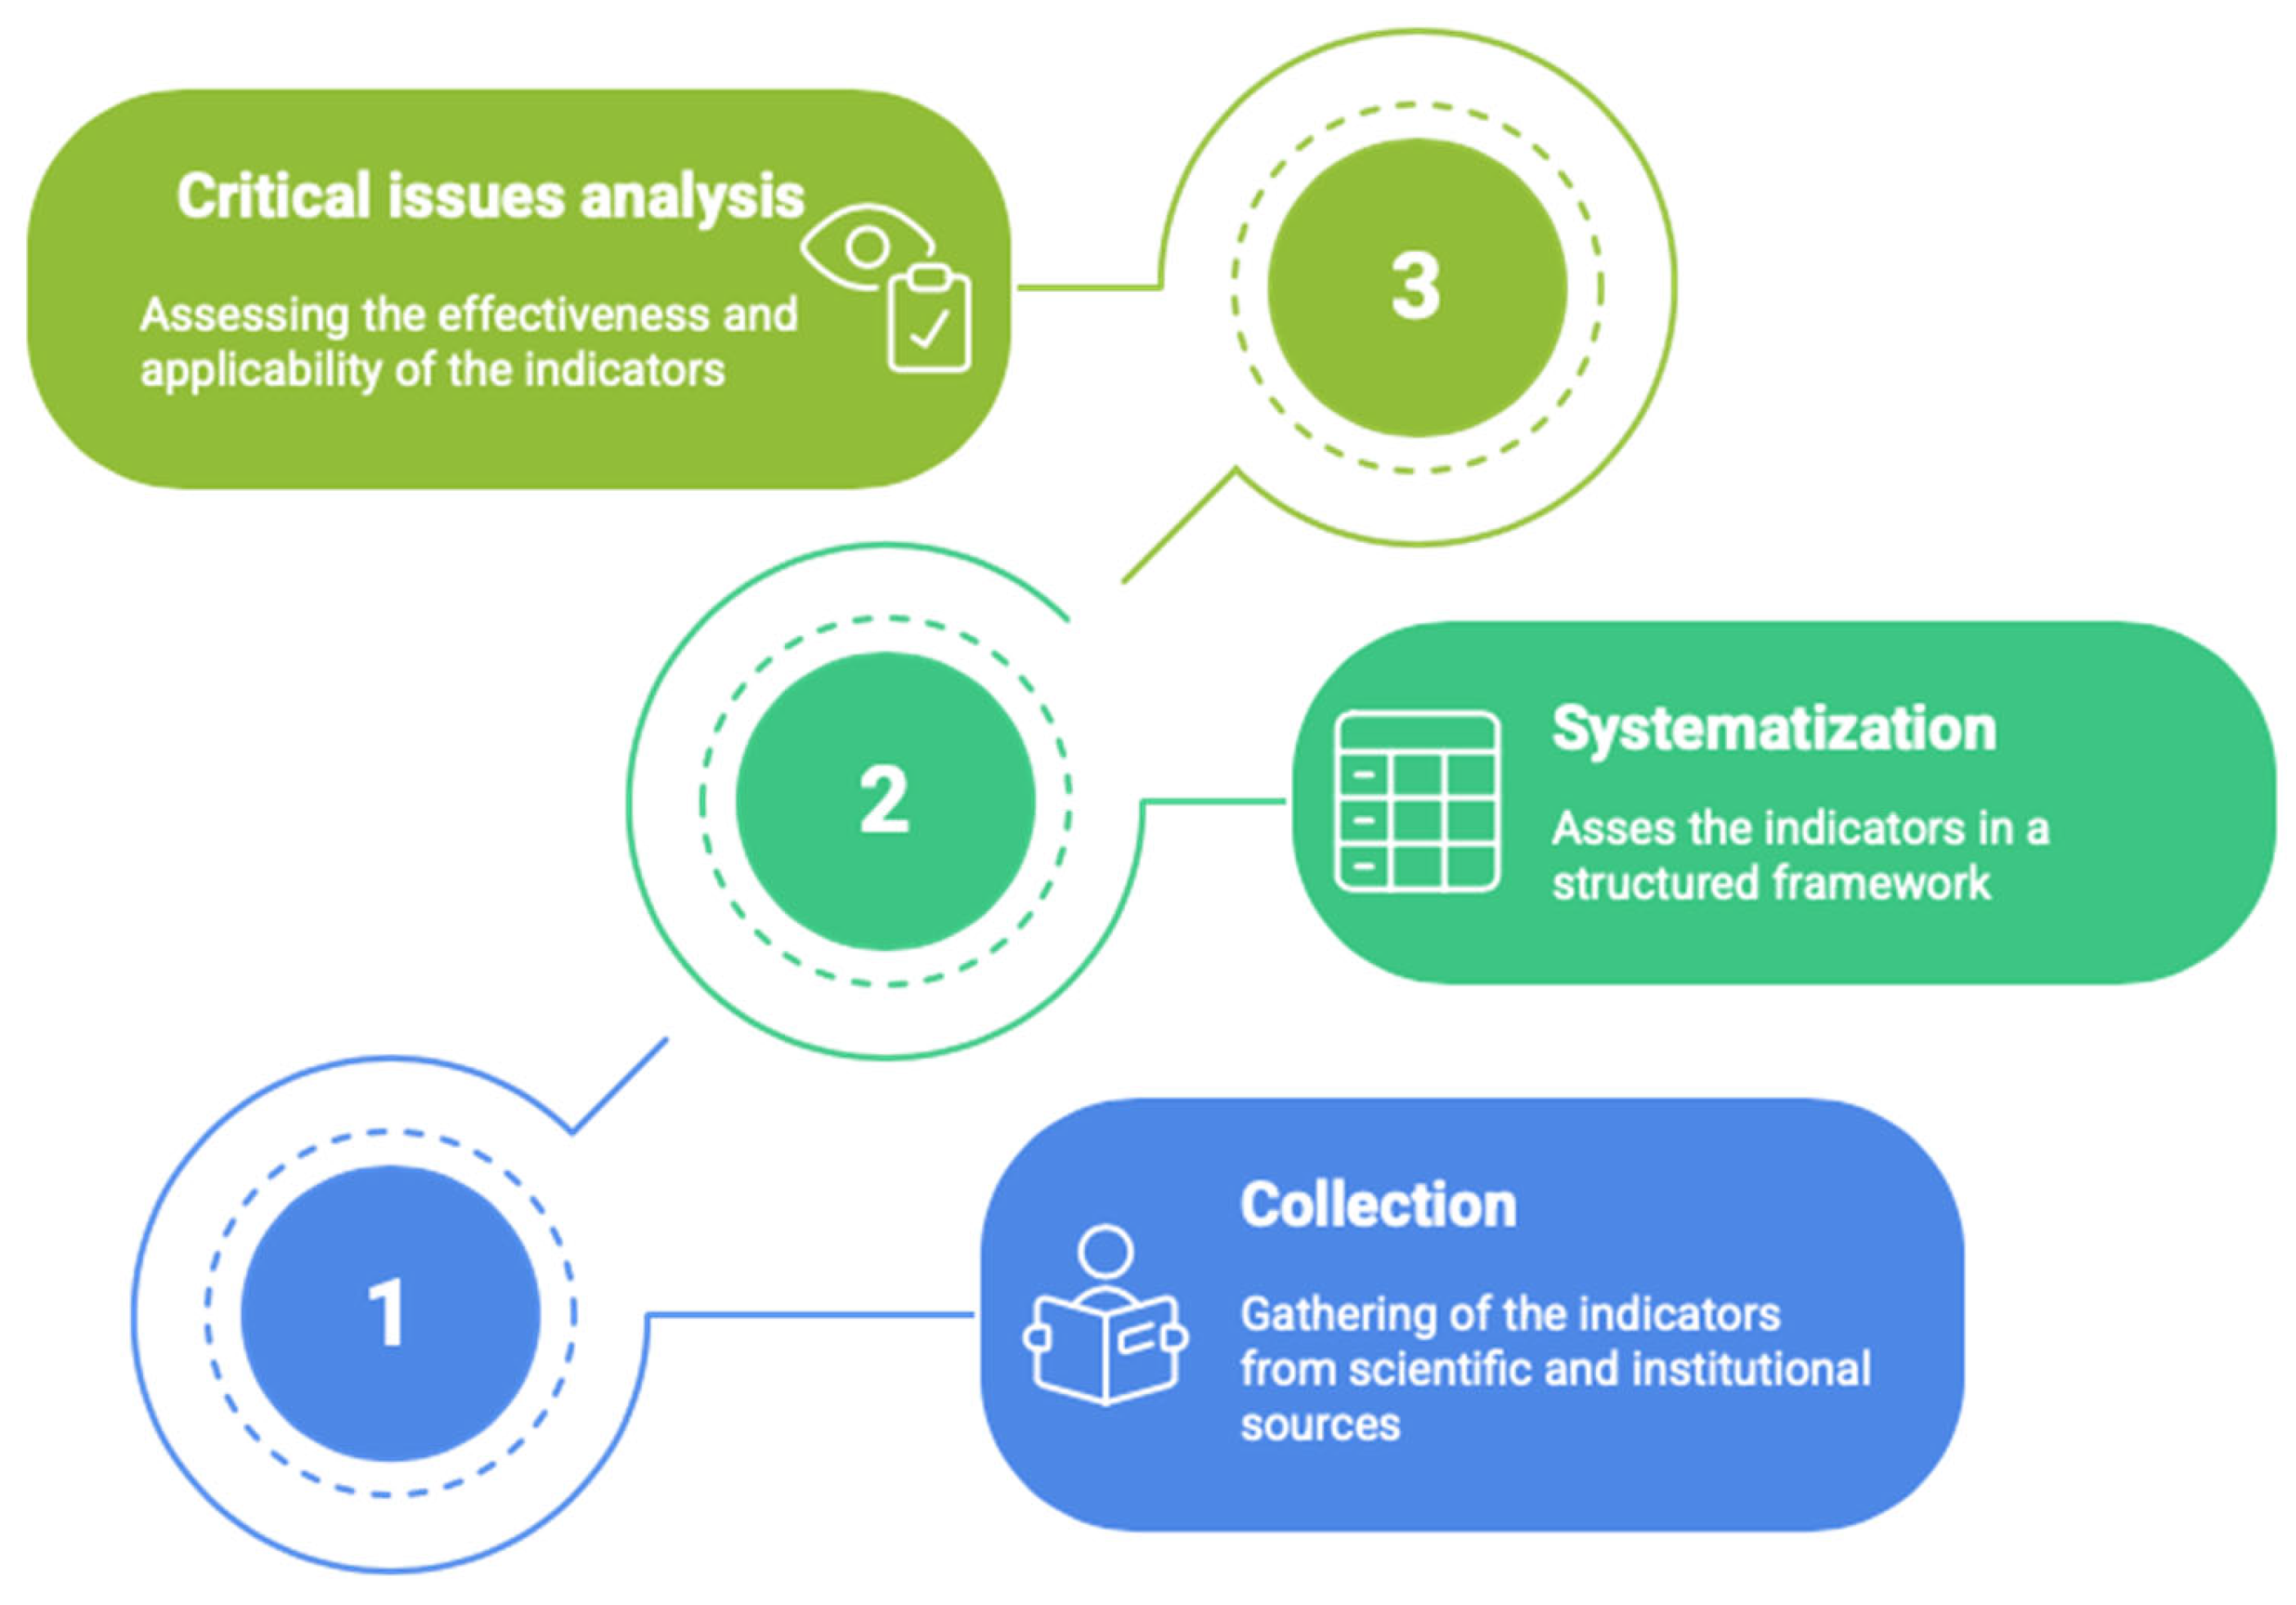
Figure 2.
Overview of the urban sustainability indicators examined within the three thematic categories (economic, environmental and social).
Figure 2.
Overview of the urban sustainability indicators examined within the three thematic categories (economic, environmental and social).
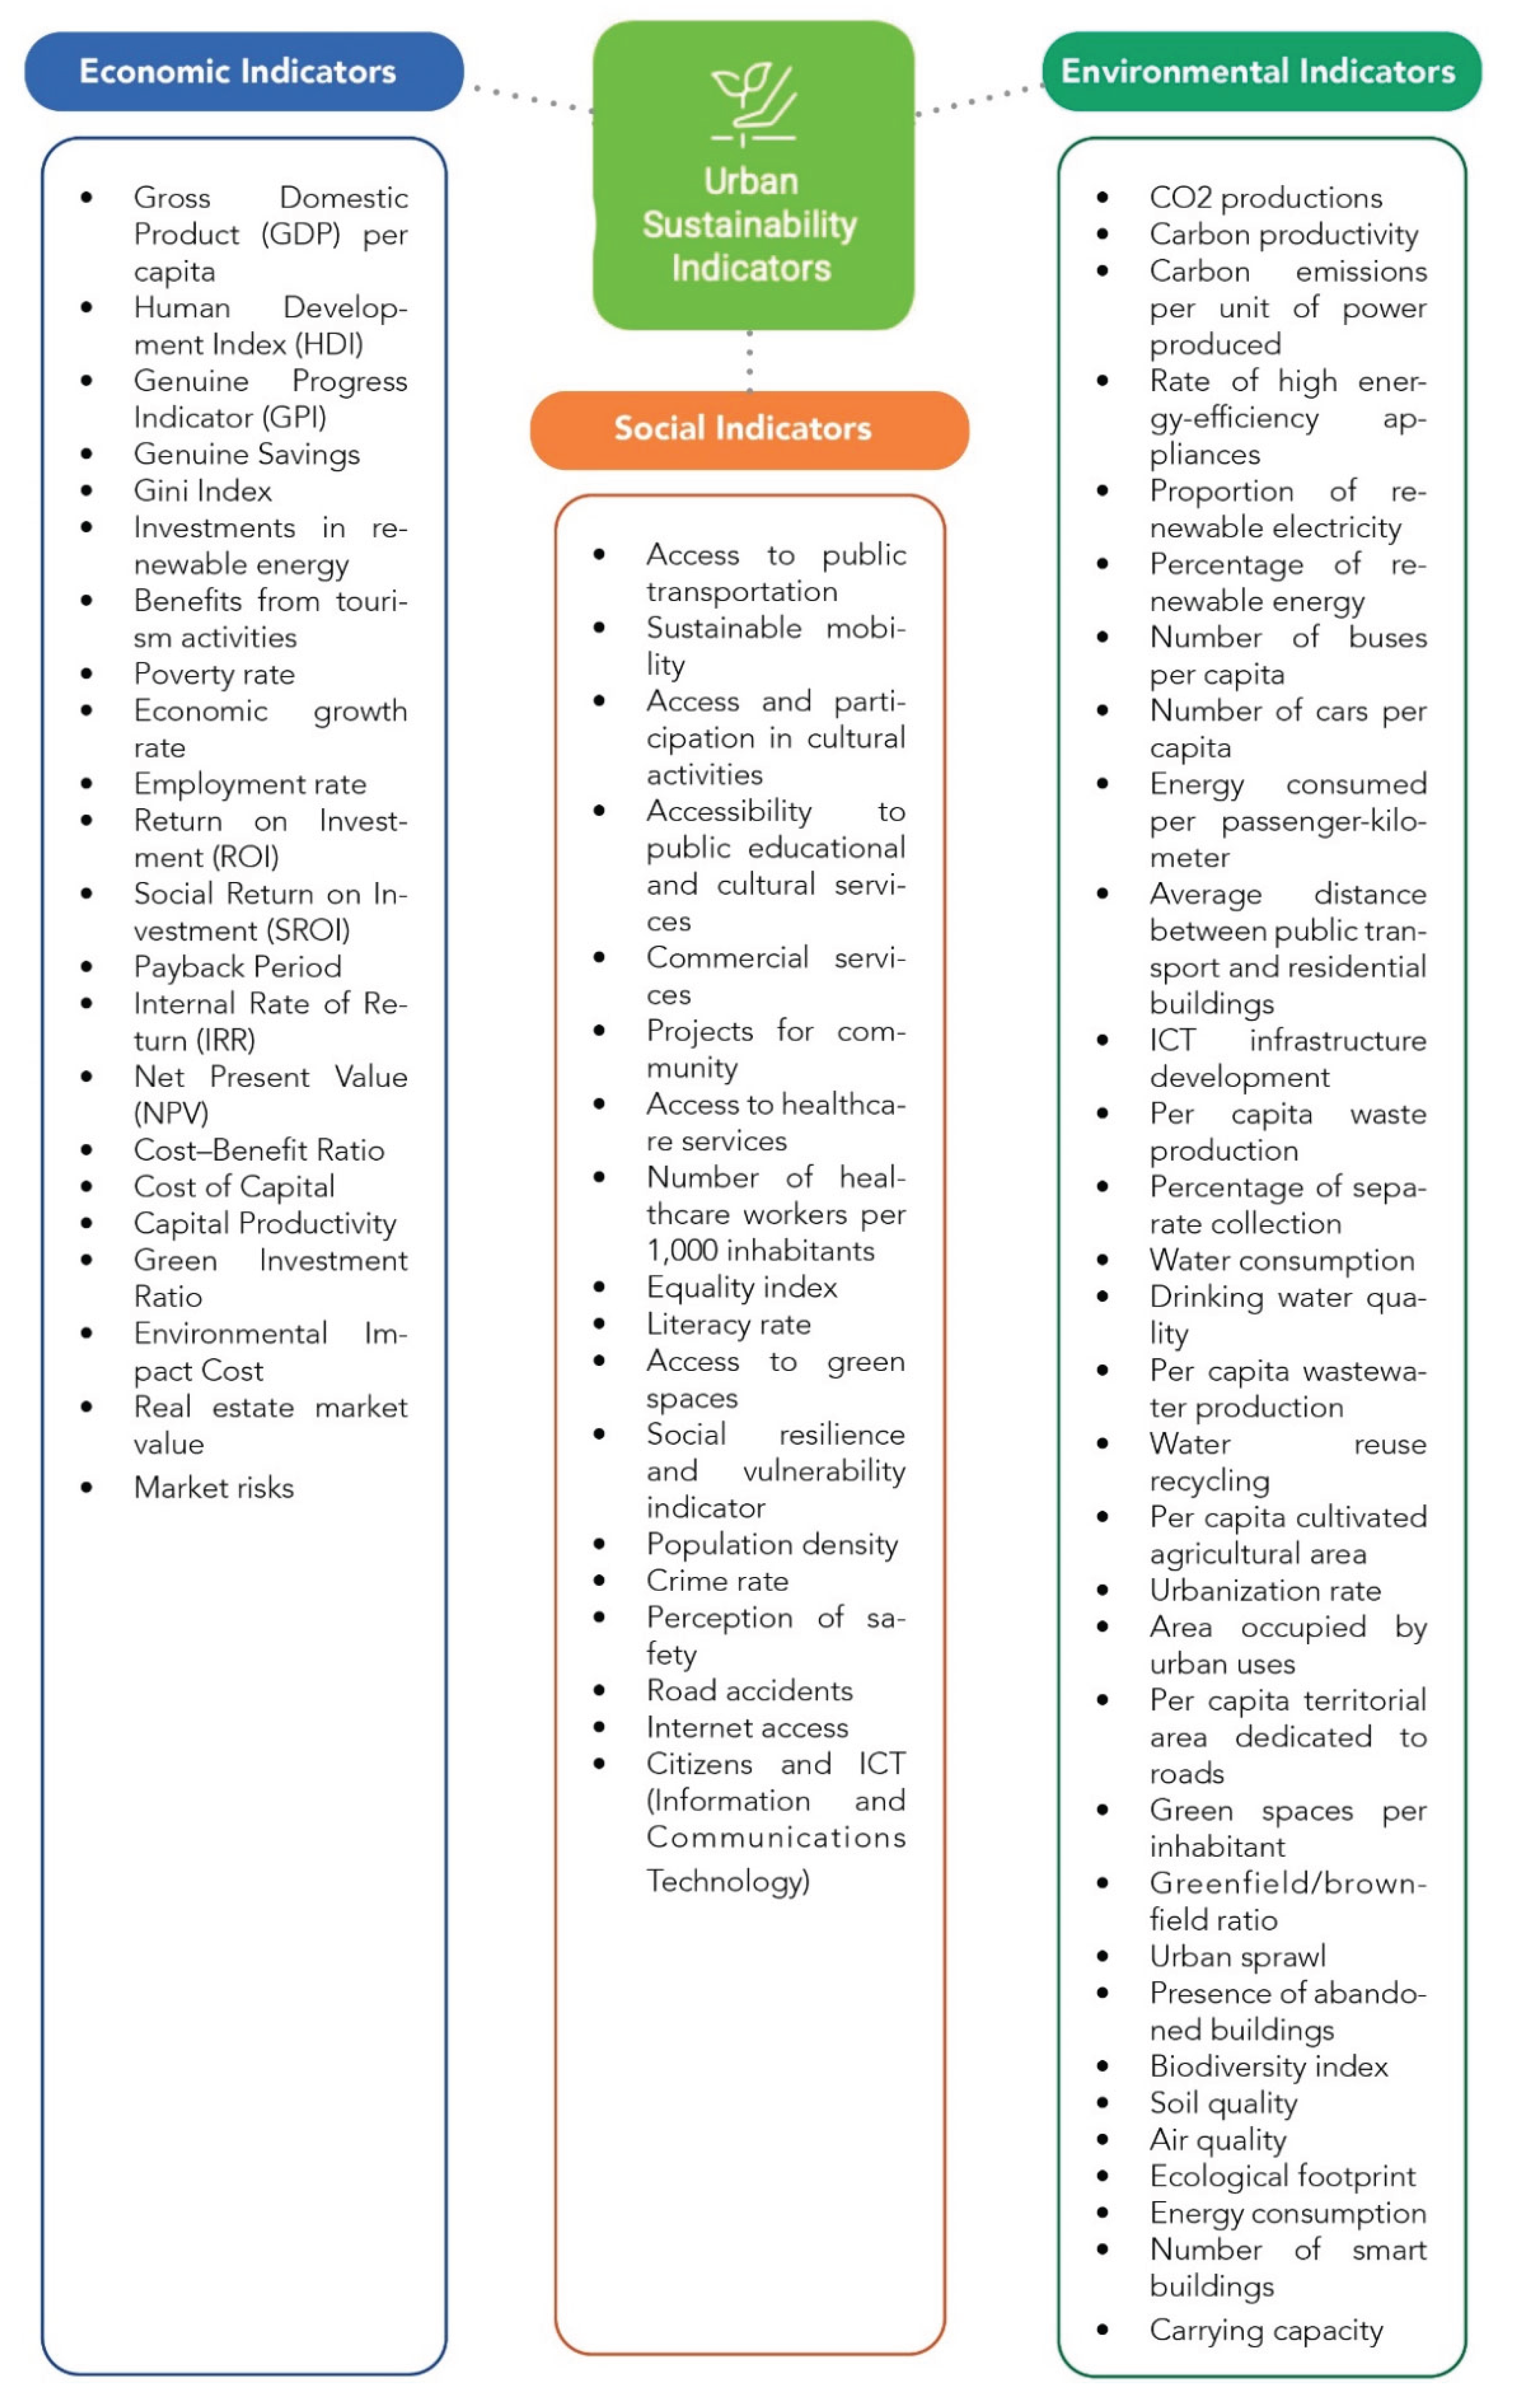
Disclaimer/Publisher’s Note: The statements, opinions and data contained in all publications are solely those of the individual author(s) and contributor(s) and not of MDPI and/or the editor(s). MDPI and/or the editor(s) disclaim responsibility for any injury to people or property resulting from any ideas, methods, instructions or products referred to in the content. |
© 2025 by the authors. Licensee MDPI, Basel, Switzerland. This article is an open access article distributed under the terms and conditions of the Creative Commons Attribution (CC BY) license (http://creativecommons.org/licenses/by/4.0/).
Copyright: This open access article is published under a Creative Commons CC BY 4.0 license, which permit the free download, distribution, and reuse, provided that the author and preprint are cited in any reuse.


