Introduction
Stroke is characterized by an interruption of blood flow to critical regions of the brain, leading to irreversible damage and long-term effects on the nervous system. The underlying etiology of stroke can be thrombotic, hemorrhagic, or embolic, with most cases (around 85%) being ischemic in nature. Stroke is the second leading cause of death and the third leading cause of acquired disability in adults worldwide [
1,
2,
3,
4].
One of the major contributors to stroke-related disability associated is the development of neuropsychiatric disorders. Post-stroke emotional and mood disorders include depression, anxiety, emotional incontinence, anger propensity, and fatigue [
5]. These emotional disturbances negatively impact clinical outcomes for patients [
6].
Depression worsens functional recovery after stroke, reduces quality of life, leads to less efficient use of rehabilitation services, and increases mortality [
7]. Longitudinal studies have shown that post-stroke depression (PSD) increases its prevalence during the first few weeks following the stroke and seriously impairs cognitive recovery. Interestingly, more than half (53%) of patients who suffer from early-onset PSD (within the first 3 months after the stroke) end up with persistent depression [
8,
9,
10].
The estimated prevalence of PSD is around 30-35%, with reported rates ranging from 20 to 60% [
11,
12]. Several observational studies and systematic reviews have reported prevalence proportions of PSD in varying degrees and formats. However, despite the abundance of primary studies, it is surprising that no systematic review focusing specifically on comparative studies with a control arm is currently available [
13].
The odds ratio, derived from longitudinal, case-control, and cross-sectional studies, offers a more robust measure of association than a simple percentage percentages. It accounts for the relative likelihood of an outcome following a specific exposure, thereby providing deeper insight into potential individualized risk. For this reason, we aimed to conduct a meta-analysis of all peer reviewed, two-armed primary studies to calculate a pooled odds ratio for PSD [
14].
Methods
Study Design and Search Strategy
A pre-registered systematic review and meta-analysis (INPLASY registration number: INPLASY202440106) was conducted on studies reporting the prevalence of depression as a consequence of brain stroke published from inception up to September 23, 2024. The search was performed across two major medical databases, PubMed and Web of Science, in accordance with the Prisma 2020 guidelines [
15].
A comprehensive and unrestricted search protocol was developed based on the following PICO framework: Patients: adult patients with brain stroke; Intervention: N/A; Comparison: Prevalence of depression in stroke patients vs. control group; Outcome: Prevalence.
The PubMed query was: ((((stroke [Text Word]) OR (post-stroke [Text Word])) OR (stroke [MeSH Terms])) AND ((depression [Text Word]) OR (depression [MeSH Terms]))) AND ((((prevalence [Text Word]) OR (prevalence [MeSH Terms])) OR (incidence [Text Word])) OR (incidence [MeSH Terms])). An identifcal search strategy, with appropriate adaptations for database-specific syntax, was applied to the Web of Science database.
Inclusion and Exclusion Criteria
The inclusion screening process consisted of two main stages: (1) title and abstract screening; and (2) full-text screening. During the title and abstract screening, studies that clearly did not report on PSD were excluded. In the full-text screening stage, studies were categorized into three groups: 1. Excluded: Studies that did not report the prevalence of PSD; 2. Partially included: Studies that repored the prevalence of PSD only as a percentage. For these, only the sample size and percentage of stroke survivors with depression were recorded; 3. Fully included: Comparative studies with a control group that reported our outcome of interest (prevalence odds ratio (OR) with 95% confidence intervals (CI)) and prevalence proportion of PSD. These studies underwent complete data extraction and quality assessment.
Data Extraction and Quality Assessment
In this systematic review, the prevalence OR was set as the main outcome of interest hence, all studies reporting OR or sufficient data to calculate the OR with a 95% CI, were chosen for quality assessment and complete data extraction, consisting of first author’s name, publication year, sample size, country where the study was conducted, follow-up duration and the scale implemented for depression assessment.
As recommended, for quality or risk of bias assessment of cohort and case-control studies, Newcastle-Ottawa score (NOS) was applied [
16]. Also to evaluate cross-sectional studies, an adapted version of NOS was used which is attached as appendix A. A color code was designed for better visualization of risk of bias being red for score 0 to 3 (high risk of bias), yellow for 4 to 6 (average risk of bias) and green for 7 to 9 (low risk of bias).
Among assessed studies, there were studies titled as case-control studies, but the design matched better with cohort studies, since all of them had a prospective nature. On such occasions the cohort questionnaire of NOS scale was applied for more adequate evaluation.
For having a comprehensive sum of mean ± standard deviation (SD) of PSD prevalence proportion in actual literature, associated data was extracted from all included studies.
EndNote 21 and Microsoft excel 2024 softwares were used for above mentioned data extraction and quality assessment process.
Statistical Analysis
In this meta-analysis, the OR with 95% CI [95% CI] was the primary outcome of interest. The effect size was expressed as the log odds ratio with its standard error. Due to the heterogeneous nature of the included studies, a random-effects model was used to calculate the pooled effect, which is presented in a forest plot.
A Begg’s funnel plot was used for the qualitative evaluation of publication bias. For quantitative evaluation, Begg and Mazumdar’s rank correlation test and Egger’s regression tests were applied. Given the discrepancy between the quantitative and qualitative assessments, the results of Duval and Tweedie’s trim and fill method were also reported [
17,
18].
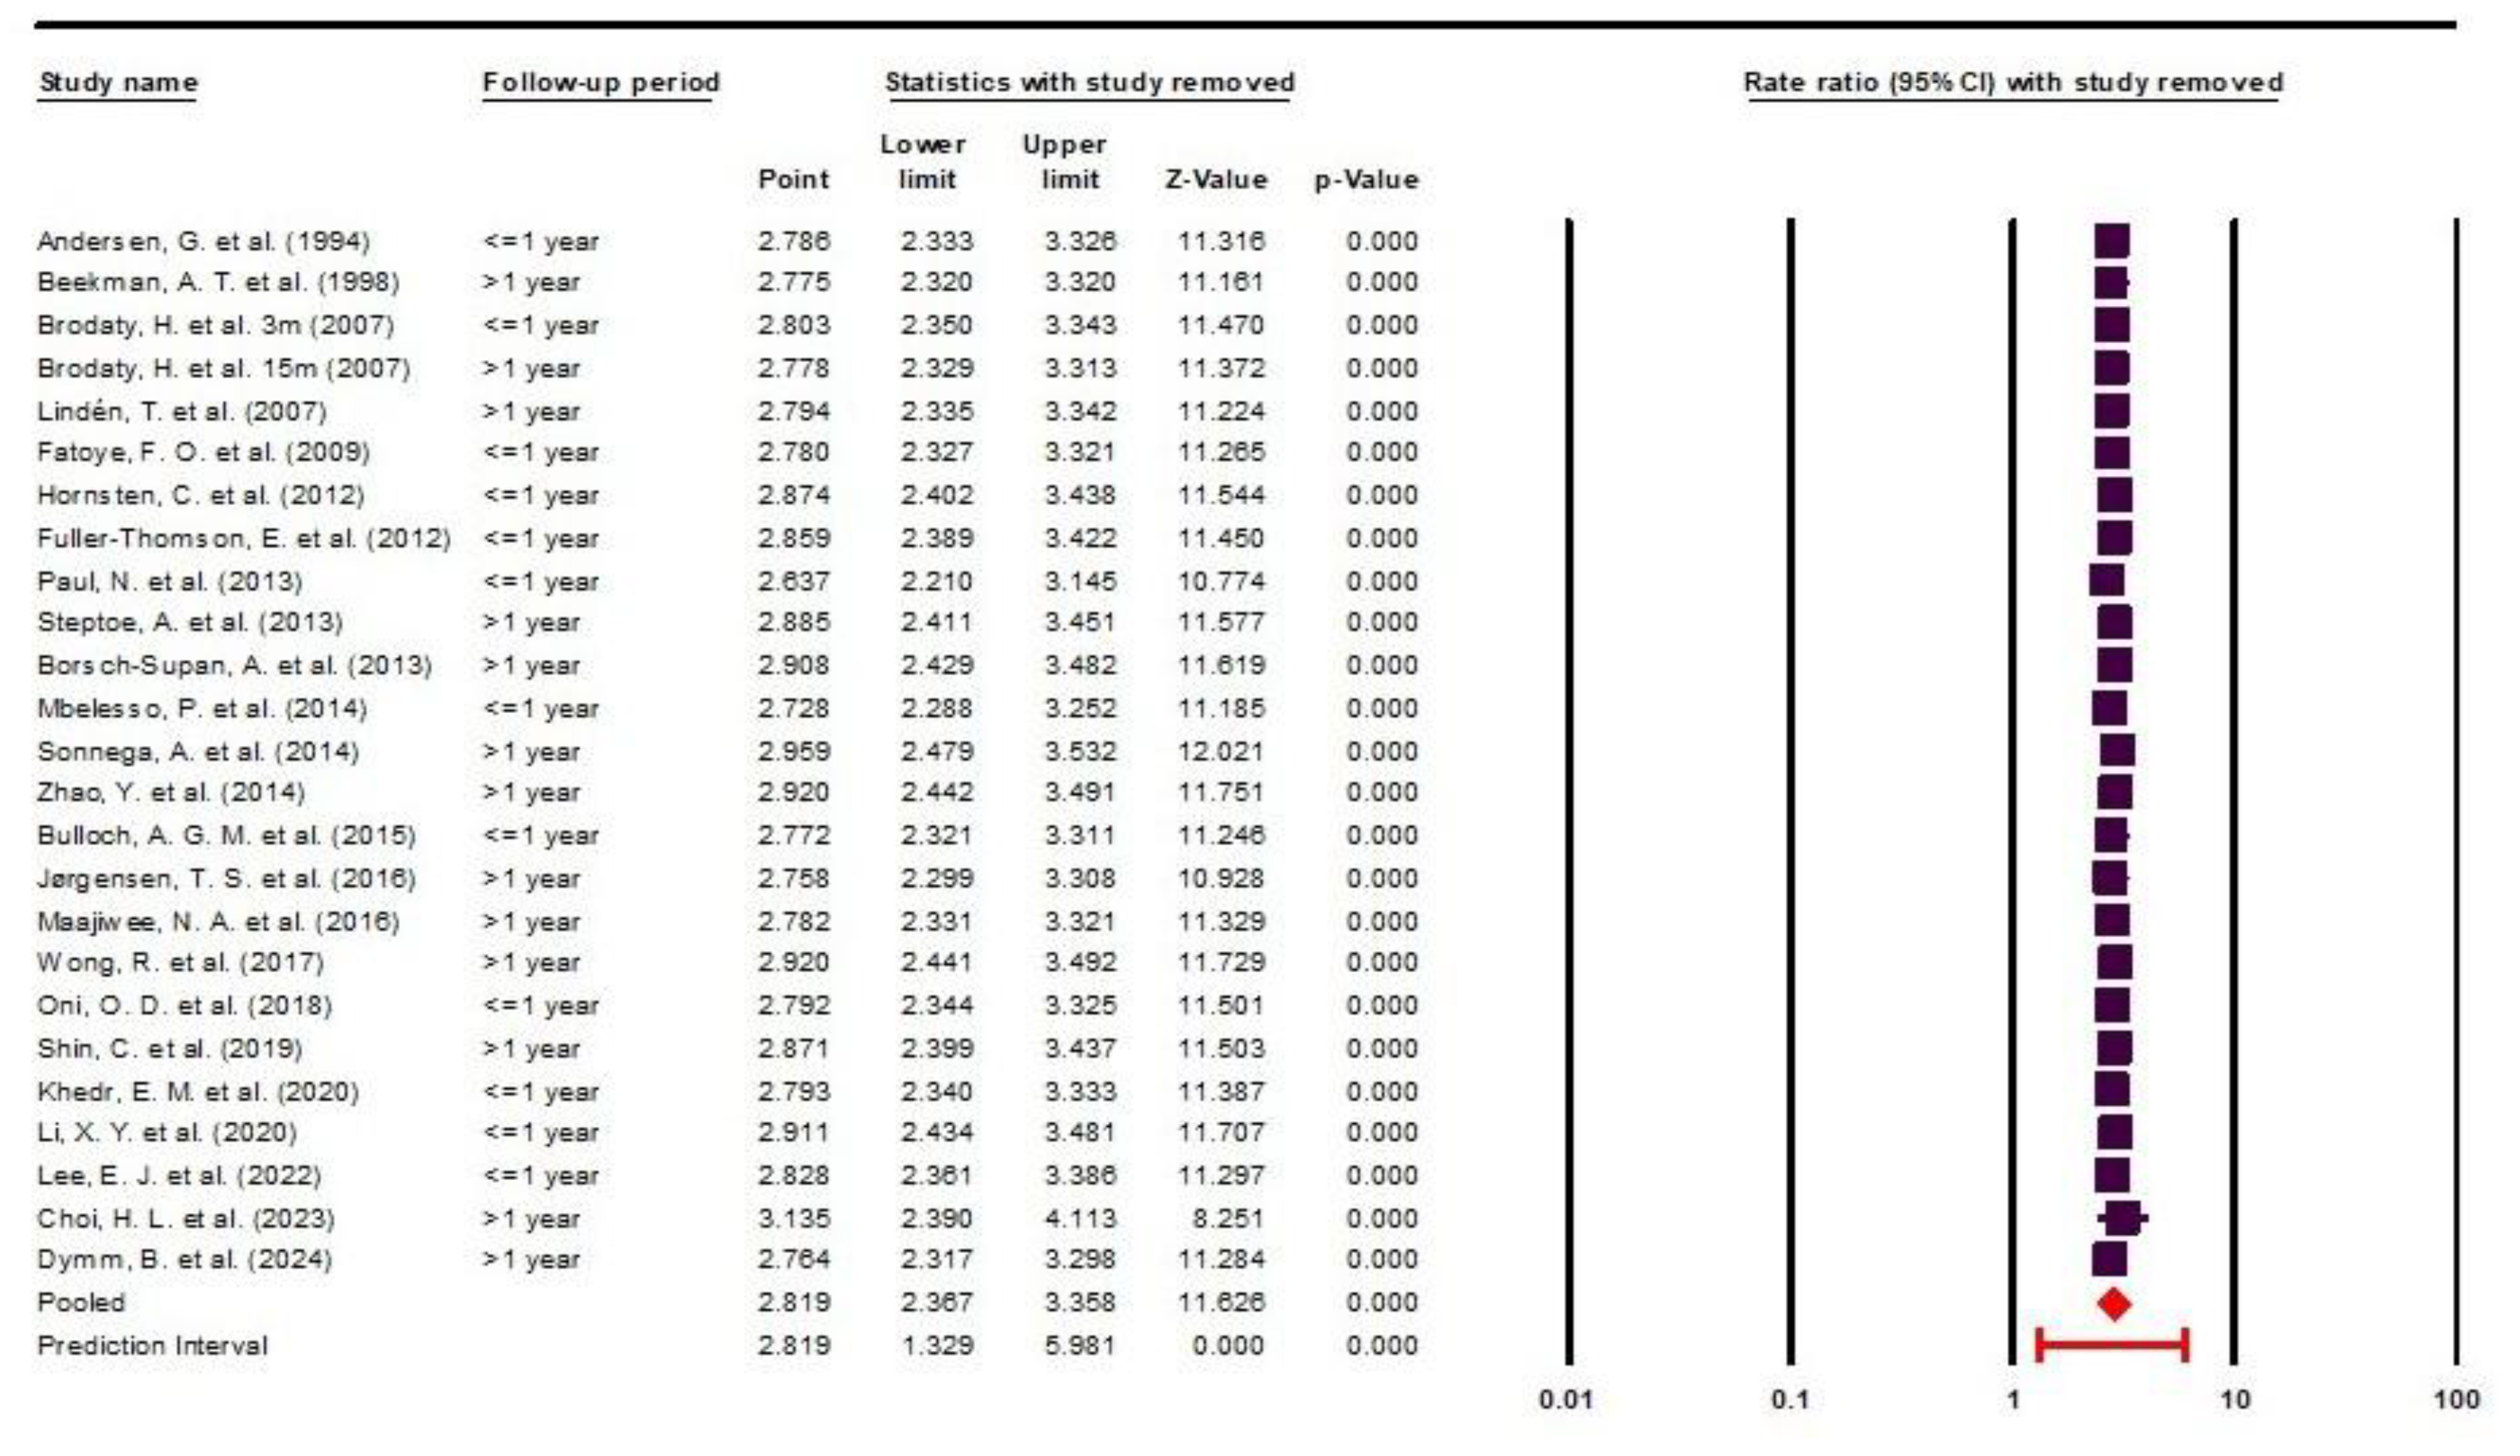
Heterogeneity was assessed using the I² and Q statistics, along with their corresponding P-values. To evaluate the sensitivity of the meta-analysis results to individual studies, a one-study-removed sensitivity analysis was performed and presented as forest plot. In this analysis, each primary study was sequentially excluded, and the overall effect size was recalculated to assess the robustness of the findings.
All meta-analytical tests were conducted using Comprehensive Meta-Analysis software, version 4 (Borenstein, M., Hedges, L., Rothstein, H. Biostat, Englewood, NJ 2022). A P-value < 0.05 was considered statistically significant in all analyses.
IBM SPSS Statistics (version 27) was applied to calculate the mean ± SD of PSD prevalence proportion and to generate the associated distribution chart.
Results
Search Results
The initial search retrieved a total of 5887 published papers. After removing 1735 duplicates and 3 retracted articles, 4149 studies were screened based on their titles and abstracts. Of these, 3881 papers were excluded, and 268 studies were selected for full-text screening, as illustrated in
Figure 1.
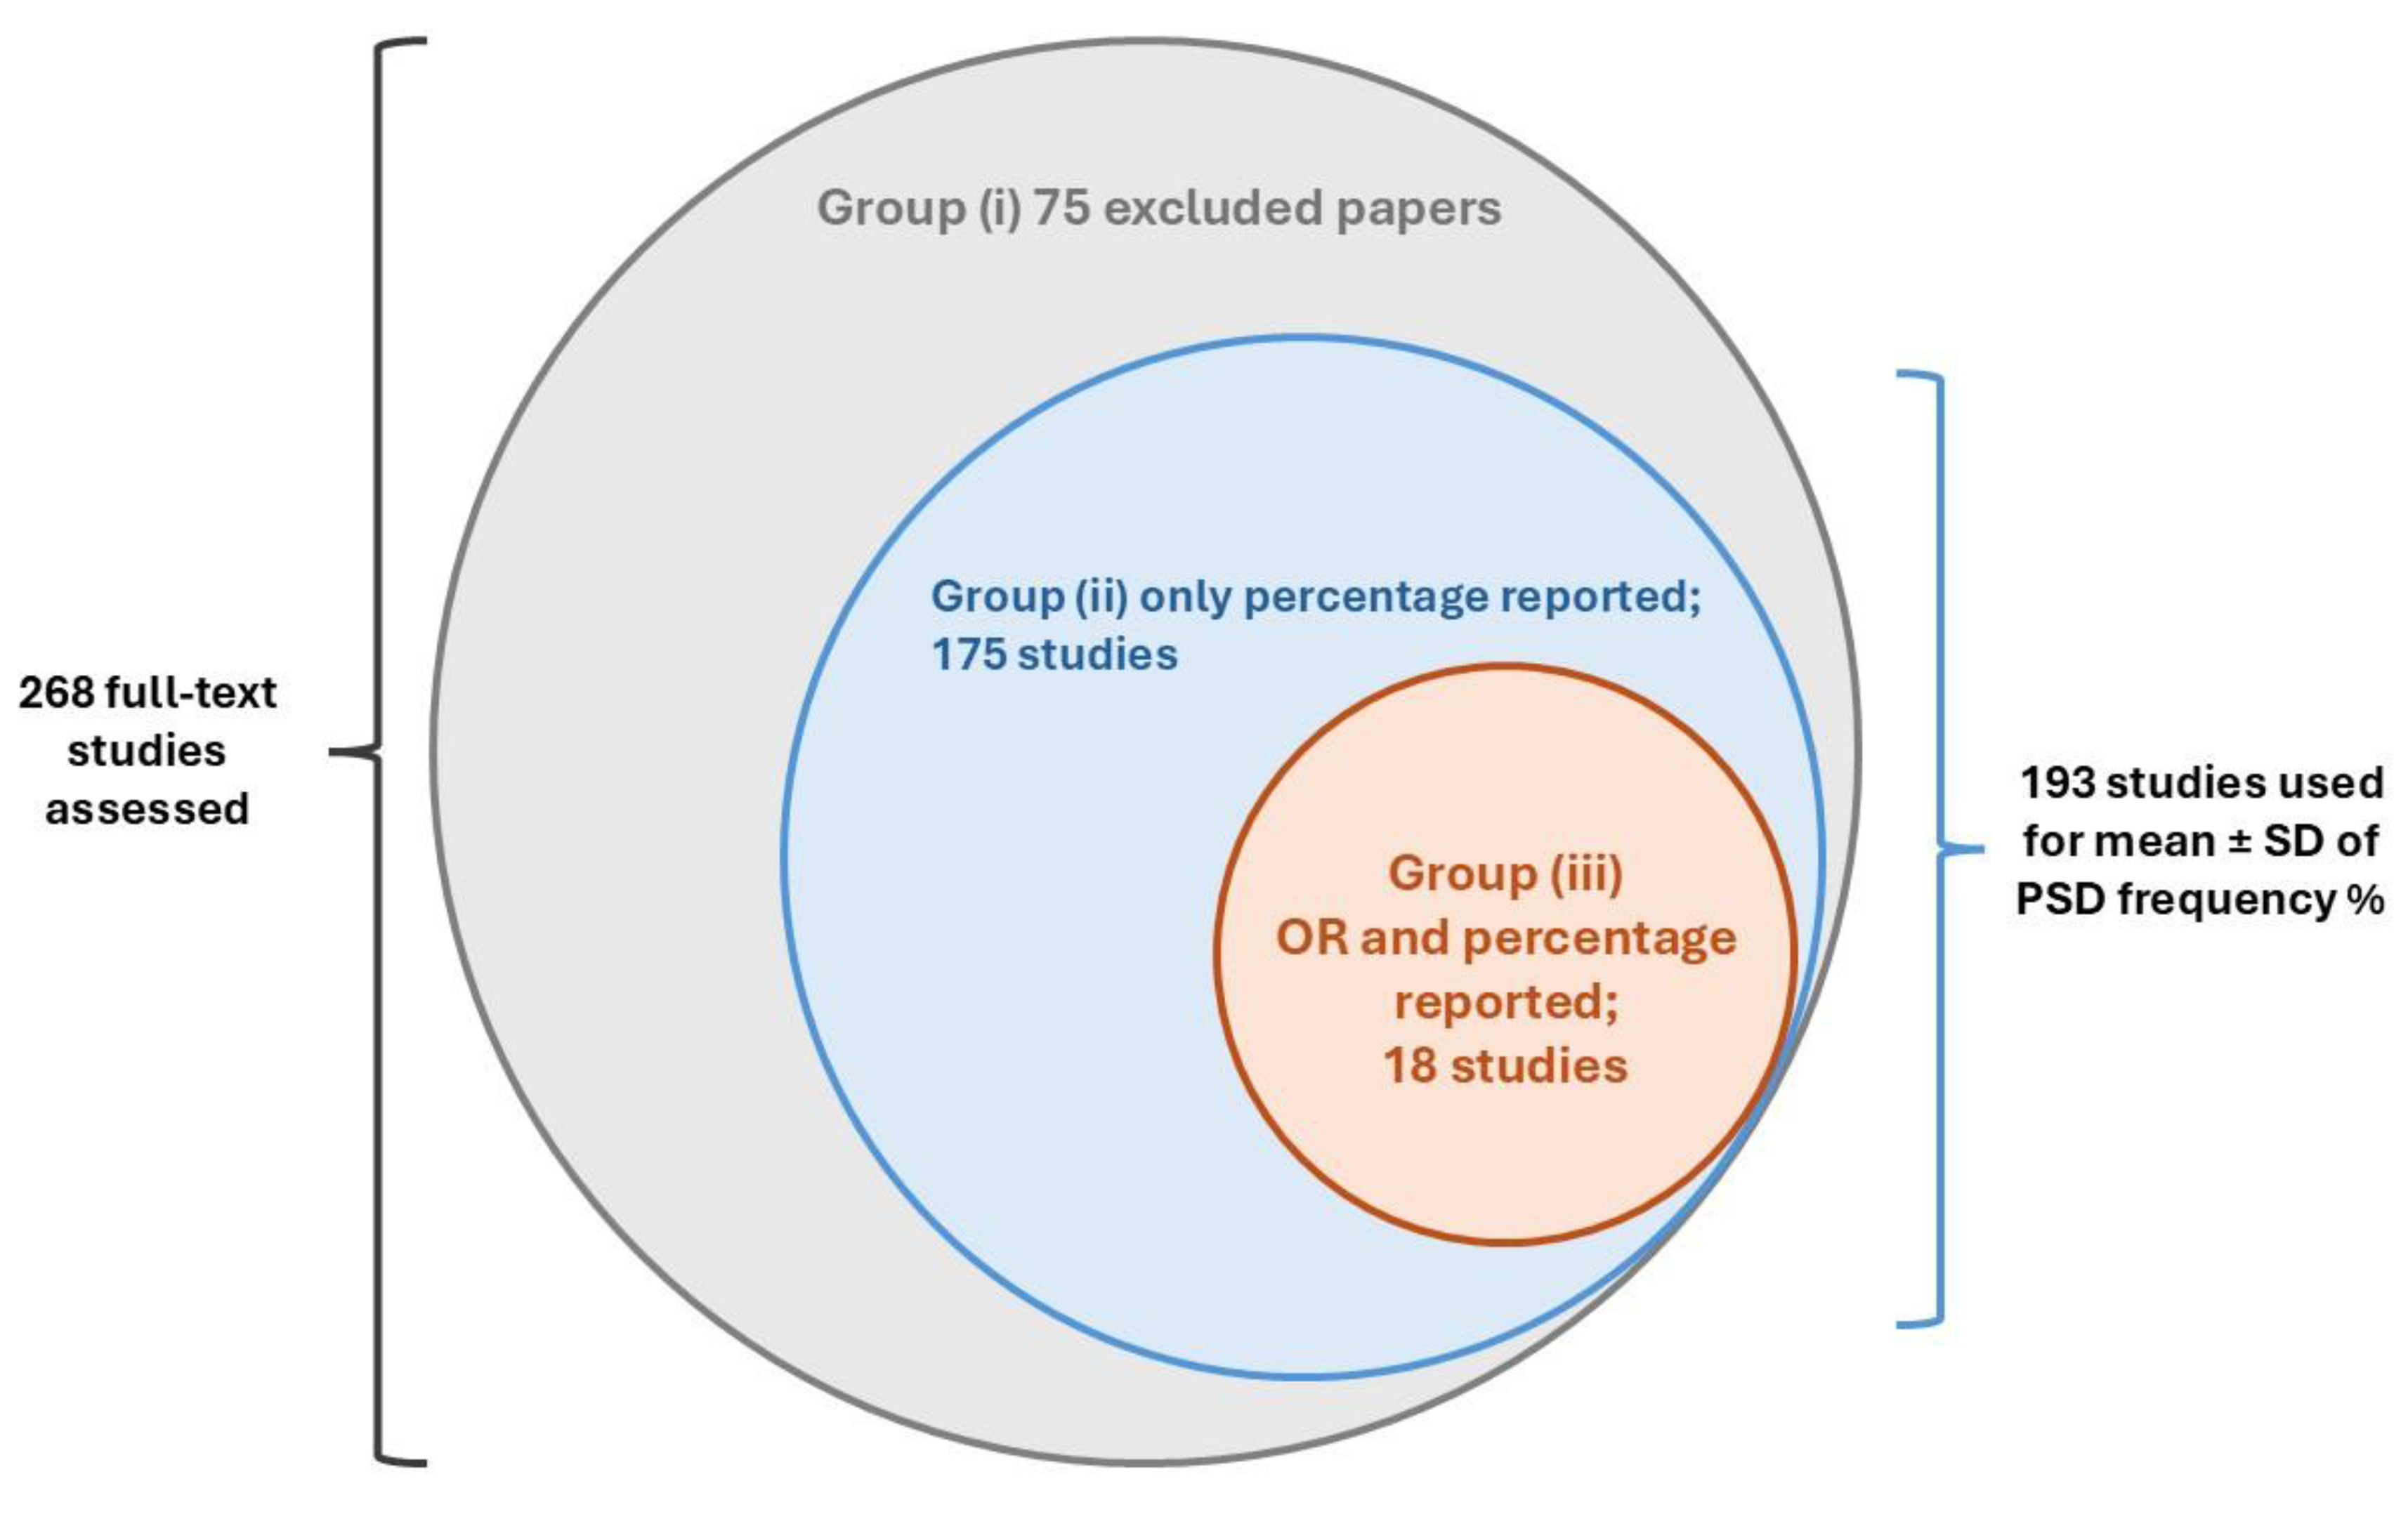
During the full-text screening, 75 articles were excluded. A total of 175 primary studies reporting the prevalence proportion (%) of PSD were separately recorded for prevalence estimation. Additionally, 18 comparative studies with control arms, reporting both prevalence OR and the prevalence proportion of depression following stroke, were finally enrolled for complete data extraction and quality assessment.
These study groups are summarized in
Figure 2.
During the full-text screening phase, six aging cohort studies were also identified and directly included in the data synthesis [
19,
20,
21,
22,
23,
24]. These cohorts had previously been analyzed in a similar meta-analysis with a different study design [
25].
Studies and Patients’ Characteristics
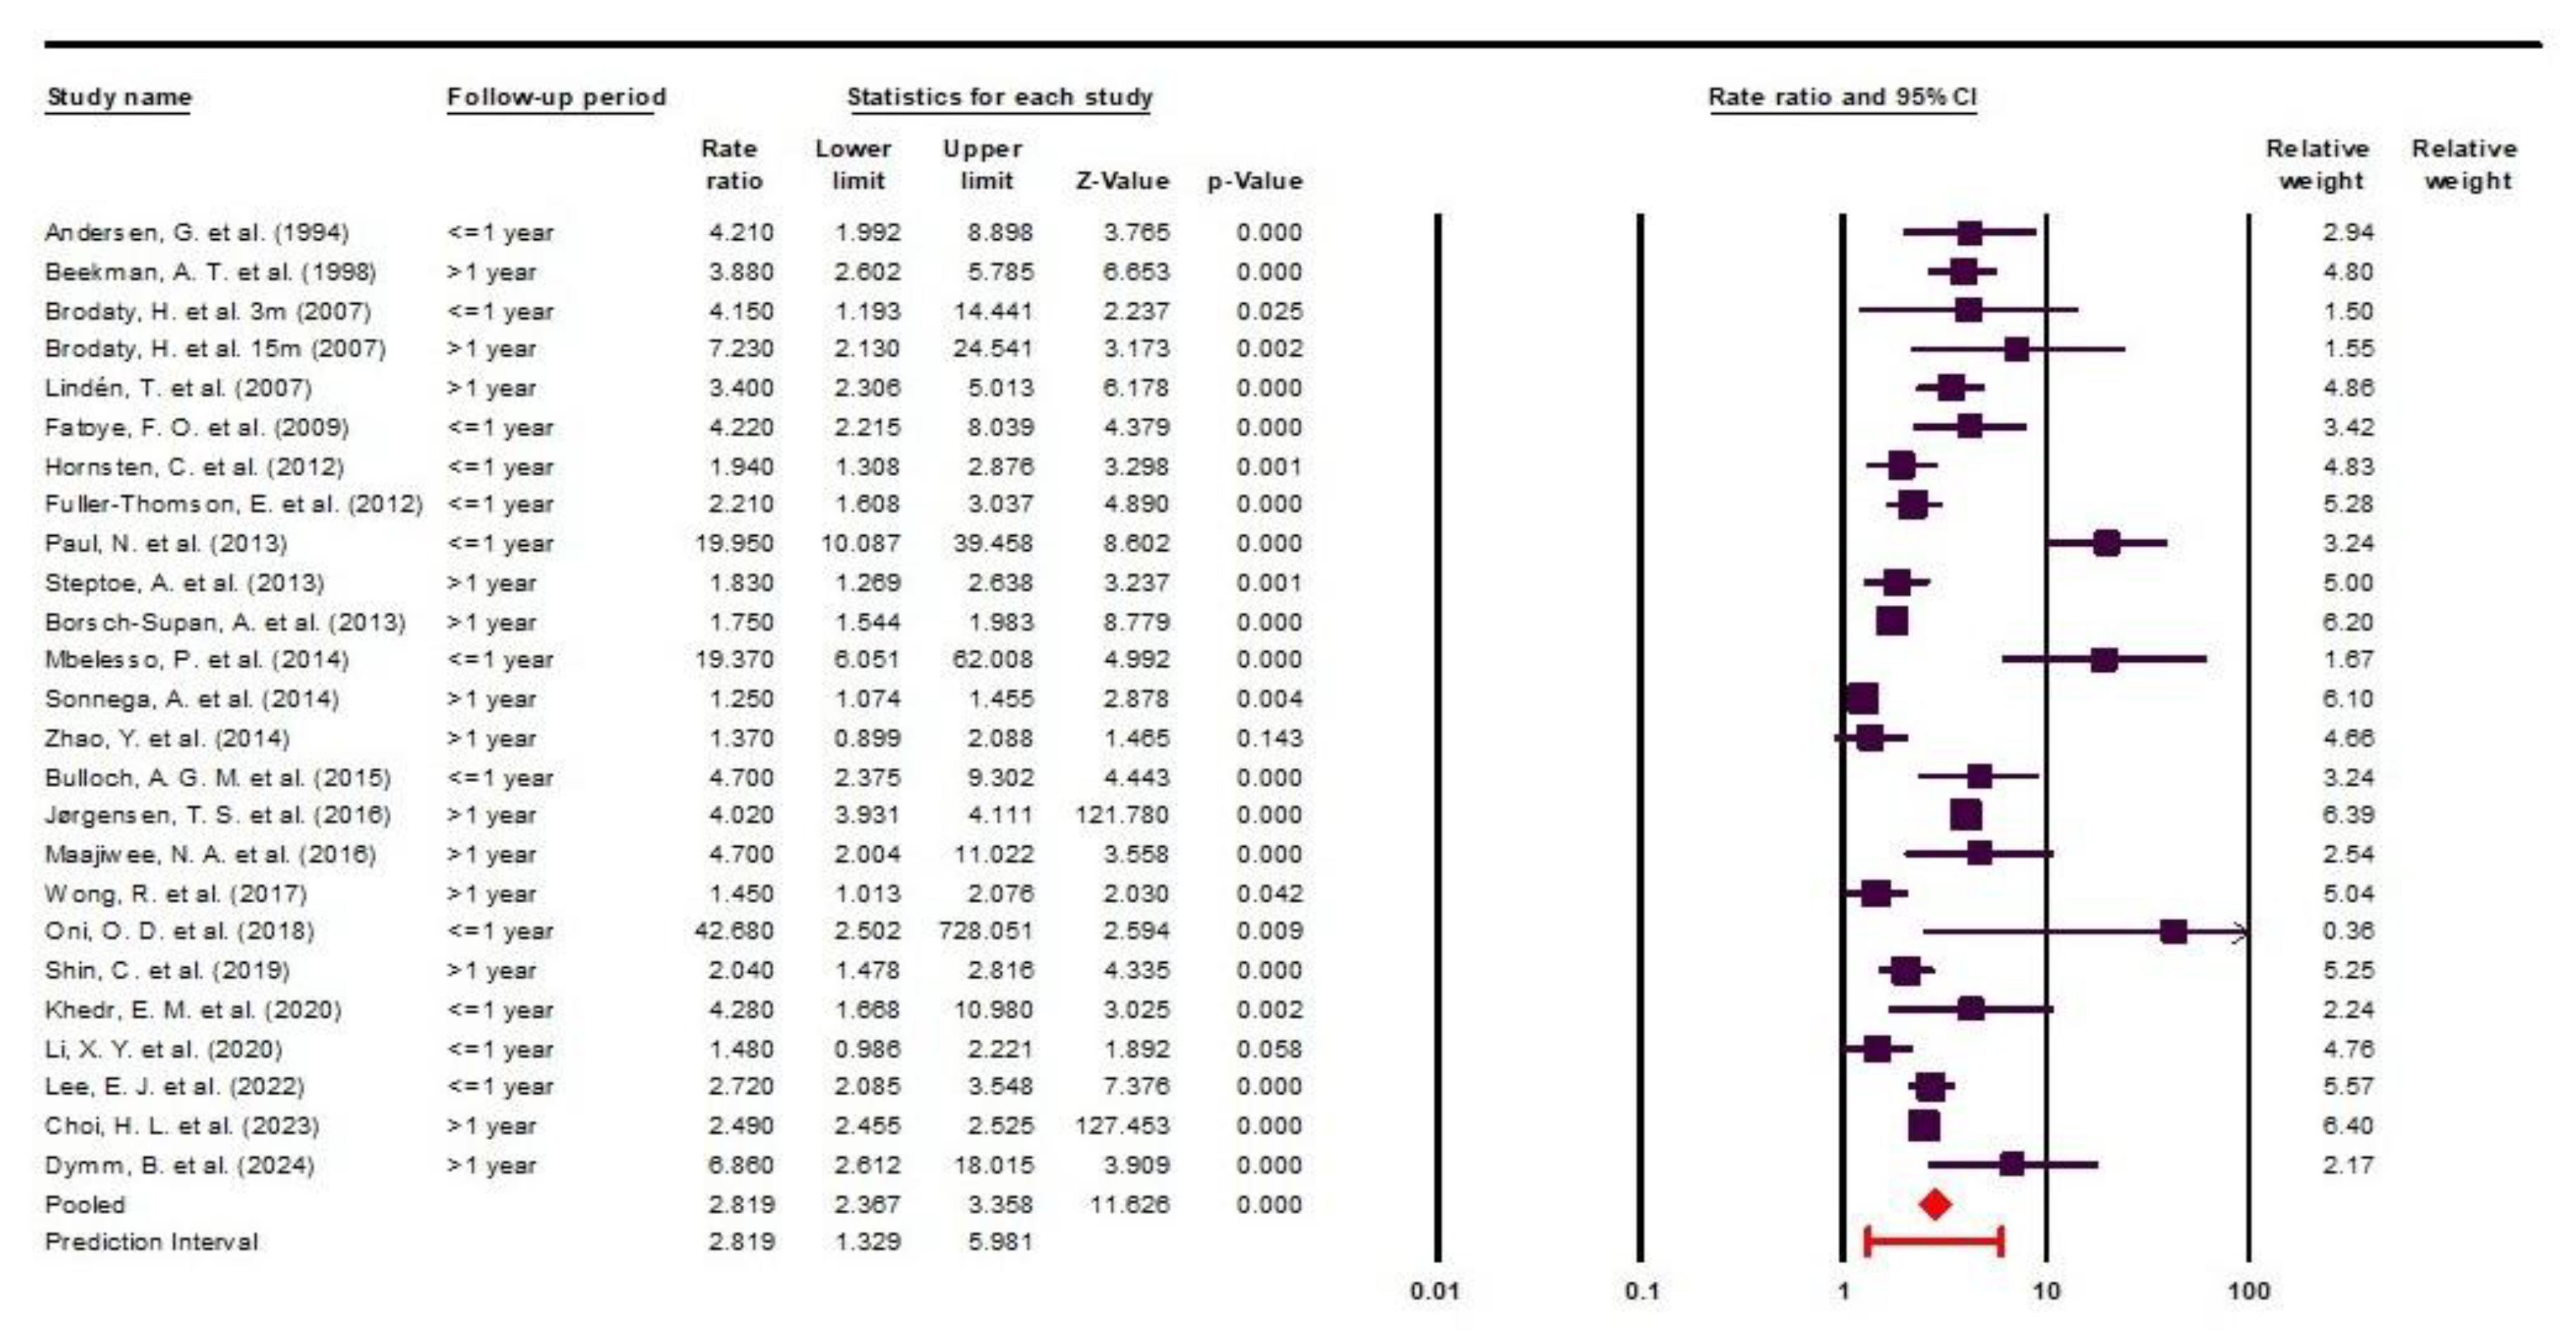
This meta-analysis encompasses a total number of 947617 participants, comprising 349093 individuals with brain stroke and 598524 controls. The reported OR [95% CI] ranged from 1.25 [1.07-1.45] to 42.68 [2.50-727.47]. Two studies reported ORs of 1.37 [0.90-2.09] [
22] and 1.48 [0.99-2.23] [
26], neither of which reached statistical significance.
Among the 24 included studies, the earliest was published in 1994 and the most recent in 2024, spanning three decades of medical literature. The primary studies varied widely in the depression assessment tools used, and the follow-up periods ranged from no follow-up to as long as 10 years.
Notably, Brodaty et al. reported their findings at two different follow-up intervals, 3 months and 15 months, which led to the inclusion of 25 data points derived from 24 studies.
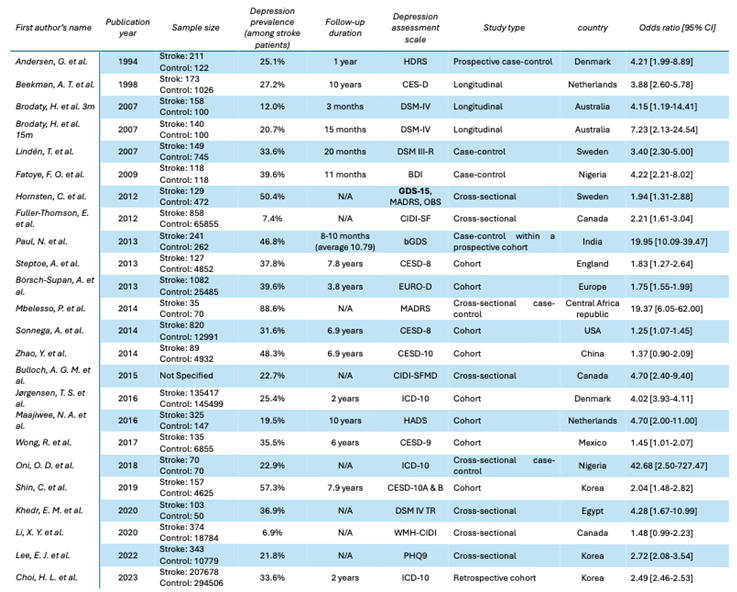
The study designs included longitudinal, case-control, cross-sectional, and retrospective cohort studies. Detailed information is presented in Data Extraction
Table 1. Of all included studies, only two did not report a statistically significant increase in the prevalence of depression among stroke survivors compared to control groups; the corresponding OR values in these cases are highlighted in red in the data extraction table [
22,
26].
Quality Assessment
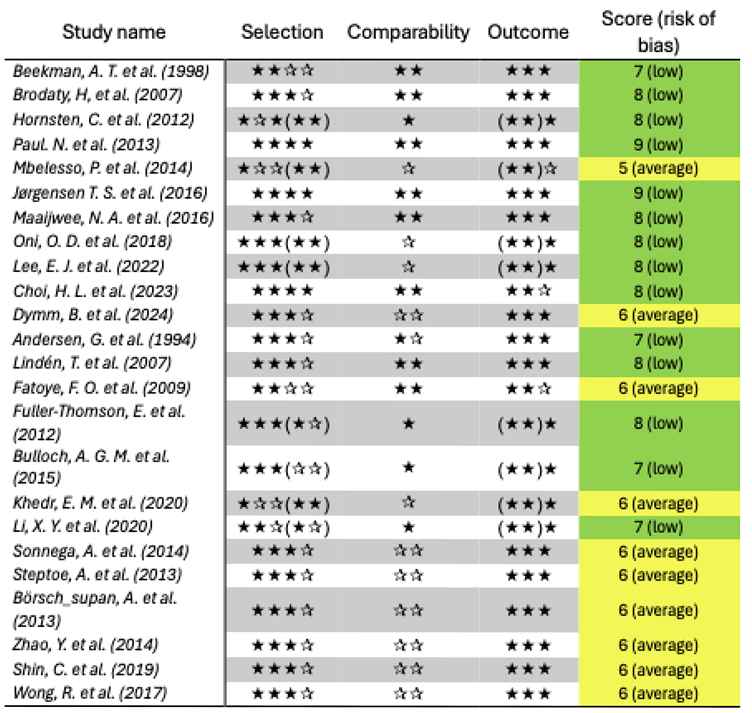
The results of quality assessment are presented in
Table 2. The overall quality of published evidence is acceptable, and, importantly, no study with high risk of bias was included.
It is also worth noting that the six aging cohorts directly included in the quality assessment and data synthesis phase were categorized as having an average risk of bias, with score of 6 out of 9. This rating is primarily due to their differing research focus, which was not on depression, and because the cohort arms were not adjusted accordingly. Therefore, the obtained score should not be seen as diminishing the strong methodology of these cohorts, but rather as reflecting the lower relevance of their data to our specific review question.
Subgroup Analysis
To better understand the course of depression in stroke survivors, studies were stratified by follow-up duration into two groups: ≤ 1 year and > 1 year. This subgroup analysis did not reduce heterogeneity within either group: I² = 83.58, Cochrane Q= 67.02, P< 0.05 for the ≤ 1-year group; and I² = 99.18, Cochrane Q= 1475.52, P< 0.05 for the > 1-year group.
As shown in
Figure 7, the risk of depression during the first year after stroke is almost twice as high compared to the period beyond the first year, although with a wider predictive interval. Specifically, the OR [95% CI] was 4.08 [2.70-6.15] with a predictive interval of [0.97-17.13] in the ≤ 1-year group, versus 2.39 [1.91-2.99] with a predictive interval of [1.06-5.38] in the > 1-year group.
Novelty
This study is the first systematic review and meta-analysis of comparative studies using odds ratios as the effect size, covering publications up to September 23, 2024. It advances the literature by enabling a more precise evaluation of the individual risk of depression among stroke survivors.
Several meta-analyses of varying quality have been published on the proportional prevalence of PSD. However, these studies typically report depression prevalence in their study populations as percentages, without accounting for the already high prevalence of depression in the general, apparently healthy population, prevalence that may not be attributable to stroke.
Considering the progressively rising global prevalence of depression, attributing depression solely to the stroke event requires the inclusion of a control group and a focus on odds ratio evaluation, an approach that distinguishes the present study [
27].
Result Analysis
Odds Ratio and Frequency
In recent years, the odds ratio has been increasingly used in the medical literature because it is simple to interpret, easy to calculate, and highly relevant for clinical decision-making. From a clinical perspective, it is valuable for the healthcare providers to understand, for example, the odds of treatment success or the likelihood of developing a specific complication.
Moreover, the ease of understanding the odds ratio also makes it a useful tool in communicating with patients, particularly when addressing neuropsychiatric sequelae of acute, debilitating conditions such as stroke [
28].
Through this study, we identified a highly concerning finding: post-stroke patients are nearly three times more likely to develop depression compared to the general population (OR = 2.81 [2.36-3.35]). This result is crucial for raising awareness among healthcare providers about the psychological vulnerability of stroke patients, as well as for improving patient compliance with necessary psychiatric treatments or interventions.
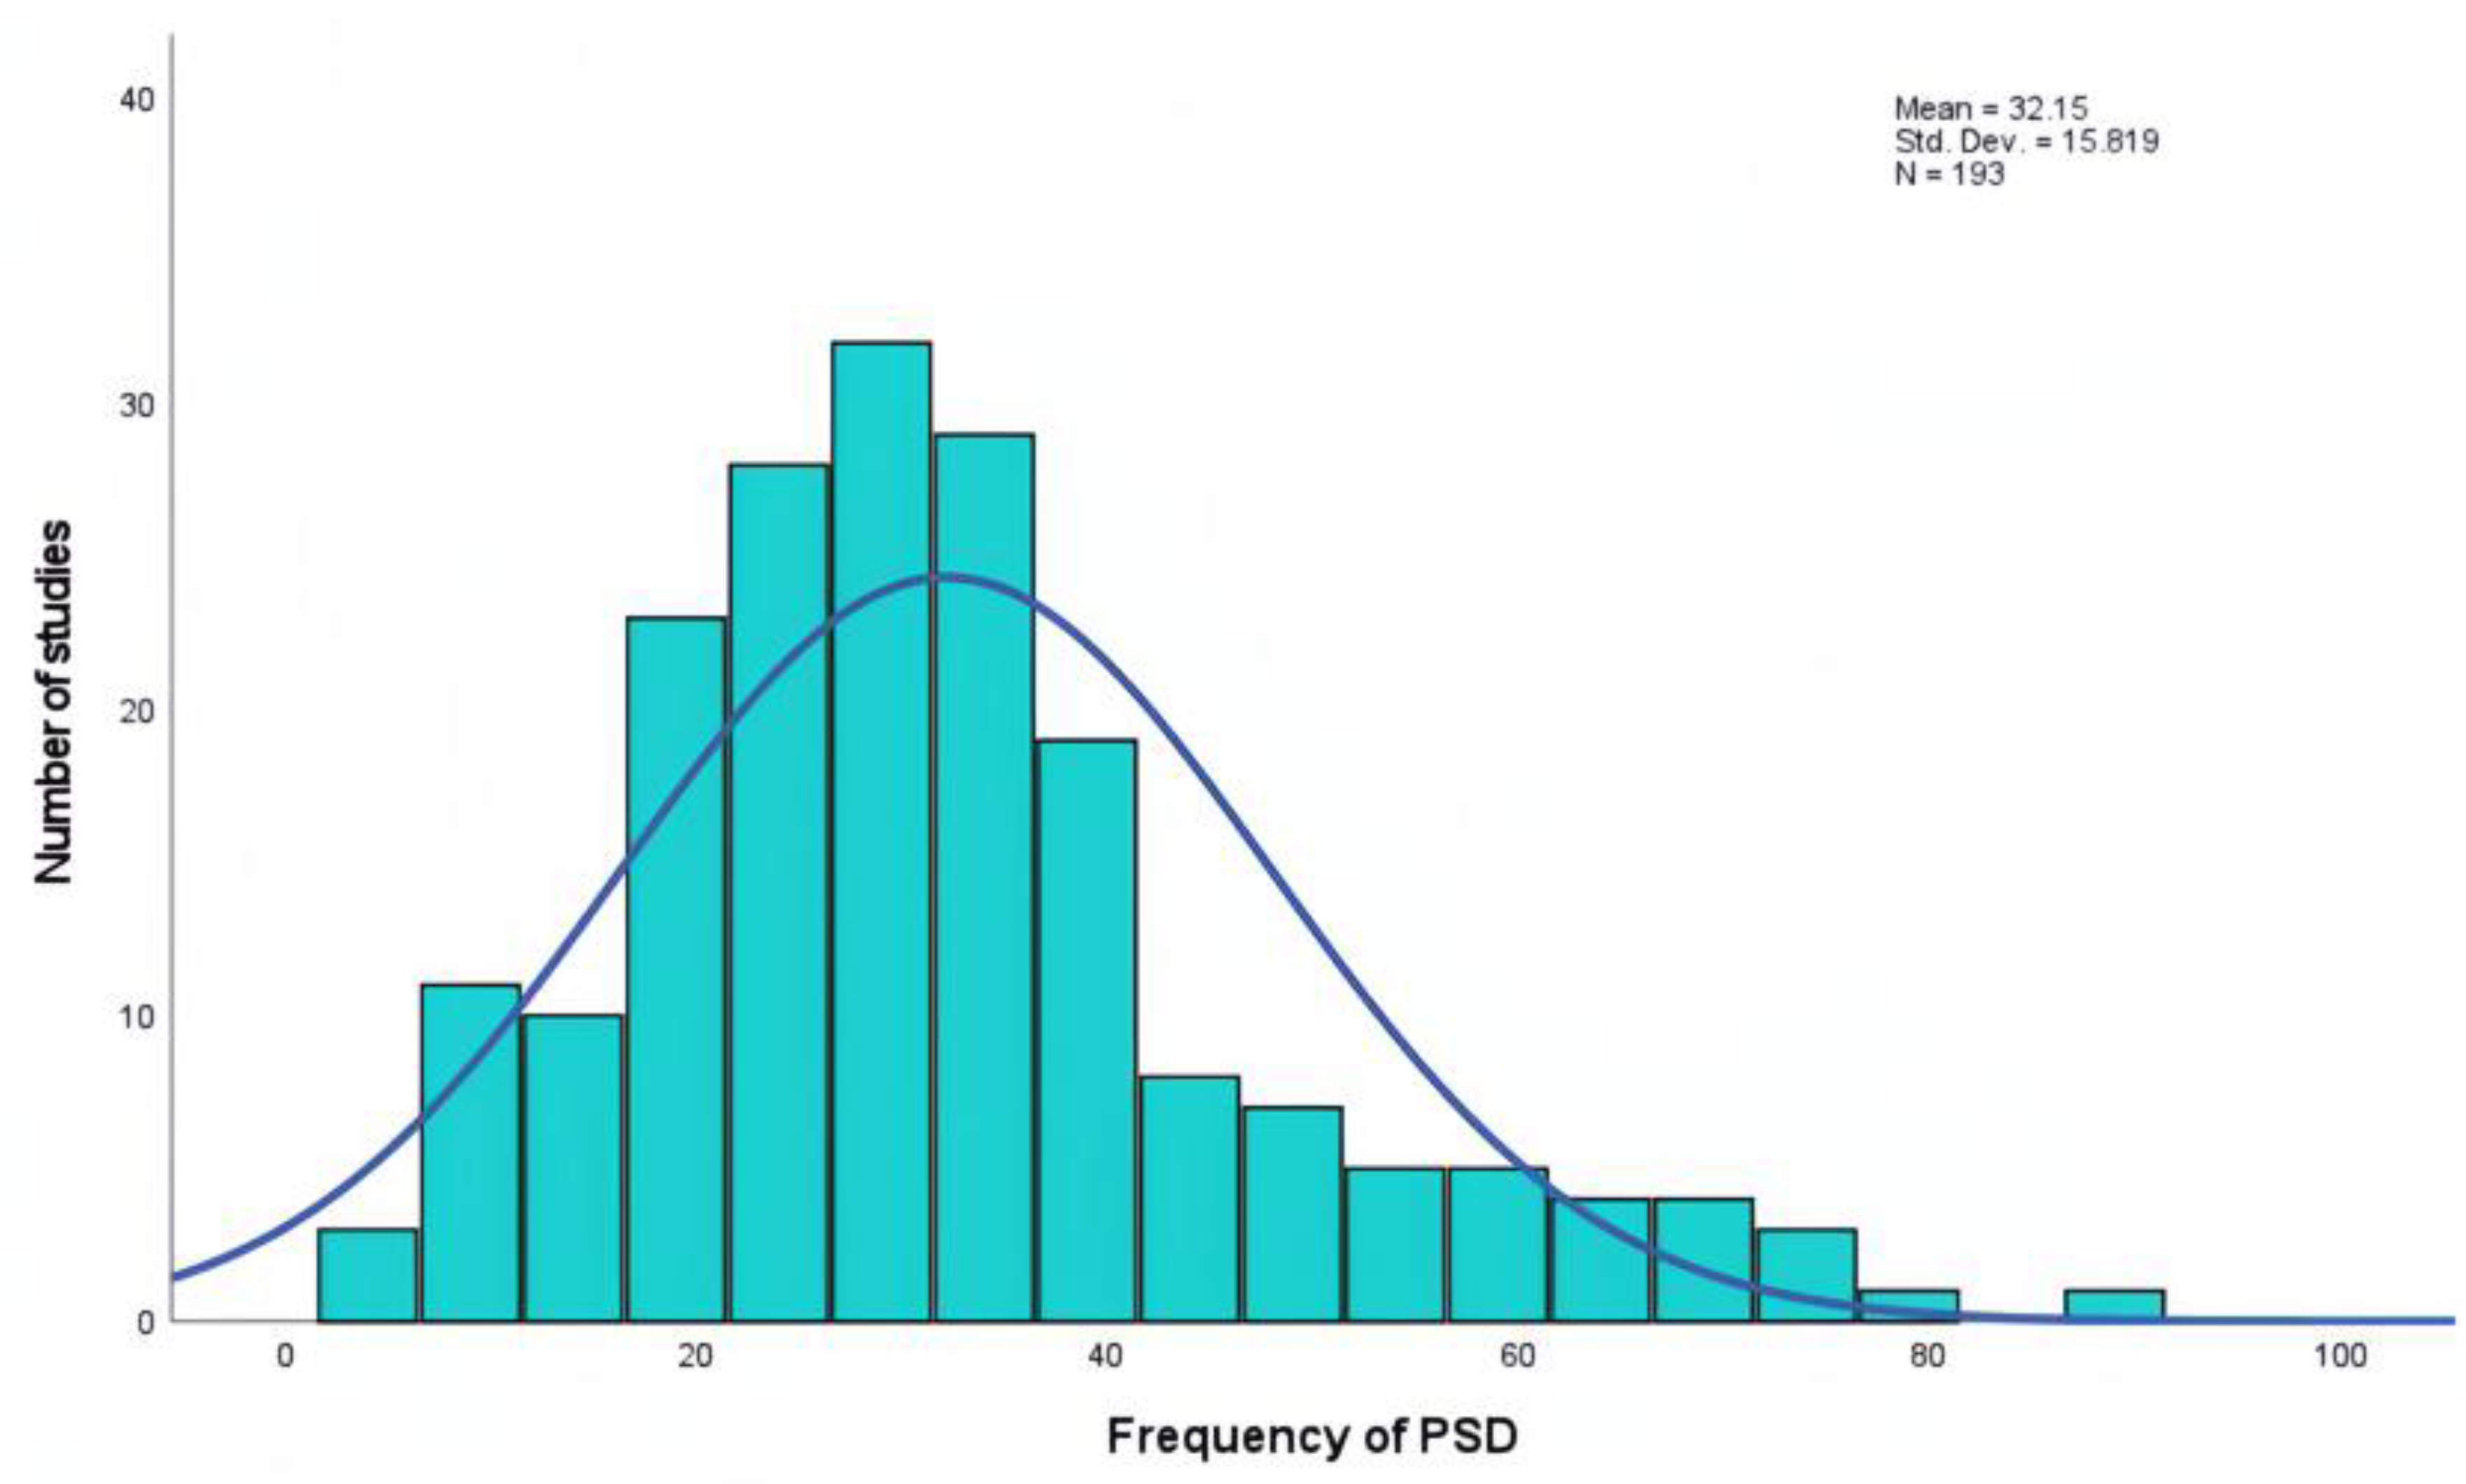
Beyond reporting a pooled odds ratio as the novel aspect of our study, we also utilized the search results to provide a more comprehensive estimate of proportional prevalence of depression among stroke survivors. This analysis was based on 193 PubMed and Web of Sciences reports, including a total of 484,846 patients.
In a recent meta-analysis published by Patra A. et al. in 2021, the authors reported a pooled prevalence of 55% [95% CI 43-65] of depression in the Indian population. This figure is higher than the overall prevalence of 32.15% observed in our study but is consistent with another study conducted in India in 2013 (46.8%). These findings reinforce the hypothesis that genetic or racial variability may influence the prevalence of PSD [
33,
34].
Similarly, a meta-analysis conducted in Iran by Dalvand S. et al. in 2018 reported an overall prevalence of 46.94% [95% CI 30.14-63.75] for PSD, with regional variability ranging from 18% to 72.5% [
35]. These results are in line with the findings of our study.
Heterogeneity
In this meta-analysis, we encountered high heterogeneity, which was primarily due to the inherent nature of the included studies. Notably, heterogeneity did not decrease across various subgroup analyses. This outcome is unsurprising, given that the included studies were not matched and reported data from diverse populations across different races, countries and age groups, using non-uniform depression assessment scales. Nevertheless, this does not imply that conducting a meta-analysis is unfeasible.
A critical review on PSD concluded that small sample sizes are one of the main limitations in the published literature. Regardless of the underlying cause, one effective solution is to design systematic reviews and meta-analyses that pool such small studies to generate more robust and meaningful results [
29].
It is nearly impossible to achieve this without accepting a degree of heterogeneity, especially in health science reseach. As recommended in such cases, applying a random-effects model is the appropriate approach in meta-analyses with substantial heterogeneity [
30]. Another useful parameter for interpreting results under these conditions is the predictive interval, which reflects the expected variability of the true effect size in future studies while accounting for observed heterogeneity [
31].
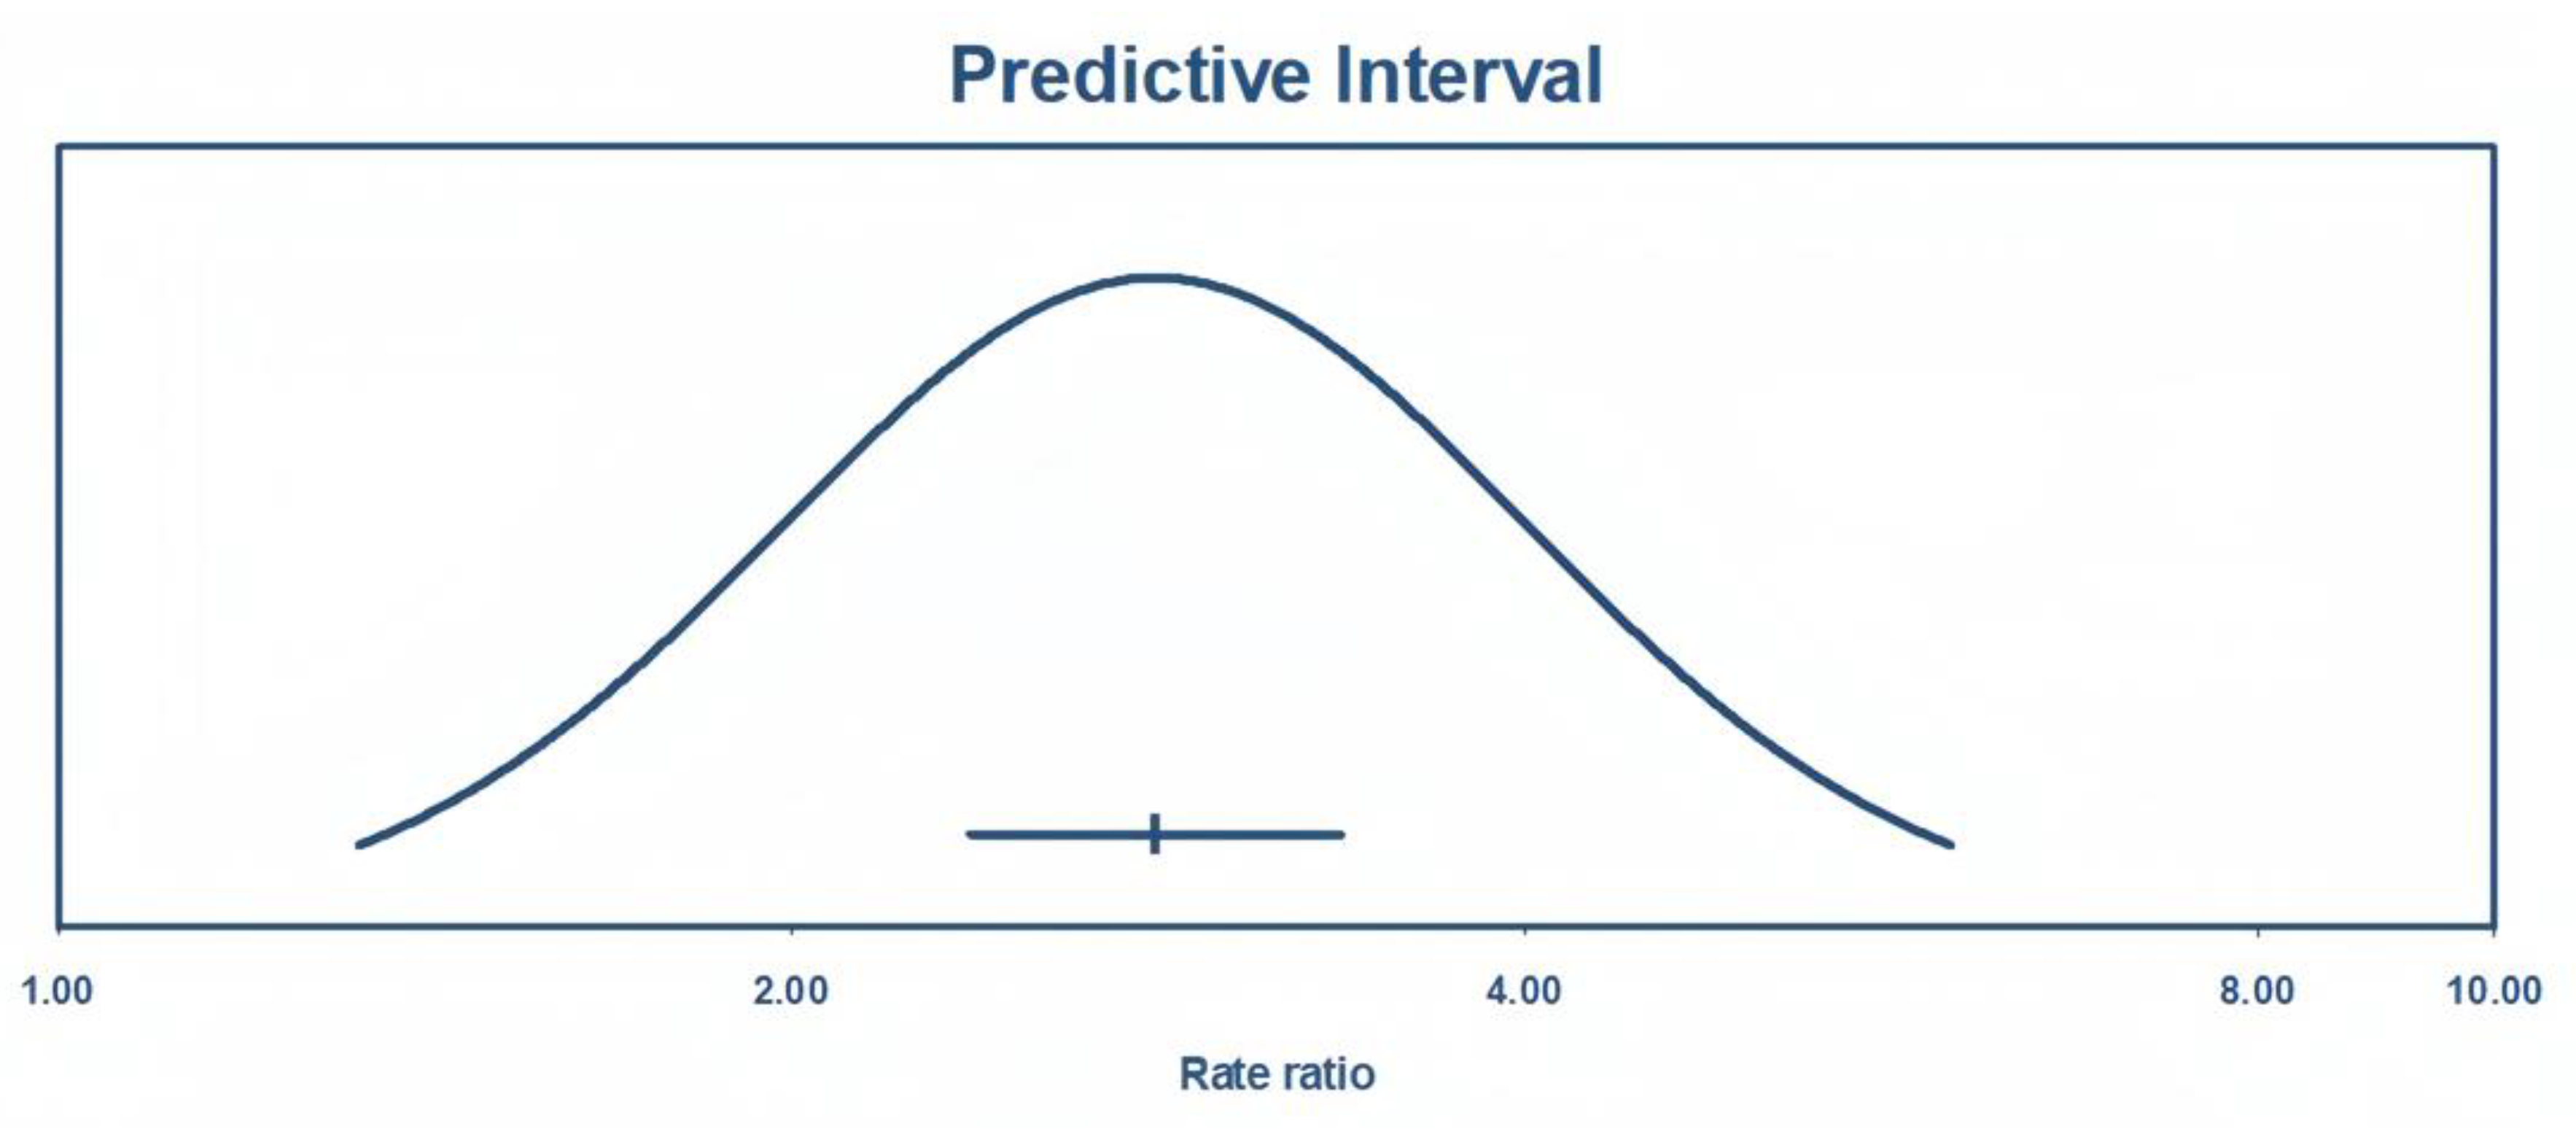
As shown in
Figure 8, the true effect size with a 95% of predictive interval ranges from 1.32 and 5.98, meaning that future studies will report an odds ratio of at least 1.86 with 95% certainty.
Publication Bias
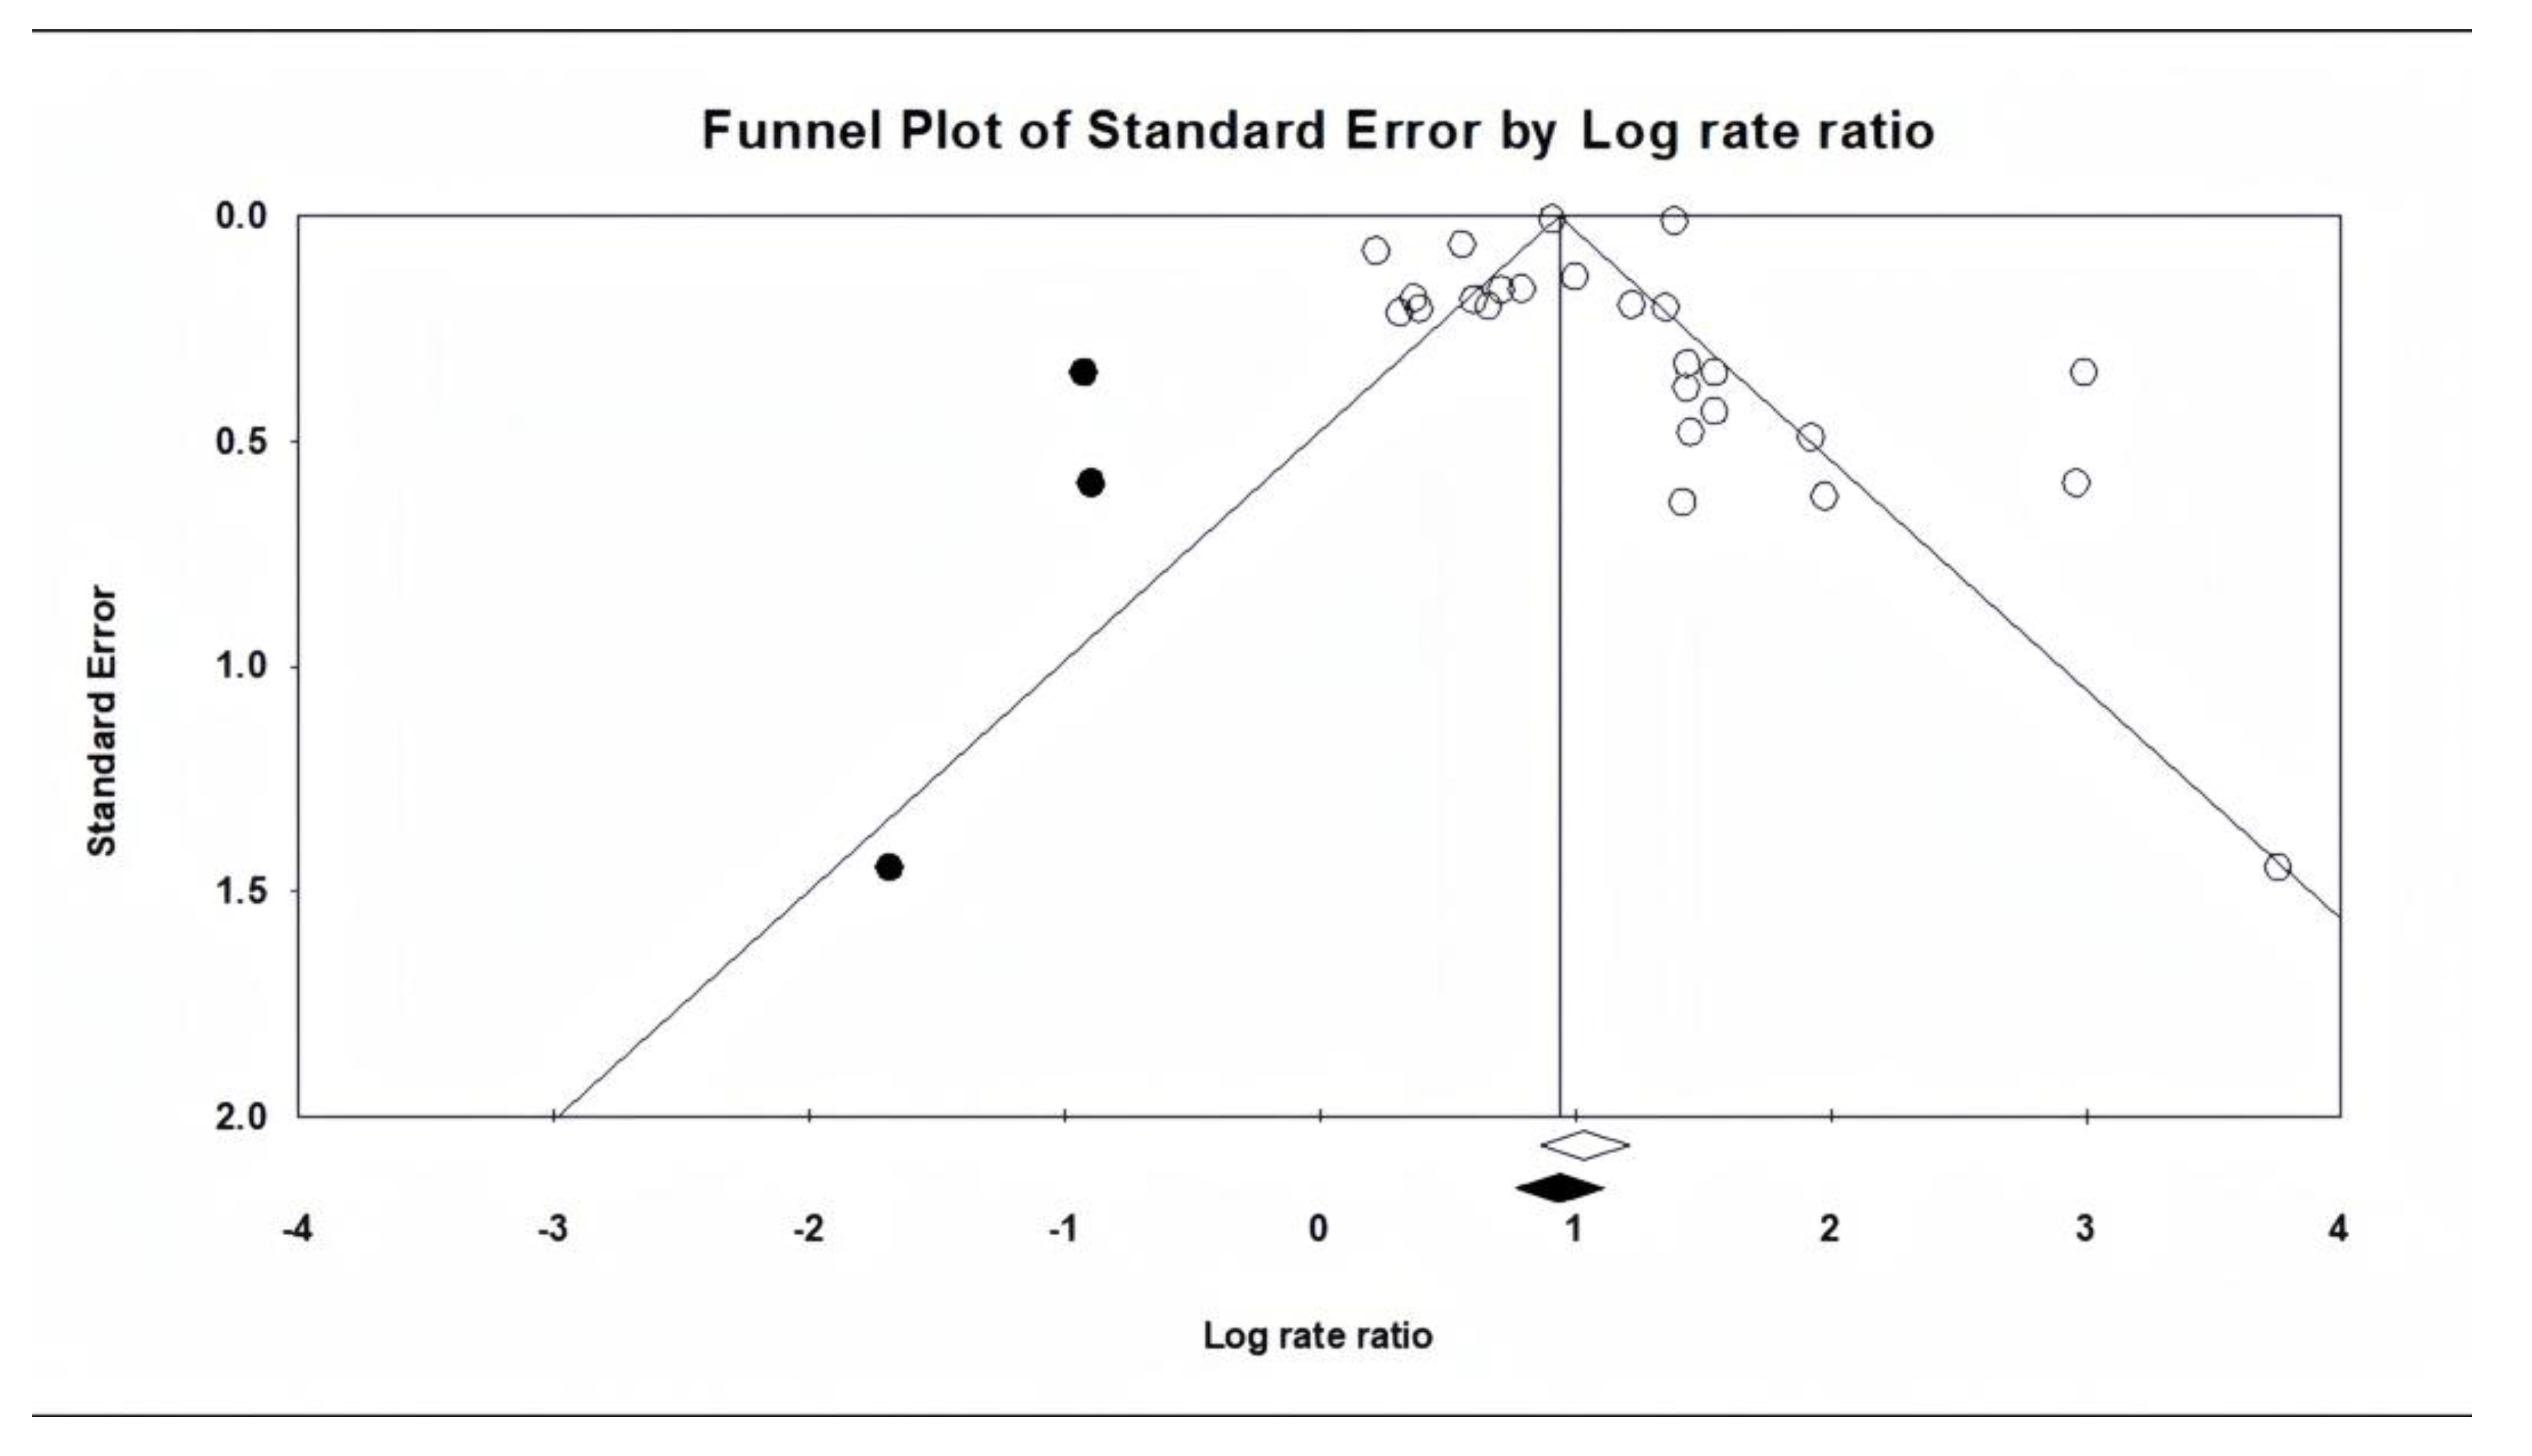
Regarding publication bias, it is important to note that asymmetries in funnel plots do not always indicate the presence of publication bias. This is especially true in the present study, where the results do not show conflicting directions but rather varying effect sizes in the same direction. In fact, the funnel plot reflects “small-study effects”, which may be strongly influenced by heterogeneity rather than publication bias [
32].
Considering all the above-mentioned data and the results of the trim-and-fill test results, it can be concluded that the findings of the present meta-analysis are not significantly affected by publication bias.
Frequency (%)
Subgroup Analysis
The natural history of depression in stroke survivors has always been a major concern for clinicians and researchers, and numerous studies with varying designs have been published on this topic. For example, Liu L.
et al. recently published a comprehensive systematic review showing that most depression cases have an early onset (within first 3 months). Moreover, more than half of these early-onset cases are at risk of persistent depression, highlighting the importance of early diagnosis and treatment in the stroke survivor population [
8].
In addition to this, Ayerbe L.
et al. investigated the natural history of depression in the South London Stroke Register with up to 15 years of follow up. Their results suggest that most depressive episodes begin within the first year, with one-third of cases diagnosed within the first 3 months, and no new cases reported after year 10. These findings emphasize the dynamic course of PSD: while most stroke survivors experience short-duration episodes, the risk of recurrence remains high in the long term [
36].
Overall, nearly all comprehensive studies and reviews are consistent in describing the natural history of PSD. They consider depression an early onset consequence of stroke, with peak incidence occurring between 6 months and 2 years. It is also evident that depression may persist for several years, with the incidence of new cases declining over time [
37].
In our systematic review, we performed a subgroup analysis based on follow-up duration. Although this analysis did not reduce heterogeneity within groups, the results remain valuable. They demonstrate that the overall pooled effect and its predictive interval more closely resemble studies with follow-up periods longer than one year. Interestingly, the predictive interval of both the overall effect and the > 1-year follow-up group is entirely encompassed by that of the ≤ 1-year group.
These findings suggest that evaluating depression after the first year may yield more realistic, stable, and persistent results compared to assessments during the first year post-stroke, possibly due to greater confounding factors in the early phase after stroke. It is important to note that in the >1-year follow-up group, patients were not under continuous treatment or monitoring for depression. In fact, the follow-up period was defined as the time point at which the authors assessed stroke patients for depressive symptoms for the first time.
Other studies
Meta-analysis
In a meta-analysis conducted by Ayerbe L.
et al. in 2013, the authors included 50 studies with percentage as the effect size and reported a pooled prevalence of 29% [95% CI: 25-32] for depression in patients with a history of stroke, which is very similar to our findings. In the same study, the authors concluded that the principal predictors of PSD are disability, cognitive impairment, pre-stroke depression, anxiety and stroke severity. They also reported that PSD independently contributes to lower quality of life, increased mortality and greater disability [
38].
One of the most frequently studied and discussed predictors of PSD is pre-stroke depression. In this regard, Taylor-Rowan M.
et al., in a meta-analysis with rigorous pre-registered methodology, reported that the pooled prevalence of pre-stroke depression is aproximately 12%. Compared to the 39-52% prevalence of PSD [
38], this suggests that the majority of PSD cases cannot be explained merely as unmasking or recurrence of pre-stroke depression. According to the authors, most cases of PSD are direct consequences of stroke itself. They further reported that the odds of developing PSD are three-times higher in patients pre-stroke depression compared to those without (OR= 3.0 [95% CI: 2.3-4.0]) [
39].
Similarly, Hackett M.L.
et al., in their 2014 meta-analysis of 61 primary studies, reported a pooled prevalence of PSD of 31% [95% CI: 28-35], which was not significantly different from their earlier report in 2005 (33% [95% CI: 29-36]) [
40,
41]. This prevalence is almost identical to the results of our study.
Finally, it is important to highlight the association between PSD and mortality. In a study conducted by Bartoli F.
et al., it was demonstrated that stroke survivors with depression are at a significantly higher risk of mortality compared to those without depression (RR = 1.50 [95% CI: 1.28-1.75]) [
9].
Original papers
Most of the included studies were conducted on patients with different types of stroke, and the primary papers excluded other possible vascular pathologies that might mimic stroke symptoms, except for the cohort study by Maaijwee, N. A.
et al., which included both transient ischemic attack (TIA) and stroke patients. Fortunately, the authors reported the results for two groups separately. In the present meta-analysis, only the data related to stroke patients were used. Interesting, according to the authors, although both TIA and stroke groups experienced higher rates of depressive symptoms, the odds ratio was higher in ischemic patients compared to TIA patients (4.7 [2.0-22.0] vs. 2.8 [1.2-6.6], respectively) [
42].
In a study conducted in China, Zeng, Y. Y.
et al. [2021] compared the prevalence of PSD in hemorrhagic stroke survivors and acute ischemic stroke survivors. They concluded that depression is significantly more common among hemorrhagic stroke survivors than among ischemic stroke survivors (42.3% vs. 22.9). After adjusting for confounding variables, the authors reported that the odds of developing depression were more than twice as high in hemorrhagic stroke patients (OR 2.65 [1.34-5.24]) [
43].
Several predictors of PSD have been suggested in the literature, including older age, female sex, stroke severity and outcomes, a history of depression or other psychiatric disorders, stressful life events prior to stroke, and lesion location and size [
44]. In a narrative review based exclusively on PubMed database, the authors were unable to identify a consistent association between lesion location and PSD due to methodological limitations in the primary studies. Nevertheless, the overall findings indicate that lesions in the frontal lobes and lesions involving the basal ganglia are more likely to be associated with depression in stroke survivors [
45].
Limitations and Strengths
This meta-analysis has some limitations. The included studies were highly heterogeneous in terms of design, populations, follow-up duration, and depression assessment tools, and this variability persisted despite subgroup analyses. Furthermore, we only analyzed published studies, excluding unpublished literature, which may have introduced publication bias. In addition, some primary studies were not specifically designed to assess post-stroke depression, and differences in adjustment for confounding factors such as pre-stroke psychiatric history or stroke severity may have influenced the results.
Despite these limitations, the study also has important strengths. Our comprehensive and highly sensitive search strategy initially identified 5,887 primary studies, ensuring broad coverage of the literature. The novelty of focusing on comparative studies with odds ratios, together with transparent reporting of the search process, objectives, and inclusion criteria, enhances the reproducibility of our findings. These features allowed us to move beyond simple prevalence estimates and provide a more robust measure of the risk of depression following stroke.
Conclusion
This meta-analysis aimed to determine the prevalence and odds of depression in stroke survivors compared with a control population. The results highlight a concerning finding: stroke survivors are almost three times more likely to experience depression, with a prevalence of 32%, compared to controls (OR [95% CI]: 2.81 [2.36-3.35]).
Overall, this systematic review and meta-analysis provides a clearer understanding of depression as a serious and debilitating consequence of stroke. Early identification and treatment of depression in stroke survivors may reduce the risk of persistent symptoms, prevent related comorbidities, and lower depression-associated mortality.
Conflicts of Interests
The authors declare that the research was conducted in the absence of any commercial or financial relationships that could be constructed as a potential conflict of interest.
Appendix A. Newcastle - Ottawa Quality Assessment Scale (Adapted for Cross Sectional Studies)
Selection: (Maximum 5 Stars)
- 1.
Representativeness of the cases:
- a)
Truly representative of the HCC patients (consecutive or random sampling of cases). 1 score
- b)
Somewhat representative of the average in the HCC patients (non-random sampling). 1 score
- c)
Selected demographic group of users. 0 score
- d)
No description of the sampling strategy. 0 score
- 2.
Sample size:
- a)
Justified and satisfactory (≥ 400 HCC included). 1 score
- b)
Not justified (<400 HCC patients included). 0 score
- 3.
Non-Response rate
- a)
The response rate is satisfactory (≥95%). 1 score
- b)
The response rate is unsatisfactory (<95%), or no description. 0 score
- 4.
Ascertainment of the screening/surveillance tool:
- a)
Validated screening/surveillance tool. 2 scores
- b)
Non-validated screening/surveillance tool, but the tool is available or described. 1 score
- c)
No description of the measurement tool. 0 score
Comparability: (Maximum 1 Stars)
- 1.
The potential confounders were investigated by subgroup analysis or multivariable analysis.
- a)
The study investigates potential confounders. 1 score
- b)
The study does not investigate potential confounders. 0 score
Outcome: (Maximum 3 Stars)
- 1.
Assessment of the outcome:
- a)
Independent blind assessment. 2 scores
- b)
Record linkage. 2 scores
- c)
Self-report. 1 score
- d)
No description. 0 score
- 2.
Statistical test:
- a)
The statistical test used to analyze the data is clearly described and appropriate. 1 score
- b)
The statistical test is not appropriate, not described or incomplete. 0 score
References
- Murphy SJ, Werring DJ. Stroke: causes and clinical features. Medicine (Abingdon). 2020 Sep;48(9):561-66. [CrossRef]
- Katan M, Luft A. Global Burden of Stroke. Semin Neurol. 2018 Apr;38(2):208-11. [CrossRef]
- Albertson M, Sharma J. Stroke: current concepts. S D Med. 2014 Nov;67(11):455, 57-61, 63-5. [PubMed]
- Tadi P, Lui F. Acute Stroke. StatPearls. Treasure Island (FL): StatPearls Publishing.
- Copyright © 2024, StatPearls Publishing LLC.; 2024.
- Nemani K, Gurin L. Neuropsychiatric Complications after Stroke. Semin Neurol. 2021 Feb;41(1):85-100. [CrossRef]
- Kim, JS. Post-stroke Mood and Emotional Disturbances: Pharmacological Therapy Based on Mechanisms. J Stroke. 2016 Sep;18(3):244-55. [CrossRef]
- Guo J, Wang J, Sun W, Liu X. The advances of PSD: 2021 update. J Neurol. 2022 Mar;269(3):1236-49. [CrossRef]
- Liu L, Xu M, Marshall IJ, Wolfe CD, Wang Y, O’Connell MD. Prevalence and natural history of depression after stroke: A systematic review and meta-analysis of observational studies. PLoS Med. 2023 Mar;20(3):e1004200. [CrossRef]
- Bartoli F, Di Brita C, Crocamo C, Clerici M, Carrà G. Early PSD and Mortality: Meta-Analysis and Meta-Regression. Front Psychiatry. 2018;9:530. [CrossRef]
- Jørgensen TS, Wium-Andersen IK, Wium-Andersen MK, Jørgensen MB, Prescott E, Maartensson S, et al. Incidence of Depression After Stroke, and Associated Risk Factors and Mortality Outcomes, in a Large Cohort of Danish Patients. JAMA Psychiatry. 2016 Oct 1;73(10):1032-40. [CrossRef]
- Frank D, Gruenbaum BF, Zlotnik A, Semyonov M, Frenkel A, Boyko M. Pathophysiology and Current Drug Treatments for PSD: A Review. Int J Mol Sci. 2022 Dec 1;23(23). [CrossRef]
- Lenzi GL, Altieri M, Maestrini I. PSD. Rev Neurol (Paris). 2008 Oct;164(10):837-40. [CrossRef]
- Liu L, Marshall IJ, Pei R, Bhalla A, Wolfe CD, O’Connell MD, et al. Natural history of depression up to 18 years after stroke: a population-based South London Stroke Register study. Lancet Reg Health Eur. 2024 May;40:100882. [CrossRef]
- Szumilas, M. Explaining odds ratios. J Can Acad Child Adolesc Psychiatry. 2010 Aug;19(3):227-9. [PubMed]
- Page MJ, McKenzie JE, Bossuyt PM, Boutron I, Hoffmann TC, Mulrow CD, et al. The PRISMA 2020 statement: an updated guideline for reporting systematic reviews. BMJ. 2021;372:n71. [CrossRef]
- Wells GA, Shea B, O’Connell D, Peterson J, Welch V, Losos M, et al. The Newcastle-Ottawa Scale (NOS) for assessing the quality of nonrandomised studies in meta-analyses. 2000.
- Thornton A, Lee P. Publication bias in meta-analysis: its causes and consequences. J Clin Epidemiol. 2000 Feb;53(2):207-16. [CrossRef]
- Shi X, Nie C, Shi S, Wang T, Yang H, Zhou Y, et al. Effect comparison between Egger’s test and Begg’s test in publication bias diagnosis in meta-analyses: evidence from a pilot survey. Int J Res Stud Biosci. 2017;5(5):14-20.
- Sonnega A, Faul JD, Ofstedal MB, Langa KM, Phillips JW, Weir DR. Cohort Profile: the Health and Retirement Study (HRS). Int J Epidemiol. 2014 Apr;43(2):576-85. [CrossRef]
- Steptoe A, Breeze E, Banks J, Nazroo J. Cohort profile: the English longitudinal study of ageing. Int J Epidemiol. 2013 Dec;42(6):1640-8. [CrossRef]
- Börsch-Supan A, Brandt M, Hunkler C, Kneip T, Korbmacher J, Malter F, et al. Data Resource Profile: the Survey of Health, Ageing and Retirement in Europe (SHARE). Int J Epidemiol. 2013 Aug;42(4):992-1001. [CrossRef]
- Zhao Y, Hu Y, Smith JP, Strauss J, Yang G. Cohort profile: the China Health and Retirement Longitudinal Study (CHARLS). Int J Epidemiol. 2014 Feb;43(1):61-8. [CrossRef]
- Shin, C. Korean Longitudinal Study of Ageing. In: Gu D, Dupre ME, editors. Encyclopedia of Gerontology and Population Aging. Cham: Springer International Publishing; 2019. p. 1-4.
- Wong R, Michaels-Obregon A, Palloni A. Cohort Profile: The Mexican Health and Aging Study (MHAS). Int J Epidemiol. 2017 Apr 1;46(2):e2. [CrossRef]
- Le P, Zhang J, Li N, Jin Y, Zheng ZJ. Depressive symptoms occurring after stroke by age, sex and socioeconomic status in six population-based studies: Longitudinal analyses and meta-analyses. Asian J Psychiatr. 2023 Jan;79:103397. [CrossRef]
- Li X, Wang X. Relationships between stroke, depression, generalized anxiety disorder and physical disability: some evidence from the Canadian Community Health Survey-Mental Health. Psychiatry Res. 2020 Aug;290:113074. [CrossRef]
- Lépine JP, Briley M. The increasing burden of depression. Neuropsychiatr Dis Treat. 2011;7(Suppl 1):3-7. [CrossRef]
- McHugh, ML. The odds ratio: calculation, usage, and interpretation. Biochemia medica. 2009;19(2):120-26.
- Primeau, F. PSD: a critical review of the literature. Can J Psychiatry. 1988 Nov;33(8):757-65. [CrossRef]
- Langan, D. Assessing Heterogeneity in Random-Effects Meta-analysis. Methods Mol Biol. 2022;2345:67-89. [CrossRef]
- IntHout J, Ioannidis JP, Rovers MM, Goeman JJ. Plea for routinely presenting prediction intervals in meta-analysis. BMJ Open. 2016 Jul 12;6(7):e010247. [CrossRef]
- Simmonds, M. Quantifying the risk of error when interpreting funnel plots. Syst Rev. 2015 Mar 11;4:24. [CrossRef]
- Patra A, Nitin K, Devi NM, Surya S, Lewis MG, Kamalakannan S. Prevalence of Depression among Stroke Survivors in India: A Systematic Review and Meta-Analysis. Front Neurol Neurosci Res. 2021;2:100008.
- Paul N, Das S, Hazra A, Ghosal MK, Ray BK, Banerjee TK, et al. Depression among stroke survivors: a community-based, prospective study from Kolkata, India. Am J Geriatr Psychiatry. 2013 Sep;21(9):821-31. [CrossRef]
- Dalvand S, Gheshlagh RG, Kurdi A. Prevalence of poststroke depression in Iranian patients: a systematic review and meta-analysis. Neuropsychiatr Dis Treat. 2018;14:3073-80. [CrossRef]
- Ayerbe L, Ayis S, Crichton S, Wolfe CD, Rudd AG. The natural history of depression up to 15 years after stroke: the South London Stroke Register. Stroke. 2013 Apr;44(4):1105-10. [CrossRef]
- Gaete JM, Bogousslavsky J. PSD. Expert Rev Neurother. 2008 Jan;8(1):75-92. [CrossRef]
- Ayerbe L, Ayis S, Wolfe CD, Rudd AG. Natural history, predictors and outcomes of depression after stroke: systematic review and meta-analysis. Br J Psychiatry. 2013 Jan;202(1):14-21. [CrossRef]
- Taylor-Rowan M, Momoh O, Ayerbe L, Evans JJ, Stott DJ, Quinn TJ. Prevalence of pre-stroke depression and its association with PSD: a systematic review and meta-analysis. Psychol Med. 2019 Mar;49(4):685-96. [CrossRef]
- Hackett ML, Pickles K. Part I: frequency of depression after stroke: an updated systematic review and meta-analysis of observational studies. Int J Stroke. 2014 Dec;9(8):1017-25. [CrossRef]
- Hackett ML, Yapa C, Parag V, Anderson CS. Frequency of depression after stroke: a systematic review of observational studies. Stroke. 2005 Jun;36(6):1330-40. [CrossRef]
- Maaijwee NA, Tendolkar I, Rutten-Jacobs LC, Arntz RM, Schaapsmeerders P, Dorresteijn LD, et al. Long-term depressive symptoms and anxiety after transient ischaemic attack or ischaemic stroke in young adults. Eur J Neurol. 2016 Aug;23(8):1262-8. [CrossRef]
- Zeng YY, Cheng HR, Cheng L, Huang G, Chen YB, Tang WJ, et al. Comparison of poststroke depression between acute ischemic and hemorrhagic stroke patients. Int J Geriatr Psychiatry. 2021 Apr;36(4):493-99. [CrossRef]
- Robinson RG, Jorge RE. PSD: A Review. Am J Psychiatry. 2016 Mar 1;173(3):221-31. [CrossRef]
- Nickel A, Thomalla G. PSD: Impact of Lesion Location and Methodological Limitations-A Topical Review. Front Neurol. 2017;8:498. [CrossRef]
- Andersen G, Vestergaard K, Riis J, Lauritzen L. Incidence of PSD during the first year in a large unselected stroke population determined using a valid standardized rating scale. Acta Psychiatr Scand. 1994 Sep;90(3):190-5. [CrossRef]
- Beekman AT, Penninx BW, Deeg DJ, Ormel J, Smit JH, Braam AW, et al. Depression in survivor of stroke: a community-based study of prevalence, risk factors and consequences. Soc Psychiatry Psychiatr Epidemiol. 1998 Oct;33(10):463-70. [CrossRef]
- Brodaty H, Withall A, Altendorf A, Sachdev PS. Rates of depression at 3 and 15 months poststroke and their relationship with cognitive decline: the Sydney Stroke Study. Am J Geriatr Psychiatry. 2007 Jun;15(6):477-86. [CrossRef]
- Lindén T, Blomstrand C, Skoog I. Depressive disorders after 20 months in elderly stroke patients: a case-control study. Stroke. 2007 Jun;38(6):1860-3. [CrossRef]
- Fatoye FO, Mosaku SK, Komolafe MA, Eegunranti BA, Adebayo RA, Komolafe EO, et al. Depressive symptoms and associated factors following cerebrovascular accident among Nigerians. Journal of Mental Health. 2009 2009/01/01;18(3):224-32. [CrossRef]
- Hornsten C, Molander L, Gustafson Y. The prevalence of stroke and the association between stroke and depression among a very old population. Arch Gerontol Geriatr. 2012 Nov-Dec;55(3):555-9. [CrossRef]
- Fuller-Thomson E, Tulipano MJ, Song M. The association between depression, suicidal ideation, and stroke in a population-based sample. Int J Stroke. 2012 Apr;7(3):188-94. [CrossRef]
- Mbelesso P, Senekian VP, Yangatimbi E, Tabo A, Zaoro-Kponsere AJ, Kette GC, et al. [Depression post stroke in Africa: myth or reality?]. Bull Soc Pathol Exot. 2014 Dec;107(5):350-5. [CrossRef]
- Bulloch AG, Fiest KM, Williams JV, Lavorato DH, Berzins SA, Jetté N, et al. Depression--a common disorder across a broad spectrum of neurological conditions: a cross-sectional nationally representative survey. Gen Hosp Psychiatry. 2015 Nov-Dec;37(6):507-12. [CrossRef]
- Oni OD, Olagunju AT, Olisah VO, Aina OF, Ojini FI. PSD: Prevalence, associated factors and impact on quality of life among outpatients in a Nigerian hospital. S Afr J Psychiatr. 2018;24:1058. [CrossRef]
- Khedr EM, Abdelrahman AA, Desoky T, Zaki AF, Gamea A. PSD: frequency, risk factors, and impact on quality of life among 103 stroke patients—hospital-based study. The Egyptian Journal of Neurology, Psychiatry and Neurosurgery. 2020 2020/07/06;56(1):66. [CrossRef]
- Lee EJ, Kwon OD, Kim SJ. Prevalence, awareness, and treatment of depression among community-dwelling stroke survivors in Korea. Sci Rep. 2022 Mar 8;12(1):4050. [CrossRef]
- Choi HL, Yang K, Han K, Kim B, Chang WH, Kwon S, et al. Increased Risk of Developing Depression in Disability after Stroke: A Korean Nationwide Study. Int J Environ Res Public Health. 2023 Jan 2;20(1). [CrossRef]
- Dymm B, Goldstein LB, Unnithan S, Al-Khalidi HR, Koltai D, Bushnell C, et al. Depression following small vessel stroke is common and more prevalent in women. J Stroke Cerebrovasc Dis. 2024 May;33(5):107646. [CrossRef]
|
Disclaimer/Publisher’s Note: The statements, opinions and data contained in all publications are solely those of the individual author(s) and contributor(s) and not of MDPI and/or the editor(s). MDPI and/or the editor(s) disclaim responsibility for any injury to people or property resulting from any ideas, methods, instructions or products referred to in the content. |
© 2025 by the authors. Licensee MDPI, Basel, Switzerland. This article is an open access article distributed under the terms and conditions of the Creative Commons Attribution (CC BY) license (http://creativecommons.org/licenses/by/4.0/).