
Submitted:
06 October 2025
Posted:
07 October 2025
You are already at the latest version
Abstract
This paper provides a reality check on the role of the creative industries in circular economy (CE) transitions. While sectors like manufacturing and construction are increasingly central to CE policy frameworks, creative production (the process of developing creative concepts into physical, experiential, or digital outputs) remains marginal and inconsistently represented. This research triangulates evidence from academic literature (2018–2024), national policy strategies, grey literature, and an exploratory online survey of creative professionals to provide macro-level, sector business norms, and niche innovation perspectives. The analysis reveals that circular activity across creative sub-sectors, including fashion, design, and architecture, is largely framed around material strategies like recycling and reuse. More transformative approaches, including redesign, refusal, and regenerative practice, remain rare. Sub-sectors such as advertising, games, film, and createch are notably under-researched, despite growing digital resource intensity and associated environmental impact. While survey respondents report practical engagement with circular practices, there is limited strategic framing or preparedness for incoming standards and regulations. This paper argues for a broader understanding of the CE in the creative industries in terms of value retention and as active agents in terms of their power to shape audience and consumer norms and system-level change.
Keywords:
circular economy
; creative industries
; natural language processing
; bibliometrics
; survey
; policy review
1. Introduction
The concept of the circular economy (CE) continues to build momentum in multiple industries [1]. In the creative industries, this can be seen most clearly in the world of fashion, where leading brands liberally use the language of circularity in their marketing material and websites. The focus on fashion can also be seen in most national CE strategies in terms of managing textile waste streams, as well as more specific strategies such as the EU Strategy for Sustainable and Circular Textiles [2].
But understanding the status of the CE transition across the breadth of the creative industries is not straightforward. First, the definition of the scope of the creative industries can be a challenge. Different countries and institutions define the industry classification and scope of the creative industries differently [3] or use alternative labels such as the “creative economy”.
The scope used in this research is shown in Table 1. For the purposes of this paper, the focus is on value-creation, intellectual property, and creative production (the process of developing creative concepts into physical, experiential, or digital outputs), not on the industrial, retail, or environmental services associated with waste management of textiles, garments, and construction materials associated with architecture and fashion.
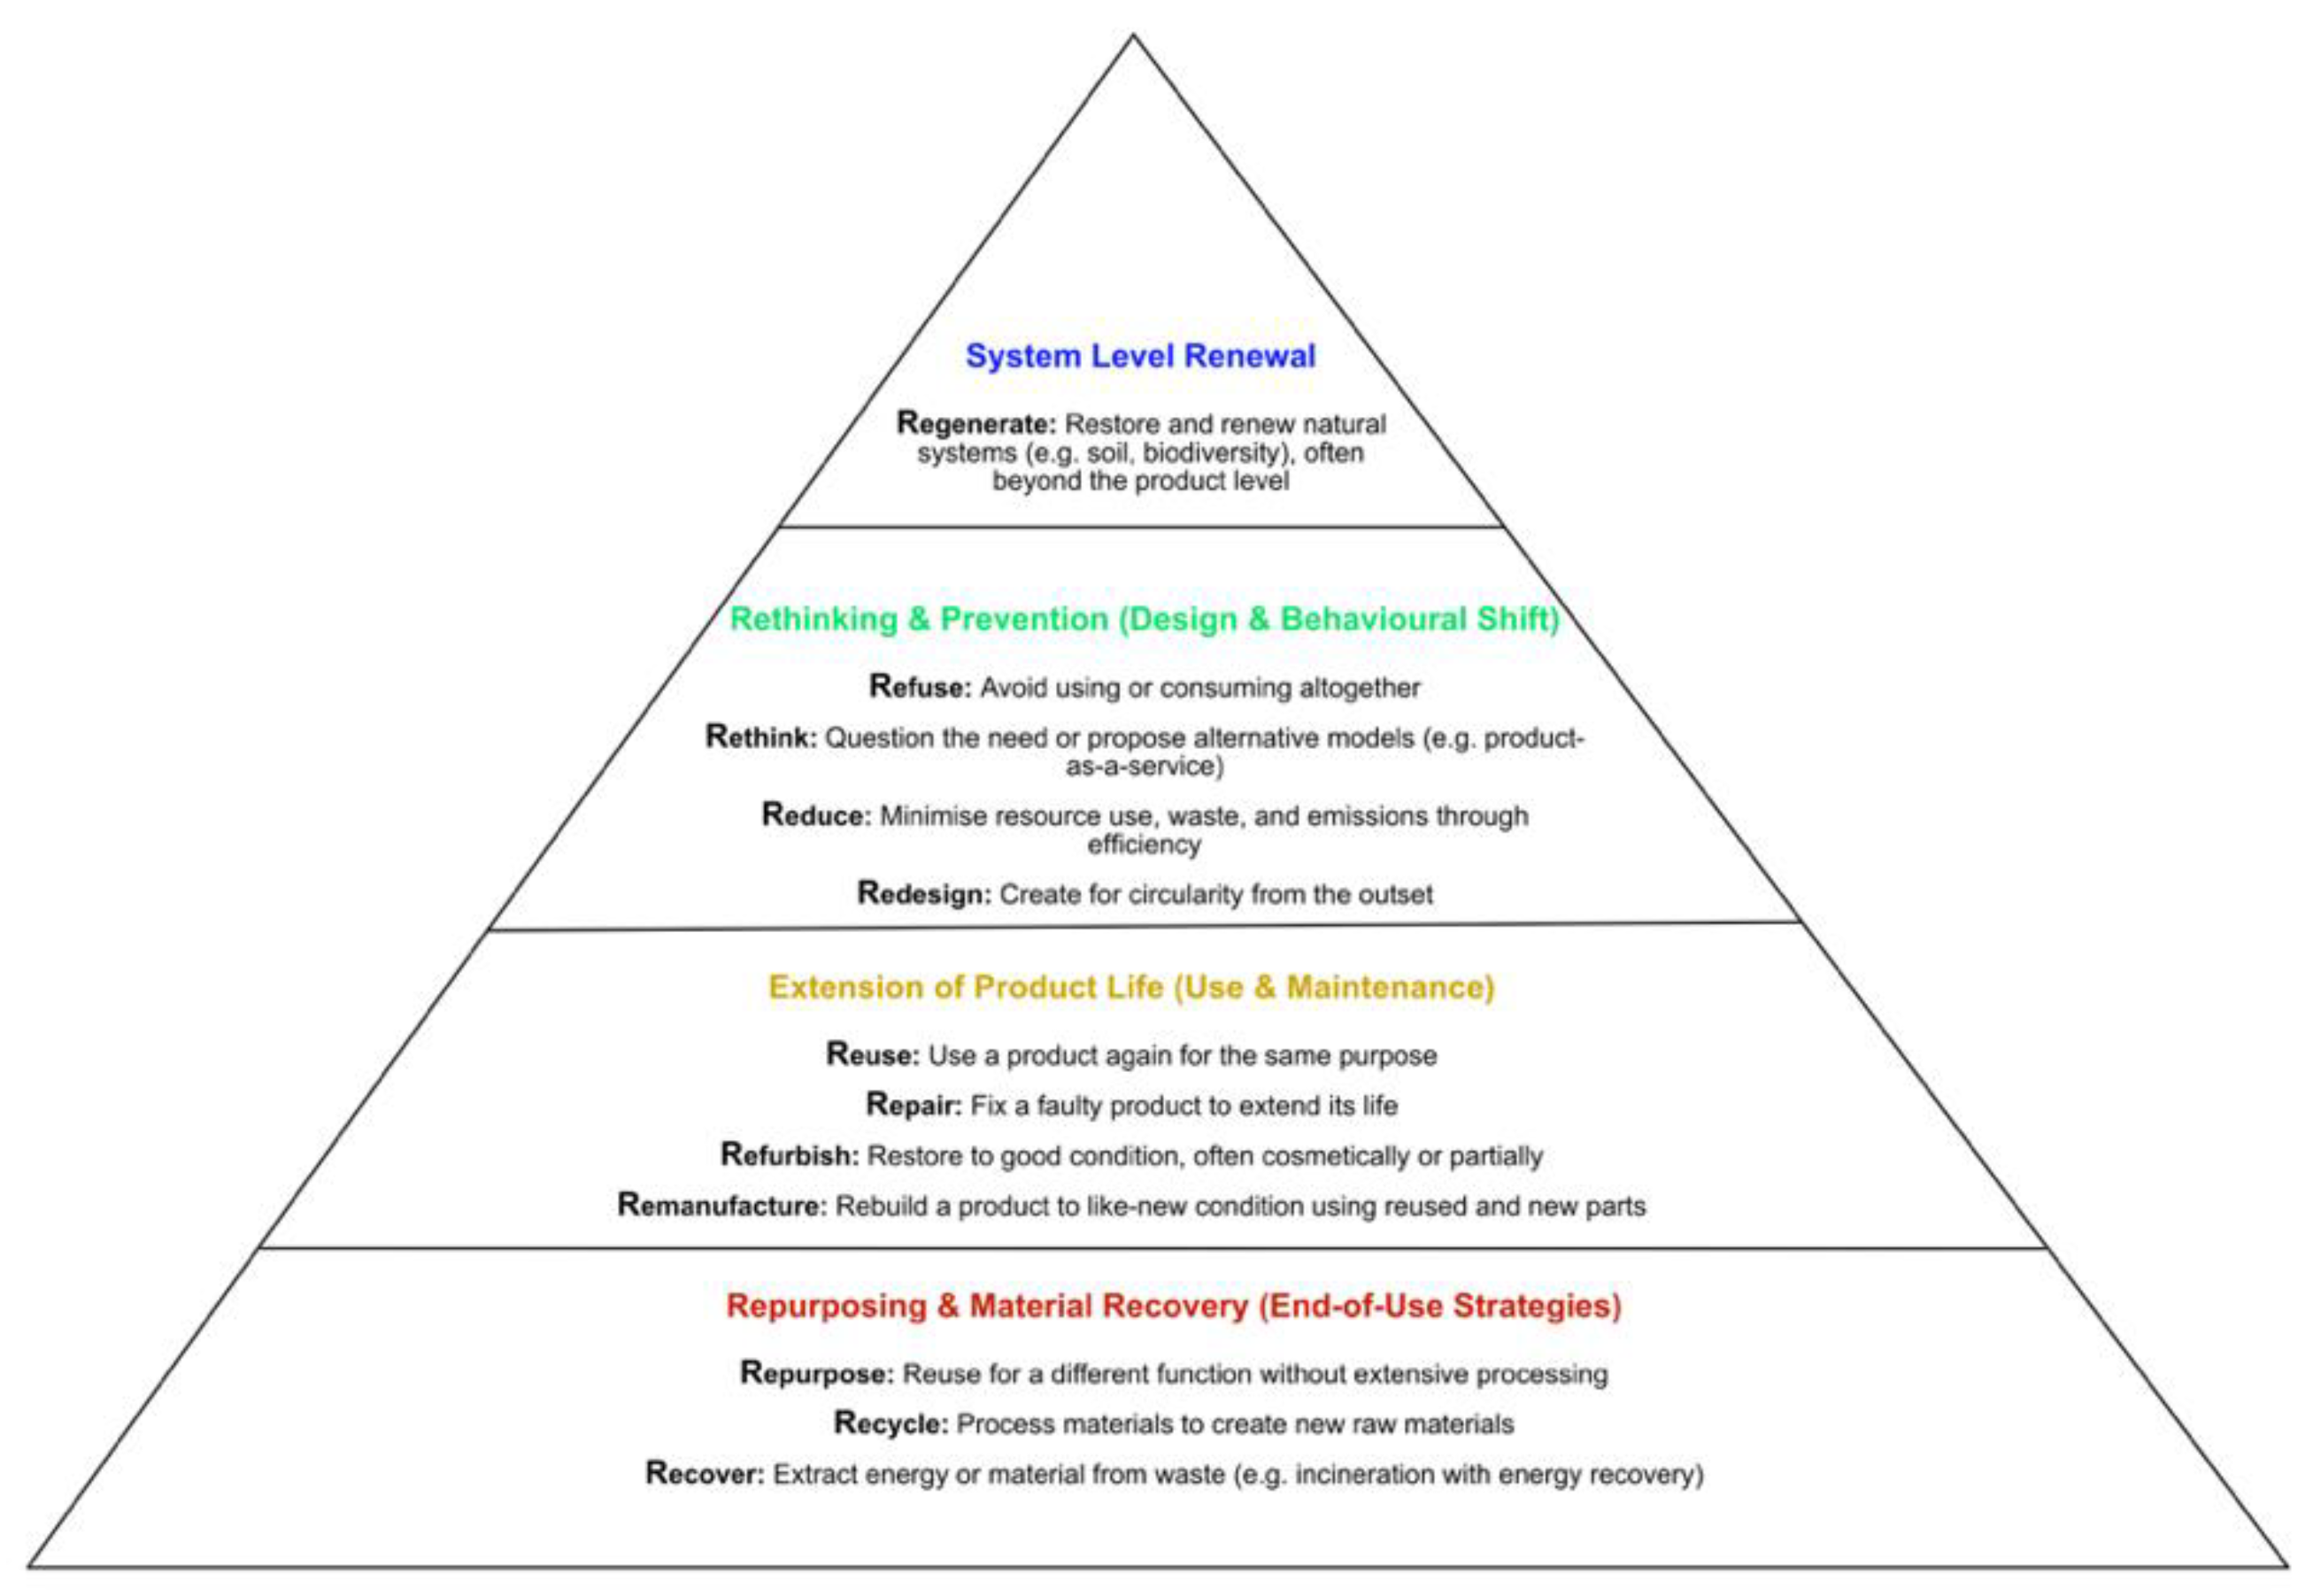
Within these different definitions, there is a spectrum of creative outputs from material-first (e.g., fashion, crafts) to those which are digital-first or experiential (e.g., video games). This raises the question of what resources circulate in the different segments of the creative industries, and how these differences might change understanding and application of the CE concept. The practical application of CE is usually described by R strategies, which offer a structured framework for prioritising circular actions that preserve value and minimise resource use throughout the lifecycle of products and services. There are multiple R strategy frameworks available, e.g., 8, 10 or 12 Rs [4,5], but for this research the authors have used a 12R framework rather than a more condensed one. This offers a fuller spectrum of circular strategies and better differentiation between strategies for analytical purposes.. Regardless of which framework is used, a high materiality sub-sector such as crafts or fashion is likely to favour different R strategies compared to a more digital sub-sector.
Second, the definition of the CE continues to evolve [6,7,8]. In 2024, the launch of the ISO59000 series of transversal standards promised greater uniformity of understanding of circularity for organisations. However, it is too soon to tell how this definition will be adopted across industry and particularly in the creative industries as there was no specific creative industries involvement in the work of the Technical Standardization Committee TC 323 in creating the definition contained in ISO59004 [9]. Kirchherr et al. identified 114 definitions [8], so what definitions or understandings are currently in use within the creative industries?
Third, the value and supply chains in the creative industries are often complex, with overlapping partner networks and ecosystems. Mapping lifecycles of products and services is difficult, as is measurement of circularity. This complexity is amplified by high levels of fragmentation [10] and the fact that the creative industries are dominated by freelancers, and micro- and small- to medium-sized businesses (MSMEs). Prior research from the authors shows that individuals and small organisations lack the resources and knowledge to implement systemic circularity solutions, and have low levels of sustainability maturity, particularly in createch [11]. So, does this low level of sustainability maturity also extend to CE practices across the sector and, if so, which R strategies are associated with lower or higher maturity?
Fourth, the creative industries are experiencing a fast-paced socio-technical transformation [12,13,14] driven by multiple Industry 4.0 technologies, especially those based on artificial intelligence (AI) such as generative AI for video. This is driving a trend to dematerialise creative production and outputs (at least in part), and many organisations in the creative industries now operate across both material and digital domains, combining physical assets with data-intensive production and distribution systems (e.g., gaming engines, streamed media). Examples include replacing physical props, sets, and locations with virtual production environments for film production and using digital twins, 3D modelling, and virtual sampling instead of multiple physical prototypes in fashion design [15]. This trend is leading to new business models such as “digital-first” platform businesses such as music streaming, and second-hand fashion markets at scale [7,16,17,18]. Today, most sub-sectors are a shifting mixture of physical and digital, e.g., fashion brands may offer physical clothing, repair services and virtual garments (for use in social media and other virtual environments).
This socio-technological transformation is also creating a hidden “world behind the screen” of data centres and end-user devices [19] that deliver online services such as streaming of films and music and consume vast amounts of energy [20,21,22] and generate CO2.
Hence, there is clearly a link to decarbonisation and national and international net zero ambitions. However, this connection with the creative industries is not fully recognised in national net zero commitments. There are also growing environmental concerns related to electronic waste (e-waste) associated with digital innovation [23,24] and semiconductor manufacture [25], particularly with the rapid rise in AI use. To what extent do organisations in the creative industries recognise the energy and e-waste impacts of accelerating use of technologies such as generative AI, and the opportunities these developments present for enhancing circularity?
Finally, the creative industries have historically relied on self-regulation, often through voluntary pledges and codes of conduct [26]. Prominent examples such as the US Green Production Guide, BAFTA albert and the Theatre Green Book incorporate elements of the CE within broader sustainability frameworks. These initiatives are gaining critical mass within their originating countries and, increasingly, are seeing international uptake; for example, the Theatre Green Book has now been translated into Japanese and Swedish, signalling growing global relevance.
However, other than architecture, and indirectly product design (notable in the electronics industry), the creative industries sector is not subject to environmental regulation. While fashion (textiles and clothing) is increasing in priority for regulators (notably in the European Union), key pieces of legislation will not be in force for some time yet. This lack of legislative drivers for the sector likely reduces the pressure for a transition towards circularity. So, what is the current role of mandatory legislation (and standards) in driving the CE transition in the creative industries? To what extent are the creative industries and their ecosystems represented in national strategies?
Hence, 'The principal research questions driving this work are:
- RQ1: How are CE principles interpreted and applied across creative industry sub-sectors, and how are sectoral norms and practices evolving?
- RQ2: How are the creative industries represented in national CE strategies, and what policy patterns or gaps emerge across different countries?
- RQ3: What systemic drivers and responses (across policy, practice, and academic discourse) are shaping the transition to a CE in the creative industries?
2. Methods and Materials
This study adopted a multi-strand research design to examine the role of the CE within the creative industries, integrating diverse data sources and methods to generate a comprehensive and policy-relevant analysis. The design is structured around four interrelated strands: academic literature review, grey literature analysis, national strategy review, and a practitioner survey. Each strand addresses different knowledge domains, and together they enable a triangulated and multi-level exploration of circular transitions in the sector.
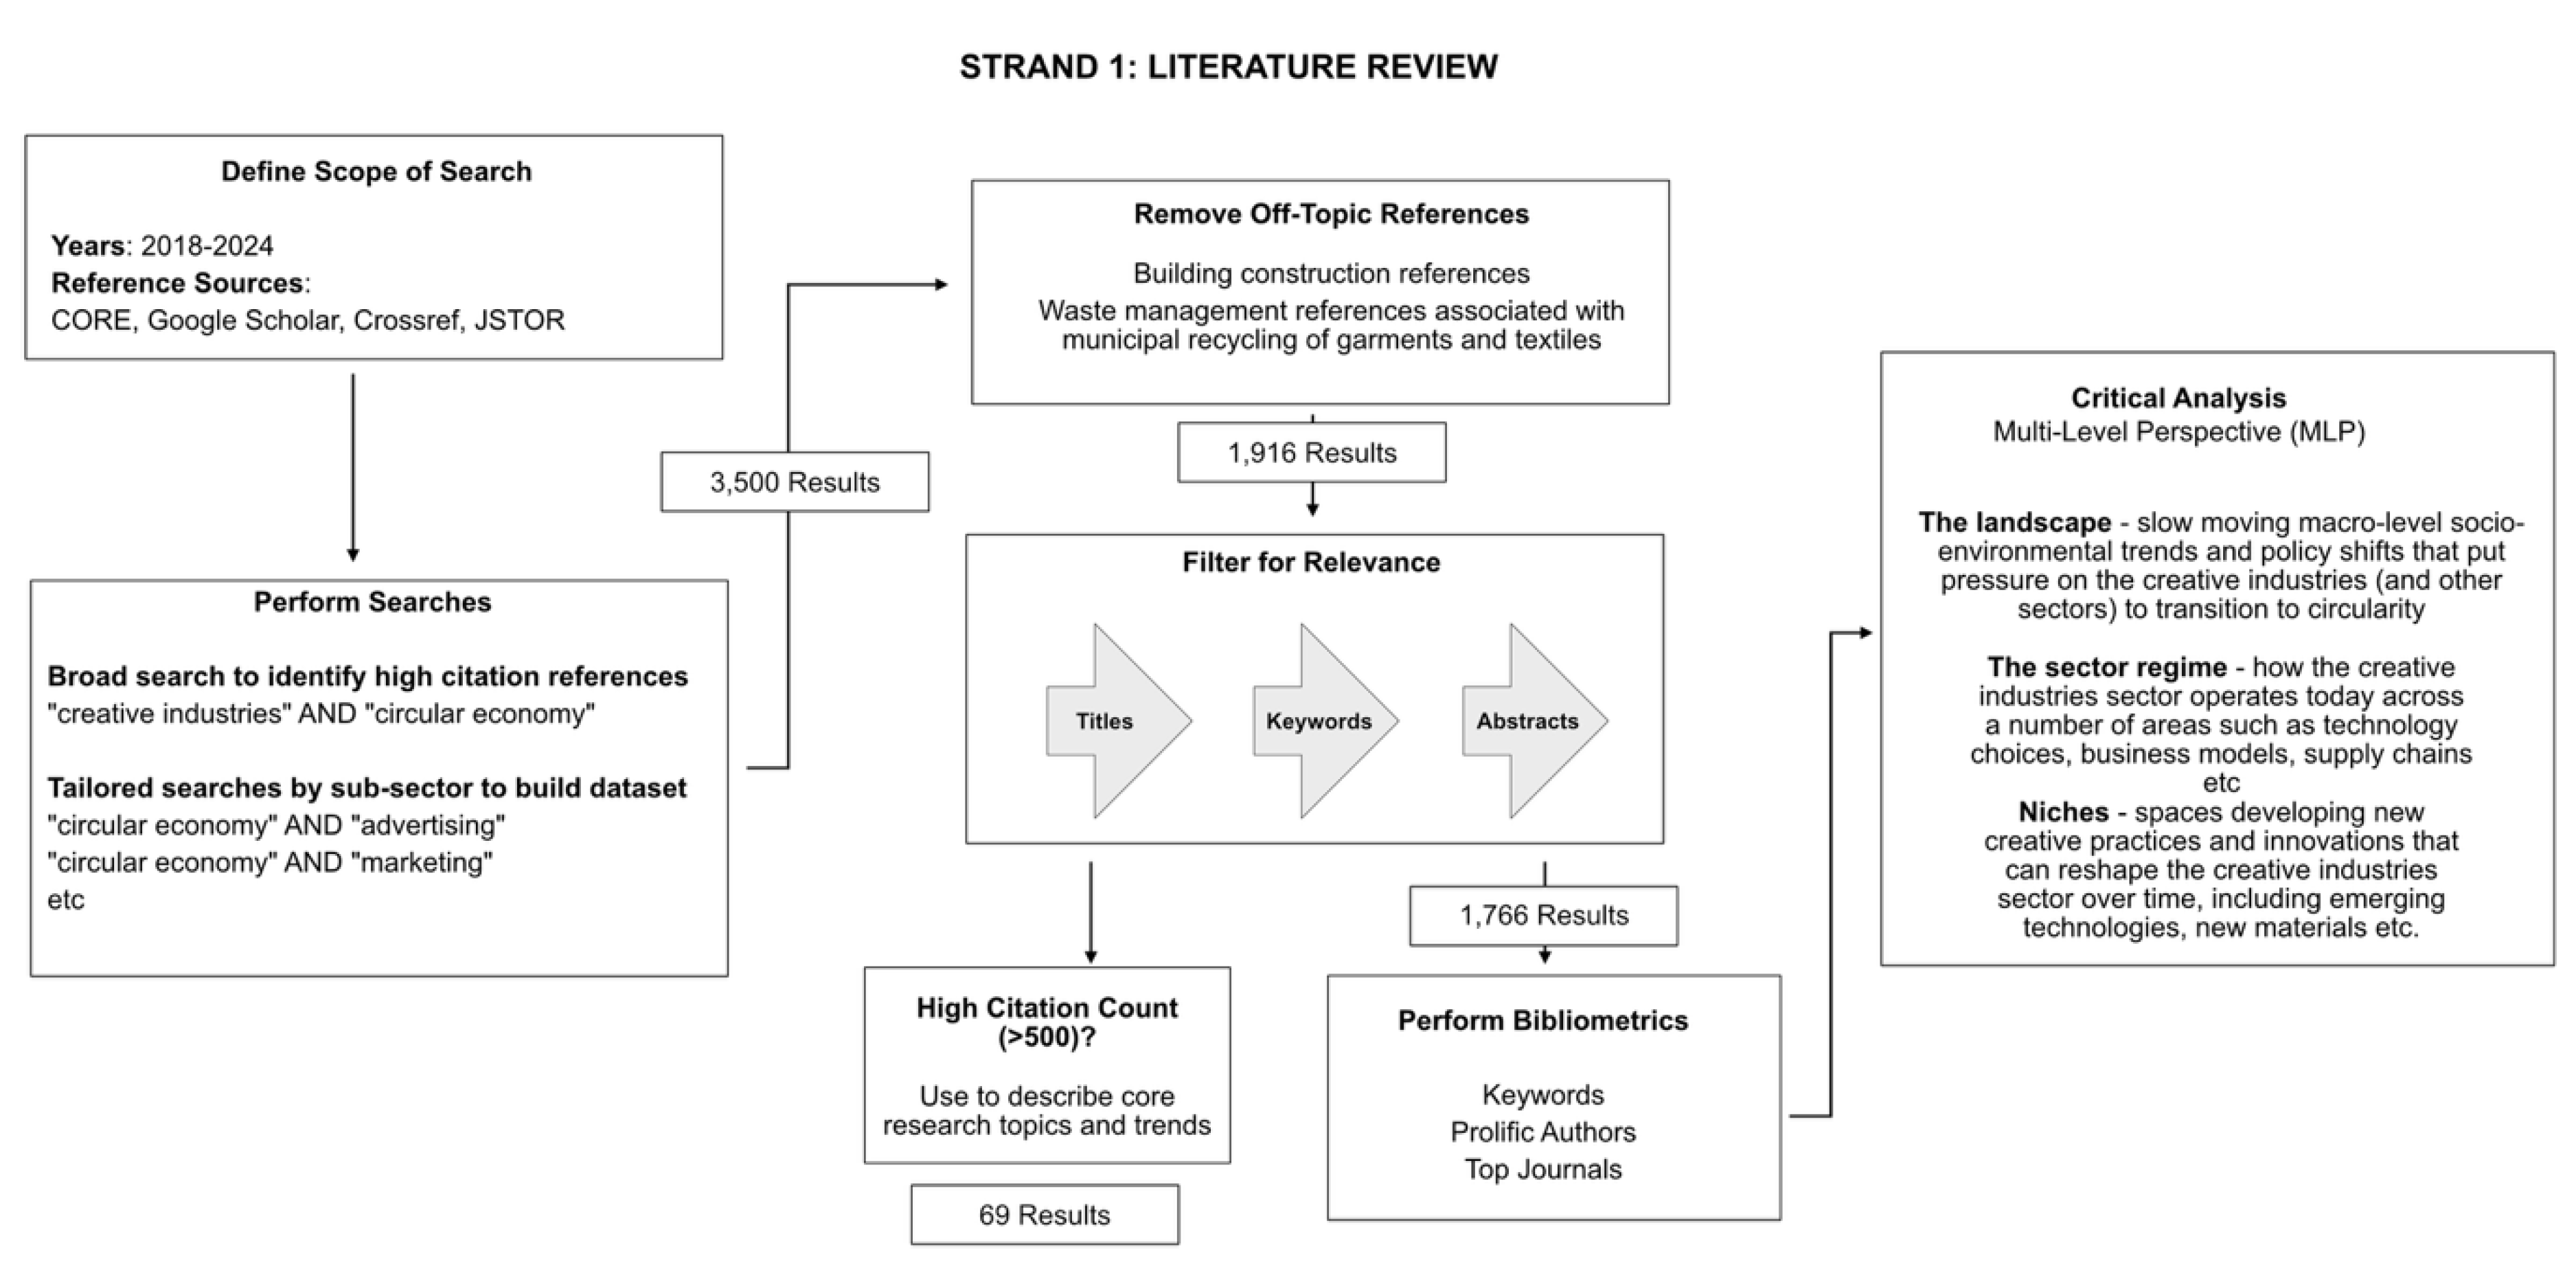
The first strand (see Figure 1) was a review of recent academic literature (2018–2024), focusing on the CE within the creative industries and specific sub-sectors. The year 2018 was chosen as the start date as the beginning of a first wave of academic literature linking the CE and creative industries, providing a critical mass for review.
After an initial broad search, multiple Boolean searches related to the CE and the sub-sectors of the creative industries (e.g., “circular economy” AND “advertising”) were used to identify candidate papers, which were then filtered for relevance based on title, keywords, and the abstract text. Basic bibliometric techniques [27] were then used to identify high-frequency authors and journals in the dataset, highly cited papers, and to analyse keywords and co-words. The results were also classified according to sub-sector.
Figure 1.
The approach to the literature review.
The second strand reviewed national circular strategies using the Chatham House inventory of 73 national strategies as a base [28,29], with revisions to the list after targeted searches. The inclusion criteria used were:
- Only official CE strategies or policy documents published or endorsed by national governments were included. Regional strategies or frameworks were included where they led to substantive national developments (e.g., EU Circular Economy Action Plan).
- Documents had to outline policy frameworks, strategic objectives, or action plans specifically related to the CE. For this paper, no distinction was made based on whether a strategy was operational or was still under development.
- Documents needed to be publicly accessible online, either through government portals or authoritative databases (e.g., Chatham House list).
- Where multiple versions of a strategy existed, the most recent available version was selected to ensure currency of analysis.
Each strategy was made machine-readable, machine-translated where needed, annotated with relevant metadata, and reviewed manually for explicit or implicit references to the creative industries. This provided insights into the policy positioning and visibility of the sector within broader CE agendas.
The third strand used a custom natural language processing pipeline1 to analyse grey literature with dates between 2018 and 2024 obtained from search engines. These results were primarily web page text and linked Adobe Acrobat formatted reports, toolkits, policy documents, and case studies from consultants, sustainability NGOs, industry associations, government bodies, and sustainability networks and initiatives. This dataset addresses practical developments and emergent issues that may be underrepresented in peer-reviewed literature. Document inclusion was based on identifiable authorship, provenance, and currency, and then the documents were loaded into the pipeline.
Figure 2 details the end-to-end analytical workflow developed to analyse the grey literature search results (see Appendix A, Figure A1 for more detail). The workflow removes special characters, images, and duplication from the results, then harmonises the format of the results and filters them for relevance to the creative industries using regular expressions. Metadata is added before the workflow continues to calculate keyword frequencies and term co-occurrences based on keywords extracted from document summaries [30,31].
As discussed in the introduction, a 12R framework is used rather than the more common 8 or 10R models (see Figure 3). Using the 12R framework in the analytical workflow allows the software to better differentiate between strategies, and to capture a wider and more nuanced range of strategies, such as regenerate, redesign, and refuse.
Generative AI is used at two points: cleansing and simplifying grey literature search text files before the text is mapped to the 12R framework and combining individual sets of searches into a human-readable digest per sub-sector for offline review by the authors.
Figure 3.
The 12R strategies with those of greatest circularity value higher in the pyramid.
The fourth strand involved an online practitioner survey with informed consent between 8th March 2025 and 19th April 2025 to gather firsthand data from business professionals across the creative industries. The survey uses quantitative and qualitative questions to identify current levels of understanding of the CE concept, patterns of application of the 12R strategies, levels of organisational maturity, CE capabilities and knowledge, and alignment with external pressures, policies, and standards. Also, the survey seeks respondents' views on challenges, gaps, and opportunities. All data gathered was anonymised before analysis.
Finally, a process of synthesis and integration brings together insights from all four strands. The Multi-Level Perspective (MLP) [32] is used for critical analysis to explore the drivers and evolution of the CE in the sector. The MLP explains how systemic change emerges through interactions across three levels. The landscape refers to the broader socio-technical context, including macro-level trends and pressures (e.g., cultural shifts, global markets, or climate change) that evolve slowly but exert powerful influence beyond the control of any single actor or sector. The sector regime comprises the policies, norms, rules, systems, and institutions that structure how organisations in the creative industries operate in the sector as a whole or in the individual sub-sectors. Regimes remain stable until challenged by landscape pressures and niche innovations. Niches are protected spaces where new practices, technologies, and business models can be developed and tested outside the dominant regime. Niches (and niche innovations), while often small in scale, are critical to long-term systemic change.
The MLP was chosen because it captures the interactions between niche innovations (especially emerging disruptive technologies such as generative AI), established industry practices, and broader societal and policy landscapes during sustainability transitions [33].
3. Results
3.1. Review and Analysis of Recent Literature
An initial broad search (“creative industries” AND “circular economy”) was performed to identify highly cited articles relevant to the CE and to establish how they relate to the creative industries. For the period 2018 to 2024, 69 references were found with 500 or more citations. In these highly cited references, mention of the creative industries is usually confined to a single sentence or repeated mentions of product design, fashion, or architecture, etc. However, by being highly cited, these references exert influence on those researching the creative industries as these papers shape the current core intellectual structure of CE scholarship for multiple sectors, particularly as it relates to policy, practice, business models, and enabling technologies. Many are literature reviews, framework papers, or conceptual critiques (e.g., "Circular economy: the concept and its limitations" [34], "The relevance of circular economy practices to the sustainable development goals" [35].
Next, a more tailored search strategy was employed at a creative industries sub-sector level (e.g., advertising). This involved numerous Boolean keyword searches across multiple academic search engines using inclusion and exclusion logic to return more relevant material. These more precise searches yielded 1766 journal articles, book chapters, and textbooks that were highly relevant to at least one sub-sector in the creative industries.
The overall trend in publication is upward (see Figure 4), with a small drop in 2024, which may be due to incomplete data due to reporting lags. Design (product and fashion) dominates the literature, accounting for almost half of the references. Table 2 shows the distribution of references by sub-sector and year. In some cases, the sub-sector has been split into the different segments which reveals an interesting trend such as a different rate or volume of publication (e.g., design has been split into design - mostly product and associated material selection - and fashion design, which includes textile design).
When interpreting these publication statistics, it is important to note that references from the construction (building) and the waste management literature associated with municipal recycling of garments and textiles were excluded from these searches, as they are out of scope for the purposes of this paper.
Both advertising and marketing are relatively flat year-on-year, but the volume in marketing is higher. These marketing references are mostly concerned with consumer behaviour and pricing related to the CE. Architecture appears to have peaked in 2021, with a steady decline since then (and a sharp drop in 2024), although this may simply be a lag in the publication process. Creative technology shows a stable upward trend with small year-on-year increases. Performing arts (theatre and dance) and crafts show marked increases in the last two years. Publishing does not appear to be an area of research.
Cross-sector references (e.g., such as those that study adoption of one of the 12R strategies in multiple sub-sectors, or between the creative industries and another sector) are characterised by low and inconsistent activity. This is an important observation as it either means i) there is a lack of dedicated scholarship on the creative industries as a whole; or ii) researchers are funded to work within sub-sector boundaries; or iii) the research on the sector is occurring but is subsumed under the dominant sub-sector or R strategy in reporting.
Table 3 lists the top 20 keywords in the CE in the creative industry dataset. Where references were not supplied with the original reference, keywords were machine-generated. Table 4 lists the top 20 keyword co-occurrences in the dataset.
Table 2, Table 3 and Table 4 suggest that the bulk of the literature is focused on the design, architecture, and fashion sub-sectors. Topic modelling of article titles analysis [36] highlights a strong focus on circular design, product development, and product-service systems [37,38,39] particularly in fashion and architecture. There is also significant attention to business models, digital innovation, and data-driven value creation, with multiple studies examining how Industry 4.0 technologies like digital twins and blockchain support circular supply chains and services in the creative industries [13,40,41,42].
Within the design references, there is a distinct sub-cluster around material innovation (for architecture, products, packaging, and fashion), much of which discusses moving to bio-based materials and the implications for designers and architects [43,44].
Another cluster centres on consumer engagement, behaviour change, and secondary markets [45,46], reflecting interest in how end users participate in circular practices, particularly again in the fashion sub-sector. Cultural narratives and storytelling also emerge as mechanisms for promoting awareness and transition [47], and this intersects with work on social responsibility, equity, and community mending cultures [48,49].
A further thematic area addresses policy frameworks, regulation, and governance, especially at the European level [50,51,52]. These papers discuss the alignment (or misalignment) between public policy and citizen engagement, the role of the UN Sustainable Development Goals (SDGs), and evolving standards and legislation supporting CE transitions.
There is also a prominent strand of papers that cluster together research on systemic perspectives and technical tools aimed at understanding circularity. At the higher level, researchers on systems-level thinking frame how the creative industries can be analysed in terms of interconnections, boundaries, and feedback loops [53]. At the more applied level, the research offers critiques of life cycle assessment, material flow analysis, and circularity metrics within sub-sectors such as architecture and media streaming as ways to measure circular performance at product and organisational scales [53,54,55].
Creative technology appears last in the top 20 keywords list, but the topic analysis identifies a growing discourse around technological transformation, including discussion of the environmental benefits of AI and digital platforms [56,57]. However, there is relatively little discussion of the negative environmental impacts of these technologies in the dataset [58]. This lack of coverage is likely due to the speed with which energy-intensive technologies such as blockchain and Generative AI have become a feature of the creative industries.
3.1.1. Applying the MLP Lens
At a landscape level, these references reflect the broad forces shaping change in the creative industries (and many other sectors): global policy agendas related to the climate crisis and sustainable consumption and production (e.g., the UN SDGs), challenges of material waste and scarcity, and digital transformation reshaping multiple sectors.
At a sector regime level, the literature suggests that multiple elements of the regime are starting to come under pressure in various sub-sectors to move away from linear practices, e.g., changes in sourcing practices, leadership behaviour in theatre management, and the criteria used by commissioners of advertising and TV content. There are references to dominant institutions (such as major broadcasters and streamers, architectural practices, creative agencies, theatre) circularity metrics, lifecycle assessments, and systems thinking. However, the transition to circularity appears to be only just starting, and there are clusters of papers that discuss slow progress and inertia in the sector as a whole. Continued reliance on linear models in fashion, architecture, and product design is evident in titles that highlight "barriers" and "challenges”. In summary, the regime is adapting incrementally.
At a niche level, there is evidence of potential radical innovations in specific sub-sectors in the references analysed. The literature contains many and varied examples of small-scale experiments, proofs of concept, and entrepreneurial startups. Examples of niche innovations include:
- Product and service design: numerous titles refer to "circular product design" and "design for deconstruction" as niche experiments in new forms of design beyond eco-design.
- Digital tools and platforms. Mentions of "digital twins" and “virtual and augmented reality” show early-stage integration of technology in circular creative workflows.
- Material experimentation. Emerging concepts like “urban mining” for reuse of architectural materials and bio-based materials for fashion show strong niche level explorations of alternatives to consumption of primary resources and those derived from fossil fuels.
However, there is little evidence of these innovations reaching a scale where linear systems are transformed into circular ones. Although not specifically addressing circularity, the written evidence given to the UK House of Lords Communications and Digital Committee by the authors and others in the context of scaling creative technologies echoes this finding [59].
3.1.2. Authors and Sources
It can take a few years for papers to build up high citation counts, so another way to understand the emerging shape of the literature is to identify individuals whose work appears frequently in the dataset (and where their work is published), which can suggest recurring perspectives, themes, or methodological approaches that may influence trends in the literature.
Table 5 shows authors with five or more references between 2018 and 2024, and Table 6 shows the leading journals, conferences, and textbooks in that period. Paper counts are based solely on the inclusion and exclusion criteria used in this study and do not necessarily reflect total career output or overall productivity.
40% of the papers published are design-related, covering:
- Design-led circular strategies. This cluster of references focuses on design-thinking, innovation, and industry transformation. Fashion and textiles are commonly mentioned.
- Product and service design for circularity across creative industries sub-sectors. These references critique case studies and design interventions that build systemic circularity in architecture, product design, and fashion systems.
- Circular design and behaviour change in creative production. These references address the CE across multiple sub-sectors. This cluster of references also contains reflections on post-Covid behaviour changes (e.g., the impact on sharing behaviour).
20% of the papers discuss Industry 4.0 and digital enablers of CE adoption in the creative industries (e.g., the use of simulation models for process design). There is a lack of sub-sector level research: most of the papers are at a general level within the creative industries, with fashion being one of the few sub-sectors to attract significant research.
The remaining references mostly cover green supply chains, benefits of platform-based systems, business model innovation, and challenges and frameworks for implementing CE strategies in the creative industries.
There are numerous similarities between the high frequency authors’ areas of interest and those of the highly cited authors. In comparison with highly cited papers, frequently occurring authors are more likely to write about the challenges of orchestration and integration of CE practices, especially in creative industries business contexts. The high frequency authors, however, are less likely to write about European policy, UN SDGs, and alignment of governance frameworks.

Table 5.
Authors with five or more references in the dataset. Note that this list contains only the number of references pertaining to the creative industries and not the entire output of each author.
Table 5.
Authors with five or more references in the dataset. Note that this list contains only the number of references pertaining to the creative industries and not the entire output of each author.
| Author | ORCID ID | Primary Affiliation | Reference Count in Dataset |
|---|---|---|---|
| Bakker, C | 0000-0001-9982-8788 | TUDelft, Netherlands | 20 |
| Balkenende, R | Not Available | LLeiden-Delft-Erasmus Universities | 14 |
| Pigosso, D | 0000-0001-7277-0360 | Technical University of Denmark, DTU | 13 |
| McAloone, T | 0000-0002-9776-3340 | Technical University of Denmark, DTU | 11 |
| Bocken, N | 0000-0003-0137-4074 | Maastricht University, Netherlands | 10 |
| Garza-Reyes, JA | 0000-0002-5493-877X | University of Derby, United Kingdom | 8 |
| Zorpas, A | 0000-0002-8154-5656 | Open University of Cyprus | 7 |
| Sarkis, J | 0000-0003-0143-804X | Worcester Polytechnic Institute, USA | 7 |
| Sassanelli, C | 0000-0003-3603-9735 | Politecnico di Bari, Italy | 7 |
| Charter, M | 0000-0001-9743-4187 | University for the Creative Arts, United Kingdom | 6 |
| Rosa, P | 0000-0003-3957-707X | Politecnico di Milano, Italy | 6 |
| Boks, C | 0000-0002-3410-0582 | Norwegian University of Science and Technology, Norway | 6 |
| Pieroni, M | 0000-0003-2968-7881 | Aalborg University, | 6 |
| Andrews, D | 0000-0002-5761-3591 2012 2024 | London Southbank University, United Kingdom | 6 |
| Saidani, M | 0000-0002-8269-4477 | Luxembourg Institute of Science and Technology, Luxembourg | 6 |
| Authors with 5 References | |||
| Dey, P; Awan, U; Papamichael, I; Centobelli, P; Kim, H; Broega, A; Niero, M; Velenturf, A; Henninger, C; Terzi, S; Morone, P; Bressanelli, G; Urbinati, A; Chiaroni, D; Sumter, D; Muthu, S; Cheshire, D; Dabaieh, M; Sundin, E | |||
Table 6.
Top 20 reference sources.
| Journal, Conference Proceedings, Books | Reference Type | Reference Count in Dataset |
|---|---|---|
| Sustainability | Journal | 112 |
| Journal of Cleaner Production | Journal | 72 |
| Resources, Conservation and Recycling | Journal | 34 |
| Business Strategy and the Environment | Journal | 34 |
| Circular Economy and Sustainability | Journal | 25 |
| Journal of Industrial Ecology | Journal | 16 |
| Sustainable Production and Consumption | Journal | 16 |
| EcoDesign for Sustainable Products, Services and Social Systems II | Edited Book | 15 |
| Environmental Footprints and Eco-design of Products and Processes | Edited Book | 15 |
| International Journal of Production Research | Journal | 12 |
| Management Decision | Journal | 11 |
| Science of the Total Environment | Journal | 11 |
| Waste Management & Research: The Journal for a Sustainable Circular Economy | Journal | 11 |
| EcoDesign for Sustainable Products, Services and Social Systems I | Edited Book | 11 |
| Journal of Environmental Management | Journal | 10 |
| Procedia CIRP | Journal | 10 |
| Polymers | Journal | 9 |
| Production Planning & Control | Journal | 9 |
| Energies | Journal | 9 |
| Proceedings of IDEAS 2022 | Proceedings | 9 |
A notable characteristic of this list is its similarity to that in the 2017 paper by Geissdoerfer et al., that researched the emergence of the CE as a paradigm and which had the Journal of Cleaner Production, Resources, Conservation and Recycling, and Sustainability as the top three journals [7]. However, these are not journals closely associated with the creative industries (e.g., Journal of Cinema and Media Studies, Journal of Architecture, International Journal of Advertising, Journal of Marketing etc).
Only one set of conference proceedings made the top 20 list, but this may be i) that relevant conferences do not publish proceedings; ii) a metadata issue as there is inconsistency in how the online sources use report titles, reference types, keywords, etc.
3.2. Analysis of National CE Strategies
Table 7 shows the 73 national CE strategies reviewed (the United Kingdom's devolved nations were reviewed separately as there is no current integrated strategy). In addition, three regional frameworks were included: European Commission Circular Economy Action Plan, the ASEAN Framework, and the Africa Circular Economy Facility.
Across these documents, there is a consistent pattern: in terms of a sector of the economy, the creative industries are largely excluded from formal policy frameworks. When mentioned, references are typically focussed on waste-related activities such as textile recycling, or broad statements about eco-design, or in the context of campaigning for a change in citizen behaviour. This omission persists despite the sector’s significant economic footprint in several of the nations. This may be due i) to a lack of engagement by the creative industries sector with policymaking; or ii) a matter of priority – policymakers likely started with the largest waste streams in their economies; or iii) the creative industries are seen as low impact.
There are notable exceptions. Four national strategies (Luxembourg [60], Montenegro [61], Rwanda [62], and Slovenia [63]) explicitly identify the creative industries as a priority economic sector in respect of their national CE transitions. Luxembourg positions the sector as a driver of sustainable design and economic diversification, promoting collaboration through its Creative Industries Cluster. Rwanda includes the creative economy within its green growth strategy, linking it to innovation, youth employment, and low-carbon entrepreneurship (including digital circularity). Slovenia frames the sector as agents of behavioural and cultural change, emphasising the role of storytelling, design, and media in public engagement. Montenegro similarly advocates for a “circular culture,” highlighting the importance of the creative industries in shaping values and embedding circularity within education and everyday life. However, even in these national strategies, there is a lack of detail about how the entire sector should move forward.
While CE can help with the decarbonisation required to deliver national net zero ambitions, this is not usually directly addressed in national CE strategies. Also, the link between actions needed to decarbonise and net zero targets is generally not made clear, and this is also true in the creative industries where the connection between the growing use of technologies such as AI and the resulting impact on energy consumption and hence emissions may not be acknowledged.
Some of the strategies analysed explicitly acknowledge that there is a connection between the CE and national net zero ambitions, e.g., the Australian strategy [64] contains the sentence “Circular economy strategies also support a sustainable, nature positive net zero transition, by ensuring technologies, materials, and infrastructure developed during the transition can be recovered and reused at their end of life”. However, acknowledging that national CE and net zero strategies are complementary is not universal, although mentions of clean or renewable energy is common.
3.2.1. Applying the MLP lens
The various national CE strategies are structured differently, making direct comparison challenging. Using the MLP as an analytical lens helps to reveal more about the structure and content of the strategies.
At the landscape level, broad sustainability imperatives drive the strategies, such as the elimination of single-use plastics and reductions in construction and textile waste. Overall, at a landscape level, the specific drivers that relate to the creative industries, such as changes in media consumption and consumer preferences, and the impact of new technologies such as generative AI, are absent.
To legitimise CE transitions, the national strategies typically align with the UN SDGs (usually goals 12 and 13), international climate policy frameworks, and global trade dynamics (e.g., access to critical raw materials, reducing dependencies on imported materials). In all cases, the CE strategies are framed primarily in material terms (e.g., virgin resource dependency, emissions, or visible waste streams), inevitably focusing on traditional high-impact industrial sectors such as automotive and steel, rather than the creative industries.
At a sector regime level, the national CE strategies focus overwhelmingly on entrenched production-consumption systems in construction, automotive, food, agriculture, electronics, and textiles and don’t include the creative industries. Consequently, there is no attention on, for example, national infrastructures needed for the creative industries, particularly related to those sub-sectors that are digital-first or experiential. Likewise, policy instruments cluster around a common set of emerging mechanisms: Extended Producer Responsibility (EPR), eco-design regulations, digital product passports, and sustainable procurement, all typically designed for linear to circular transitions in manufacturing ecosystems and not the creative industries.
At a niche level, as noted in the academic literature and stated above, the creative industries are experimenting with small-scale niche innovations, such as circular fashion business models and platforms, modular theatre-set design, bio-based materials and low-carbon virtual production for film and TV. Based on the analysis of the 73 national strategies, these experiments currently appear to be operating in a policy vacuum. There is little evidence of state-supported incubation or systematic scaling of circular practices within creative MSME businesses, even though these actors dominate the sector structurally and are often early adopters of sustainability practices. This fragmentation of the sector and the intangible nature of many of its outputs (e.g., digital, experiential, or narrative content) contribute to its invisibility in policy.
Since the national CE strategies focus on sectors with hard infrastructures and tangible flows, the “World Behind the Screen” (the tangible impact of digital production and data centres, increasingly central to creative workflows) remains unaddressed perhaps due to lack of awareness and complexity. In some cases, dematerialisation trends, such as digital fashion and virtual production, are presented as inherently sustainable, despite evidence of their growing energy and e-waste footprints.
3.2.2. Implications for the Creative Industries of Policy Paradigms
The national CE strategies analysed use the vocabulary of sustainable development, but many anticipate implementation through market-based approaches such as:
- Government-backed green finance and bonds to channel funds into initiatives that support a CE transition;
- Mobilising private sources of capital to support CE transitions through venture capital and private equity;
- Developing markets to connect suppliers and buyers of secondary materials and circular goods;
- Resource-pricing e.g., incentivising secondary material use by increasing the cost of virgin resource extraction or use;
- Investment in smarter waste sorting infrastructures;
- Using government and business procurement clauses to stimulate demand for circular products;
- Calls for private sector innovation and technological progress (guided by light regulation) in areas such as AI-enabled recycling, blockchain-based traceability, and circular design tools.
The national CE strategies assume that technological and regulatory innovation can decouple growth from environmental harm without fundamentally challenging existing consumption patterns (a view often repeated in the technology sector and Silicon Valley in particular). As yet, this is unproven.
This predominately market-driven approach to implementing CE transitions has implications for the creative industries:
- National CE strategies that prioritise digital tools (e.g. blockchain, product passports) and infrastructure investments may marginalise low-tech circular practices common in areas like fashion, crafts, and the performing arts. Likewise, the contribution of creative businesses that offer community-based solutions, such as local repair and upcycling services, may be ignored;
- The creative industries may be required by customers or regulators to demonstrate circularity using quantifiable indicators (e.g. carbon reduction, traceability of materials and products), even if their actual contribution lies in changing values, narratives, and behaviour;
- Sub-sectors like advertising, creative technology, and gaming may benefit if they prioritise development or application of technologies that align with CE goals, such as immersive storytelling to promote behaviour change or tools to reduce digital waste.
More generally, creative work that promotes social justice, intergenerational equity, and cultural transformation in their circularity transition may be overlooked if national CE policy frameworks focus narrowly on technological fixes and economic efficiency.
3.3. Grey Literature Analysis
Grey literature searches for the CE in the creative industries initially yielded 54,538 initial results, a high proportion of which were duplicates or short entries with links pointing to the same source. After deduplication, removal of short and off-topic entries, adverts, pay-walled articles, and academic journal entries, this gave 4,791 unique items (known as ‘snippets’) that had been screened for relevance to the CE across the sub-sectors of the creative industries. These snippets were used for text analytics. Table 8 shows the breakdown of the search results by sub-sector.
Table 9 gives a breakdown by the dominant type of content found in each snippet.
Using keyword patterns phrases based on those widely used in industry handbooks, guides, and consultant reports when the goal is actionable insights or tools rather than abstract theorisation, the results were tagged as either ‘How-To/Practical’ or ‘Theory/Conceptual’. Excluding standards, and government policy, strategy, and regulatory content, 49% were How-To/Practical vs 51% Theory/Conceptual. In terms of concepts or frameworks, the Ellen MacArthur Foundation (EMF) is mentioned 565 unique times in the dataset (the most mentions), suggesting it is a dominant source and general reference point for CE thinking across the creative industries. However, most of the EMF content related to the sector is oriented towards fashion. In contrast, there are 207 unique mentions of the UN SDGs, suggesting a weaker relationship (but still strong).
The grey literature contains some of the most up to date and influential sources of information and practical guidance for the creative industries. For example, reports on investigations into materials [65], virtual film production [12] and [21], industry handbooks such as the Theatre Green Book, sector guidance such as World Business Council for Sustainable Development Circular Transition Indicators for Fashion and Textiles, and standards such as BAFTA Albert. It is also highly fragmented and difficult to navigate quickly.
To further examine the practical application of the 12R strategies to the creative industries, additional text analytics were applied to the dataset to identify how the 12R strategies map out across the different sub-sectors. In n some cases sub-sectors have been further divided where this yielded meaningful findings e.g., separating out mass market fashion from designer fashion, radio and podcasts from TV and film, and theatre from the remainder of the performing arts). The results are presented in Figure 5. A “rule of thumb” is that a value greater than five is a high frequency, and greater than 10 is very high.
This analysis shows that different sub-sectors (or segments within the sub-sector) are oriented towards different combinations of R strategies, and that three of the 12Rs are little mentioned (remanufacture, refurbish, and refuse). However, it is also possible that there are different understandings of the 12Rs between sub-sectors.
One anomaly is that the radio and podcasts segment has a high occurrence number in places due to the titles of the shows in the dataset being relevant (e.g., using words like “repair”). Hence, these results should not be taken as a commentary on the business of radio or podcasting.
Figure 6 presents the co-occurrences of the 12Rs in the dataset (a value of greater than 1.6% represents a significant co-occurrence at the 95% confidence level derived from a binomial one-sided test under the assumption of independence between terms). These pairings suggest natural groupings in how people write and think about CE topics. Redesign appears in three of the top five high-frequency co-occurrences. Redesign pairs particularly strongly with reduce, rethink, and recycle, reflecting its core role as bridge between R strategies (e.g., the more technical strategies such as recycle, and strategic ones such as rethink). Reduce is also prominent (appears in three high frequency pairs) implying that it is used in multi-dimensional contexts, i.e. not just about cutting resource use, but also reframing and reimagining designs, and systems.
3.3.1. Applying the MLP lens
Using keyword patterns associated with the levels of the MLP, the grey literature results were classified by the different levels as shown in Table 10.
Ten percent of the grey literature search results were tagged as landscape content. This landscape content tends to be high level and less specific to the creative industries, even when the target audience is the sector. 57% of the content at this level comprises NGO, governmental, and intergovernmental CE publications that describe the CE concept and build the case for circularity transitions based on generic drivers such as climate change, public pressure for waste reduction. A typical example is the United Nations Economist Network Creative Economy publication “New Economics For Sustainable Development” [66] that summarises CE concepts in the context of the creative industries and details the policy implications at global and country level. This landscape level content also contains descriptions of regional and global governance frameworks (e.g., the various UN initiatives, the European Green Deal, and various agreements on limiting emissions).
Only 21% of the content at the landscape level comes directly from organisations in the creative industries, specifically larger companies (e.g., the BBC, Universal Studios, Decathlon) and international networks and initiatives (e.g., Playing for the Planet). These organisations likely have dedicated resources capable of producing this type of content.
The sector regime content is almost 50% of the grey literature volume, with much of that content containing descriptions of how the regime in specific sub-sectors needs to change (or is changing), rather than a discussion of the sector as a whole. The content includes a wide range of topics such as national or local policies and regulation, industry circularity initiatives, the impact of digitalisation on the sector, changes to supply chains and infrastructure needed for low-carbon operation and circularity, and institutional barriers to transition.
The volume and diversity of sector regime content suggests that there is an extensive exploration of the pre-requisites and practical actions needed for regime-level change, at least within a subset of sub-sectors.
At a niche level (40% of the content), the grey literature contains diverse examples of CE experiments, pilots, startups, and emerging business models. Examples include 3D printing start-ups using biopolymers for on-demand products, corporate take-back and resale initiatives such as that at IKEA, and tools that take AI-generated art and place it into ready-to-use game engine environments for virtual production in advertising, film and TV. However, the challenge of scaling is again apparent in content from industry observers and the businesses themselves.
3.4. Online Survey of Practitioners
The survey was conducted during March and April 2025 and gathered 80 responses with informed consent from a diverse cross-section of professionals working within the sector and its supporting ecosystems. An initial analysis of the survey is contained in the report entitled “The Circular Economy in the Creative Industries: Progress, Challenges, and Hard Truths”[10]. This paper builds on that initial analysis to present more granularity concerning current practices and future intentions for the sector through additional cross-tabulations for each sub-sector.
Of the 80 responses, 41 were from the target demographic, including partial responses, limiting some of the analyses and sub-sector representation (see Table 11 for sub-sector breakdown, and Appendix B, Table B1, Table B2, and Table B3for the participant demographics).
The high proportion of responses from music, performing and visual arts (including theatre) introduces bias into the results. The higher number of survey responses may reflect a greater level of interest in the CE in that sub-sector, but it may also be due to the way that participants were recruited i.e., including some respondents via an active WhatsApp group with members in this area.
Also, where there are only one or two responses (advertising, marketing, crafts, publishing, and multiple sub-sectors), the results can only provide qualitative insights into perspectives within that part of the sector. Organisationally, the responses reflected the sector’s characteristic composition (90% were freelancers or MSMEs), and held a wide range of roles, including creatives, producers, technicians, and those in strategic or managerial positions related to sustainability.
Table 11.
Breakdown of survey responses by sub-sector showing the number fully completing the survey.
Table 11.
Breakdown of survey responses by sub-sector showing the number fully completing the survey.
| Sub-Sectors | Fully Completed Responses |
|---|---|
| Music, Performing and Visual arts (incl. Theatre) | 13 |
| Film, TV, Video, Radio, and Photography | 7 |
| Design (incl. Graphic, Product, and Fashion | 6 |
| IT, Software and Computer Services (including Createch) | 5 |
| Architecture | 4 |
| Other (Multiple Sub-Sectors) | 2 |
| Publishing | 2 |
| Advertising and Marketing | 1 |
| Crafts | 1 |
| Total | 41 |
While the survey demographics offer insights into how circular practices are perceived and applied across different organisational contexts and scales, there are two important caveats. The sample sizes for cross-tabulation by sub-sector are small with missing data where some respondents skipped questions or abandoned the survey before completion), and despite being launched internationally, 80% of responses came from the United Kingdom. The remaining 20% included responses from Western Europe, the Nordics, the Middle East, and the USA. Despite the limited sample size, clear themes and shared concerns emerged, helping to identify priority areas for future research.
To understand the drivers for a transition to a more CE, the survey asked questions about priorities and sources of pressure. In terms of priority rankings, Table 12 shows the breakdown by sub-sector based on a ranking 13 business areas, including the three CE ones shown in the table.
The rankings suggest that circular business models are currently low priority across the sector, but there are wide variations in the ranking for resource efficiency and decarbonisation. Perhaps the most surprising finding given the amount of coverage in the press concerning data centres (especially those for AI) is that the technology sub-sector respondents chose not to rank reducing emissions, energy, and waste as priorities.
To further understand prioritisation, respondents were asked about the importance of the CE to their sub-sector. For each sub-sector, the score was greater than four out of five (where five is very important), except for the technology sub-sector which had a mean score of 2.8 (see Table 13).
Table 14 tabulates the level of pressure for adopting CE practices by sub-sector (where five is very high). Again, the technology sub-sector scores low compared to other sub-sectors, which may explain the low priority.
Table 15 shows the sub-sector variation in terms of sources of pressure to transition, today and in the future. While there is a spread of opinions about current sources, government regulations or policies are overwhelmingly viewed as the major source of pressure in the future.
A more regulated future may prove a challenge for some in the sector, as knowledge and readiness for regulation (e.g., extended producer responsibility, eco-design regulations etc), and standards such as BS8001 and ISO 59000 series is low in multiple sub-sectors (see Table 16). Note that ‘awareness’ does not imply that companies are ready for regulation or using standards.
When asked how prepared organisations are to implement changes needed to meet a range of CE legislation, except for local, national, or regional waste management regulations (e.g., EU Waste Framework Directive), no sub-sector scored greater than 10%. There is clearly a knowledge and readiness gap and, more generally, only 36% said they were very knowledgeable or expert concerning the CE, and the majority came from the design (both product and fashion), film and TV, music and performing arts sub-sectors. Crafts and the technology sub-sectors’ respondents appeared to be the least knowledgeable (although only one craft respondent answered that question). 32% of respondents were unaware of any voluntary guidelines, frameworks, or toolkits for implementing CE practices, and fewer than 50% of respondents had received training or external guidance (despite there being a significant amount of self-guided learning available in the grey literature)
Another area of enquiry in the survey is organisational maturity using the Zero, Basic, Intermediate, and Advanced (ZBIA) scale developed by Professor Martin Charter. Table 17 shows the breakdown by sub-sector.
The low percentage of architecture respondents self-identifying as Intermediate or Advanced compared to most of the other sub-sectors seems counter to the academic and grey literature findings (which suggest greater maturity). One interpretation is that this survey results may reflect greater self-awareness in the architecture profession of the status quo in that sub-sector.
The technology sub-sector also scores low on maturity, and this suggests that the technology sub-sector is not following the same maturity trajectory as the other sub-sectors of the creative industries. A possible interpretation is that the technology sub-sector prioritises innovation speed and market disruption over CE concerns. In addition, the technology sub-sector faces rapid software and hardware obsolescence cycles and globalised supply chains, which create specific structural barriers to adopting CE practices.
Table 17.
Breakdown by sub-sector of those respondents rating their organisational maturity level as intermediate or advanced.
Table 17.
Breakdown by sub-sector of those respondents rating their organisational maturity level as intermediate or advanced.
| Sub-Sector | Sample Size | Number Responding Zero or Basic | Percentage Responding Zero or Basic | Number Responding Intermediate or Advanced | Percentage Responding Intermediate or Advanced |
|---|---|---|---|---|---|
| Advertising/Marketing | 0 | No Data | No Data | No Data | No Data |
| Architecture | 4 | 3 | 75% | 1 | 25% |
| Crafts | 1 | 0 | 0% | 1 | 100% |
| Design (Graphic, Product, Fashion) | 6 | 2 | 33% | 4 | 67%% |
| Film, TV, Video, Radio, and Photography | 6 | 2 | 33% | 4 | 67% |
| IT, Software and Computer Services (incl. Createch) | 5 | 4 | 80% | 1 | 20% |
| Music, Performing and Visual Arts (incl. Theatre and Dance) | 10 | 4 | 30% | 6 | 70% |
| Publishing | 0 | No Data | No Data | No Data | No Data |
| Other (Multi-Sector) | 2 | 0 | 0% | 2 | 50% |
| Total | 34 | 15 | 19 |
The analysis of the grey literature contains roughly equal volumes of conceptual and practical content. The survey shows that there is ambiguity over the understanding of the concept and definitions such as those contained in ISO59004, and this is discussed in the report [10]. However, the survey also contains information about the practical application of the 12R strategies by sub-sector (see Table 18).
The survey results are consistent with the analysis of the grey literature overall. Reduce, recycle and reuse have the highest representation across the sector. Remanufacture, refurbish, and regenerate strategies are less frequently reported (<25% in most sub-sectors), suggesting one or more of a lack of awareness, knowledge, expertise, applicability, or access to relevant infrastructure. Refuse and rethink also show low engagement, potentially showing challenges in upstream strategic design thinking or procurement-level decisions. For example, an advertising agency may find it economically unattractive to challenge a client brief or turn down work. Another way to look at this is that more technical or physical Rs (like recycle, reuse, reduce) dominate, while more abstract or upstream Rs (like rethink, refuse, redesign) are under-represented. From the comments in the survey, there is a perception that some Rs only apply to product-related sub-sectors (e.g., design, architecture), and some respondents replied certain Rs were not applicable to them.
Ignoring the lowest sample size sub-sectors, the strongest responses across the breadth of the 12Rs come from three sub-sectors: design; film, TV, video, radio, and photography, technology; and music, performing and visual arts. The relatively high percentages from the technology sub-sector across most of the 12Rs contrasts with earlier observations about priority and maturity. One interpretation is that respondents from this sub-sector are taking relevant actions but do not connect those actions to the overarching CE concept level.
Table 18.
Breakdown by sub-sector and R-strategy of ‘frequently applied’ or ‘common practice’ responses. Advertising and Publishing have not been included as there is no data.
Table 18.
Breakdown by sub-sector and R-strategy of ‘frequently applied’ or ‘common practice’ responses. Advertising and Publishing have not been included as there is no data.
| Sub-Sector | Number or percentage responding ‘frequently applied’ or ‘common practice’ | ||||||||||||
|---|---|---|---|---|---|---|---|---|---|---|---|---|---|
| Sample Size | Refuse | Rethink | Reduce | Reuse | Repair | Refurbish | Remanufacture | Repurpose | Recycle | Recover | Regenerate | Redesign | |
| Architecture | 4 | 1 | 1 | 2 | 2 | 1 | 1 | 1 | 1 | 2 | 1 | 0 | 1 |
| Architecture (%) | 25 | 25 | 50 | 50 | 25 | 25 | 25 | 25 | 50 | 25 | 0 | 25 | |
| Crafts | 1 | 0 | 1 | 0 | 0 | 0 | 1 | 1 | 0 | 1 | 1 | 0 | 1 |
| Crafts (%) | 0 | 100 | 0 | 0 | 0 | 100 | 100 | 0 | 100 | 100 | 0 | 100 | |
| Design (Graphic, Product, Fashion) | 5 | 3 | 1 | 3 | 2 | 2 | 0 | 2 | 2 | 2 | 2 | 1 | 3 |
| Design (Graphic, Product, Fashion) (%) | 60 | 20 | 60 | 40 | 40 | 0 | 40 | 40 | 40 | 40 | 20 | 60 | |
| Film, TV, Video, Radio, and Photography | 4 | 1 | 1 | 1 | 3 | 1 | 2 | 1 | 1 | 4 | 2 | 1 | 0 |
| Film, TV, Video, Radio, and Photography (%) | 25 | 25 | 25 | 75 | 25 | 50 | 25 | 25 | 100 | 50 | 25 | 0 | |
| IT, Software and Computer Services (incl. Createch) | 4 | 2 | 3 | 2 | 2 | 1 | 1 | 1 | 2 | 2 | 1 | 0 | 3 |
| IT, Software and Computer Services (incl. Createch) (%) | 50 | 75 | 50 | 50 | 25 | 25 | 25 | 50 | 50 | 25 | 0 | 75 | |
| Music, Performing and Visual Arts (incl. Theatre and Dance) | 8 | 5 | 5 | 3 | 7 | 6 | 3 | 3 | 5 | 7 | 2 | 0 | 2 |
| Music, Performing and Visual Arts (incl. Theatre and Dance) (%) | 63 | 63 | 38 | 88 | 75 | 38 | 38 | 63 | 88 | 25 | 0 | 25 | |
| Other (Multi-Sector) | 2 | 1 | 1 | 1 | 1 | 1 | 1 | 1 | 1 | 1 | 1 | 1 | 1 |
| Other (Multi-Sector) (%) | 50 | 50 | 50 | 50 | 50 | 50 | 50 | 50 | 50 | 50 | 50 | 50 | |
3.4.1. Applying the MLP Lens
At a landscape level, the respondents to the survey show an awareness of future international and regional policy and regulatory pressures, with a sense that broader systemic change is coming. However, there is little evidence that these pressures are currently shaping behaviour or incentives within the sector as a whole. Likewise, emerging horizontal standards (e.g. ISO 59004) are too recent to exert pressure and may be too generic.
Overall, the survey portrays organisations in the sector regime as fragmented in their approach to CE. There is uneven engagement with CE principles within and across sub-sectors, and for all sizes of organisation. Practical strategies are being applied, but focus mostly on concrete, familiar actions such as recycling, reuse, and reduction. It is implied that there is little regulatory pressure on the sector and few institutional structures that support CE transitions generally and specifically within the creative industries. Even the influence of guidance, standards, and tools originating from within the creative industries appears limited currently.
The open-ended responses in the survey provide an insight into niche-level activity. Responses highlight both the potential of niche CE innovations and the barriers to their adoption. Respondents shared examples of the reuse and repurposing of sets, props, and materials in film and television, and slow fashion models such as made-to-order production. Education and training for emerging creatives were seen as vital for embedding change from the ground up, while pan-industry collaboration, take-back schemes, and repair and refurbishment offer promising pathways for scaling circularity.
In contrast, respondents pointed to structural constraints such as time pressures in film, TV, and theatre production, the dominance of freelance and SME workers with limited resources, and the lack of infrastructure for reuse and recycling. Cost and quality concerns, alongside client and customer resistance, also make it difficult for niche innovations to scale.
3.5. Integrating the Four Research Strands with the MLP
The Multi-Level Perspective (MLP) provides a structured framework that helps to interpret the evidence presented across the literature review, national strategy analysis, grey literature dataset, and practitioner survey. Figure 7 provides an umbrella perspective on the findings using the MLP framework.
At the landscape level, the forces acting on the creative industries appear broadly consistent with those shaping other sectors. International agreements (e.g., the Paris Agreement, the UN SDGs, the European Circular Economy Action Plan) and wider debates on decarbonisation and resource scarcity provide the same external orientation as for manufacturing or agriculture. The academic literature emphasises that these forces are generally interpreted through a material lens, with relatively limited attention given to the digital infrastructures and data-intensive practices now central to the creative industries. Thus, while landscape drivers are not unique to the sector, their translation into relevant pressures for digital, cultural, and experiential production remains underdeveloped.
Evidence regarding the sector regime suggests inertia compared to other industries, but with some sub-sectors more advanced than others. The academic literature identifies stronger engagement with CE concepts in architecture, design, and fashion, where existing standards, metrics, and material innovation are already embedded in professional practice. However, digital-first sub-sectors such as advertising, games, and createch are weakly represented in the academic literature and national strategies, suggesting that regime-level rules, norms, and infrastructures in multiple sub-sectors remain largely unaltered. The grey literature reinforces this picture: of the curated snippets, the majority concern regime-level adjustments such as voluntary standards and sub-sector specific guidance (e.g., the Theatre Green Book, BAFTA albert). These sources may carry disproportionate influence because they often constitute the most practical and accessible reference points for practitioners in sub-sectors, but they lack the formal authority of legislation or international standards.
At the niche level, the academic literature and grey evidence highlight significant experimentation. Examples include regenerative and bio-based materials in fashion, virtual production in film and television, modular set design in theatre, and blockchain-enabled traceability. The grey literature captures these developments in greater volume and detail than peer-reviewed publications, suggesting that practice-led sources are currently the main record of innovation. However, both the academic literature and grey evidence agree that scaling remains limited, and policy support for incubation or acceleration is absent from most national strategies. With few exceptions, niche CE practices appear not to have challenged the way the sector operates so far in any substantive manner.
The survey evidence provides an additional perspective on the sector regime and niche levels by situating the findings in organisational contexts. Responses show that resource efficiency and waste reduction are common practices across sub-sectors, but that awareness of CE standards and preparedness for regulatory compliance remain low. The survey confirms the picture of uneven maturity: some sub-sectors apply a range of R-strategies without recognising them as part of a broader CE framework, while others identify the importance of circularity in principle but lack the capacity to act systematically. Although the small and UK-weighted sample limits generalisability, the survey illuminates how sector fragmentation and the predominance of freelancers and MSMEs shape regime stability and limit scaling of niche innovations.
4. Discussion
This discussion synthesises findings from four evidence strands: academic literature (2018–2024), national CE strategies (n=73 + 3 regional), grey literature text analytics (~4.8k curated snippets), and an exploratory online practitioner survey (n=80; uneven completion by sub-sector). The survey adds practitioner perspectives but, given small cell counts in several sub-sectors and high UK weighting, it cannot be read as statistically representative. Accordingly, wherever survey responses are cited, they are interpreted in triangulation with the policy, literature, and grey evidence bases. Together, these strands reveal: (i) a conceptually narrow and materially-oriented interpretation of the CE across the sector; (ii) a modest and fragmented uptake of the 12R strategies; (iii) limited policy recognition of the creative industries as a cohesive sector; and (iv) the need for stronger responses from the sector in the near future to address pressure for circularity from new policies, regulation, and standards; and (v) a lack of awareness of the CE impacts of digitalisation and AI, and the link to net zero targets and regulation.
4.1. Slow Response to Socio-Technical Changes in the Sector
Across the creative industries, CE practices are closely linked to broader socio-technical changes and climate change mitigation because material and energy use is directly tied to greenhouse gas emissions. Increased energy demand, particularly when met by fossil fuels, drives higher CO2 outputs, making decarbonisation inseparable from circularity. This makes the technology sub-sector’s relatively low maturity and limited prioritisation of CE particularly significant, as it overlooks the strong relationship between digital growth, rising energy demand, and associated emissions, all areas where circular strategies could play a critical role in mitigating climate impacts. However, these links are not always made explicit in sectoral discussions, with most sub-sectors focusing on waste reduction or recycling without fully recognising the climate implications of their technology choices.
While multiple national CE strategies identify the potential environmental harm from digitalisation in general (energy consumption, e-waste, and consumption of scarce materials), they do not extend their CE policies to include the digital flows of data, services, and content that are at the core of so much of the creative work performed today. Generative AI (Gen-AI) systems (text-to-image, music, code, 3-D assets) are diffusing across advertising, design, publishing, and screen media. The global generative AI for the creative industries market is forecast to jump to US$4.1bn (2025) at a 33% CAGR [67], and agencies such as WPP are already rebuilding their business models around these tools.
From this research, there is a growing awareness in the creative industries that digital flows are powered by energy-intensive infrastructure (data centres, networks), and that digital content can drive physical consumption. However, business leaders, creatives and technicians in the sector have been slow to recognise that commercial and aesthetic decisions create hidden “take-make-waste” linearities in seemingly virtual systems. For example, a decision to use virtual production in film/TV/game development to reduce costs replaces physical sets and long-haul shoots with LED panels, real-time game-engine rendering and remote collaboration. Pilot studies and industry carbon audits show potential emissions cuts of 20–50% per project [21], mainly by slashing travel and set waste, but such studies typically ignore the CE implications of the hardware involved in the production volume (media servers, LED walls, camera and lighting rigs, etc), much of which is subject to rapid obsolescence and replacement with the latest technology. While some large-scale second-life markets exist (e.g., for film cameras), often they are ad hoc and localised (e.g., selling or donating last-generation LED panels to further nearby education establishments).
Studies also warn of rising data centre energy loads that may overtake any reductions in emissions, and lifecycle claims of “dematerialisation” are no longer automatically synonymous with lower carbon footprints. A recent MIT study [20] highlights the sizeable and uneven carbon and water costs of training and using large generative models. Less well researched in the creative industries (and perhaps generally) are the CE implications of reuse, recycling, and repurposing of digital assets, large datasets, and AI models. For example, digital assets created for a particular game may be reused in other games, advertising shoots, and in film production.
4.2. Fragmented Approach to CE in the Creative Industries
The authors’ experience and prior research into other sustainability topics in the creative industries has consistently revealed fragmented approaches [10,68]. Evidence from across the research strands shows that circularity in the creative industries is also being adopted in a fragmented and incremental manner in terms of policy coverage, terminology, sub-sectors, and geographies (initiatives originating in Europe and the UK are at the fore).
The variety of approaches described in the academic and grey literature is an illustration of the fragmentation in the sector around the CE. While there are multiple examples of small-scale, practical, material-focussed actions such as recycling, reuse, and waste reduction for individual sub-sectors, it is difficult to locate any broad-based initiatives aimed at transforming the entire sector.
There is little evidence of a universal set of drivers for circularity in the creative industries, or a dominant approach to a circular transition across the sector. Rather than a coordinated shift across the sector, change appears to be happening incrementally through isolated initiatives and sub-sector specific adaptations, most commonly in the parts of the sector that are more material intensive (such as design, architecture, and fashion). Even where there is an obvious need for a common or shared CE solution, initiatives in one sub-sector rarely extend to adjacent sub-sectors. For example, set storage schemes in theatre rarely extend to adjacent sub-sectors such as film.
Of course, it is possible that there may be less fragmentation of approach than the evidence suggests and as one survey participant wrote “the sector is learning about the circular economy and mostly embracing it”, although this research suggests that the sector has only recently recognised the relevance of the CE concept, and that widespread action is yet to happen. Also, there may be greater commonality between sub-sectors, but it is being masked by language choices and a lack of an accepted definition for CE in the creative industries. For example, survey respondents from technology-dependent or digital-first organisations scored the importance of the CE (as a concept) lower than others yet also said they are currently applying a range of R strategies in practice (e.g., data/energy optimisation, server repurposing or reuse). Likewise, in the grey literature, discussions of virtual production, data centres, and streaming footprints are seldom framed explicitly as circular.
National CE strategies are one place where a more orchestrated approach to the CE in the creative industries could potentially be documented. However, as this research shows, that is not yet happening in most cases, and even where the creative industries are included, there is a lack of substantive content. Scarcity of sector-wide research and a lack of coordinated action between sub-sectors led by industry incumbents may also contribute to national CE strategies overlooking the creative industries as a sector. For example, in the UK, the creative industries have been identified as one of eight key sectors in the government’s Industrial Strategy, but the creative industries sector is not one of the six sectors within England’s CE taskforce.
Taken together, this triangulation raises an interesting question: is a unified approach to the creative industries at a national level likely to be successful, or is it more effective to exploit commonality within sub-sectors (even between competitors) and the overlaps between sub-sectors around specific CE actions?
4.3. Gap in Knowledge Beyond Material Sub-Sectors
There is a marked knowledge gap concerning how CE principles apply to less material-intensive sub-sectors in the creative industries, particularly those increasingly shaped by digital production, platform-based or digital-first business models, and intangible assets. The environmental impacts of digitalisation are often indirect (Scope 3), distributed, or embedded within extended value chains, making them harder to identify, quantify, and govern. Moreover, these impacts are often treated as external to the sector and attributed to adjacent industries such as technology services or electronics manufacturing. As a result, CE policies and research tend to default to a material-first logic, focusing on resource efficiency, waste management (e.g., textiles), and the lifecycles of physical products.
The literature occasionally references these less material-intensive sub-sectors and their digital-first organisations in broader discussions of Industry 4.0, information and communication technology (ICT) infrastructure (such as data centres), or the environmental footprint of digital streaming. However, relatively few studies engage with the specific circular strategies relevant to these sub-sectors or the ongoing digital transformation of all sub-sectors of the creative industries.
In contrast, sub-sectors like design, fashion, and architecture are not only more visible in the literature but are also more likely to be covered by existing and emerging regulation and standards, reinforcing the current material-first logic in policymaking and research. This material-first logic treats circularity primarily as a question of managing materials, rather than integrating broader dimensions such as the energy use and carbon emissions associated with the use of technology.
This knowledge gap regarding the digital transformation of the sector has significant implications both for practitioners within the creative industries and for policymakers shaping future CE strategies. Particularly in the case of increasingly digital-first sub-sectors like film, advertising, and gaming, the absence of a robust understanding of how circularity applies to digitalisation limits the ability to make informed policy or business decisions regarding the CE.
Without a more inclusive and digitally literate conception of circularity, less material-intensive sub- sectors may remain marginalised in policymaking and research.
4.4. Changes in the Compliance Environment Anticipated
The review of national strategies shows that, to date, the creative industries have only been targeted directly for CE regulation in a limited number of sub-sectors (e.g., architecture and some aspects of product design). However, a growing body of policy and legislation is emerging from the European Commission that specifically targets the fashion sub-sector. Existing and near-future policy instruments are instead applied to sectors such as agriculture, automotive, food, construction, and textiles. Instead, practitioners in multiple sub-sectors voluntarily comply with industry frameworks (e.g., the Theatre Green Book) and standards (e.g., the BAFTA albert Studio Sustainability Standard) rather than legally binding regulations. This is reflected in the survey findings, where respondents do not view regulation as an enabler or driver for their CE actions currently.
When asked about future drivers for circularity, however, survey respondents widely anticipate the introduction of regulatory compliance measures across the sector. This will be a significant change for most sub-sectors, and they appear ill-prepared. Despite government policy being identified as the most influential future driver across most sub-sectors, respondents showed only low-to-moderate awareness of existing CE regulations, and most were unaware of current and forthcoming standards that support those regulations.
One reason for the lack of preparedness is that creative industries possess limited clarity regarding the scope, timeline, or relevance of regulations to their specific domains as they have not been engaged with the development or shaping (or had to prepare or comply with) current or upcoming regulations (e.g., eco-design frameworks, digital product passports) or standards. (e.g., the horizontal standards such as ISO 59004). Based on qualitative comments from survey respondents and grey literature sources, the sector is detecting the signs of a shift in the policy environment indirectly (e.g., via the media, self-study, consultant reports, blogs).
Regulatory compliance may prove challenging for the sector if it does not engage in the development process. Historically, the freelancers and micro-businesses that make up the bulk of the sector have been unwilling or unable to engage in creating policy, regulations, and standards. Similarly, compliance with regulations and standards is an administrative strain on smaller organisations and, in many cases, counter cultural.
4.5. Niche Innovations Face a Scaling Challenge
While the academic and grey literature highlights a wide range of niche innovations emerging across the creative industries such as modular theatre set design, shared reuse depots for film and live events, virtual production tools, bio-based and regenerative materials [65], digital product passports, and secondary markets for creative assets, these practices largely remain experimental, localised, and uncoordinated. Their presence in specific sub-sectors signals creative energy and technical possibility, but their scaling and mainstreaming remains limited.
This scaling challenge reflects a broader dynamic observed in many sectors: niche innovations require targeted support to move beyond early adopters in specific sub-sectors and disrupt the dominant sector regime to precipitate a wider circularity transition. In the context of the creative industries, this scaling process is complex due to sectoral fragmentation, project-based work, and limited capital in many MSMEs. Without support from governments, private sources of finance, and large organisations, promising CE innovations risk being stranded as one-off experiments rather than becoming integrated into industry practices.
Government support is critical in bridging this gap. Yet few national CE strategies explicitly refer to the creative industries (four countries e out of the 73 national strategies examined), let alone establish mechanisms to scale niche innovations within them. Where references exist, they tend to focus narrowly on material flows (e.g., blockchains for tracking textile waste), and do not address the wider ecosystem of knowledge exchange, infrastructure access, or regulatory incentives needed to accelerate uptake. A more enabling policy environment could include dedicated funding for experimentation, procurement incentives, cross-sector partnerships, and integration with broader industrial strategy, particularly in geographies with strong creative clusters.
At the same time, larger companies in the creative industries (e.g., those that buy media, commission TV, or manage fashion brands) also have a key role to play in scaling innovation through their procurement power, supply chain reach, and visibility. By adopting and promoting circular practices (e.g., standardising reuse systems, investing in regenerative materials, or mandating circularity from suppliers), these firms can legitimise and normalise niche approaches, creating downstream demand and reducing the risk for smaller players to follow suit. Larger firms are also better positioned to invest in data infrastructure, certification, and compliance, which will be essential as circularity becomes increasingly embedded in policy (e.g., through eco-design requirements or digital product passports).
In summary, while niche innovations in circularity are visible and diverse across the creative industries, their potential will remain under-realised without deliberate government intervention and leadership from dominant industry actors. Coordinated action is needed to move from one-off experiments to widespread change across sub-sectors or the entire sector.
4.6. Normative Tensions for the Sector
The grey literature shows that there is a strong relationship between the current CE narrative in the creative industries and the goals of the UN SDGs e.g., SDG 12 (Responsible Consumption and Production) is commonly cited. More broadly, the creative industries tend to emphasise values such as diversity, participation, and community engagement, which resonate strongly with the social goals of the SDGs (e.g., reducing inequalities, ensuring decent work, and fostering inclusive growth). Hence, there is a recognisable alignment between the sector social norms, the SDGs, and the CE.
With the growing influence of technology companies in the sector, however, a different narrative is emerging based on the norms of those organisations that prioritise market-led solutions, digital innovation, and scale. This suggests that the transition from linear to circular models in the creative industries will be shaped as much by two competing narratives as by technical or organisational change. For organisations in the sector, the tension between these narratives creates a macro-level dilemma, especially for MSMEs, who may be expected to align with policies that they lack the resources to adopt (or consider counter to their values), while also being called upon to contribute to broader social and environmental goals.
The market-led narrative primarily benefits large, well-capitalised organisations that can pursue the incorporating of circularity into organisational process and products while scaling digital platforms, monetising data, and capturing investment through financial markets. These organisations are best positioned to respond to national CE strategies that emphasise market mechanisms, innovation, and technological solutions, while freelancers and MSMEs may struggle to access the same opportunities or influence. While this narrative promotes innovations like digital product passports, blockchain traceability, and virtual production, this may be at the expense of labour practices and employment, perceived cultural value (e.g., generative AI vs human artist), and social equity. It risks marginalising low-technology, place-based, or community-driven CE innovations that do not scale easily or generate market returns.
No national CE strategy wholly favours one narrative or the other and the SDG-framed, people-centred elements of national CE strategies provide some level of balance through inclusive CE transitions that prioritise just labour practices, equitable participation, and community-level change. This may help ensure that the benefits of circularity are more widely distributed rather than concentrated among large organisations. This resonates more strongly with the values of many in the creative industries and challenges the assumption that technological innovation alone can deliver circularity by drawing attention to behaviour change, education, and the social dimensions of creative production and outputs. The literature of ecological modernisation contains warnings about overreliance on technology and markets to deliver sustainability goals [69,70].
4.7. A System Approach is Important
Currently, there is little evidence of system level change at the sector or sub-sector level in the creative industries. There are, however, signs across the research strands suggesting that the creative industries are now starting to incrementally reconfigure some aspects of how the sector regime operates to embrace CE principles, at least in a selection of sub-sectors. For example, selective circular practices are being bolted onto existing production models (e.g., setting up of reuse schemes, material swap libraries, adding virtual production volumes to existing studios), rather than wholesale system replacement.
Also, various technologies are transforming the sector, altering value chains and skill sets across the sector regime. However, this is happening without a full understanding of the system level impacts and implications for the CE. For example, some technology niche innovations are creating new environmental hotspots because of e-waste, energy consumptions, and water table depletion from cooling AI data centres.
Using the current incremental approach, it is unclear from this research how far and fast the CE in the sector will progress. Current approaches lack systems-thinking. Simply addressing incremental material efficiencies misses the way technologies, user practices, company cultures, audience preferences, national infrastructures, regulations, and standards need to co-evolve to deliver circular transitions even in individual parts of the creative industries. For example, the virtual production studio or the generative AI visual effects pipeline only becomes circular when:
- Power grids decarbonise;
- Data centre shells and mechanical, electrical and plumbing (MEP) services are designed for disassembly. reuse, and eventual material reclamation (steel, aluminium, copper, concrete aggregates);
- Data centres divert their construction waste from landfill, reuse waste heat, use closed loop water or adiabatic cooling, and operate high volume hardware loops (i.e. repair, refurbish, and recycle servers and storage);
- Creatives shift their aesthetics and storytelling practices to embody CE principles;
- Technicians implement and maintain modular, repairable systems;
- Media servers and LED walls are designed for modular refurbishment;
- Asset libraries adopt open metadata standards for reuse/remix;
- Contractual, IP, and labour rules reward reuse rather than overproduction;
- Audiences value lower-impact digital experiences and circular narratives.
The CE debate in the creative industries is recent yet risks stalling if it treats circularity as a matter of greener props and costumes alone.
5. Limitations and Areas for Future Research
This study triangulates evidence from academic literature, national CE strategies, grey literature, and an exploratory online survey to assess how CE principles are interpreted and applied within the creative industries. While this multi-strand approach offers a rich, layered picture of the current landscape, several limitations remain.
5.1. Evidence Coverage and Representativeness
The online survey, while valuable for practitioner insight, had a modest overall response rate and uneven sub-sector representation. Music, performing and visual arts (including theatre) were relatively well represented, while others - particularly advertising, publishing, gaming, and live performance - had few responses. As such, findings drawn from the survey should be interpreted as indicative rather than generalisable. Further studies with larger, stratified samples and sector-specific follow-ups would strengthen empirical confidence.
5.2. Bibliometric and Conceptual Mapping Gaps
Although the literature review was broad and thematically structured, bibliometric analysis of CE-related research in creative sub-sectors was constrained by lack of access to full citation and reference data (e.g., via SCOPUS). This limited the ability to model co-authorship, citation networks, and topic evolution over time. Future research should incorporate database-level citation analytics and semantic clustering to map the conceptual contours of the CE in the creative industries more systematically.
5.3. Policy Text Scope and Language Limitations
The review of national CE strategies was limited to publicly available national government documents published in English (or accompanied by official translations) or where the quality of machine translation was considered acceptable. Where machine translation was used, this may have excluded important nuances or details.
By focusing on national strategies, documents at a city level will not have been captured.
Also, expanding the dataset to include national cultural policies (e.g., such as that produced by the French Ministry of Culture) would improve the completeness of the policy analysis.
5.4. Practitioner Perspectives on Niche Innovation
The online survey did not ask specific questions about niche innovations. A further survey or interview-based study could explore this important area more thoroughly.
5.5. CE Implications of Technology
This research identified knowledge gaps related to the growing use of various technologies in the sector. This area remains under-theorised in research and is not yet visible in policy. Future work should explore how CE frameworks apply to intangible assets, digital workflows, and dematerialised value chains in multiple sub-sectors, including lifecycle thinking for data, cloud infrastructure, and digital assets.
A key need is for research to develop a new scalar that redefines the sector as a spectrum from fully material to fully dematerialised (and mixtures), integrating the emergence of digital production and distribution in the creative industries as an important aspect of circularity (e.g., data centres, cloud platforms).
6. Conclusions
This paper has provided a reality check on the role of the creative industries in CE transitions. The evidence shows a sector that frequently makes sustainability and circularity claims in marketing and strategy documents, but where concrete practices remain fragmented, incremental, and uneven across sub-sectors. Using the MLP lens clarifies this mismatch. At the landscape level, the creative industries have the same global pressures as other sectors: climate policy, resource scarcity, and rapid digitalisation. Yet these drivers have not been translated into targeted national strategies for the sector, and at the regime level, entrenched practices, institutional norms, and fragmented structures mean adaptation is slow and partial. The most dynamic activity remains at the niche level, where experimentation with regenerative materials, modular set design, virtual production, and reuse platforms demonstrates potential but lacks pathways for scaling. Without deliberate support, these niches risk remaining isolated rather than reshaping the sector. Scaling requires mechanisms that bridge the gap between niche creativity and mainstream adoption: policy incentives, procurement frameworks, and investment in infrastructures that allow MSMEs and freelancers to participate. Only through such support can niche practices accumulate momentum, destabilise linear practices, and eventually change the way the sector operates.
The impact of technology on the sector regime has significant practical implications for CE policymakers and businesses. As stated in the introduction, many organisations in the creative industries now operate across both material and digital domains, combining physical assets (e.g., sets, props, equipment) with data-intensive production and distribution systems (e.g., streamed media). As such, there is a need for policymakers and business leaders alike to reconcile the CE interdependencies between material and digital practices, as well as linkages to net zero goals, when developing national CE strategies and business plans.
However, the research findings show that the circular transition within the creative industries is in its earliest stages, with few ‘hard’ drivers such as regulation. While there is a growing body of relevant academic literature, emerging policy statements, and examples of niche innovations, developments have not yet coalesced into a coordinated or systemic shift. Instead, CE-related activity remains fragmented, piecemeal, and clustered around a limited number of organisations and a few sub-sectors (fashion, product design, and architecture). The immaturity of CE in the sector can also be seen in how the 12R strategies are deployed. Downstream, tangible actions (e.g. recycling, reuse of costumes and sets, modular set design) are prioritised, while upstream and systemic strategies are rarely discussed or implemented. In practice, there are many knowledge gaps that need academic-industry collaborations to close.
This immaturity in the sector is matched by the absence of the creative industries in current national CE strategies. This represents a significant oversight, particularly given the socio-technological changes underway and the need to scale niche CE innovations. Also, this omission underplays the capacity of the creative industries to shape CE narratives, influence consumer values, and promote sustainable lifestyles at a national level. Including the creative industries in national strategies requires policymakers and business leaders to connect and develop a shared understanding of CE needs and priorities for all stakeholders. Practical steps to update national CE strategies include:
- Recognising and addressing digital resource flows i.e. explicitly including data centres, digital production pipelines, and creative technology hardware (e.g., servers, media servers, LED volumes, and consumer devices) as part of CE strategies. This could involve extending eco-design and Extended Producer Responsibility (EPR) frameworks to cover creative technology equipment and supporting sector-specific metrics and tools to measure energy, e-waste, and resource intensity of digital creative production;
- Creating targeted support for scaling niche innovations. Policymakers could establish funding streams or procurement incentives that reward circular practices in creative contracts and public cultural investment, support cross-sector reuse infrastructures (e.g., shared set, costume, and prop banks for theatre and film, or reuse depots for creative MSMEs), and encourage national R&D programmes that connect creative MSMEs with universities to incubate and scale CE innovations;
- Supporting sector-specific standards and capacity-building. Policymakers could co-develop creative industry–specific guidance documents that translate horizontal CE standards into sector-relevant language and case studies. They could also assist current industry frameworks (e.g., Theatre Green Book, BAFTA albert) to evolve into formalised, recognised standards that can be embedded into national CE strategies and regulations. Policymakers could also fund training and capacity-building programmes for freelancers and MSMEs in areas like CE compliance. Similarly, standards bodies need to embrace the CE for the verticals in the creative industries, as well as more generally for the sector. This is already starting to happen in fashion, but not elsewhere.
An important consideration for researchers and policymakers is the fragmented nature of the sector. From a CE perspective, the sub-sectors of the creative industries may not be a unified sector in the conventional sense. Rather, the creative industries are better understood by treating the sector regime as a set of overlapping and interdependent ecosystems [71], each with many shared opportunities to adopt circular principles. For example, advertising, marketing, film and TV production all share studio spaces, hire costumes from the same suppliers etc. Importantly, these different ecosystems can also be characterised by the strength of the external drivers, such as CE regulatory and standards environments (high in the ecosystems around architecture and product design activities, low for film and TV).
In conclusion, the CE potential of the creative industries remains largely untapped and requires stronger policy recognition, alongside targeted research to support and scale emerging circular practices across the diverse sub-sectors.
Author Contributions
Conceptualisation, T.D. and M.C.; formal analysis, T.D.; investigation, T.D.; writing—original draft preparation, T.D.; writing—review and editing, M.C.; software, T.D.; visualisation, T.D. All authors have read and agreed to the published version of the manuscript.
Funding
Funding for this project is from the Research England Strategic Priorities Fund. Research England is part of UK Research and Innovation, a public body funded by the UK government.
Data Availability Statement
All data used for this communication are within the document. Additionally, additional raw data from the grey literature analysis is available at DOI 10.6084/m9.figshare.29958620.
Conflicts of Interest
The authors declare that the research was conducted in the absence of any commercial or financial relationships that could be construed as a potential conflict of interest.
Abbreviations
The following abbreviations are used in this manuscript:
| BAFTA | British Academy of Film and Television Arts |
| CE | regime |
| EMF | Ellen MacArthur Foundation |
| EPR | Extended Producer Responsibility |
| e-waste | Electronic waste |
| ICT | Information and communication technology |
| MLP | Multi-Level Perspective |
| UN SDGs | United Nations Sustainable Development Goals |
Appendix A
Figure A1 provides additional detail on the data pipeline used to process the grey literature in Strand 3 of the research method.
Figure A1.
End-to-end workflow for analysing the grey literature, showing the different applications used.
Figure A1.
End-to-end workflow for analysing the grey literature, showing the different applications used.
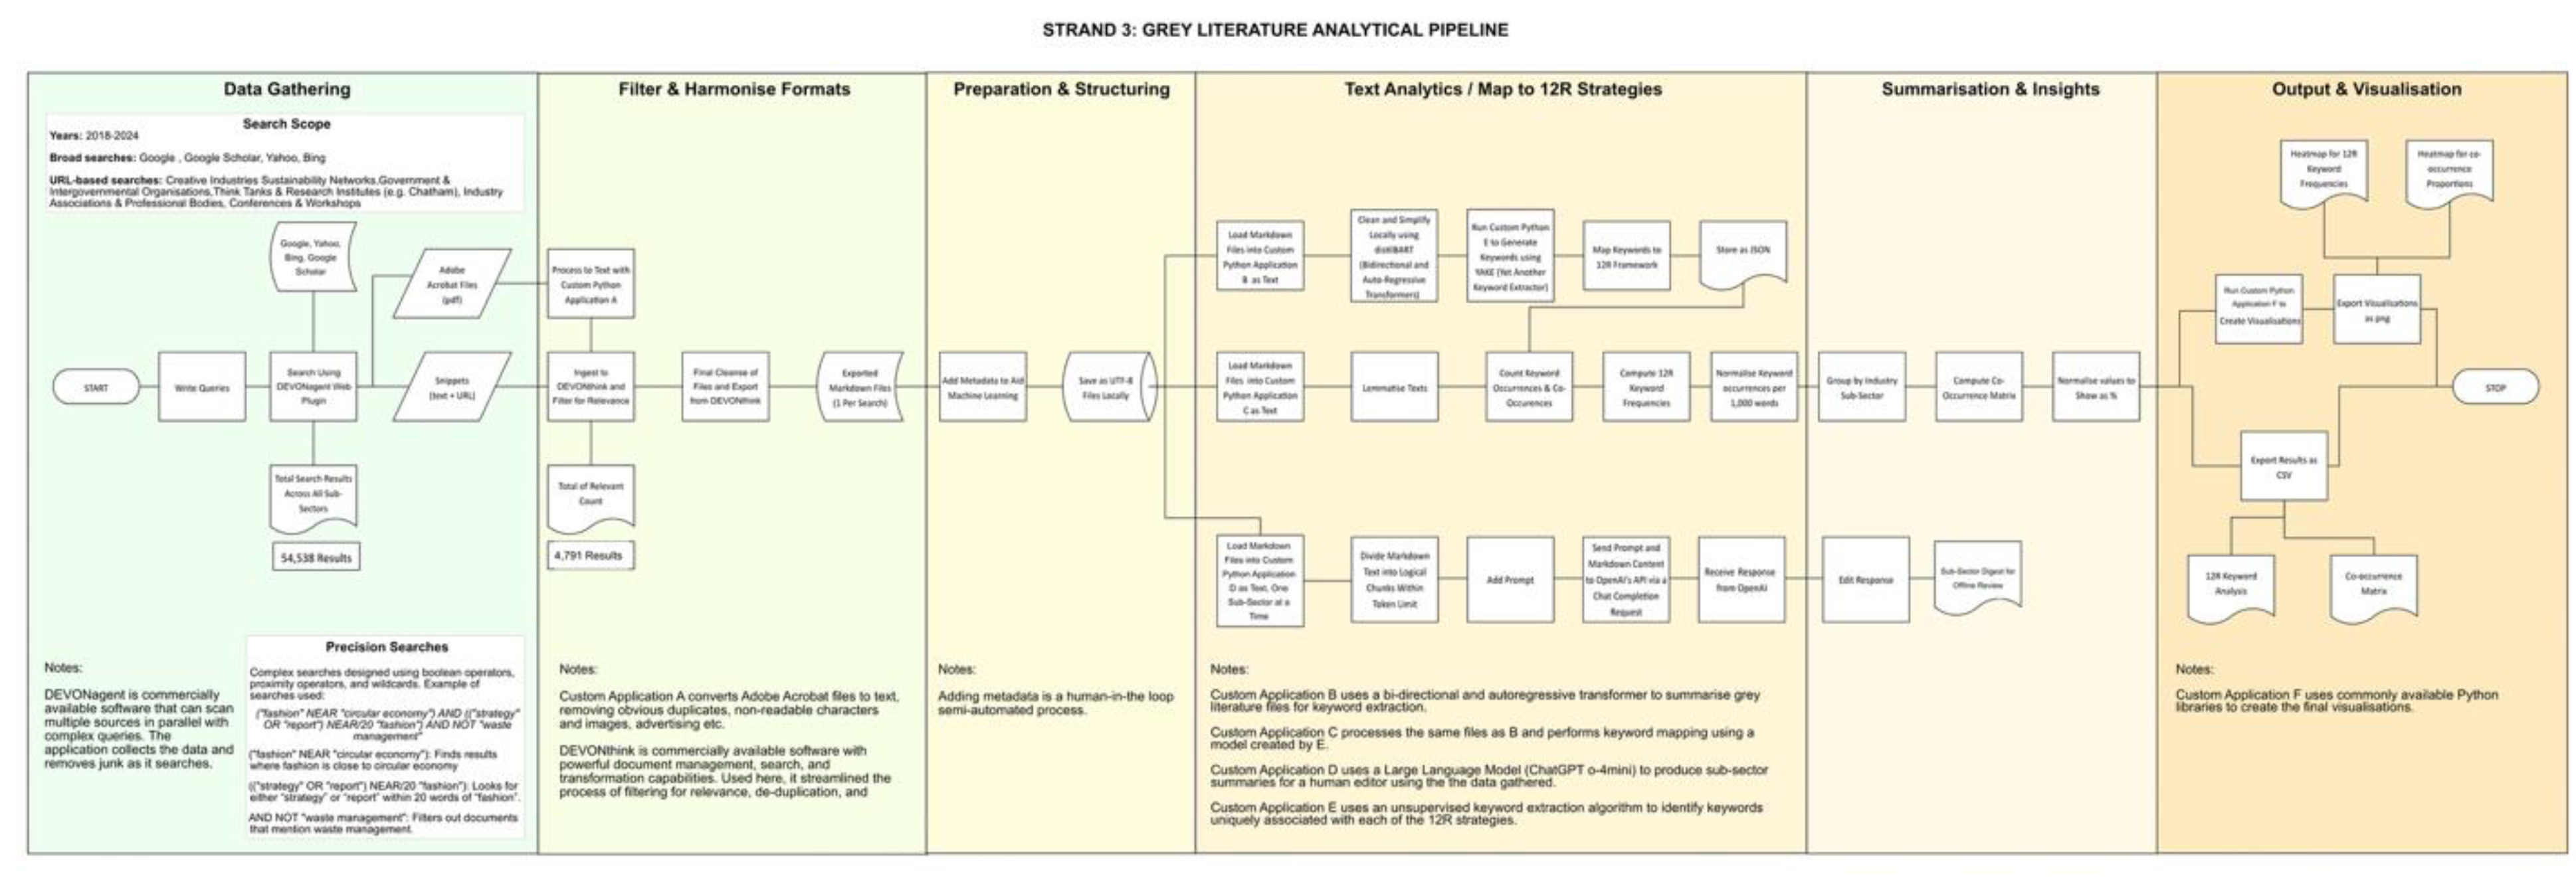
Appendix B
The aim of the survey was to solicit input from practitioners active in the creative industries i.e., those identifying as consultants, academics etc. were screened out by the questions shown in Table B1. 80 people responded to the survey, 13 dropping out at this screening question (possibly because they realised this survey was not aimed at them).
Table B1.
What is your main relationship to the Creative Industries?
| Answer Choice | Responses | Count |
|---|---|---|
| I work in one or more of the sub-sectors of the Creative Industries | 62.7% | 42 |
| I am a consultant working with the Creative Industries | 14.9% | 10 |
| I am an educator | 13.4% | 9 |
| I am a supplier to one or more of the sub-sectors of the Creative Industries | 4.5% | 3 |
| I am a policy maker focused on the Creative Industries | 1.5% | 1 |
| I am a postgraduate or academic studying the Creative Industries | 1.5% | 1 |
| I am a student in vocational or higher education | 1.5% | 1 |
| Total | 67 |
In the next screening step, one person dropped out, leaving 41 participants working in the creative industries to form the basis of the analysis in this paper (see Table B2).
Table B2.
What is your role?
| Answer Choice | Responses | Count |
|---|---|---|
| Creative/Designer/Artist/Maker | 29.3% | 12 |
| Manager/Producer/Director | 26.8% | 11 |
| Senior Manager/Organisation leader | 26.8% | 11 |
| Sustainability Lead/Officer | 14.6% | 6 |
| Technician/Craftsperson | 2.4% | 1 |
| Other (please specify) | 0.0% | 0 |
Table B3.
What is the size of your organisation?
| Answer Choice | Responses | Count |
|---|---|---|
| Freelancer / Self-employed | 26.8% | 11 |
| Micro (<10 employees) | 51.2% | 21 |
| Small (10–49 employees) | 9.8% | 4 |
| Medium (50–249 employees) | 4.9% | 2 |
| Large (250+ employees) | 7.3% | 3 |
| Total | 41 |
Table B3 shows the size of the organisations represented in the 41 responses.
Based on these tables, the authors conclude that recruitment for the survey was a good fit with the design criteria for the survey.
References
- Kirchherr, J.; Hartley, K. , Is circular economy a failing sustainability paradigm? Not necessarily. Journal of Industrial Ecology 2025, 29(4), 1051–1059. [Google Scholar] [CrossRef]
- EU strategy for sustainable and circular textiles; European Commission, Directorate-General for Environment: 2023.
- Bokor, K., Unlocking the potential of the creative economy for resilience and sustainable development: Short course for Permanent Missions in Geneva. In Geneva, 2023.
- Reike, D.; Vermeulen, W. J. V.; Witjes, S., Conceptualization of Circular Economy 3.0: Synthesizing the 10R Hierarchy of Value Retention Options. In Towards a Circular Economy: Transdisciplinary Approach for Business, Alvarez-Risco, A.; Rosen, M. A.; Del-Aguila-Arcentales, S., Eds. Springer International Publishing: Cham, 2022; pp 47–69.
- Fornasari, T.; Paolo, N. , A Model for the Transition to the Circular Economy: The “R” Framework. Symphonya. Emerging Issues in Management 2022, 78–91. [Google Scholar] [CrossRef]
- Alcalde-Calonge, A.; Sáez-Martínez, F. J.; Ruiz-Palomino, P. , Evolution of research on circular economy and related trends and topics. A thirteen-year review. Ecological Informatics 2022, 70, 101716. [Google Scholar] [CrossRef]
- Geissdoerfer, M.; Savaget, P.; Bocken, N. M. P.; Hultink, E. J. , The Circular Economy – A new sustainability paradigm? Journal of Cleaner Production 2017, 143, 757–768. [Google Scholar] [CrossRef]
- Kirchherr, J.; Reike, D.; Hekkert, M. , Conceptualizing the circular economy: An analysis of 114 definitions. Resources, conservation and recycling 2017, 127, 221–232. [Google Scholar] [CrossRef]
- ISO 59004:2024 Circular Economy - Framework and Principles for Implementation; International Organization for Standardization: Geneva, Switzerland, 2024.
- Davis, T.; Charter, M. The Circular Economy in the Creative Industries: Progress, Challenges, and Hard Truths; The Centre for Sustainable Design, University for the Creative Arts: Farnham, England, 2025. [Google Scholar]
- Charter, M.; Davis, T. Createch in the UK: Sustainability Policy Linkages and Company Activity; University for the Creative Arts: Farnham, UK, July 2022, 2022. [Google Scholar]
- Hitchen, G.; Ekmekcioglu, E.; Ozcinar, C. Mapping the Virtual Production Eco-System; Loughborough University London, 2022. [Google Scholar]
- Swords, J.; Willment, N. , ‘It used to be fix-it in post production! now it’s fix-it in pre-production’: how virtual production is changing production networks in film and television. Creative Industries Journal 2024, 1–17. [Google Scholar] [CrossRef]
- von Kolpinski, C.; Kratzer, J. , Zooming Out: Circular Economy Development in the European Union and its Implications on the Economy and Society. Circular Economy 2024, 2(4). [Google Scholar] [CrossRef]
- Akarsu, T. N. , From polyester to pixels: Will virtual fashion drive sustainability and digital innovation? Journal of Information Technology Teaching Cases 2025, 0(0), 20438869251325261. [Google Scholar] [CrossRef]
- Bocken, N. M. P.; De Pauw, I.; Bakker, C.; Van Der Grinten, B. , Product design and business model strategies for a circular economy. Journal of industrial and production engineering 2016, 33(5), 308–320. [Google Scholar] [CrossRef]
- Bocken, N. M. P.; Shirahada, K. , Circular business models in Japan: Analysis of circular business transformation through an institutional approach. Sustainable Production and Consumption 2025, 54, 389–403. [Google Scholar] [CrossRef]
- Centobelli, P.; Cerchione, R.; Chiaroni, D.; Del Vecchio, P.; Urbinati, A. , Designing business models in circular economy: A systematic literature review and research agenda. Business Strategy and the Environment 2020, 29(4), 1734–1749. [Google Scholar] [CrossRef]
- Ptach, D. I.; Andrews, D.; Philbin, S. P., Sustainable Development Goals, Circularity and the Data Centre Industry: A Review of Real-world Challenges in a Rapidly Expanding Sector. In Issues in Environmental Science and Technology, Ghosh, S. K.; Eduljee, G., Eds. Royal Society of Chemistry (RSC): 2023; Vol. 51, pp 252–285.
- Bashir, N.; Donti, P.; Cuff, J.; Sroka, S.; Ilic, M.; Sze, V.; Delimitrou, C.; Olivetti, E. , The Climate and Sustainability Implications of Generative AI. An MIT Exploration of Generative AI 2024. [Google Scholar] [CrossRef]
- Keeney, D. Virtual Production’s Role in Carbon Reduction and Net Zero Production in the Screen Industries; Ulster University, 2023. [Google Scholar]
- Tarnovskaya, E.; Williams, V.; Hitchen, G. Sustainability Impacts of Convergent Technologies in the UK Creative Industries; CoSTAR The UK Network for Creative Technology: UK, 2025. [Google Scholar]
- de Vries, A. , The growing energy footprint of artificial intelligence. Joule 2023, 7(10), 2191–2194. [Google Scholar] [CrossRef]
- Measuring the environmental impacts of artificial intelligence compute and applications; OECD (Organisation for Economic Co-operation and Development): 2022.
- Schröder, P.; Charter, M.; Barrie, J. , Circularity of Semiconductor Chip Value Chains: Advancing AI Sustainability Amid Geopolitical Tensions. Journal of Circular Economy 2025, 2(2). [Google Scholar] [CrossRef]
- French, C.; Charter, M. Creative industries: sustainability networks; The University for the Creative Arts: Franham, United Kingdom, 2024. [Google Scholar]
- Zupic, I.; Čater, T. , Bibliometric Methods in Management and Organization. Organizational Research Methods 2015, 18(3), 429–472. [Google Scholar] [CrossRef]
- Barrie, J. S., Ilmi; Schroder, P; Stucki, J National Circular Economy Roadmaps: A Global Stocktake for 2024; UNIDO – United Nations Industrial Development Organization Circular Economy and Resource Efficiency Unit: Vienna, Austria, 2024.
- Policies | circulareconomy.earth. https://circulareconomy.earth/ (January 7, 2025),.
- Campos, R.; Mangaravite, V.; Pasquali, A.; Jorge, A.; Nunes, C.; Jatowt, A. , YAKE! Keyword extraction from single documents using multiple local features. Information Sciences 2020, 509, 257–289. [Google Scholar] [CrossRef]
- Sanh, V.; Debut, L.; Chaumond, J.; Wolf, T. , DistilBERT, a distilled version of BERT: smaller, faster, cheaper and lighter. ArXiv 2019, arXiv:1910.01108. [Google Scholar] [CrossRef]
- Geels, F., The Multi-Level Perspective on Sustainability Transitions: Background, overview, and current research topics. In Introduction to Sustainability Transitions Research, Wesche, J.; Hendriks, A., Eds. Cambridge University Press: Cambridge, UK, 2024.
- Frameworks for understanding transformations to sustainability - the ‘Multi-Level Perspective’ in socio-technical transitions research; International Science Council: October, 2019, 2019.
- Korhonen, J.; Honkasalo, A.; Seppälä, J. , Circular Economy: The Concept and its Limitations. Ecological Economics 2018, 143, 37–46. [Google Scholar] [CrossRef]
- Schroeder, P.; Anggraeni, K.; Weber, U. , The Relevance of Circular Economy Practices to the Sustainable Development Goals. Journal of Industrial Ecology 2019, 23(1), 77–95. [Google Scholar] [CrossRef]
- Blei, D. M.; Ng, A. Y.; Jordan, M. I., Latent Dirichlet Allocation. In Advances in Neural Information Processing Systems 14: Proceedings of the 2001 Conference, Dietterich, T. G.; Becker, S.; Ghahramani, Z., Eds. The MIT Press: 2002; p 0.
- Dokter, G.; Thuvander, L.; Rahe, U. , How circular is current design practice? Investigating perspectives across industrial design and architecture in the transition towards a circular economy. Sustainable Production and Consumption 2021, 26, 692–708. [Google Scholar] [CrossRef]
- Franconi, A.; Badalucco, L.; Peck, D.; Nasr, N. , A multi-hierarchical “Design for X” framework for accelerating circular economy. Sustainability 2019, 14(15), 9298. [Google Scholar] [CrossRef]
- Kjær, L. L.; Pigosso, D. C. A.; Niero, M.; Bech, N. M.; McAloone, T. C. , Product/Service-Systems for a Circular Economy: The Route to Decoupling Economic Growth from Resource Consumption? Journal of Industrial Ecology 2018, 23(1), 22–35. [Google Scholar] [CrossRef]
- Casciani, D.; D'Itria, E. , Fostering Directions for Digital Technology Adoption in Sustainable and Circular Fashion: Toward the Circular Fashion-Tech Lab. Systems 2024, 12(6), 190. [Google Scholar] [CrossRef]
- Keena, N.; Friedman, A.; Parsaee, M.; Klein, A., Data visualization for a circular economy: Designing a web application for sustainable housing. Technology|Architecture + Design 2023, 7(2), 262–281. [CrossRef]
- Ostermann, C.; Nascimento, L.; Zen, A. , Business model innovation for circular economy in fashion industry: a startups' perspective. Frontiers in Sustainability 2021, 2. [Google Scholar] [CrossRef]
- Paru, S. , Innovations in Sustainable and Smart Textiles: A Comprehensive Study of Fashionable Textile Technologies and Trends. Oleoscience 2023, 21(9), 361–368. [Google Scholar] [CrossRef]
- Seidu, R.; Eghan, B.; Acquaye, R. , A review of circular fashion and bio-based materials in the fashion industry. Circular Economy and Sustainability 2024, 4(1), 693–715. [Google Scholar] [CrossRef]
- Calaza, M.; Casal, C. V.; … Second-hand selling apps and the notion of luxury: trend networking and circular economy. International Journal of Fashion Design, Technology and Education 2023, 16(1), 70–78. [CrossRef]
- Wastling, T.; Charnley, F.; Moreno, M. , Design for circular behaviour: Considering users in a circular economy. Sustainability 2018, 10(6), 1743. [Google Scholar] [CrossRef]
- Goldmark, S.; Purdum, K., In words and chairs: making meaning of sustainability, equity and circularity in American theatrical design and production. Theatre and Performance Design 2021, 7((3-4)), 152–162. [CrossRef]
- Ashton, W.; Fratini, C.; Isenhour, C.; Krueger, R., Justice, equity, and the circular economy: introduction to the special double issue. Local Environment 2022, 27((10-11)), 1173–1181. [CrossRef]
- Diddi, S.; Yan, R. , Consumer perceptions related to clothing repair and community mending events: A circular economy perspective. Sustainability 2019, 11(19), 5306. [Google Scholar] [CrossRef]
- Barkhausen, R.; Durand, A.; Fick, K. , Review and analysis of ecodesign directive implementing measures: Product regulations shifting from energy efficiency towards a circular economy. Sustainability 2022, 14(16), 10318. [Google Scholar] [CrossRef]
- Pratt, A. , Toward circular governance in the culture and creative economy: Learning the lessons from the circular economy and environment. City, Culture and Society 2022, 29, 100450. [Google Scholar] [CrossRef]
- Puglia, M.; Parker, L.; Clube, R.; Demirel, P.; Aurisicchio, M. , The circular policy canvas: Mapping the European Union's policies for a sustainable fashion textiles industry. Resources, Conservation and Recycling 2024, 204, 107459. [Google Scholar] [CrossRef]
- Iacovidou, E.; Hahladakis, J.; Purnell, P. , A systems thinking approach to understanding the challenges of achieving the circular economy. Environmental Science and Pollution Research 2021, 28(19), 24785–24806. [Google Scholar] [CrossRef]
- Corona, B.; Shen, L.; Reike, D.; Rosales Carreón, J.; Worrell, E., Towards sustainable development through the circular economy - A review and critical assessment on current circularity metrics. Resources, Conservation and Recycling 2019, 151. [CrossRef]
- Larsen, V.; Tollin, N.; Sattrup, P.; Birkved, M.; Holmboe, T. , What are the challenges in assessing circular economy for the built environment? A literature review on integrating LCA, LCC and S-LCA in life cycle sustainability assessment, LCSA. Journal of Building Engineering 2022, 50, 104203. [Google Scholar] [CrossRef]
- Çetin, S.; Gruis, V.; Straub, A. , Digitalization for a circular economy in the building industry: Multiple-case study of Dutch social housing organizations. Resources, Conservation & Recycling Advances 2022, 15, 200110. [Google Scholar] [CrossRef]
- Jaitly, D.; Desai, K. Jaitly, D.; Desai, K., Artificial Intelligence and the Future of Fashion: A Systematic Review on Sustainable and Circular Practices. 2024 International Conference on Artificial Intelligence and Quantum Computation-Based Sensor Application (ICAIQSA) 2024, 1–8. [Google Scholar] [CrossRef]
- Berthelot, A.; Caron, E.; Jay, M.; Lefèvre, L. , Estimating the environmental impact of Generative-AI services using an LCA-based methodology. Procedia CIRP 2024, 122, 707–712. [Google Scholar] [CrossRef]
- AI and creative technology scaleups: less talk, more action. 2nd Report of Session 2024–25; House of Lords: London, UK, 2025.
- Schosseler, P.; Tock, C.; Rasqué, P. Circular Economy Strategy Luxembourg; Le Gouvernment Du Grand-Duché de Luxembourg: Luxembourg, 2021. [Google Scholar]
- Roadmap Towards the Circular Economy in Montenegro; Chamber of Economy Montenegro & The United Nations Development Programme (UNDP) in Montenegro: Montenegro, 2022.
- Rwanda National Circular Economy Action Plan and Roadmap; Republic of Rwanda Ministry of Environment: Rwanda, 2022.
- Košir, L. G.; Korpar, N.; Potočnik, J.; Kocjančič, R. Roadmap towards the Circular Economy in Slovenia; Ministry of the Environment and Spatial Planning of the Republic of Slovenia: Slovenia, 2018. [Google Scholar]
- Australia’s Circular Economy Framework; Australian Goverment, Department of Climate Change, Energy the Environment and Water: Australia, 2024.
- Oakley, P.; Mock, R.; Findley, J.; Jansen, I.; Bauer, S.; Lardeur, R.; Macdonald, E. Sustainable materials in the creative industries: A scoping report for the AHRC (Redacted Version); 2022.
- Henderson, M.; Chantal Line Carpentier; Landveld, R.; Al-Saqqaf, R.; Groot, O. J. d.; Podolski, M.; Antonelli, A.; Jalilova, N.; Pratami, D., New Economics For Sustainable Development. In United Nations Economist Network: Creative Economy: 2023.
- Generative AI In Creative Industries Global Market Report 2025; The Business Research Company: 2025.
- Charter, M.; Davis, T. Update: creative industries foresight 2030; University for the Creative Arts: Farnham, UK, 2021. [Google Scholar]
- Mol, A. P. J.; Sonnenfeld, D. A. , Ecological modernisation around the world: An introduction. Environmental Politics 2000, 9(1), 1–14. [Google Scholar] [CrossRef]
- Smith, A. K., Florian The transitions discourse in the ecological modernisation of the Netherlands. https://hdl.handle.net/10779/uos.23330030.v1 (11/09/2025).
- Aryee, R.; Kanda, W.; Geissdoerfer, M.; Kirchherr, J., Circular ecosystems: Past, present, and future research directions. Journal of Industrial Ecology 2025, 29(4), 1364–1381. [CrossRef]
| 1 | A sequence of computational steps such as cleaning text, extracting keywords, classifying content, or generating summaries designed to process and analyse text data as part of an analytical workflow. |
Figure 2.
Analytical workflow developed for the grey literature research.
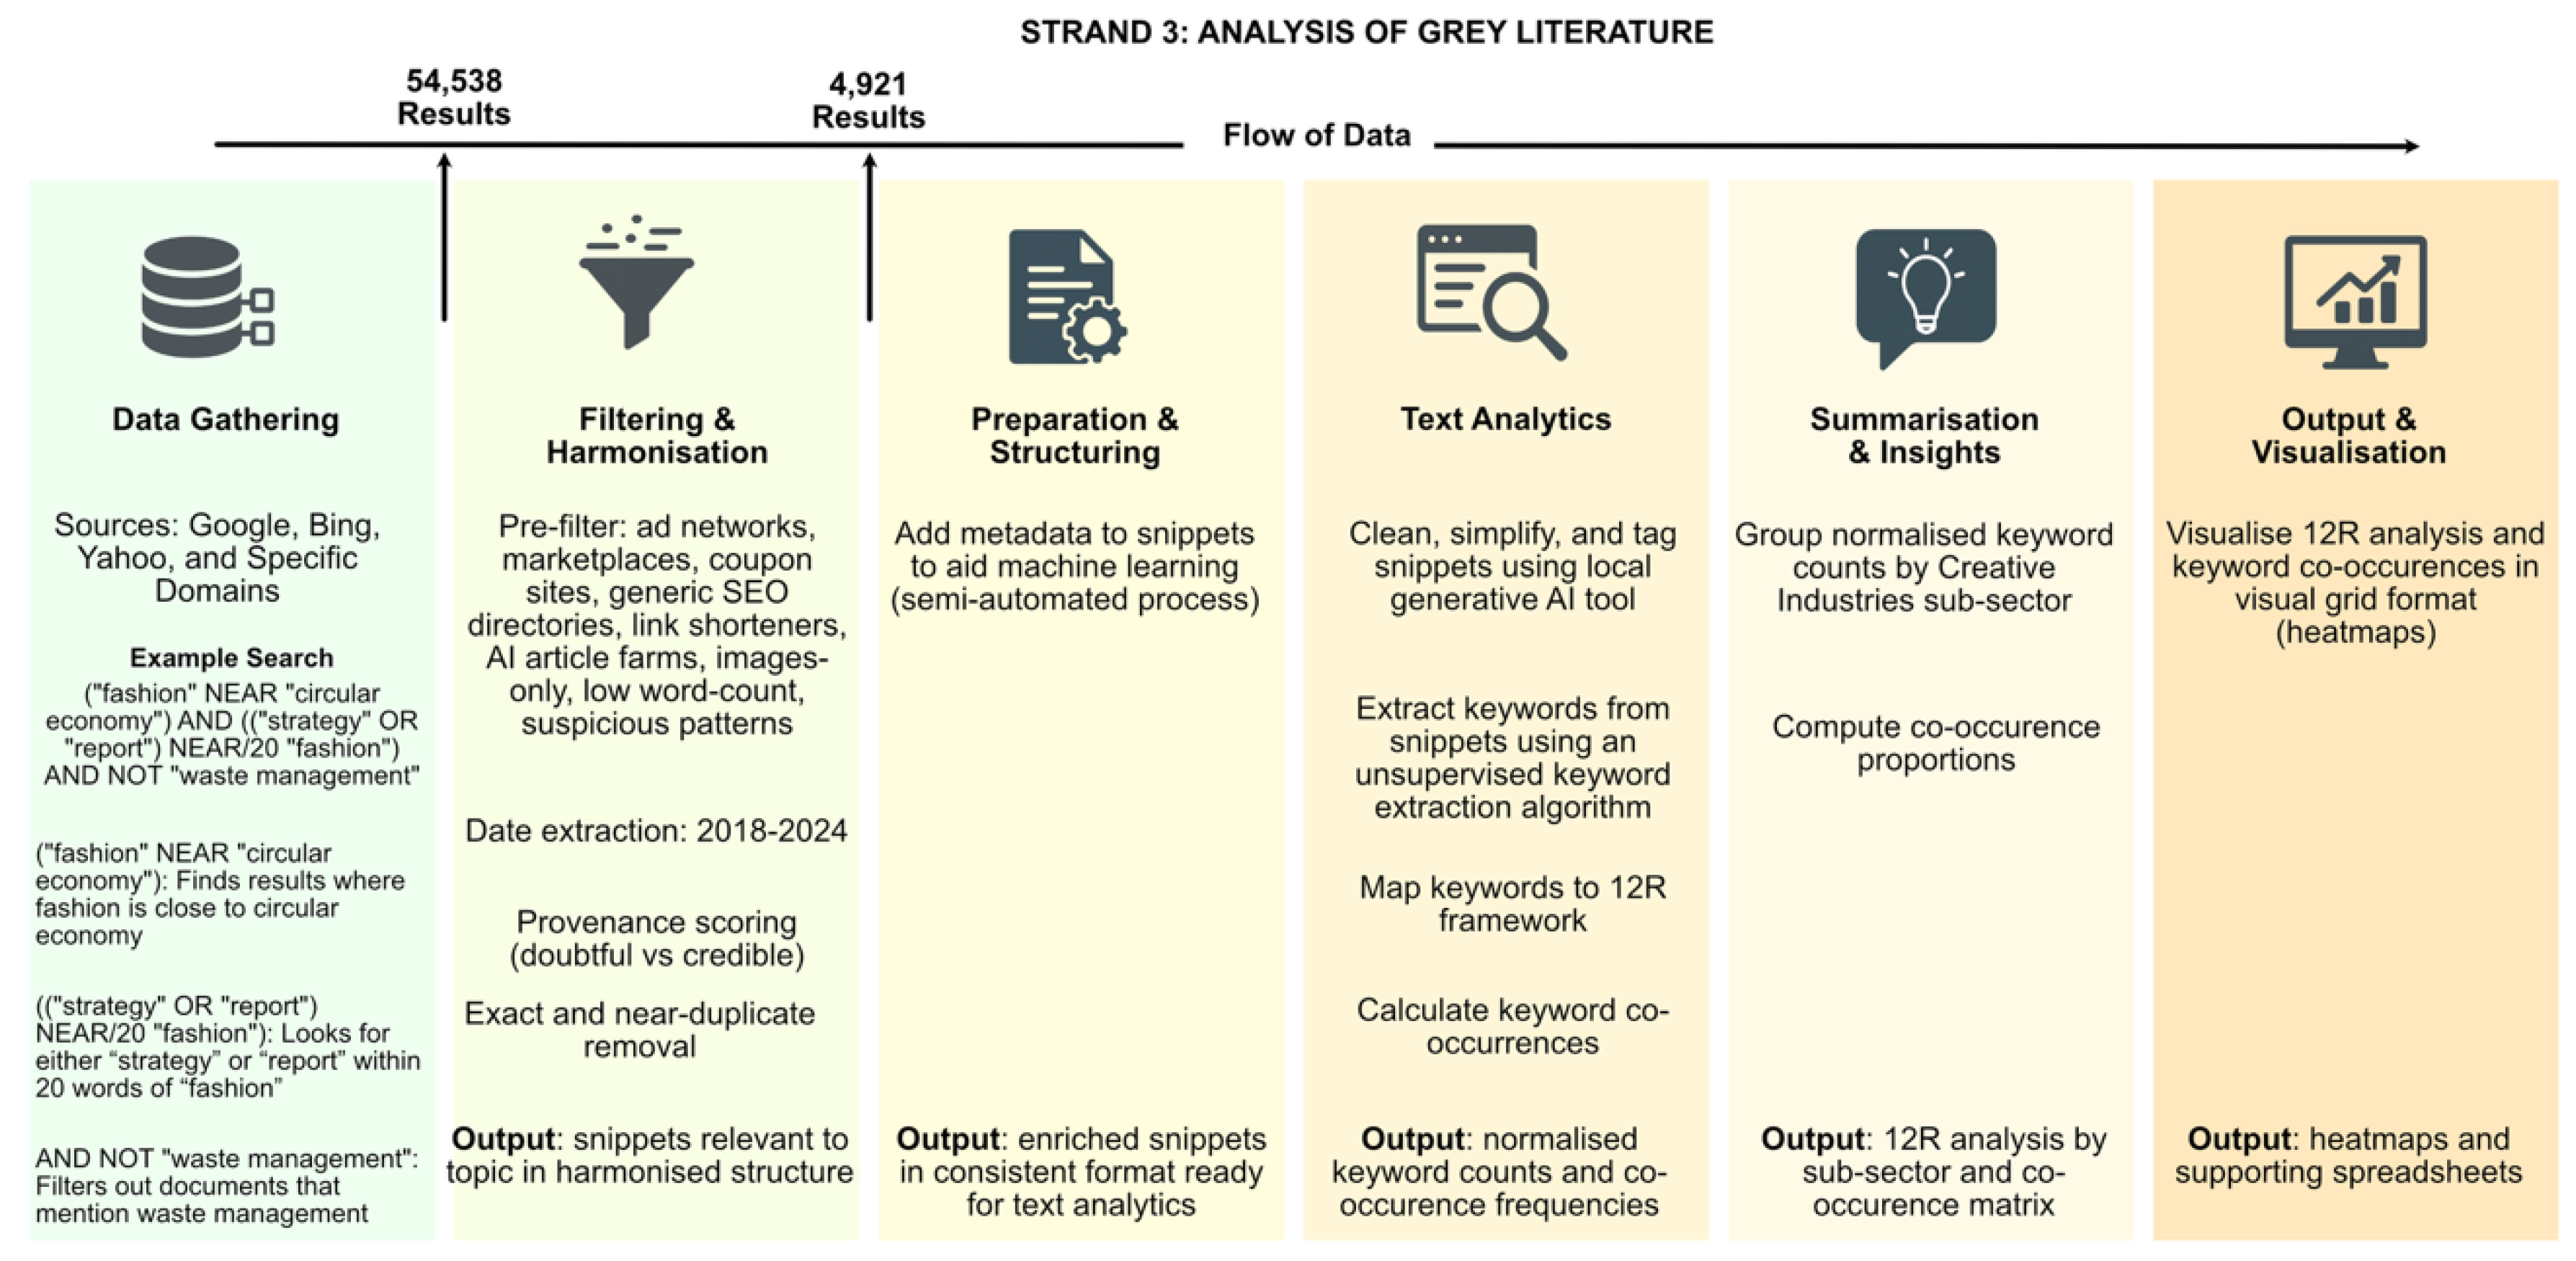
Figure 4.
Trend in published references 2018-2024 by sub-sector.
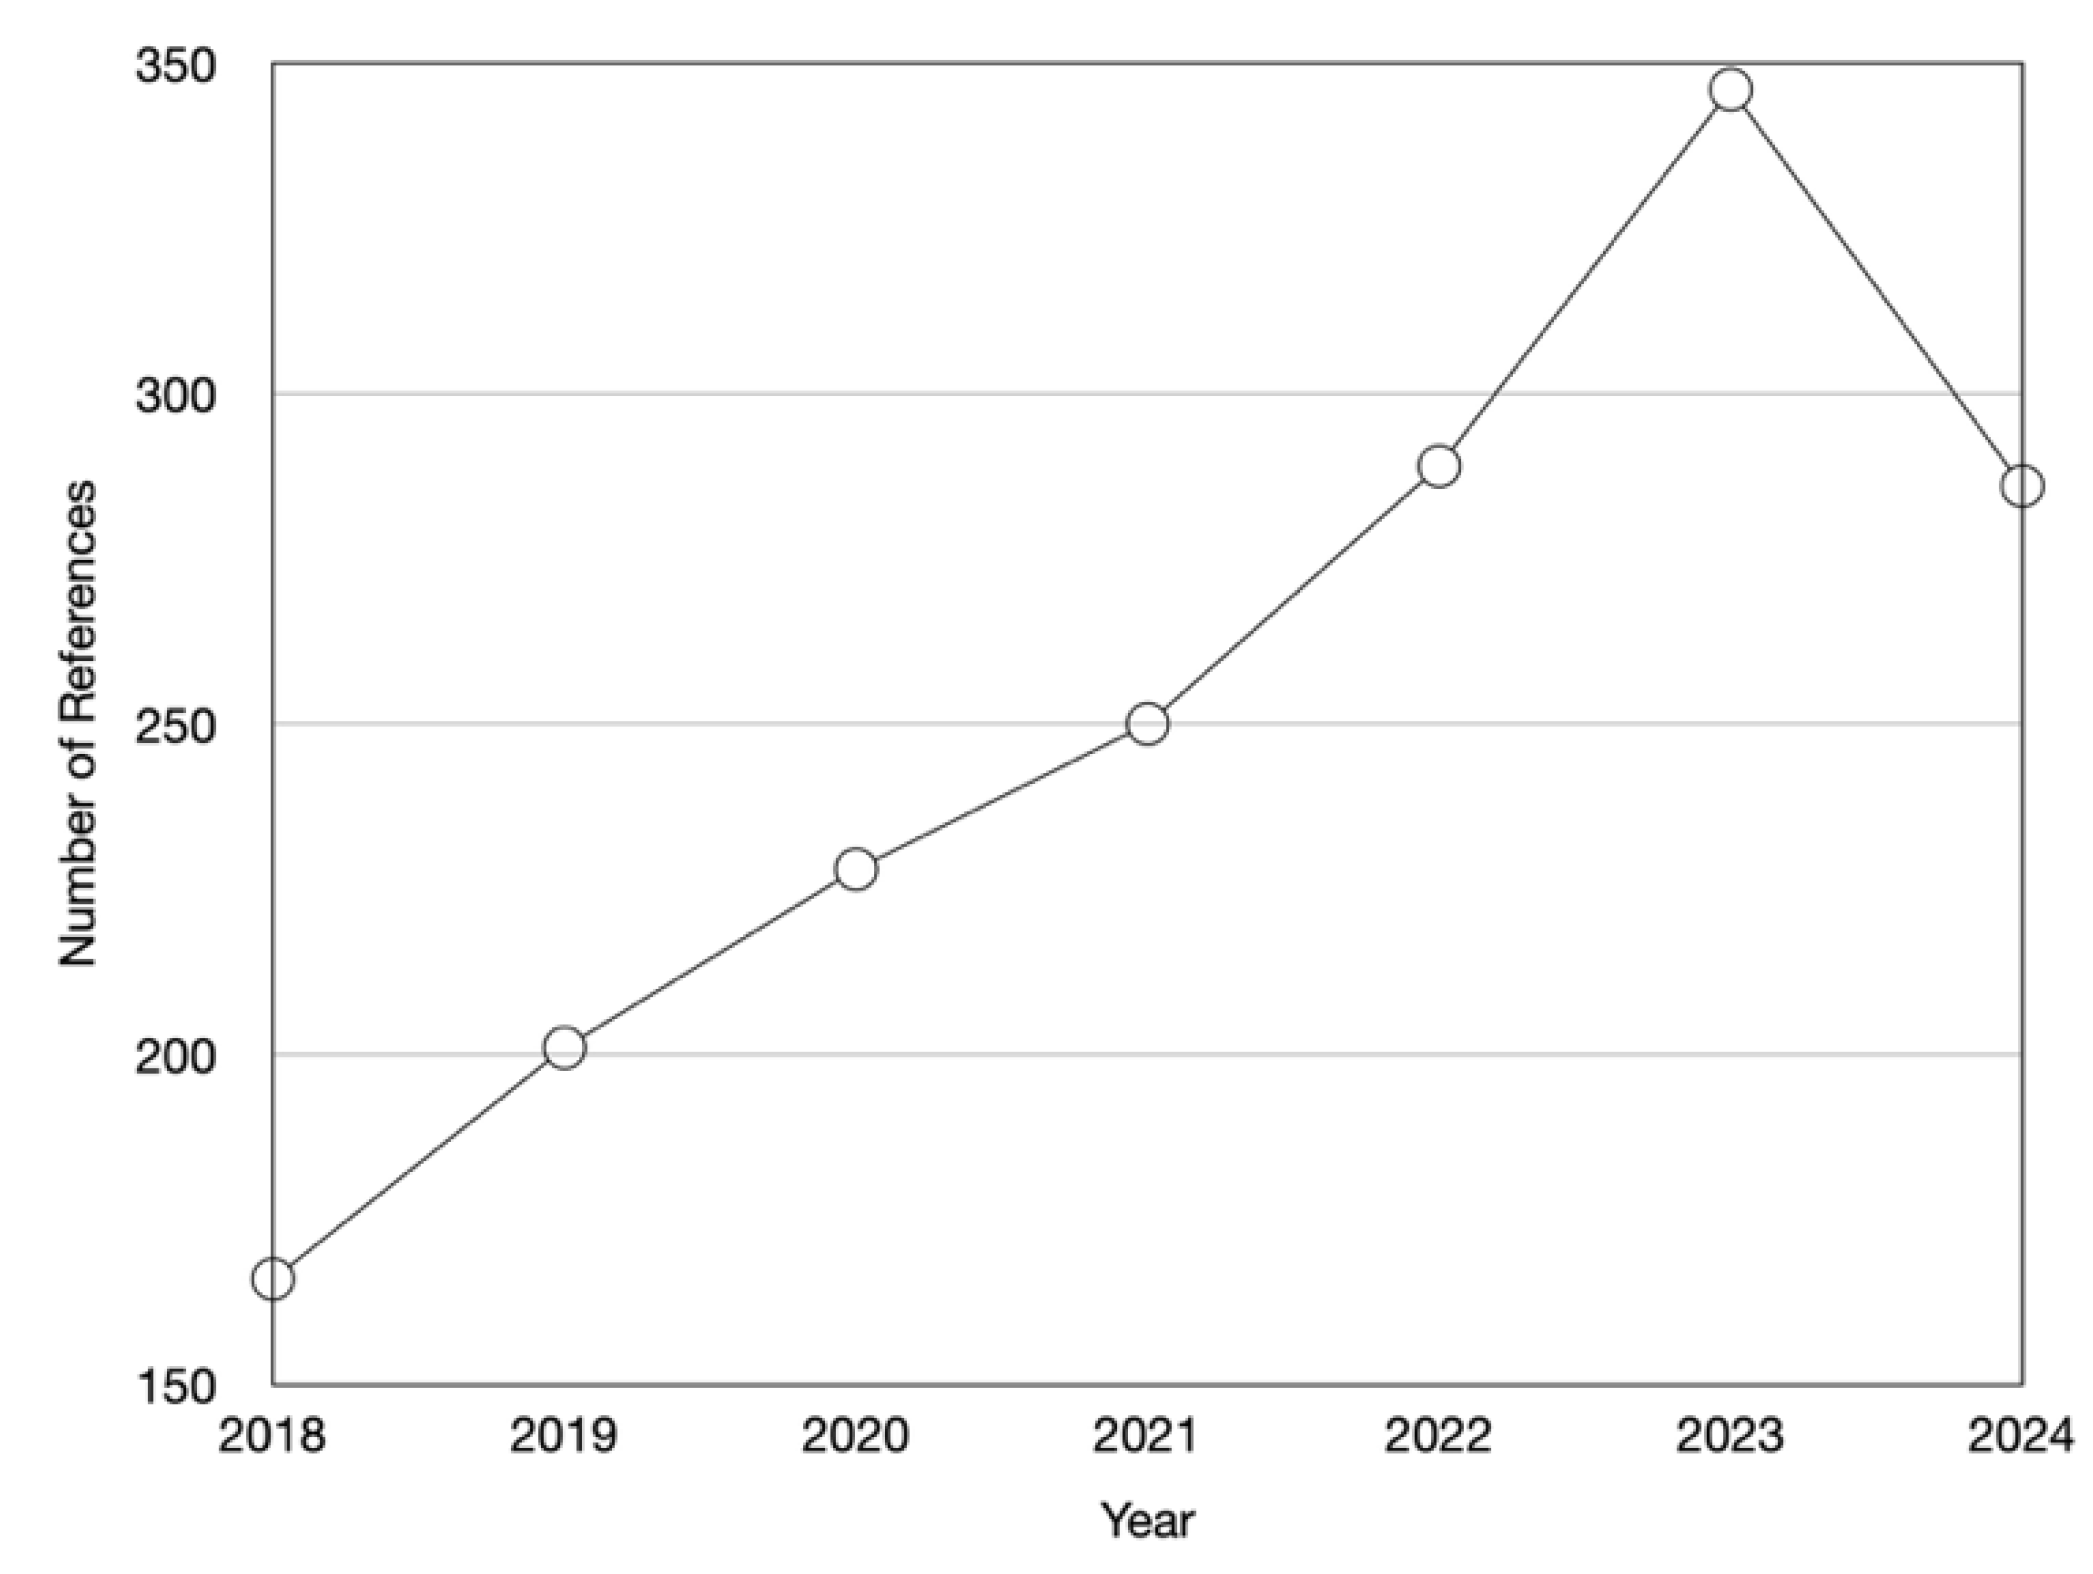
Figure 5.
Heatmap of R strategies by sub-sector and below based on text analytics.
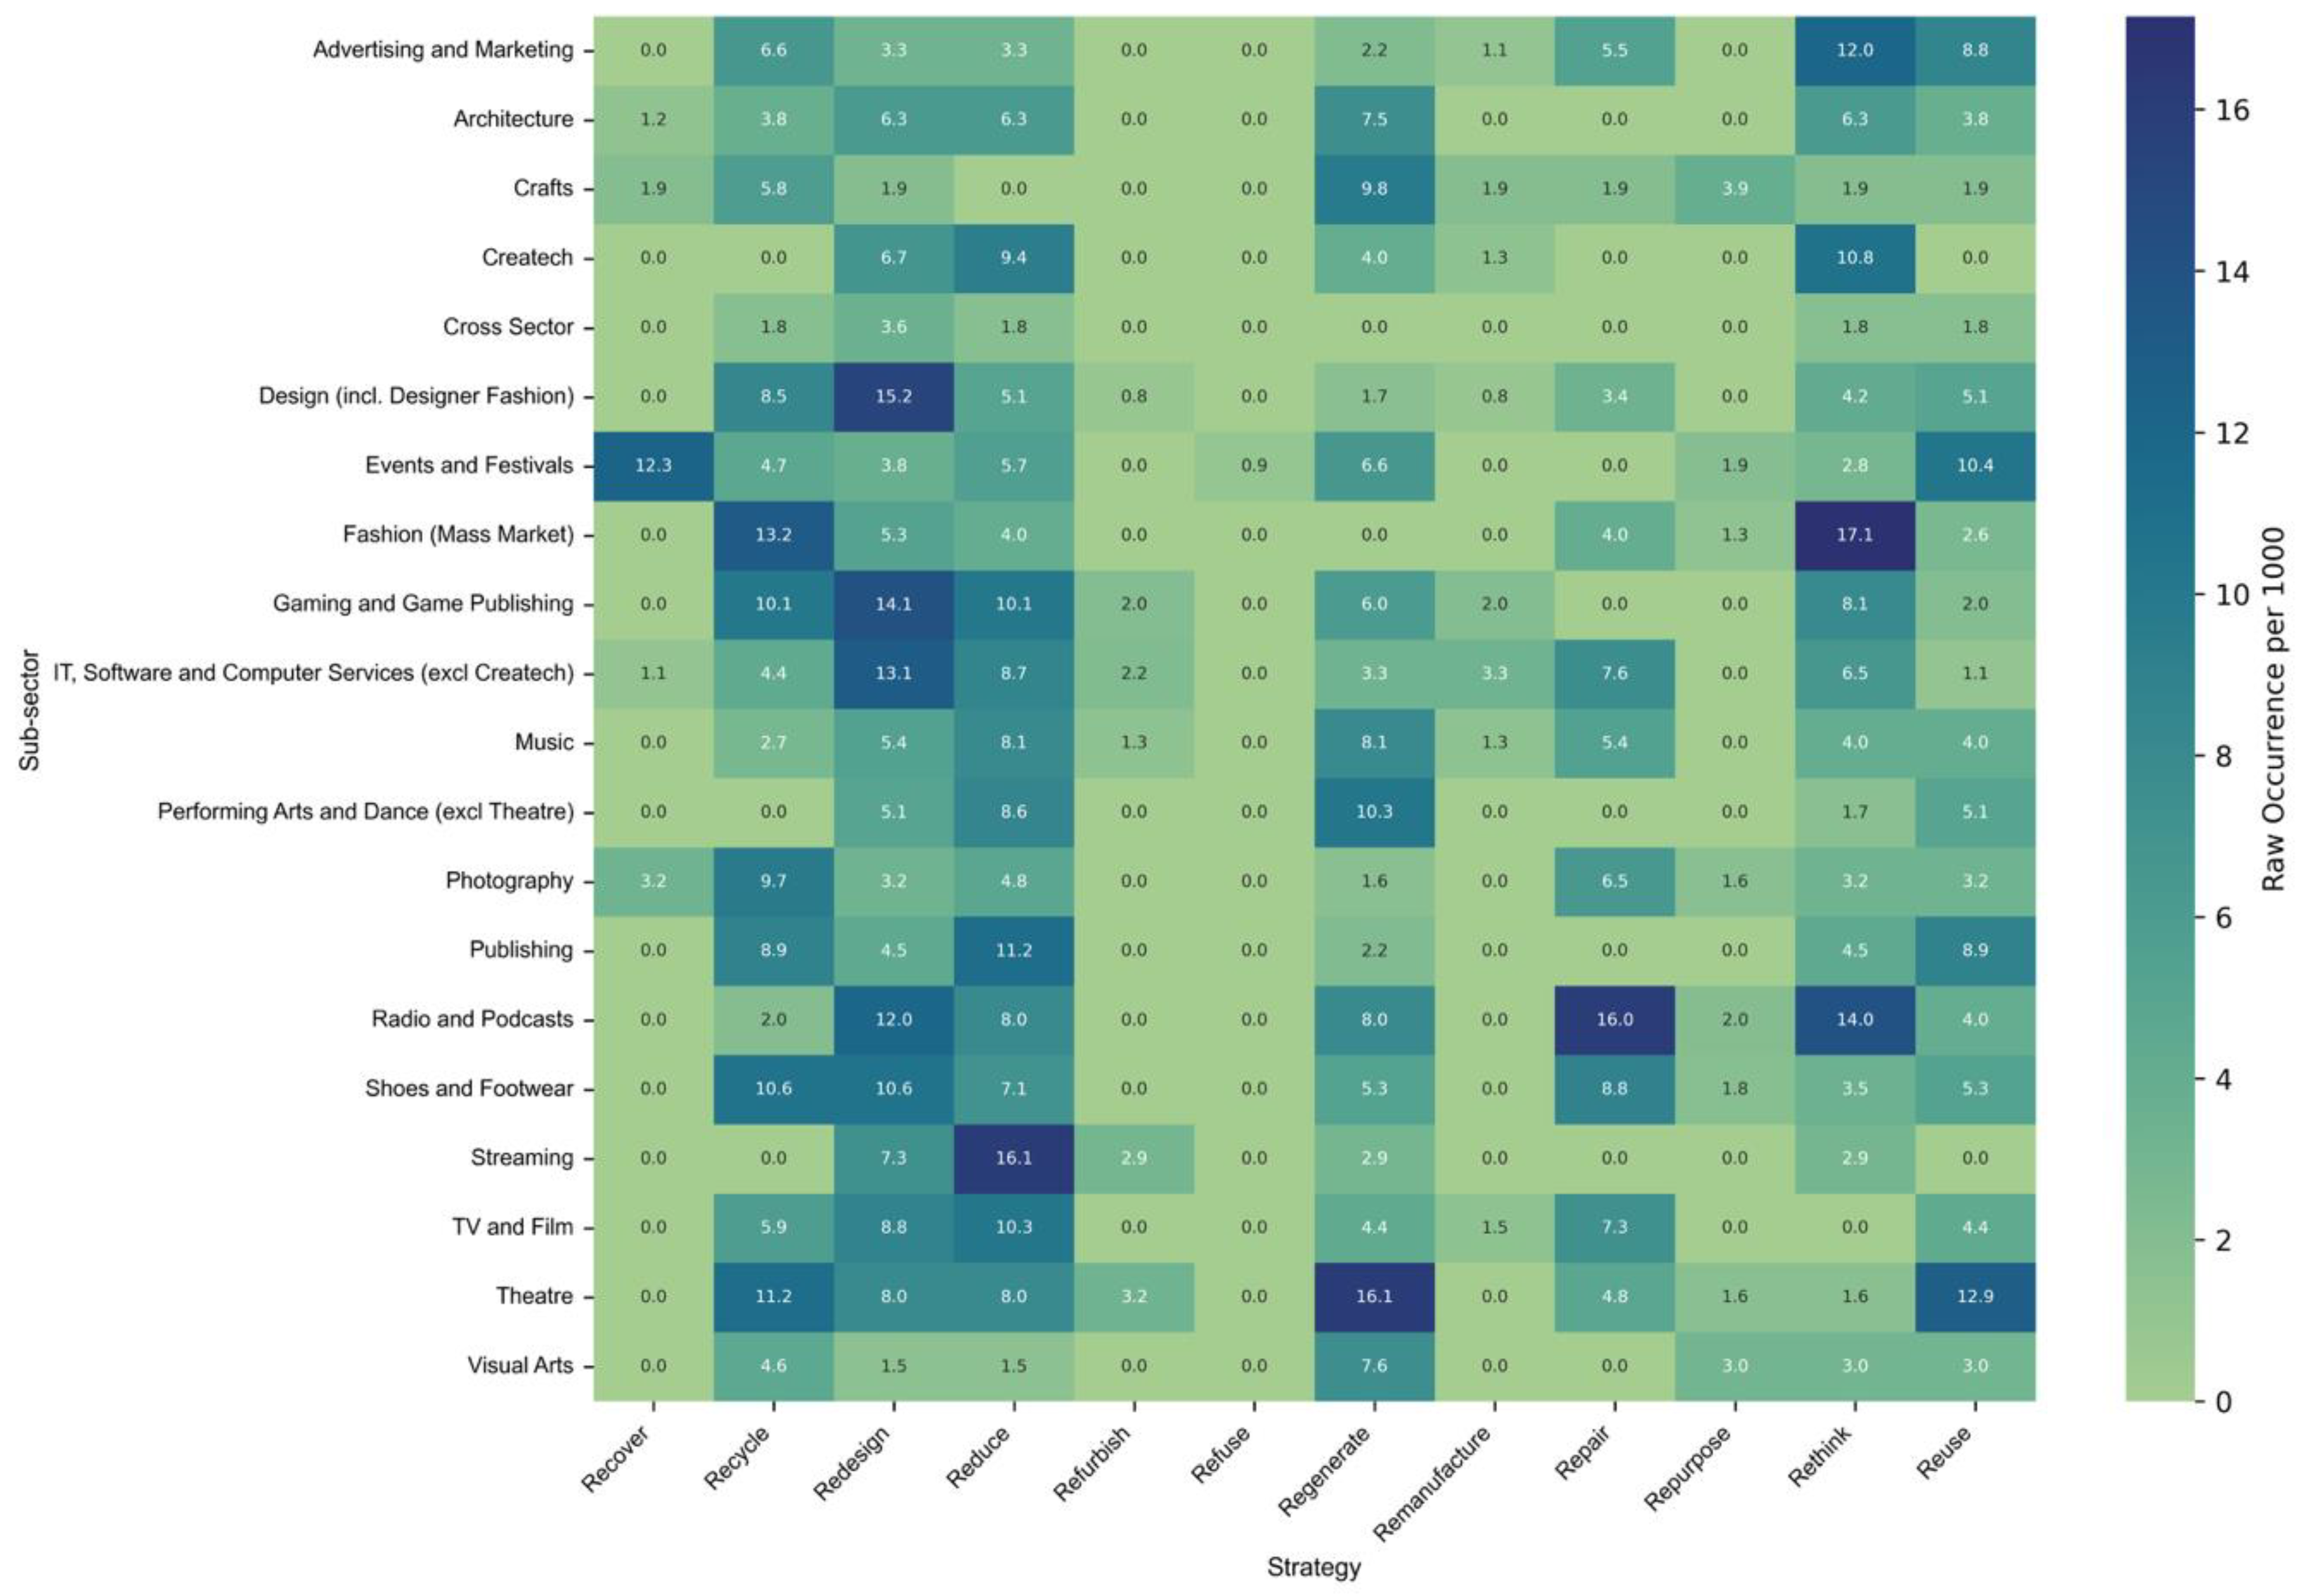
Figure 6.
Co-occurrence matrix for the 12Rs expressed as a percentage of the text analysed.
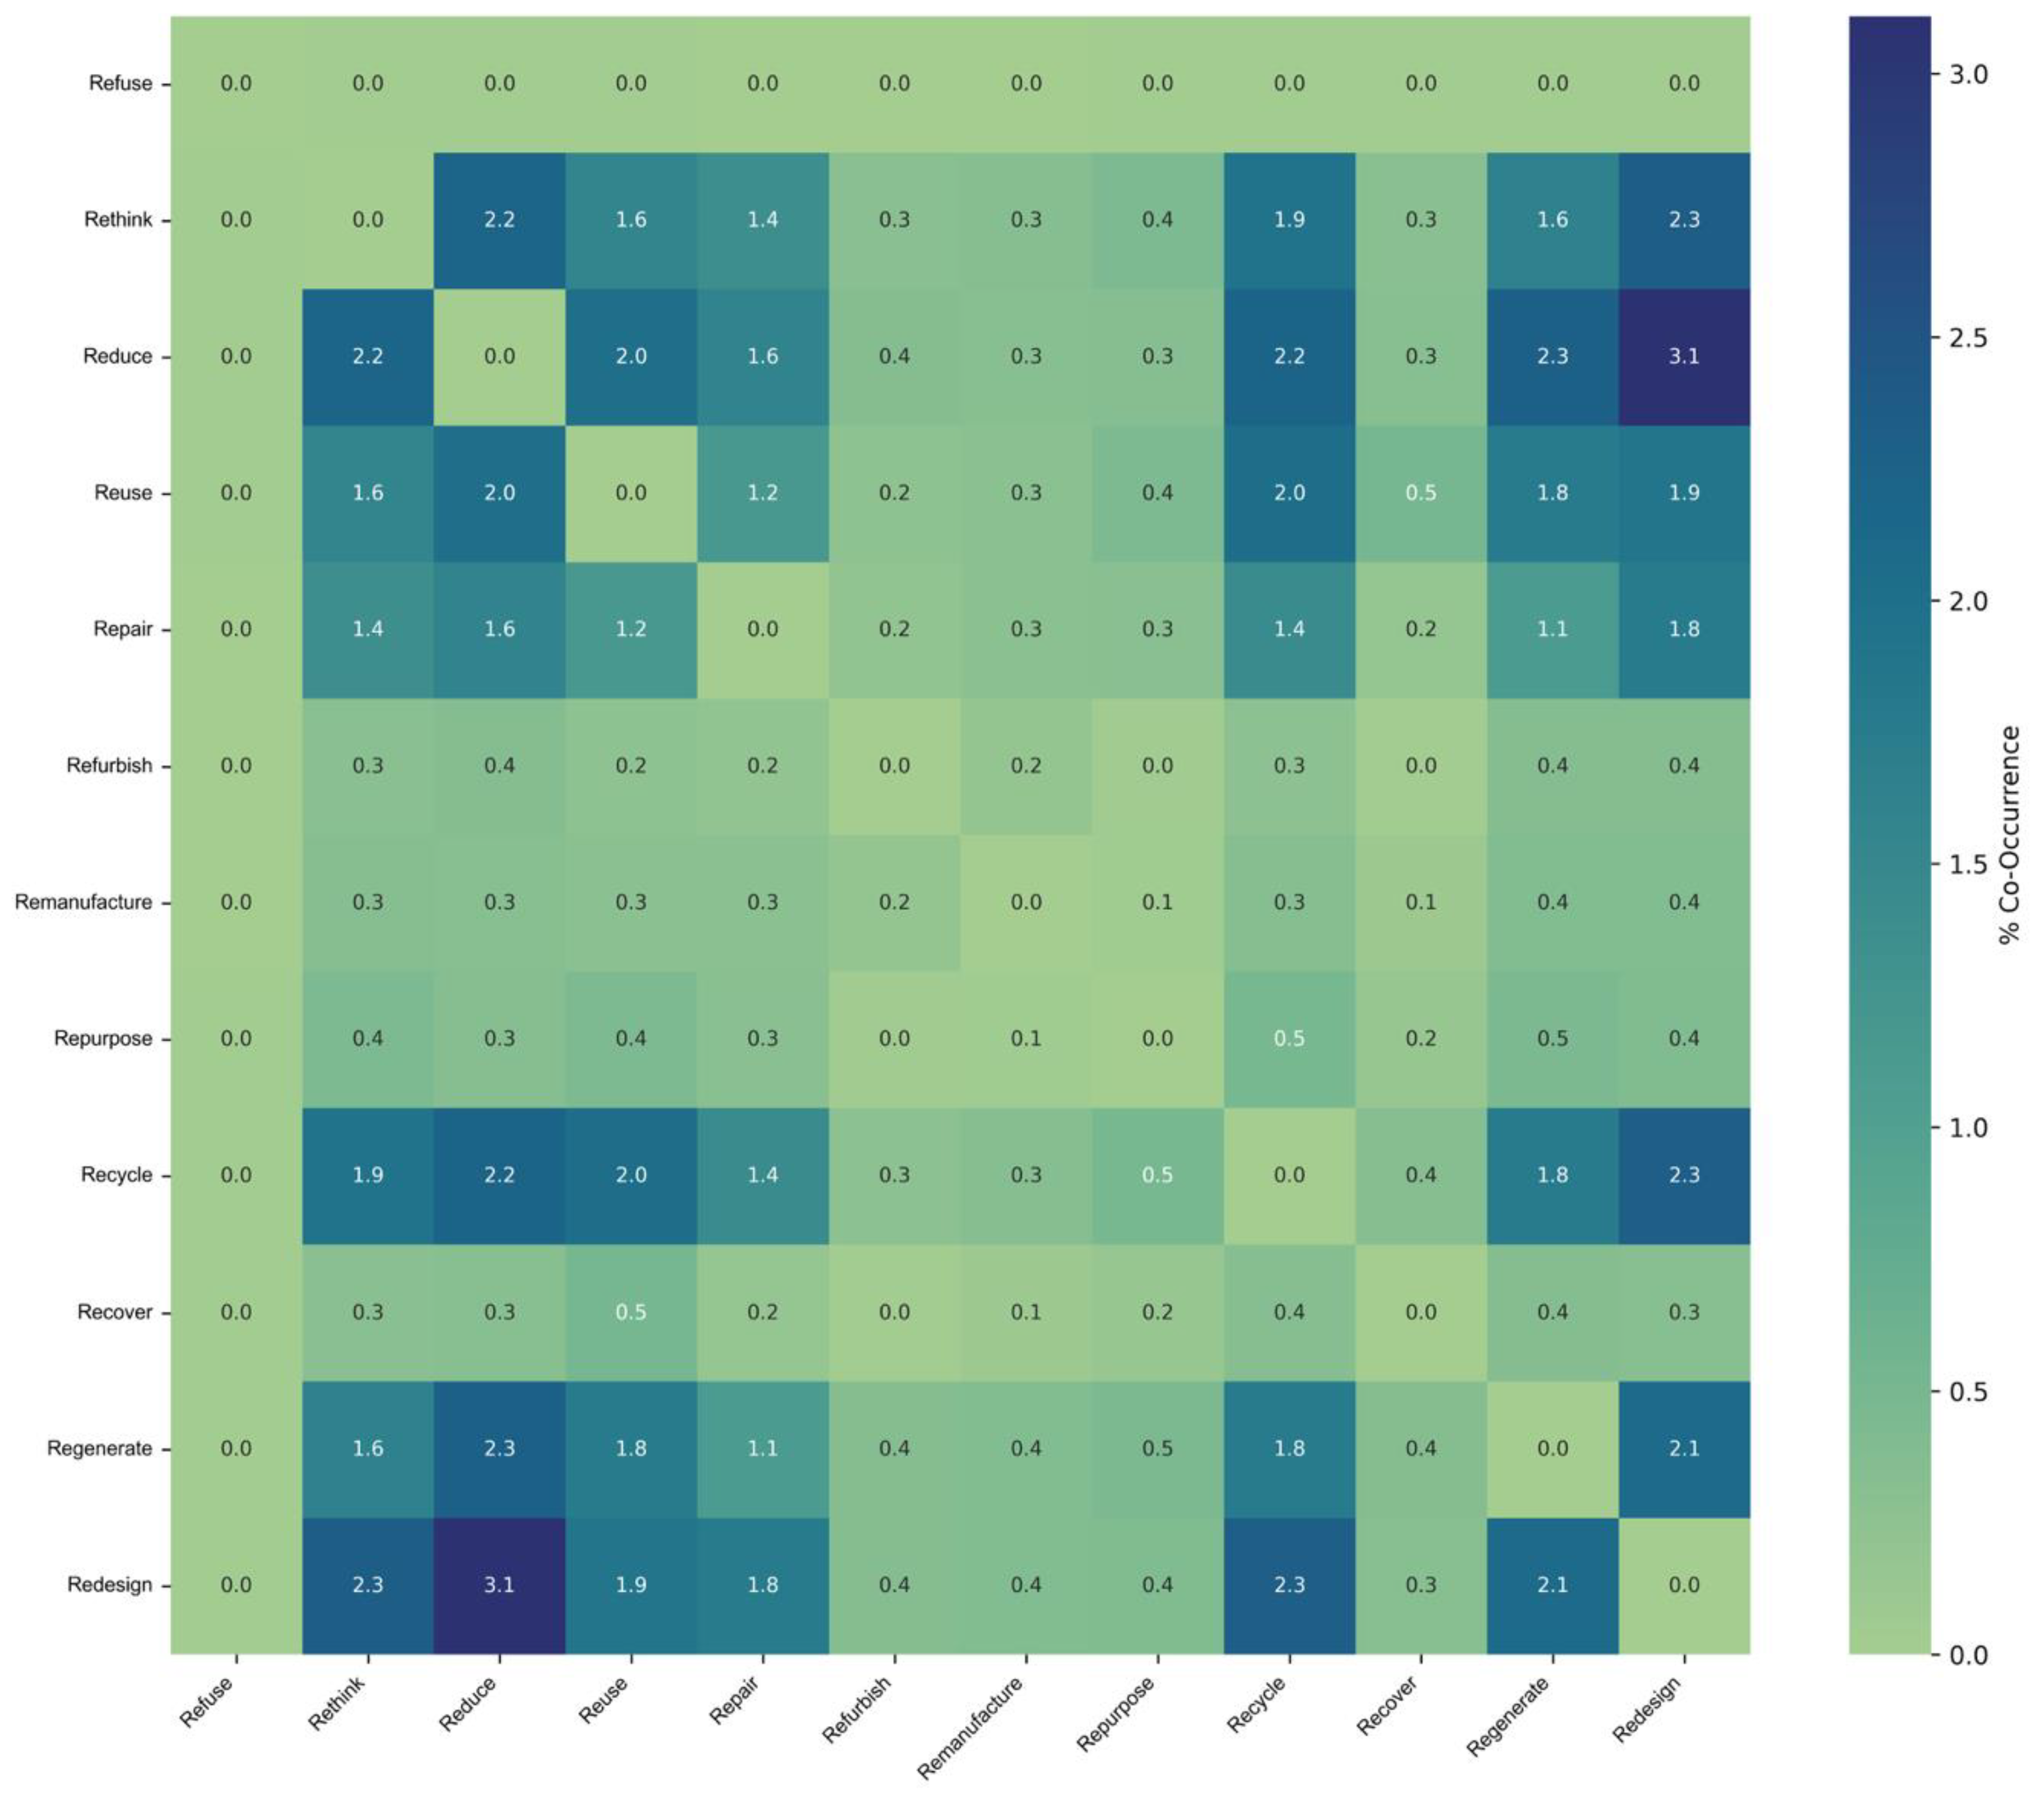
Figure 7.
The Multi-Level Perspective interpretation for this research into CE in the creative industries.
Figure 7.
The Multi-Level Perspective interpretation for this research into CE in the creative industries.
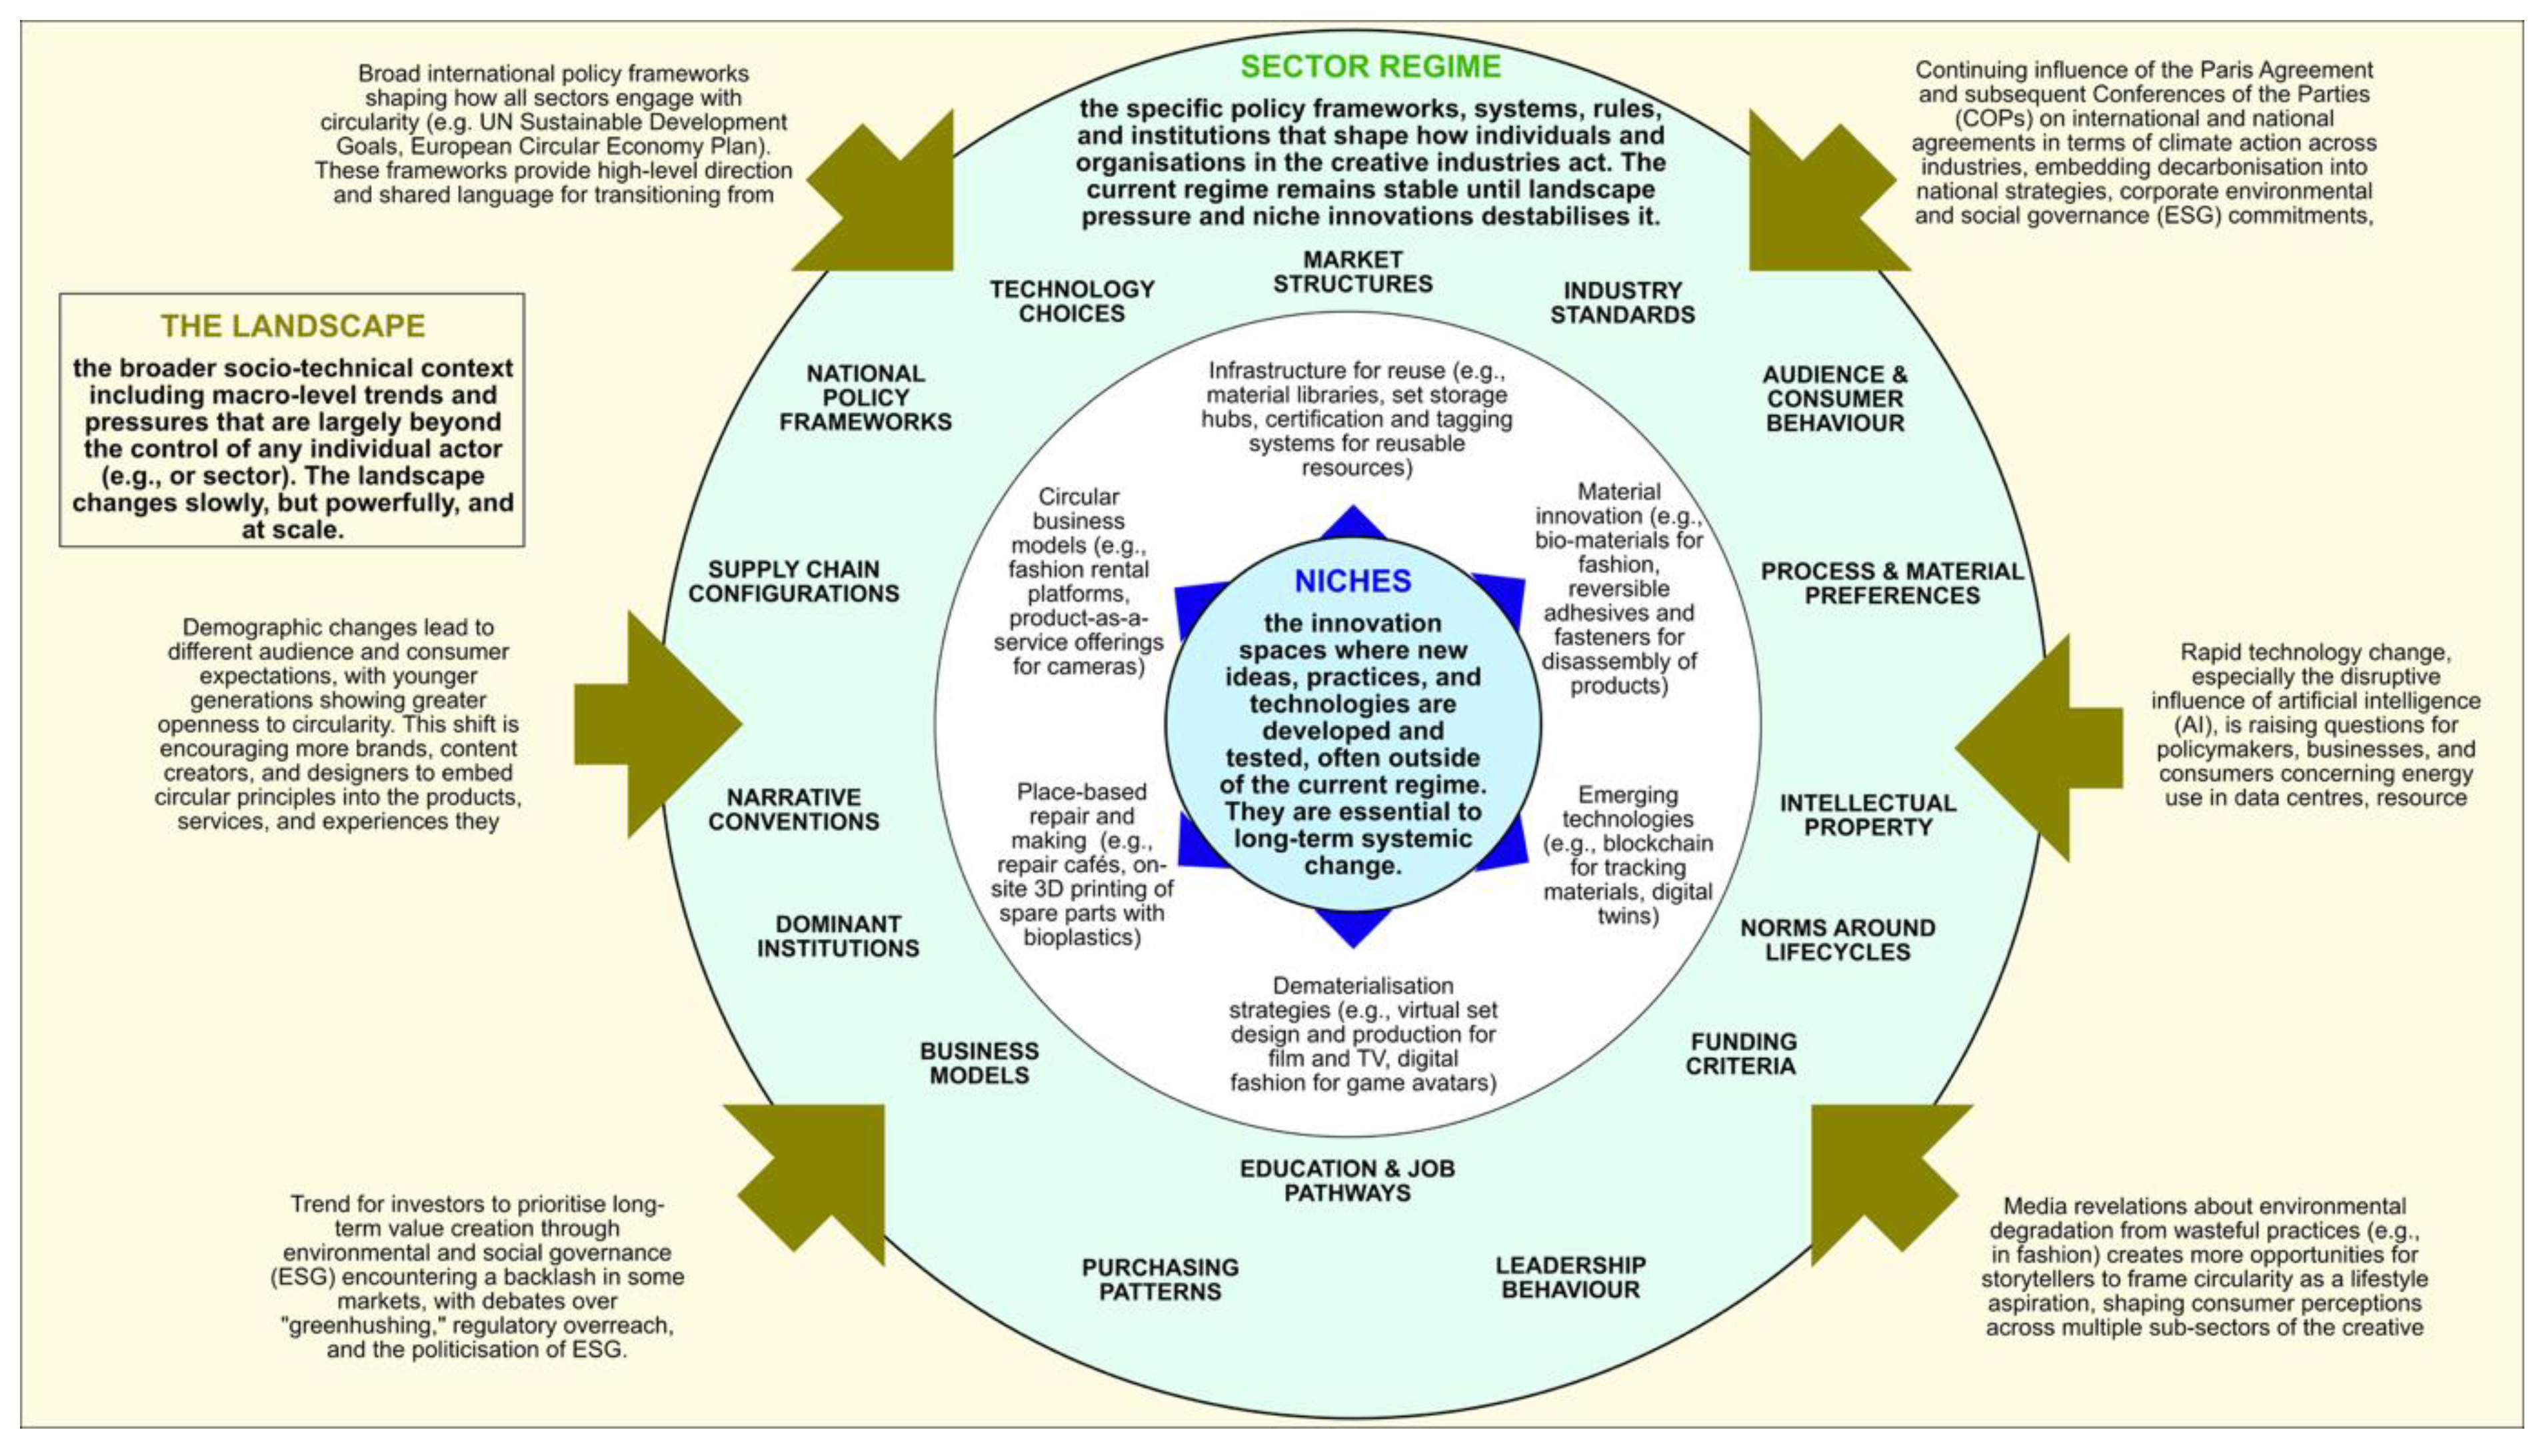
Table 1.
Sub-sectors of the creative industries used in this research.
| Sub-Sectors of the Creative Industries 1 |
|---|
| Advertising and Marketing Architecture Crafts Design (Product, Graphic, and Fashion Design) Film, TV productions, TV, Video, Radio, and Photography (incl. Streaming Media) Game Design and Game Publishing IT, Software and Computer Services (including business to business Createchs) Publishing Music, Performing and Visual arts (including Theatre, Events, and Festivals) |
1 These sub-sectors are derived from those used by the UK government Department for Culture, Media, and Sport (DCMS).
Table 2.
Distribution of references by sub-sector and year. Note that the label “creative technology” is used as a shorthand for IT, Software and Computer Services (including business-to-business createchs).
Table 2.
Distribution of references by sub-sector and year. Note that the label “creative technology” is used as a shorthand for IT, Software and Computer Services (including business-to-business createchs).
| Sub-Sector | Year | |||||||
|---|---|---|---|---|---|---|---|---|
| 2018 | 2019 | 2020 | 2021 | 2022 | 2023 | 2024 | Total | |
| Advertising | 2 | 6 | 4 | 5 | 5 | 2 | 0 | 24 |
| Architecture | 18 | 24 | 35 | 39 | 37 | 35 | 20 | 208 |
| Crafts | 4 | 3 | 5 | 2 | 4 | 13 | 13 | 44 |
| Creative Technology | 4 | 10 | 17 | 19 | 18 | 25 | 27 | 120 |
| Design (Product, Packaging, and Materials) | 86 | 97 | 110 | 106 | 112 | 162 | 134 | 807 |
| Events and Festivals | 1 | 1 | 3 | 5 | 9 | 9 | 9 | 37 |
| Fashion and Textile Design | 19 | 29 | 24 | 34 | 52 | 41 | 33 | 232 |
| Film and TV | 4 | 5 | 4 | 4 | 16 | 15 | 15 | 63 |
| Games | 3 | 1 | 3 | 6 | 6 | 11 | 7 | 37 |
| Marketing | 16 | 10 | 11 | 13 | 13 | 12 | 10 | 85 |
| Music | 0 | 2 | 2 | 2 | 1 | 4 | 1 | 12 |
| Performing Arts (incl. Theatre and Dance) | 1 | 1 | 1 | 5 | 2 | 8 | 11 | 29 |
| Publishing | 0 | 0 | 0 | 0 | 1 | 0 | 0 | 1 |
| Cross-sector | 8 | 12 | 9 | 10 | 13 | 9 | 6 | 67 |
| Total | 166 | 201 | 228 | 250 | 289 | 346 | 286 | 1766 |
Table 3.
Top 20 keywords.
| Keyword | Count |
|---|---|
| circular economy | 1217 |
| design | 608 |
| fashion | 206 |
| architecture | 168 |
| circular design | 137 |
| fashion industry | 101 |
| business model | 97 |
| marketing | 80 |
| supply chain | 78 |
| case study | 71 |
| product design | 69 |
| literature review | 66 |
| film production | 64 |
| circular fashion | 63 |
| sustainable development | 62 |
| sustainability | 61 |
| economy | 59 |
| industry | 55 |
| circular economy principle | 53 |
| creative technology | 51 |
Table 4.
Top 20 co-occurrences.
| Keyword 1 | Keyword 2 | Count |
|---|---|---|
| circular economy | design | 396 |
| circular economy | fashion | 175 |
| architecture | circular economy | 137 |
| circular economy | fashion industry | 95 |
| business model | circular economy | 79 |
| circular design | circular economy | 68 |
| circular economy | supply chain | 64 |
| circular economy | marketing | 62 |
| circular economy | circular fashion | 57 |
| circular economy | product design | 55 |
| circular economy | film production | 54 |
| circular economy | literature review | 53 |
| circular economy | economy principle | 53 |
| case study | circular economy | 51 |
| circular economy | circular transition | 51 |
| circular economy | economy fashion | 46 |
| circular economy | sustainable development | 44 |
| circular economy | sustainability | 43 |
| design | product | 43 |
| circular economy | fashion textile | 38 |
Table 7.
List of countries included in the review of national CE strategies.
| Albania | England | Luxembourg | Scotland |
| Angola | Estonia | Malaysia | Serbia |
| Argentina | Finland | Malta | Slovak Republic |
| Australia | France | Mauritius | Slovenia |
| Austria | Georgia | Moldova | South Africa |
| Bangladesh | Germany | Montenegro | South Korea |
| Belarus | Greece | Morocco | Spain |
| Belgium | Guinea-Bissau | Netherlands | Sweden |
| Brazil | Hungary | New Zealand | Switzerland |
| Cambodia | India | Nigeria | Taiwan |
| Canada | Indonesia | Northern Ireland | Thailand |
| Chile | Ireland | Panama | Turkey |
| China | Italy | Peru | UAE |
| Colombia | Japan | Poland | Ukraine |
| Costa Rica | Kenya | Portugal | Uruguay |
| Czechia | Kosovo | Qatar | Vietnam |
| Denmark | Latvia | Romania | Wales |
| Ecuador | Lithuania | Rwanda |
Table 8.
Breakdown of grey sources by sub-sector.
| Sub-Sector | Number of Snippets |
|---|---|
| Design (Product, Graphic, and Fashion Design) | 885 |
| Film, TV productions, TV, Video, Radio, and Photography (incl. Streaming Media) | 812 |
| Fashion, but more closely aligned with manufacturing and post-consumer waste streams | 809 |
| IT, Software and Computer Services (including business to business Createchs) | 461 |
| Architecture | 342 |
| Advertising and Marketing | 195 |
| Music, Performing and Visual arts (including Theatre, Events, and Festivals) | 186 |
| Crafts | 148 |
| Cross-sector entries | 137 |
| Game Design and Game Publishing | 37 |
| Publishing | 7 |
| Total used for text analytics | 4,791 |
Table 9.
Breakdown of source types found in grey literature by sub-sector.
| Source Type | Number of Snippets |
|---|---|
| Industry handbooks or guidance | 1,154 |
| Government: International or national policy/strategy | 862 |
| Government: Sector legislation/regulation | 556 |
| Working papers or reports from research | 493 |
| Government: Local government initiatives | 470 |
| NGO reports | 388 |
| Consultant reports | 350 |
| Standards | 211 |
| Industry practitioner generated content | 158 |
| Government: Reports by public agencies | 149 |
Table 10.
Mapping of text analytics results to the level of the MLP.
| Level | Number of Snippets |
|---|---|
| Sector regime | 2,348 |
| Niche innovations in the sector | 1,964 |
| Landscape pressures on the sector | 479 |
Table 12.
Priority rankings by sub-sector.
| Sub-Sector | Ranking for transitioning to circular business models (e.g., leasing, reuse, remanufacturing) | Ranking for improving resource efficiency and reducing waste | Ranking for reducing carbon emissions and energy consumption | Top Priority |
|---|---|---|---|---|
| Advertising/Marketing | No Data | No Data | No Data | No Data |
| Architecture | 10 | 9 | 4 | Growth and scaling operations |
| Crafts | 8 | Not ranked | 3 | Ensuring I/my organisation is financially viable |
| Design (Graphic, Product, Fashion) | 6 | 10 | 7 | Growth and scaling operations |
| Film, TV, Video, Radio, and Photography | 11 | 3 | 2 | Innovation and new product/service development |
| IT, Software and Computer Services (incl. Createch) | 8 | Not ranked | Not ranked | Innovation and new product/service development |
| Music, Performing and Visual Arts (incl. Theatre and Dance) | 9 | 2 | 1 | Reducing carbon emissions and energy consumption |
| Publishing | 7 | Not ranked | 6 | Ensuring I/my organisation is financially viable |
| Other (Multi-Sector) | 5 | 3 | 2 | Growth and scaling operations |
Table 13.
Mean importance of the CE for each sub-sector. Mean for the entire sector is 4.0.
| Sub-Sector | Sample Size | Mean |
|---|---|---|
| Advertising/Marketing | 0 | No Data |
| Architecture | 4 | 4.5 |
| Crafts | 1 | 5.0 |
| Design (Graphic, Product, Fashion) | 6 | 4.5 |
| Film, TV, Video, Radio, and Photography | 6 | 4.3 |
| IT, Software and Computer Services (incl. Createch) | 5 | 2.8 |
| Music, Performing and Visual Arts (incl. Theatre and Dance) | 10 | 4.2 |
| Publishing | 0 | No Data |
| Other (Multi-Sector) | 2 | 4.0 |
Table 14.
Mean level of current pressure by sub-sector. Mean for the entire sector is 2.4.
| Sub-Sector | Sample Size | Mean |
|---|---|---|
| Advertising/Marketing | 0 | No Data |
| Architecture | 4 | 2.5 |
| Crafts | 1 | 2.0 |
| Design (Graphic, Product, Fashion) | 6 | 2.5 |
| Film, TV, Video, Radio, and Photography | 6 | 2.5 |
| IT, Software and Computer Services (incl. Createch) | 5 | 1.8 |
| Music, Performing and Visual Arts (incl. Theatre and Dance) | 10 | 2.7 |
| Publishing | 0 | No Data |
| Other (Multi-Sector) | 2 | 2.5 |
Table 15.
Comparison of top-ranked sources of pressure by sub-sector (current, future).
| Sub-Sector | Top ranked source currently | Top ranked source in the future |
|---|---|---|
| Advertising/Marketing | No Data | No Data |
| Architecture | Environmental NGOs or activists | Government regulations or policies |
| Crafts | Government regulations or policies | Government regulations or policies |
| Design (Graphic, Product, Fashion) | Artists/creators/designers/makers | Artists/creators/designers/makers |
| Film, TV, Video, Radio, and Photography | Industry associations/guilds | Government regulations or policies |
| IT, Software and Computer Services (incl. Createch) | Public opinion or media coverage | Government regulations or policies |
| Music, Performing and Visual Arts (incl. Theatre and Dance) | Government regulations or policies | Government regulations or policies |
| Other (Multi-Sector) | Artists/creators/designers/makers | Public opinion or media coverage |
| Publishing | Government regulations or policies | Government regulations or policies |
Table 16.
Respondents stating that they are aware of relevant regulations and standards by sub-sector.
Table 16.
Respondents stating that they are aware of relevant regulations and standards by sub-sector.
| Sub-Sector | Sample Size | Awareness of CE related regulation | Awareness of any CE related standards |
|---|---|---|---|
| Advertising/Marketing | No Data | No Data | No Data |
| Architecture | 4 | 1 | 1 |
| Crafts | 1 | 1 | 1 |
| Design (Graphic, Product, Fashion) | 5 | 3 | 2 |
| Film, TV, Video, Radio, and Photography | 5 | 2 | 2 |
| IT, Software and Computer Services (incl. Createch) | 5 | 0 | 1 |
| Music, Performing and Visual Arts (incl. Theatre and Dance) | 9 | 2 | 2 |
| Publishing | No Data | No Data | No Data |
| Other (Multi-Sector) | 2 | 1 | 1 |
Disclaimer/Publisher’s Note: The statements, opinions and data contained in all publications are solely those of the individual author(s) and contributor(s) and not of MDPI and/or the editor(s). MDPI and/or the editor(s) disclaim responsibility for any injury to people or property resulting from any ideas, methods, instructions or products referred to in the content. |
© 2025 by the authors. Licensee MDPI, Basel, Switzerland. This article is an open access article distributed under the terms and conditions of the Creative Commons Attribution (CC BY) license (https://creativecommons.org/licenses/by/4.0/).
Copyright: This open access article is published under a Creative Commons CC BY 4.0 license, which permit the free download, distribution, and reuse, provided that the author and preprint are cited in any reuse.


