
Submitted:
08 November 2025
Posted:
10 November 2025
You are already at the latest version
Abstract
This study explores the relationship between ESG disclosure and firm performance using a panel dataset of approximately 24,500 firm-year observations between 2015 and 2024, based on Refinitiv ESG scores across 12 industries and multiple European countries. To capture regional heterogeneity, the analysis splits the sample into Nordic and non-Nordic firms, applying fixed-effects panel regression for the latter and random-effects models for the former, supported by Hausman test results. The results reveal that ESG disclosure correlates positively with firm performance, though effects differ across finan-cial metrics and regional contexts. In the Nordic sample, a 10-point increase in ESG score is associated with a 4.2 basis point reduction in WACC, suggesting that ESG maturity enables firms to access cheaper financing. In contrast, for non-Nordic firms, short-run profitability appears more sensitive to ESG engagement, especially through the environ-mental pillar. Importantly, the governance (G) component plays a critical role in reducing financing costs outside the Nordics. These findings highlight how institutional maturity and disclosure quality shape ESG’s financial impact. The study recommends that firms and regulators in less mature ESG environments strengthen governance transparency to realize capital cost advantages. The analysis reveals that while ESG scores are associated with lower WACC in both Nordic and non-Nordic firms, their effect on short-run profitability (ROA/ROE) is nega-tive and statistically significant only in the non-Nordic subsample. These region-specific differences support the role of institutional maturity and investor orientation in shaping ESG outcomes.
Keywords:
Environment
; Social
; Governance
; ESG
; Financial performance
; sustainability
; ROA
; ROE
; WACC.
1. Introduction
Environmental, Social, and Governance (ESG) factors have gained increasing importance in recent years, as businesses and investors alike recognize their potential to shape corporate sustainability and financial performance. ESG scores offer insights into how firms manage sustainability-related issues and their broader impact on society, the environment, and governance. Despite growing attention, research on the relationship between ESG performance and financial outcomes remains diverse, with some studies suggesting a positive correlation, while others report mixed or even negative associations.
The existing literature highlights that the impact of ESG on financial performance is often region-specific and influenced by various industry characteristics. While several studies have focused on the effects of ESG performance in individual regions, particularly in Europe, a comparative analysis between Nordic and non-Nordic European firms remains underexplored. In Nordic countries, where sustainability initiatives are more deeply embedded in corporate practices, firms with strong ESG performance are often associated with lower financing costs and improved investor confidence. Conversely, for firms in broader Europe, the relationship between ESG and financial performance appears more nuanced, with some studies showing that strong ESG initiatives may come at a short-term profitability cost.
This study aims to contribute to this gap by comparing the ESG-performance relationship between Nordic and non-Nordic European firms, analyzing data from 2015 to 2024. By examining key financial performance indicators such as Return on Assets (ROA), Return on Equity (ROE), and Weighted Average Cost of Capital (WACC), this research explores how ESG scores, along with individual environmental, social, and governance pillars, influence firm financial outcomes. The study also incorporates control variables such as leverage and firm size to account for external factors that may impact firm performance.
The findings from this analysis will provide valuable insights into the role of ESG in shaping financial performance across different institutional contexts. Furthermore, this study addresses the broader debate on whether sustainability efforts translate into financial benefits, particularly in terms of risk reduction, cost of capital, and long-term firm value.
Despite a growing body of research examining the empirical link between ESG score and firm performance, most studies focus on implementation or regional differences rather than the underlying theoretical mechanisms driving these variations. This study addresses this gap by integrating institutional, signalling, and agency perspectives into a unified framework that conceptually explains how institutional maturity and information asymmetry jointly shape the ESG–performance relationship.
This study contributes to the literature in three important ways. First, it offers one of the most comprehensive comparative analyses between Nordic and non-Nordic European firms using a large panel of approximately 24,500 firm-year observations from 2015–2024. This design allows us to reveal how regional institutional maturity and sustainability traditions shape the ESG–performance nexus, a dimension largely overlooked in earlier European studies that typically treated the region as homogeneous.
Second, methodologically, this paper simultaneously examines profitability (ROA, ROE) and financing efficiency (WACC) within a unified panel-regression framework, using Hausman-tested fixed- and random-effects models with controls for leverage, market risk, and firm size. This multi-indicator design provides a balanced assessment of both risk-reduction and return channels of ESG.
Finally, by identifying governance quality as a consistent driver of reduced financing costs across Europe, the study delivers actionable implications for policymakers and investors on how score standards can enhance capital-market efficiency. Collectively, these elements distinguish our contribution from prior work and clarify how institutional and regional mechanisms shape the economic value of the ESG score.
This paper is structured as follows. Section 2 reviews the literature and develops hypotheses on the ESG–financial performance nexus. Section 3 describes the research design, including the sample, data, and variables. Section 4 presents the empirical analysis, outlining the econometric framework, descriptive statistics, and correlation tests. Section 5 reports and discusses the regression results for ROA, ROE, and WACC across Nordic and non-Nordic European firms. Finally, Section 6 concludes with key findings, managerial implications, limitations, and recommendations for future research.
To deepen this comparative perspective, the study formulates directional hypotheses for each ESG pillar by region, reflecting differences in institutional enforcement, reporting culture, and financing structures between Nordic and non-Nordic Europe.
2. Literature Review and Development of Hypotheses
Environmental, Social, and Governance (ESG) refers to non-financial information regarding how a firm addresses various sustainability issues, and its significance for firm valuation has grown significantly in recent years [1]. Despite the lack of standardized reporting on ESG metrics, scholars argue that ESG scores are crucial for adapting to environmental changes and can serve as an integral component of a company’s competitive strategy [2]. ESG scores, readily accessible through various financial databases, are often used as a proxy for corporate sustainability performance [3]. These scores are typically divided into three components: environmental, social, and governance initiatives. The environmental score evaluates factors such as CO2 emissions and waste management; the social score assesses areas like equality, human rights, and labor conditions; and the governance score includes metrics related to shareholder rights, anti-corruption practices, and board structure. The composite ESG score, which combines these three pillars, is offered by well-known databases like ASSET4, SAM, Bloomberg, and Thomson Reuters EikonTM [4], with the latter being the source used in this study.
The relationship between ESG performance and firm financial outcomes has garnered growing attention in academic research over the past decade. However, despite this extensive body of work, a theoretical gap remains: prior studies have rarely combined multiple theoretical perspectives to explain why ESG-performance relationships differ across institutional and regional contexts. Addressing this theoretical gap is essential for moving beyond descriptive correlations and toward a more conceptually grounded understanding of the ESG-performance nexus. ESG scores are increasingly recognized as potential drivers of corporate financial performance, although the findings on this relationship remain diverse across regions, industries, and specific ESG pillars. While many studies have examined the individual effects of each ESG component (environmental, social, and governance) on firm performance, there is still a lack of comparative analyses, particularly regarding the differences between ESG impacts on Nordic and non-Nordic European firms. Existing literature reveals three primary patterns regarding the ESG–financial performance link: positive, negative, and neutral/mixed relationships. The findings vary considerably depending on geographic and industry-specific factors. In some regions, the positive impact of ESG initiatives on financial outcomes is more pronounced, while in others, the relationship remains neutral or even negative. This variation underscores the complexity of the ESG-performance relationship, suggesting that ESG factors influence corporate success differently based on contextual variables such as regional maturity, regulatory frameworks, and industry characteristics.
The relationship between ESG (Environmental, Social, and Governance) factors and financial performance has been a subject of scholarly interest since the early 1970s, with the first study on this topic emerging during that period [5] Over the subsequent decades, academic research on ESG and its impact on firm performance has flourished, with more than 2,200 studies published by 2019 [3]. Although the terminology has evolved over time, with terms such as Socially Responsible Investing (SRI) and Corporate Social Performance (CSP) being used interchangeably with ESG, the core focus of these studies remains largely consistent. All of these frameworks aim to assess how sustainable business practices—whether labeled as ESG, SRI, or CSP—affect a company's financial outcomes. This body of research suggests a growing consensus that integrating ESG principles not only contributes to positive social and environmental outcomes but can also result in financial benefits for firms, highlighting the potential for ESG practices to be a source of competitive advantage.
2.1. Positive Relationship:
The relationship between Environmental, Social, and Governance (ESG) scores and firm performance has been extensively examined in the literature, though the findings remain varied. Some studies have reported a positive connection between sustainability practices and financial outcomes. For instance, a meta-analysis conducted by [6] reviewed over 1,000 articles published between 2015 and 2020 and found that 58% of studies identified a positive relationship between ESG performance and financial performance, though the evidence remains mixed. [7] analyzed a sample of 4,887 firms from 2014 to 2018 and concluded that strong performance across the environmental, governance, and social pillars correlates with higher market value. Similarly, [8], examining 1,038 firms across Europe, found a positive association between ESG factors and profitability, specifically Return on Equity (ROE) and Return on Assets (ROA), with governance having a particularly strong effect, especially among German firms.
Several multi-country studies have also supported the positive link between ESG performance and firm financial outcomes. [9] found that most ESG initiatives are positively associated with financial performance, though some results were mixed. [10] examined the financial success of 65 Indian firms between 2015 and 2017 and observed a positive impact of ESG scores on firm performance. Likewise, [11] found a positive relationship between ESG score and firm performance in large Italian firms, noting that the environmental and social pillars had a more significant impact, while governance showed no measurable effect. [12] argued that Corporate Social Responsibility (CSR) governance alone does not directly enhance financial performance, but when combined with environmental and social outcomes, it leads to improved performance metrics such as ROA and Tobin’s Q.
However, not all studies report a positive association. [13] found that in poorly governed environments, particularly in the MENA region, ESG score had a negative impact on firm value, suggesting that effective governance is essential for realizing the financial benefits of ESG engagement. [14] also reported a positive correlation between a firm’s ESG rating and its financial performance, as measured by ROA and Tobin’s Q, and noted that a one-year time lag between ESG performance and financial outcomes was significant. These mixed findings underscore the complexity of the ESG–performance relationship, suggesting that its impact is contingent on regional, industry, and governance contexts.
2.2. Negative Relationship:
While a positive relationship between ESG performance and financial outcomes is widely documented, some studies report a negative connection. [5] conducted a meta-analysis and found a weakly negative relationship between ESG performance and financial performance, suggesting that the benefits of ESG engagement are not universally experienced. Similarly, [15] reported mixed results, with certain ESG factors showing a negative correlation with financial performance. [16], in their analysis of European firms, found that corporate controversies had a negative impact on financial performance (specifically ROE and ROA), with ESG practices alone insufficient to mitigate these financial damages. [17] analyzed 510 firms across 17 countries and concluded that ESG performance generally had a negative and statistically significant effect on financial metrics like ROA, ROE, and Tobin’s Q, particularly due to the negative impact of the environmental and social components. Likewise, studies by [18] and [19] observed negative correlations between ESG scores and both ROA and Tobin’s Q. Additionally, [20] found a negative relationship between WACC and ESG performance, further suggesting that, in certain contexts, ESG initiatives may increase the cost of capital rather than reduce it. These findings highlight the complexity and variability of the ESG–performance relationship, indicating that the impact of ESG factors on financial outcomes may not always be positive and can depend on factors such as corporate governance, industry, and the nature of ESG initiatives.
2.3. Neutral and Mixed Relationships:
In addition to the positive and negative findings, several studies have reported neutral or mixed results regarding the relationship between ESG performance and financial outcomes. [21], in their review of 11 studies, found a mix of positive and negative correlations between ESG scores and firm performance. [22] examined Norwegian companies and observed a positive link between ESG scores and firm value (Tobin’s Q), but a negative correlation with profitability (ROA). Similarly, [23] analyzed the energy sector in India and found mixed outcomes, with the impact of ESG reporting varying by pillar. For example, environmental reporting had a negative effect on financial performance, while social and governance aspects had a positive influence. [24] explored the Turkish market and discovered that environmental reporting negatively impacted financial performance, while the social and governance dimensions showed a positive effect. These findings highlight that the results depend significantly on the ESG index used and the specific context in which ESG data is reported. This variability underscores the need for further research to better understand the nuanced impact of ESG across different regions and industries. Additionally, [25]examined the effect of ESG scores on profitability, firm value, and cost of capital for publicly listed companies in Malaysia, finding no significant relationship between ESG scores and either firm value or profitability, further contributing to the mixed nature of the ESG–financial performance relationship.

Table 1.
Literature on the positive, negative, and mixed and neutral association between ESG and performance.
Table 1.
Literature on the positive, negative, and mixed and neutral association between ESG and performance.
| Firm performance variable measures used | The direction of the relationship with ESG performance | |||
| Positive | Negative | Mixed and Neutral | ||
| Financial performance | ROA | De Lucia et al. (2020) | Nirino et al.,( 2021) | Bhaskaran et al., (2020) |
| Velte (2017) | Shaikh(2022) | Friede et al. (2015) | ||
| Xie et al (2019) | P. & Busru,( 2021) | Buallay (2019) | ||
| Dalal & Thaker (2019) | Sharma et al., (2019) | Saygili et al., (2022) | ||
| Carnini Pulino et al. (2022) | Atan et al (2018) | |||
| Wang & Sarkis (2017) | Giannopoulos et al. (2022) | |||
| Thomas et al., (2021) | Halid et al., (2023) | |||
| ROE | De Lucia et al. (2020) | Shaikh(2022) | Bhaskaran et al.(2020) | |
| Thomas et al.(2021) | Nirino et al., (2021) | Friede et al. (2015) | ||
| Buallay (2019) | ||||
| Halid et al.,( 2023) | ||||
| WACC | Priem & Gabellone, (2022) | Atan et al (2018) | ||
| Source: Prepared by the authors. | ||||
Building on the empirical evidence summarized in Sections 2.1–2.3, the following subsection moves beyond descriptive results to explore the underlying mechanisms that may explain why ESG–performance linkages vary across regions and industries.
2.4. Policy Incentives, Financing Frictions, and Transition Dynamics
Recent studies highlight the channels through which environmental regulations influence firms’ financial and strategic behavior. [26] show that penalties, taxes, and subsidies affect corporate environmental investment through financing constraints and executive incentives, implying that institutional enforcement and policy credibility determine how strongly environmental performance translates into lower financing costs. This mechanism is particularly relevant for comparing Nordic and non-Nordic firms: in economies where policy risk is credibly priced and environmental regulations are consistently enforced, ESG score is more likely to reduce firms’ weighted average cost of capital (WACC) and enhance firm value.
At the industry level, [27] reveal that climate transition risk, carbon-market uncertainty, and green innovation shape differential returns across sectors. Incorporating this lens allows us to interpret industry-specific ESG effects as responses to transition pressures and technological readiness. Sectors with higher exposure to carbon-price volatility or faster green-innovation cycles may exhibit stronger ESG–performance linkages, as ESG investments help mitigate transition risk.
Together, these perspectives suggest that both institutional enforcement and transition exposure mediate the ESG–performance relationship, reinforcing the importance of regional and industry contexts
While Section 2.4 highlights the regulatory and transition mechanisms that shape the ESG–performance relationship, a comprehensive theoretical foundation is required to conceptually frame these dynamics and derive the study’s hypotheses. The next section therefore develops the theoretical framework underpinning this research.
2.5. Theoretical Framework
To conceptually ground the mechanisms and empirical patterns discussed above, this section develops the theoretical framework explaining how ESG score influences firm performance through agency, signalling, and institutional channels.
In response to this theoretical gap identified in the literature, the present study develops a comprehensive framework that draws upon three complementary lenses—agency, signalling, and institutional theories—to conceptually explain the ESG-performance relationship. The relationship between ESG score and firm performance can be theoretically explained through three complementary lenses: signalling theory, agency theory, and institutional theory. Traditional financial reports are often insufficient to capture the multidimensional aspects of corporate activities [28]. Consequently, regulatory frameworks such as the EU Non-Financial Reporting Directive require large firms to disclose non-financial information through instruments like Integrated Reports and Sustainability Reports[29]. Such scores help to reduce information asymmetry and mitigate agency costs—both key concerns highlighted by agency theory [30,31]. Moreover, consistent with signalling theory, voluntary sustainability reporting serves as a credible signal of a firm’s long-term commitment to responsible practices, thereby enhancing its reputation, investor confidence, and ultimately, its financial performance [32]. Finally, institutional theory emphasizes that firms respond to external pressures from regulatory, normative, and cultural environments, adopting ESG score practices to gain legitimacy and align with evolving societal expectations.
2.5.1. Agency Theory
According to agency theory, the firm is conceptualized as a nexus of contracts between principals (owners) and agents (managers), where the separation of ownership and control creates potential conflicts of interest [33,34]. While the principal delegates decision-making authority to the agent with the expectation that managerial actions will serve the principal’s long-term interests, managers often pursue personal objectives or short-term gains that may not align with shareholder value[35,36]. This divergence of goals generates agency costs, including moral hazard and information asymmetry. However, robust corporate governance mechanisms—such as enhanced transparency, independent oversight, and comprehensive financial and non-financial score (ESG reporting)—can mitigate these conflicts by aligning managerial and stakeholder interests [37,38]. In this context, ESG initiatives play a complementary role by signalling managerial integrity and fostering accountability, thus reducing opportunistic behaviour and improving long-term firm performance. Taken together, these theoretical insights provide a strong conceptual foundation for understanding variations in the ESG–performance relationship across different institutional environments, particularly between Nordic and non-Nordic firms, where governance maturity and stakeholder orientation differ substantially.
2.5.2. Signalling Theory
Within the signalling theory perspective, information plays a foundational role in market transactions, and managers can mitigate information asymmetry by voluntarily sharing decision-relevant information with external stakeholders[39,40]. Firms therefore invest resources to disclose credible, often non-replicable information on their sustainability commitments—via ESG and related reports—to provide stakeholders with insights unavailable elsewhere [41,42]. Signalling theory formalizes this process through four elements—signal, signaller, receiver, and feedback—whereby internal management (signaller) transmits an information stream (signal) to external stakeholders (receivers), whose subsequent reactions constitute feedback and complete the information loop [43,44]. In this setting, voluntary ESG score operates as a credible signal of managerial quality and long-term orientation: when score is costly or supported by third-party assurance, its credibility rises, reducing information asymmetry, curbing scepticism about managerial intent, and strengthening relationships with shareholders, customers, and other stakeholders [45,46]. In markets characterized by sophisticated investors and high transparency, such signals are more efficiently impounded into prices, contributing to a lower weighted average cost of capital and higher firm valuation. More broadly, signalling theory holds that organisations use observable signals to communicate intentions, identity, conduct, and performance, thereby alleviating informational frictions and improving both capital-market and stakeholder assessments.
2.5.3. Institutional Theory
According to institutional theory, organizational behavior is shaped, mediated, and constrained by the broader institutional environment composed of formal regulations, informal norms, and cultural-cognitive expectations[47,48]. Institutions establish the “rules of the game” that define legitimate conduct, influence organizational priorities, and determine how sustainability is interpreted and implemented across sectors. In the context of corporate sustainability, institutional theory emphasizes how firms respond to coercive pressures (laws and regulations), normative pressures (professional and societal expectations), and mimetic pressures (imitation of best practices) to gain legitimacy within their socio-economic environments.
Building on this foundation, institutional maturity refers to the extent to which market, legal, and regulatory systems effectively enforce sustainability-related norms and enable transparent, accountable capital markets. Firms embedded in more mature institutional contexts—such as those in Nordic countries—face stronger normative and coercive pressures to internalize environmental, social, and governance (ESG) standards. These pressures not only enhance organizational legitimacy but also reduce information asymmetry and financing costs, leading to a more stable and trustworthy investment environment. Consequently, institutional theory provides a robust lens for understanding why the ESG-performance relationship varies across regions with differing levels of institutional development.
These regional distinctions align with institutional theory, as firms in more mature environments (e.g., Nordic countries) respond more strongly to ESG incentives and experience lower financing costs, whereas firms in less mature contexts may face short-run trade-offs between ESG commitments and financial outcomes.
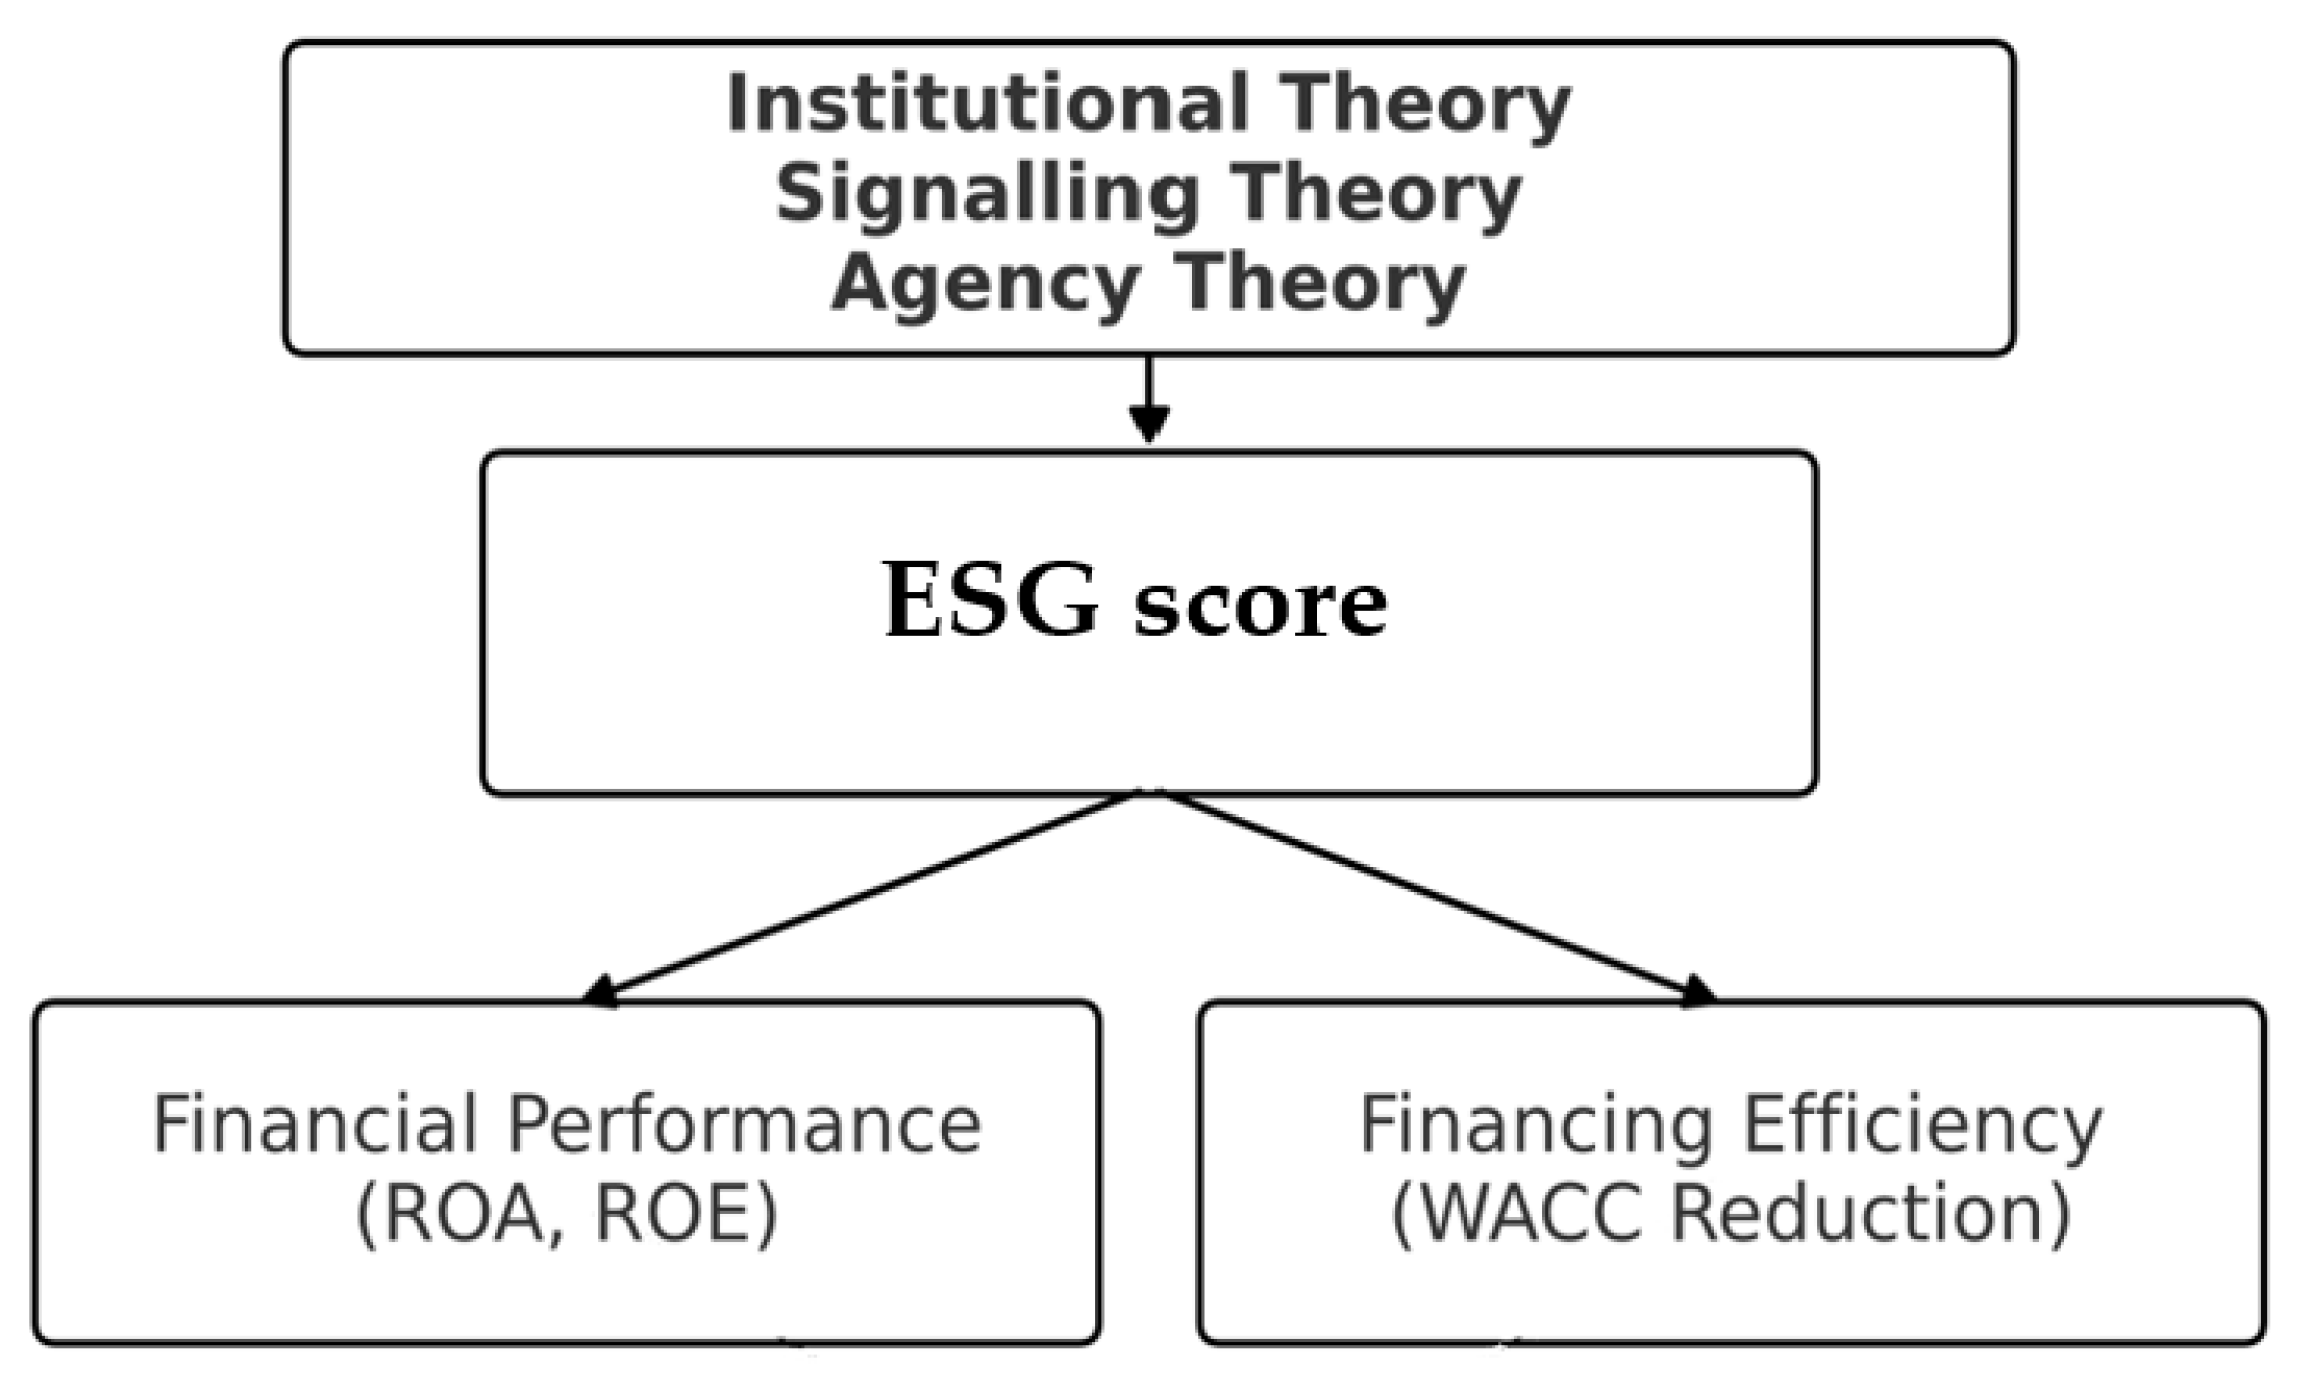
Figure 1.
illustrates the conceptual framework of the study. ESG score, grounded in agency, signalling, and institutional theories, is expected to enhance firm performance (ROA, ROE) and reduce financing costs (WACC).
Figure 1.
illustrates the conceptual framework of the study. ESG score, grounded in agency, signalling, and institutional theories, is expected to enhance firm performance (ROA, ROE) and reduce financing costs (WACC).
2.6. Hypotheses
Drawing from the literature, the following hypotheses are proposed to explore the relationship between ESG pillar scores and firm performance, specifically focusing on Nordic countries in comparison to non-Nordic European countries.
In our hypotheses and tests, ESG denotes the Refinitiv composite ESG score, a performance-oriented composite rather than a pure disclosure metric.
In light of the literature review above, considering the increased interest from investors and public image of the firm, we expect high performance on ESG scores to have a positive impact on firm value and profitability. The following hypotheses are tested:
2.6.1. Main Hypothesis (H1):
There exists a significant relationship between ESG scores and firm performance measures in Nordic countries, and this relationship can be compared with that of firms in non-Nordic European countries.
2.6.2. Sub-Hypotheses:
- H1a (Environmental Pillar): The environmental score (E) has a significant impact on firm performance measures.
We expect a neutral or slightly positive effect in Nordic countries due to strong environmental regulations, and a negative or insignificant short-term effect in non-Nordic countries due to transition costs and weaker policy enforcement.
Rationale: Based on the literature, environmental performance can reduce operational costs and enhance reputation. In Nordic countries, with mature green regulations, this leads to better financial outcomes. However, in non-Nordic Europe, the short-run adjustment costs may offset these gains.
- H1b (Social Pillar): The social score (S) has a significant impact on firm performance measures.
We expect a positive association in both Nordic and non-Nordic samples, with potentially stronger effects in Nordic firms due to cultural emphasis on social responsibility.
Rationale: Strong social performance improves employee satisfaction, customer trust, and long-term profitability. Nordic business culture often integrates social goals deeply, enhancing the link.
- H1c (Governance Pillar): The governance score (G) has a significant impact on firm performance measures.
We expect a negative association with WACC in both Nordic and non-Nordic samples, but a stronger impact in the non-Nordic group, where governance quality plays a more critical role in investor confidence.
Rationale: Good governance practices reduce agency costs and improve capital access. In non-Nordic markets with more institutional uncertainty, strong governance signals have a higher marginal value.
Many academic studies and observations from market practice suggest a positive relationship between ESG and firm value and profitability. However, there are also quite a number of negative and mixed results in previous research. Using the hypotheses, the paper will attempt to contribute to this debate with a large, recent, and comprehensive dataset.
3. Research Methodology
This section outlines the methodology employed to explore the relationship between Environmental, Social, and Governance (ESG) performance and firm financial outcomes. The analysis focuses on three key dependent variables: Return on Assets (ROA), Return on Equity (ROE), and Weighted Average Cost of Capital (WACC).
The independent variables in this study include overall ESG performance as well as the individual pillars of ESG: Environmental (E), Social (S), and Governance (G). To account for additional factors that may affect firm performance, control variables such as leverage, beta, and firm size are incorporated into the models.
For each dependent variable, three panel data models are applied, while four models are estimated for each independent variable to assess the impact of ESG scores on financial performance.
Most of the existing literature reviewed in this study employs a quantitative research methodology, with a few exceptions utilizing case study approaches. For example, [49] incorporate a survey for part of their data collection, focusing on corporate social responsibility and firm reputation. However, reputation is inherently qualitative, and thus, a qualitative methodology is required. Since it is not feasible to analyze financial data through surveys or other qualitative methods, this approach does not align with the research objectives of the current study.
In contrast, quantitative research is often employed to examine the correlation between variables that can be expressed numerically [50]. Given that this study seeks to explore the relationship between numerically defined variables, a quantitative approach is deemed the most suitable for addressing the research objectives. Therefore, this methodology has been selected for the present investigation.
3.1. Sample Data
The sample consists of publicly listed European firms collected from the Refinitiv database over the period 2015–2024. We restrict the dataset to companies with available ESG scores, resulting in approximately 2,450 firm-year observations annually, or 24,500 observations in total. Of these, 530 firm-year observations (around 22% of the sample) correspond to Nordic companies, while the remaining 1,920 observations per year are drawn from the non-Nordic European countries. To construct the final sample, ESG scores were combined with financial data to form a complete dataset. The sample for this study was restricted to publicly listed and de-listed (inactive) companies across the Nordic and non-Nordic European countries' exchanges, as recommended by [51] and [52]. This approach helps mitigate survivorship bias, ensuring more robust and generalizable inferences about the relationship between ESG and financial performance. This is especially important for the return analysis. Companies without an ESG score for the period from 2015 to 2024 were excluded, although companies with limited annual ESG score data were included. This filtering criterion ensures that the dataset remains representative and relevant. The sample covers listed firms across multiple European countries and industries. A full list of country and industry classifications is provided in Appendix A.
The study period of 2015–2024 was selected for both conceptual and data-quality reasons. ESG score data for European firms have become broadly available and methodologically consistent only after 2015, coinciding with the implementation of the EU Non-Financial Reporting Directive (Directive 2014/95/EU) and the global Paris Agreement on climate change. These regulatory milestones mark the beginning of systematic ESG reporting across Europe. Extending the sample through 2024 allows the analysis to capture the evolution of ESG practices through major structural shifts—including the European Green Deal initiatives and the post-COVID-19 recovery period—while ensuring data completeness across countries and industries. Therefore, this ten-year window provides a balanced and representative period for evaluating how ESG score affects firm performance and financing outcomes.
To further enhance the robustness of the analysis, the sample was limited to the period from 2015 to 2024, ensuring the data is both current and reliable. Extreme outliers in continuous variables were winsorized at the 5th and 95th percentiles, by variable and at the firm-year level, to reduce the influence of extreme values. The descriptive statistics reported in Table 5 are based on these winsorized values to ensure consistency and robustness across variables. In addition, all variables were harmonized for unit and scale consistency across sections and tables to ensure comparability and accuracy of results.
This method, commonly used in academic research, reduces the influence of extreme values that could otherwise distort the results, ensuring the reliability of the statistical analysis and preventing misleading conclusions. The 2450 sample firms belong to 12 different sectors, as reported below in Fig.1. The data collected for this study are annual firm-level panel observations combining ESG scores from Refinitiv (LSEG) with financial statement and market variables. Focusing on 2015–2024 ensures reliable and consistent ESG coverage, as prior to 2015 reporting was sparse and uneven across countries. This period also captures important developments in European ESG regulation and reporting standards, which makes the findings more relevant to current debates. Using both active and delisted firms reduces survivorship bias, and the inclusion of 12 industries ensures broad sectoral representation. By restricting the sample to publicly listed companies, the study aligns with the availability of standardized ESG data but may not reflect private firms’ practices. Future research could extend the analysis to post-2024 data to examine whether the relationships documented here persist as ESG regulations continue to evolve, and could also include alternative data sources or higher-frequency scores (e.g., quarterly or event-driven) to capture shorter-term dynamics in the ESG-performance link.
Figure 2.
ESG Score Availability By Industry. Source: Prepared by the authors.
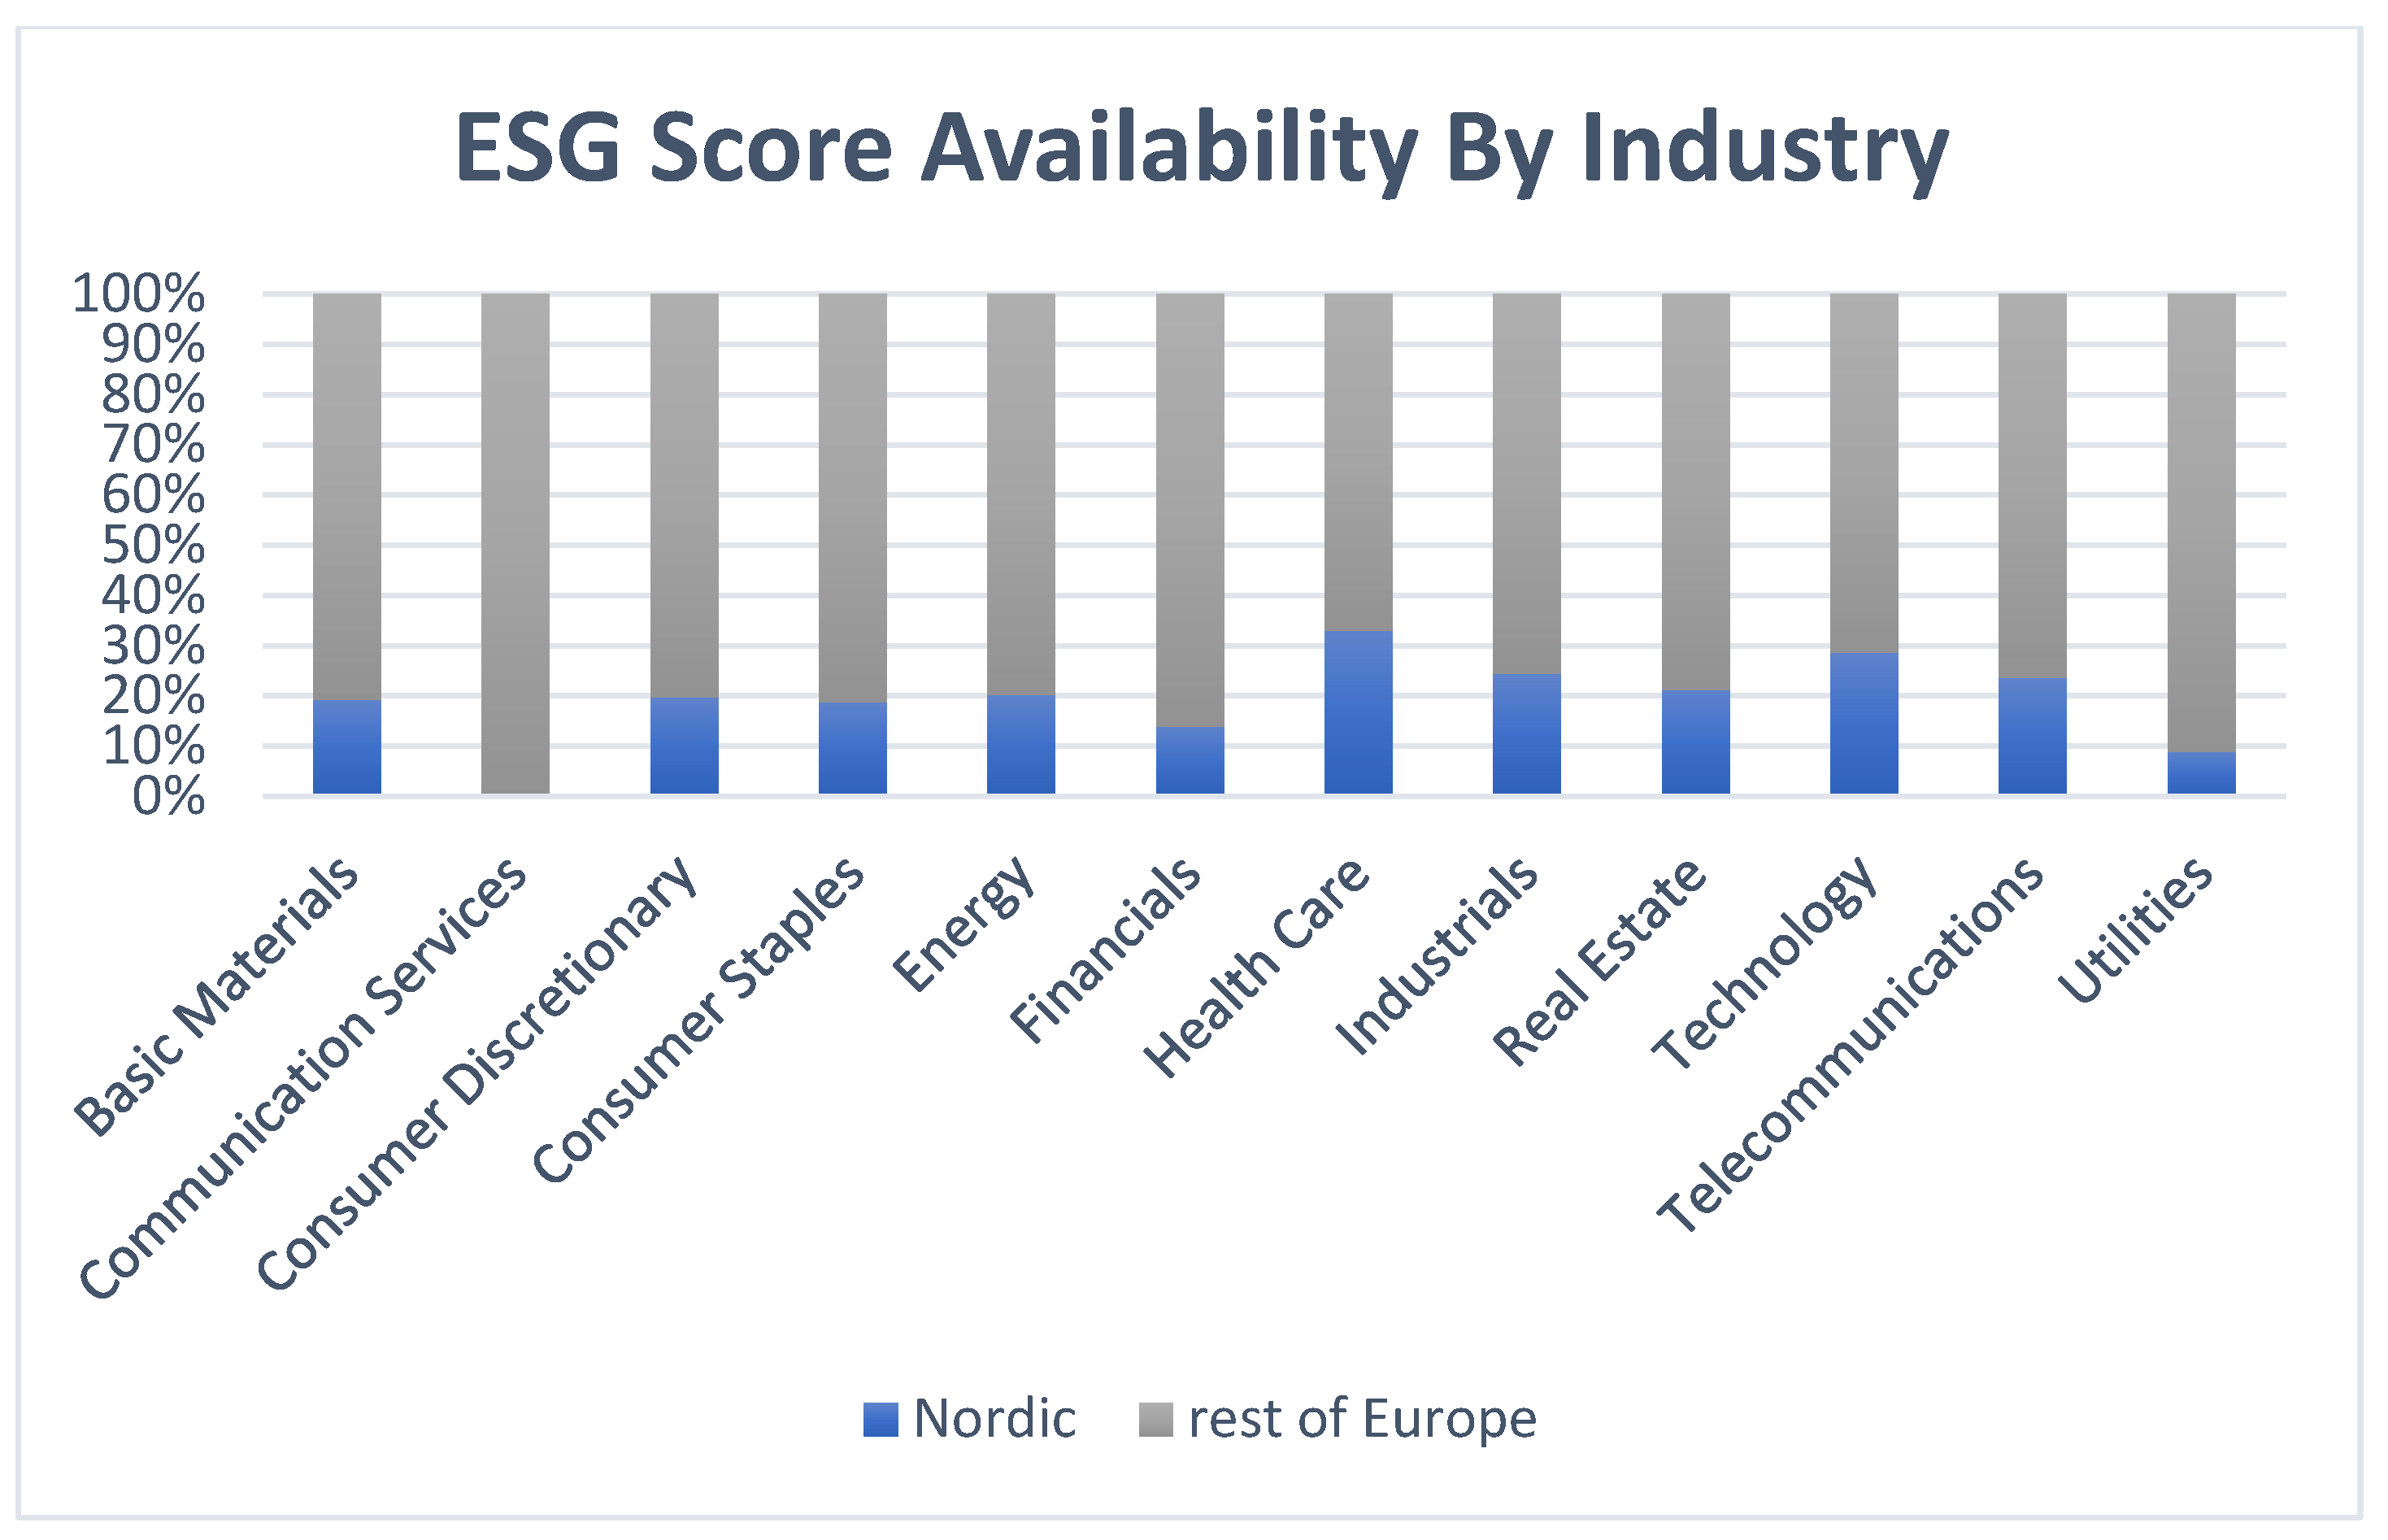
Because Figure 2 illustrates the industry composition of the sample, we also verified that differences in industry mix between Nordic and non-Nordic firms do not drive the results. The findings remain robust after including industry controls (industry fixed effects) in the regression models.
4. Empirical Analysis
4.1. Measurement of Variables
4.1.1. Dependent Variables
There are three financial performance indicators in the present analysis, which are defined as the dependent variables. Following prior literature ([15,22,24,53,54,55] the first two measures considered in the study are ROA (return on assets) and ROE (return on equity). While ROA is measured as the proportion of net income to total assets, ROE is the ratio between net income to shareholders’ equity [14,25,56]. The Weighted-Average Cost of Capital (WACC) is the third dependent variable. The cost of capital is the rate of return a company requires to finance its investments, representing the weighted average cost of equity and debt[20].
4.1.2. Control Variables
We select Size, Leverage, and Beta, as control variables [22], [25,53,57,58]. In addition, Table 2 reports an alternative leverage proxy, the debt-to-equity ratio (DTE), and our regression specifications include year, industry, and country fixed effects to absorb time-varying macroeconomic, sectoral, and regional heterogeneity. Table 2 provides a summary of all variables.
4.1.3. Independent
The paper uses four independent variables, namely ESG combined score, Environment score, Social score, and Governance score. All ESG scores are from Refinitiv. Many researchers prefer to use Refinitiv ESG scores in their papers[22,56,59]. In this study, the LSEG database ESG score is updated continuously with weekly recalculations; however, the ESG scores are only reported annually, so that each firm’s official ESG score is only finalised and published once a year. This may put limitations on the transparency of their actual ESG performance because it can fluctuate throughout the year.
Three pillars and their themes are as follows: Environment (emissions, innovation, and resource usage), Social (human rights, workforce, product responsibility, and community), and Governance (shareholders, management, and CSR Strategy). Refinitiv gathers most of the data from public sources such as business websites, annual reports, and other company reports. They also obtain some of the data directly from the company. They audit and standardize this data and prepare ESG scores.
In the empirical analysis, “ESG” is operationalized using the Refinitiv composite ESG score. This is a performance-oriented composite that blends disclosure-based inputs with inferred outcomes from public sources and company reports, rather than a pure disclosure metric. Accordingly, throughout the empirical sections we refer to the independent variable as ESG score (Refinitiv) and interpret results as relating to ESG performance as captured by this composite measure.
Table 2.
Variables of the Study.
| Variables | Labels | Formula | Description | Source and References |
| Dependent variables | ||||
| ROA | Net Income/Total Assets | Return on assets is the calculation of the profitability as a percentage of the net Income in proportion to all the assets owned by the company. | [11,14,21,22,24] | |
| ROE | Net income/shareholders’ equity | Return on equity determines the benefit as a proportion of the net income to the shareholder equity. | [13,17,20,21] | |
| WACC | [E/ (D + E)].RE +[D/ (D + E)]. RD .(1 -T) | The cost of capital is the rate of return a company requires to finance its investments, representing the weighted average cost of equity and debt. | [20,25] Atan et al (2018) | |
| Independent variables | ||||
| ESG score | ESG | The scores range from 1 to 100 | Total combined score | Refinitiv ESG Scores |
| Environment score | E_score | The scores range from 1 to 100 | Environment score of the sample companies | Refinitiv ESG Scores |
| Social score | S_score | The scores range from 1 to 100 | Social score of the sample companies | Refinitiv ESG Scores |
| Governance score | G_score | The scores range from 1 to 100 | Governance score of the sample companies | Refinitiv ESG Scores |
| Control variables | ||||
| BETA | beta factor | Systematic risk of a company's stock | [57] | |
| LEVERAGE | Total debt / total assets | Leverage is using third-party capital to finance part of a company’s investments, increasing the potential return for shareholders and financial risk | [21,25] | |
| SIZE | ln(market capitalization) | Natural logarithm of market capitalization. | [22,24] | |
| DTE | Total debt / shareholders' equity | measures a company's financial leverage by comparing the amount of its debt to the value of its shareholders' equity | [17,24,58] | |
Notes: Table 2 summarizes all variables used in the analysis, their operational definitions, data sources, and representative recent studies that employ similar measures. All financial data were obtained from Refinitiv Eikon, and ESG metrics were extracted from the Refinitiv ESG database for 2015–2024.
4.1.4. Data Processing and Preparation
Before conducting the econometric analysis, several steps were undertaken to ensure data quality and consistency. First, firm-level financial and ESG data were merged using company identifiers provided in the Refinitiv Eikon database. Observations with missing values for key variables (ROA, ROE, WACC, or ESG scores) were removed to avoid bias from incomplete records. Extreme outliers in continuous variables were winsorized at the 1st and 99th percentiles, following standard practice in panel-data research.
All monetary values were converted to U.S. dollars (USD) to maintain cross-country comparability, and the dataset was checked for internal consistency and balance. Variables were tested for multicollinearity using Variance Inflation Factors (VIF), with all values below 10, indicating no serious collinearity problems. Finally, continuous variables were mean-centered and standardized before regression to reduce scale heterogeneity.
These preprocessing steps ensured that the dataset used in the empirical analysis was clean, balanced, and statistically reliable.
4.2. Empirical Framework
To investigate the research objectives of this study, panel data regression is employed. The dataset consists of panel data from 2450 companies over a period of 10 years. The analysis uses three primary dependent variables: Return on Assets (ROA), Return on Equity (ROE), and Weighted Average Cost of Capital (WACC), to measure financial performance.
4.3. Hausman Test:
The choice between fixed-effects (FE) and random-effects (RE) models depends on whether the unobserved firm-specific effects are correlated with the explanatory variables. In the fixed-effects model, these unobserved characteristics are allowed to correlate with the independent variables, making FE suitable when such correlation exists. Conversely, the random-effects model assumes that the individual effects are uncorrelated with the regressors, providing more efficient estimates when this assumption holds.
To empirically determine which specification is appropriate, the Hausman test is employed.
- Null hypothesis (H₀): Random-effects estimator is consistent (no correlation between individual effects and regressors).
- Alternative hypothesis (H₁): Random-effects estimator is inconsistent (correlation exists).
If the p-value is below 0.05, the null hypothesis is rejected and the fixed-effects model is preferred; otherwise, the random-effects model is retained.
This testing procedure was applied separately for Nordic and non-Nordic samples using ROA, ROE, and WACC as dependent variables. The resulting p-values and model choices are reported in Table 3 and Table 4.
As shown in Table 3, for Nordic countries, the p-values for ROA (0.3909), ROE (0.0014), and WACC (2.2e-16) indicate that the random-effects model is suitable only for ROA, while the fixed-effects model is appropriate for ROE and WACC.
In contrast, Table 4 shows that for non-Nordic European firms, the p-values for all dependent variables (ROA, ROE, and WACC) are below the 0.05 significance level, leading to rejection of the null hypothesis and confirming that the fixed-effects model should be used across all specifications.
These results guided the selection of model types in the subsequent regression analyses (Table 7, Table 8 and Table 9).
Table 3.
Hausman Test Results for Nordic Countries (Model Selection between Fixed and Random Effects).
Table 3.
Hausman Test Results for Nordic Countries (Model Selection between Fixed and Random Effects).
| Dependent variables | Test result | Chi-square | p-value |
| ROA | Fixed effects | 145.91 | 2.2e-16 |
| ROE | Fixed effects | 165.27 | 2.2e-16 |
| WACC | Fixed effects | 130.73 | 2.2e-16 |
Table 4.
Hausman Test Results for Non-Nordic European Countries (Model Selection between Fixed and Random Effects).
Table 4.
Hausman Test Results for Non-Nordic European Countries (Model Selection between Fixed and Random Effects).
| Dependent variables | Test result | Chi-square | p-value |
| ROA | Random effects | 14.816 | 0.3909 |
| ROE | Fixed effects | 35.086 | 0.001428 |
| WACC | Fixed effects | 143.14 | 2.2e-16 |
Source: Prepared by the authors.
So the final model for Nordic and non-Nordic countries is estimated as follows:
4.4. Descriptive Statistics:
Table 5 presents the descriptive statistics for the variables used in the empirical analysis. The overall ESG score has a mean value of 51.80 with a standard deviation of 20.91, and ranges from 0.69 to 95.68, indicating substantial cross-sectional heterogeneity in firms’ sustainability performance. Among the ESG pillars, the social score (SESG) displays the highest average level (mean 55.25) and relatively high dispersion (SD 23.73), while the environmental (EESG) and governance (GESG) scores exhibit slightly lower means of 47.42 and 50.62, respectively, together suggesting that firms tend to be more advanced on social and governance dimensions than on environmental disclosure.
Regarding financial performance, the mean ROA is 0.0421, with values spanning from −0.1074 to 0.1618, and the mean ROE is 0.1067, ranging between −0.2582 and 0.3873. These figures are consistent with moderate profitability, but also reveal notable dispersion across the weighted average cost of capital (WACC) averages 0.0667 with a standard deviation of 0.0286 and varies between 0.0230 and 0.1288. WACC is expressed in decimal form, and enters the regression analysis using the same scale to maintain consistency and interpretability of coefficients.
The control variables also show considerable variation. The leverage ratio has a mean of 0.5564 and a relatively large standard deviation 0.2326, indicating that some firms rely much more heavily on debt financing than others. The market beta averages 0.95, pointing to an overall exposure to systematic risk close to the market benchmark, but with values ranging from strongly defensive to highly volatile firms. The natural logarithm of market capitalization (log_Market_cap) has a mean of 20.91 and ranges from 5.05 to 26.76, confirming that the sample includes both small and very large listed companies. In addition, the debt-to-equity ratio (DTE), reported in Table 5, exhibits substantial dispersion, which further underscores the diversity of capital structures in the sample and motivates controlling for firms’ financing profiles in the subsequent regression analysis.
The relatively large standard deviations observed for the ESG, EESG, SESG, and GESG variables indicate substantial cross-sectional heterogeneity in sustainability performance across firms and regions. This variation reflects differences in institutional maturity, industry structure, and corporate size between Nordic and non-Nordic European companies. Specifically, Nordic firms tend to report consistently higher ESG scores due to mature regulatory frameworks, whereas non-Nordic firms exhibit wider score dispersion as ESG adoption remains uneven across sectors and countries. Hence, the observed dispersion is theoretically expected and consistent with previous multi-country ESG studies [14,15,25], confirming the representativeness and realism of the dataset.
Table 5.
Descriptive statistics.
| mean | sd | median | mad | min | max | |
|---|---|---|---|---|---|---|
| ESG_Score | 51.8034 | 20.9069 | 53.0784 | 23.6352 | 0.6856 | 95.6782 |
| EESG_Score | 47.4218 | 27.3601 | 48.1523 | 33.7489 | 0.0000 | 99.0634 |
| SESG_Score | 55.2456 | 23.7315 | 57.3183 | 27.3202 | 0.2774 | 98.2021 |
| GESG_Score | 50.6151 | 23.3312 | 51.5280 | 28.2071 | 0.3234 | 98.8877 |
| ROA | 0.0421 | 0.0600 | 0.0405 | 0.0451 | -0.1074 | 0.1618 |
| ROE | 0.1067 | 0.1422 | 0.1088 | 0.0961 | -0.2582 | 0.3873 |
| WACC | 0.0667 | 0.0286 | 0.0635 | 0.0294 | 0.0230 | 0.1288 |
| Leverage | 0.5564 | 0.2326 | 0.5664 | 0.2375 | 0.1016 | 0.9412 |
| Beta | 0.9452 | 0.5519 | 0.9011 | 0.4930 | -3.2237 | 8.5386 |
| DTE | 2.3332 | 3.0087 | 1.2480 | 1.1560 | 0.0639 | 12.0632 |
| log_Market_cap | 20.9103 | 1.9592 | 20.8732 | 1.9023 | 5.0519 | 26.7567 |
Source: Prepared by the authors.
4.5. Correlation Matrix:
Table 6 presents the Pearson correlation matrix for all variables used in the analysis. As expected, the overall ESG score is strongly correlated with its underlying pillars (EESG, SESG, and GESG), with some pairwise coefficients exceeding 0.80. This outcome is mechanical because Refinitiv constructs the composite ESG score directly from the environmental, social, and governance pillars. To avoid mechanical collinearity, the empirical models do not include the composite ESG score and the individual pillars in the same specification; instead, each regression uses either the aggregate score or one pillar at a time (Models 1–4). Correlations between ESG-related variables and financial performance indicators are generally low. Specifically, the correlations between ESG (and its pillars) and ROA, ROE, or WACC are small in magnitude and far below the conventional threshold that signals multicollinearity. The correlation between ROA and ROE is relatively strong and positive, as expected, since both ratios capture similar profitability dimensions. Additionally, ESG measures show a moderate positive correlation with firm size (log of market capitalization), implying that larger firms tend to have higher ESG scores.
Regarding leverage indicators, the correlation between Leverage (total debt/total assets) and DTE (total liabilities/shareholders’ equity) is positive and moderately high but remains below 0.80, which is within acceptable limits. Moreover, multicollinearity was formally assessed through Variance Inflation Factors (VIF) for all model specifications. In all cases, VIF values remained well below the conventional cut-off of 10, confirming that multicollinearity is not a serious concern and does not distort the regression estimates.
Overall, the correlation structure aligns with theoretical expectations: ESG measures are highly correlated with each other by construction, moderately associated with firm size, and only weakly correlated with profitability and cost-of-capital measures. Combined with the VIF diagnostics and the modelling strategy that separates composite and pillar scores across specifications, these results confirm that collinearity does not threaten the validity of the regression analysis.
Table 6.
Correlation matrix.
| (1) | (2) | (3) | (4) | (5) | (6) | (7) | (8) | (9) | (10) | (11) | |
| ESG_Score(1) | 1 | ||||||||||
| EESG_Score(2) | 0.85160 | 1 | |||||||||
| SESG_Score(3) | 0.89935 | 0.73128 | 1 | ||||||||
| GESG_Score(4) | 0.72388 | 0.42731 | 0.45580 | 1 | |||||||
| ROA(5) | 0.06849 | 0.06044 | 0.07043 | 0.03622 | 1 | ||||||
| ROE(6) | 0.12162 | 0.11092 | 0.11446 | 0.07775 | 0.76114 | 1 | |||||
| WACC(7) | -0.07336 | -0.10167 | -0.09661 | 0.02827 | 0.07472 | 0.03129 | 1 | ||||
| Leverage(8) | 0.23490 | 0.25144 | 0.19665 | 0.16445 | -0.26027 | 0.07921 | -0.18189 | 1 | |||
| Beta(9) | 0.05490 | 0.04573 | 0.01527 | 0.10660 | -0.16326 | -0.10241 | 0.61759 | 0.13501 | 1 | ||
| DTE(10) | 0.17077 | 0.20671 | 0.11992 | 0.14377 | -0.25150 | 0.02551 | -0.14520 | 0.74567 | 0.12191 | 1 | |
| log_Market_cap(11) | 0.59829 | 0.56728 | 0.55656 | 0.37769 | 0.27415 | 0.28028 | -0.15317 | 0.11234 | -0.10396 | 0.14098 | 1 |
| Source: Prepared by the authors. | |||||||||||
5. Results and Discussion
In line with prior studies, the results highlight important regional differences in the ESG–performance nexus. Consistent with [15] and [22], Nordic firms appear to benefit from stronger ESG practices primarily through lower financing costs, supporting the view of ESG as a mechanism to reduce firm-specific risk. However, similar to findings in [24] on Turkish firms and [16]on corporate controversies, the results for the broader European sample show that higher ESG scores are often associated with weaker short-term profitability (ROA and ROE). This suggests that the upfront costs of sustainability investments may outweigh immediate benefits in less mature ESG environments. At the same time, governance quality consistently demonstrates a positive role in reducing WACC across both samples, confirming evidence from [10]and [8]that effective governance mechanisms enhance investor confidence and financing efficiency. Taken together, these results reinforce [5]meta-analysis, which reported that while the majority of ESG–performance studies find neutral or positive outcomes, the effect is highly sensitive to context, measurement, and time horizo.
5.1. Return on Asset (ROA)
Tables 7, 8, and 9 present the results of the regression models. Table 7 presents four different models to show the panel regression results of the relationship between ROA as a dependent variable and the independent factors—ESG Score, Environmental Score, Social Score, and Governance Score. The regressions are run on a sample of 530 companies and 2886 observations for Nordic companies, and also 1920 companies and 11717 observations in the rest of Europe. The association between ESG scores and ROA differs substantially between Nordic and European firms. For the Nordic sample, none of the ESG indicators are statistically significant across the models, indicating that ESG engagement does not translate into higher short-term profitability in mature institutional settings. The coefficients for the overall ESG score and its three pillars are close to zero, suggesting that even economically, a one-standard-deviation increase in ESG (≈ 20.9 points) would change ROA by less than 0.002 percentage points—a negligible magnitude. This outcome implies that Nordic firms may have already internalized sustainability practices as part of their operational efficiency, leaving little incremental financial gain from further ESG improvements. These findings align with [15,53], who similarly observed non-significant ESG-performance effects in highly regulated or ESG-advanced economies. These findings align with our directional hypotheses, confirming that environmental disclosure reduces ROA only in non-Nordic firms—likely due to implementation costs, market transition pressures, and lower investor tolerance for short-run ESG trade-offs. For the non-Nordic sample, the coefficients for ESG (−0.00012 **), E (−0.00009 **), and G (−0.0001 *) are negative and statistically significant, though economically small. A 10-point increase in the environmental score, for instance, is associated with only a 0.0009-unit decline in ROA—equivalent to less than one-tenth of a basis point—indicating that while ESG adoption may impose short-term adjustment costs, its financial impact remains limited in magnitude. Leverage is consistently negative and highly significant, confirming that higher debt ratios reduce accounting profitability, whereas firm size (log Market Cap) is positive and significant, reflecting economies of scale. The negative relationship observed between ESG and ROA is consistent with prior studies, such as[17,19,22,60]. Overall, the ROA analysis supports the interpretation that ESG engagement affects profitability minimally in both groups, though for different reasons: institutional saturation in the Nordics and transition costs in less mature non-Nordic markets.
5.2. Return on Equity (ROE)
Table 8 presents four different models to show the panel regression results of the relationship between ROE as a dependent variable and the independent factors—ESG Score, Environmental Score, Social Score, and Governance Score. The regressions are run on a sample of 530 companies and 2886 observations for Nordic companies, and also 1920 companies and 11716 observations in the rest of Europe. The association between ESG scores and ROE differs substantially between Nordic and European firms. For Nordic firms, the coefficients for ESG and its individual pillars (E, S, and G) are negative but statistically insignificant across all models, indicating that ESG activities do not enhance shareholders’ returns in the short term. The small absolute magnitudes of these coefficients further confirm their limited economic relevance: a one–standard–deviation increase in the ESG score (≈ 20.9 points) would change ROE by less than 0.002 percentage points, a negligible effect both statistically and economically. This pattern suggests that Nordic firms—operating in a context of high institutional maturity and strong sustainability regulation—may already have optimized their ESG strategies, such that additional disclosure or investment provides no incremental financial benefit to equity holders. These findings are consistent with[15,53], who also documented insignificant or neutral ESG–ROE relationships in ESG-saturated markets where stakeholder expectations are already embedded in corporate governance structures. In contrast, for non-Nordic firms, ESG and governance (G) exhibit small but statistically significant negative effects on ROE (β_ESG = −0.0003*, β_G = −0.0004***). Although these coefficients are statistically different from zero, their economic magnitudes remain modest. For example, a 10-point increase in governance quality is associated with roughly a 0.004-point decrease in ROE, implying a minor short-run trade-off between resource allocation to governance improvement and shareholder returns. This suggests that firms in less mature ESG environments may face temporary cost pressures when expanding ESG initiatives, consistent with the transition-cost hypothesis discussed. The negative relationship observed between ESG and ROE is consistent with prior studies, such as[16,17]. Among control variables, Leverage and firm size (log_Market_cap) are positively and significantly associated with ROE, implying that larger and moderately leveraged firms enjoy higher returns, while Beta and DTE are negative, indicating that greater market risk and higher debt-equity ratios dampen equity profitability. Overall, the ROE analysis reveals that ESG engagement exerts either neutral or slightly negative short-term effects on shareholders’ returns, with institutional maturity shaping the direction and strength of these relationships. The results collectively reinforce the view that ESG benefits are more structural and long-term in nature, emerging gradually as firms integrate sustainability within their financial and operational systems.
5.3. Weighted Average Cost of Capital (WACC)
Table 9 presents four different models to show the panel regression results of the relationship between WACC as a dependent variable and the independent factors—ESG Score, Environmental Score, Social Score, and Governance Score. The regressions are run on a sample of 530 companies and 3180 observations for Nordic companies, and also 1920 companies and 12970 observations in the rest of Europe. The association between ESG scores and WACC differs substantially between Nordic and European firms. For Nordic firms, the ESG coefficients are negative but not statistically significant across all models, suggesting that sustainability performance exerts only a weak influence on financing costs in these economies. The governance pillar (G) shows a small but significant negative coefficient (β = −0.00003*), indicating that stronger governance practices may marginally reduce firms’ WACC. However, the effect remains economically modest: a one–standard–deviation increase in governance quality (≈ 21 points) corresponds to a decline of roughly 0.0006 units in WACC, or less than one basis point. This implies that, in mature ESG environments, capital markets have already priced sustainability transparency into firms’ risk premiums, limiting the incremental benefit of additional ESG improvements. These results are consistent with[15,53], who report that in highly institutionalized contexts, ESG disclosure enhances legitimacy rather than materially lowering financing costs. As expected, governance scores are the most consistent drivers of WACC reduction across both regions, especially in non-Nordic Europe, where credible governance signals play a central role in mitigating financing constraints.
In contrast, For non-Nordic firms, the coefficients for ESG (−0.00002) and governance (−0.00004***) are negative and statistically significant, suggesting that ESG engagement reduces the cost of capital where sustainability norms are still evolving. A 10-point increase in governance quality is associated with an approximate 0.0004-unit reduction in WACC, equivalent to about 4 basis points, a small but economically meaningful improvement in financing efficiency. The stronger response in the non-Nordic sample reflects the higher marginal impact of ESG adoption, where markets are still differentiating firms by sustainability risk exposure. The negative relationship observed between ESG and WACC is consistent with prior studies, such as[20,61]. Among the control variables, Beta and firm size (log_Market_cap) are positively and highly significant, confirming that higher systematic risk and scale are associated with higher WACC, while Leverage is negative and significant, suggesting that greater reliance on debt financing is linked to lower weighted average capital costs due to tax advantages. Overall, the WACC results indicate that ESG performance is more financially relevant in emerging or less mature ESG markets, where it directly improves firms’ access to cheaper capital. In contrast, in the Nordic region, where sustainability standards are deeply embedded, ESG performance mainly serves a reputational function rather than producing additional financing gains. These findings complement[27], who find that ESG impacts on financing costs are contingent on institutional maturity and the credibility of policy enforcement.
Table 7.
Dependent Variable: ROA.
| Dependent variable: ROA |
Nordic (Random effects) | non-Nordic (Fixed effects) | ||||||||
| Model 1 | Model 2 | Model 3 | Model 4 | Model 1 | Model 2 | Model 3 | Model 4 | |||
| Independent variables: | ||||||||||
| ESG | -0.00004 0.00013 |
-0.00012** 0.00004 |
||||||||
| E_score | -0.00007 0.00009 |
-0.00009** 0.00003 |
||||||||
| S_score | 0.0001 0.0001 |
-0.0001 0.0000 |
||||||||
| G_score | -0.00001 0.0001 |
-0.0001* 0.0000 |
||||||||
| Control variables: | ||||||||||
| Beta | -0.00121 0.00348 |
-0.00110 0.00349 |
-0.0014 0.0035 |
-0.0012 0.0035 |
-0.00520*** 0.00091 |
-0.00520*** 0.00092 |
-0.0052*** 0.0009 |
-0.0051*** 0.0009 |
||
| Leverage | -0.04280** 0.01444 |
-0.04192** 0.01446 |
-0.0441** 0.0144 |
-0.0431*** 0.0144 |
-0.08544*** 0.00499 |
-0.08509*** 0.00499 |
-0.0856*** 0.0050 |
-0.0855*** 0.0050 |
||
| log_Market_cap | 0.03084*** 0.00153 |
0.03105*** 0.00151 |
0.0304*** 0.0015 |
0.0308 *** 0.0014 |
0.01773*** 0.00068 |
0.01774*** 0.00068 |
0.0177*** 0.0007 |
0.0176*** 0.0007 |
||
| DTE | -0.00036 0.00171 |
-0.00036 0.00171 |
-0.0003 0.0017 |
-0.0003 0.0017 |
-0.00097*** 0.00026 |
-0.00099*** 0.00026 |
-0.0010*** 0.0003 |
-0.0010*** 0.0003 |
||
| Constant | -0.57580*** 0.03748 |
-0.57877*** 0.03743 |
-0.5699*** 0.0374 |
-0.5748*** 0.0369 |
- | - | - | - | ||
| R2 | 0.1905 | 0.19068 | 0.19063 | 0.1908 | 0.16667 | 0.16669 | 0.16616 | 0.16636 | ||
| Observations(N) | 2886 | 2886 | 2886 | 2886 | 11716 | 11715 | 11715 | 11716 | ||
| Source: Prepared by the authors. | ||||||||||
Table 8.
Dependent Variable: ROE.
| Dependent variable: ROE |
Nordic (Fixed effects) | non-Nordic (Fixed effects) | |||||||
| Model 1 | Model 2 | Model 3 | Model 4 | Model 1 | Model 2 | Model 3 | Model 4 | ||
| Independent variables: | |||||||||
| ESG | -0.0001 0.0003 |
-0.0003* 0.0001 |
|||||||
| E_score | -0.0002 0.0002 |
-0.0002 0.0001 |
|||||||
| S_score | 0.0002 0.0003 |
0.00002 0.0001 |
|||||||
| G_score | -0.0001 0.0002 |
-0.0004*** 0.0001 |
|||||||
| Control variables: | |||||||||
| Beta | -0.0121 0.0081 |
-0.0118 0.0081 |
-0.0123 0.0081 |
-0.0122 0.0081 |
-0.0018 0.0027 |
-0.0018 0.0027 |
-0.0017 0.0027 |
-0.0013 0.0027 |
|
| Leverage | 0.3355*** 0.0348 |
0.3380*** 0.0349 |
0.3333*** 0.0348 |
0.3344*** 0.0347 |
0.0255 0.0149 |
0.0261 0.0149 |
0.0252 0.0149 |
0.0257 0.0149 |
|
| log_Market_cap | 0.0505*** 0.0047 |
0.0507*** 0.0047 |
0.0504*** 0.0047 |
0.0504*** 0.0047 |
0.0425 *** 0.0020 |
0.0424 *** 0.0020 |
0.0422*** 0.0020 |
0.0423*** 0.0020 |
|
| DTE | -0.0584*** 0.0041 |
-0.0585*** 0.0041 |
-0.0581*** 0.0041 |
-0.0583*** 0.0041 |
-0.0044*** 0.0008 |
-0.0045*** 0.0008 |
-0.0045*** 0.0008 |
-0.0044*** 0.0008 |
|
| R2 | 0.12722 | 0.1275 | 0.12747 | 0.12729 | 0.075243 | 0.075053 | 0.074724 | 0.076645 | |
| Observations(N) | 2886 | 2886 | 2886 | 2886 | 11716 | 11715 | 11715 | 11716 | |
Source: Prepared by the authors.
Table 9.
Dependent Variable: WACC.
| Dependent variable: WACC |
Nordic (Fixed effects) | non-Nordic (Fixed effects) | ||||||||
| Model 1 | Model 2 | Model 3 | Model 4 | Model 1 | Model 2 | Model 3 | Model 4 | |||
| Independent variables: | ||||||||||
| ESG | -0.00005 0.00003 |
-0.00002 0.00002 |
||||||||
| E_score | -0.00002 0.00002 | -0.00001 0.00001 |
||||||||
| S_score | -0.00001 0.00002 | 0.00001 0.00001 |
||||||||
| G_score | -0.00003* 0.00002 |
-0.00004*** 0.00001 |
||||||||
| Control variables: | ||||||||||
| Beta | 0.03466*** 0.00067 |
0.03467*** 0.00067 |
0.03464 *** 0.00067 |
0.03463*** 0.00067 |
0.03059*** 0.00037 |
0.03059*** 0.00037 |
0.03059 *** 0.00037 |
0.03064 *** 0.00037 |
||
| Leverage | -0.00791 ** 0.00274 |
-0.00787** 0.00274 |
-0.00805** 0.00274 |
-0.00820** 0.00273 |
-0.02151*** 0.00201 |
-0.02147*** 0.00201 |
-0.02152*** 0.00201 |
-0.02149*** 0.00201 |
||
| log_Market_cap | 0.00220*** 0.00038 |
0.00221*** 0.00038 |
0.00219*** 0.00038 |
0.00217*** 0.00038 |
0.00426*** 0.00027 |
0.00426*** 0.00027 |
0.00424*** 0.00027 |
0.00426*** 0.00027 |
||
| DTE | -0.00035 0.00030 |
-0.00034 0.00030 |
-0.00034 0.00030 |
-0.00032 0.00030 |
0.00010 0.00011 |
0.00010 0.00011 |
0.00010 0.00011 |
0.00010 0.00011 |
||
| R2 | 0.61179 | 0.61151 | 0.61139 | 0.6119 | 0.62881 | 0.62878 | 0.62877 | 0.62915 | ||
| Observations(N) | 3180 | 3180 | 3180 | 3180 | 12970 | 12969 | 12969 | 12970 | ||
Source: Prepared by the authors. NOTE: The significance levels are indicated as *** 1% significance level,**5% significance level, and* 10% significance level. Source: Own calculation based on the data collected from the LSEG database. Standard errors clustered at the firm level; specifications include year and industry fixed effects. Sample sizes vary due to listwise deletion of missing values.
These findings are consistent with the theoretical framework presented in Section 2.5. Specifically, the negative short-term profitability effects observed in non-Nordic firms align with agency theory, as managers’ ESG investments may initially increase costs before long-term value emerges. Conversely, the stable cost-of-capital advantages identified in Nordic firms reflect institutional theory, indicating that mature regulatory and cultural environments embed sustainability into financial systems. Moreover, the reduction in WACC linked to stronger governance supports signalling theory, where credible ESG disclosure enhances investor trust and lowers perceived risk.
5.4. Robustness Analysis Using Dynamic Panel GMM
To strengthen the robustness and reliability of the baseline results, this study extends the analysis by applying a dynamic panel data model estimated through the two-step System Generalized Method of Moments (System-GMM), as proposed by Arellano and Bover (1995) and Blundell and Bond (1998). The use of a dynamic estimator allows the inclusion of a lagged dependent variable among the regressors, which captures the dynamic persistence of firm performance and mitigates potential endogeneity, reverse causality, and omitted variable bias — common concerns in corporate finance and ESG–performance studies.
In the System-GMM framework, the estimation combines equations in both first differences and levels, using lagged levels as instruments for the differenced equation and lagged differences as instruments for the level equation. This dual approach enhances estimation efficiency compared to the traditional Difference-GMM estimator. Following Lee (2007) and recent applications such as Wu et al. (2024) and Bamel et al. (2025), the model specification is expressed as:
where Financial performance denotes firm performance measures (ROA, ROE, and WACC), ESG represents ESG-score indicators (overall ESG score), and control variables includes (Leverage, Beta, log of Market Capitalization, and DTE). The term μi captures firm-specific fixed effects, while εit represents idiosyncratic errors.
All continuous variables were mean-centered and winsorized at the 5th and 95th percentiles to minimize the influence of outliers. The two-step estimator with Windmeijer-corrected standard errors was employed to improve efficiency and correct for potential finite-sample bias in the variance–covariance matrix.
The validity of the GMM specification is assessed through two diagnostic tests:
- the Arellano–Bond test for second-order serial correlation (AR(2)), which ensures that the differenced residuals are not serially correlated; and
- the Hansen test of over-identifying restrictions, which verifies the validity of the chosen instruments. Non-significant p-values (p > 0.10) in both tests support model consistency and instrument validity.
This robustness procedure provides more reliable estimates by addressing potential endogeneity between ESG performance and firm outcomes and validates the stability of the main results across alternative estimation techniques.
The results of the dynamic GMM estimations are presented in Table 10, confirming that the main findings remain robust and consistent with the baseline fixed- and random-effects estimations.
Table 10.
Panel GMM estimation results.
| Nordic (GMM) | non-Nordic (GMM) | ||||||
| Dependent variable: | ROA | ROE | WACC | ROA | ROE | WACC | |
| Independent variables: | |||||||
| Lag(ROA,ROE,WAAC) | 0.6791*** 0.1099 |
0.5819*** 0.0772 |
0.2924 0.2865 |
0.42336*** 0.04095 |
0.35172*** 0.04120 |
1.4763*** 0.2350 |
|
| ESG | -0.0004 0.0003 |
-0.0004 0.0007 |
-0.00002 0.00006 |
0.00002 0.00008 |
-0.00007 0.00021 |
-0.0002* 0.0001 |
|
| Control variables: | |||||||
| Beta | -0.0009 0.0108 |
0.0006 0.0200 |
0.03074*** 0.00208 |
-0.00898** 0.00327 |
-0.00156 0.01642 |
0.0202*** 0.0030 |
|
| Leverage | -0.1554*** 0.0465 |
0.3517* 0.1367 |
-0.0190* 0.0082 |
-0.11580*** 0.01568 |
-0.00732 0.07831 |
-0.0226* 0.0094 |
|
| log_Market_cap | 0.0287*** 0.0055 |
0.0291* 0.0130 |
-0.0018 0.0010 |
0.01856*** 0.00187 |
0.04037*** 0.00643 |
0.0036* 0.0018 |
|
| DTE | 0.0079 0.0041 |
-0.0675*** 0.0138 |
0.0011 0.0010 |
-0.00047 0.00055 |
-0.00667 0.00563 |
0.0003 0.0005 |
|
| AR(1) | -6.4352 | -7.3729 | -1.7634 | -10.92665 | -12.61673 | -4.3062 | |
| AR(2) | 0.16023 | -0.8149 | -4.1928 | -1.801461 | -2.404315 | -6.5923 | |
| Wald Chi2 | 98.69543 | 158.5792 | 310.8511 | 428.6264 | 147.1118 | 106.3477 | |
| Hansen Test | 1.816739 | 1.473421 | 8.0263 | 5.1384 | 5.4151 | 19.7646 | |
| Observations(N) | 2886 | 2886 | 2886 | 11716 | 11716 | 11716 | |
NOTE: The significance levels are indicated as *** 1% significance level,**5% significance level, and * 10% significance level. Source: Own calculation based on the data collected from the LSEG database. Standard errors clustered at the firm level; specifications include year and industry fixed effects. Sample sizes vary due to listwise deletion of missing values. Source: Prepared by the authors.
The GMM robustness results reported in Table 10 broadly confirm the baseline findings and highlight meaningful regional differences. For both Nordic and non-Nordic firms, the lagged dependent variables are positive and highly significant in the ROA and ROE equations, indicating strong persistence in profitability over time. By contrast, the ESG coefficient remains statistically insignificant in all profitability specifications, suggesting that ESG performance does not exert a short-run impact on accounting returns in either sub-sample. However, in the non-Nordic sample, ESG is negatively and significantly associated with WACC, whereas the corresponding coefficient for Nordic firms is small and insignificant. This pattern is consistent with the idea that in less mature ESG environments, stronger ESG engagement helps reduce firms’ cost of capital, while in ESG-advanced Nordic markets the marginal financing benefit of additional ESG improvements is more limited.
The control variables behave largely in line with expectations. Leverage is negatively related to ROA and WACC in both regions, while firm size (log_Market_cap) and Beta are generally positively associated with WACC, reflecting the role of capital structure, scale, and market risk in shaping financing conditions. The GMM diagnostics support the validity of the dynamic specification: the Arellano–Bond tests do not indicate problematic second-order serial correlation, the Hansen test suggests that the instruments are valid, and the Wald statistics confirm the joint significance of the regressors. Overall, the dynamic panel GMM results reinforce the main conclusion that ESG performance primarily affects the cost of capital in non-Nordic markets, whereas in Nordic countries ESG appears to be already internalized in firms’ operating and financing practices.
6. Conclusions
This study examined how ESG disclosure relates to firm performance for public European companies, comparing ESG-mature Nordic markets with the broader non-Nordic context (2015–2024). The analysis yielded three notable findings. First, among Nordic firms, higher overall ESG scores (and each E/S/G pillar) are consistently associated with a lower cost of capital (WACC), while accounting-based returns (ROA, ROE) remain unchanged. This suggests that in ESG-mature settings, sustainability efforts are primarily rewarded through cheaper financing rather than immediate profit gains. Second, outside the Nordics, higher ESG is linked to lower ROA (and marginally lower ROE), indicating short-run profitability trade-offs, and notably only the governance pillar significantly reduces WACC. In these less mature markets, investors appear to reward strong governance practices with lower financing costs, whereas environmental and social initiatives may not yet translate into cheaper capital. Third, the control variables behave as expected (e.g. larger firms and lower leverage associate with better outcomes), supporting the robustness of our estimations.
These contrasting outcomes underscore the role of institutional context in the ESG–performance relationship. In Nordic countries with advanced ESG frameworks, the evidence supports the view of ESG as a risk-mitigation mechanism: firms’ sustainability engagement is valued by markets through reduced financing costs, aligning with the notion that better ESG lowers risk. By contrast, the negative association between ESG and profitability in non-Nordic Europe highlights that companies in less ESG-developed environments may face short-term costs when allocating resources to sustainability. The fact that only governance improvements lower WACC outside the Nordics reinforces the importance of governance quality for investor confidence in such settings. Overall, these findings enrich the ongoing debate on whether ESG creates or erodes value, suggesting that institutional maturity conditions how sustainability performance is capitalized by investors.
From a practical standpoint, our results carry implications for both managers and policymakers. For corporate managers, the findings indicate that in ESG-leading regions, continuing to invest in comprehensive sustainability practices can yield tangible financial benefits via lower capital costs. In less mature markets, however, a more selective approach may be prudent: managers might prioritize governance reforms and cost-efficient environmental and social initiatives that can deliver visible gains in performance and credibility. This targeted strategy can help balance stakeholder pressures with financial performance during the transition. For policymakers, the evidence suggests a need to tailor ESG frameworks to regional contexts. Stronger institutional support—such as harmonized disclosure standards and incentives for long-term investment—could mitigate the apparent performance trade-offs observed outside the Nordics. In particular, aligning reporting requirements and improving transparency across Europe would reduce information asymmetry and enable investors to better price sustainability into valuations, thereby rewarding responsible firms more consistently.
It is also important to recognize the boundaries of our inference. This study focuses on publicly listed European firms (Nordic and non-Nordic) covered by Refinitiv’s ESG database, using annual data and disclosure-based ESG scores from 2015–2024. Consequently, the conclusions apply primarily to large firms in this regional and temporal context, and may not generalize directly to private companies or other parts of the world. Moreover, ESG measurement methodologies vary across providers, which can influence empirical results. Indeed, different rating agencies often disagree on ESG evaluations – with correlations between major ESG ratings ranging only from about 0.4 to 0.7 on average – so the strength of ESG-performance links might differ under alternative metrics. Acknowledging these limitations helps avoid over-reach in our conclusions and highlights the need for caution when extrapolating beyond the study’s scope.
Finally, our research opens several avenues for future inquiry. One promising extension would be to examine whether financing frictions or credit constraints moderate the ESG–WACC relationship. Firms with greater financing constraints might experience a different benefit (or cost) from ESG initiatives; conversely, well-capitalized firms could leverage ESG strengths more easily. Exploring this angle can build on evidence that the effectiveness of sustainability-related incentives often depends on a firm’s financial constraints. A second extension is to investigate industry-specific dynamics by interacting firm-level ESG performance with measures of industry climate transition risk and carbon market uncertainty. Recent findings indicate that higher transition risk correlates with lower industry returns (while policy uncertainty and green innovation can offset some negatives), suggesting that the short-run profitability impacts of ESG investments might be most pronounced in high transition-risk sectors. Future studies could test whether the negative ESG–profitability link we observe is concentrated in carbon-intensive or transition-exposed industries, providing more nuanced insight. In addition, extending the analysis beyond 2024 to track longer-term outcomes, incorporating market-based performance indicators (e.g. stock returns or credit spreads), and disaggregating ESG into specific practices (such as emissions reductions, workforce development, or board diversity) would all help to paint a more comprehensive picture of how sustainability efforts translate into value. By pursuing these directions, researchers can build on our findings to further clarify the complex relationship between ESG and firm performance across varying institutional and industry contexts.
These results emphasize the importance of tailoring ESG policy recommendations and investment strategies to regional institutional contexts. In Nordic markets, ESG is already rewarded through financing channels, while in non-Nordic Europe, environmental disclosure may impose short-term profitability pressures. Future research could explore how policy credibility and transition risk moderate these dynamics, offering further insights into the institutional channels behind ESG-performance heterogeneity.
Abbreviations
The following abbreviations are used in this manuscript:
| ESG | Environmental, Social and Governance |
| E | Environmental |
| S | Social |
| G | Governance |
| ROE | Return on Equity |
| ROA | Return on Assets |
| WACC | Weighted Average Cost of Capital |
| β | Beta |
| OLS | Ordinary Least Squares |
| VIF | Variance Inflation Factor |
| FE | Fixed Effects |
| RE | Random Effects |
Appendix A. List of Countries and Industries Included in the Sample
| Sweden | United Kingdom | Ireland | Netherlands | ||
| Finland | France | Switzerland | Belgium | ||
| Norway | Luxembourg | Cyprus | Isle of Man | ||
| Denmark | Germany | Jersey | Greece | ||
| Iceland | Italy | Austria | Poland | ||
| Guernsey | Portugal | Malta | Spain | ||
| Gibraltar | Bulgaria | Monaco | Hungary | ||
| Lithuania | Slovak Republic | Ukraine | Czech Republic | ||
| Romania | Liechtenstein | Faroe Islands | Slovenia | ||
| Russia | |||||
| Telecommunications | Financials | ||||
| Technology | Consumer Staples | ||||
| Real Estate | Consumer Discretionary | ||||
| Industrials | Basic Materials | ||||
| Health Care | Energy | ||||
| Communication Services | Utilities | ||||
References
- A. Bassen and A. M. Kovács, “Environmental, Social and Governance Key Performance Indicators from a Capital Market Perspective,” zfwu Zeitschrift für Wirtschafts- und Unternehmensethik, vol. 9, no. 2, pp. 182–192, Aug. 2008. [CrossRef]
- J. Galbreath, “ESG in Focus: The Australian Evidence,” J Bus Ethics, vol. 118, no. 3, pp. 529–541, Dec. 2013. [CrossRef]
- S. Drempetic, C. Klein, and B. Zwergel, “The Influence of Firm Size on the ESG Score: Corporate Sustainability Ratings Under Review,” J Bus Ethics, vol. 167, no. 2, pp. 333–360, Nov. 2020. [CrossRef]
- G. Dorfleitner, G. Halbritter, and M. Nguyen, “Measuring the level and risk of corporate responsibility – An empirical comparison of different ESG rating approaches,” J Asset Manag, vol. 16, no. 7, pp. 450–466, Dec. 2015. [CrossRef]
- G. Friede, T. Busch, and A. Bassen, “ESG and financial performance: aggregated evidence from more than 2000 empirical studies,” Journal of Sustainable Finance & Investment, vol. 5, no. 4, pp. 210–233, Oct. 2015. [CrossRef]
- T. Whelan, U. Atz, and C. Clark, “ESG AND FINANCIAL PERFORMANCE:,” 2020.
- R. K. Bhaskaran, I. W. K. Ting, S. K. Sukumaran, and S. D. Sumod, “Environmental, social and governance initiatives and wealth creation for firms: An empirical examination,” Managerial and Decision Economics, 2020. [CrossRef]
- C. De Lucia, P. Pazienza, and M. Bartlett, “Does Good ESG Lead to Better Financial Performances by Firms? Machine Learning and Logistic Regression Models of Public Enterprises in Europe,” Sustainability, vol. 12, no. 13, p. 5317, Jan. 2020. [CrossRef]
- J. Xie, W. Nozawa, M. Yagi, H. Fujii, and S. Managi, “Do environmental, social, and governance activities improve corporate financial performance?,” Business Strategy and the Environment, vol. 28, no. 2, pp. 286–300, 2019. [CrossRef]
- K. K. Dalal and N. Thaker, “ESG and Corporate Financial Performance: A Panel Study of Indian Companies,” IUP Journal of Corporate Governance, vol. 18, no. 1, pp. 44–59, Jan. 2019.
- S. Carnini Pulino, M. Ciaburri, B. S. Magnanelli, and L. Nasta, “Does ESG Disclosure Influence Firm Performance?,” Sustainability, vol. 14, no. 13, p. 7595, Jan. 2022. [CrossRef]
- Z. Wang and J. Sarkis, “Corporate social responsibility governance, outcomes, and financial performance,” Journal of Cleaner Production, vol. 162, pp. 1607–1616, Sept. 2017. [CrossRef]
- C. J. Thomas, “The impact of sustainability practices on firm financial performance: evidence from Malaysia / Christopher Jerry Thomas ...[et al.],” 2021.
- P. Velte, “Does ESG Performance Have an Impact on Financial Performance? Evidence from Germany,” Feb. 14, 2017, Social Science Research Network, Rochester, NY: 2916741. Accessed: Apr. 24, 2025. [Online]. Available: https://papers.ssrn.com/abstract=2916741.
- A. Buallay, “Sustainability reporting and firm’s performance: Comparative study between manufacturing and banking sectors,” International Journal of Productivity and Performance Management, vol. 69, no. 3, pp. 431–445, Dec. 2019. [CrossRef]
- N. Nirino, G. Santoro, N. Miglietta, and R. Quaglia, “Corporate controversies and company’s financial performance: Exploring the moderating role of ESG practices,” Technological Forecasting and Social Change, vol. 162, p. 120341, Jan. 2021. [CrossRef]
- I. Shaikh, “ENVIRONMENTAL, SOCIAL, AND GOVERNANCE (ESG) PRACTICE AND FIRM PERFORMANCE: AN INTERNATIONAL EVIDENCE,” Journal of Business Economics and Management, vol. 23, no. 1, pp. 218–237, Jan. 2022. [CrossRef]
- F. P. and S. A. Busru, “CSR disclosure and firm performance: evidence from an emerging market,” Corporate Governance, vol. 21, no. 4, pp. 553–568, Jan. 2021. [CrossRef]
- D. Sharma, S. Bhattacharya, and S. Thukral, “Resource-based view on corporate sustainable financial reporting and firm performance: evidences from emerging Indian economy,” International Journal of Business Governance and Ethics, vol. 13, no. 4, pp. 323–344, 2019.
- R. Priem and A. Gabellone, “The Impact of a Firm’s ESG Score on Its Cost of Capital: Can a High ESG Score Serve as a Substitute for a Weaker Legal Environment?,” Nov. 25, 2022, Social Science Research Network, Rochester, NY: 4286057. [CrossRef]
- S. Halid, R. A. Rahman, R. Mahmud, N. Mansor, and R. A. Wahab, “A Literature Review on ESG Score and Its Impact on Firm Performance,” International Journal of Academic Research in Accounting, Finance and Management Sciences, vol. 13, no. 1, pp. 272–282, Jan. 2023.
- G. Giannopoulos, R. V. Kihle Fagernes, M. Elmarzouky, and K. A. B. M. Afzal Hossain, “The ESG Disclosure and the Financial Performance of Norwegian Listed Firms,” Journal of Risk and Financial Management, vol. 15, no. 6, p. 237, June 2022. [CrossRef]
- A. Behl, P. S. R. Kumari, H. Makhija, and D. Sharma, “Exploring the relationship of ESG score and firm value using cross-lagged panel analyses: case of the Indian energy sector,” Ann Oper Res, vol. 313, no. 1, pp. 231–256, June 2022. [CrossRef]
- E. Saygili, S. Arslan, and A. O. Birkan, “ESG practices and corporate financial performance: Evidence from Borsa Istanbul,” Borsa Istanbul Review, vol. 22, no. 3, pp. 525–533, May 2022. [CrossRef]
- R. Atan, M. M. Alam, J. Said, and M. Zamri, “The Impacts of Environmental, Social, and Governance Factors on Firm Performance: Panel Study of Malaysian Companies.” Accessed: Apr. 24, 2025. [Online]. Available: https://www.sciencegate.app/document/10.31235/osf.io/ntz52.
- C. Guo, W. Ma, C. Yang, and R. Yang, “Enterprise characteristics and incentive effect of environmental regulation,” International Review of Finance, vol. 25, no. 3, 2025, Accessed: Oct. 29, 2025. [Online]. Available: https://ideas.repec.org//a/bla/irvfin/v25y2025i3ne70032.html.
- Q. Zhou, J. Ni, and C. Yang, “Climate transition risk and industry returns: The impact of green innovation and carbon market uncertainty,” Technological Forecasting and Social Change, vol. 214, p. 124056, May 2025. [CrossRef]
- B. Cuadrado-Ballesteros, J. Martínez-Ferrero, and I. M. García-Sánchez, “Mitigating information asymmetry through sustainability assurance: The role of accountants and levels of assurance,” International Business Review, vol. 26, no. 6, pp. 1141–1156, Dec. 2017. [CrossRef]
- M. F. Izzo, M. Ciaburri, and R. Tiscini, “The Challenge of Sustainable Development Goal Reporting: The First Evidence from Italian Listed Companies,” Sustainability, vol. 12, no. 8, p. 3494, Jan. 2020. [CrossRef]
- F. Rossi and M. A. Harjoto, “Corporate non-financial disclosure, firm value, risk, and agency costs: evidence from Italian listed companies,” Rev Manag Sci, vol. 14, no. 5, pp. 1149–1181, Oct. 2020. [CrossRef]
- S. M. Bae, M. A. K. Masud, and J. D. Kim, “A Cross-Country Investigation of Corporate Governance and Corporate Sustainability Disclosure: A Signaling Theory Perspective,” Sustainability, vol. 10, no. 8, p. 2611, Aug. 2018. [CrossRef]
- E. Taoketao, T. Feng, Y. Song, and Y. Nie, “Does sustainability marketing strategy achieve payback profits? A signaling theory perspective,” Corporate Social Responsibility and Environmental Management, vol. 25, no. 6, pp. 1039–1049, 2018. [CrossRef]
- M. C. Jensen and W. H. Meckling, “Theory of the firm: Managerial behavior, agency costs and ownership structure,” Journal of Financial Economics, vol. 3, no. 4, pp. 305–360, Oct. 1976. [CrossRef]
- C. de Villiers, V. Naiker, and C. J. van Staden, “The Effect of Board Characteristics on Firm Environmental Performance,” Journal of Management, vol. 37, no. 6, pp. 1636–1663, Nov. 2011. [CrossRef]
- S. F. A. Khatib, D. F. Abdullah, E. Hendrawaty, and A. A. Elamer, “A bibliometric analysis of cash holdings literature: current status, development, and agenda for future research,” Manag Rev Q, vol. 72, no. 3, pp. 707–744, Sept. 2022. [CrossRef]
- B. Panda and N. M. Leepsa, “Agency theory: Review of Theory and Evidence on Problems and Perspectives,” Indian Journal of Corporate Governance, vol. 10, no. 1, pp. 74–95, June 2017. [CrossRef]
- A. Khan, M. B. Muttakin, and J. Siddiqui, “Corporate Governance and Corporate Social Responsibility Disclosures: Evidence from an Emerging Economy,” J Bus Ethics, vol. 114, no. 2, pp. 207–223, May 2013. [CrossRef]
- R. D. Morris, “Signalling, Agency Theory and Accounting Policy Choice,” Accounting and Business Research, vol. 18, no. 69, pp. 47–56, Dec. 1987. [CrossRef]
- M. Spence, “Job Market Signaling*,” Q J Econ, vol. 87, no. 3, pp. 355–374, Aug. 1973. [CrossRef]
- R. Hahn and M. Kühnen, “Determinants of sustainability reporting: a review of results, trends, theory, and opportunities in an expanding field of research,” Journal of Cleaner Production, vol. 59, pp. 5–21, Nov. 2013. [CrossRef]
- Z. Wang, T.-S. Hsieh, and J. Sarkis, “CSR Performance and the Readability of CSR Reports: Too Good to be True?,” Corporate Social Responsibility and Environmental Management, vol. 25, no. 1, pp. 66–79, 2018. [CrossRef]
- S. Maas, T. Schuster, and E. Hartmann, “Pollution Prevention and Service Stewardship Strategies in the Third-Party Logistics Industry: Effects on Firm Differentiation and the Moderating Role of Environmental Communication,” Business Strategy and the Environment, vol. 23, no. 1, pp. 38–55, 2014. [CrossRef]
- S. A. Taj, “Application of signaling theory in management research: Addressing major gaps in theory,” European Management Journal, vol. 34, no. 4, pp. 338–348, Aug. 2016. [CrossRef]
- H. Y. Ching and F. Gerab, “Sustainability reports in Brazil through the lens of signaling, legitimacy and stakeholder theories,” Social Responsibility Journal, vol. 13, no. 1, pp. 95–110, Mar. 2017. [CrossRef]
- T. Mavlanova, R. Benbunan-Fich, and M. Koufaris, “Signaling theory and information asymmetry in online commerce,” Information & Management, vol. 49, no. 5, pp. 240–247, July 2012. [CrossRef]
- B. L. Connelly, D. J. Ketchen, and S. F. Slater, “Toward a ‘theoretical toolbox’ for sustainability research in marketing,” J. of the Acad. Mark. Sci., vol. 39, no. 1, pp. 86–100, Feb. 2011. [CrossRef]
- A. J. Hoffman and P. D. Jennings, “Institutional Theory and the Natural Environment: Research in (and on) the Anthropocene,” Organization & Environment, vol. 28, no. 1, pp. 8–31, Mar. 2015. [CrossRef]
- J. Pinto, “A multifocal framework for developing Intentionally Sustainable Organizations,” Current Opinion in Environmental Sustainability, vol. 28, pp. 17–23, Oct. 2017. [CrossRef]
- K. Nyborg and T. Zhang, “Is Corporate Social Responsibility Associated with Lower Wages?,” Environ Resource Econ, vol. 55, no. 1, pp. 107–117, May 2013. [CrossRef]
- M. Elmarzouky, K. Hussainey, T. Abdelfattah, and A. E. Karim, “Corporate risk disclosure and key audit matters: the egocentric theory,” IJAIM, vol. 30, no. 2, pp. 230–251, Apr. 2022. [CrossRef]
- G. Halbritter and G. Dorfleitner, “The wages of social responsibility — where are they? A critical review of ESG investing,” Review of Financial Economics, vol. 26, pp. 25–35, Sept. 2015. [CrossRef]
- G. Landi and M. Sciarelli, “The impact of ESG rating on corporate financial performance,” ResearchGate, 2018. [CrossRef]
- N. Bamel, K. Khatri, U. Bamel, and S. Kumar, “ESG disclosure and firm performance in global south economy: Does industry profile and board independence moderate the relationship,” International Review of Economics & Finance, vol. 100, p. 104093, June 2025. [CrossRef]
- W. Hussain, T. Ong, F. Kamarudin, M. Khan, and Z. Bács, “ESG disclosure, firm internationalization, and firm financial performance: Evidence from Asia-Pacific,” JOURNAL OF INTERNATIONAL STUDIES, vol. 17, pp. 240–261, June 2024. [CrossRef]
- M. Basali, “Impact of Financial Performance and Corporate Governance on ESG Disclosure: Evidence from Saudi Arabia,” Sustainability, vol. 17, no. 18, p. 8473, Jan. 2025. [CrossRef]
- M. K. Al-Kubaisi and B. Abu Khalaf, “Climate Governance, ESG Reporting, and the Firm Performance: Does It Matter More for Europe or the GCC?,” Sustainability, vol. 17, no. 9, p. 3761, Jan. 2025. [CrossRef]
- J. Surroca, J. A. Tribó, and S. Waddock, “Corporate responsibility and financial performance: the role of intangible resources,” Strategic Management Journal, vol. 31, no. 5, pp. 463–490, 2010. [CrossRef]
- Y. Adeneye and I. Kammoun, “Real earnings management and capital structure: Does environmental, social and governance (ESG) performance matter?,” Cogent Business & Management, vol. 9, no. 1, p. 2130134, Dec. 2022. [CrossRef]
- E. Duque-Grisales and J. Aguilera-Caracuel, “Environmental, Social and Governance (ESG) Scores and Financial Performance of Multilatinas: Moderating Effects of Geographic International Diversification and Financial Slack,” J Bus Ethics, vol. 168, no. 2, pp. 315–334, Jan. 2021. [CrossRef]
- P. Fahad and S. A. Busru, “CSR disclosure and firm performance: evidence from an emerging market,” Corporate Governance, vol. 21, no. 4, pp. 553–568, 2021. [CrossRef]
- R. Atan, M. M. Alam, J. Said, and M. Zamri, “The impacts of environmental, social, and governance factors on firm performance: Panel study of Malaysian companies,” Management of Environmental Quality: An International Journal, vol. 29, no. 2, pp. 182–194, Mar. 2018. [CrossRef]
Disclaimer/Publisher’s Note: The statements, opinions and data contained in all publications are solely those of the individual author(s) and contributor(s) and not of MDPI and/or the editor(s). MDPI and/or the editor(s) disclaim responsibility for any injury to people or property resulting from any ideas, methods, instructions or products referred to in the content. |
© 2025 by the authors. Licensee MDPI, Basel, Switzerland. This article is an open access article distributed under the terms and conditions of the Creative Commons Attribution (CC BY) license (http://creativecommons.org/licenses/by/4.0/).
Copyright: This open access article is published under a Creative Commons CC BY 4.0 license, which permit the free download, distribution, and reuse, provided that the author and preprint are cited in any reuse.


