Submitted:
01 October 2025
Posted:
03 October 2025
You are already at the latest version
Abstract
In rehabilitation research, coarse clinical outcome measures may limit the sensitivity of trials by failing to detect meaningful intervention-induced changes. Sensorized robotic platforms can potentially improve the evaluation of motor function, yet their reliability compared to skilled therapists remains unclear. This study utilized a robotic device to measure two fundamental impairments that are critical to ankle function: range of motion (ROM, active and passive) and dorsiflexion maximum voluntary contraction (MVC). In 34 chronic hemiparetic post-stroke individuals, we assessed test-retest reliability over two days for the robot and experienced therapists, who used a goniometer and manual muscle testing (MMT). We also evaluated robotic test-retest reliability in 36 young and 26 older unimpaired adults. Reliability for robotic and therapist-based AROM and MVC measures was high (ICC > 0.86), consistent across all groups. Robotic AROM and PROM measure-ments correlated strongly with therapist assessments (r > 0.60, p < 0.001) but were 120% and 37% larger than therapist assessments (p < 0.001), respectively. For the MVC measurement, the therapist assigned 85% of participants a score of 1 on the MMT, but their MVC torque was distributed from 0 to ~20 Nm. Measurement differences between methods likely arose from the robot's constrained setup, allowing compensatory muscle activation. The increased granularity provided by robotic MVC measurements could enable more precise tracking of motor recovery and facilitate tailored rehabilitation strategies. These results support the clinical utility of robotic platforms for ankle assessment, offering detailed, objective measurements that can augment traditional evaluations. A supplementary dataset for benchmarking future research is provided.
Keywords:
test-retest reliability
; ankle motor function
; robotic assessment
1. Introduction
Impaired gait following stroke is strongly associated with reduced independence, difficulty leaving the home, and limited community and social participation [1,2]. These limitations are often driven by impairments in ankle joint motion and strength, which are common after stroke and negatively impact gait and balance function [3,4,5]. Assessing ankle impairment is critical in diagnosing gait deficits, guiding treatment plans, and monitoring treatment progression [6,7].
Two key assessments often completed by physical therapists to assess ankle motor impairment are range of motion (ROM, both passive (PROM) and active (AROM)) and maximum voluntary contraction (MVC). The methods for measuring ankle ROM can be broadly classified into three categories: goniometry, weight-bearing, and instrumented techniques [8], but the most used technique in the clinic is the goniometer. Goniometers are inexpensive and convenient but require technical proficiency, due to the necessity of aligning the axis with the joint fulcrum and positioning the two arms with established reference points, a process that is even more complicated during PROM measurements when the therapist must hold the goniometer while manually moving the joint [6,9]. For assessing MVC, there are many methods and tools, including handheld dynamometer, but the most used technique in the clinic is the Manual Muscle Test (MMT), as it is quick and easy to perform [10]. However, its reliability is low because its grading depends on subjective assessment of force, which can be influenced by the examiner’s muscle strength and temporal variations in force production [11].
With these challenges of assessing the ankle, alternative methods have been proposed, such as electromechanical sensing technologies [12]. Within the last couple of decades there has been an increase in using robotic devices for neurorehabilitation training in clinical centers, including both wearable exoskeletons and platform-based devices [13,14,15]. Besides using them for movement training, translational researchers in neurorehabilitation have proposed using the sensors embedded in these robotic devices to overcome some of the limitations in traditional clinical assessments [16]. Sensorized, robotic devices can potentially provide accurate (e.g. able to control/measure exact body position/force applied) and objective (not relying as strongly on observer judgement) measurements [13,16]. Yet there is currently limited information on the reliability and validity of such systems [13,17].
To address this gap, we used a bilateral, platform-based robotic device to evaluate two fundamental aspects of ankle function, dorsiflexion/plantarflexion ROM and MVC, in persons post-stroke. For comparison, skilled rehabilitation therapists acquired the same measures using the aforementioned, most common, clinical approaches to these assessments. We hypothesized that the robotic device would facilitate the acquisition of both reliable and valid measurements of ankle ROM and dorsiflexion MVC, comparable to those from the therapists.
2. Materials and Methods
2.1. Participants
Persons in the chronic phase post-stroke were enrolled in a clinical trial designed to evaluate the efficacy of a brain-computer-interface combined with a functional electrical stimulation system for treating foot drop (clinicaltrials.gov NCT04279067). Clinical and functional status of stroke participants was characterized using standardized assessments shown in Table 2. For this analysis, only ROM and MVC measurements taken at baseline and prior to the start of therapy were included. These measurements were spaced one week apart.
For an extensive list of inclusion and exclusion criteria see [18], but here we list several key inclusion criteria: (1) Age 18-80 years inclusively at time of consent, (2) Radiologically confirmed bilateral or unilateral stroke, ischemic or intracerebral hemorrhage (ICH) in etiology, with day of onset at least 26 weeks prior to day of randomization, (3) Gait velocity <0.8 m/s at screening and baseline visits, (4) Foot drop in affected limb as defined by dorsiflexion active range of motion (AROM) via goniometry in seated position foot dangling is less than passive range of motion and less than 15 degrees. (5) Can walk >10 m (with or without AFO, and cane or walker permitted) at a supervised level. Exclusion criteria included: (1) A major, active, coexisting medical, neurological (apart from stroke) or psychiatric disease (apart from stroke), (2) Implanted electronic device (e.g. pacemaker) or skull metallic implants, (3) Pregnancy, (4) Significant pain (visual analog scale >4), chest pain, or shortness of breath with walking, (5) Non-English speaking, such that participant does not speak sufficient English to comply with study procedures (6) Received chemical denervation (e.g., botulinum toxin) to legs in the preceding 6 months. The local ethics committee approved this study and written informed consent was obtained from each participant prior to participating, following the procedures established by the University of California Irvine Institutional Review Board.
For comparison, young uninjured participants, 18–35 years old, and older uninjured adults with ages selected to match the average age of our stroke participants, were recruited for two assessment sessions. For young and older unimpaired participants, the exclusion criteria were: history of neurological injury, musculoskeletal damage to the ankles, current injuries that affected participants’ ability to move or feel either of their ankles, or use of medication that would change how the brain perceived pain/movement. Leg dominance was determined using a self-report question from the method described by van Melick et al., in which participants indicate which leg they would use to kick a ball [19].
2.2. Robotic Device
Two versions of Ankle Measuring Proprioceptive Device (AMPD and 2AMPD) were used for this study. 2AMPD is an improved version of AMPD that was designed to improve the ease of participant transfers to the device by lowering the seat height. Here we briefly describe the common features of both AMPD and 2AMPD [20]. Each device has two modes: rigid and transparent, terms which describes how the foot pedal feels when the participant pushes against it. The modes are selected by operating a mechanical clutch (Figure 1). In its rigid mode, the device can individually assist and move both ankles, via linear actuators (lead screw actuators) and a rack and roller pinion system, through participants’ natural dorsiflexion and plantarflexion passive range of motion. In transparent mode, the rack and roller pinion are mechanically disconnected, enabling voluntary ankle movement with minimal impedance. This is achieved through low-friction ball-bearings around which the footplates rotate and a counterbalancing system that neutralizes gravity. The devices are equipped to measure ankle position (dorsiflexion and plantarflexion), via angular encoders, and ankle force converted to ankle torque, via s-type load cells. Sample frequency was set to 200 Hz and data was stored on a laptop.
2.3. Robotic Assessments
For all participants, ROM and MVC were measured in two sessions that were three to ten days apart, using AMPD devices. For post-stroke participants, no treatment occurred between the first and second assessments.
For the post-stroke participants, two skilled physical therapists (PT), each with 20+ years of experience in assessing motor function after stroke, used AMPD to assess ROM and MVC. Robotic assessments were always performed after therapist assessments during each session. Within each robotic session, AROM was assessed first, followed by dorsiflexion MVC, and then passive ROM. For young and older unimpaired adults, a trained operator assessed, AROM, PROM and MVC, in this exact order.
Using AMPD, all participants sat in an upright position with their hips and knees bent at 90 degrees such that the shanks were perpendicular to the ground and the feet were hip width apart. The feet were strapped to the AMPD footplates after wood shims were added to the footplates to align the lateral malleolus to the rotational shaft of AMPD. Once participants were in the correct seated position, the chair position was recorded and saved so it could be used for the second session of measurements. Standardized instructions and a demonstration were provided before each ankle test.
For measuring ROM, AMPD was placed in its transparent mode. For the AROM measurements participants were instructed to dorsiflex the ankle to their maximum position without lifting the heel off the foot pedal, and then transition to their maximum plantarflexion position without internally rotating the hip. A single trial consisted of each maximum position held for ~3 seconds. All participants performed three trials on each ankle and 15 seconds of rest was given between each trial. For stroke participants, three trials were performed on the unimpaired ankle first to aid in understanding the task and then the unimpaired ankle was measured. For measuring PROM, only the impaired ankle was measured by the PT who manually rotated the impaired ankle foot pedal into dorsiflexion until firm resistance was encountered without inducing discomfort. That position was saved, and only one trial was completed.
For measuring dorsiflexion MVC, AMPD was placed in its rigid mode with the ankles locked at an angle of 90° in the parasagittal plane. Participants were asked to gradually dorsiflex one ankle until they reached maximum effort and hold for three seconds. Like AROM measurements, participants performed three trials on each ankle. For participants who were post-stroke, three trials were performed on the unimpaired ankle first to aid understanding of the task and then the impaired ankle was measured.
2.4. Clinical Assessments (Only Stroke)
For the post-stroke participants, the same two PTs also manually assessed the dorsiflexion ROM (both PROM and AROM) and MVC. AROM and PROM were assessed before MVC. The test order was kept consistent across all participants and both sessions. While this fixed ordering facilitated standardization, it also introduces a potential ordering effect, which was not counterbalanced or randomized. The post-stroke participants were seated on a gurney in an upright position with the hip and knee bent at 90 degrees such that the shank was perpendicular to the ground and the feet suspended in the air.
For measuring the dorsiflexion AROM using the goniometer, the PT positioned the goniometer so that the rotation axis rested over the center of the lateral malleolus. They aligned the stationary goniometer arm parallel to the longitudinal axis of the fibula, and the mobile arm parallel to the longitudinal axis of the fifth metatarsal bone. The therapist measured the impaired ankle dorsiflexion AROM three times to the nearest degree. A similar procedure was used to measure PROM, but in this case the therapist manually dorsiflexed the ankle with their knee to the felt end of the ROM and three trials were performed.
The manual muscle test (MMT) was used to measure dorsiflexion MVC. Each stroke participant was asked to dorsiflex as strongly as possible, and the PT rated the force generated using the Medical Research Council Scale (0-5) [21]. Only one trial was performed.
2.5. Statistical Analysis
Statistical analyses were conducted using Matlab R2023 and JMP Pro 16 software. For dorsiflexion MVC, if participants did not overcome the weight of their foot to create a positive flexion torque, then they received a zero dorsiflexion torque for that specific trial. The intraclass correlation coefficient (ICC) with 95% confidence intervals (CI) was calculated using a two-way mixed effects with a single rater [22] to assess the test–retest reliability (session 1 compared to session 2 measurements) for each. ICC values less than 0.5 indicate poor reliability, values between 0.5 and 0.75 indicate moderate reliability, values between 0.75 and 0.9 indicate good reliability, and values greater than 0.90 indicate excellent reliability [22]. Standard error of measurement (SEM) was calculated using the standard deviation (SD), where SEM = SD * , and minimal detectable change (MDC) at 95% confidence level was computed using the formula MDC = SEM * 1.96 * √2 [23].
Each output parameter (AROM and MVC) for each group, using the average of 3 trials, was independently tested for normality using the Shapiro Wilks test. All AROM and MVC measurements were normally distributed (p > 0.05), justifying the use of parametric tests. To assess validity, Pearsons’s correlation coefficient was calculated between robotic and physical therapist measurements. Paired t-tests were used for comparing validation measurements.
For chronic stroke participants a repeated-measures ANOVA was conducted to examine the main effects of timepoint (first vs. second session), ankle impairment (impaired vs. unimpaired side), and sex (female vs. male). For unimpaired participants, repeated-measures ANOVA was used to assess the effects of timepoint (first vs. second session), leg dominance (dominant vs. nondominant), age group (young vs. older), and sex (female vs. male). If significant main or interaction effects were identified, post hoc comparisons were performed using Tukey’s Honest Significant Difference (HSD) test. Effect sizes were calculated using Cohen’s d, with values of 0.2, 0.5, and 0.8 interpreted as small, medium, and large effects, respectively [24]. The level of statistical significance was set at p < 0.05.
3. Results
34 persons in the chronic phase of stroke (19 male, 15 female; age = 60 ± 12 yrs) participated in ankle ROM and MVC assessments during two sessions that were on average 7 ± 2 days apart. In addition, 36 young, unimpaired participants (23 male, 13 female; mean ± SD, age = 25 ± 4 yrs), and 26 older, unimpaired participants (10 male, 16 female; age = 65 ± 10 yrs) completed the same protocol for robotic assessments. The older group was aged matched to the stroke group (p = 0.16, t-test). The ankle ROM and MVC of participants who were post-stroke were assessed using a sensorized robotic platform (AMPD) and by a physical therapist (PT) using a goniometer and manual muscle testing (MMT). Clinical characteristics of the participants who were post-stroke are shown in Table 1. Demographics of the unimpaired participants are shown in Table 2.

Table 1.
Characteristics of stroke participants (N = 34).
| Average ± SD | [Min Max] | |
|---|---|---|
| Age | 60 ± 12 | [27 78] |
| Days Post Stroke | 1138 ± 1027 | [201 4085] |
| [25] NIH Stroke Severity Scale [0 42] |
6 ± 3 | [2 16] |
| [26] Lower Extremity Fugl Meyer [0 34] | 20 ± 4 | [12 28] |
| [27]Modified Ashworth Score [0 4] |
1.56 ± 0.46 | [0 2] |
| [28] 6 min walk distance (meters) |
107.9 ± 66.2 | [0.20 298.50] |
| [29] 10 Meter Walk Test (m/s) | 0.36 ± 0.24 | [0 0.76] |
| [30] Montreal Cognitive Assessment [0 30] | 22 ± 6 | [1 30] |
| Ischemic/Hemorrhagic/Both | 16/16/2 | |
Table 2.
Characteristics of unimpaired participants.
| # of Participants | Age [Max Min] | Sex | Dominance | |
| Young | 36 | 25 ± 4 [19 33] | 23M/13F | 34R/2L |
| Older | 26 | 64 ± 10 [50 84] | 10M/16F | 22R/4L |
3.1. Overview of Measurements and Effect of Stroke
Figure 2 provides an overview of the AROM and dorsiflexion MVC measurements collected during the first session using AMPD for all participants, while Table 3 summarizes the averages. Viewing the data in Figure 2 gives a sense for the inter-subject variability in these measurements, as well as the decreased AROM and dorsiflexion MVC of the hemiparetic ankle. A supplemental data file provides the corresponding numerical measurements along with basic demographic and clinical descriptors of the participants, for use as a benchmark in future studies.
Within the stroke participants, the impaired ankle had significantly less AROM and dorsiflexion strength compared to the unimpaired ankle, as measured with the robot (p < 0.0001). Stroke participants’ unimpaired AROM was comparable to unimpaired age-matched controls (p > 0.4). However, they generated significantly less dorsiflexion torque on their “unimpaired” side compared to controls (p< 0.001).
3.2. Test-Retest Reliability of Robot- and Therapist-Based Measurement of Ankle ROM and MVC
As described in the Methods, therapist test-retest data were collected for the impaired ankle of stroke participants for dorsiflexion AROM and MVC (and not plantarflexion or passive ROM). Both the robot and therapist measurements of ankle dorsiflexion AROM and MVC showed excellent test-retest reliability: ICCs were always 0.91 or above for AROM, and 0.86 or above for MVC (Table 4).
We additionally assessed reliability via the minimal detectable change (MDC) estimated from the two AROM or MVC measurements (Table 3). The MDC resulting from the robot measurements was typically lower than for the therapist, a fact attributable to the greater variability in the two measurements obtained with AMPD for both AROM and MVC (see SEM, Table 4).
3.3. Validity of Robot-Based Compared to Therapist-Based Measurement
We analyzed how well dorsiflexion AROM, PROM, and MVC measurements taken with AMPD correlated with the same measurements taken by the therapist. We performed this analysis only for the post-stroke participants, since therapists did not obtain these measurements from the unimpaired participants. The correlations between robot and therapist obtained measures were strong for ROM and moderate for MVC (Figure 3).
However, the impaired ankle dorsiflexion ROM measured with the robot was larger than that with the goniometer (Figure 3 left and 3 middle). Post-stroke participants were able to achieve on average 18.2 ± 9.9 degrees more dorsiflexion range of motion when the robot measured AROM (p < 0.0001) and 3.9 ± 6.0 degrees more when the robot measured dorsiflexion PROM (p < 0.0001).
As for maximum dorsiflexion strength, although the robotic and therapist measures of MVC were significantly correlated, the MMT scores had poor resolution. 85% of participants scored 1 on the MMT, corresponding to “Flicker or trace of contraction”. However, their ankle strengths were distributed across a range from 0 to nearly 20 Nm. Despite the coarse, ordinal nature of MMT, robotic MVC values were moderately correlated with MMT scores (r = 0.41, p = 0.02; Figure 3 right).
3.4. Reliability of Robotic Measures for Unimpaired Participants
We also used the robot to obtain test-retest reliability of AROM and MVC for young and older, unimpaired participants. Test-retest reliability was also good to excellent for these participants: ICCs were always 0.90 or above (Table 5).
3.5. Comparison of First and Second Session Measurements
As described above, test-retest reliability of ankle impairment was high, though not perfect, raising the question of whether participants improved between the first and second testing sessions. For stroke participants, dorsiflexion measured with AMPD did not change significantly from the first to the second trial (p > 0.5, Table 3). For young and older participants, however, dorsiflexion AROM significantly increased for both young and older unimpaired participants by 1.3°±3.2° and 1.2°±2.4° (p < 0.001, Table 3), but had a small effect (d < 0.20). Plantarflexion AROM and dorsiflexion MVC measurements did not change significantly between sessions for any group (p > 0.3, see Table 3).
3.6. Comparison of Older to Younger Unimpaired Adults and Effect of Leg Dominance
Robotic measurements revealed no significant differences in ankle dorsiflexion AROM (p > 0.1) or MVC (p > 0.5) between young and older participants. In young participants, the dominant ankle exhibited greater dorsiflexion AROM compared to the non-dominant ankle (p < 0.04), an effect not observed in the older group (p = 0.52). Both young and older participants demonstrated significantly greater dorsiflexion MVC in the dominant ankle compared to the non-dominant ankle (p < 0.001; see Figure 2 and Table 3)
4. Discussion
We confirmed the hypothesis that a sensorized, robotic platform could provide reliable and valid measurements of ankle motor function after stroke. The reliability of both the ROM and MVC measurements was high for both the robot and the therapist, and for both the stroke and unimpaired groups. Further, the robot measurements for ROM were strongly correlated with therapist measurements, as well as detected the significant effect of stroke and leg dominance on ankle function. The robot MVC measurements also showed higher granularity. However, the robot ROM measurements significantly differed from those of the therapists, an important consideration. We will now discuss these results, followed by limitations and directions for future research.
4.1. Considerations in Using Sensorized, Robotic Platforms as Ankle Assessment Tools
The motivation for the study was to evaluate the validity and reliability of a class of technology, sensorized robotic platforms, for the purpose of ankle function measurement. The robot we used, AMPD, was custom-built, but is similar to several other research [31,32,33] and commercial [34] devices that can measure ankle function. The common features of these devices are that they test ankle function in a seated posture and use movement and force sensors integrated with a rotating foot plate strapped to the foot. This approach standardizes the testing posture, supports/constrains ankle movement (as opposed to the therapist having to manually do this), and provides fine resolution measure of angle and force. AMPD is mainly unique in its use of a mechanical method to switch between isometric force and free-motion measurements, but the overall measurement principles, standardized positioning, isolated joint testing, and integrated sensing, are shared across this class of devices, supporting the broader relevance of our findings
The high test-retest reliability of robotic assessment of AROM and MVC across all groups, at a level comparable with that of the therapists, supports the concept that robotic devices could be useful for ankle function assessment. The reliability was not better than a therapist, but neither was it worse. Previous studies have found therapists to have moderate to good test-retest reliability for ankle range of motion [9,35,36]. Likewise, the finding of high test-retest reliability of MMT is consistent with those obtained in other studies for older [37,38] and young unimpaired adults [10].
The robotic assessments were not only reliable but also showed strong correlations with traditional therapist-based measurements, demonstrating concurrent validity. However, important differences emerged. Specifically, both active and passive range of motion (AROM and PROM) values were consistently higher when measured with the robotic device. This discrepancy could arise from several factors.
First, the robot may have held the foot in a more consistently pronated position than the therapist, which may allow the ankle to achieve greater angles of dorsiflexion ROM [39]. Second, the footplate used with AMPD contacted the plantar surface of the foot, which may have increased cutaneous input, a factor known to enhance force output [40]. Third, and most probable in our opinion, the discrepancy could have stemmed from the robot constraining the ankle to move strictly in the dorsiflexion/plantarflexion plane. In doing so, it blocks off-axis movements, allowing contributions from coupled or compensatory motions to be redirected into the primary movement plane. People with hemiparesis after stroke often lose the ability to move their joints independently, resulting in abnormally coupled pathophysiological movement patterns, also called synergies [16,41]. Ankle dorsiflexion is part of the so-called flexion synergy [42], and if the robot blocked the other components of this flexion synergy that occur at the hip, knee, and ankle, it may have allowed participants to leverage the synergy to dorsiflex the ankle further. This distinction should be kept in mind when interpreting robotic platform measurements and relating them to unconstrained, functional movements.
In the context of this study, the robotic approach provided greater granularity of strength measurement compared to the most common clinical method used here, the MMT. While continuous clinical measurement tools are available, the MMT remains the standard in most rehabilitation settings, and our comparison reflects this common practice rather than all possible clinical approaches. Individuals with the same MMT score created dorsiflexion torques that ranged from 0 to ~20 Nm. This highlights the robotic device’s ability to detect differences in strength that are obscured by the coarse, ordinal nature of the manual muscle test. Beyond increased granularity, continuous measurements such as those obtained from the robotic platform offer fundamental statistical advantages over categorical scales like the MMT. Continuous data better support parametric analyses, provide improved sensitivity to change, and enable richer modeling of motor recovery trajectories, making them more suitable for clinical research and outcome evaluation [43].
4.2. Limitations and Directions for Future Research
This study has several limitations. First, we did not assess AROM in unimpaired participants using a goniometer, so test-retest reliability and validity analyses for AROM were limited to individuals post-stroke. Second, most stroke participants in our sample had severe ankle weakness, with MMT scores below 2; future studies should include individuals with milder impairments to assess generalizability. Third, our comparisons involved only two therapists. Although both therapists had over 20 years of experience and were highly trained, it remains possible that results could vary depending on the specific techniques used by the testing therapist [9,44]. Further, less skilled therapists may produce different results.
Finally, it is important to note that using a robot for ankle assessment did not eliminate the need for human involvement. A trained experimenter or therapist was required to set up the control interface, position the participant, provide instructions and feedback, and monitor data quality. These human-controlled elements, including variations in participant positioning, strapping, and instruction delivery, could have contributed to the variability observed in the robotic measurements, and should be considered in the interpretation of results. The robot serves not as a replacement for clinical expertise, but as an advanced measurement tool—akin to a more sophisticated, sensorized goniometer that enhances, rather than replaces, human judgment.
5. Conclusion
We established that a sensorized, robotic platform can be highly reliable for evaluating ankle ROM and MVC, similar to a skilled therapist with more than 20 years of experience. In addition, robotic measurements of ROM demonstrated strong validity against therapist-based assessments, while MVC measures showed moderate validity despite the limitations of the ordinal MMT scale. Such an approach can also provide more granular strength assessments than the traditional therapist-based method examined here. We hope that the supplementary dataset of ankle ROM and MVC values for post-stroke, age-matched, and younger individuals can serve as a useful benchmark for future research into ankle function.
References
- E. S. Donkor, “Stroke in the 21st Century: A Snapshot of the Burden, Epidemiology, and Quality of Life,” Stroke Res Treat, vol. 2018, 2018. [CrossRef]
- J. Carod-Artal, J. A. Egido, J. L. González, and E. Varela de Seijas, “Quality of Life Among Stroke Survivors Evaluated 1 Year After Stroke,” Stroke, vol. 31, no. 12, pp. 2995–3000, Dec. 2000. [CrossRef]
- P. Y. Lin, Y. R. Yang, S. J. Cheng, and R. Y. Wang, “The Relation Between Ankle Impairments and Gait Velocity and Symmetry in People With Stroke,” Arch Phys Med Rehabil, vol. 87, no. 4, pp. 562–568, Apr. 2006. [CrossRef]
- S. S. Ng and C. W. Hui-Chan, “Contribution of Ankle Dorsiflexor Strength to Walking Endurance in People With Spastic Hemiplegia After Stroke,” Arch Phys Med Rehabil, vol. 93, 2012. [CrossRef]
- D. Kunkel, J. Potter, and L. Mamode, “A cross-sectional observational study comparing foot and ankle characteristics in people with stroke and healthy controls,” Disabil Rehabil, vol. 39, no. 12, pp. 1149–1154, Jun. 2017. [CrossRef]
- M. Abdalla Alawna, B. H. Unver, and E. O. Yuksel, “The Reliability of a Smartphone Goniometer Application Compared With a Traditional Goniometer for Measuring Ankle Joint Range of Motion,” J Am Podiatr Med Assoc, Jan. 2019. [CrossRef]
- M. Rabelo, G. S. Nunes, N. M. Da Costa Amante, M. De Noronha, and E. Fachin-Martins, “Reliability of muscle strength assessment in chronic post-stroke hemiparesis: a systematic review and meta-analysis,” Top Stroke Rehabil, vol. 23, no. 1, pp. 26–35, 2016. [CrossRef]
- J. Wilken, R. Smita, M. Estin, C. Saltzman, and H. John Yack, “A new device for assessing ankle dorsiflexion motion: reliability and validity,” J Orthop Sports Phys Ther, vol. 41, no. 4, pp. 274–280, 2011. [CrossRef]
- M. M. Konor, S. Morton, J. M. Eckerson, and T. L. Grindstaff, “RELIABILITY OF THREE MEASURES OF ANKLE DORSIFLEXION RANGE OF MOTION,” Int J Sports Phys Ther, vol. 7, no. 3, p. 279, Jun. 2012, Accessed: Mar. 24, 2024. [Online]. Available: /pmc/articles/PMC3362988/.
- S. Y. Cho, Y. Myong, S. Park, M. Cho, and S. Kim, “A portable articulated dynamometer for ankle dorsiflexion and plantar flexion strength measurement: a design, validation, and user experience study,” Sci Rep, vol. 13, no. 1, p. 22221, 2023. [CrossRef]
- F. N. Bittmann, S. Dech, M. Aehle, and L. V. Schaefer, “Manual Muscle Testing—Force Profiles and Their Reproducibility,” Diagnostics, vol. 10, no. 12, Dec. 2020. [CrossRef]
- M. Zhang, T. C. Davies, Y. Zhang, S. Xie, and E. Phd, “Reviewing effectiveness of ankle assessment techniques for use in robot-assisted therapy,” vol. 51, no. 4, pp. 517–534, 2014. [CrossRef]
- O. Lambercy, S. Maggioni, L. Lünenburger, R. Gassert, and M. Bolliger, “Robotic and Wearable Sensor Technologies for Measurements/Clinical Assessments,” 2016, pp. 183–207. [CrossRef]
- J. Mehrholz, S. Thomas, C. Werner, J. Kugler, M. Pohl, and B. Elsner, “Electromechanical-assisted training for walking after stroke,” Cochrane Database Syst Rev, vol. 5, no. 5, May 2017. [CrossRef]
- I. Díaz, J. J. Gil, and E. Sánchez, “Lower-Limb Robotic Rehabilitation: Literature Review and Challenges,” Journal of Robotics, vol. 2011, p. 759764, 2011. [CrossRef]
- S. Maggioni et al., “Robot-aided assessment of lower extremity functions: A review,” Aug. 02, 2016, BioMed Central Ltd. [CrossRef]
- E. A. S. Duncan and J. Murray, “The barriers and facilitators to routine outcome measurement by allied health professionals in practice: A systematic review,” BMC Health Serv Res, vol. 12, no. 1, pp. 1–9, May 2012. [CrossRef]
- P. Biswas et al., “A single-center, assessor-blinded, randomized controlled clinical trial to test the safety and efficacy of a novel brain-computer interface controlled functional electrical stimulation (BCI-FES) intervention for gait rehabilitation in the chronic stroke population,” BMC Neurol, vol. 24, no. 1, p. 200, 2024. [CrossRef]
- N. van Melick, B. M. Meddeler, T. J. Hoogeboom, M. W. G. Nijhuis-van der Sanden, and R. E. H. van Cingel, “How to determine leg dominance: The agreement between self-reported and observed performance in healthy adults,” PLoS One, vol. 12, no. 12, p. e0189876, Dec. 2017. [CrossRef]
- C. A. Johnson, D. S. Reinsdorf, D. J. Reinkensmeyer, and A. J. Farrens, “Robotically quantifying finger and ankle proprioception: Role of range, speed, anticipatory errors, and learning.” Accessed: Nov. 15, 2023. [Online]. Available: https://arinex.com.au/EMBC/pdf/full-paper_1006.pdf.
- R. P. Kleyweg, F. G. A. Van Der Meché, and P. I. M. Schmitz, “Interobserver agreement in the assessment of muscle strength and functional abilities in Guillain-Barré syndrome,” Muscle Nerve, vol. 14, no. 11, pp. 1103–1109, Nov. 1991. [CrossRef]
- T. K. Koo and M. Y. Li, “A Guideline of Selecting and Reporting Intraclass Correlation Coefficients for Reliability Research,” J Chiropr Med, vol. 15, no. 2, p. 155, Jun. 2016. [CrossRef]
- J. P. WEIR, “QUANTIFYING TEST-RETEST RELIABILITY USING THE INTRACLASS CORRELATION COEFFICIENT AND THE SEM,” The Journal of Strength & Conditioning Research, vol. 19, no. 1, 2005, [Online]. Available: https://journals.lww.com/nsca-jscr/fulltext/2005/02000/quantifying_test_retest_reliability_using_the.38.aspx.
- J. Cohen, “Statistical Power Analysis for the Behavioral Sciences,” Statistical Power Analysis for the Behavioral Sciences, May 2013. [CrossRef]
- S. E. Kasner, “Clinical interpretation and use of stroke scales,” Lancet Neurol, vol. 5, no. 7, pp. 603–612, Jul. 2006. [CrossRef]
- S. J. Page, E. Hade, and A. Persch, “Psychometrics of the wrist stability and hand mobility subscales of the Fugl-Meyer assessment in moderately impaired stroke,” Phys Ther, vol. 95, no. 1, pp. 103–108, Jan. 2015. [CrossRef]
- G. Lee, S. An, Y. Lee, D. Lee, and D. S. Park, “Predictive factors of hypertonia in the upper extremity of chronic stroke survivors,” J Phys Ther Sci, vol. 27, no. 8, p. 2545, Aug. 2015. [CrossRef]
- U. B. Flansbjer, A. M. Holmbäck, D. Downham, C. Patten, and J. Lexell, “Reliability of gait performance tests in men and women with hemiparesis after stroke,” J Rehabil Med, vol. 37, no. 2, pp. 75–82, Mar. 2005. [CrossRef]
- K. Severinsen, J. K. Jakobsen, K. Overgaard, and H. Andersen, “Normalized muscle strength, aerobic capacity, and walking performance in chronic stroke: a population-based study on the potential for endurance and resistance training,” Arch Phys Med Rehabil, vol. 92, no. 10, pp. 1663–1668, Oct. 2011. [CrossRef]
- T. B. Cumming, D. Lowe, T. Linden, and J. Bernhardt, “The AVERT MoCA Data: Scoring Reliability in a Large Multicenter Trial,” Assessment, vol. 27, no. 5, pp. 976–981, Jul. 2020. [CrossRef]
- J. A. Saglia, N. G. Tsagarakis, J. S. Dai, and D. G. Caldwell, “Control strategies for patient-assisted training using the ankle rehabilitation robot (ARBOT),” IEEE/ASME Transactions on Mechatronics, vol. 18, no. 6, pp. 1799–1808, 2013. [CrossRef]
- A. B. Farjadian, M. Nabian, A. Hartman, and S.-C. Yen, “Vi-RABT: A Platform-Based Robot for Ankle and Balance Assessment and Training,” J Med Biol Eng, vol. 38, no. 4, pp. 556–572, 2018. [CrossRef]
- Z. Zhou, Y. Zhou, N. Wang, F. Gao, K. Wei, and Q. Wang, “A proprioceptive neuromuscular facilitation integrated robotic ankle–foot system for post stroke rehabilitation,” Rob Auton Syst, vol. 73, pp. 111–122, Nov. 2015. [CrossRef]
- N. A. S. Taylor, R. H. Sanders, E. I. Howick, and S. N. Stanley, “Static and dynamic assessment of the Biodex dynamometer,” Eur J Appl Physiol Occup Physiol, vol. 62, no. 3, pp. 180–188, May 1991. [CrossRef]
- P. Tavares, V. Landsman, and L. Wiltshire, “Intra-examiner reliability of measurements of ankle range of motion using a modified inclinometer: a pilot study.,” J Can Chiropr Assoc, vol. 61, no. 2, pp. 121–127, Aug. 2017.
- I.-G. Jung, I.-Y. Yu, S.-Y. Kim, D.-K. Lee, and J.-S. Oh, “Reliability of ankle dorsiflexion passive range of motion measurements obtained using a hand-held goniometer and Biodex dynamometer in stroke patients,” J Phys Ther Sci, vol. 27, no. 6, pp. 1899–1901, 2015. [CrossRef]
- C. Y. Wang, S. L. Olson, and E. J. Protas, “Test-retest strength reliability: Hand-held dynamometry in community-dwelling elderly fallers,” Arch Phys Med Rehabil, vol. 83, no. 6, pp. 811–815, Jun. 2002. [CrossRef]
- H. B. Menz, A. Tiedemann, M. M.-S. Kwan, M. D. Latt, C. Sherrington, and S. R. Lord, “Reliability of Clinical Tests of Foot and Ankle Characteristics in Older People,” J Am Podiatr Med Assoc, vol. 93, no. 5, pp. 380–387, 2003. [CrossRef]
- J. W. Youdas, C. L. Bogard, and V. J. Suman, “Reliability of goniometric measurements and visual estimates of ankle joint active range of motion obtained in a clinical setting,” Arch Phys Med Rehabil, vol. 74, no. 10, pp. 1113–1118, Oct. 1993. [CrossRef]
- J. T. Choi, J. Lundbye-Jensen, C. Leukel, and J. B. Nielsen, “Cutaneous mechanisms of isometric ankle force control,” Exp Brain Res, vol. 228, no. 3, pp. 377–384, Jul. 2013. [CrossRef]
- N. D. Neckel, N. Blonien, D. Nichols, and J. Hidler, “Abnormal joint torque patterns exhibited by chronic stroke subjects while walking with a prescribed physiological gait pattern,” J Neuroeng Rehabil, vol. 5, no. 1, pp. 1–13, Sep. 2008. [CrossRef]
- S. BRUNNSTROM, “Movement therapy in hemiplegia,” A neurophysiological approach, 1970, Accessed: May 04, 2024. [Online]. Available: https://cir.nii.ac.jp/crid/1574231875545213568.bib?lang=en.
- R. D. Luce and L. Narens, “Measurement Scales on the Continuum,” Science (1979), vol. 236, no. 4808, pp. 1527–1532, Jun. 1987. [CrossRef]
- S. E. Munteanu, A. B. Strawhorn, K. B. Landorf, A. R. Bird, and G. S. Murley, “A weightbearing technique for the measurement of ankle joint dorsiflexion with the knee extended is reliable,” J Sci Med Sport, vol. 12, no. 1, pp. 54–59, 2009. [CrossRef]
Figure 1.
Device used to measure ankle active range of motion, passive range of motion, and dorsiflexion maximum strength. In rigid mode, the foot pedal is coupled to a non-backdriveable, linear actuator so that isometric force can be measured or the ankle can be passively driven. In transparent mode, the pedal is decoupled from the drive, allowing free ankle dorsiflexion/plantarflexion movement.
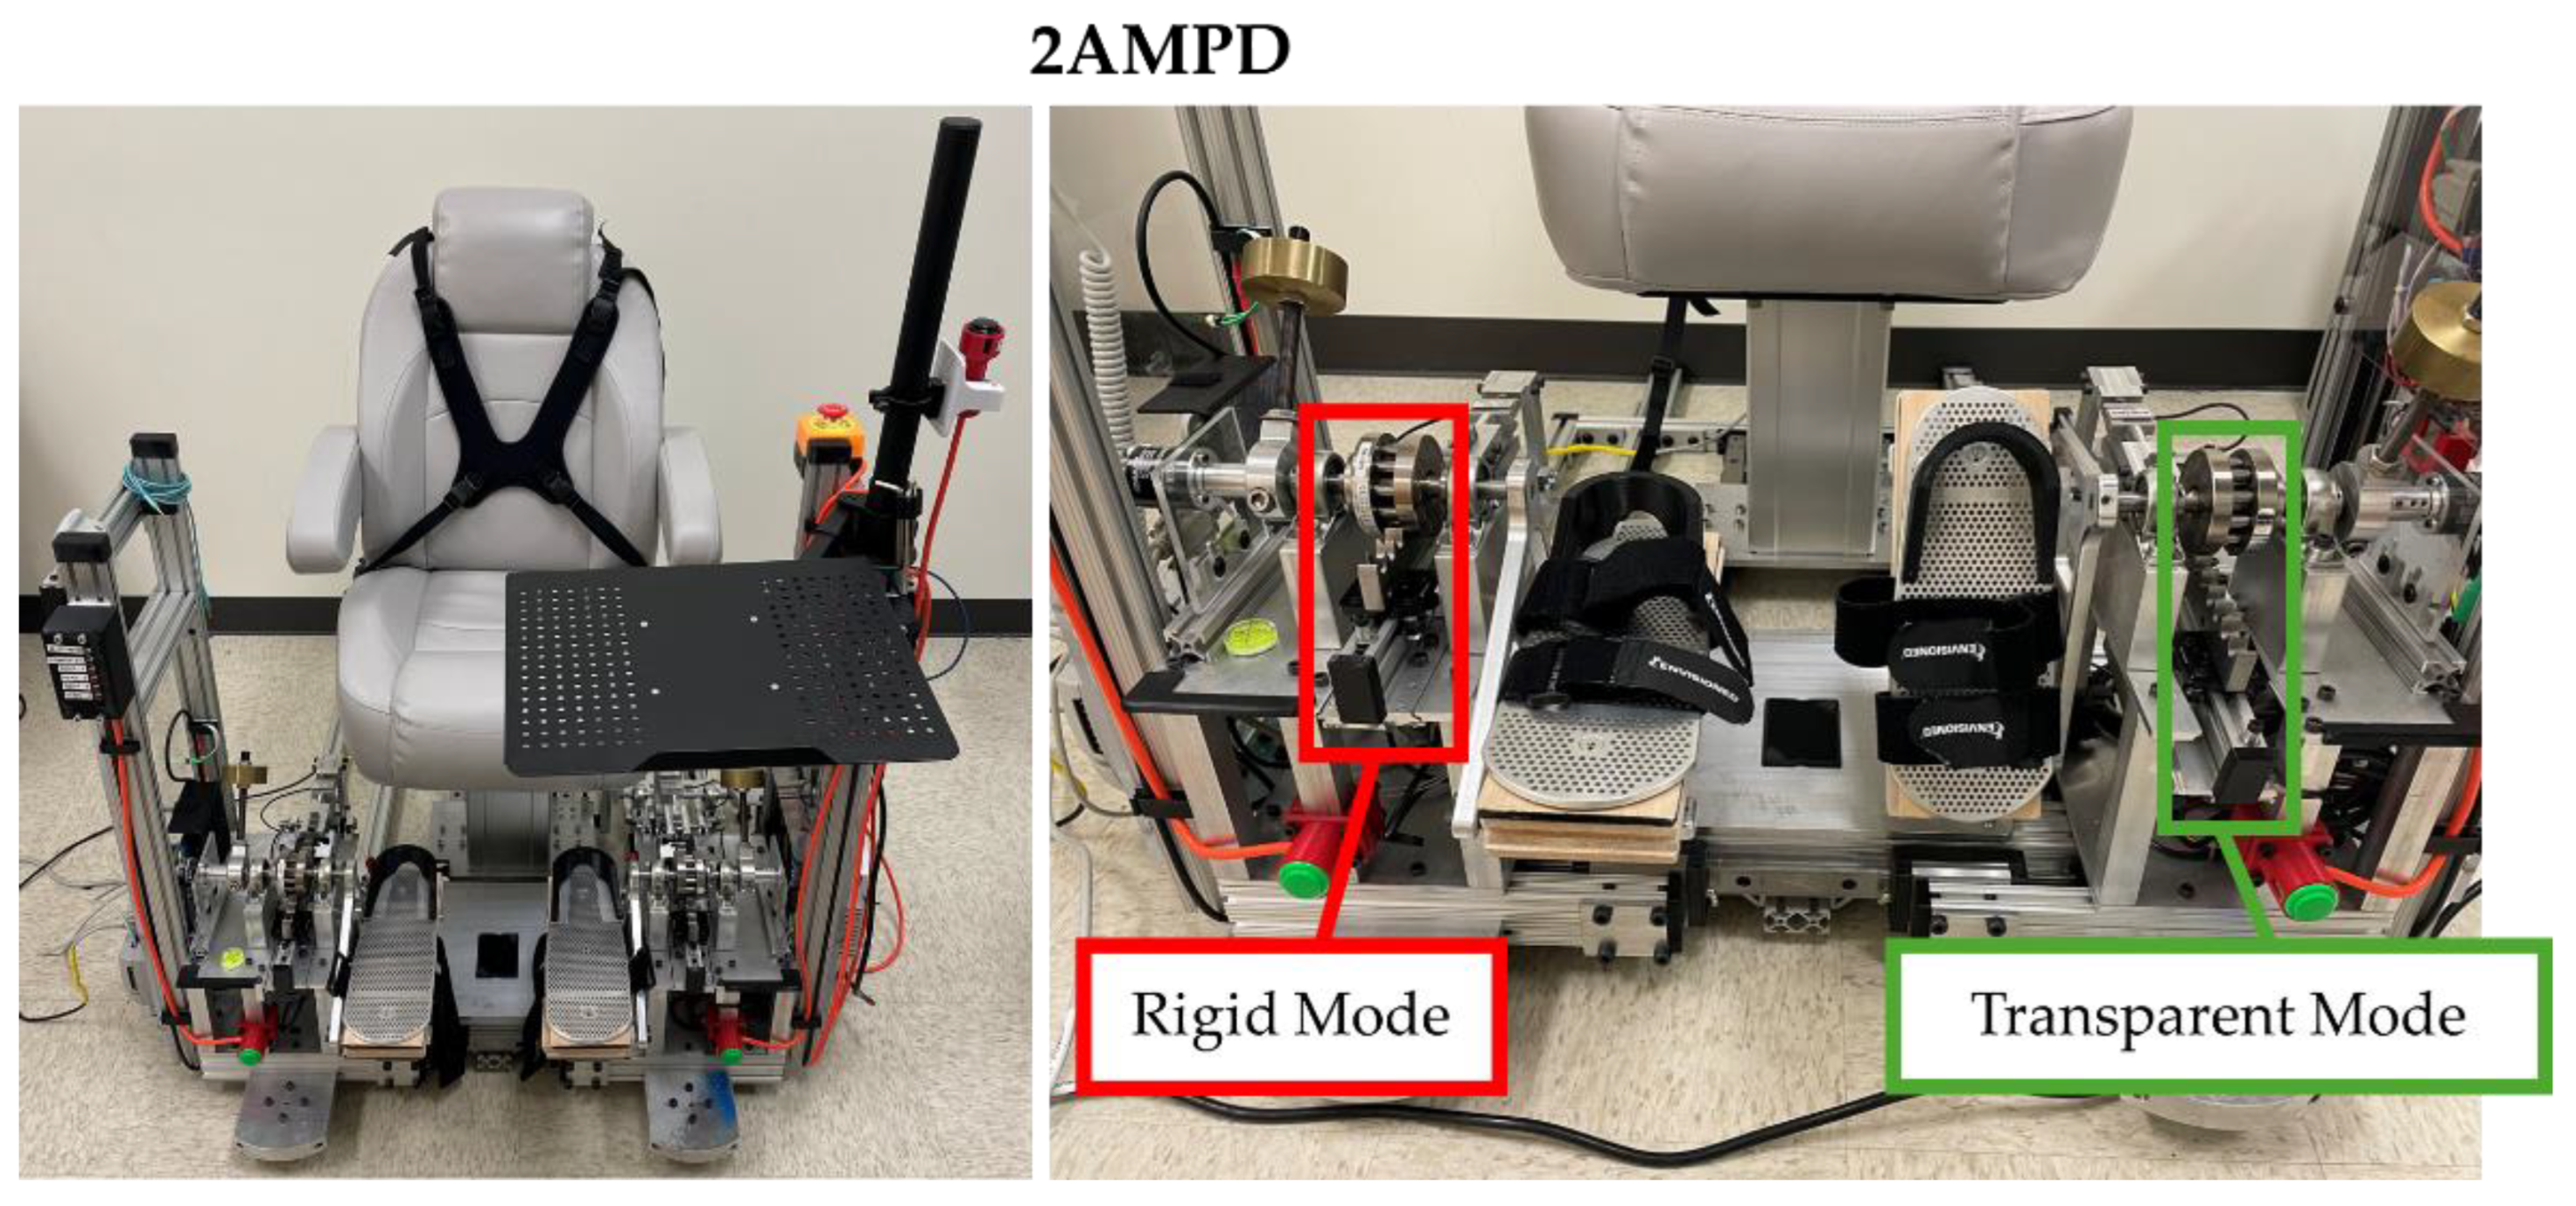
Figure 2.
Averages per participant for AROM and dorsiflexion MVC obtained using the sensorized robotic platform, AMPD, for all groups at session 1 but stratified by sex and leg dominance. Top: AROM dorsiflexion and plantarflexion positions for the dominant and non-dominant ankle. Bottom: Dorsiflexion MVC for the dominant and non-dominant ankle. The dotted and solid black lines represent the averages for the dominant and non-dominant ankle. DF: Dorsiflexion, PF: Plantarflexion, Non-Dom: Non-dominant, Dom: Dominant, YNG F: Young Female, YNG M: Young Male, OLDER F: Older Female, OLDER M: Older Male, STR IMP. F: Stroke Impaired Side Female, STR IMP. M: Stroke Impaired Side Male, STR UN-IMP. F: Stroke Unimpaired Side Female, STR UN-IMP. M: Stroke Unimpaired Side Male.
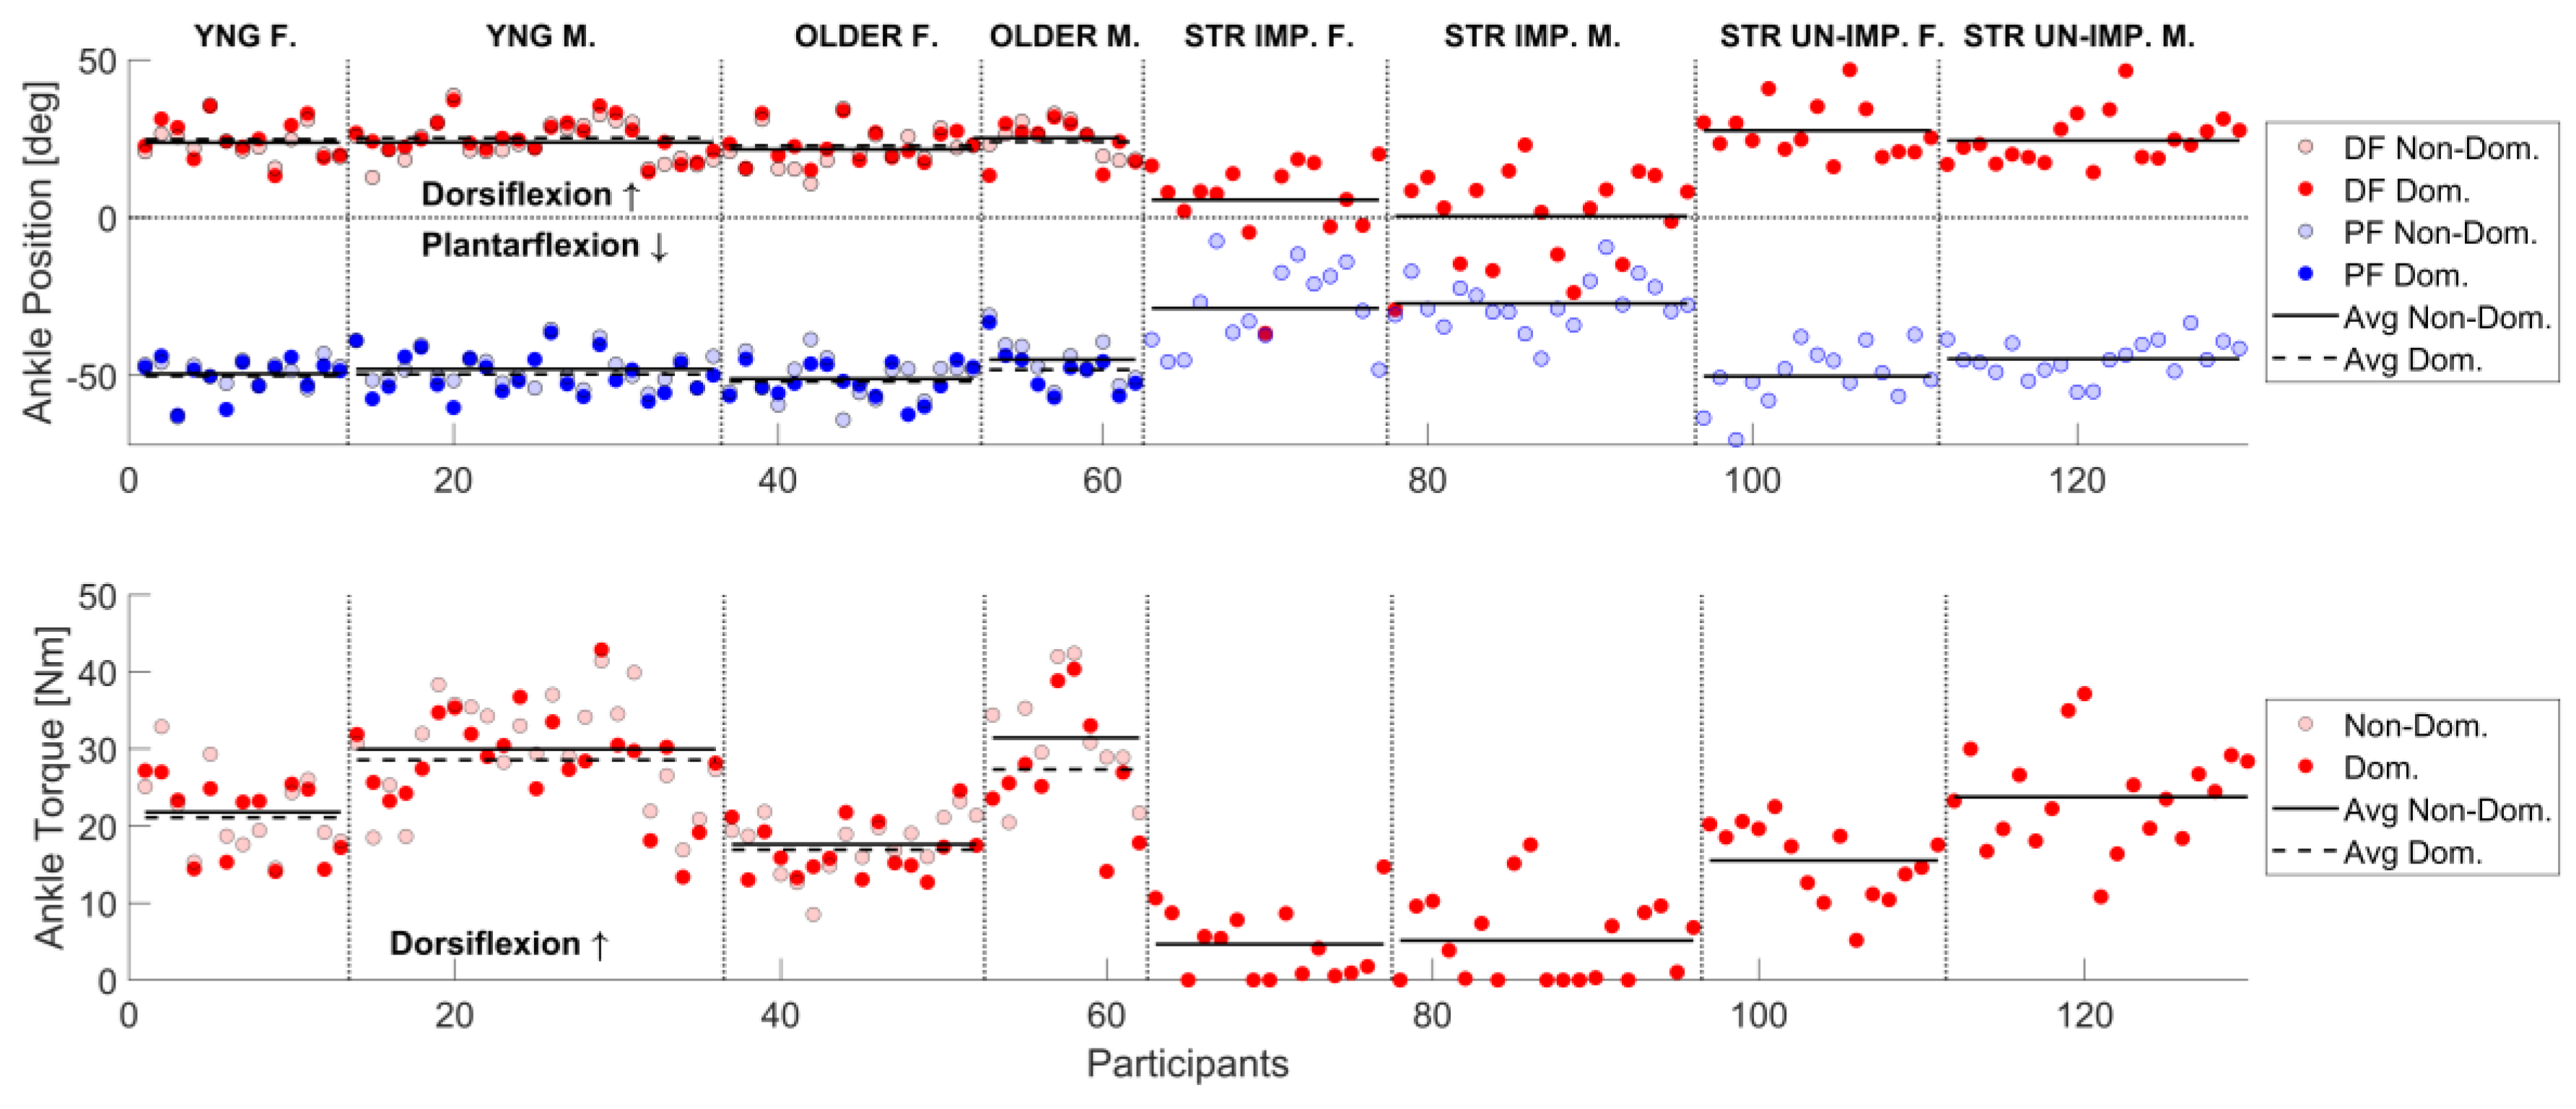
Figure 3.
Relationships between clinical measures (x-axis) and AMPD measures (y-axis) of chronic stroke participants impaired ankle for active and passive ROM and maximum dorsiflexion strength.
Figure 3.
Relationships between clinical measures (x-axis) and AMPD measures (y-axis) of chronic stroke participants impaired ankle for active and passive ROM and maximum dorsiflexion strength.
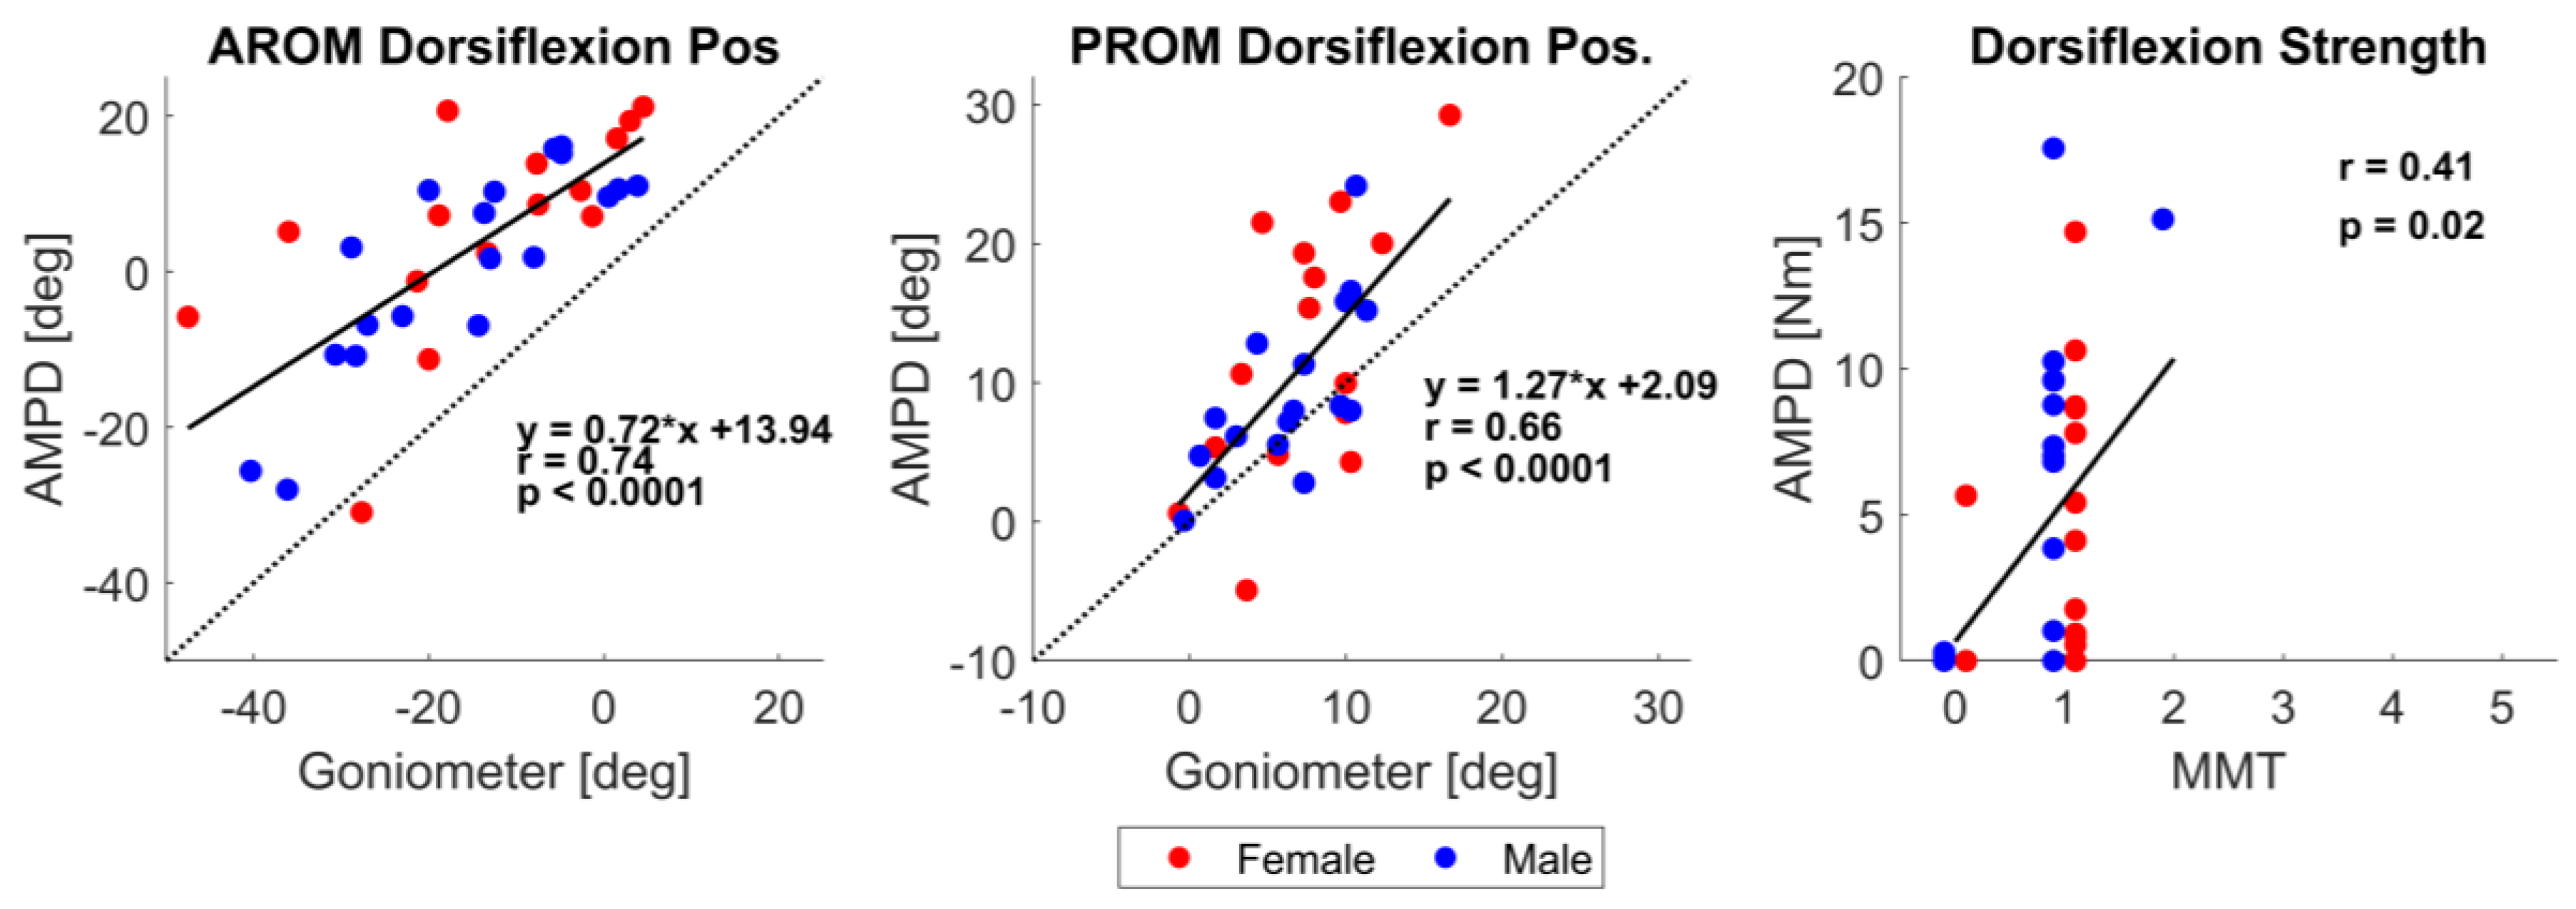
Table 3.
Average dorsiflexion and plantarflexion active range of motion (AROM) and dorsiflexion maximum voluntary contraction (MVC) values from Sessions 1 and 2 for each ankle, stratified by group, side dominance, and sex. A: All participants, F: Female, M: Male.
Table 3.
Average dorsiflexion and plantarflexion active range of motion (AROM) and dorsiflexion maximum voluntary contraction (MVC) values from Sessions 1 and 2 for each ankle, stratified by group, side dominance, and sex. A: All participants, F: Female, M: Male.
| Young | Old | Stroke | ||||
| Dom. | Non-Dom. | Dom. | Non-Dom. | Impaired | Unimpaired | |
| AROM Dorsiflexion Position [°] | ||||||
| Session 1 | A: 25.04°±5.8 F: 24.8°± 6.4° M: 25.2°±5.6° |
A: 23.8°±6.0° F: 23.7° ± 5.2° M: 23.8°±6.5° |
A:23.2°±6.0° F: 22.8°±5.6° M:24.0°±6.7° |
A: 23.0°±6.1 F: 21.6°± 6.3° M: 25.2°±5.4° |
A: 2.7°±7.8° F: 5.6°± 14.2° M: 0.4°± 14.7° |
A:25.8°±8.2 F: 27.6°± 8.6° M: 24.4°± 7.9° |
| Session 2 | A: 26.4°±5.9° F: 25.8°±6.4° M: 26.7°±5.7° |
A: 25.0°±6.4° F: 25.1°± 7.1° M: 24.9°±6.2° |
A:24.7°±7.0° F: 24.9°±7.8° M: 24.3°±5.8° |
A:24.0°±6.7° F: 23.1°±7.0° M: 25.4°±6.3° |
A: 3.3°±13.6° F: 5.6°± 14.6° M: 1.5°± 12.9° |
A:25.5°±7.5° F: 25.7°± 8.4° M: 25.4°± 6.9° |
| Change in mean | A:1.3°±2.7° F: 1.0°±3.5° M: 1.5°±2.2° |
A:1.2 °± 3.7° F: 1.3°±4.7° M: 1.1°± 3.1° |
A: 1.3°± 2.8° F: 2.1°± 2.9° M: 0.4°±1.6° |
A: 1.0°± 2.1° F: 2.1°± 2.9° M: 0.2°±2.5° |
A: 0.6°± 7.8° F: 0.0°± 7.6° M: 1.1°± 8.1° |
A: -0.3°± 2.7° F: -1.9°± 4.2° M: 1.0°± 4.1° |
| AROM Plantarflexion Position [°] | ||||||
| Session 1 | A: -49.8°±6.3° F: -50.2°± 5.9° M: -49.6°±6.6° |
A: -48.5°±5.5° F: -49.5°±5.3° M: -48.0°± 5.7° |
A: -50.5°±6.3° F: -51.9°±5.5° M -48.2°±7.1° |
A: -48.7°±7.6° F: -51.1°± 6.9° M: -45.0°±7.4° |
A: -27.9°±10.5° F: -28.7°± 13.2° M: -27.2°± 8.0° |
A: -47.2°±8.0° F: -50.3°± 9.4° M: -44.8°± 5.8° |
| Session 2 | A: -49.75°±7.0° F: -49.8°± 7.6° M: -49.7°± 6.8° |
A: -48.3°±6.2° F: -49.9°± 6.1° M: -47.4°± 6.2° |
A: -49.2°±5.3° F: -50.3°± 5.3° M: -47.3°±5.0° |
A: -48.6°±6.1° F: 50.1°±6.1° M: -46.2°±5.5° |
A: -28.1°±12.0° F: -27.0°± 15.6° M: -28.9°± 8.5° |
A: -46.8°±8.4° F: -49.4°± 10.3° M: -44.7°± 6.0° |
| Change in mean | A:0.1°±2.8° F: 0.4°±2.9° M: -0.1°± 2.8° |
A:0.2°±3.4° F: -0.4°± 3.0° M: 0.5°±3.6° |
A:1.3°±3.3° F: 1.6°± 3.6° M: 0.9°± 2.9° |
A:0.1°±3.2° F: 1.0°± 3.1° M: -1.2°± 3.0° |
A: -0.2°±6.4° F: 1.7°± 6.8° M: -1.7°± 5.7° |
A:0.4°±3.5° F: 0.8°± 3.3° M: 0.0°± 3.7° |
| Dorsiflexion Maximum Strength [Nm] | ||||||
| Session 1 | A: 25.9±7.0 F: 21.1±5.2 M: 28.6±6.4 |
A: 27.0±7.6 F: 21.8± 5.5 M: 30.0±7.1 |
A: 20.9±7.7 F: 16.9±3.6 M: 27.3±8.3 |
A: 22.9±8.7 F: 17.6±3.9 M: 31.4±7.4 |
A: 4.9±5.1 F: 4.7±4.6 M: 5.1±5.6 |
A: 20.1±7.1 F: 15.5±4.9 M: 23.8±4.6 |
| Session 2 | A: 25.9±7.1 F: 21.7±6.2 M: 28.2±6.6 |
A: 27.1±7.1 F: 22.0±6.1 M: 29.9±6.0 |
A: 21.3±6.9 F: 18.5±4.2 M: 25.9±8.0 |
A: 23.2±8.9 F: 18.9±4.8 M: 30.0±9.8 |
A: 4.3±4.9 F: 4.7±5.4 M: 4.0±4.6 |
A: 19.1±6.9 F: 15.3±4.9 M: 22.1±6.9 |
| Change in mean | A: 0.02±2.7 F: 0.6±2.4 M: -0.3±2.9 |
A: 0.05±3.0 F: 0.2±2.1 M: -0.02±3.5 |
A: 0.4±3.5 F: 1.6±2.8 M: -1.4±3.9 |
A: 0.2±3.9 F: 1.3±2.6 M: -1.4±5.1 |
A: -0.6±3.2 F: 0.1±2.7 M: -1.1±3.5 |
A: -1.0±3.9 F: -0.2±2.7 M: -1.6±4.6 |
Table 4.
For both AMPD (R) and physical therapist (T) the ICC intraclass correlation coefficient, SEM standard error of measurement, MDC minimal detectable change for the average of 3 trials for dorsiflexion AROM. For dorsiflexion MVC only the first trial was used. This table only includes post-stroke participants.
| Stroke | |||
|---|---|---|---|
| Trial | ICC [95% CI] | SEM | MDC |
| AROM Dorsiflexion Position (Impaired Ankle) | |||
| Avg of 3 | R: 0.92 [0.84 0.96] T: 0.95 [0.90 0.98] |
R: 2.2° T: 1.3° |
R: 6.2° T: 3.7° |
| Dorsiflexion MVC (Impaired Ankle) | |||
| First | R: 0.89 [0.78 0.94] T: 0.86 [0.72 0.93] |
R: 1.0 Nm T: 0.1 |
R: 2.9 Nm T: 0.3 levels |
Table 5.
Summary of test-retest reliability of AMPD. ICC intraclass correlation coefficient, SEM standard error of measurement, MDC minimal detectable change, for the average of 3 trials.
Table 5.
Summary of test-retest reliability of AMPD. ICC intraclass correlation coefficient, SEM standard error of measurement, MDC minimal detectable change, for the average of 3 trials.
| Young | Older | Stroke | ||||||
| ICC [95% CI] | SEM | MDC | ICC [95% CI] | SEM | MDC | ICC [95% CI] | SEM | MDC |
| AROM Dorsiflexion Position | ||||||||
| 0.91 [0.85 0.95] | 0.9 | 2.6 | 0.96 [0.90 0.98] | 0.5 | 1.4 | 0.96 [0.94 0.98] | 1.2 | 3.5 |
| AROM Plantarflexion Position | ||||||||
| 0.94 [0.90 0.96] | 0.6 | 1.8 | 0.93 [0.87 0.96] | 0.9 | 2.5 | 0.96 [0.94 0.98] | 1.0 | 2.7 |
| Dorsiflexion MVC | ||||||||
| 0.96 [0.94 0.98] | 0.6 | 1.6 | 0.95 [0.91 0.97] | 0.9 | 2.4 | 0.96 [0.94 0.98] | 0.7 | 1.8 |
Disclaimer/Publisher’s Note: The statements, opinions and data contained in all publications are solely those of the individual author(s) and contributor(s) and not of MDPI and/or the editor(s). MDPI and/or the editor(s) disclaim responsibility for any injury to people or property resulting from any ideas, methods, instructions or products referred to in the content. |
© 2025 by the authors. Licensee MDPI, Basel, Switzerland. This article is an open access article distributed under the terms and conditions of the Creative Commons Attribution (CC BY) license (http://creativecommons.org/licenses/by/4.0/).
Copyright: This open access article is published under a Creative Commons CC BY 4.0 license, which permit the free download, distribution, and reuse, provided that the author and preprint are cited in any reuse.


