Submitted:
30 September 2025
Posted:
01 October 2025
You are already at the latest version
Abstract
This study investigates the effects of Ti addition on the microstructures, melting temperature ranges, thermal expansion behavior, high temperature creep and oxidation resistances of an equimolar CoNiFeCr alloy of a foundry origin. 1.5 wt.% Ti added did not really change the single–phased state of the reference quaternary alloy but induces a significant decrease of the melting start and melting end temperatures. The thermal expansion coefficient is slightly lowered only while the creep resistance at 1100°C is significantly enhanced. The oxidation at 1200°C is controlled by species diffusion through a continuous chromia layer and the parabolic constant is higher than for the quaternary alloy, due to external and internal Ti oxidation. The presence of a thin layer of titanium oxide covering the chromia scale is suspected to limit chromia volatilization and scale spallation at cooling. Globally Ti demonstrated a globally beneficial influence of the high temperature properties of the alloy.
Keywords:
CoNiFeCr alloy
; titanium addition
; melting temperature range
; thermal expansion
; creep resistance
; hot oxidation
1. Introduction
Many industrial or transportation applications require structural materials able to resist heat, mechanical stresses and chemical aggressions. Two major examples are the glass forming tools and the components working in the hottest parts of combustible turbines. Among the first metallic materials which answer these needs there are alloyed steels and superalloys [1]. Appeared more recently, the multi–principal elements alloys (MPEAs), high entropy alloys (HEAs) and medium entropy alloys (MEAs) can represent a third family candidate for these applications. By comparison with superalloys notably, many of these XEAs may be nowadays considered as superalloys versions freer in the Co and Ni (and Cr if present for favoring a chromia–forming behavior [2]) quasi–critical elements. In the case of the Cantor’s alloy this thank to the presence of more Fe and Mn instead a part of cobalt and nickel. In order to reinforce, at high temperature, the oxidation–resistant Mn–free version of the Cantor’s alloy (equimolar CoNiFeCr), with preservation of its FCC single–phased state, solid solution strengthening can be considered. Tungsten, molybdenum, tantalum or rhenium are classically used in this purpose. Unfortunately they induce an increase in volume mass if present in significant quantity in the alloys. Much lighter, titanium merits to be considered.
This element is already present in many superalloys, for various reasons. For instance it allows forming MC carbides and it can take part in the formation of the gamma prime precipitates. In some conditions it can influence positively creep resistance [3] and is not neutral in the hot oxidation behavior [4,5,6], in cobalt–based and nickel–based alloys.
In the present study it was wished to explore the effects of the introduction of 2 wt.%Ti in an equimolar CoNiFeCr alloy, on the microstructure of the alloy and on its high temperature thermal, mechanical and chemical properties.
2. Materials and Methods
First a compact ovoid ingot weighing 40 grams was elaborated by casting in inert atmosphere. The metal mixture – prepared from high purity (>99.9%) cobalt, nickel, iron, chromium an titanium (flakes, balls and rods; Alfa Aesar) – was placed in the copper crucible of an induction furnace surrounded by a copper coiled. Crucible and coil were continuously cooled by fresh water circulation. A silica tube was placed between crucible and coil and it was closed. The initial laboratory air was replaced by an inert atmosphere made of pure argon at about 300 millibars. An alternative current was generated in the coil for inducing Foucault’s currents heating the metals by Joule effect until becoming liquid. The operating parameters were: frequency 100 kHz, voltage from 0 to 5 kV, intensity of several A. After ten minutes spent at maximal power, the liquid was considered as wholly homogenized chemically and the progressive decrease in voltage resulted in liquid state cooling, solidification and solid state cooling.
The obtained ingot was cut using a metallographic precision saw. A part was embedded (cold resin mixture) for chemical and microstructure control, while other samples were prepared for exploring the following properties at high temperature of the alloys:
- Small parallelepiped (about 2 mm 2 mm 7 mm) for specifying the temperatures of start and end of fusion and solidification by differential thermal analysis (DTA)
- Small square–based prism (about 5 mm 5 mm 2 mm) for specifying the thermal dimensional behavior by thermo–dilatometry analysis (TDA)
- Square–based prism (about 10 mm 10 mm 3 mm) for specifying the mass gain kinetic during hot oxidation by thermo–gravimetry analysis (TGA)
- Long parallelepiped (about 15 mm 2 mm 1.5 mm) for central three points flexural creep test (3PFC)
The embedded sample for chemical and microstructure control was subjected to X–ray diffraction (XRD) using a D8 Advance diffractometer from Bruker (wave length of the used radiation: 0.154 nanometers). The diffraction results were analyzed using the DIFFRAC.EVA V5.0 software. After grinding (SiC papers from #240 to #1200) and polishing (textile disk enriched with 1µm alumina particles), the same sample was placed in the chamber of a scanning electron microscope (SEM; JEOL JSM 6010LA) in which its microstructure was observed in back scattered mode (BSE) at various magnifications, for an acceleration voltage rated at 20 kV. The chemical composition was measured by energy dispersion spectrometry (EDS) of the SEM (several 250 full frame acquisitions followed by calculation of the average contents and their standard deviation values). Elemental maps were also acquired.
The DTA run was performed using a SETARAM machine (model: TG-ATD 92-16.18), with a 20K min-1 heating rate from ambient temperature to 1000 °C, a 5K min-1 heating rate up to 1450 °C, a -5K min-1 cooling rate down to 1000 °C and, finally, a -20K min-1 cooling rate. The TDA run was performed using a SETARAM dilatometer (model: Ligne 96 TMA) with a 10K min-1 heating rate from ambient temperature to 1200 °C and a -10K min-1 cooling rate to go back to ambient temperature.
The 3PFC run was performed using a SETARAM dilatometer (model: TMA 92-16.18) modified to allow bending creep tests. Taking into account the distance between the two (sample/alumina rod support) contacts, and the accurately measured width and thickness of the parallelepiped, the central load was calculated in order produce a tensile stress equal to 10 MPa in the central bottom location in the surface of the sample. Heating was done at 20K min-1, the isothermal creep at 1100 °C was followed during 200 hours (or less in case of alloy failure before), and cooling was down at -20K min-1 cooling rate down to room temperature.
The TGA run was performed, under circulation of synthetic air (dry 80%N2 – 20%O2, about 1.5L h-1), using a SETARAM thermo-balance (model: TG 92-16.18), with a 20K min-1 heating rate from ambient temperature to 1200 °C, a 50 hours isothermal stage and a -5K min-1 cooling rate to return at room temperature.
3. Results
3.1. Characteristics of the Obtained Alloy
The control by EDS of the chemical composition of the obtained ingot shows that the targeted weight contents in Co, Ni, Fe and Cr are well respected (Table 1). Their atomic contents are very close to one another. In contrast, the obtained content for titanium is lower than wished (1.5 wt.% against 2 wt.%). A quarter of the titanium quantity introduced initially was seemingly lost by forming oxides or nitrides with the O and N present as traces in the pure argon. The microstructure appears as quasi single–phased (Figure 1), confirmed by XRD (Figure 2). However elemental EDS mapping allows observing Ti segregated in the grain boundaries (Figure 3). The DTA run (Figure 4) led to a heating curves with only one endothermic peak and a cooling with, also, a single exothermic peak (starting abruptly because of a delayed nucleation). Re-melting started at about 1280 °C and cooling finished at about 1250 °C (Table 2). The alloy should be still solid up to 1250 °C at least, and this allows choosing temperatures equal to 1200 °C maximum for the other tests. The characteristic temperatures are listed in Table 2. They are to compare with a Ti–free CoNiFeCr alloy elaborated in the same conditions studied in parallel with the same apparatus, and the solidus and liquidus temperatures of which are about 150 °C higher [7].
3.2. Thermal and Mechanical Behavior
The used apparatus usually induces some irregularities in the low temperature part of the heating phase (alumina apparatus not at a thermal equilibrium) and the corresponding part of the heating curve is removed in the left part of Figure 5). The average thermal expansion coefficient is of about 16 × 10-6 K-1. The cooling curve is much more regular. It is moreover rather straight and the thermal contraction coefficient is about 15 × 10-6 K-1 (right part of Figure 5). The values are gathered in Table 3. They are slightly lower than for the Ti–free equimolar CoNiFeCr alloy previously evocated [7].
The downward displacement of the central point during the flexural isothermal creep test is plotted versus time in the left graph in Figure 6. The deformation was rather fast (maximum of 20 µm h-1) during the first hours of the isothermal creep phase. It slowed down to reach only about 2 µm h-1 (right graph in Figure 6). When it was decided to interrupt the test after 200 hours (to allow other users to take benefit from the apparatus) the deformation was very slow and the total deformation was only of 325 µm. Table 4 gathered these results. The Ti–free equimolar CoNiFeCr alloy deformed much rapidly (almost 700 µm after 140h) [8].
3.3. Oxidation Behavior at High Temperature: Kinetic
The mass gain curve obtained at 1200 °C with the thermo-balance is plotted versus time in Figure 7 (left) and versus the square root of time (right). Obviously, after a mass gain mixing a linear part and a parabolic one during the three first hours of the isothermal stage (better seen in the beginning of the curve plotted versus the square root of time 83), the mass gain regime became purely parabolic. This is confirmed by the straight line in the right graph of Figure 7. This evidences that a continuous oxide scale isolated the alloy from the oxidizing atmosphere, leading to a kinetic obeying the Wagner’s law. The slope of the straight line allows estimating the parabolic constant: Kp ≅ 86 × 10-12 g2 cm-4 s-1. This more than three times higher than for the Ti–free equimolar CoNiFeCr alloy [9].
In fact, oxidation and thus mass gain started, not at the beginning of the isothermal stage, but during the heating. The graph presented in Figure 8, plotted after having corrected mass gain from the air buoyancy variations due to heating (Archimede’s pressure), shows that mass gain started to be detectable at about 810 °C for the +20K min-1 heating rate (one hundred °C lower than for the CoNiFeCr alloy) [9]. After the end of the isothermal stage mass gain went on a little before slowing down (high temperature part of cooling) before almost stopping. Cooling induced more and more intense compression stress in the external oxide scale because of the alloy contraction at 15 ≅ 10-6 K-1 (Figure 5 right) against about half this value for the oxide. This finished by resulting in scale breaking and oxide parts losses, visualized by the irregular decrease in mass under about 710 °C (thirty °C below the CoNiFeCr alloy the oxide scale of which spalled off much more) [9]. All quantitative results are presented in Table 5.
3.4. Oxidation Behavior at High Temperature: Oxidation Products
The scale spallation described just above was rather limited, as suggested by the rather low mass loss per surface unit area (less than 2 mg cm-2) and by the photograph of the oxide sample (Figure 9 left) which also presents two SEM micrographs taken in secondary electron mode (SE) to better see the outermost morphology (Figure 9 center and right). XRD was performed on the oxidized surface. A diffractogram is shown in Figure 10. It is hard to attribute with certitude the peaks to particular oxides since the same peaks can correspond to different oxides (e.g., Fe3O4, CoFe2O4, CoCrFeO4). Fe2O3 can be excluded and the other oxides which appear to be present are compound involving titanium (NiTiO3 and TiO2).
EDS elemental maps were also performed on the outermost side of the oxide scale (Figure 11). It seems that the concerned area is composed of mainly chromia (top left part) and of an oxide of both Fe and Ti.
After cross–sectional preparation one can better distinguish the oxidation product with the SEM in BSE mode (Figure 12). Over the alloy there is a continuous oxide scale made of an outermost thin scale containing two types of areas with two different gray levels, and of a thick oxide beneath. Internal oxidation also occurred, as evidenced by the presence of black oxides dispersed in a 50 µm depth under the scale/alloy interface. EDS elemental mapping shows qualitatively that the thick oxide scale is chromia and the thin outermost oxide is composed of titanium oxide and of a mixed oxide mixing Ti, Fe and seemingly also Cr, Co and Ni (Figure 13). This was confirmed quantitatively by EDS spot analyses. The internal particles are not oxides in fact, but titanium nitrides.
According to the concentration profiles acquired in subsurface perpendicularly to the oxide scale/alloy interface (Figure 14), one can see that chromium and titanium both diffused in the direction of the oxidation front.
4. Discussion
Thus, adding Ti in the equimolar based did not change the FCC single–phased state of the equimolar quaternary CoNiFeCr alloy, even if some rare and very small black precipitates rich in Ti were seen with the SEM in BSE imaging mode. Taking into account that about a quarter of the titanium quantity initially introduced was lost during elaboration despite the inert atmosphere. However the refractoriness of the alloy was significantly decreased by the presence of the 1.5 wt.% Ti, with as consequence a possible decrease in maximal service temperature for mechanical reasons (creep). In fact, as earlier observed, for instance, for FeNi–based [10] and Ni–based [11,12] superalloys, the addition of Ti seems improving the creep–resistance of the CoNiFeCr alloy. It seems that Ti is rather efficient in solid solution strengthening. Unfortunately the presence of Ti seems inducing an acceleration of oxidation. This was previously observed in polycrystalline Ni–based superalloy [13] and found again here by comparison with the quaternary CoNiFeCr alloy (Ti: Kp three times higher). By comparison with the quaternary alloy again, with Ti the alloy becomes more reactive at heating and mass gain starts at lower temperature.
The post–mortem examination of the oxidized sample allows observing phenomena earlier seen, such as a thin layer of Ti rich oxide (rutile TiO2 [14,15]). It was also reported earlier that Ti diffused through the chromia scale to feed the grow of this outer thin Ti oxide [16,17]. This was observable here too with the gradient in Ti content in the subsurface.
It was observed here that the thin Ti–rich outer oxide scale was composed of a dark (seemingly TiO2) part and a pale one gathering all elements and more in contact with the thick chromia layer beneath. It is possible that, at the particularly high temperature of the oxidation test carried out here (1200 °C), TiO2 had partially reacted with chromia to give this intermediate pale oxide separating the dark titanium oxide and the dark chromia.
It was earlier suspected that this outer scale of titanium rich oxide, seemingly recovering continuously the outer side of chromia, protected chromia from re–oxidation into volatile CrO3 [15]. This seems to be effectively the case when one consider the linearity of the isothermal mass gain when plotted versus the square root of time. In addition, such a limitation or suppression of the volatilization of chromia at this so high temperature at which chromia volatilization should be intensive, may induce an accelerated mass gain but without accelerated damage of the alloy. In addition to this possible protection against volatilization, the thin outermost continuous scale prevent too intensive scale spallation when temperature decrease, as it was noted here by comparison with the Ti–free quaternary alloy.
5. Conclusions
The high temperature performances of the refractory equimolar CoNiFeCr alloy are globally enhanced by a moderate addition of titanium. Despite the decrease in refractoriness, special focus is to be done on the mechanical and chemical behaviors at high temperature of the Ti–doped version studied here. This still single–phased alloy presents properties which are consistently improved by Ti presence even in small quantity. It appears as a new basis from which more performing versions can be developed, by the introduction of particles of a second phase for further strengthening, notably. Before that, other contents in Ti need to be tested to identify an optimum one.
Author Contributions
Conceptualization, P.B.; methodology, P.B. and L.A.; software, P.B. and L.A.; validation, P.B., S.H., L.A. and C.R.; formal analysis, P.B. and S.H.; investigation, P.B. and S.H.; resources, L.A.; data curation, P.B.; writing—original draft preparation, P.B.; writing—review and editing, P.B.; visualization, P.B.; supervision, P.B.; project administration, P.B. All authors have read and agreed to the published version of the manuscript.” Please turn to the CRediT taxonomy for the term explanation. Authorship must be limited to those who have contributed substantially to the work reported.
Funding
This research received no external funding.
Conflicts of Interest
The authors declare no conflicts of interest.
References
- M.J. Donachie, S.J. M.J. Donachie, S.J. Donachie, Superalloys: a technical guide, 2002. [CrossRef]
- D.J. Young, High temperature oxidation and corrosion of metals, 2008. [CrossRef]
- Y. Fukui, R. Sasaki, F. Hataya, T. Kashimura. Effect of titanium, niobium and zirconium on creep rupture strength and ductility of cobalt base superalloys. Metall. Trans. A 1981, 12A, 1033–1039. [Google Scholar] [CrossRef]
- G. P. Wagner, G. Simkovich. The oxidation of cobalt-chromium-titanium alloys at 1000 °C. Oxid. Met. 1986, 26, 139–155. [Google Scholar] [CrossRef]
- M. Taylor, R. Ding, P. Mignanelli, M. Hardy. Oxidation behaviour of a developmental nickel-based alloy and the role of minor elements. Corros. Sci. 2022, 196, 110002. [Google Scholar] [CrossRef]
- T. D. Nguyen, J. Zhang, D. J. Young. Effects of Si, Al and Ti on corrosion of Ni-20Cr and Ni-30Cr alloys in Ar-20CO2 at 700 °C. Corros. Sci. 2018, 130, 161–176. [Google Scholar] [CrossRef]
- R. Chevalme, S. R. Chevalme, S. Hammi, Y. El Hadad, L. Amrouche, L. Aranda, P. Berthod. Refractoriness, thermal expansion behavior and microstructure stability at elevated temperature of an equimolar cast quaternary CoNiFeCr alloy and of two slightly modified versions. HAL, /: https, 4937. [Google Scholar]
- Y. El Hadad, L. Y. El Hadad, L. Amrouche, R. Chevalme, S. Hammi, L. Aranda, P. Berthod. As-cast microstructure, room temperature hardness and high temperature creep deformation of an equimolar quaternary CoNiFeCr alloy and of two slightly modified versions. HAL, /: https, 4937. [Google Scholar]
- S. Hammi, Y. S. Hammi, Y. El Hadad, L. Amrouche, R. Chevalme, L. Aranda, P. Berthod. Influence of the presence of Ti or Ta on the oxidation behavior at 1200 °C of cast MPEAs derived from an equimolar CoNiFeCr basis. TMS 2025 154th Annual Meeting & Exhibition Supplemental proceedings, Las Vegas, –27, 2025. 23 March.
- S. I. Baik, S. Y. Wang, P. K. Liaw, D. C. Dunand. Increasing the creep resistance of Fe-Ni-Al-Cr superalloys via Ti additions by optimizing the B2/L21 ratio in composite nanoprecipitates. Acta Mater. 2018, 157, 142–154. [Google Scholar] [CrossRef]
- P. Berthod, E. Kretz, F. Allègre, M. Ritouet, T. Schweitzer, L. Aranda. Oxidation and creep properties at 1200 °C of cast quaternary Ni-Cr-C-Ti alloys. Mater. Sci. Eng. A 2017, 699, 145–155. [Google Scholar] [CrossRef]
- G. Lemos, M. C. Fredel, F. Pyczak, U. Tetzlaff. Creep resistance improvement of a polycrystalline Ni-based superalloy via TiC particles reinforcement. Mater. Sci. Eng. A 2022, 854, 143821. [Google Scholar] [CrossRef]
- M. T. Lapington, D. J. Crudden, R. C. Reed, M. P. Moody, P. A. J. Bagot. Characterization of oxidation mechanisms in a family of polycrystalline chromia-forming nickel-base superalloys. Acta Mater. 2021, 206, 116626. [Google Scholar] [CrossRef]
- S. Cruchley, H. E. Evans, M. P. Taylor, M. C. Hardy, S. Stekovic. Chromia layer growth on a Ni-based superalloy: Sub-parabolic kinetics and the role of titanium. Corros. Sci. 2013, 75, 58–66. [Google Scholar] [CrossRef]
- P. Berthod, F. P. Berthod, F. Allègre, E. Kretz. Influence of titanium on the high temperature oxidation and chromia volatilization of ternary Ni–Cr–C Alloys. Oxid. Met. [CrossRef]
- J. H. Chen, P. M. Rogers, J. A. Little. Oxidation behavior of several chromia-forming commercial nickel-base superalloys. Oxid. Met. 1997, 47, 381–410. [Google Scholar] [CrossRef]
- W. J. Nowak, B. Wierzba, J. Sieniawski. Effect of Ti and Ta on oxidation kinetic of chromia forming Ni-base superalloys in Ar-O2-based atmosphere. High Temp. Mater. Process. 2018, 37, 801–806. [Google Scholar] [CrossRef]
Figure 1.
The a–cast microstructure of the studied alloy.
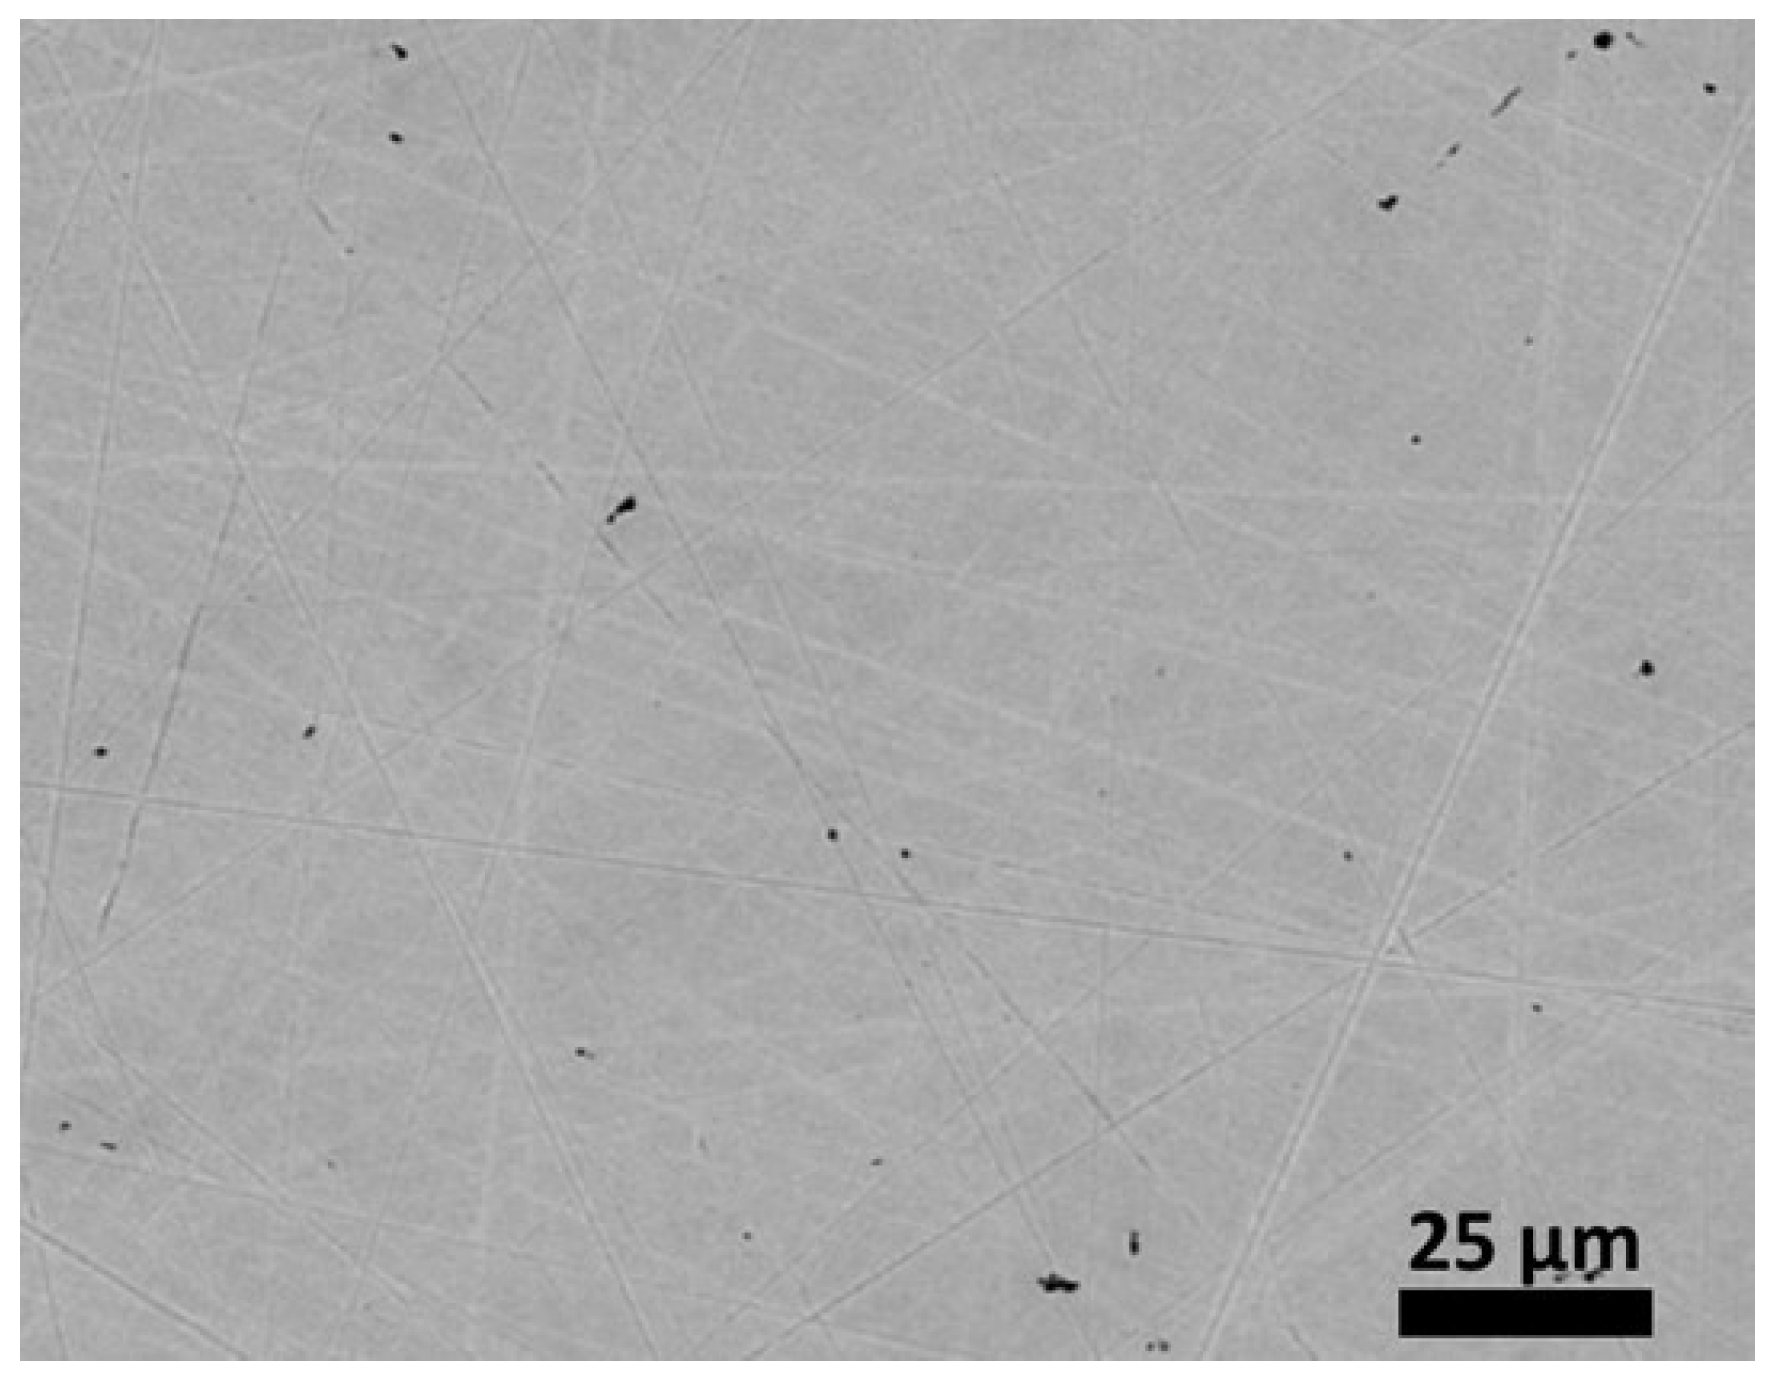
Figure 2.
The diffractogram acquired on the as–cast studied alloy.
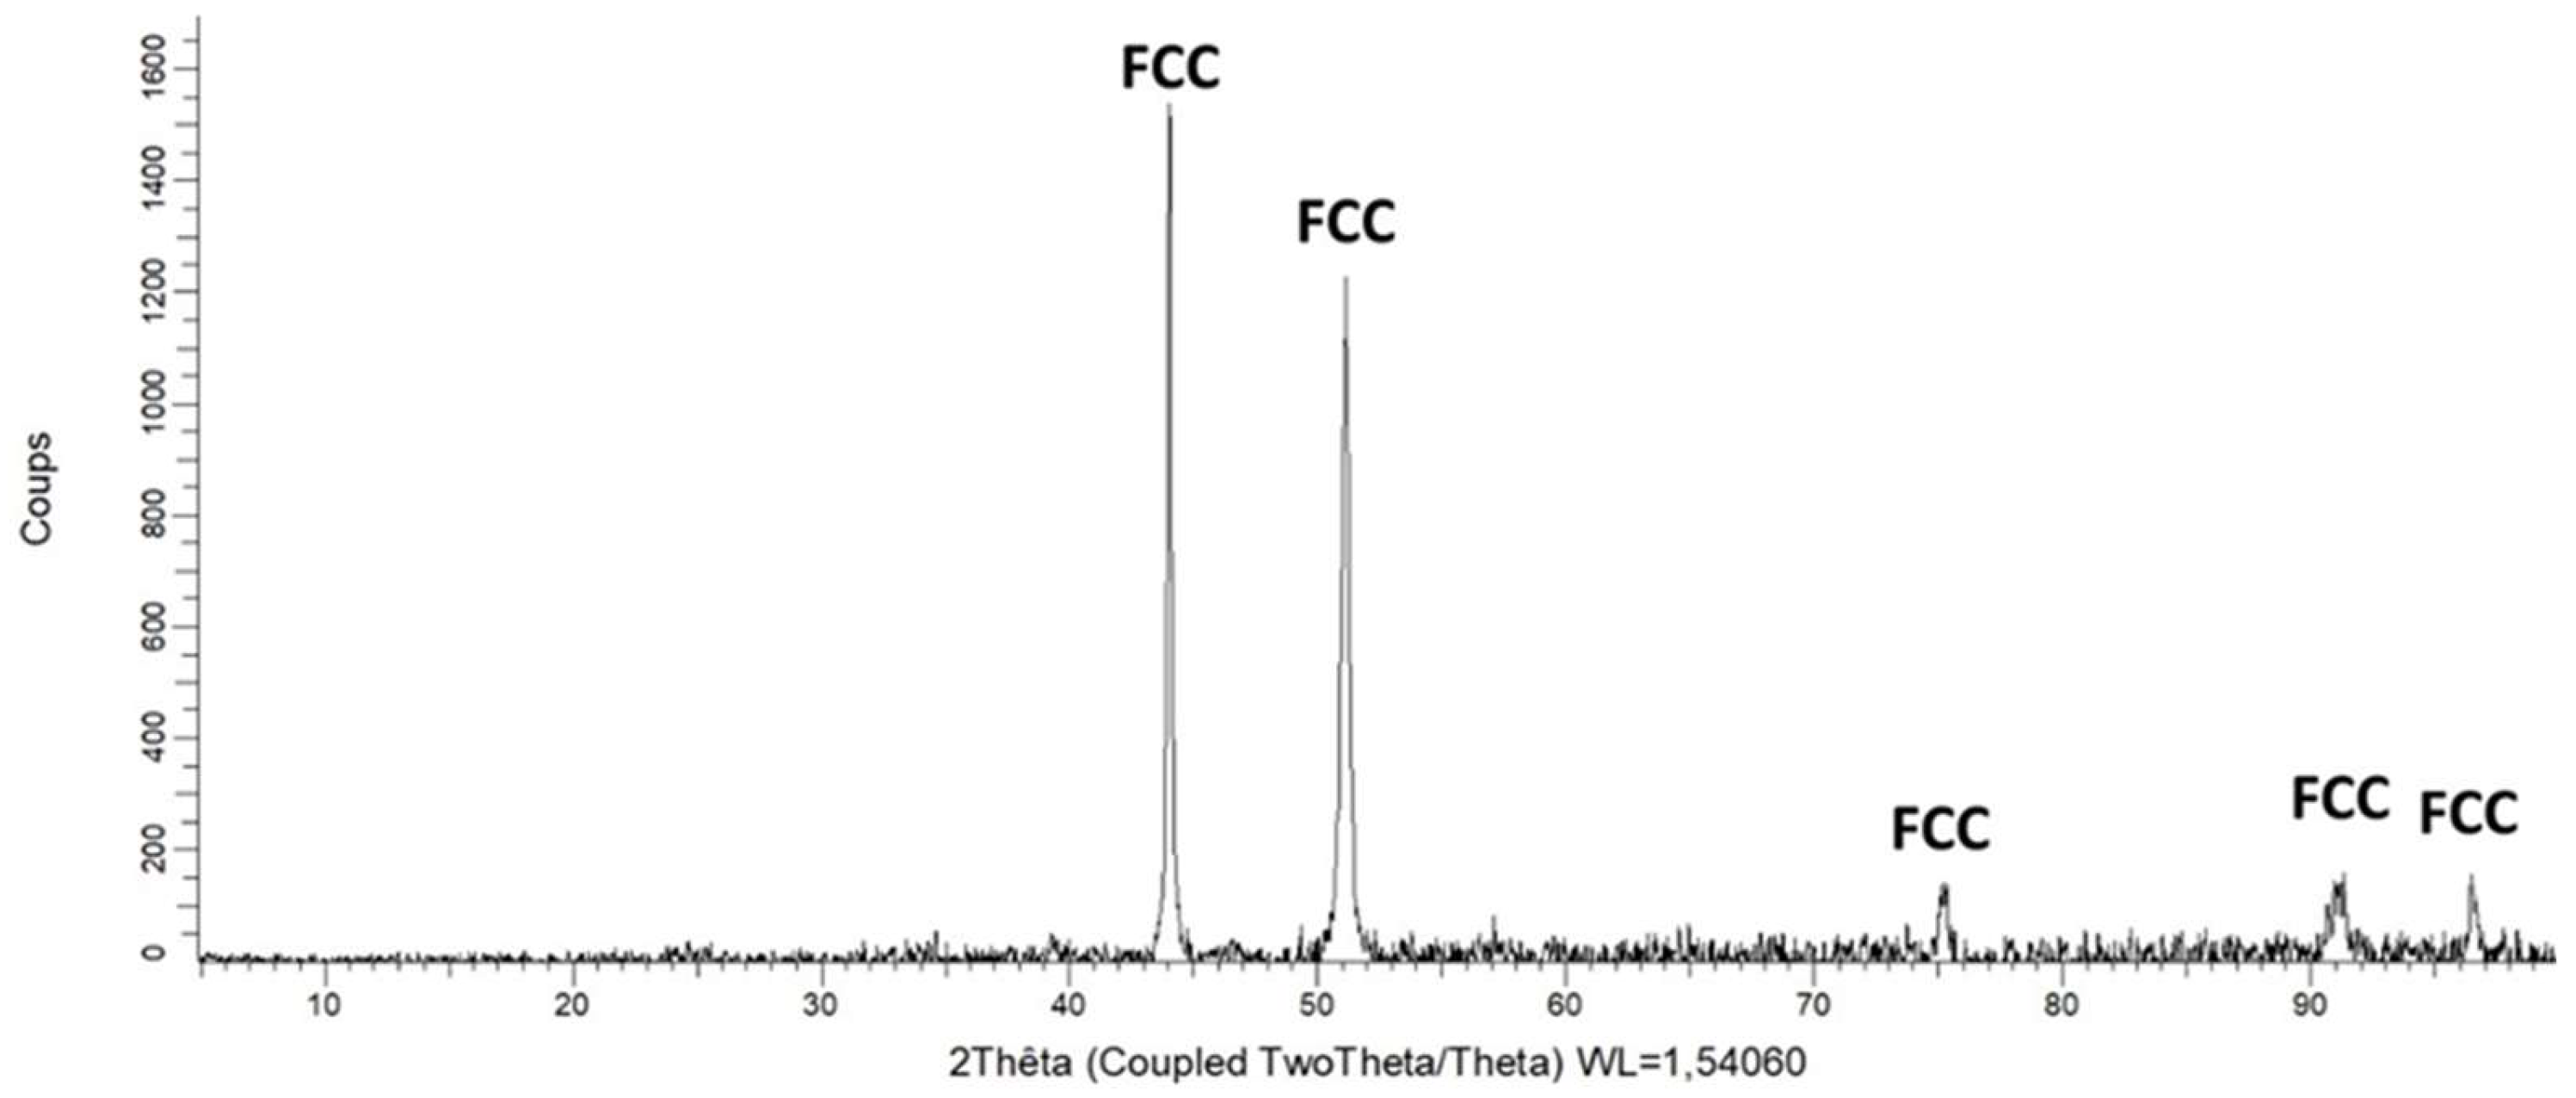
Figure 3.
EDS elemental mapping acquired on the as–cast alloy.
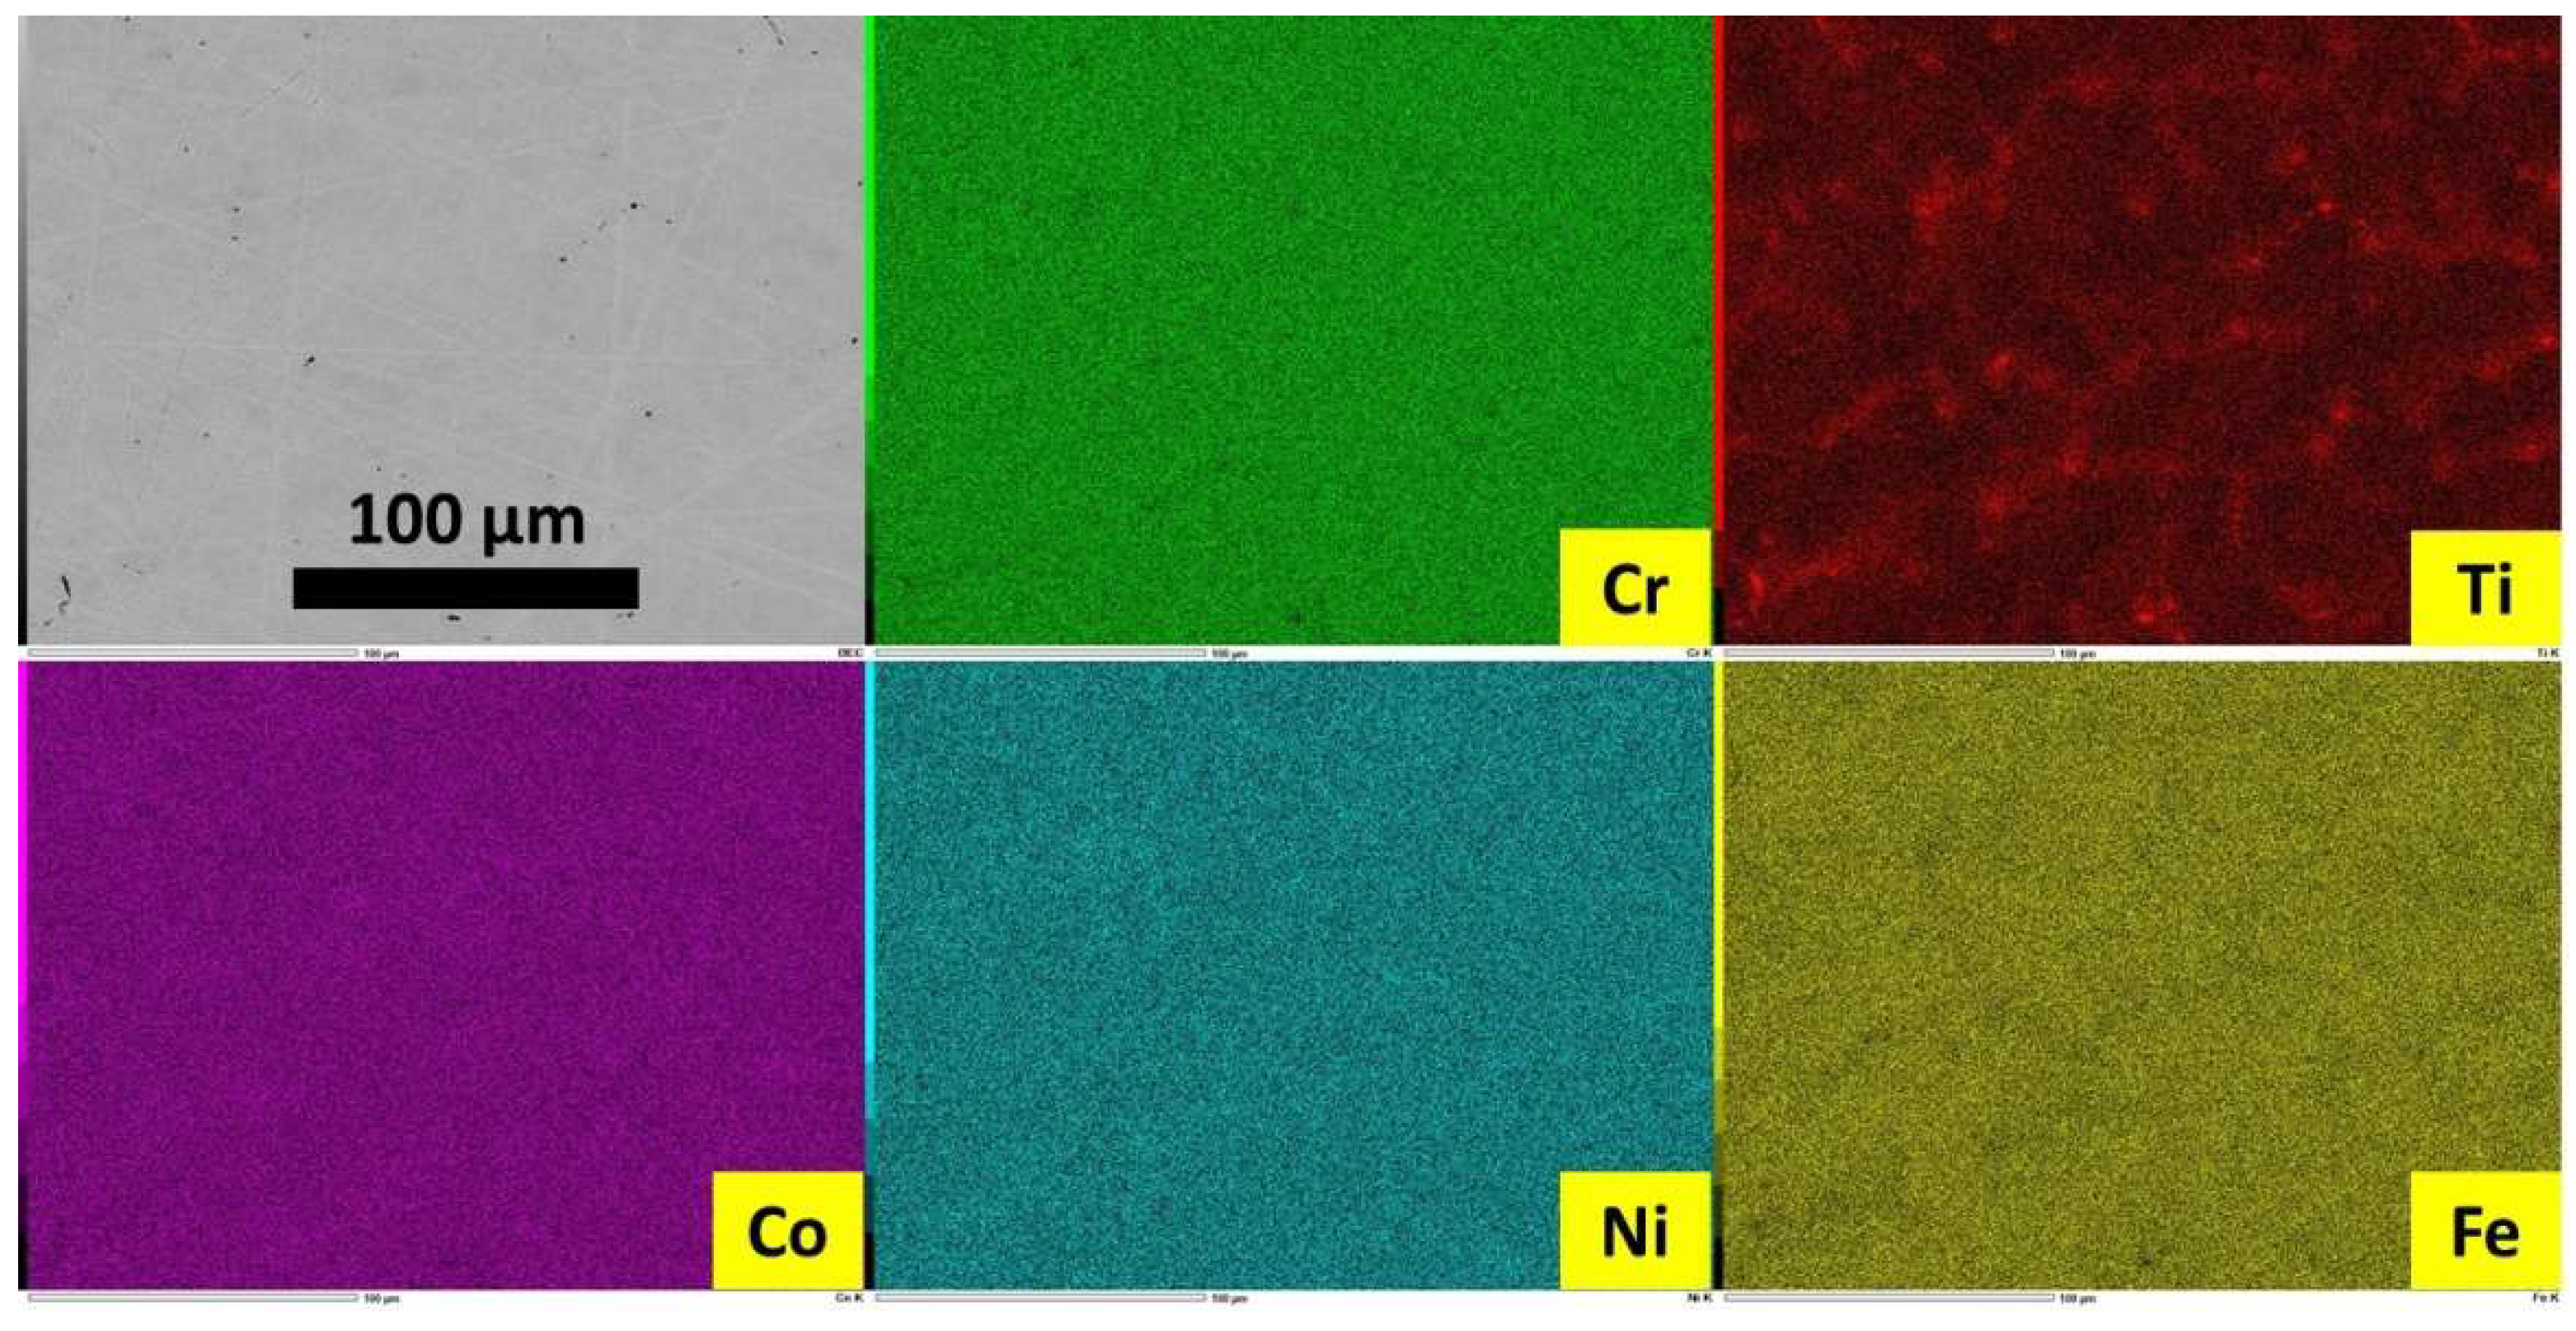
Figure 4.
Enlargement of the zones of interest of the DTA curve.
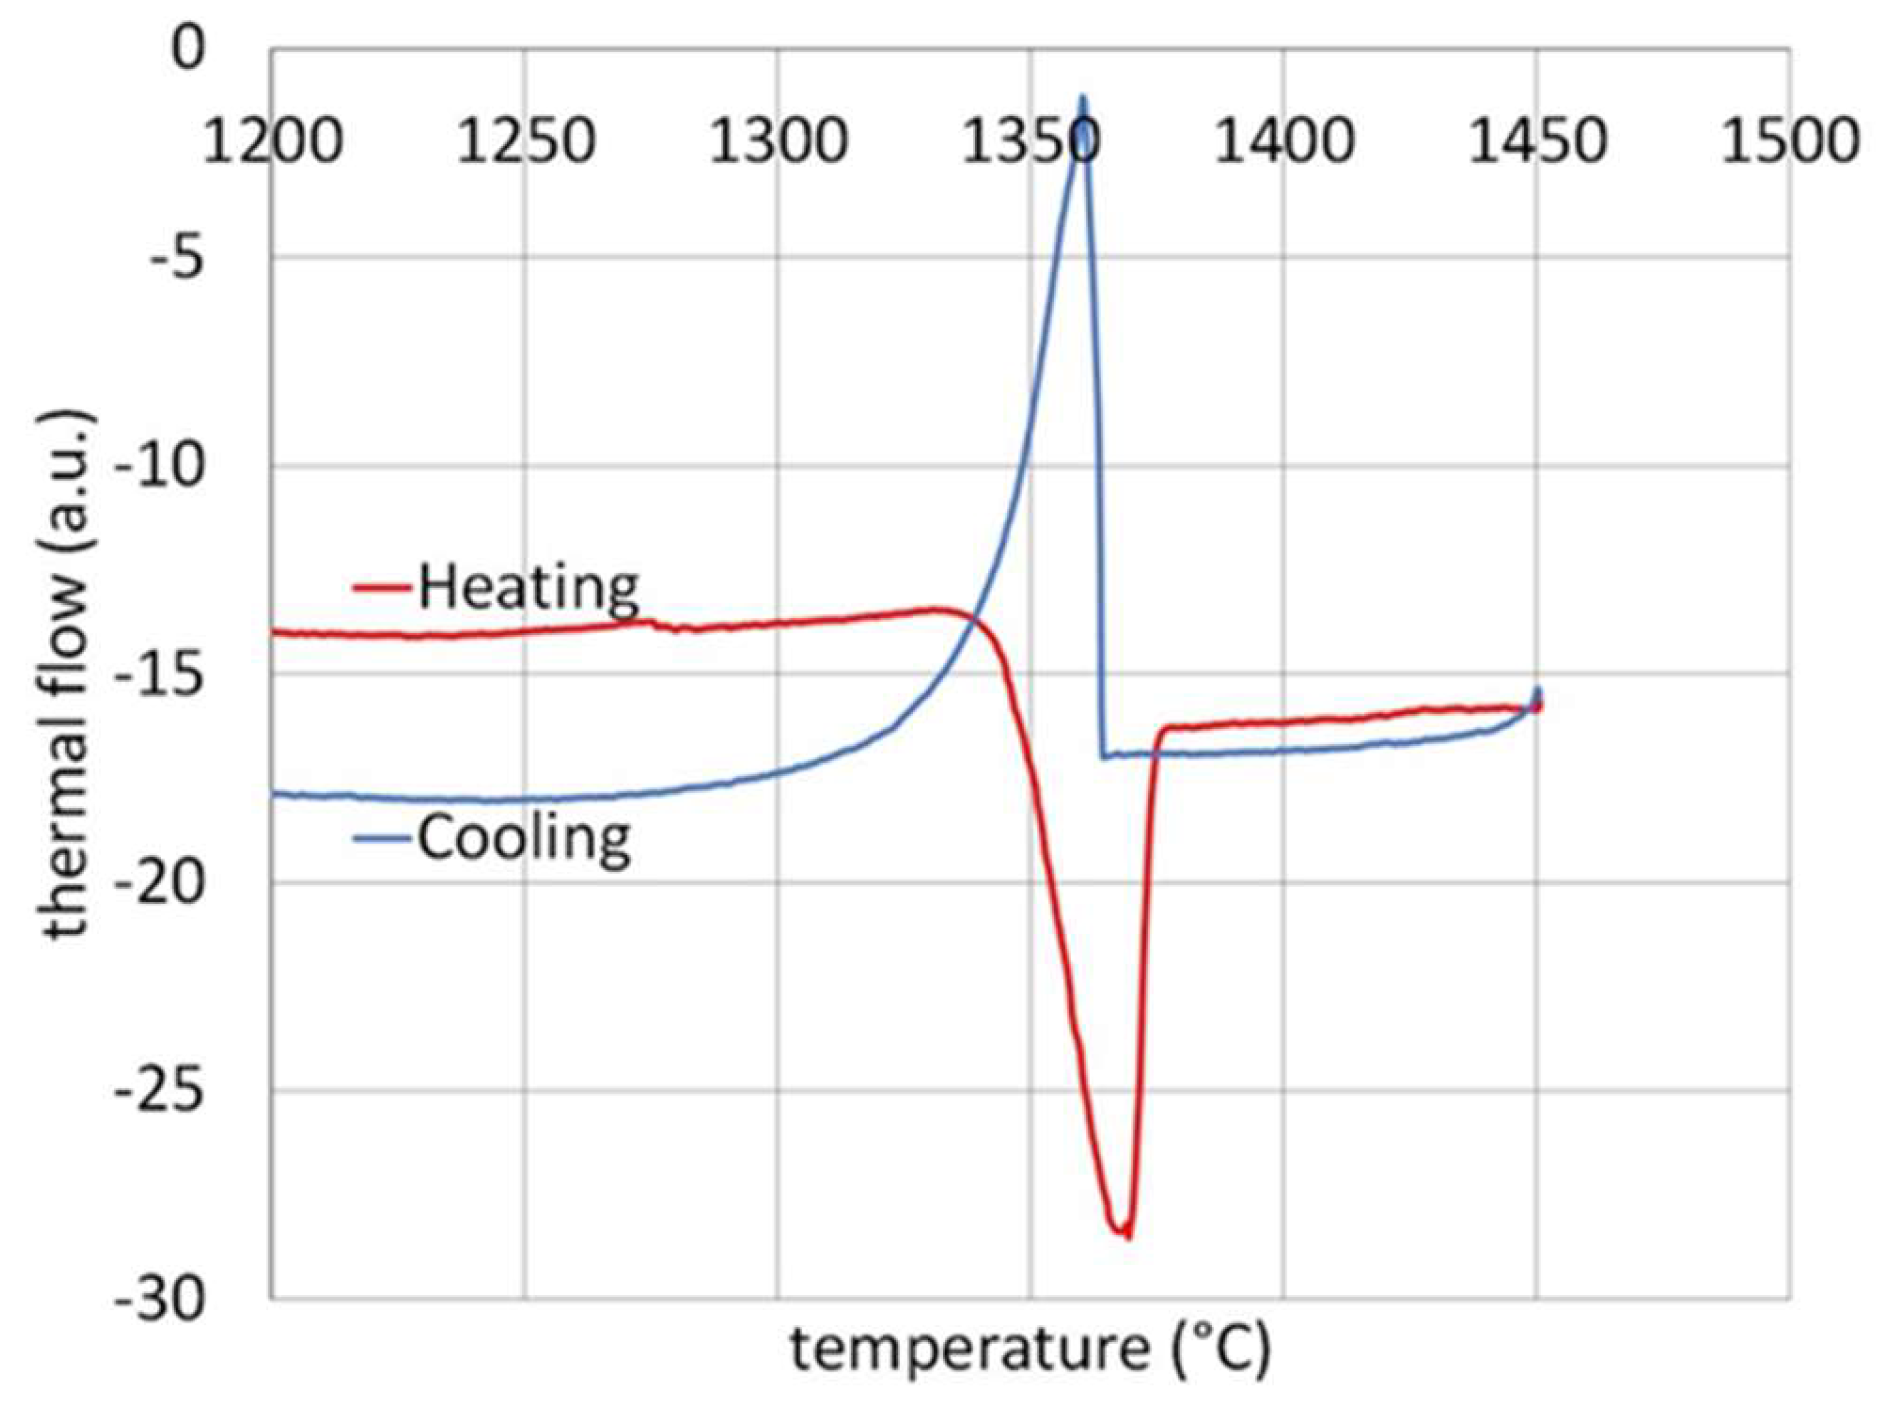
Figure 5.
Dimensional deformation during heating (left) and during cooling (right) observed during the thermo-dilatometry test.
Figure 5.
Dimensional deformation during heating (left) and during cooling (right) observed during the thermo-dilatometry test.
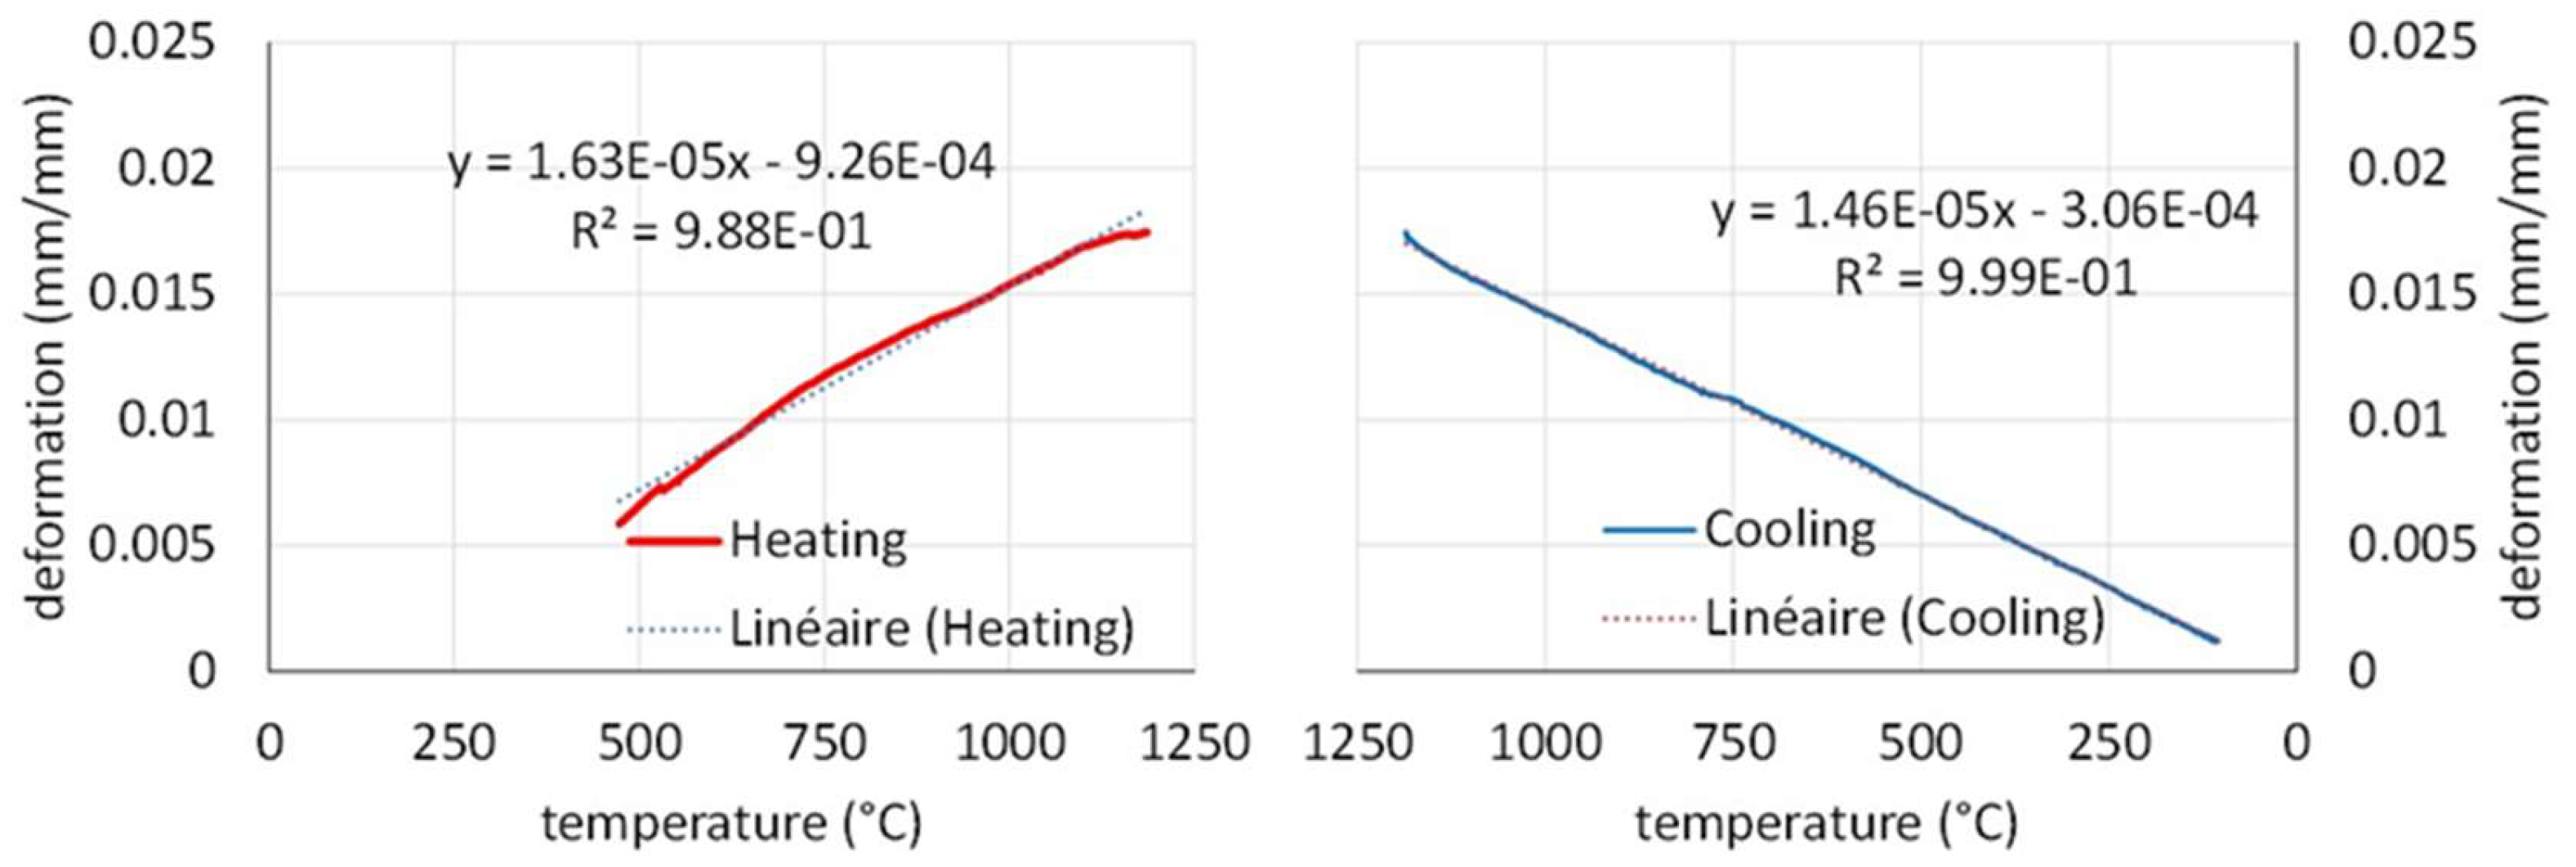
Figure 6.
Displacement of the upper central point (left) and its displacement rate (right) versus time during the flexural creep test at 1100 °C for 10 MPa.
Figure 6.
Displacement of the upper central point (left) and its displacement rate (right) versus time during the flexural creep test at 1100 °C for 10 MPa.
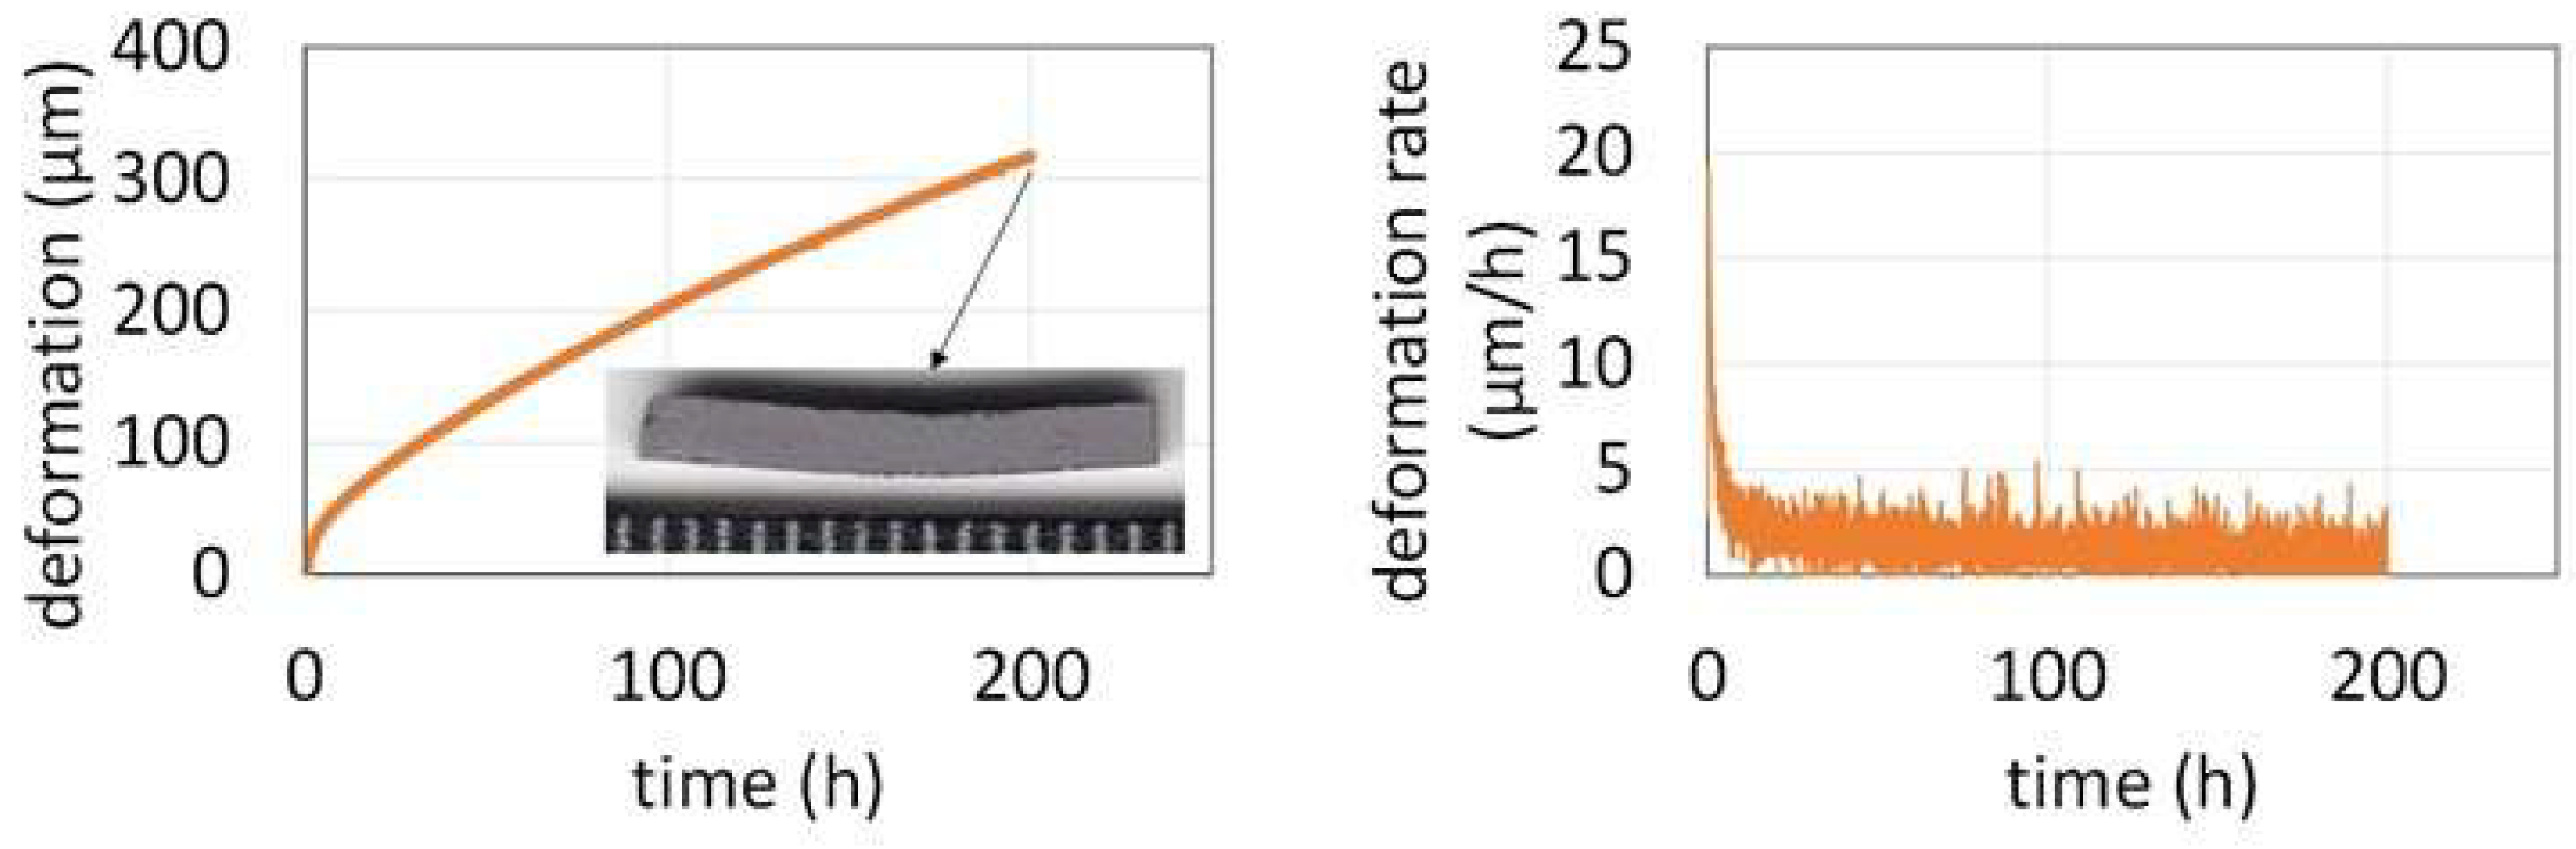
Figure 7.
Oxidation in synthetic air at 1200 °C: mass gain curve plotted versus time (left) and versus the square root of time (right).
Figure 7.
Oxidation in synthetic air at 1200 °C: mass gain curve plotted versus time (left) and versus the square root of time (right).
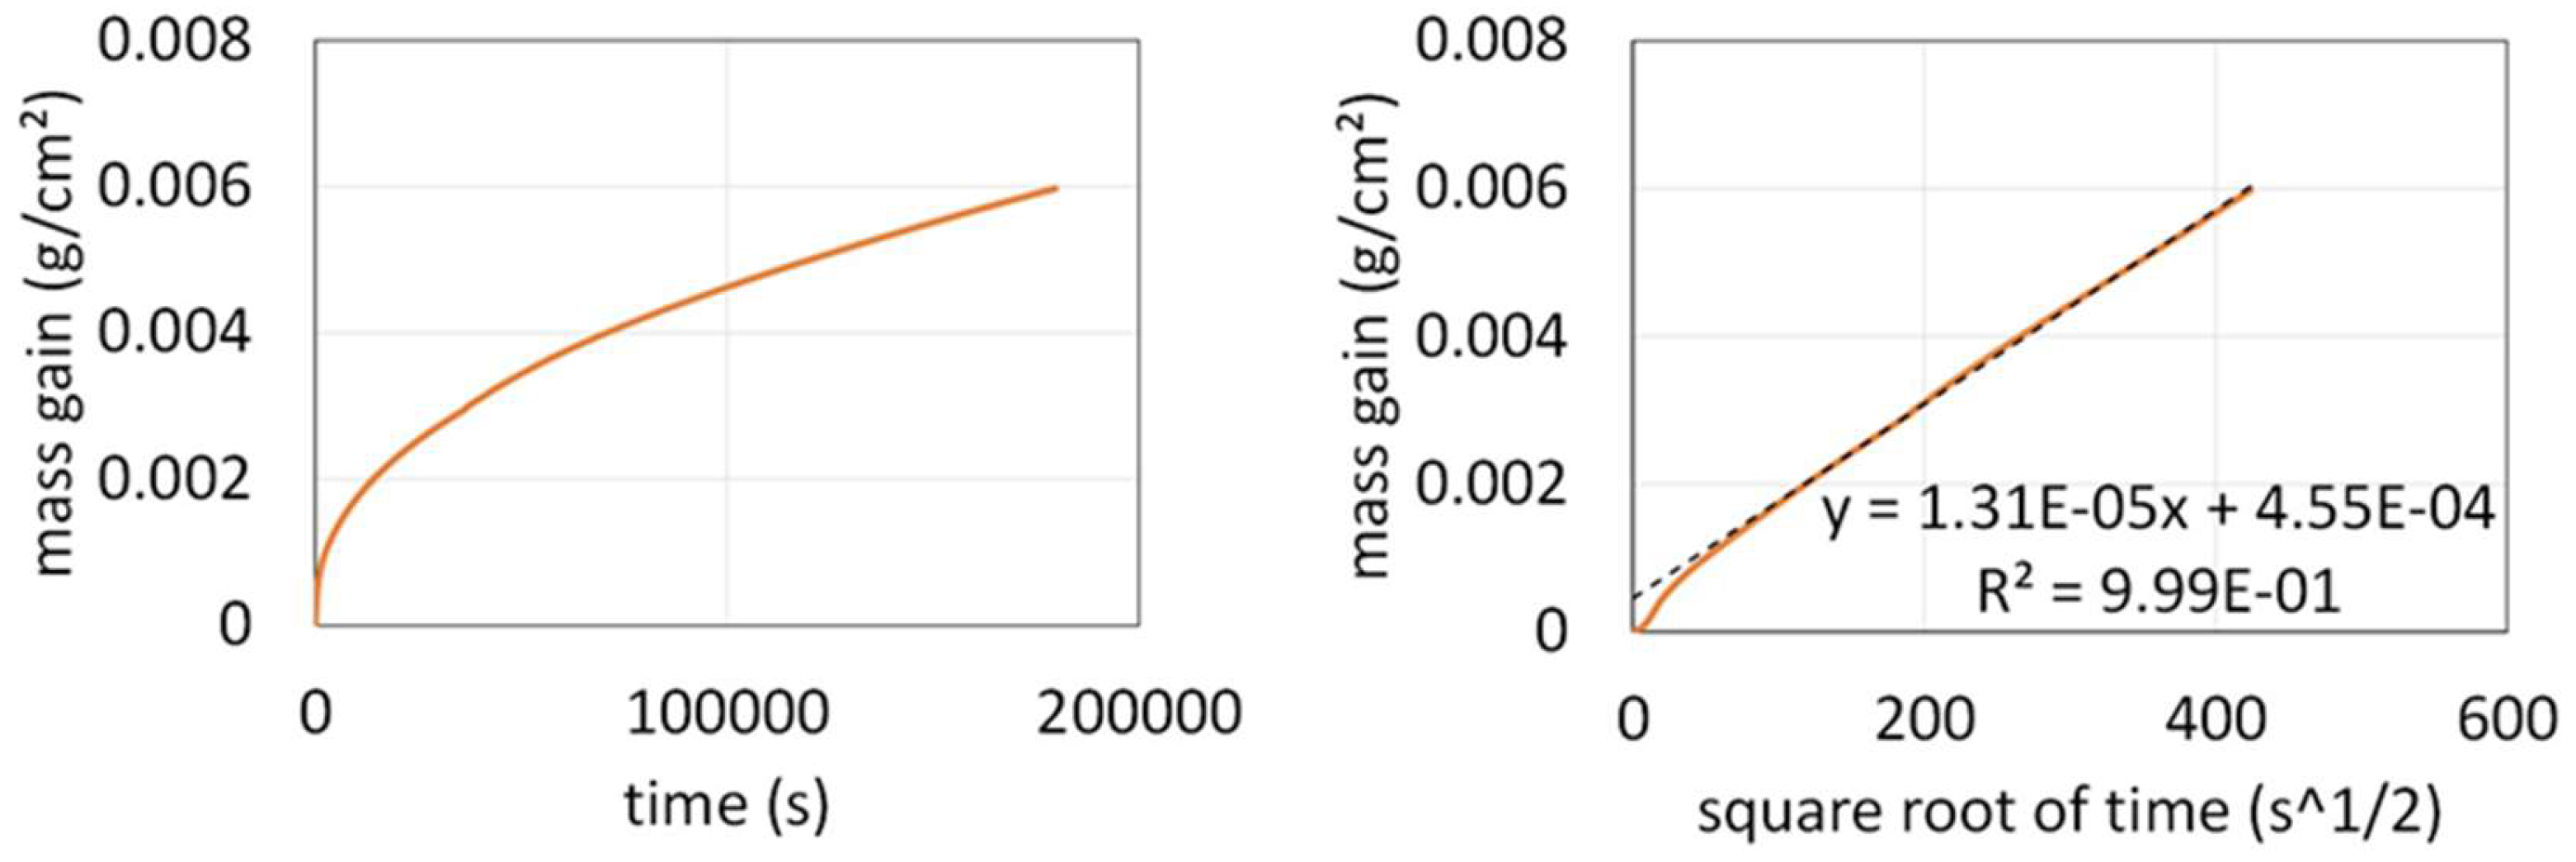
Figure 8.
Mass gain during the heating (left) and mass loss during the post isothermal cooling (right).
Figure 8.
Mass gain during the heating (left) and mass loss during the post isothermal cooling (right).
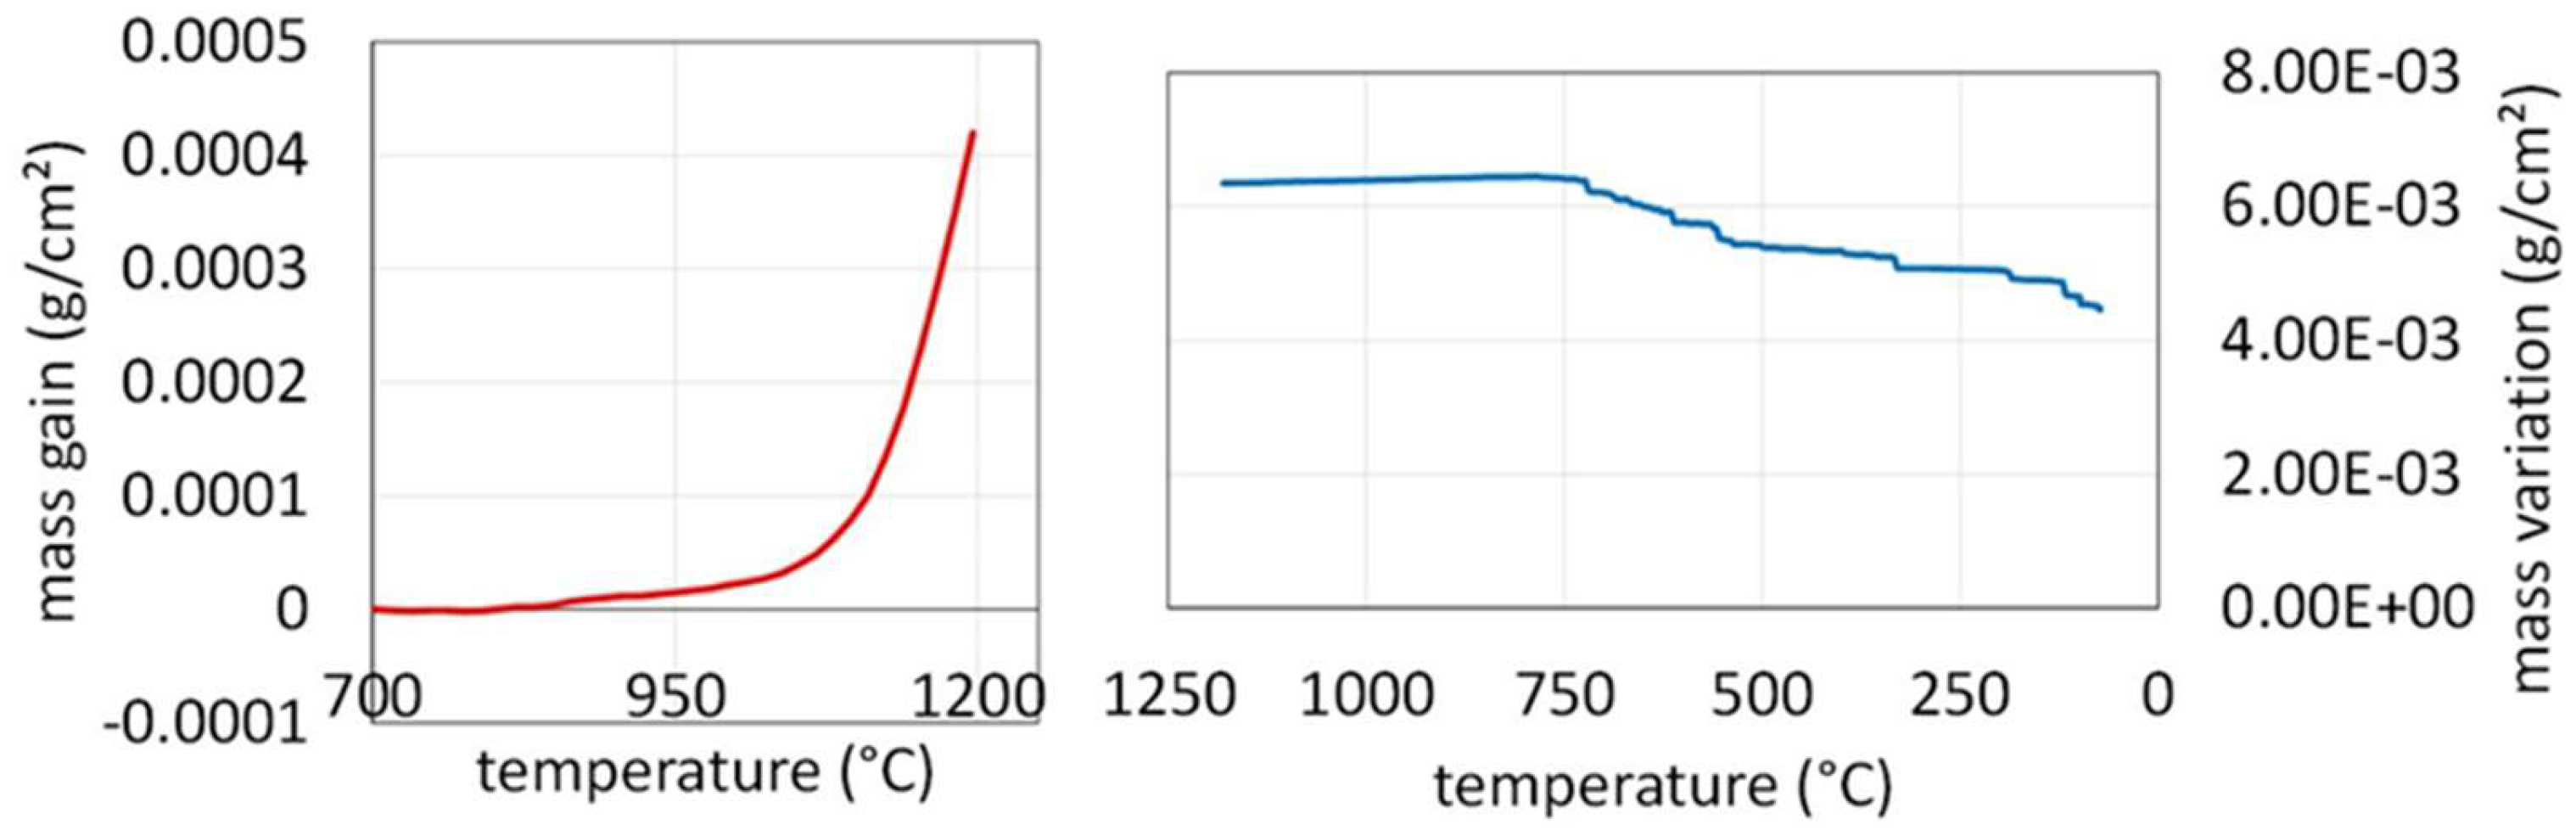
Figure 9.
General aspect of the oxidized sample (left) and SEM/SE micrographs taken on the outermost side of the oxide scale at two different magnifications (center and right).
Figure 9.
General aspect of the oxidized sample (left) and SEM/SE micrographs taken on the outermost side of the oxide scale at two different magnifications (center and right).
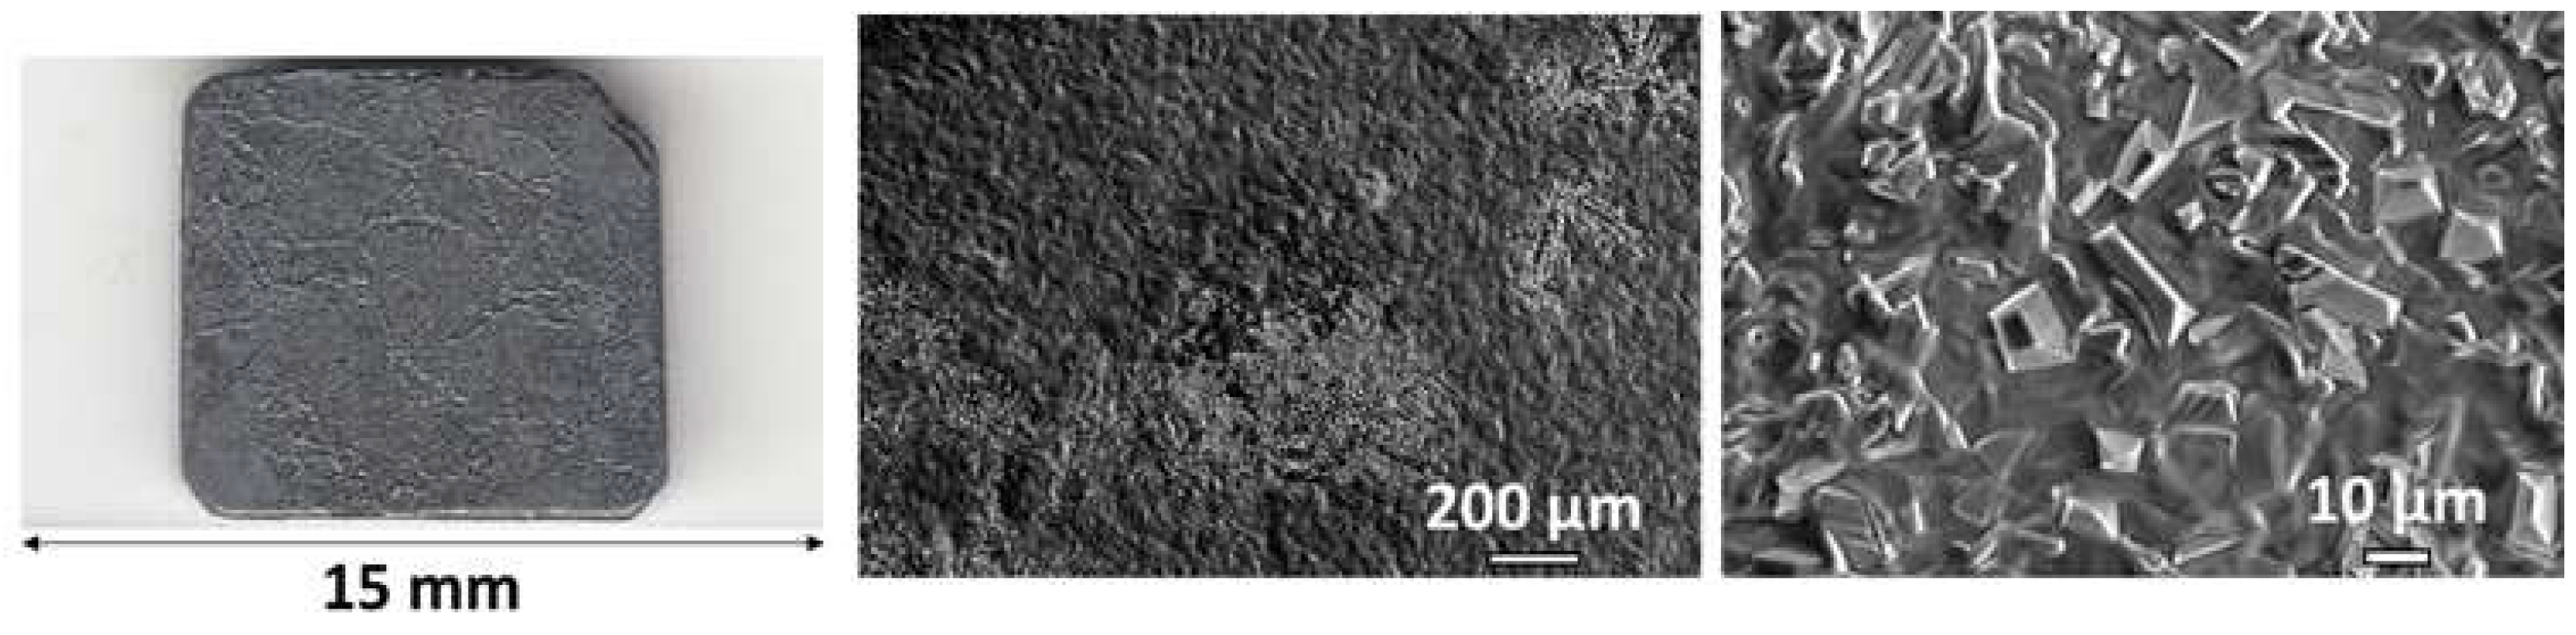
Figure 10.
Diffractogram acquired on the oxidized sample.
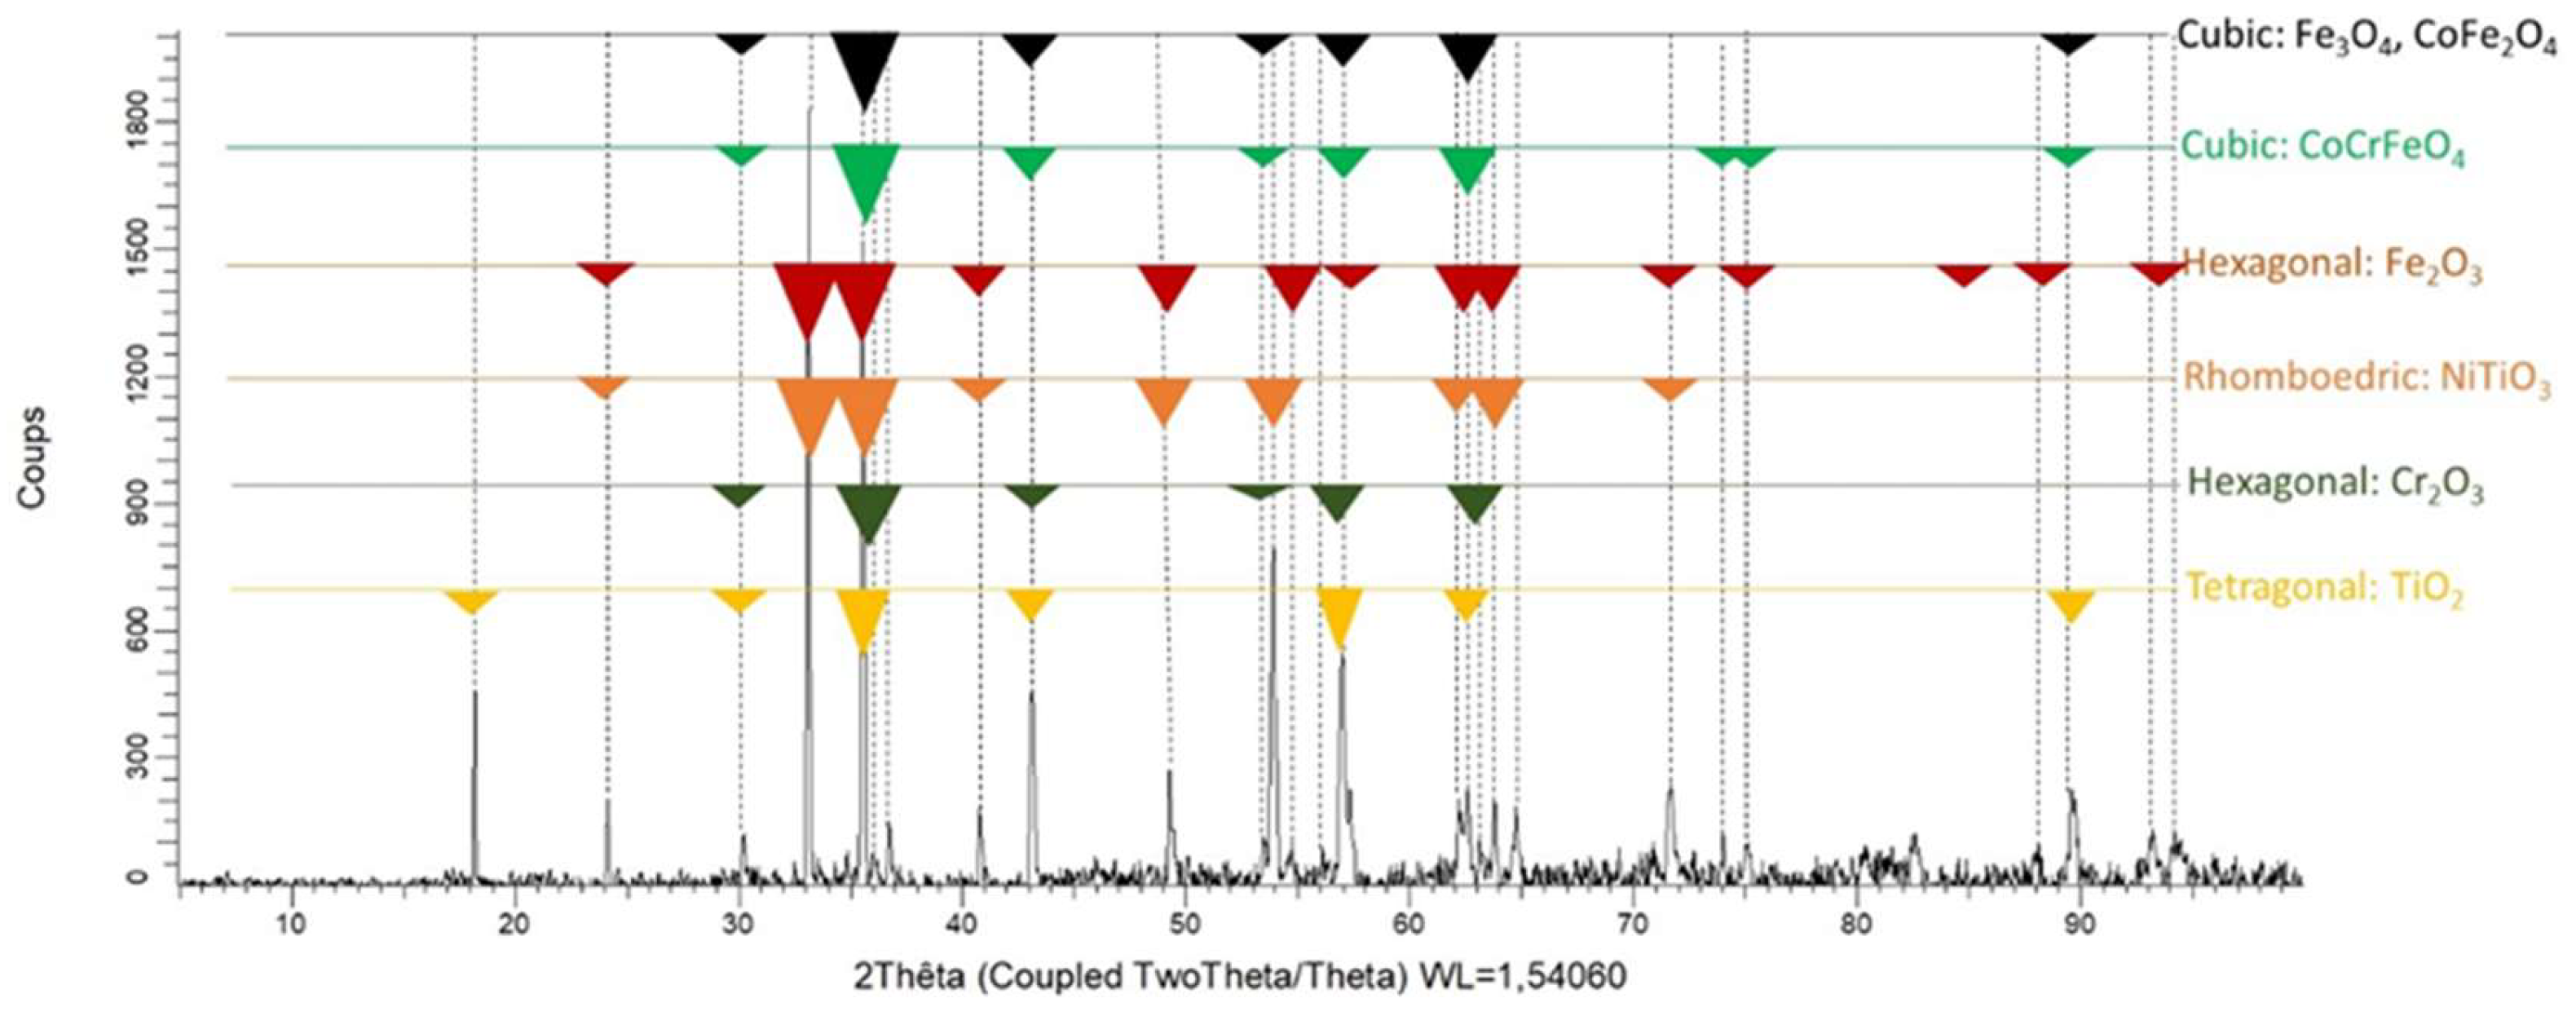
Figure 11.
EDS elemental mapping on the outermost side of the external scale.
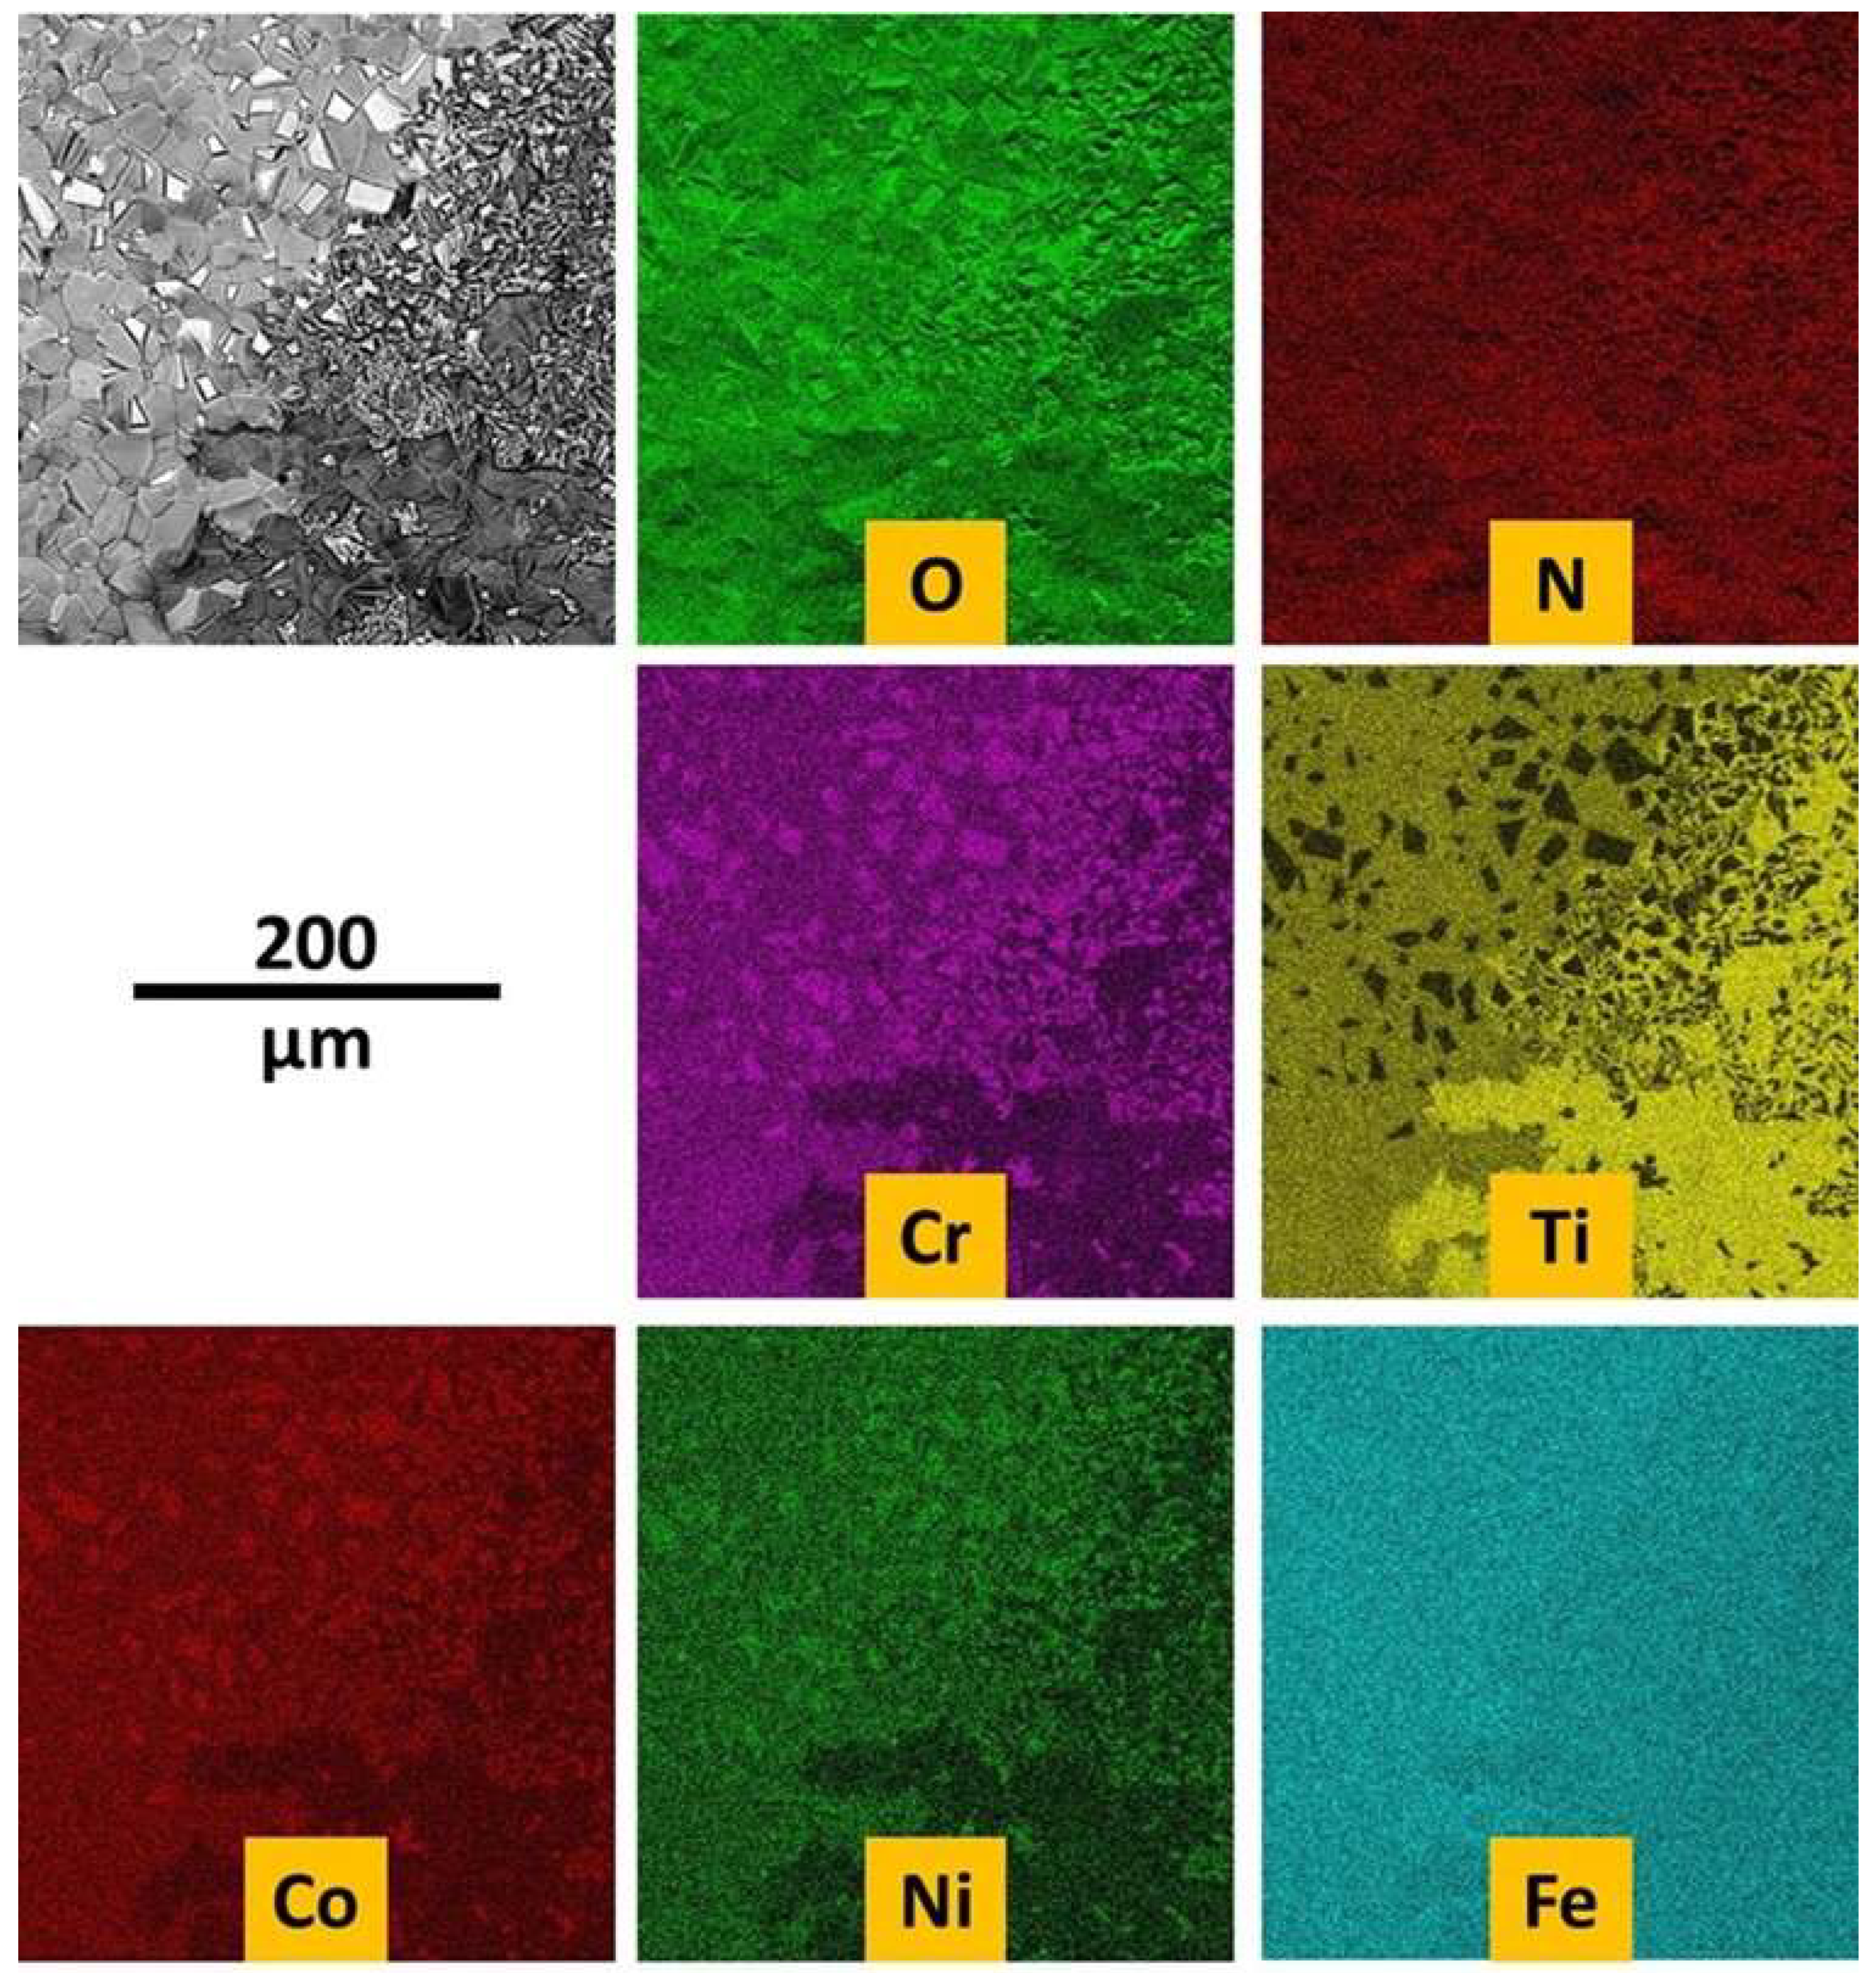
Figure 12.
General (left) and detailed (right) SEM/BSE micrographs taken on the external oxide scale and on the subsurface affected by oxidation.
Figure 12.
General (left) and detailed (right) SEM/BSE micrographs taken on the external oxide scale and on the subsurface affected by oxidation.
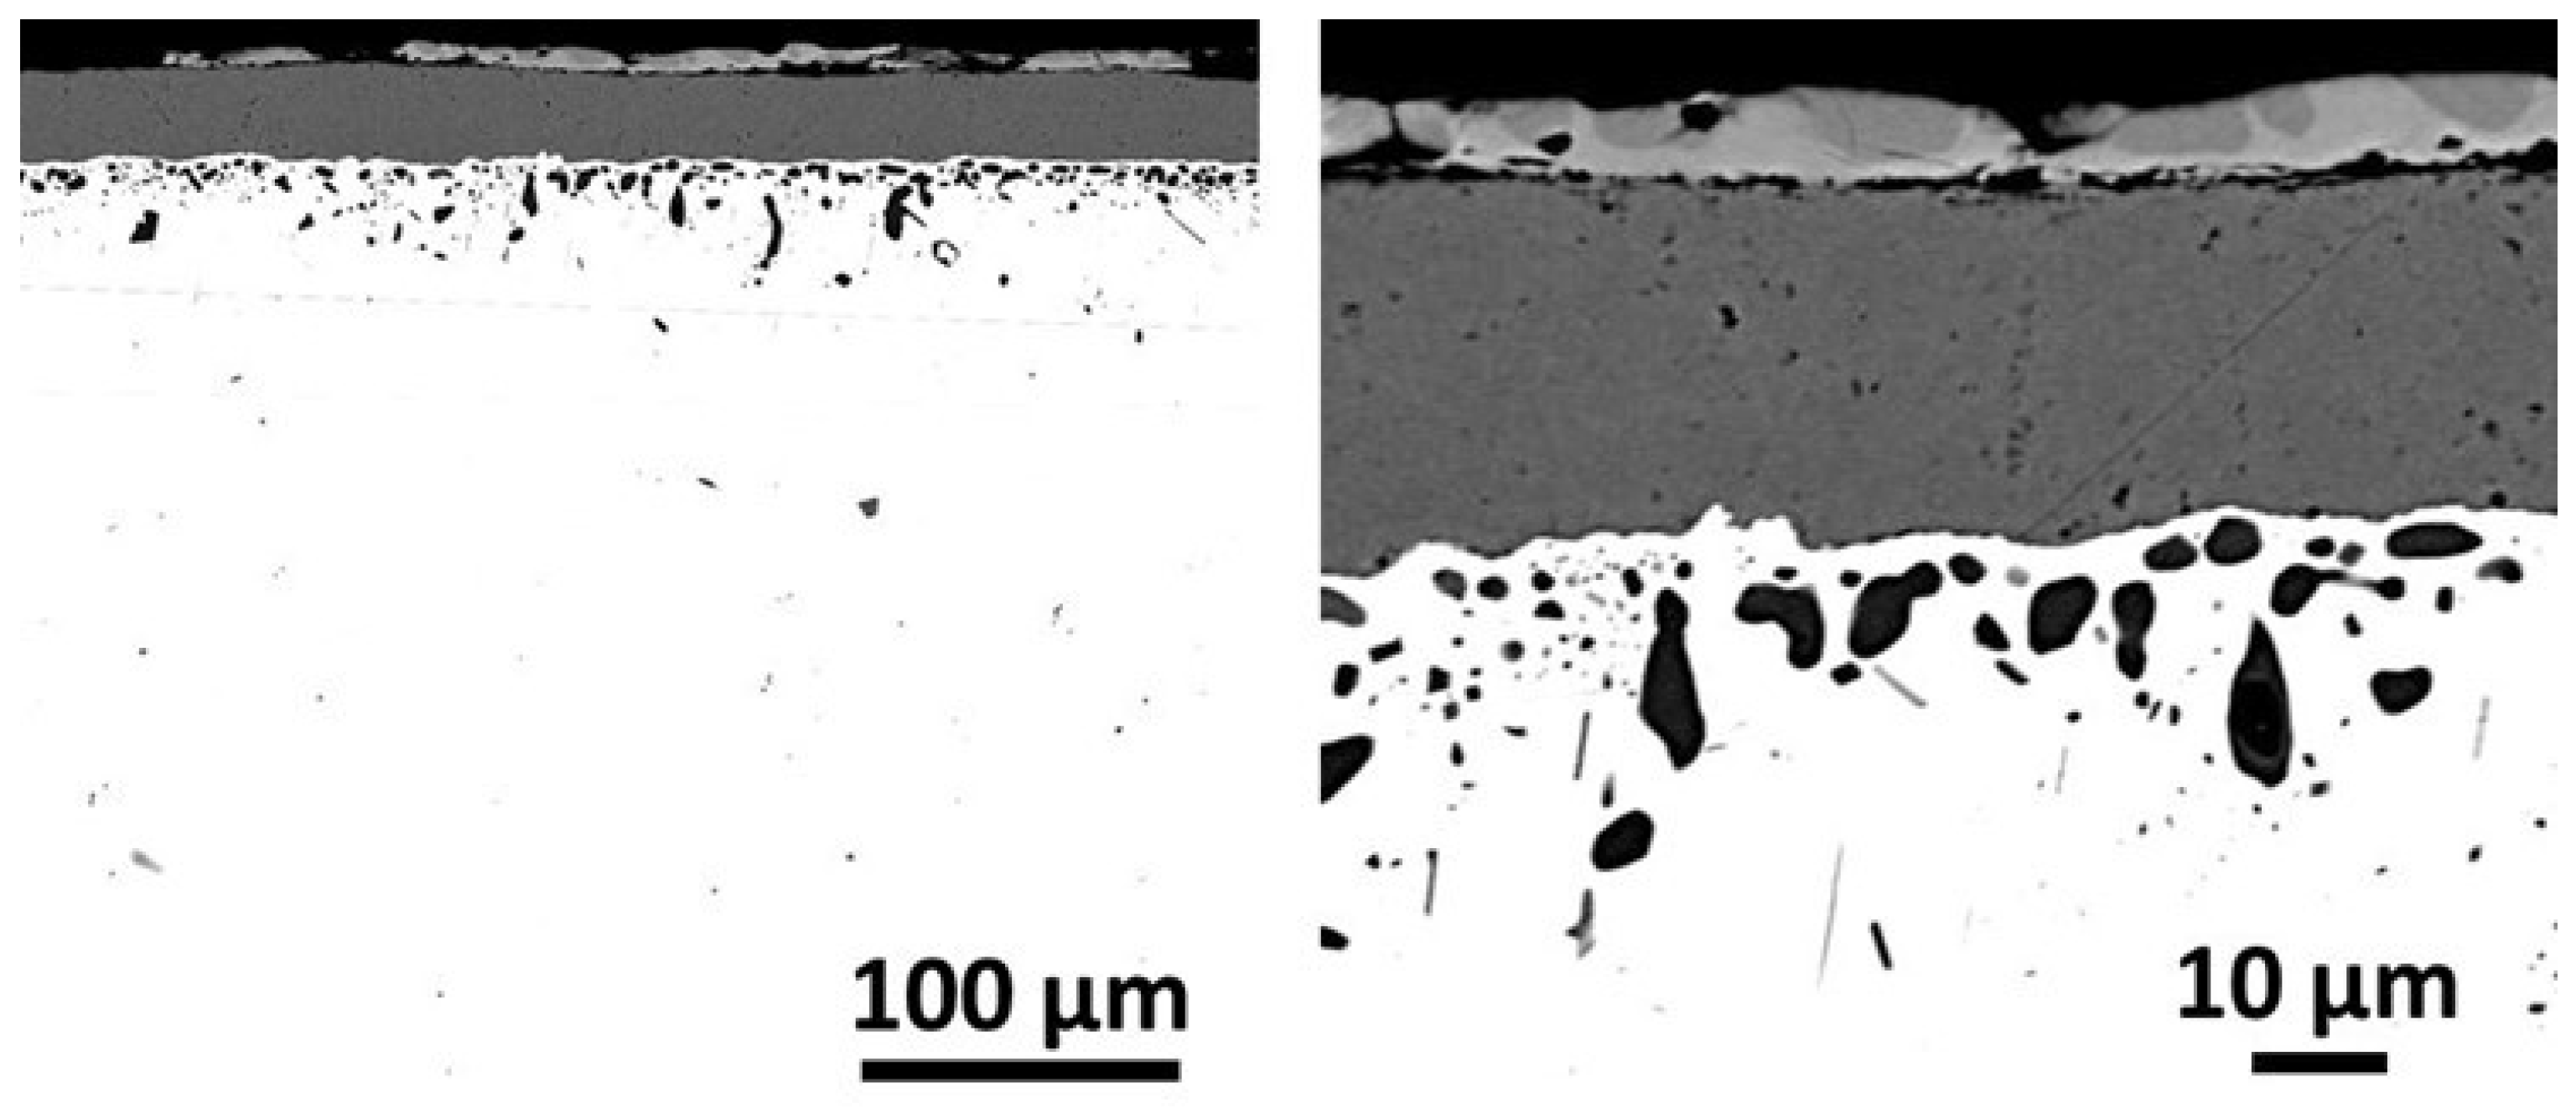
Figure 13.
EDS elemental mapping evidencing the elements involved in oxidation (and nitridation) externally and internally.
Figure 13.
EDS elemental mapping evidencing the elements involved in oxidation (and nitridation) externally and internally.
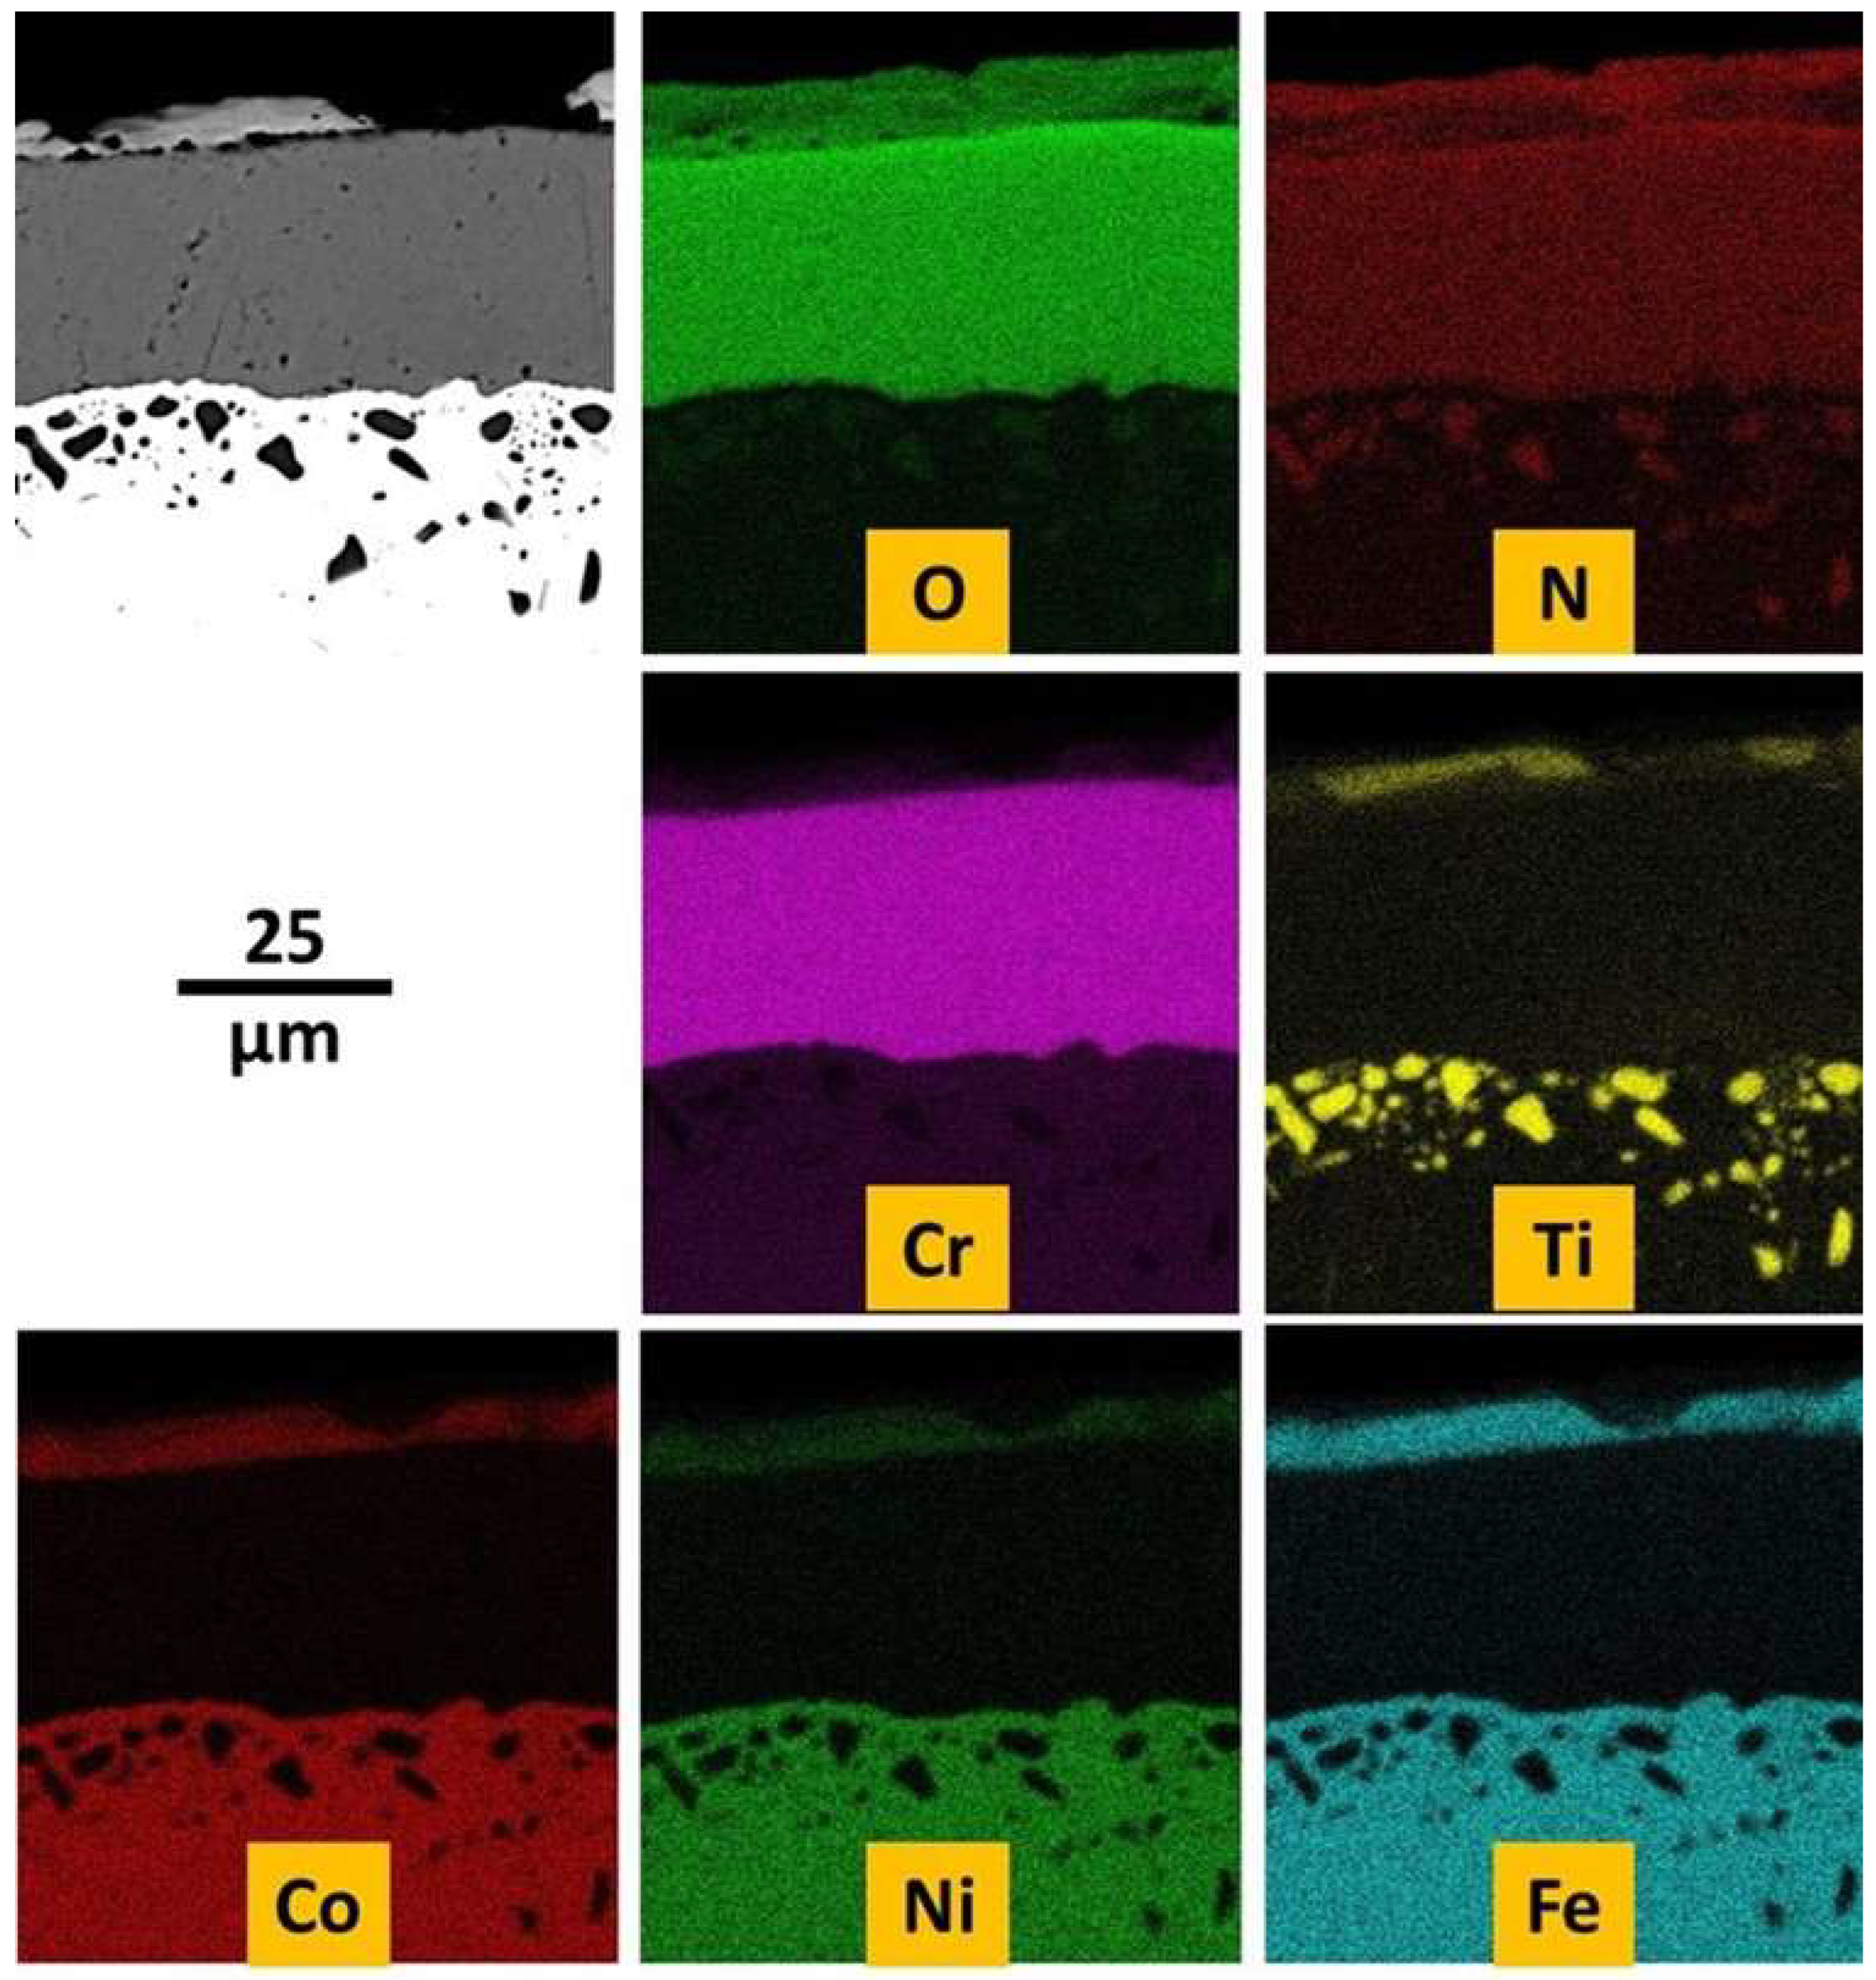
Figure 14.
EDS concentration profiles performed in the subsurface perpendicularly to the scale/alloy interface.
Figure 14.
EDS concentration profiles performed in the subsurface perpendicularly to the scale/alloy interface.
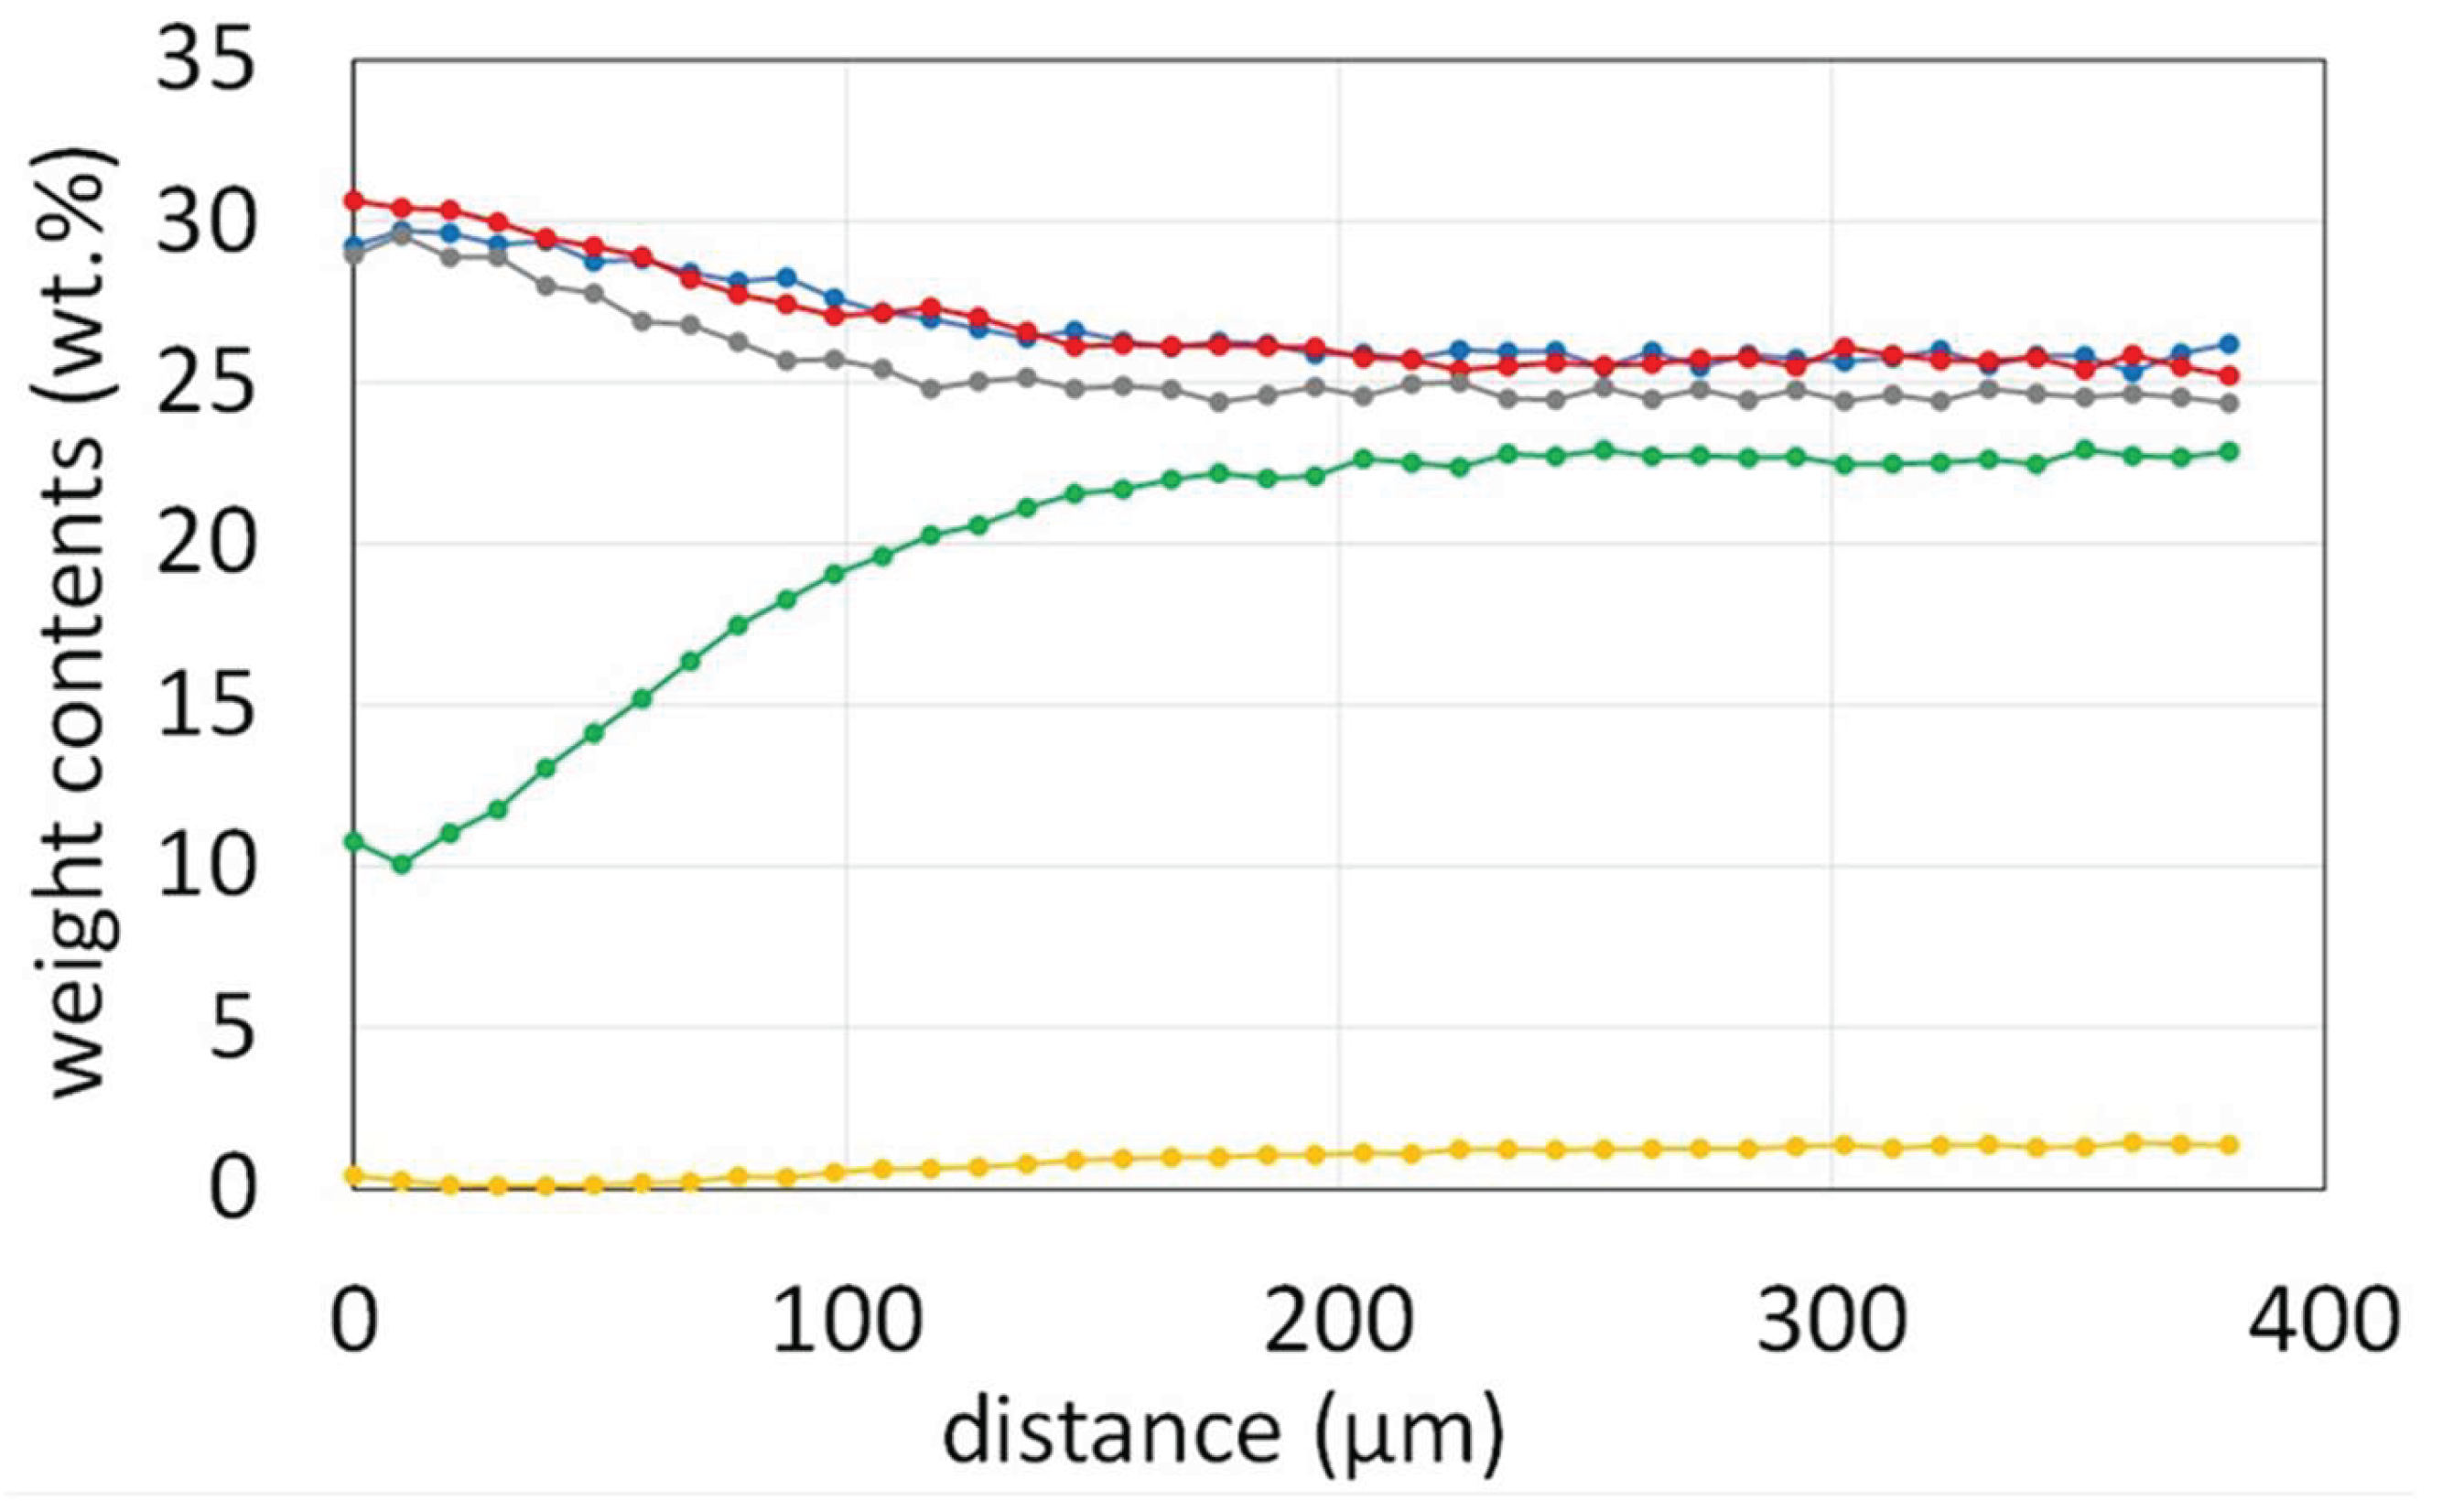

Table 1.
Chemical composition of the obtained alloy (average and standard deviation values from five ×250 full frame EDS analyses).
Table 1.
Chemical composition of the obtained alloy (average and standard deviation values from five ×250 full frame EDS analyses).
| Elements | Co | Ni | Fe | Cr | Ti |
|---|---|---|---|---|---|
| In wt.% | 25.7 ±0.2 | 25.7 ±0.2 | 24.5 ±0.2 | 22.6 ±0.1 | 1.5 ±0.1 |
| In at.% | 24.5 ±0.2 | 24.6 ±0.2 | 24.7 ±0.2 | 24.5 ±0.1 | 1.8 ±0.1 |
Table 2.
Characteristic temperatures resulting from DTA.
| Temperatures | Start | End |
| Heating (fusion) | 1277 °C | 1379 °C |
| Cooling (solidification) | 1248 °C | 1366 °C |
Table 3.
Coefficients of thermal expansion and of thermal contraction.
| Coefficients | Expansion | Contraction |
| (× 10-6 K-1) | 16.3 | 14.6 |
Table 4.
Creep deformation data.
| Three points centered flexural creep test at 1100 °C under 10 MPa | Stabilized deformation rate | Deformation after 200 hours |
| 1.0 µm h-1 | 316 µm |
Table 5.
Characteristic data for the three steps of the hot oxidation test.
| Characteristic | Heating | Isothermal stage | Cooling |
|---|---|---|---|
| Kp | / | 85.8 × 10⁻¹² g2 cm-4 s-1 | / |
| Tstart mass gain oxidation or Tstart oxide spallation |
806 °C | / |
706 °C |
| Mass gain or Mass loss |
+0.42 mg cm-2 | / |
-1.76 mg.cm-2 |
Disclaimer/Publisher’s Note: The statements, opinions and data contained in all publications are solely those of the individual author(s) and contributor(s) and not of MDPI and/or the editor(s). MDPI and/or the editor(s) disclaim responsibility for any injury to people or property resulting from any ideas, methods, instructions or products referred to in the content. |
© 2025 by the authors. Licensee MDPI, Basel, Switzerland. This article is an open access article distributed under the terms and conditions of the Creative Commons Attribution (CC BY) license (http://creativecommons.org/licenses/by/4.0/).
Copyright: This open access article is published under a Creative Commons CC BY 4.0 license, which permit the free download, distribution, and reuse, provided that the author and preprint are cited in any reuse.


