

Submitted:
29 September 2025
Posted:
30 September 2025
You are already at the latest version
Abstract
Given the pressing need to strengthen operational reliability in electrical distribution networks, this study proposes an optimization methodology based on the Teaching-Learning-Based Optimization (TLBO) algorithm for the strategic location of redundant lines. The model is validated on the “MV Distribution Network – Base Model” test system, considering the combination of the MTBF (Mean Time Between Failures) and MTTR (Mean Time To Repair) indicators as the objective function. After 500 independent runs, it is determined that the configuration with three redundant lines identified as LN_1011, LN_1058, and LN_0871 offers the most stable solution. Specifically, this topology increases the MTBF from 403.64 h to 409.42 h and reduces the MTTR from 2,351 h to 2,306 h. In addition, significant improvements are observed in the voltage profile and angle, a more balanced redistribution of active and reactive power, more efficient use of existing lines, and an overall reduction in energy losses.
Keywords:
Dynamic Voltage Restorer (DVR)
; voltage profile
; reactive power
; optimal location
; electrical power systems
1. Introduction
Increased downtime due to failures or unexpected events in distribution lines negatively impacts the reliability of the electrical system, resulting in financial losses and inconvenience to users. Therefore, a comprehensive strategy is required to ensure the reliability and continuity of the electrical supply, including the identification of alternative energy flow routes in the event of a failure [1,2].
The purpose of an electrical power system is to carry the generated and transformed load from the dispatch points to the end user, taking reliability into account and minimizing costs and losses in the electrical distribution system. The distribution system operates under conditions that affect both the end user and the system’s reliability. Generally, the topology of distribution networks is radial, extending from the substation to the end-user [3,4].
One of the most important activities in electrical power system planning is in the distribution stage, as it is expected to improve reliability and reduce losses as the system’s consumer base continues to grow [6]. The idea is to reduce costs to meet each of the investment and operational requirements. The optimal operating topology must be identified to enhance the system’s efficiency [6]. Improvements to the distribution network are associated with increased reliability, as measured by reduced outage times and fewer hours of outage experienced by the end user in a given year [5].
Its main objective is to provide continuity to electrical elements without affecting their performance and to select the most cost-effective technologies to meet the performance requirements of distribution systems, thereby satisfying end-user demands. In terms of efficiency and reliability, not only the system but also its components have been affected by distribution network topologies and the constant increase in demand [6]. There are numerous other benefits to improving the network, including maintaining its customer base, attracting new users, and avoiding penalties for poor reliability. For these reasons, companies responsible for distributing electrical energy strive to enhance the quality and reliability of their distribution feeders [7].
Reliability is primarily related to component failures, end-user interruptions, and repair times. These depend on the system’s response and component failures to predict the reliability of the electrical system. To achieve this, reliability indices are utilized to help us respond optimally in the shortest possible time when restoring the power supply [8]. A residential user experiences between 70 and 80 minutes of power outages per year, caused by failures in the distribution system to which they are connected. This is because most distribution systems are radial and the proximity of the system to the end user [9,10].
This document will analyze two indices based on repair times: MTBF and MTTR. MTBF quantifies the reliability of repairable equipment by dividing the total operating hours by the number of failures. This metric is used in this analysis because components are restored after each failure; in contrast, MTTF corresponds to irreparable units and is therefore inapplicable. Decreasing MTBF reduces the frequency of interruptions and improves the overall reliability of the system [11].
The mean time to repair is the time it takes to repair a system. It includes repair time and testing time. It is an indicator of the ease of maintenance or repair of the component, so the objective is to minimize this index so that the downtime for repairs is as low as possible [12,13]. In power systems, the network must be both reliable and efficient. To operate a network effectively, it is essential to manage it in a centralized manner to achieve optimal power flow [14].
In distribution, optimization methods are efficient in terms of computation. A very high-speed communication infrastructure is required to make this type of optimization converge to the solution with fewer interactions [15]. This research will utilize the TLBO (Teaching-Learning-Based Optimization) algorithm, which is employed to solve optimization problems. This algorithm can find the optimal point and is ideal for solving problems with a large and complicated computational load, as well as reduced reaction times [16].
The TLBO algorithm employs a mathematical model for teaching and learning [16], but it does not account for the system’s reliability, as it requires a power supply to function. When a failure occurs, the redundant system replaces the non-operating or faulty component. With this redundancy system, power supply interruptions can be avoided. In any electrical system, the continuity of the system must be ensured, and the extension of the redundant system would reduce failure and repair times [17].
The repair of a defective component is subject to certain restrictions associated with failures, which reveal variables such as the mean time to repair (MTTR). If the element does not meet the MTTR threshold, it is taken out of operation [17]. In parallel redundancy, all components operate simultaneously. This is implemented when the system needs to remain functional without interruption [18,19].
An initial analysis of the electrical system will be performed, including the identification of critical distribution lines and their reliability behavior. This will involve the simultaneous collection and evaluation of data from two IEEE systems, excluding other electrical power distribution systems, on single-phase faults and interruption times. Additionally, it will utilize reliability metrics to understand the nature and frequency of interruptions.
Models will be developed in PowerFactory to simulate the operation of the SEP. This will include configuring system components in redundant distribution lines, taking into account previously collected reliability data. Functional tests and simulations will be conducted to assess the impact of various fault scenarios on downtime and system reliability.
The analysis will be carried out by applying downtime reduction and appropriate reliability analysis techniques, such as mean time between failures and mean time to repair. This will allow the system’s ability to cope with problems in the distribution lines to be evaluated and its reliability to be quantified, limited to two IEEE systems, without considering other electrical power distribution systems. The study will be based on specific data and characteristics of this system to perform the reliability analysis.
2. Related Works
Reconfiguring the distribution network is one of the most economical and effective ways to improve reliability, as it uses existing resources. The reconfiguration of the system depends on its operating states, such as loads at the nodes. However, it is essential to repeat the analysis and calculations to find the optimal configuration [20,21].
The predictive reliability study is based on the failure rate cycle, represented by a bathtub curve. It utilizes the standard Weibull distribution to determine the slope of the failure rate in each period, employing median range regression for parameter estimation. The bathtub curve leads to the insertion of parameters, such as the total factor deterioration index (TFDI), through linear trend regression of the parameters on a logarithmic scale of their useful life [22].
One of the strategies to improve reliability is to install reclosers in an optimal manner, which isolate faults in a few seconds and thus mitigate interruptions to the end user. The aim is to study the effect on SAIFI and SAIDI reliability indices in the ETAP software [23].
The implementation of smart grids guarantees continuous power while maintaining system reliability. The Monte Carlo method is applied in a stochastic study, which involves a sequential time system that identifies events in temporal order, generating a sequence of repair cycles that focus on both repair time and failure time [24].
2.1. Distribution Reliability Indices
When a power failure occurs in the distribution system, the goal is to restore power to the end user as quickly as possible, ensuring normal and stable operation. The procedure for managing faults is divided into three levels: first, the location of the fault must be found; second, the fault must be isolated from the distribution network; and third, power must be restored. Reliability indices help to identify the location of faults by providing information to restore the power supply as quickly as possible. The main reliability characteristics have been defined in the following ways: user-based and demand-based [8].
Mean time between failures (MTBF) quantifies the average time between consecutive network outages; Its estimate is presented in (1), where the product of the total number of users and the 8,760 hours per year is divided by the sum of impacted customers; the result, expressed in hours, summarizes the frequency of failures according to the fraction of compromised demand [12,25].
The mean time to repair (MTTR) indicates the average time required for the system to restore service after each interruption. Equation (2) establishes its calculation. The numerator adds the products, while the denominator accumulates the interrupted users. The result, expressed in hours, evaluates the effectiveness of service restoration efforts [12,25].
2.2. Reliability in Redundant Systems
In any electrical or electronic system, system continuity must be ensured, and the extension of the redundant system would reduce failure and repair times. In the event of a failure, the N+1 redundant system will replace the failing hot component, thus avoiding process interruptions [17].
The repair of a defective component is subject to certain restrictions associated with failures, which reveal variables such as the mean time to repair (MTTR). If the component does not meet the MTTR threshold, it is taken out of operation. When performing a reliability analysis on redundant systems, the components are assumed to be independent and to fail simultaneously. Still, in practice, most systems are connected in parallel with another element [26].
In parallel redundancy, all components operate simultaneously. This is implemented when the system needs to remain functional without interruption [18]. Redundancy leads us stochastically to consider some random variables, such as the useful life of the components in a redundant parallel system, resulting in a marginal exponential distribution. Then, Tmax (X, Y) has the following reliability function:
Redundant components that are on standby function when the system has a failure. This method is used when component replacement does not require a lengthy process and does not cause further system failure [19]. The convolution of the variables is estimated stochastically, giving us T=X+Y, which is the useful life of the system, giving us the following distribution function when they are independent:
3. Methodology and Problem Statement
Reliability in electrical power distribution systems is essential, as it directly impacts service continuity and causes economic losses during outages, particularly due to distribution line failures that result in extended downtime. This study presents a methodology that optimally integrates redundant distribution lines, utilizing reliability analysis in conjunction with an optimization process based on the TLBO algorithm.
The methodology comprises six stages designed to improve reliability in distribution systems, as shown in Figure 1. Initially, a reliability study is conducted on a test system using DIgSILENT PowerFactory, quantifying basic indicators such as Mean Time Between Failures (MTBF) and Mean Time To Repair (MTTR), which reflect the system’s initial performance without modifications. Next, the MTBF and MTTR values are exported, organizing the data needed to integrate them into the mathematical optimization model. Subsequently, the TLBO algorithm is used to identify the optimal location and minimum number of redundant distribution lines to increase reliability, evaluating various configurations and selecting those that reduce MTTR without compromising electrical performance.
In the next phase, the redundant lines are incorporated into the DIgSILENT model, connecting the critical nodes defined during optimization. Next, a new reliability analysis is performed on the modified system, yielding updated MTBF and MTTR values to verify the improvement in the indicators. Parameters are adjusted, and the optimization is repeated if the results are not satisfactory.
Finally, the original configuration is compared with the optimized one, analyzing reliability indicators alongside key electrical variables, including the nodal voltage profile, active power, reactive power, phase angle, and technical losses, to validate the impact of the solution on the system’s reliability and electrical performance.
3.1. Reliability Analysis
Six reliability scenarios are analyzed: the base network without reinforcements (S0) and five configurations with between one and five optimal redundant lines (S1–S5). The lines are determined using the robust TLBO algorithm, applied 500 times to a 278-bus network with five iterations of increasing complexity. Each scenario maintains the historical loads and original topology, allowing direct comparison of the combined reduction in MTBF and MTTR achieved with the reinforcements.
Algorithm 1 summarizes the procedure executed to analyze the reliability of the electrical distribution system in each scenario, organizing the stages developed in the DigSilent PowerFactory simulation environment. This ranges from initial parameterization to the obtaining of final indicators, beginning with the loading of historical operation and maintenance data for each component of the system, Table 1 describes all variables used in Algorithm 1.
In lines 2 to 5, for each component i, the failure rate is calculated by dividing the number of failures by the total operating time , similarly determining the repair rate by dividing the number of repairs by the total repair time . Likewise, in lines 6 and 7, the network model is configured in PowerFactory, defining the time horizon of analysis and the number of simulation iterations necessary to evaluate the probabilistic behavior of the system in the face of failures.
In lines 8 to 14, execute the simulation cycle, generating failure and repair events for each component i using exponential distributions with their respective parameters . This allows the system status to be recorded over time and the cumulative duration of unavailability events to be calculated. Once the simulation is complete in lines 15 to 18, determine the Mean Time Between Failures , the Mean Time To Repair , and the availability for each component, using the appropriate mathematical expressions. This reveals the individual performance of each element and facilitates the evaluation of its contribution to the overall system reliability.
| Algorithm 1 Reliability Evaluation in DigSilent PowerFactory |
|
3.2. Data Processing
The export of electrical and reliability data from DigSilent PowerFactory is carried out using a routine in DPL language, as detailed in Algorithm 2, which automates this procedure and transfers results from the simulation environment to Excel spreadsheets. This facilitates the organization of technical information for subsequent analysis and use as input in the optimization algorithm, Table 2 describes all variables used in Algorithm 2.
| Algorithm 2 Export of Electrical and Reliability Data from DIgSILENT to Excel |
|
Lines 1 to 3 specify the input to the process, represented by a network case with previously performed load flow and reliability studies. Additionally, the connection between PowerFactory and Excel is established, generating an error message and halting the procedure if the connection is unsuccessful. Once the connection is complete, line 6 adjusts the visibility of Excel and opens the file located in the specified path, enabling interaction with specific sheets in the workbook to store the data obtained.
Lines 7 to 14 export nodal variables, creating and activating a sheet called “Nodes” where the headers are entered: node name, voltage per unit, and phase angle. Then, the load flow is executed, and each ElmTerm type element is scanned, reading the voltage and angle values for each node to record them in the sheet next to the corresponding identifier.
Lines 16 to 19 export line data, creating a sheet called “Lines” where the headers of the variables to be captured are entered: line name, type, length, connected nodes, current at both ends, apparent power, active power, reactive power, and load capacity. The load flow is then executed, and each active line in the system (ElmLne) is traversed to record its general attributes and electrical variables in a new row within the respective sheet.
3.3. Optimization with TLBO
The TLBO algorithm identifies the optimal location of redundant distribution lines to increase system reliability, as shown in Algorithm 3. To do this, it uses the MTBF and MTTR vectors, the contingency table T, and the total number of bars n as input. In addition, execution parameters are defined, such as the maximum number of redundant lines to be inserted , the number of independent repetitions , the iterations per run , and the population size P, generating a population m of solutions for each number of redundant lines , where each represents a set of candidate bars for insertion, Table 3 describes all variables used in Algorithm 3.
The population evolves during execution through the teaching and learning phases, with individuals in the first phase adjusting according to the best current solution, M. In the second phase, new solutions are generated by comparing pairs. The proposed solutions are validated and replaced only if they improve the objective value. Finally, once all the runs have been completed, the best solution is selected for each m, representing the most robust locations for installing redundant lines.
| Algorithm 3 Robust Optimization of Redundant Line Placement using TLBO |
|
3.4. Case Study
The proposed methodology is validated using the “MV Distribution Network – Base Model” integrated into the DigSilernt PowerFactory. This test system represents a medium-voltage distribution network with realistic characteristics, commonly used in reliability studies, load flow analysis, and contingency assessment in electrical systems. The model structure comprises four primary substations, designated as SUB_01 to SUB_04, which cover over 270 connection nodes and approximately 300 distribution lines. Figure 2 shows the single-line diagram of the test system in question.
4. Results Analysis
This section presents the results obtained from the optimization process executed using the TLBO algorithm, focused on determining optimal locations for redundant distribution lines in the electrical system. The analysis details the most efficient solutions identified for different numbers of additional lines, examining their specific impact on reducing the value of the objective function established for the optimization problem.
The evaluation continues with an analysis of the effects that these selected locations have on the system’s reliability indicators, fundamental parameters that characterize the operational performance of the distribution network. Subsequently, the changes in the electrical behavior of the system are evaluated, considering critical operational variables such as voltage profiles at different nodes, power flows through transmission lines, and total energy losses in the system.
Table 4 shows the results obtained from optimization using TLBO. Here, the algorithm demonstrated a progressive reduction in the value of the objective function (Mean, ) as the number of redundant lines increased, reaching its minimum with (m: number of redundant lines); however, the selected solution corresponds to (lowest CV) because it has the lowest relative dispersion value (CV: coefficient of variation) and greater statistical stability (: standard deviation) during the 500 independent iter performed, showing that lines LN_1011 and LN_0871 (selected lines) appear with high frequency in multiple configurations, which indicates that these locations represent optimal strategic points for the installation of redundant lines in the electrical distribution system.
4.1. Evaluation of Reliability Indicators.
The implementation of the valid solution with three redundant lines resulted in quantifiable improvements in reliability indicators, as evidenced by an increase in the average MTBF from 403.64 hours to 409.42 hours and a reduction in MTTR from 2,351 hours to 2,306 hours, as shown in Figure 3. These variations reflect a lower frequency of component failures and faster recovery after each event, confirming that the optimized location of redundant lines using the TLBO algorithm has a positive influence on the reliable performance of the electrical distribution system under analysis.
4.2. Electrical Impact of Redundant Lines.
Analysis of the voltage profile (Figure 4) reveals that, without redundant lines (red line), the most significant drops are concentrated near nodes 1500 and 2000, with minimum values of approximately 0.94 p.u. In contrast, with redundant lines (blue line), the minimum values are located around node 2000, remaining around 0.95 p.u. and with less dispersion. However, the rest of the nodes maintain a magnitude of around 0.98 p.u. These results show that the inclusion of redundant lines substantially improves the voltage profile.
Analysis of the stress angle (Figure 5) reveals that, without redundant lines (blue line), angular variations are significant, reaching a value of approximately -10° in the nodes after 2000. With redundant lines (red line), although variations persist, they are less intense and remain between -4° and -8°.
These results indicate that redundant lines reduce angular dispersion, moderately improving synchronization between nodes. The distribution of active power per line, as shown in Figure 6, undergoes significant changes after the implementation of redundant lines. This transformation converts a system that initially exhibits high variability, with flows exceeding ±5000 MW in several sections of the network, into a configuration where values are concentrated in a more contained range with less overall dispersion. In detail, although some points experience a reduction in power magnitude, a more uniform distribution between lines is achieved, reducing local overloads by providing alternative routes for energy flow. This allows power to be distributed across multiple paths rather than concentrated on a few specific lines, favoring a more balanced operation of the distribution system.
For its part, the comparison of reactive power per line reveals a more concentrated distribution with less dispersion in the system with redundant lines, as shown in Figure 7. In the original configuration, reactive flows vary widely, with values exceeding ±3000 Mvar. After the topology modification, the values are grouped in a narrower range, with fewer extreme fluctuations. There is evidence of an attenuation in power peaks, reflecting more uniform behavior between consecutive sections. This redistribution helps to stabilize the reactive power exchange in the network.
The comparison of load capacity, as shown in Figure 8, reveals that incorporating redundant lines increases the utilization percentage of existing lines. This transforms a system where the original topology has load levels below 40% across virtually the entire network into a configuration where the values increase and are distributed evenly, with multiple lines operating between 40% and 80% of their nominal capacity. This behavior is explained by the phenomenon of flow redistribution, which allows previously underutilized lines to participate more actively in energy transport.
The comparison of active power losses, shown in Figure 9, demonstrates an overall reduction following the implementation of redundant lines. This is evidenced by a transformation of the system where the original configuration shows losses reaching peaks of up to 60 MW in specific sections. However, in a modified configuration, the values are distributed more evenly with considerably lower magnitudes.
The reactive power losses per line, shown in Figure 10, experience a general reduction after the incorporation of redundant lines. Since the initial configuration presents pronounced negative values exceeding -40 Mvar in multiple sections, the modified configuration, however, stabilizes the values in a narrower range with less depth at the extremes.
5. Conclusions
The application of the TLBO algorithm successfully achieved the specific objectives set out in the research. First, the challenges related to reliability and downtime were clearly identified, highlighting the need for redundant lines to improve the operational performance of the system. Second, through the analysis and evaluation of mean time between failures (MTBF) and mean time to repair (MTTR), it was determined that the best solution obtained corresponds to the incorporation of three redundant lines (LN-1011, LN-1058, and LN-0871), due to their greater statistical stability and lower variability in results.
Simulation of the distribution system under defined scenarios quantitatively confirmed the improvement in reliability, increasing the MTBF from 403.64 h to 409.42 h and reducing the MTTR from 2.351 h to 2.306 h. In addition, the findings demonstrated specific electrical benefits: the voltage profile showed lower drops and greater stability above 0.98 p.u., angular dispersion decreased significantly, and the distribution of active and reactive power became more uniform, with a considerable reduction in energy losses. Finally, the average load capacity of the lines increased, confirming a more efficient use of the existing electrical infrastructure.
These results clearly validate that the proposed optimal location of redundant lines meets the overall objective of strengthening reliability indicators and improving the electrical performance of the distribution system.
Author Contributions
Conceptualization, D.C.; Methodology, G.C.; Formal analysis, J.J.; Data curation, M.J.; Writing original draft, J.J.; Writing review & editing, D.C. and M.J.; Supervision, D.C.; Project administration, D.C.; Funding acquisition, D.C. All authors have read and agreed to the published version of the manuscript.
Data Availability Statement
The original contributions presented in this study are included in the article. Further inquiries can be directed to the corresponding author.
Conflicts of Interest
The authors declare no conflicts of interest.
Abbreviations
The abbreviations used in this article are as follows:
| EPS connectivity matrix | |
| PMU implementation cost at node i | |
| PMU location binary variable at node i | |
| EPS observability percentage | |
| PMU quantity | |
| T | Planning period |
| Operation costs | |
| Investment costs | |
| generators set | |
| Nodes set | |
| Generation production costs | |
| Generator real power | |
| Initial state of the line between nodes | |
| Binary variable representing the status of the line | |
| Cost of the candidate line between nodes | |
| Power flow limit per line | |
| Maximum power flow limit per line | |
| Susceptance of the line between nodes | |
| Voltage angle at node i | |
| M | maximum line load capacity |
| Real power generated by the generator i | |
| Maximum active power limit of generators | |
| Minimum active power limit for generator | |
| Load shedding at node i | |
| Load at node i |
References
- Brown, R.E.; Ochoa, J.R. Distribution system reliability: Default data and model validation. IEEE Power Engineering Review 1998, 17, 39–40. [Google Scholar] [CrossRef]
- Ma, C.; Gao, Y. Study on mesh segmentation of topology optimization results using Reeb graph. Proceedings - 2021 International Conference on Artificial Intelligence and Electromechanical Automation, AIEA 2021 2021, pp. 277–280. [CrossRef]
- Dong, Q.; Gao, Y.; Zhang, W.; Chen, Z.; Liu, Q. Modified GRA method for probabilistic hesitant fuzzy MAGDM and application to network health performance evaluation of radial distribution system. Journal of Intelligent and Fuzzy Systems 2023, 45, 435–443. [Google Scholar] [CrossRef]
- Peña, D.; Aguila, A.; Jurado, F. Reliability Assessment of Ecuador’s Power System: Metrics, Vulnerabilities, and Strategic Perspectives. Energies 2025, 18. [Google Scholar] [CrossRef]
- Masache, P.; Carrión, D.; Cárdenas, J. Optimal Transmission Line Switching to Improve the Reliability of the Power System Considering AC Power Flows. Energies 2021, Vol. 14, Page 3281 2021, 14, 3281. [Google Scholar] [CrossRef]
- Bishop, M.; McCarthy, C.; Witte, J.; Day, T.; DeAlcala, G. Distribution system reliability improvements justified by increased oil production. IEEE Transactions on Industry Applications 2000, 36, 1697–1703. [Google Scholar] [CrossRef]
- Shaheen, A.M.; Elattar, E.E.; El-Sehiemy, R.A.; Elsayed, A.M. An Improved Sunflower Optimization Algorithm-Based Monte Carlo Simulation for Efficiency Improvement of Radial Distribution Systems Considering Wind Power Uncertainty. IEEE Access 2021, 9, 2332–2344. [Google Scholar] [CrossRef]
- Karimi, H.; Niknam, T.; Dehghani, M.; Ghiasi, M.; Ghasemigarpachi, M.; Padmanaban, S.; Tabatabaee, S.; Aliev, H. Automated Distribution Networks Reliability Optimization in the Presence of DG Units Considering Probability Customer Interruption: A Practical Case Study. IEEE Access 2021, 9, 98490–98505. [Google Scholar] [CrossRef]
- Arora, J. Reliability of a 2-Unit Standby Redundant System with Constrained Repair Time. IEEE Transactions on Reliability 1976, R-25, 203–205. [Google Scholar] [CrossRef]
- Bhardwaj, R.K.; Kaur, K.; Malik, S.C. Reliability indices of a redundant system with standby failure and arbitrary distribution for repair and replacement times. International Journal of System Assurance Engineering and Management 2016, 8, 423–431. [Google Scholar] [CrossRef]
- Sharifinia, S.; Rastegar, M.; Allahbakhshi, M.; Fotuhi-Firuzabad, M. Inverse Reliability Evaluation in Power Distribution Systems. IEEE Transactions on Power Systems 2020, 35, 818–820. [Google Scholar] [CrossRef]
- Michlin, Y.H.; Grabarnik, G.Y. Sequential Testing for Comparison of the Mean Time Between Failures for Two Systems. IEEE Transactions on Reliability 2007, 56, 321–331. [Google Scholar] [CrossRef]
- De, S.K.; Zacks, S. Exact Calculation of the Distributions of the Stopping Times of Two Types of Truncated SPRT for the Mean of the Exponential Distribution. Methodology and Computing in Applied Probability 2015, 17, 915–927. [Google Scholar] [CrossRef]
- Xifang, H.; Fusuo, L.; Dandan, Z.; Yu, W.; Ling, Z.; Ruitong, L. Optimization Scheme of Fault Ride through Strategy for Improving Transient Stability and DC Voltage Security of Power Grid. In Proceedings of the 2022 6th International Conference on Power and Energy Engineering (ICPEE); 2022; pp. 351–357. [Google Scholar] [CrossRef]
- Sadnan, R.; Dubey, A. Distributed Optimization Using Reduced Network Equivalents for Radial Power Distribution Systems. IEEE Transactions on Power Systems 2021, 36, 3645–3656. [Google Scholar] [CrossRef]
- Shojaei, F.; Rastegar, M.; Dabbaghjamanesh, M. Simultaneous placement of tie-lines and distributed generations to optimize distribution system post-outage operations and minimize energy losses. CSEE Journal of Power and Energy Systems 2021, 7, 318–328. [Google Scholar] [CrossRef]
- Stiller, J.C. Modelling and Quantification of Correlated Failures of Multiple Components due to Asymmetries of the Electrical Power Supply System of Nuclear Power Plants in PSA. In Proceedings of the Proceedings of the Probabilistic Safety Assessment and Management Conference (PSAM 16), Honolulu, Hawaii, July 2022. [Google Scholar]
- Hamadani, A.Z.; Nasrabadi, A.N. The effect of dependency on the MRL function of redundant systems. In Proceedings of the 2007 IEEE International Conference on Industrial Engineering and Engineering Management; 2007; pp. 1191–1195. [Google Scholar] [CrossRef]
- Kavlak, K.B. Reliability and mean residual life functions of coherent systems in an active redundancy. Naval Research Logistics 2017, 64, 19–28. [Google Scholar] [CrossRef]
- Gautam, M.; Bhusal, N.; Benidris, M. Deep Q-Learning-based Distribution Network Reconfiguration for Reliability Improvement. In Proceedings of the 2022 IEEE/PES Transmission and Distribution Conference and Exposition; 2022; pp. 1–5. [Google Scholar] [CrossRef]
- Lemus, A.; Carrión, D.; Aguire, E.; González, J.W. Location of distributed resources in rural-urban marginal power grids considering the voltage collapse prediction index. Ingenius 2022, 28, 25–33. [Google Scholar] [CrossRef]
- Dechgummarn, Y.; Fuangfoo, P.; Kampeerawat, W. Predictive Reliability Analysis of Power Distribution Systems Considering the Effects of Seasonal Factors on Outage Data Using Weibull Analysis Combined With Polynomial Regression. IEEE Access 2023, 11, 138261–138278. [Google Scholar] [CrossRef]
- Zhgun, K.; Mazaheri, H. Enhancing Distribution Grid Reliability via Recloser Placement. In Proceedings of the 2023 North American Power Symposium (NAPS); 2023; pp. 1–6. [Google Scholar] [CrossRef]
- das Neves Neto, J.C.; Abubakar, A.; Meschini Almeida, C.F.; Delbone, E. Stochastic Analysis (MCS) for Mitigation of Reliability Indicators of the Power Distribution System. In Proceedings of the 2022 IEEE PES Generation, Transmission and Distribution Conference and Exposition – Latin America (IEEE PES GTD Latin America); 2022; pp. 1–5. [Google Scholar] [CrossRef]
- Aguila, A.; Ortiz, L.; Ruiz, M.; Narayanan, K.; Varela, S. Optimal Location of Reclosers in Electrical Distribution Systems Considering Multicriteria Decision Through the Generation of Scenarios Using the Montecarlo Method. IEEE Access 2023, 11, 68853–68871. [Google Scholar] [CrossRef]
- Huang, W.; Loman, J.; Andrada, R.; Chin, J. Assessment of propagating failure modes in a cross-strapped redundant system. In Proceedings of the 2017 Annual Reliability and Maintainability Symposium (RAMS); 2017; pp. 1–6. [Google Scholar] [CrossRef]
Figure 1.
Proposed methodology for improving the reliability of distribution systems.
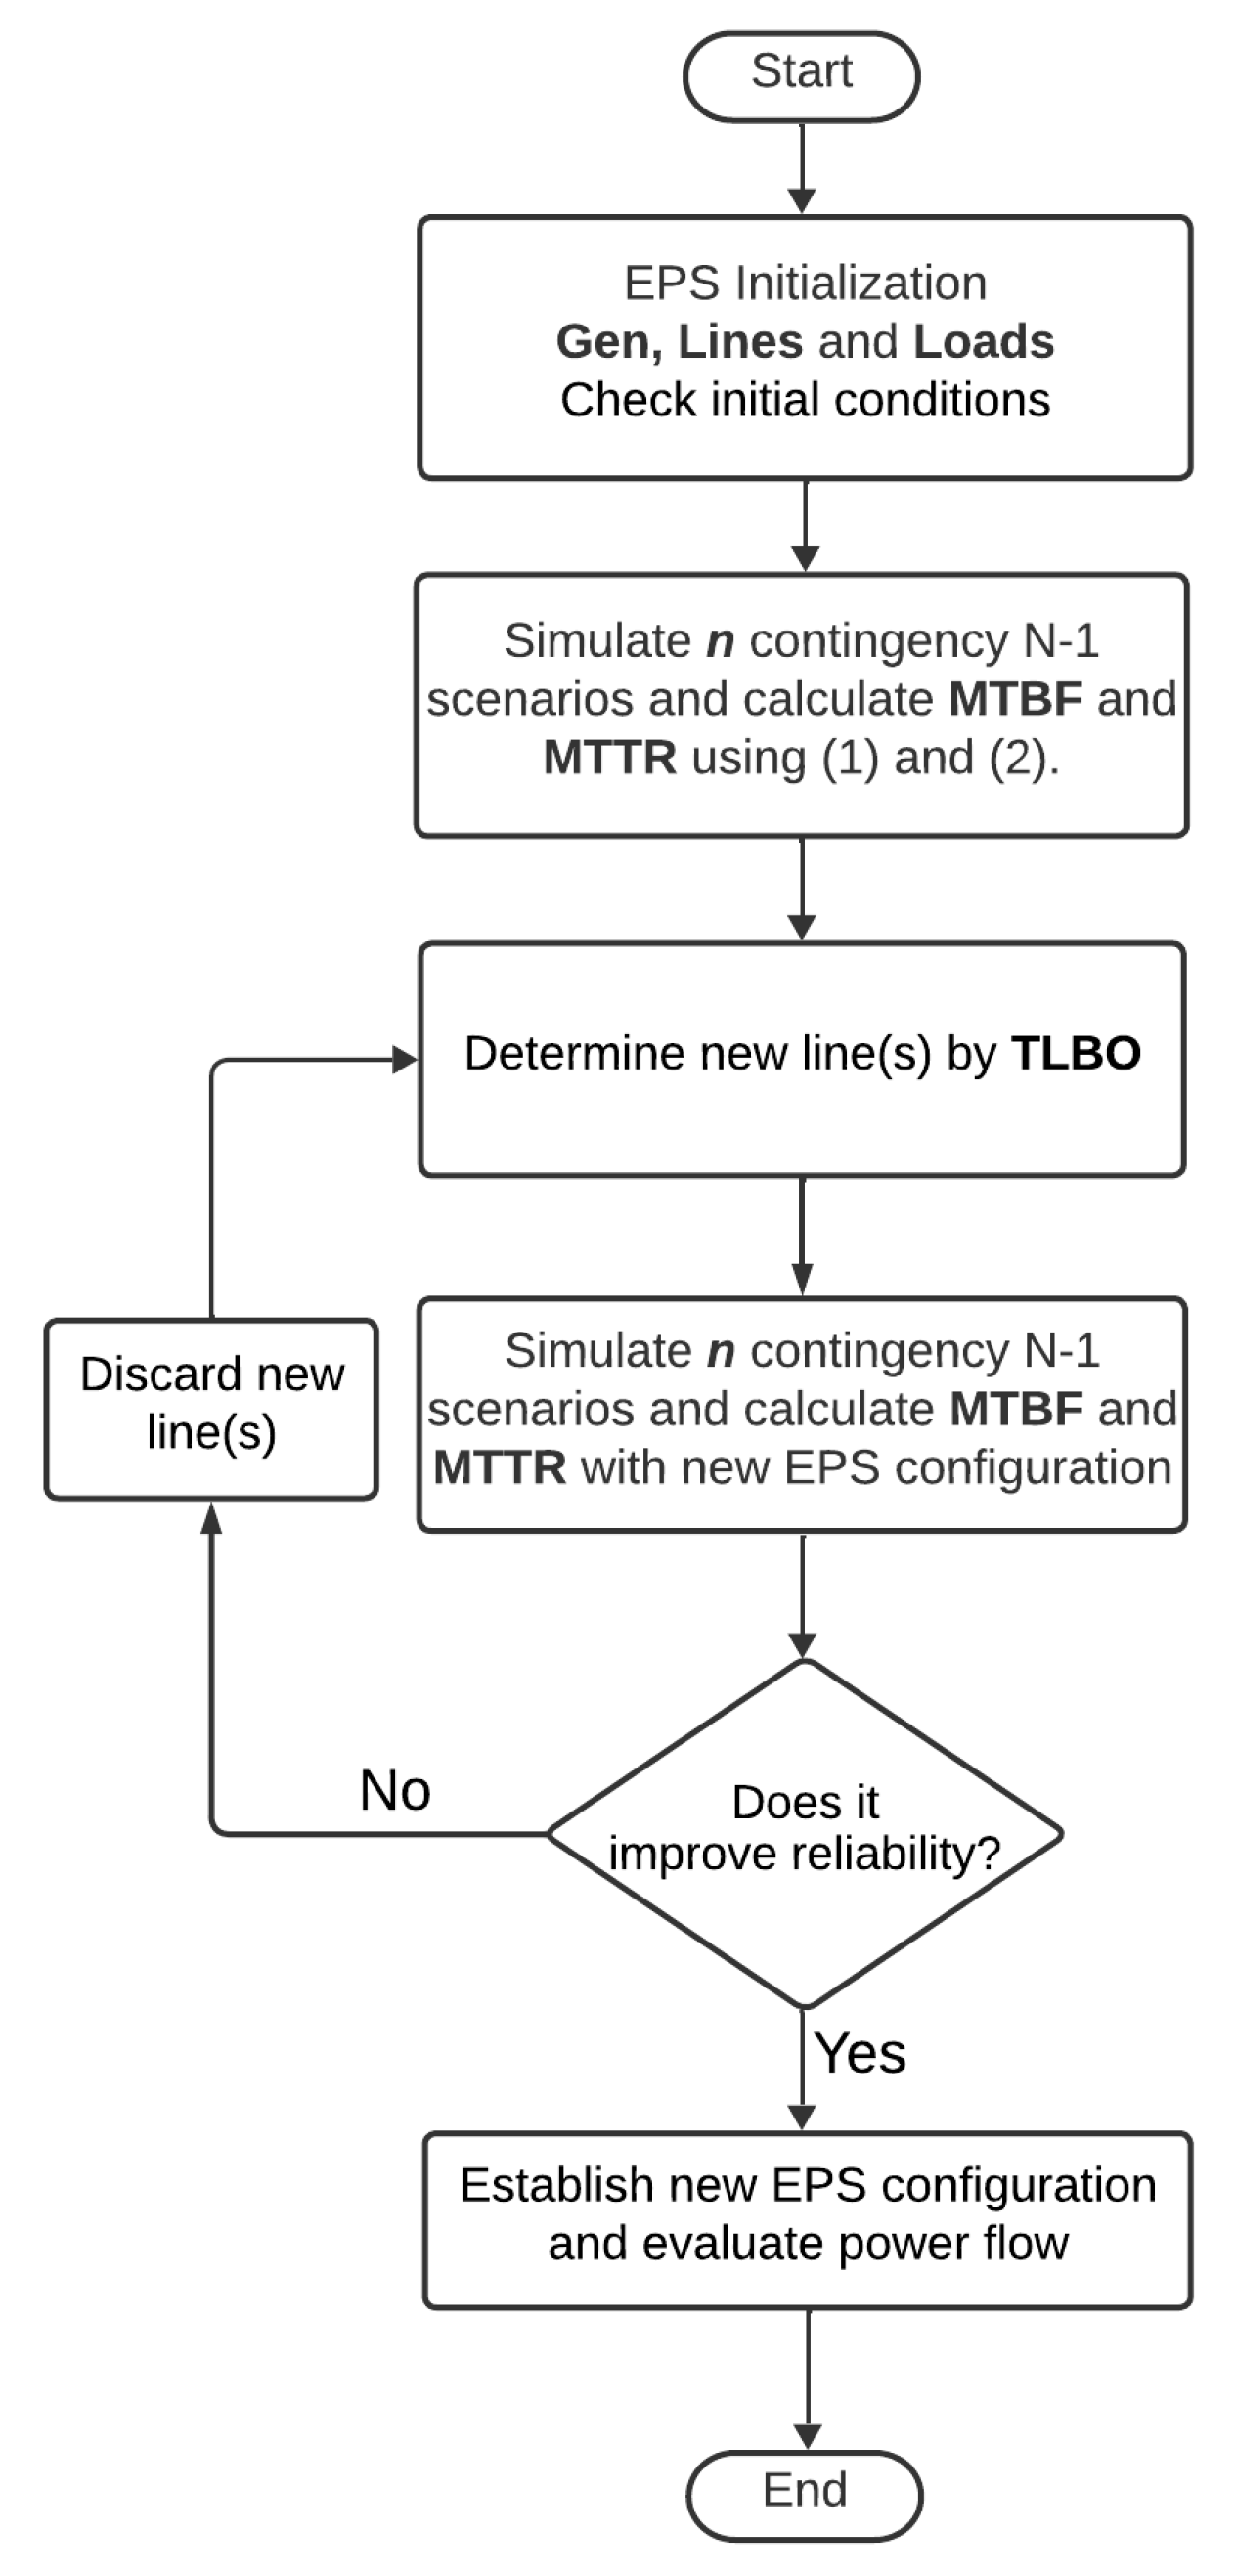
Figure 2.
Single-line diagram of the “MV Distribution Network – Base Model” test system.
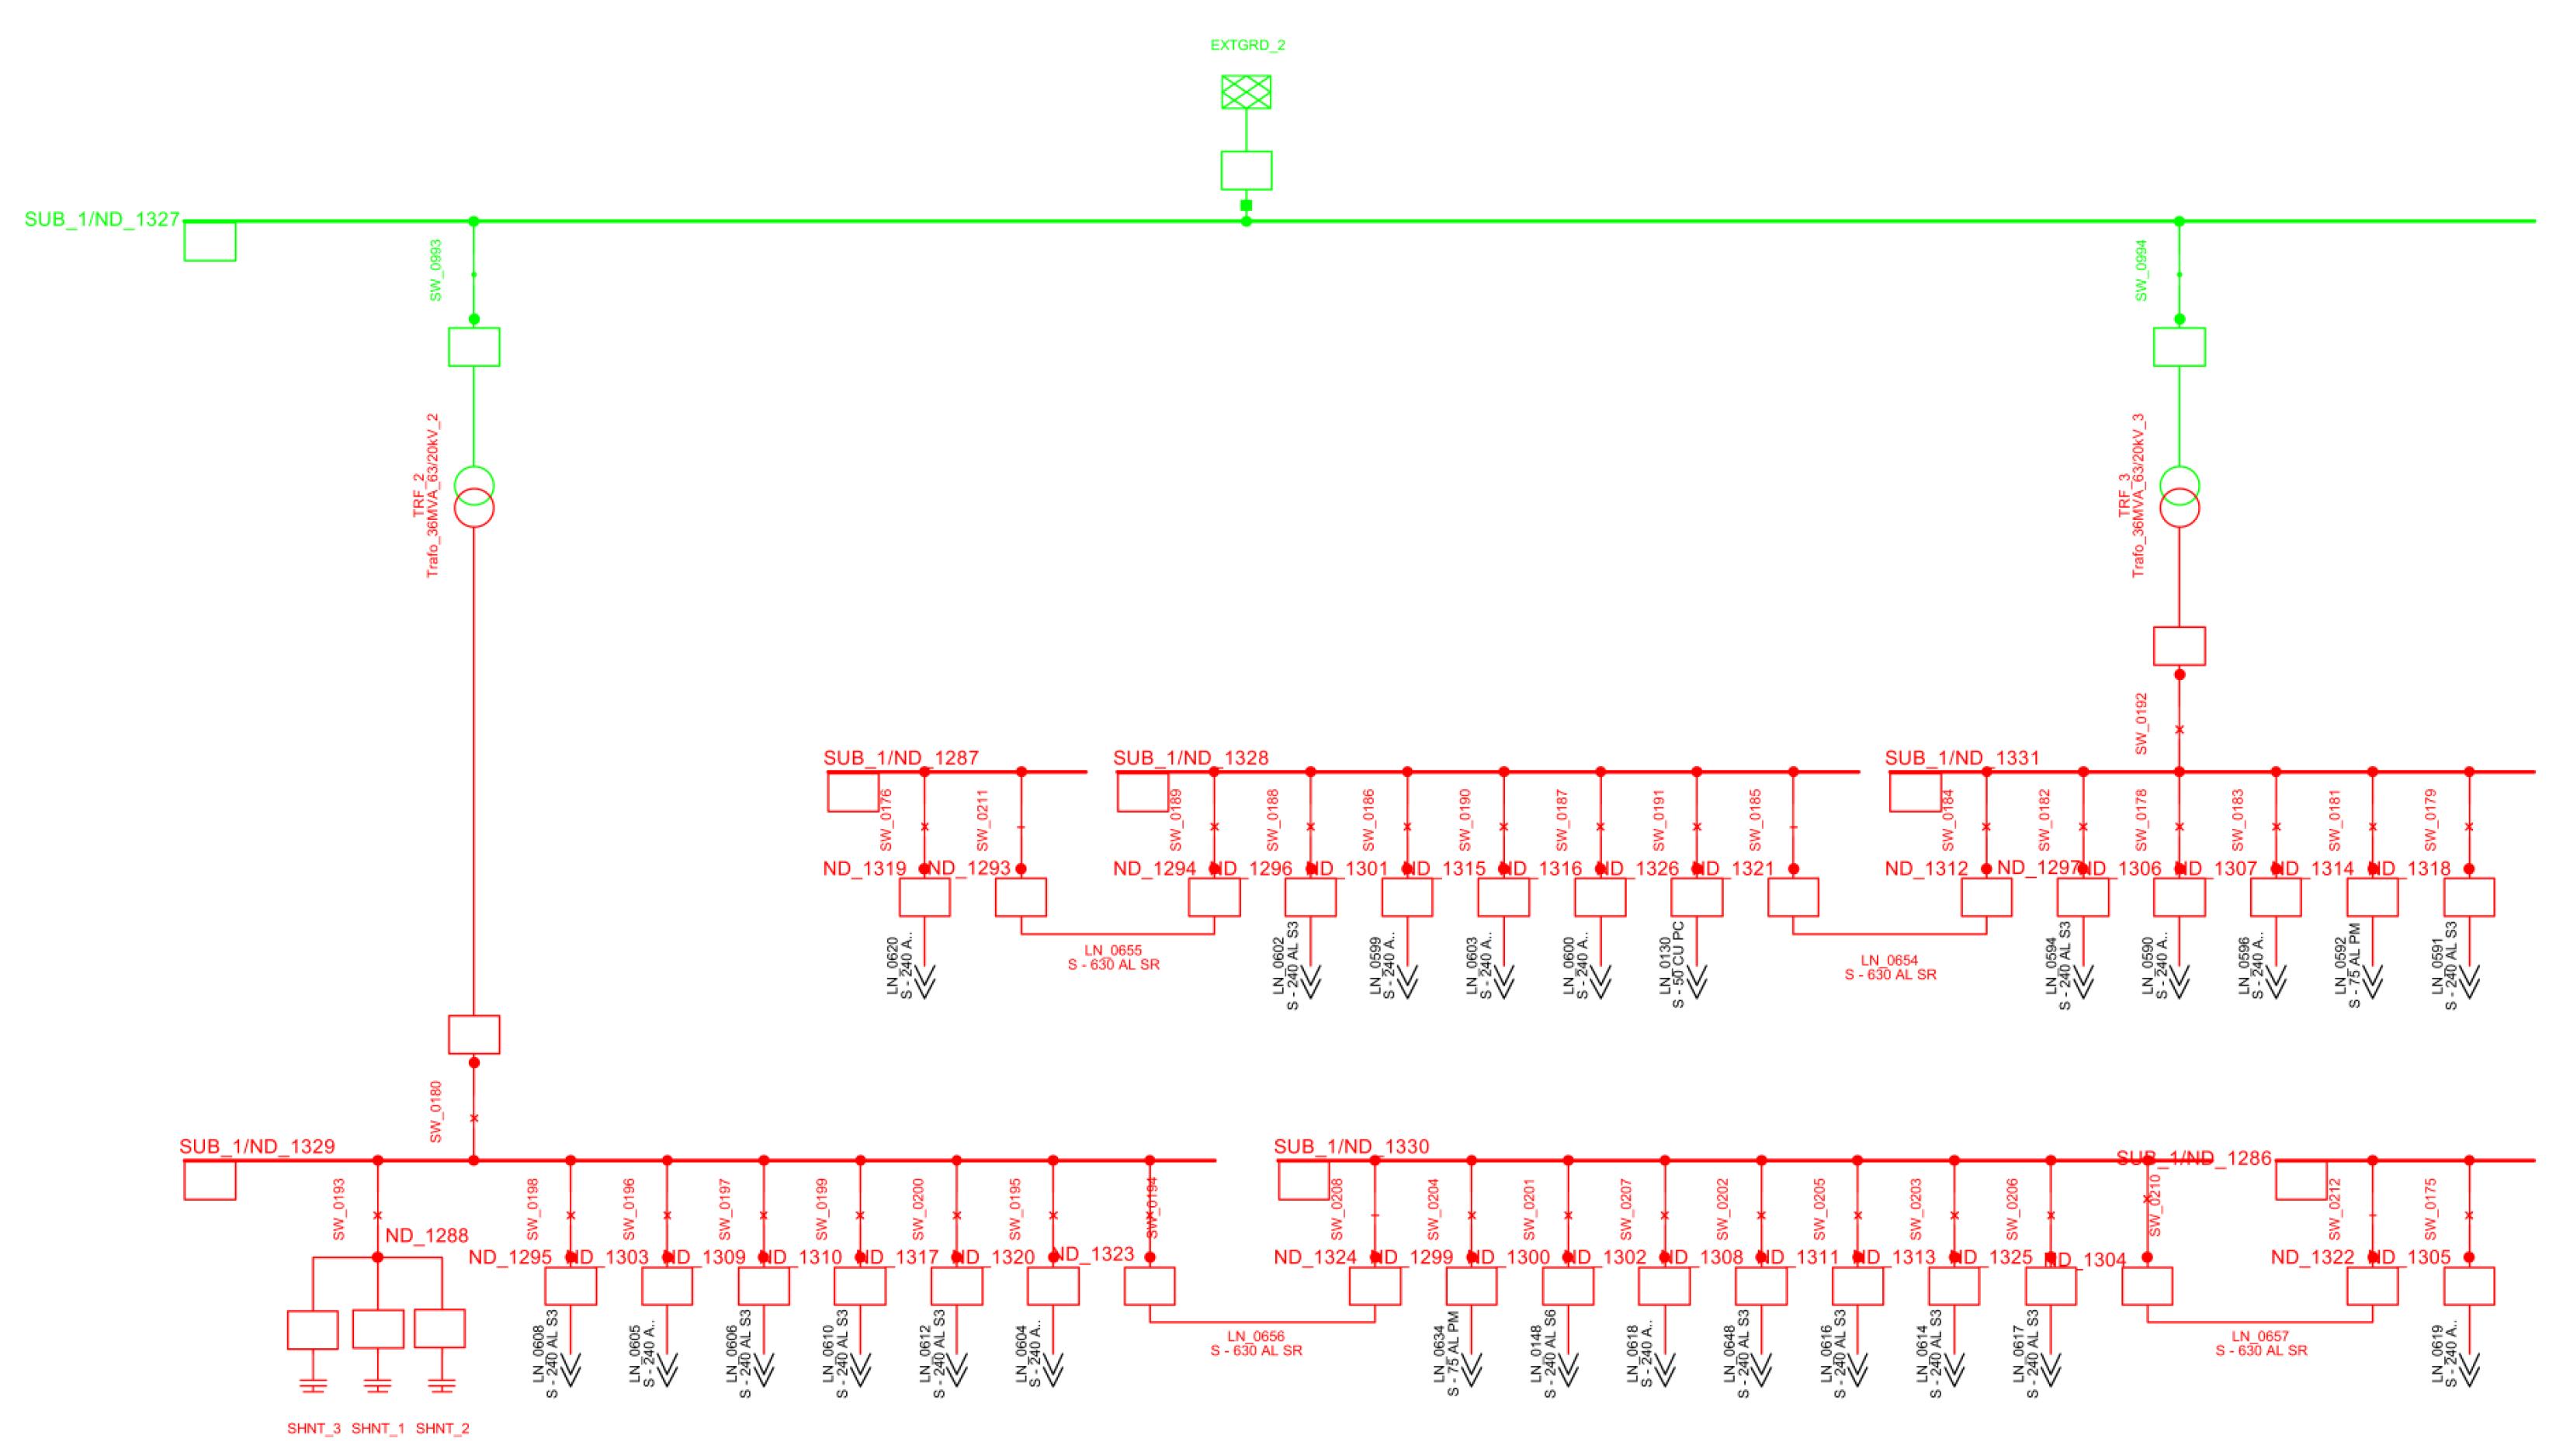
Figure 3.
Comparison of MTBF and MTTR reliability indicators.
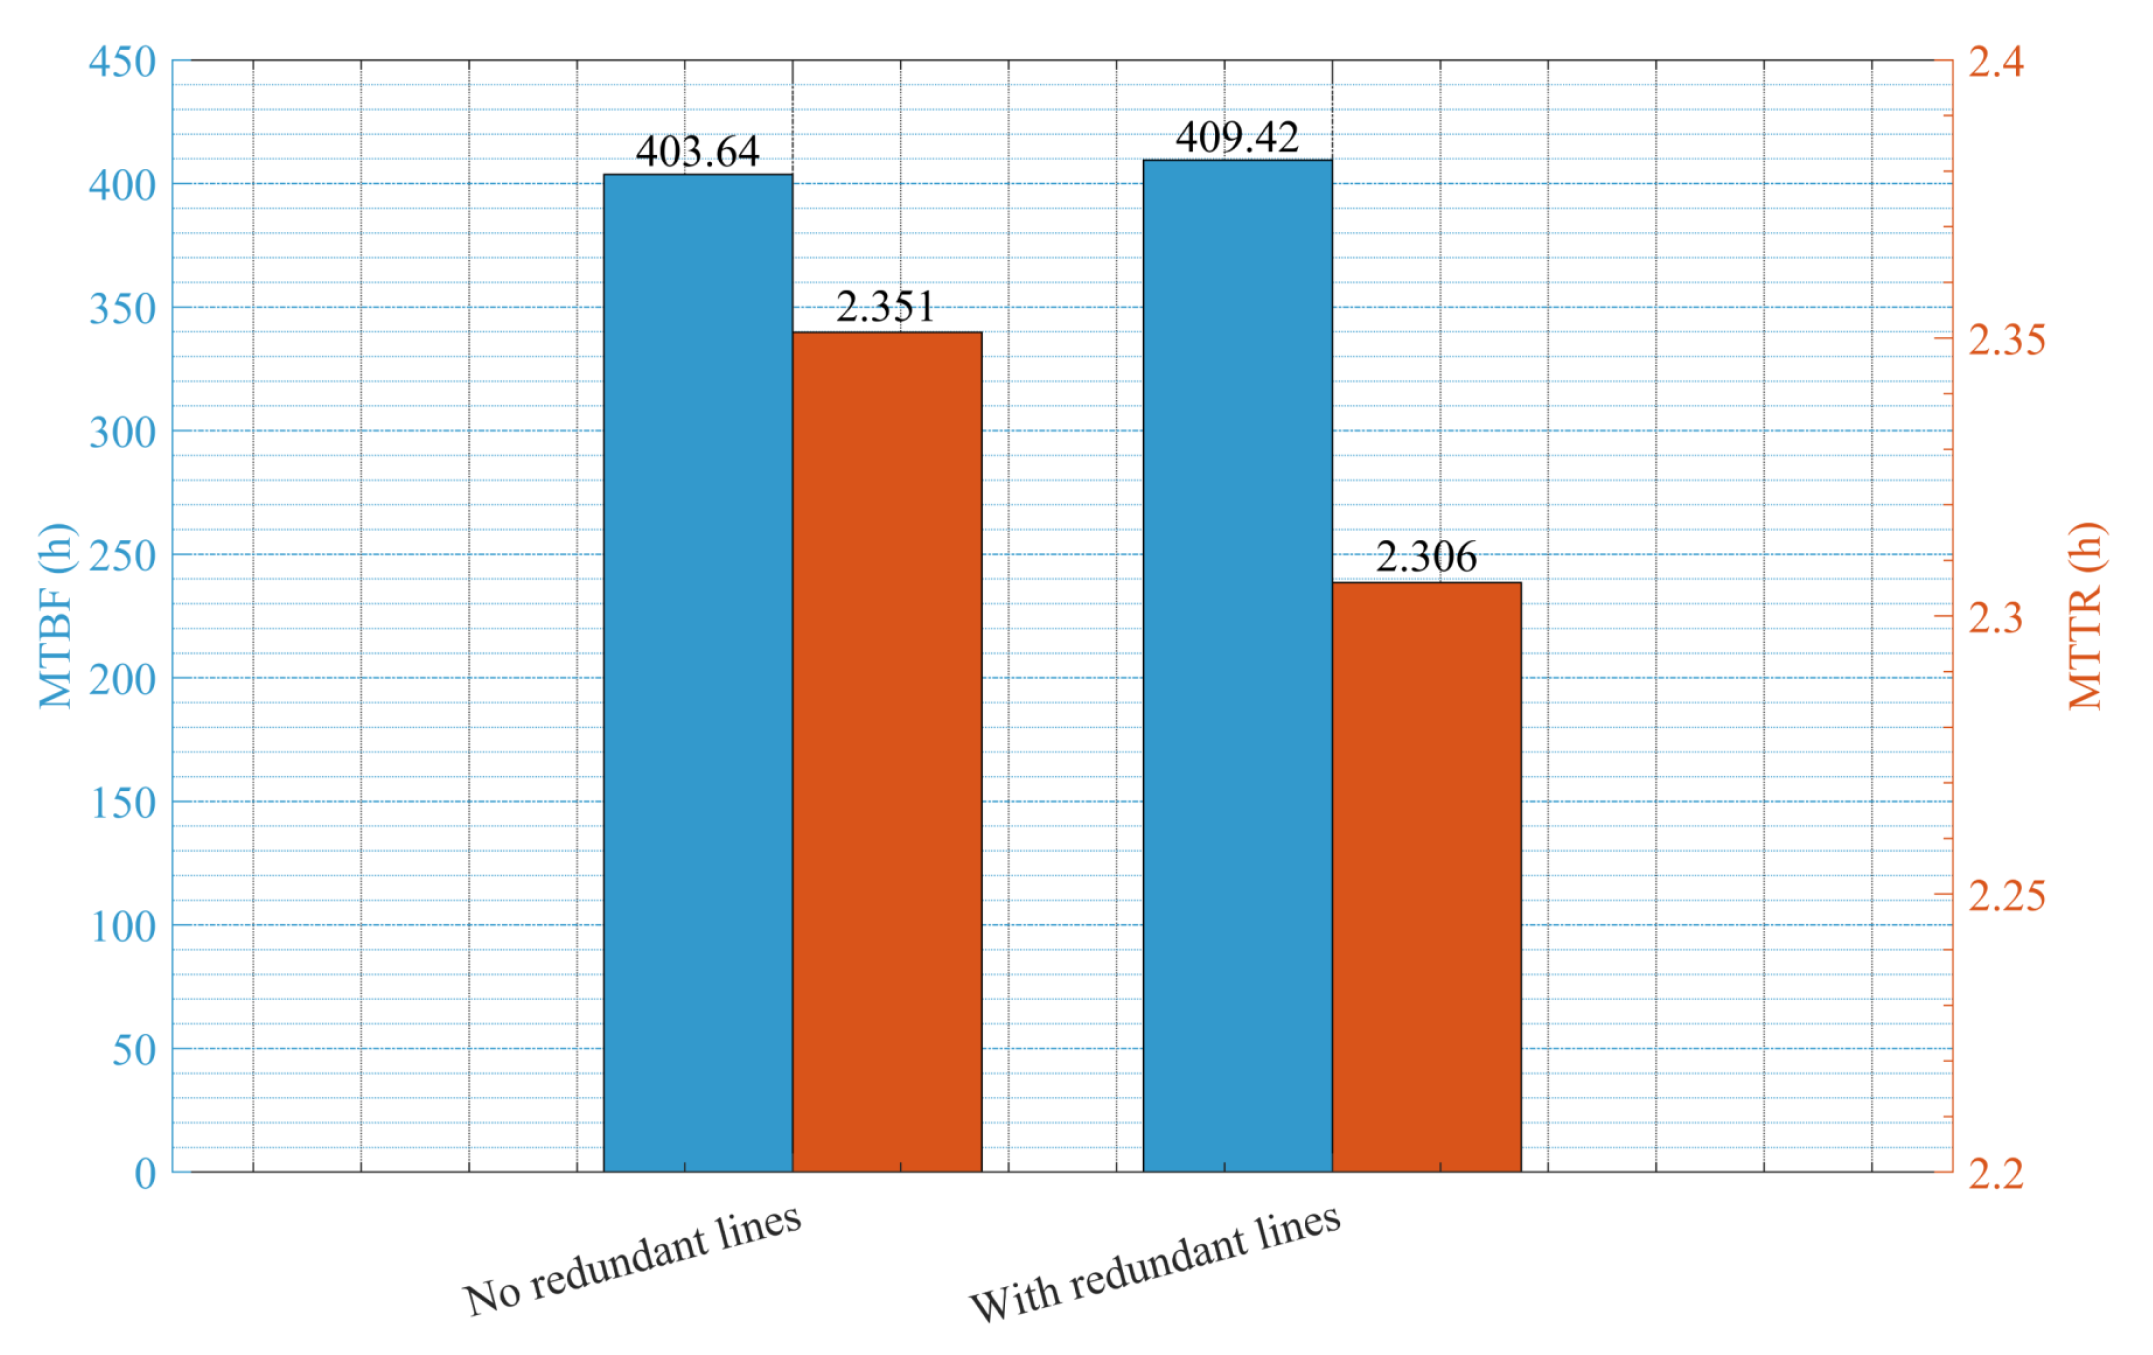
Figure 4.
Comparative analysis of voltage profiles with and without redundant lines.
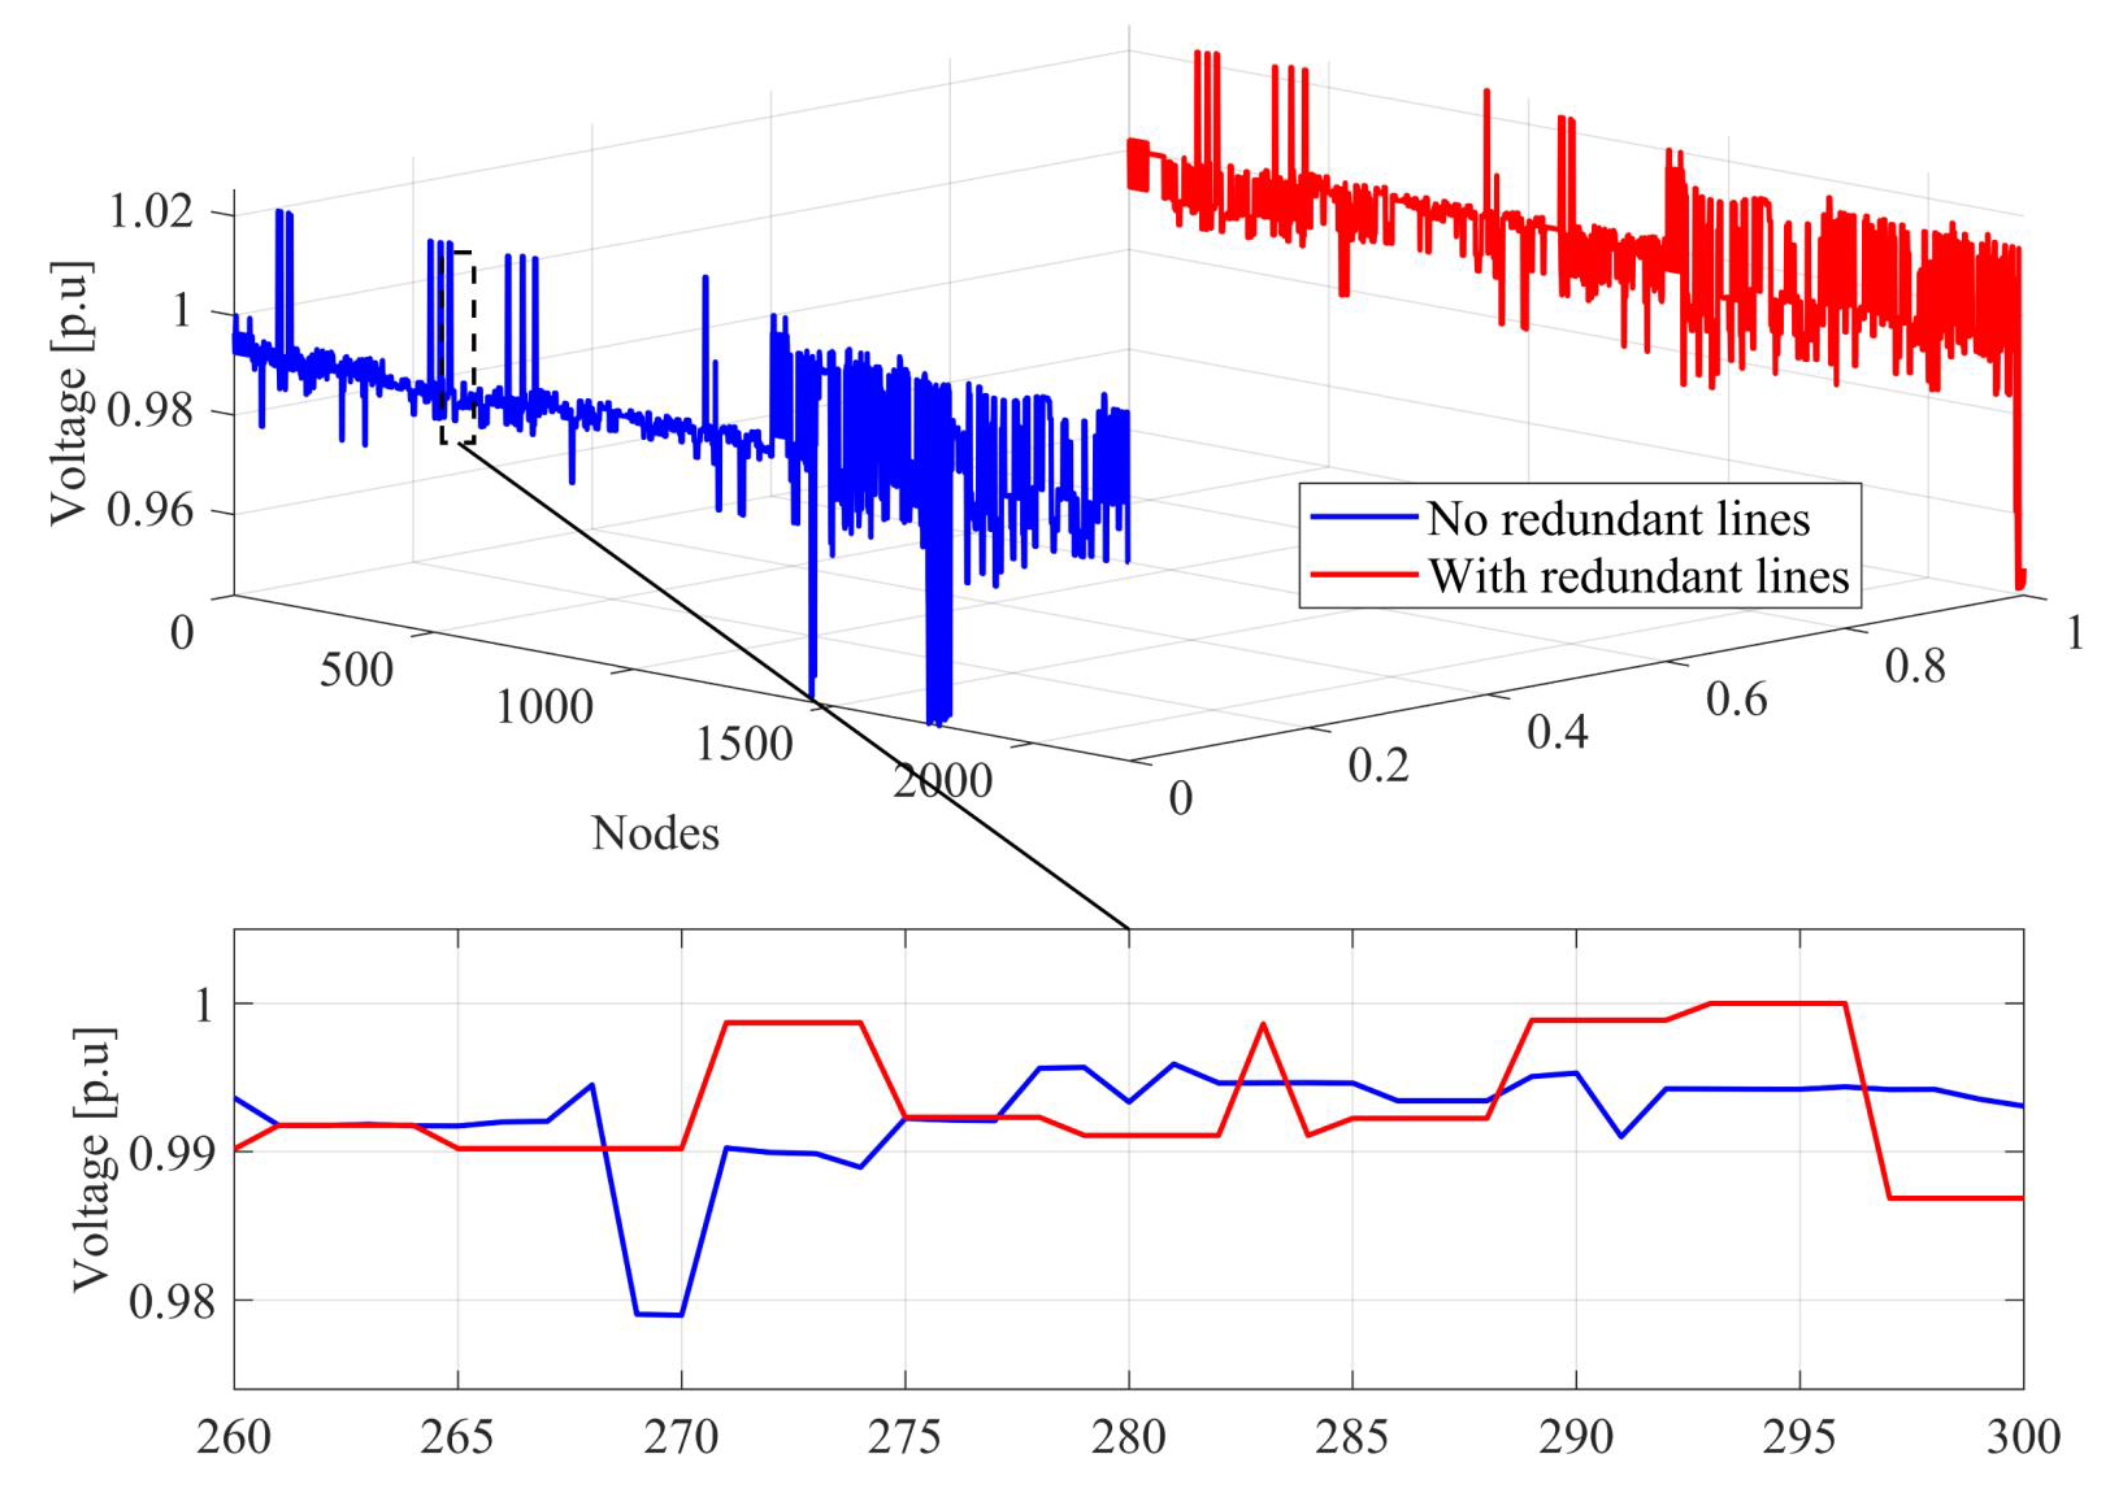
Figure 5.
Comparative analysis of the stress angle with and without redundant lines.
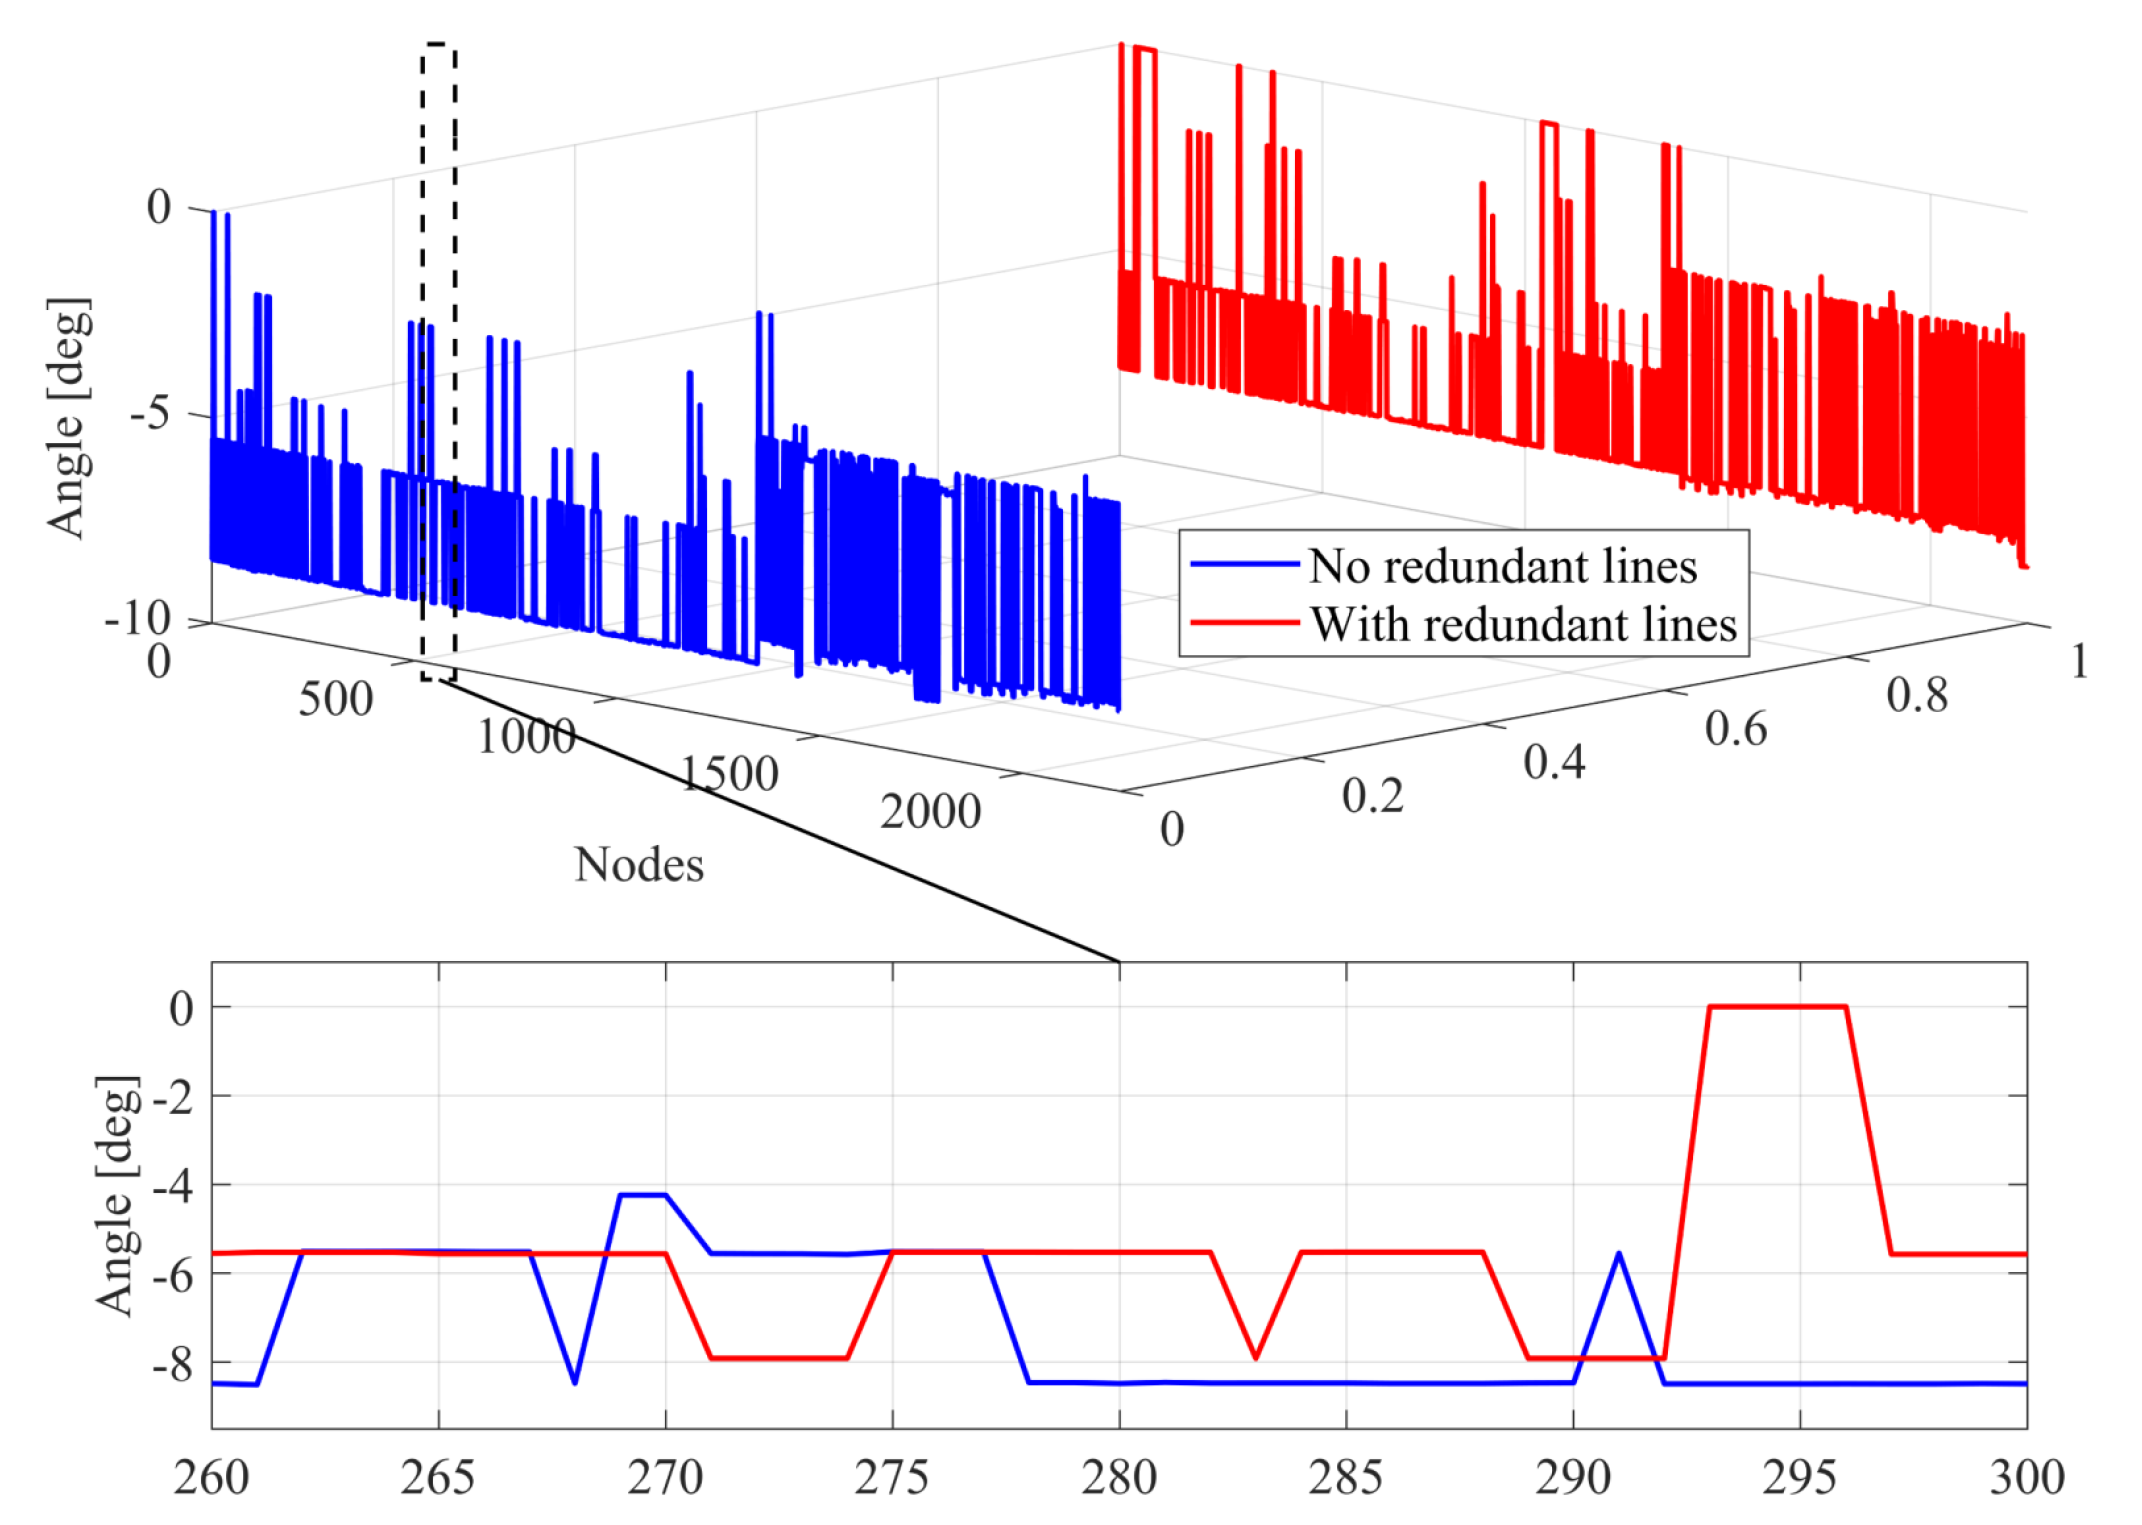
Figure 6.
Comparative analysis of real power with and without redundant lines.
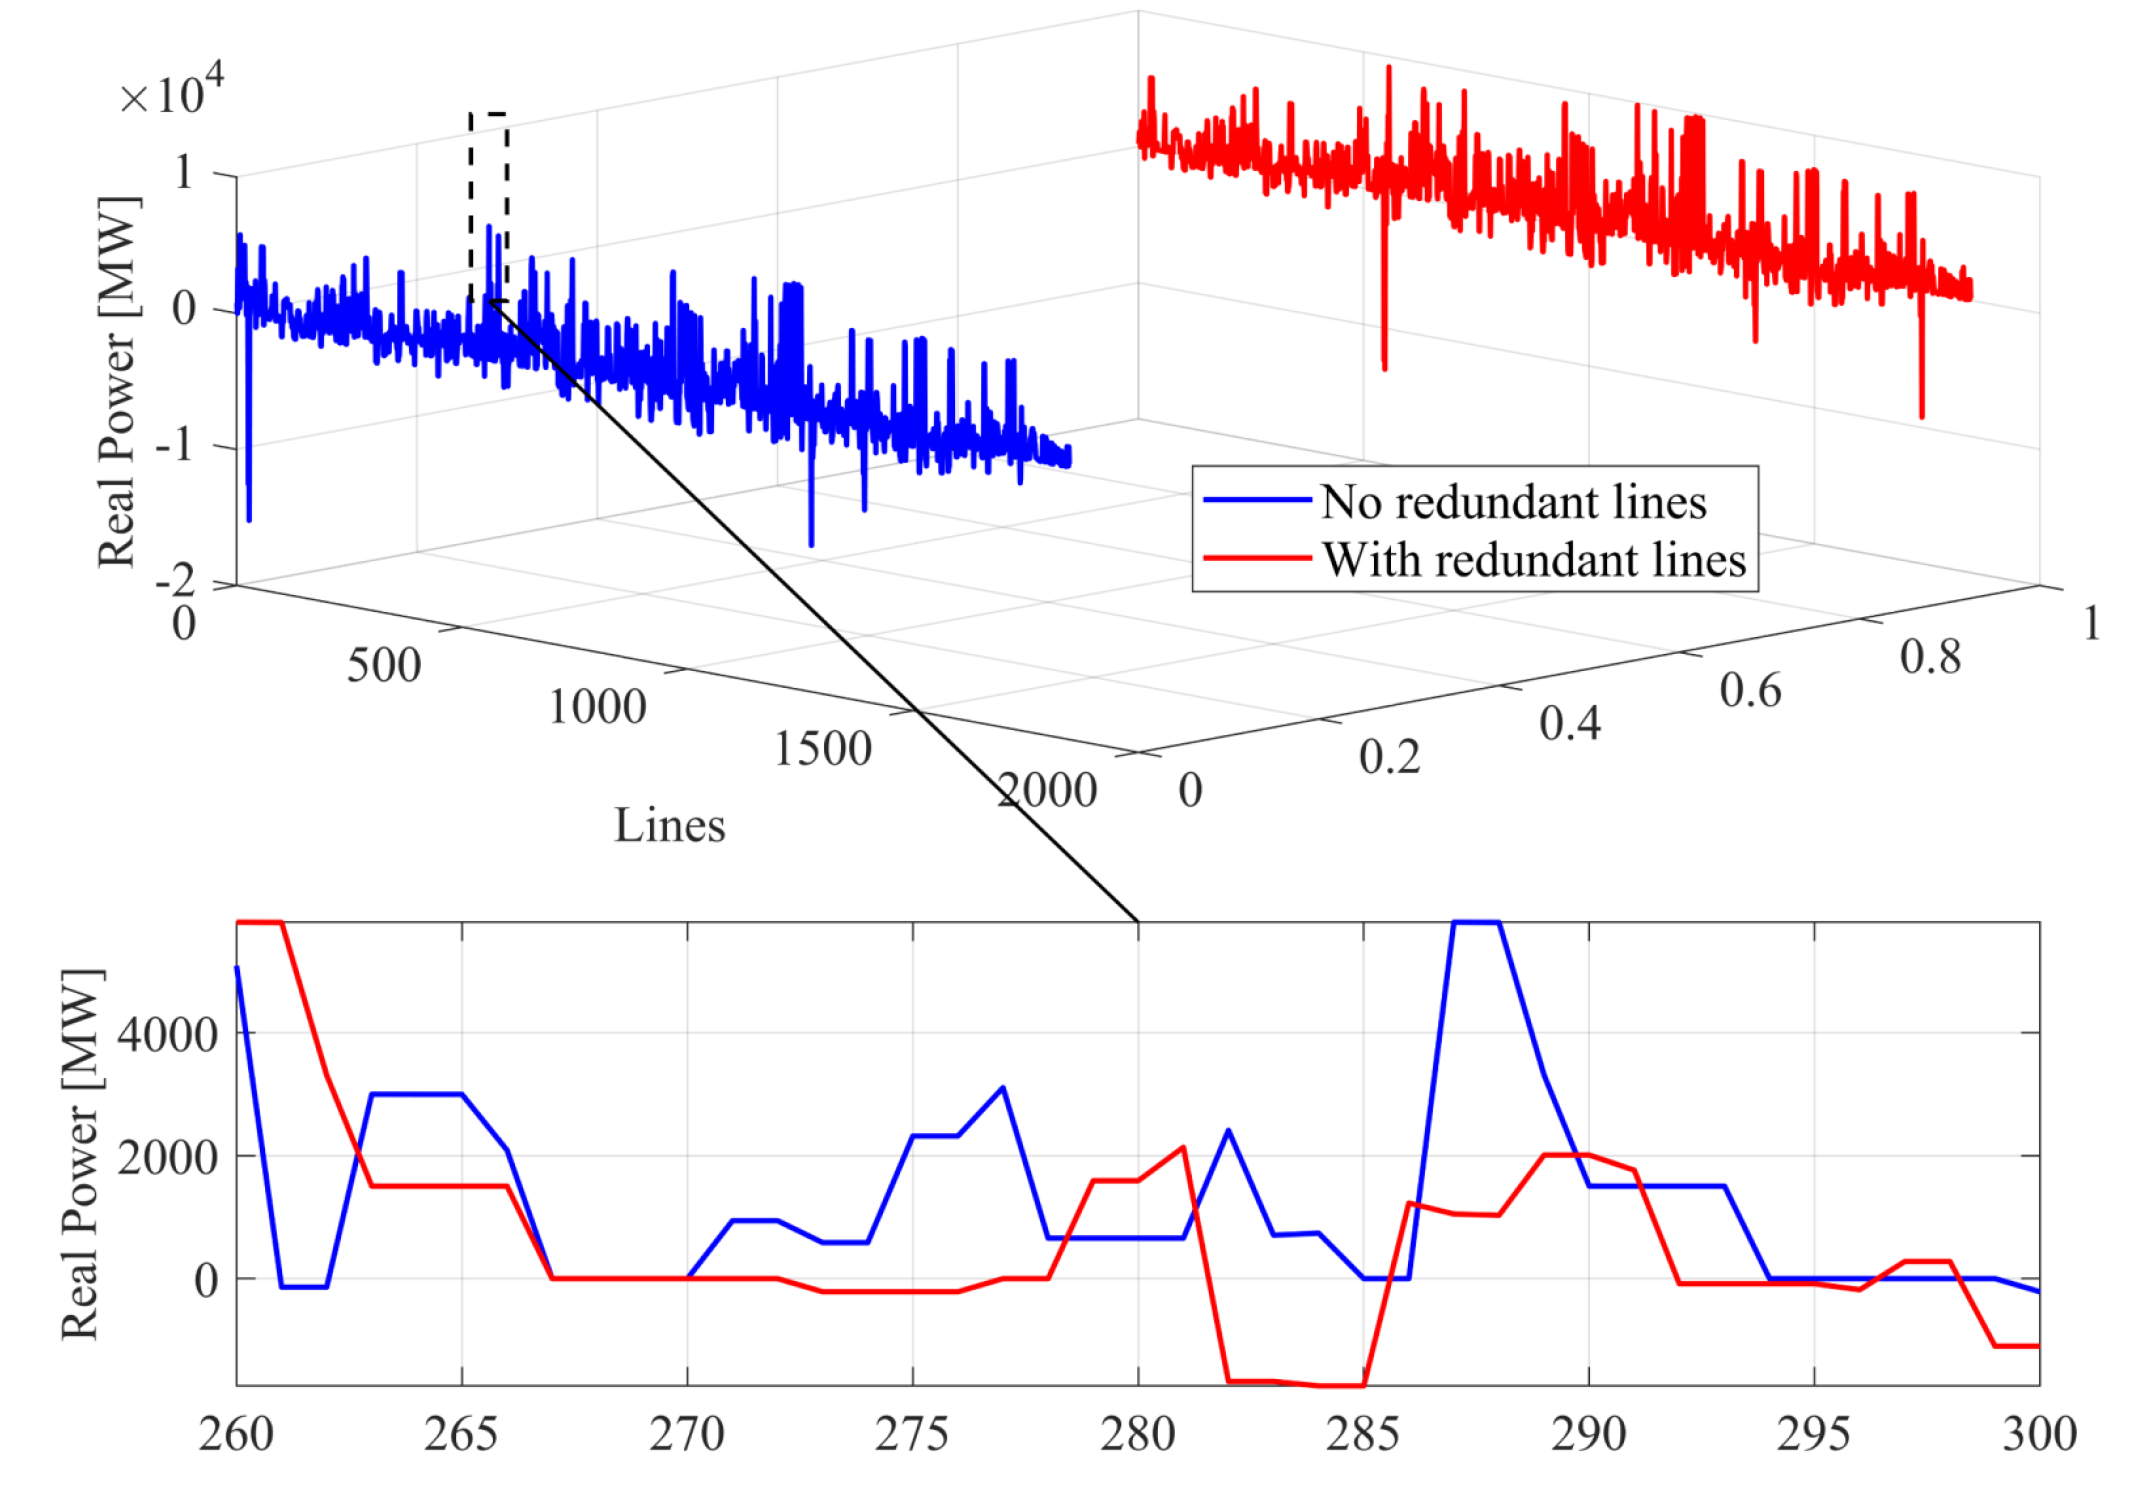
Figure 7.
Comparative analysis of reactive power with and without redundant lines.
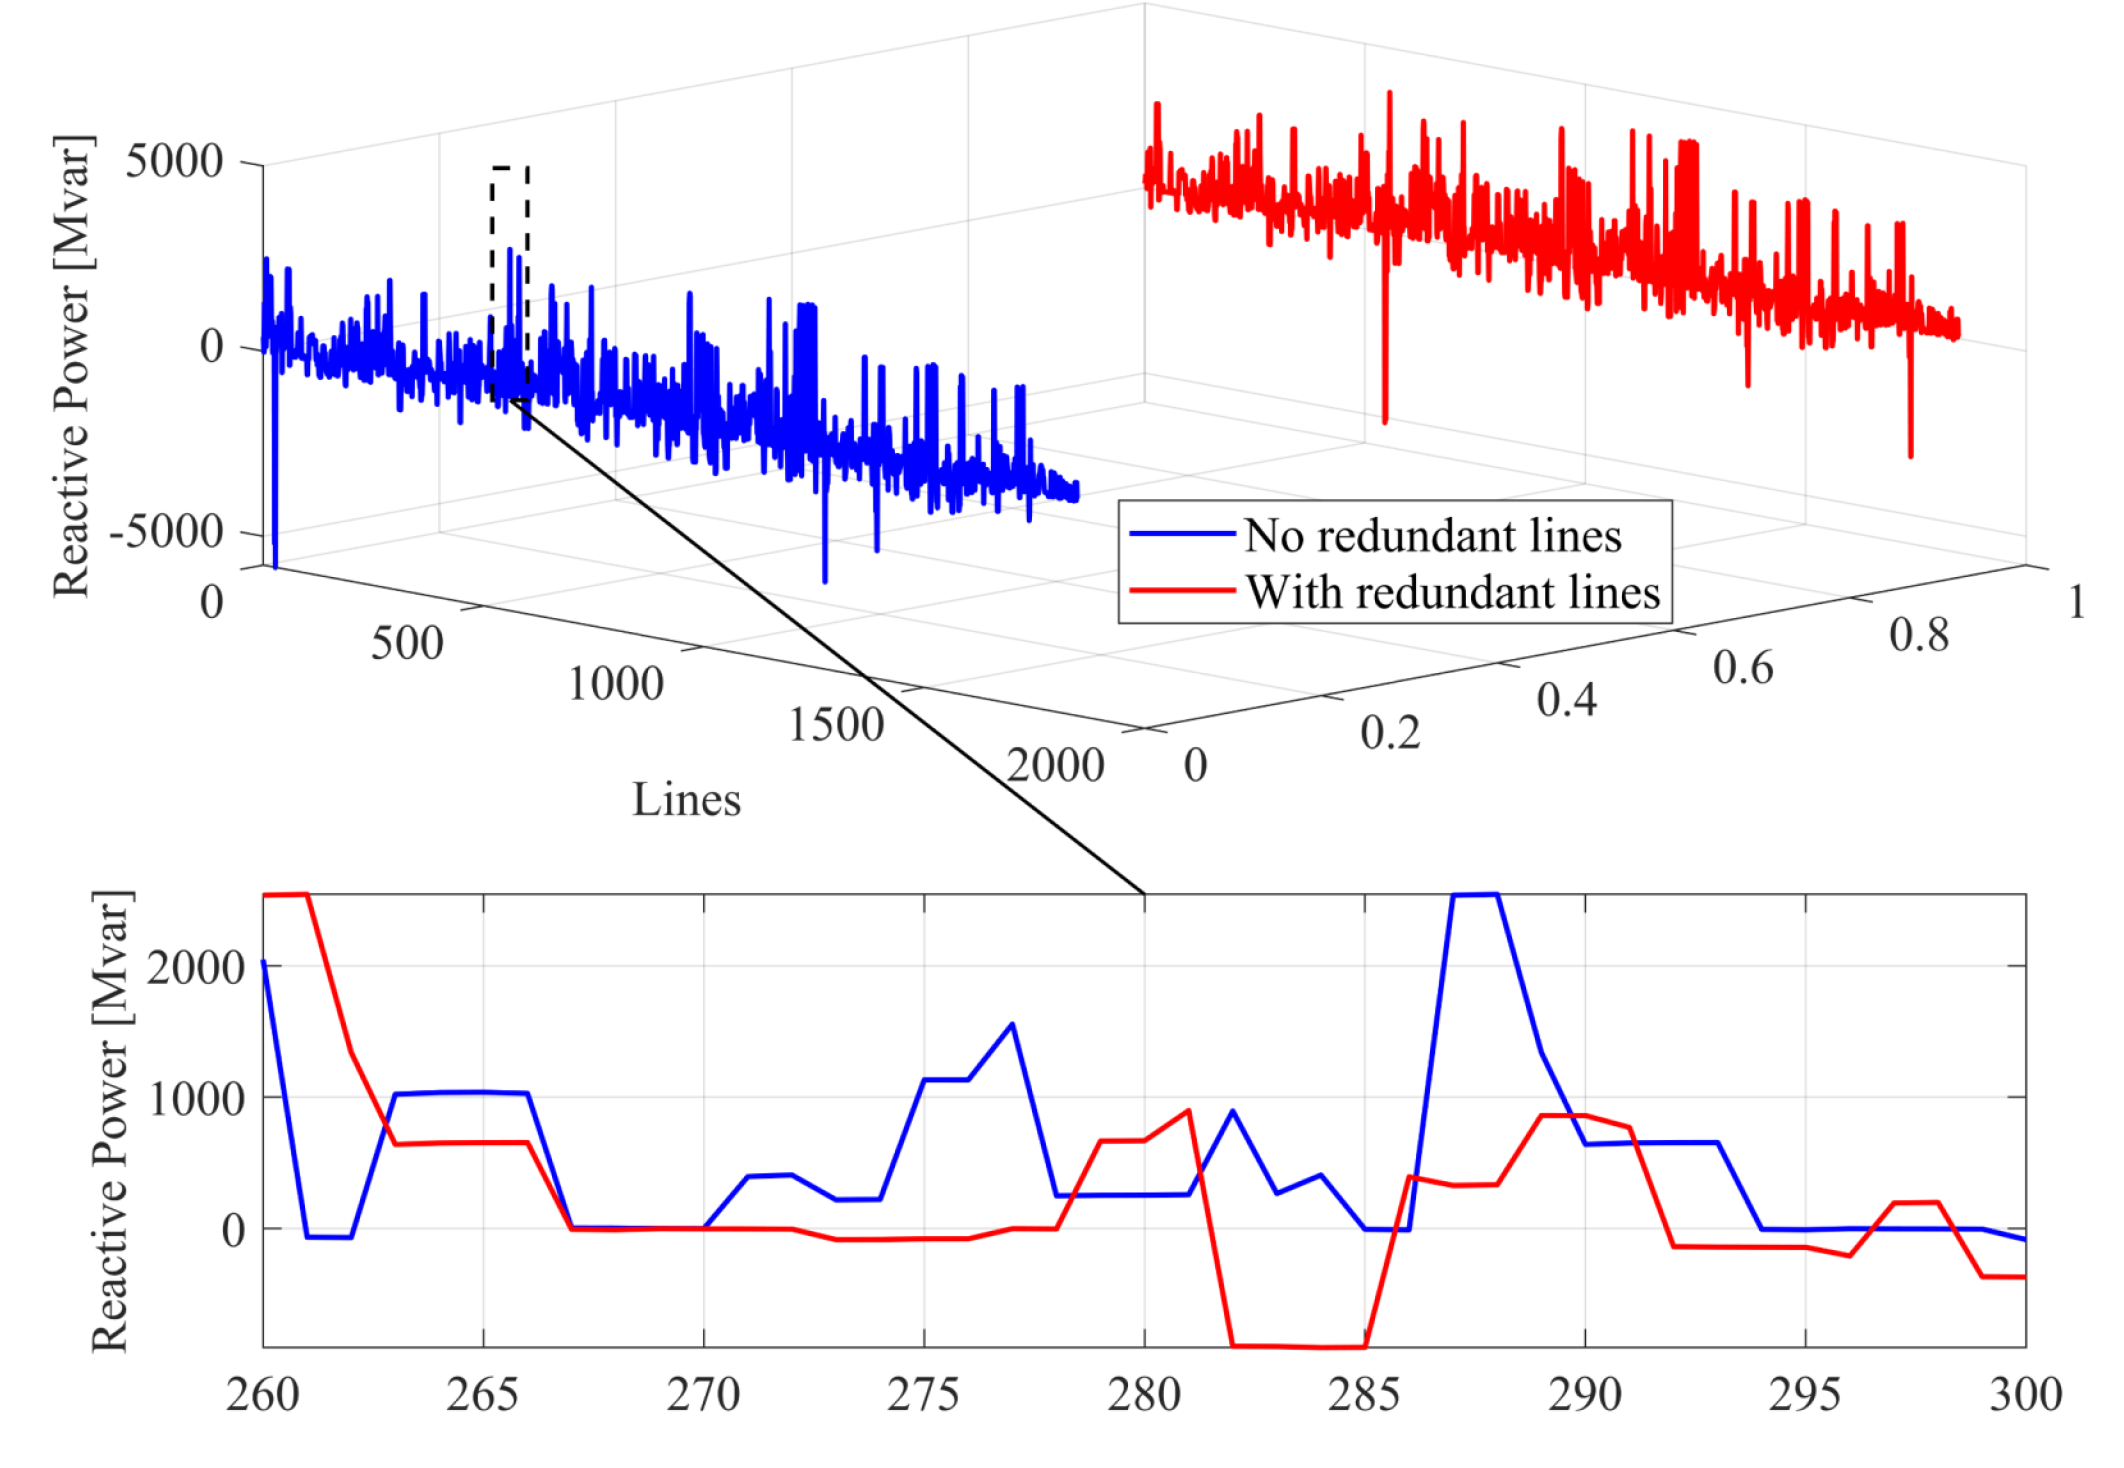
Figure 8.
Comparative analysis of loadability y with and without redundant lines.
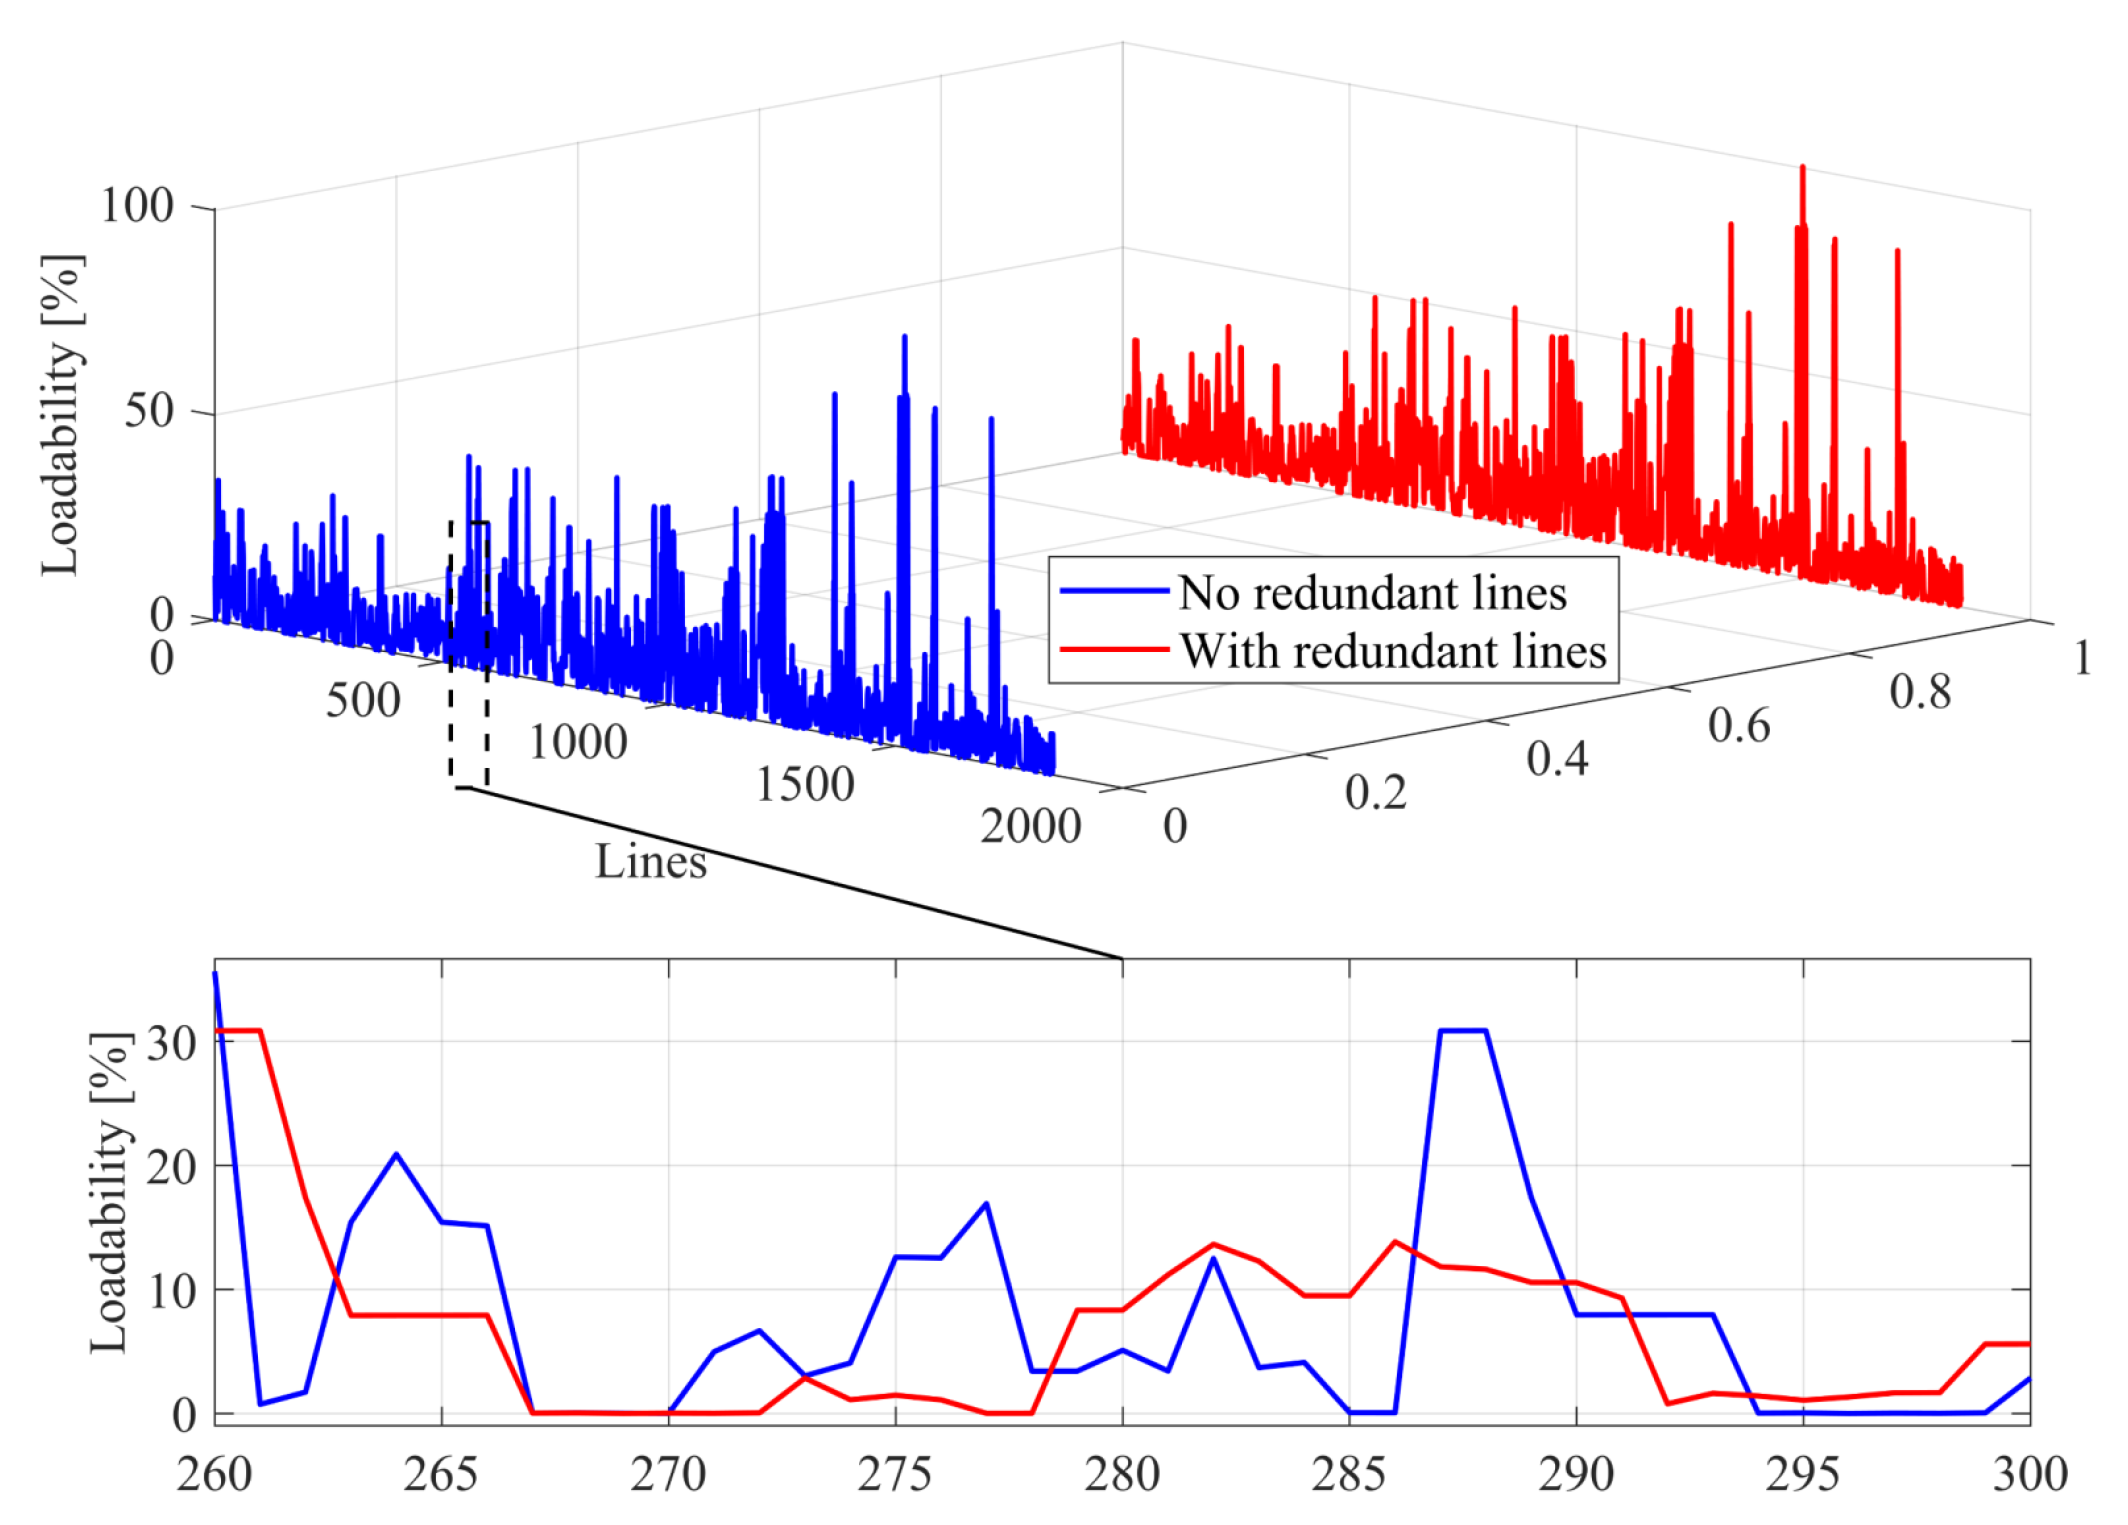
Figure 9.
Comparative analysis of real power losses with and without redundant lines.
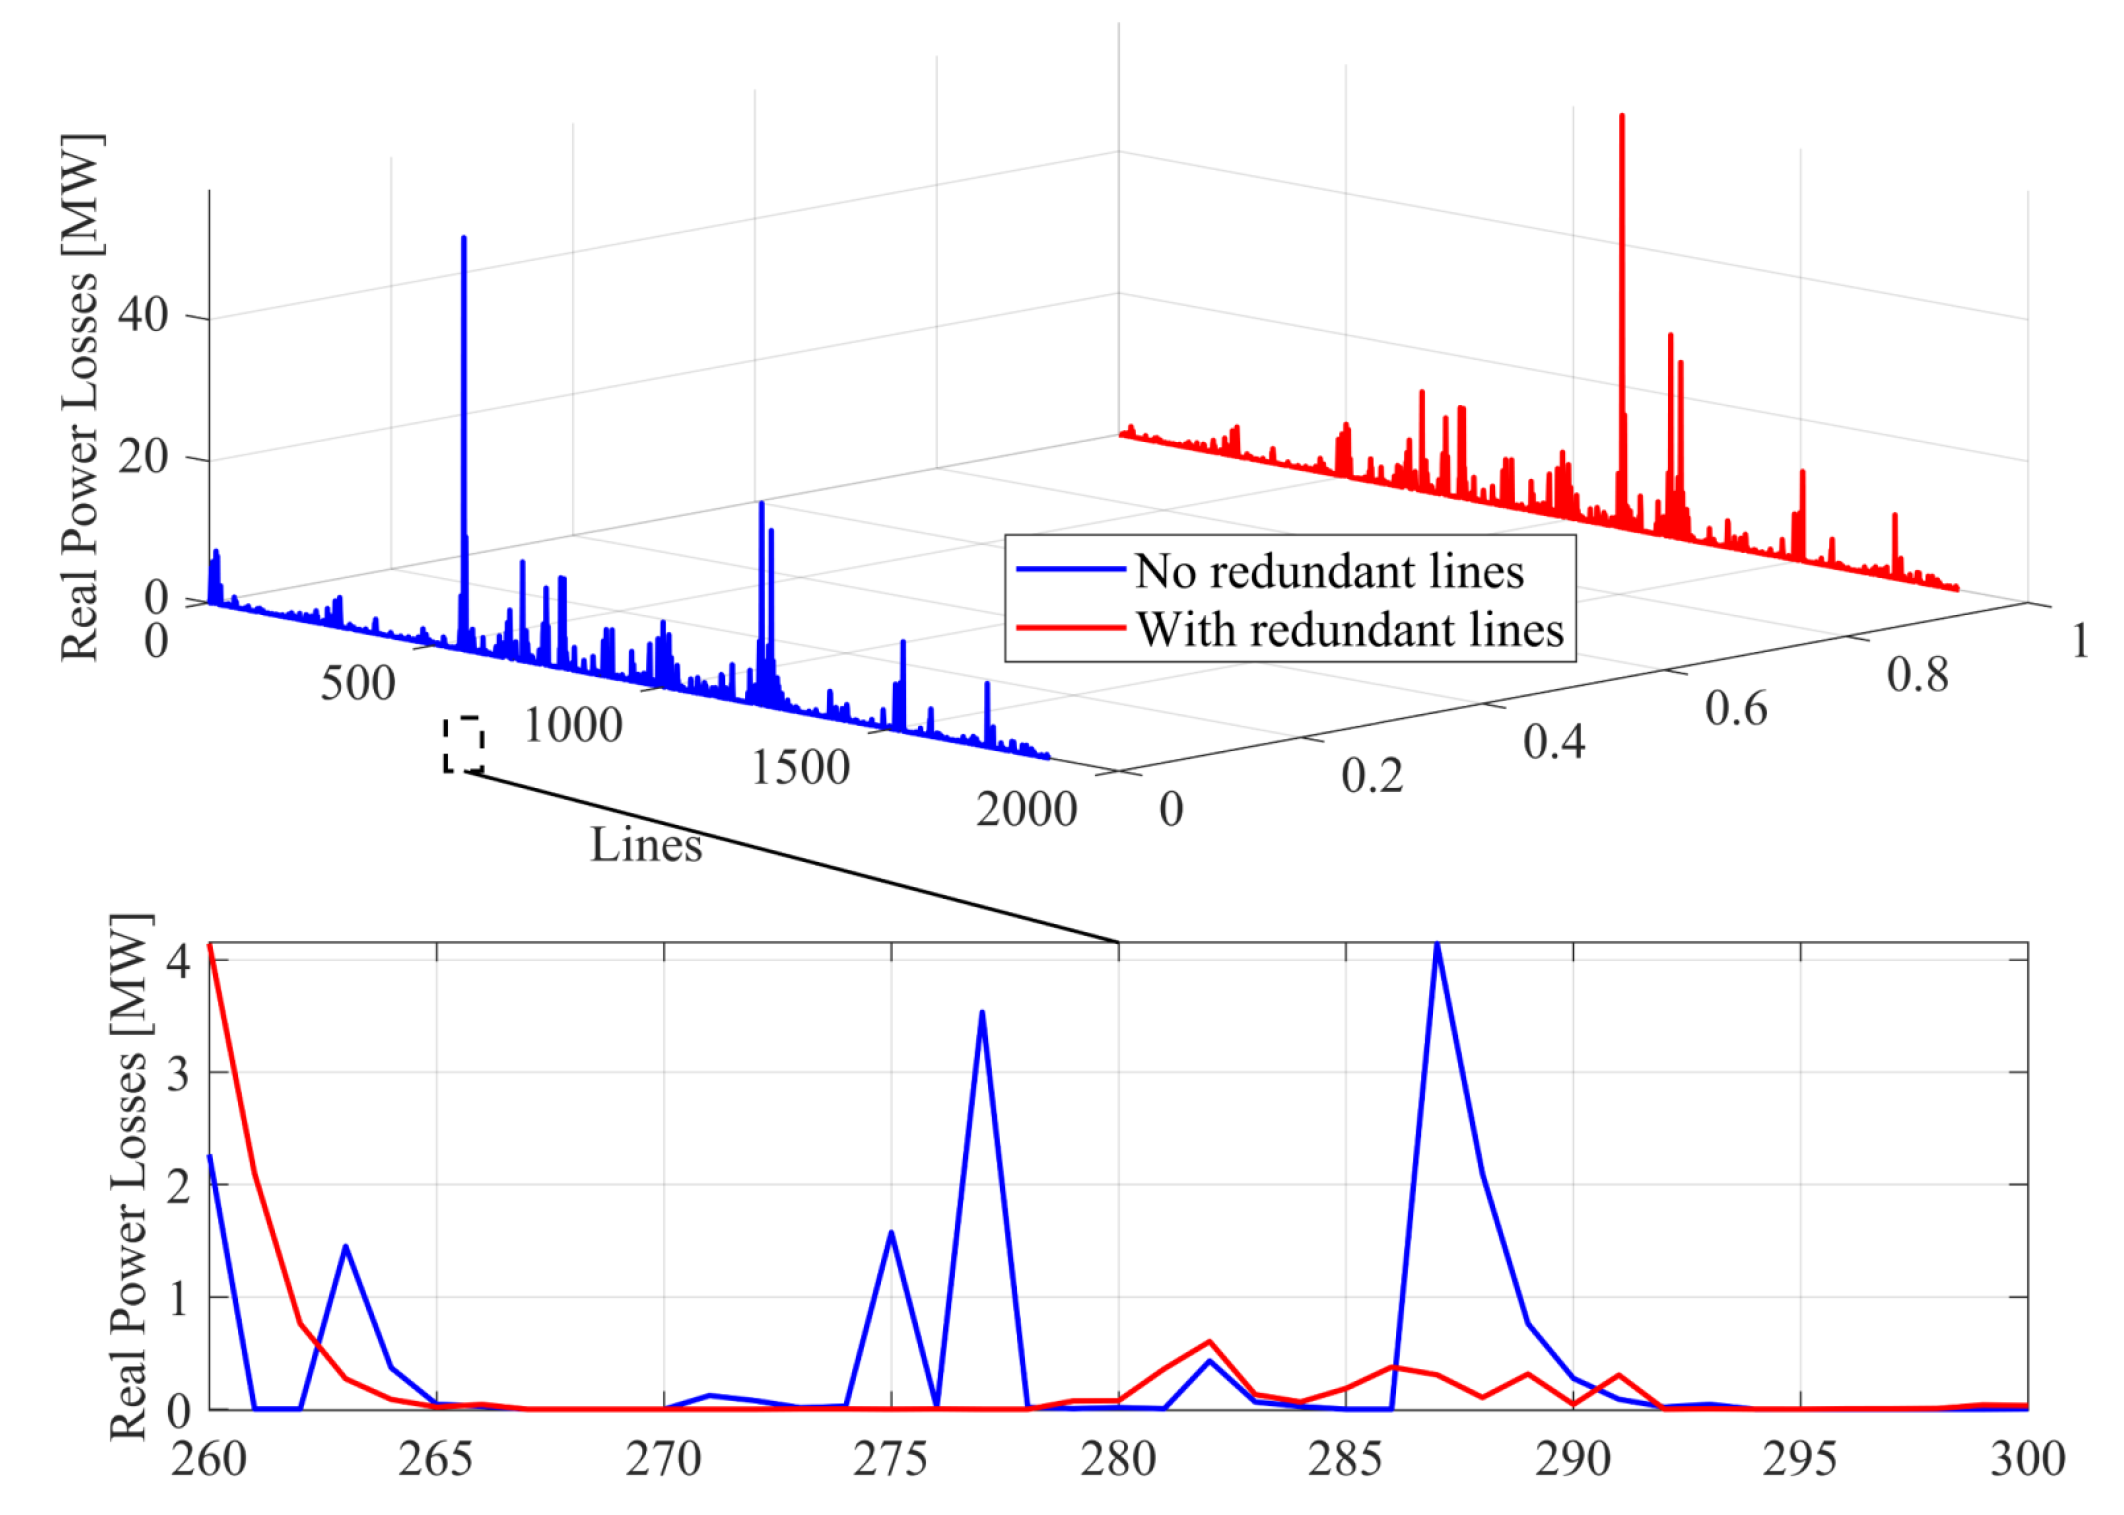
Figure 10.
Comparative analysis of reactive power losses with and without redundant lines.
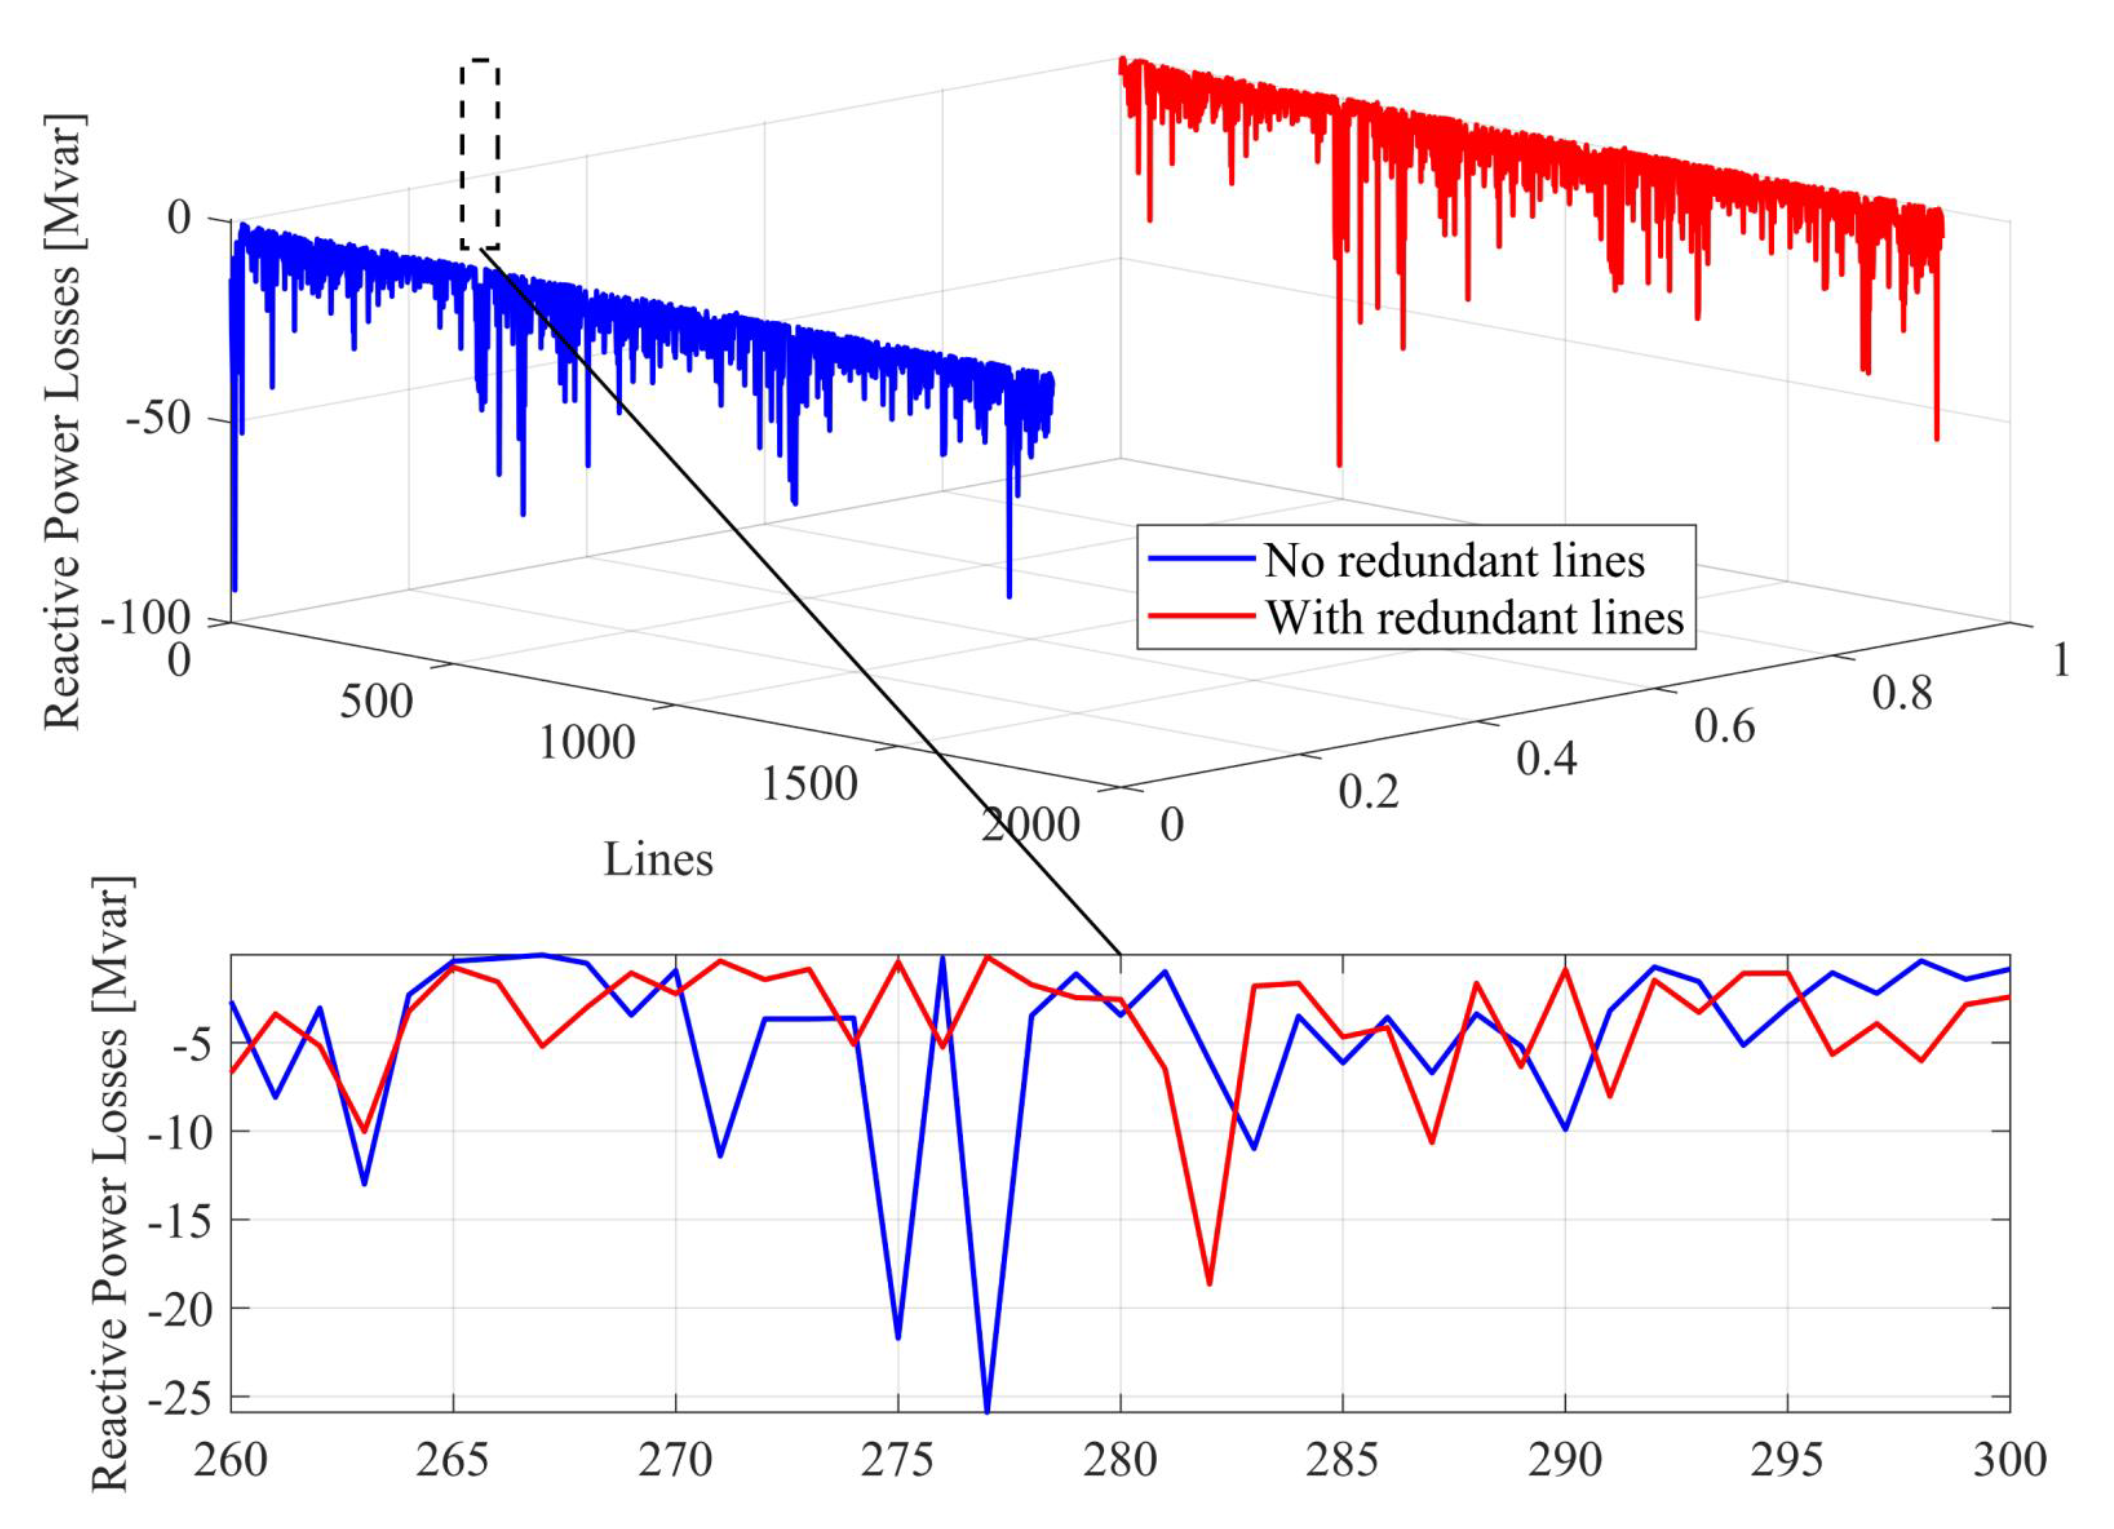

Table 1.
Description of the variables used in Algorithm 1.
| Symbol | Description |
|---|---|
| Failure rate of component i (failures/hour) | |
| Repair rate of component i (repairs/hour) | |
| Number of failures of component i | |
| Total operation time of component i | |
| Number of repairs of component i | |
| Total repair time of component i | |
| Random failure time generated for i | |
| Random repair time generated for i | |
| Mean Time Between Failures of component i | |
| Mean Time To Repair of component i | |
| Availability of component i |
Table 2.
Description of the variables used in Algorithm 2.
| Symbol | Description |
|---|---|
| Node object of type ElmTerm | |
| Node voltage in per unit (p.u.) | |
| Phase angle of the node in degrees (∘) | |
| Line object of type ElmLine | |
| Line type (associated object) | |
| Line length (km) | |
| Nodes connected at the line ends | |
| Current at each line end (kA) | |
| Apparent power at each line end (MVA) | |
| Active power at each line end (MW) | |
| Reactive power at each line end (Mvar) | |
| Line load percentage (%) | |
| Mean Time Between Failures of the component | |
| Mean Time To Repair of the component | |
| A | Operational availability of the component |
Table 3.
Description of the variables used in Algorithm 3.
| Symbol | Description |
|---|---|
| Vector of Mean Time Between Failures | |
| Vector of Mean Time To Repair | |
| T | System contingency table |
| n | Total number of buses |
| Maximum number of redundant lines considered | |
| Number of independent algorithm repetitions | |
| Number of iterations per run | |
| P | Population size (number of individuals) |
| k | Index of the independent run |
| m | Number of redundant lines under evaluation |
| Bus value at row i and column j of the population | |
| Objective function value for a solution L | |
| Best objective value recorded in a run | |
| t | Iteration index in a run |
| Solution (individual) i within the population | |
| M | Teacher solution (current best individual) |
| New solution generated for individual i | |
| Difference between two selected individuals | |
| Best solution obtained in run k for m lines | |
| Final optimal solution for m redundant lines |
Table 4.
Result of optimization using TLBO.
| m | Mean | CV | Selected lines | |
|---|---|---|---|---|
| 1 | 0.06908 | 0.02583 | 0.374 | LN_0711 |
| 2 | 0.01448 | 0.01827 | 1.262 | LN_1098 LN_0061 |
| 3 | 0.00429 | 0.00438 | 1.021 | LN_1011 LN_1058 LN_0871 |
| 4 | 0.00389 | 0.00443 | 1.140 | LN_0076 LN_0008 LN_1011 LN_0871 |
| 5 | 0.00564 | 0.00600 | 1.064 | LN_0076 LN_0008 LN_1011 LN_1008 LN_0871 |
Disclaimer/Publisher’s Note: The statements, opinions and data contained in all publications are solely those of the individual author(s) and contributor(s) and not of MDPI and/or the editor(s). MDPI and/or the editor(s) disclaim responsibility for any injury to people or property resulting from any ideas, methods, instructions or products referred to in the content. |
© 2025 by the authors. Licensee MDPI, Basel, Switzerland. This article is an open access article distributed under the terms and conditions of the Creative Commons Attribution (CC BY) license (http://creativecommons.org/licenses/by/4.0/).
Copyright: This open access article is published under a Creative Commons CC BY 4.0 license, which permit the free download, distribution, and reuse, provided that the author and preprint are cited in any reuse.