Submitted:
29 September 2025
Posted:
30 September 2025
You are already at the latest version
Abstract
This study was designed to systematically investigate the influence of variations in the microscopic silicon crystal size on the electrochemical performance of pre-magnesium silicate anode materials, under the premise that the macroscopic particle size remains consistent. Through precise control of the macroscopic particle distribution of silicon materials, the study focused on exploring the mechanisms by which different microscopic grain sizes affect the reaction kinetics, structural stability during the pre-magnesium process, and the properties of the final composite products.The research findings indicate that both relatively small and large silicon crystals are disadvantageous for cycling performance. When the silicon crystal grain size is 5.79 nm, the composite material demonstrates a relatively high overall capacity of 1442 mAh/g and excellent cycling stability. After 100 cycles, the capacity retention rate reaches 83.82%. EIS analysis reveals that larger silicon crystals exhibit a higher lithium-ion diffusion coefficient. As a result, the silicon electrodes show more remarkable rate performance. Even under a high current density of 1C, the capacity of the material can still be maintained at 1044 mAh/g.
Keywords:
Silicon oxide
; Pre magnesium
; Grain size
; Coating
; Lithium-ion batteries
1. Introduction
Silicon-based materials, particularly silicon oxide (SiOx) anodes, are considered an ideal choice for the next-generation high-energy-density lithium-ion batteries [1,2,3,4,5,6,7]. This is because their theoretical capacity far surpasses that of traditional graphite. Nevertheless, the low initial Coulombic efficiency has emerged as a central issue that significantly hinders their commercialization [8,9,10]. This problem mainly stems from the irreversible consumption of a substantial amount of lithium from the cathode during the formation of the solid electrolyte interface (SEI) film in the first charge-discharge process. To overcome this bottleneck, the "pre-magnesiation" technique has been developed [11,12,13,14]. This technique involves the pre-introduction of active magnesium sources into the electrode to compensate for lithium loss, thereby significantly enhancing the initial Coulombic efficiency and improving the cycling performance [15]. As a result, it has become a focal point of research in both the industrial and academic arenas.
Although the pre-magnesiation strategy has demonstrated notable effectiveness, existing research has predominantly concentrated on optimizing the types of magnesium sources, their addition amounts, and process parameters [16,17]. However, there is a lack of in-depth exploration regarding how the key structural parameters of SiOx materials themselves, especially the microscopic grain size, influence the pre-magnesiation process and the ultimate electrochemical performance.The microscopic structure of a material is the fundamental determinant of its macroscopic properties. SiOx materials are composites in which nanoscale silicon grains are uniformly dispersed within a silica matrix [18,19,20]. The size of the internal silicon grains directly impacts the material's specific surface area, reactivity, and volume change behavior. In previous studies, the factors of microscopic silicon grain size and macroscopic particle size have often been conflated. This is because alterations in the preparation process typically result in concurrent changes in both, making it challenging to distinguish their individual mechanisms [21,22,23,24,25]. In light of this, this study innovatively endeavors to isolate the interfering factor of macroscopic particle size. Through precise process control, a series of pre-magnesiated SiOx model materials with similar macroscopic particle size distributions but significantly different microscopic silicon grain sizes were prepared. The aim was to independently unveil the influence of the microscopic silicon grain size, a core structural parameter, on the pre-magnesiation process and the performance of the resultant products.
The key research contents of this thesis are as follows: First, a systematic characterization of the macroscopic physical properties and microscopic structures of the prepared series of materials was conducted to ensure a consistent macroscopic particle size while maintaining a gradient distribution of microscopic grain sizes. By assembling half-cells, the electrochemical performance of different materials was comprehensively evaluated. Particular emphasis was placed on analyzing the differences in their initial Coulombic efficiency, cycling stability, and rate performance. Additionally, a structure-activity relationship among the microscopic structure, pre -magnesiation behavior, and electrochemical performance was established.This research aims to deepen the understanding of the pre-magnesiation mechanism at the microscopic level, providing clear theoretical guidance and experimental evidence for the optimization of the preparation of high-performance and long-lifespan silicon-based anode materials through microscopic structure design.
2. Materials and Methods
2.1. Experimental Materials
The raw material silicon powder (Si) is a crystalline silicon material. The silica powder (SiO2) used is a white powder composed of irregularly shaped amorphous micrometer-sized particles. The particle size of both materials is approximately 10 μm. The Mg particles are ellipsoidal, with a particle size of around 250 μm, and present as a white powder.
2.2. Synthesis Method (Synthesis of M-SiOx and C@M-SiOx)
The mass ratio of Si powder, SiO2 powder and Mg powder was carefully designed to achieve a magnesium content of approximately 8%. During the synthesis process, the formation of silicon crystallites was significantly influenced by temperature, with different synthesis temperatures resulting in variations in silicon crystallite size. As illustrated in Scheme 1,Pre-magnesiated silicon oxide (M-SiOx) samples containing different silicon crystallite structures were synthesized under a reduced-pressure furnace atmosphere (PVD, less than 1 Pa). The silicon oxide precursor was heated and maintained at temperatures of 1200 °C, 1220 °C, 1240 °C and 1260 °C, respectively, yielding samples labeled as M1-SiOx, M2-SiOx, M3-SiOx, and M4-SiOx. In this study, CH4 and C2H2 were selected as carbon sources (QCH4:QC2H2 =1:1), and the aforementioned M-SiOx samples were further modified through carbon coating via the CVD method. As a result, carbon-coated M-SiOx anode materials (C@M-SiOx) were successfully prepared and labeled as C@M1-SiOx, C@M2-SiOx, C@M3-SiOx, and C@M4-SiOx, respectively.
2.3. Material Characterization
The crystallinity of the samples was performed by XRD (Bruker, D8 ADVANCE, Germany). The Renishaw Raman spectrometer has a spectral range centered at 1050 cm-1, spanning from 98.58 to 1869.89 cm-1, with a step size of 1μm and an intensity of 5%. The single-point scanning time is 0.5s, and a 50μm x 50μm area is selected for scanning. For particle size measurement, a laser particle size analyzer (Malvern 3000) was employed.Scanning electron microscopy (SEM) (HITACHI S-4800) was used to analyze the morphology of the samples. For electrical characterizations, the electrode was assembled into CR2032 button cells in a glove box at the atmosphere of argon.All the cells were assembled in an Ar-filled glovebox at an oxygen level below 0.1 ppm and aged for 24 h at 25 °C before the electrochemical test. The coin cells were tested using a battery cycler system (LANDCT2001A) at 25 °C. The voltage range was 0.005-1.5 V, the constant current was approximately 1/10 C , and the voltage was held at 0.005 V . EIS measurements of various cells were recorded by a CHI604D Electrochemistry System with the frequency range of 106~10-2 Hz .
3. Results and Discussion
3.1. Characterization of M-SiOx and C@M-SiOx
Through precise process control, pre-magnesiated SiOx materials with a similar macroscopic particle size distribution were synthesized. As shown in Figure 1(a), the D50 particle size of these materials is 6.02 μm. M-SiOx samples were synthesized under different constant temperature conditions. At 1200 °C, M1-SiOx contains silicon crystallites with a size of 2.43 nm, and no silicate precipitation was observed, this is attributed to the insufficient generation of gaseous reaction components when the temperature is below 1200 °C. Upon heating to 1220 °C, silicon microcrystals and magnesium silicate precipitates formed simultaneously, with the crystallite size in M2-SiOx measured at 3.98 nm. At 1240 °C, the diffraction peaks corresponding to silicon and silicate phases in M3-SiOx become more pronounced, indicating a crystallite size of 5.41 nm. When the synthesis temperature reaches 1260 °C or higher, the material's surface or interior changes color from black to yellow, the silicon crystallites grow significantly, and the crystallite size of M4-SiOx reaches 6.86 nm. In this study, Methane and acetylene mixed gas as the gas source selected as the carbon source, and the carbon content was controlled at approximately 4.5%. The carbon-coated Mg-SiOx samples of XRD are presented in Fig. 1(b). No distinct diffraction peak characteristic of graphite was observed in the XRD pattern, indicating that the carbon formed after high-temperature coating exhibited an amorphous structure. This process did not cause significant damage to the original crystal structure. However, after carbon coating, the silicon crystallites in C@Mg-SiOx exhibited relative growth compared to those in the uncoated M-SiOx under high-temperature treatment, with sizes of 3.98 nm, 4.87 nm, 5.79 nm, and 8.13 nm, respectively. The N2 adsorption-desorption isotherms of the materials under diverse silicon crystal conditions was measured( Figure 1(c)). The SiOx particles exhibit a relatively low BET value of 1.5 m2/g. Subsequent to the pre-magnesiation of SiOx, an interesting phenomenon was noted: an increase in the size of silicon crystals was accompanied by a corresponding increase in the specific surface area . The measured specific surface area values were 6.2 m2/g, 10.87 m2/g, 19.65 m2/g, 32.21 m2/g, and 41.15 m2/g, respectively.This phenomenon can be attributed to the intricate structural rearrangement and the synergistic evolution of multi-scale pores that occur during the high temperature treatment of the materials. Specifically, during the thermal induction stage, smaller silicon nanocrystals, due to their relatively high surface energy, tend to dissolve. The silicon atoms within these nanocrystals diffuse through the magnesium silicate matrix or the amorphous silicon oxide layer. Significantly, this material migration process does not result in densification. rather, it leaves behind an abundance of intergranular pores at the original positions of the small nanocrystals and forms porous interfacial regions around the larger crystals, thereby significantly augmenting the mesopore volume. Furthermore, the magnesium doping process itself etches and reconstructs the surrounding SiOx matrix, giving rise to new phases such as magnesium silicate. The interfaces between these newly formed phases and silicon crystals typically harbor a substantial number of defects and pores. After the coating process, the BET value of C@M-SiOx was regulated to 5.7 m2/g.
The particle size and morphology of the carbon-coated C@M-SiOx were examined using SEM, as shown in Figure 2(a-d). The particle size distribution was relatively uniform, with an average size of approximately 6.42 μm, which is 0.4 μm larger than the average particle size of M-SiOx (6.02 μm). This increase in size confirms the presence of a carbon layer on the material surface. The SEM images of C@M3-SiOx at high magnification are presented in Figure 2(e-f). The surface of M3-SiOx is encapsulated by a carbon layer. In combination with Raman analysis, it can be seen that the carbon layer mainly consists of disordered carbon, within which there are some graphitized regions. This amorphous-like structure abundant in disordered carbon, due to its isotropic property, is conducive to the transport of Li+. Furthermore, the carbon layer formed from the C2H2/CH4 mixed gas source exhibits a three dimensional structure. This not only enhances the mechanical stability but also effectively restrains the volume expansion of SiOx during the cycling process. The complete encapsulation gives rise to a dense and continuous conductive network, which is favorable for multi-point electrical contact among particles. The carbon bridges formed between particles contribute to the formation of a more stable conductive framework, thereby strengthening both the electron transport and the structural stability. Figure 2f(1–4) presents the EDS elemental mapping of the C@Mg-SiOx sample, demonstrating the uniform distribution of Si, O, Mg, and C throughout the material. These results confirm the successful synthesis of the carbon-coated Mg-SiOx composite.Figure 2g(1–4) depicts the characterization of the composition and structure of the carbon layer on the surface of C@Mg-SiOx. Evidently from the figure, the median value of ID/IG is 1.1. The four samples exhibit remarkable similarity not only in the coating structure but also in composition. This circumstance permits the elimination of the carbon-coating factor during the subsequent performance analysis, thereby isolating the single variable of silicon crystal size.
3.2. Electrochemical Properties of C@M-SiOx
The first-cycle voltage-capacity profiles of C@M-SiOx are presented in Fig. 3(a). The specific capacities of the four samples were 1418 mAh/g, 1429 mAh/g, 1442 mAh/g and 1431 mAh/g, respectively. The corresponding initial Coulombic efficiencies were 82.01%, 82.94%, 83.33%, and 83.50%. According to the results, both the first-cycle capacity and the initial Coulombic efficiency increase with increasing silicon crystallite size, indicating that crystalline silicon (c-Si) contributes a higher capacity compared to the amorphous SiOx matrix. As the silicon crystallite size increases, the amount of inactive interfaces (e.g., Si/SiO2 interfaces) decreases, the lithium-ion diffusion barrier is reduced, and the alloying reaction becomes more complete, thereby enhancing the overall specific capacity. Under the same carbon content, the continued growth of small silicon crystallites reduces side reactions with the electrolyte (e.g., excessive SEI film formation), which may contribute to the improved initial Coulombic efficiency.
The dQ/dV curves of the first charge and discharge processes for C@M-SiOx are presented in Figure 3(b). During the discharge process, the alloying reaction of the coating materials occurred below 0.25 V, while the dealloying reaction took place at approximately 0.5 V during charging. The reduction peak observed at 0.1 V corresponds to the lithium insertion process in amorphous silicon. At this stage, Li+ reacted with amorphous silicon to form the LiₓSi phase. During the first charging process, as the cell voltage increased, a distinct oxidation peak appeared at around 0.45 V [26,27], which corresponds to the lithium extraction process from the C@Mg-SiOx composite. No clear redox peaks associated with amorphous carbon were observed in the curves, which may be attributed to the overlapping of strong oxidation and reduction peaks from silicon, thereby masking the weaker signals from amorphous carbon.
Figure 4(a) presents the cycling performance and Coulombic efficiency of C@M-SiOx anode materials under different silicon microcrystalline structures. When the silicon crystallite size is 3.98 nm, the large interfacial bonding energy between the silicon crystal and the amorphous matrix may lead to Si enrichment, which negatively affects cycling stability. The capacity retention rate of C@M1-SiOx is 81.84%. As the silicon crystallite size increases, the formation of amorphous Li-rich Li-Si phases during charging becomes relatively less significant, resulting in improved cycling performance. The capacity retention rates of C@M2-SiOx and C@M3-SiOx reach 82.54% and 83.82%, respectively. However, the capacity retention rate of C@M4-SiOx is only 75.68%, which can be attributed to the larger crystallite size of 8.13 nm that facilitates the formation of the amorphous Li-rich phase, leading to premature failure of the silicon electrode. By precisely controlling the silicon crystallite size, the electrochemical performance of C@M-SiOx can be effectively optimized. Throughout the long-term cycling process, the Coulombic efficiency of the electrodes approaches 99.89%, indicating that the amount of Li+ intercalating and deintercalating between the electrodes is nearly balanced after material activation.
Figure 4(b) shows the rate performance comparison of C@M-SiOx prepared at different different silicon crystal sizes. Under a high current density of 1C, the capacity of C@M4-SiOx can still be sustained at 1044 mAh/g, whereas that of C@M1-SiOx decays to 980 mAh/g. The silicon electrodes with larger grain sizes demonstrate excellent rate performance. This is because lithium has a higher diffusion rate towards the broader grain boundaries. An increase in the grain size has a positive impact on the rate performance. However, if the grain size is excessively large, the capacity decay rate under high-rate conditions also becomes significant. The discrepancy in Coulombic efficiency during cycling and rate tests further suggests that the reversibility of the electrode with silicon crystals of 5.5 nm is superior to that of electrodes with other silicon crystal sizes.
The relationship between grain size and the formation of the amorphous Li-rich (a-Li) phase can be explained as follows(Figure 5). It is assumed that the grain boundary serves as a lithium diffusion channel rather than a lithium storage site. At the initial stage of lithium insertion, lithium ions preferentially diffuse into the grain boundaries, as the activation energy for lithium diffusion into the boundary is lower than that required to enter the grain interior, resulting in the formation of a Li-depleted (lean) a-Li phase along the grain boundary. As lithium insertion progresses, lithium subsequently diffuses from the grain boundaries into the grain interior, independent of surface diffusion from the particle exterior. Meanwhile, due to the high lithium concentration near the grain boundary, silicon with larger grain size is more prone to form an a-Li-rich phase, especially when the grain boundary is relatively wide, which can lead to greater strain accumulation. In contrast, a smaller grain size can effectively suppress the formation of the a-Li-rich phase and thereby enhance the cycling stability of the material.
Figure 6 depicts the STEM dark-field images (DF-I) of magnesium-doped SiOx with varying grain sizes. This figure showcases the microstructure of magnesium (Mg)-doped non- stoichiometric silicon oxide (SiO2) materials.The image contrast (the contrast between black and white) predominantly arises from differences in crystal orientation (diffraction conditions). The bright white regions correspond to grains that satisfy the Bragg diffraction conditions. The image vividly exhibits a distinct black-and-white contrast. Among them, the uniformly sized and well-defined white bright spots are nanocrystals formed subsequent to magnesium doping.These nanocrystals are evenly embedded within the gray-black amorphous SiO2 matrix, thereby forming a typical "nanocrystal-amorphous" composite structure. As the grain size increases, the entire gray - black region gradually transforms into a white area. This visually confirms that magnesium doping effectively triggers the precipitation of nanoscale grains in the SiOx materials and enables precise control over the grain size.The STEM characterization further validates the above findings.
The Nyquist diagrams of C@M1-SiOx, C@M2-SiOx, C@M3-SiOx, and C@M4-SiOx are presented in Figure 7(a). The first intercept on the Z-Real axis corresponds to the electrolyte resistance (Rs), the second semicircle in the medium-frequency region is attributed to the charge transfer resistance (Rct), and the sloping line in the low-frequency region is associated with the lithium ion diffusion impedance (W) within the bulk electrode [28,29]. The EIS data, obtained by fitting the corresponding equivalent circuit model using ZView software, are summarized in Table 1. For samples with different silicon crystallite sizes, the values of Rs and Rct are nearly identical.
The plot of Z-Real versus the square root reciprocal of the lower angular frequencies (ω-1/2) is presented in Figure 7(d). The linear relationship of the fitted line follows the equation: and ,where R is the gas constant, T is the absolute temperature, A is the electrode surface area, F is Faraday’s constant, n is the number of electrons transferred per molecule during oxidation, and C is the molar concentration of Li+. The calculated values of σ (interfacial resistance) and D (diffusion coefficient) are summarized in Table 1. Among all samples, the C@M4-SiOx electrode exhibits the highest diffusion coefficient (DLi+) of 1.95 × 10⁻¹⁰ cm²·s-1, significantly higher than those of the other three electrodes. This enhancement in the diffusion coefficient can be primarily attributed to the abundant grain boundaries and the accelerated charge transfer kinetics and Li+ transport within the electrode.
4. Conclusions
Through precise process control, pre-magnesiated SiOx materials with similar macroscopic particle size distributions were synthesized. During the coating process, the coating amount was kept constant to ensure the consistency of the structure and composition of the coating layer. This approach was designed to solely investigate the impact of different silicon crystal states on the performance.The study revealed that when the silicon crystal grain size was small, the grain-boundary binding energy within the amorphous matrix was relatively high. This led to silicon enrichment, which had an adverse effect on the cycling performance. When the grain size was moderate, the formation of lithium-rich lithium-silicon alloy phases during lithiation was suppressed. As a result, the strain within the active material was reduced, and the cycling stability was enhanced.Larger silicon grains tended to facilitate the formation of lithium - rich lithium-silicon alloy phases, thereby degrading the cycling performance of the electrode. Additionally, Electrochemical Impedance Spectroscopy (EIS) analysis demonstrated that smaller silicon grains might impede the diffusion of lithium ions due to their narrow grain boundaries. In contrast, silicon electrodes with larger grains exhibited more excellent rate performance, which could be ascribed to the enhanced Li+ diffusion in wider grain boundaries.Consequently, precise control over the silicon crystal grain size can optimize the electrochemical performance of C@M-SiOx composite materials.
Author Contributions
Conceptualization, J.L and B.Z.; formal analysis, J.L.; investigation, J.L.; resources, B.Z.; data curation, J.L.; writing—original draft preparation, J.L.; writing—review and editing, J.L. ,J.S. and B.Z.; visualization, J.L.; supervision, J.S. and B.Z.; project administration, J.S. and B.Z.; funding acquisition, J.S. and B.Z. All authors have read and agreed to the published version of the manuscript.
Funding
This research was funded by the Natural Science Foundation of Inner Mongolia (2020ZD17) , the Basic Research Funds for Universities Directly under Inner Mongolia Autonomous Region (No. 2023QNJS018) and the Basic Research Funds for Universities Directly under Inner Mongolia Autonomous Region (No. 2023YKJX007).
Data Availability Statement
Data is contained within the article
Conflicts of Interest
The authors declare no conflicts of interest.
References
- Li, Z.J.; Du, M.J.; Liu, P.F.; Zhang, D.; Wang, Q.J.; Sun, H.L.; Sun, Q.J.; Wang, B. Exploring the Influence of Oxygen Distribution on the Performance of SiOx Anode Materials. J. Power Sources 2025, 625, 235720. [Google Scholar] [CrossRef]
- Xie, G.J.; Tan, X.; Shi, Z.Z.; Peng, Y.; Ma, Y.; Zhong, Y.R.; Wang, F.X.; He, J.R.; Zhu, Z.; Cheng, X.B.; Wang, G.J.; Wang, T.; Wu, Y.P. SiOx Based Anodes for Advanced Li-Ion Batteries: Recent Progress and Perspectives. Adv. Funct. Mater. 2025, 35. [Google Scholar] [CrossRef]
- Lee, S.K.; Oh, S.M.; Park, E.; Scrosati, B.; Hassoun, J.; Park, M.S.; Kim, Y.J.; Kim, H; Belharouak, I; Sun, Y. K. Highly Cyclable Lithium-Sulfur Batteries with a Dual-Type Sulfur Cathode and a Lithiated Si/SiOx Nanosphere Anode. Nano Lett. 2020, 15, 2863–2868. [Google Scholar] [CrossRef]
- Lim, K.; Park, H.; Ha, J.; Kim, Y.T.; Choi, J. Dual-Carbon-Confined Hydrangea-Like SiO Cluster for High-Performance and Stable Lithium Oon Batteries. J. Ind. and Eng. Chem. 2021, 101, 397–404. [Google Scholar] [CrossRef]
- Mu, X.; Fu, C.K.; Li, R.L.; Du, C.Y.; Gao, Y.Z.; Yin, G.P.; Zuo, P.J. High Performance SiOx Anode Enabled by AlCl3-MgSO4 Assisted Low-Temperature Etching for Lithium-Ion Batteries. J. Power Sources 2023, 557, 232537. [Google Scholar] [CrossRef]
- Long, Z.X.; Fu, R.S.; Ji, J.J.; Feng, Z.Y.; Liu, Z.P. Unveiling the Effect of Surface and Bulk Structure on Electrochemical Properties of Disproportionated SiOx Anodes. Chemnanomat 2020, 6, 1127–1135. [Google Scholar] [CrossRef]
- Wan, D.Y.; Yang, L.L.; Lv, D.; Song, R.F.; Liu, J.; Hu, W.B.; Zhong, C. Preparation of SiOx Anode with Improved Performance Through Reducing Oxygen Content, Controlling SiO2 Crystallization, and Carbon-Coating. J. Solid State Electro. 2025, 29, 2933–2942. [Google Scholar] [CrossRef]
- Zhao, J.H.; Shi, L.K.; Lang, Z.M.; Jia, G.X.; Lan, D.W.; Cui, Y.F.; Cui, J.L. Selenium Element Doping to Improve Initial Irreversibility of C/SiOx Anode in Lithium-Ion Batteries. Electroanal. Chem. 2025, 977, 118878. [Google Scholar] [CrossRef]
- Qiu, S.Y.; Huang, Z.; Fu, F.B. Enhancing Lithium Storage Performance of Carbon/SiOx Composite via Coating Edge-Nitrogen-Enriched Carbon. Int. J. Hydrogen Eenerg. 2024, 91, 1355–1364. [Google Scholar] [CrossRef]
- Liu, H.Y.; Kang, T.X.; Li, S.F.; Ma, Z.; Nan, J.M. A Temperature-Controlled Chemoswitching Aqueous Binder and In Situ Binding Strategy for Stabilizing SiOx Anodes of Lithium-Ion Batteries. " ACS Sustainable Chem. Eng. 2024, 12, 17855–17868. [Google Scholar] [CrossRef]
- Liu, B.; Liu, J.; Zhong, C.; Hu, W.B. Mg-Doped, Carbon-Coated, and Prelithiated SiOx as Anode Materials with IImproved Initial Coulombic Efficiency for Lithium-Ion Batteries. Carbon Energy 2024, 6. [Google Scholar]
- Han, J.; Jo, S.; Na, I.; Oh, S.M.; Jeon, Y.M.; Park, J.G.; Koo, B.; Hyun, H.; Seo, S.; Lee, D.; Kim, H.; Kim, J.; Lim, J.C.; Lim, J. Homogenizing Silicon Domains in SiOx Anode during Cycling and Enhancing Battery Performance via Magnesium Doping. ACS Appl. Mater. Interfaces 2021, 13, 52202–52214. [Google Scholar] [CrossRef]
- Tan, Y,; Jiang, T. T.; Chen, G.Z. Mechanisms and Product Options of Magnesiothermic Reduction of Silica to Silicon for Lithium-Ion Battery Applications. Front. Energy Res. 2021, 9, 651386. [Google Scholar]
- Xu, D.X.; Zhao, Y.M.; Chen, H.X.; Lu, Z.Y.; Tian, Y.F.; Xin, S.; Li, G.; Guo, Y.G. Reduced Volume Expansion of Micron-Sized SiOx via Closed-Nanopore Structure Constructed by Mg-Induced Elemental Segregation. Angew. Chem. Int. Edit. 2024, 63, e202401973. [Google Scholar] [CrossRef] [PubMed]
- Wu, R.X.; Du, X.F.; Liu, T.; Zhuang, X.C.; Guan, P.; Zhang, B.Q.; Zhang, S.H.; Gao, C.H.; Xu, G.J.; Zhou, X.H.; Cui, G.L. Robust and Fast-Ion Conducting Interphase Empowering SiOx Anode Toward High Energy Lithium-Ion Batteries. Adv. Energy Mater. 2024, 14. [Google Scholar] [CrossRef]
- Yang, L.L.; Song, R.F.; Wan, D.Y.; Ji, S.; Liu, J.; Hu, W.B.; Zhong, C. Magnesiothermic Reduction SiO Coated with Vertical Carbon Layer as High-Performance Anode for Lithium-Ion Batteries. J. Energy Storage 2024, 99, 113440. [Google Scholar] [CrossRef]
- Raza, A.; Jung, J.Y.; Lee, C.H.; Kim, B.G.; Choi, J.H.; Park, M.S.; Lee, S.M. Swelling-Controlled Double-Layered SiOx/Mg2SiO4/SiOx Composite with Enhanced Initial Coulombic Efficiency for Lithium-Ion Battery. ACS Appl. Mater. Interfaces 2021, 13, 7161–7170. [Google Scholar] [CrossRef]
- Zou, J.H.; Huang, Y.; Xie, Y.Y.; Du, X.P.; Chen, C.; Zhou, J.H.; Bi, Z.; Xuan, X.D.; Guo, Y.C. Tang, Y. Zhang, A.B.; Yang, CH. Tuning the Stable Interlayer Structure of SiOx-Based Anode Materials for High-Performance Lithium-Ion Batteries. J. Mater. Sci. 2025, 60, 8449–8463. [Google Scholar] [CrossRef]
- Huang, X.Z.; Shea, J.; Liu, J.X.; Hagh, N.M.; Nageswaran, S.; Wang, J.; Wu, X.Y.; Kwon, G.; Son, S.B.; Liu, T.C.; Gim, J.; Su, C.C.; Dong, P.; Fang, C.C.; Li, M.T.; Amine, K.; Jankairaman, U. Comparative Study of Vinylene Carbonate and Lithium Difluoro(oxalate)borate Additives in a SiOx/Graphite Anode Lithium-Ion Battery in the Presence of Fluoroethylene Carbonate. ACS Appl. Mater. Interfaces 2025, 17, 7648–7656. [Google Scholar] [CrossRef]
- Song, R.F.; Di, J.; Lv, D.; Yang, L.L.; Luan, J.Y.; Yuan, H.Y.; Liu, J.; Hu, W.B.; Zhong, C. Improving the Electrochemical Properties of SiOx Anode for High-Performance Lithium-Ion Batteries by Magnesiothermic Reduction and Prelithiation. ACS Appl. Mater. Interfaces 2025, 17, 7849–7859. [Google Scholar] [CrossRef]
- Bie, X.; Dong, Y.W.; Xiong, M.; Wang, B.; Chen, Z.X.; Zhang, Q.C.; Liu, Y.; Huang, R.H. Nitrogen-Doped Carbon Matrix to Optimize Cycling Stability of Lithium Ion Battery Anode from SiOx Materials. Inorganics 2024, 12, 9. [Google Scholar] [CrossRef]
- Li, Y.; Chen, G.Y.; Yang, H.X.; Geng, X.B.; Luo, Z.; Zhang, C.T.; Huang, L.Q.; Luo, X.T. Three-Dimensional Porous Si@SiOx/Ag/CN Anode Derived from Deposition Silicon Waste toward High-Performance Li-Ion Batteries. ACS Appl. Mater. Interfaces 2023, 15, 43887–43898. [Google Scholar] [CrossRef] [PubMed]
- Ogata, K.; Jeon, S.; Ko, D.S.; Jung, I.S.; Kim, J.H.; Ito, K.; Kubo, Y.; Takei, K.; Saito, S.; Cho, Y.H.; Park, H.; Jang, J.; Kim, H.G.; Kim, J.H.; Kim, Y.S.; Choi, W.; Koh, M.; Uosaki, K.; Doo, S.G.; Hwang, Y.; Han, S. Evolving Affinity between Coulombic Reversibility and Hysteretic Phase Transformations in Nano-Structured Silicon-Based Lithium-Ion Batteries. Nat. Commun. 2018, 9, 479. [Google Scholar] [CrossRef]
- Domi, Y.; Usui, H.; Sugimoto, K.; Sakaguchi, H. Effect of Silicon Crystallite Size on Its Electrochemical Performance for Lithium-Ion Batteries. Energy Technol-Ger 2019, 7, 1800946. [Google Scholar] [CrossRef]
- Mukhan, O.; Umirov, N.; Lee, B.M.; Yun, J.S.; Choi, J.H.; Kim, S.S. A Facile Carbon Coating on Mg-Embedded SiOx Alloy for Fabrication of High-Energy Lithium-Ion Batteries. Adv. Mater. Interfaces 2022, 9, 2201426. [Google Scholar] [CrossRef]
- Ghassemi, H.; Au, M.; Chen, N.; Heiden, P.A.; Yassar, R.S. In Situ Electrochemical Lithiation/Delithiation Observation of Individual Amorphous Si Nanorods. Acs Nano 2011, 5, 7805–7811. [Google Scholar] [CrossRef]
- McDowell, M.T.; Ryu, I.; Lee, S.W.; Wang, C.M.; Nix, W.D.; Cui, Y. Studying the Kinetics of Crystalline Silicon Nanoparticle Lithiation with In Situ Transmission Electron Microscopy. Adv. Mater. 2012, 24, 6034–+. [Google Scholar] [CrossRef]
- Xu, Q.; Li, J.Y.; Sun, J.K.; Yin, Y.X.; Wan, L.J.; Guo, Y.G. Watermelon-Inspired Si/C Microspheres with Hierarchical Buffer Structures for Densely Compacted Lithium-Ion Battery Anodes. Adv. Energy Mater. 2017, 7, 1601481. [Google Scholar] [CrossRef]
- Li, Z.L.; Zhao, H.L.; Lv, P.P.; Zhang, Z.J.; Zhang, Y.; Du, Z.H.; Teng, Y.Q.; Zhao, L.N.; Zhu, Z.M. Watermelon-Like Structured SiOx-TiO2@C Nanocomposite as a High-Performance Lithium-Ion Battery Anode. Adv. Funct. Mater. 2018, 28, 1605711. [Google Scholar] [CrossRef]
Scheme 1.
Synthesis Process of Carbon-Coated M-SiOx Powder.
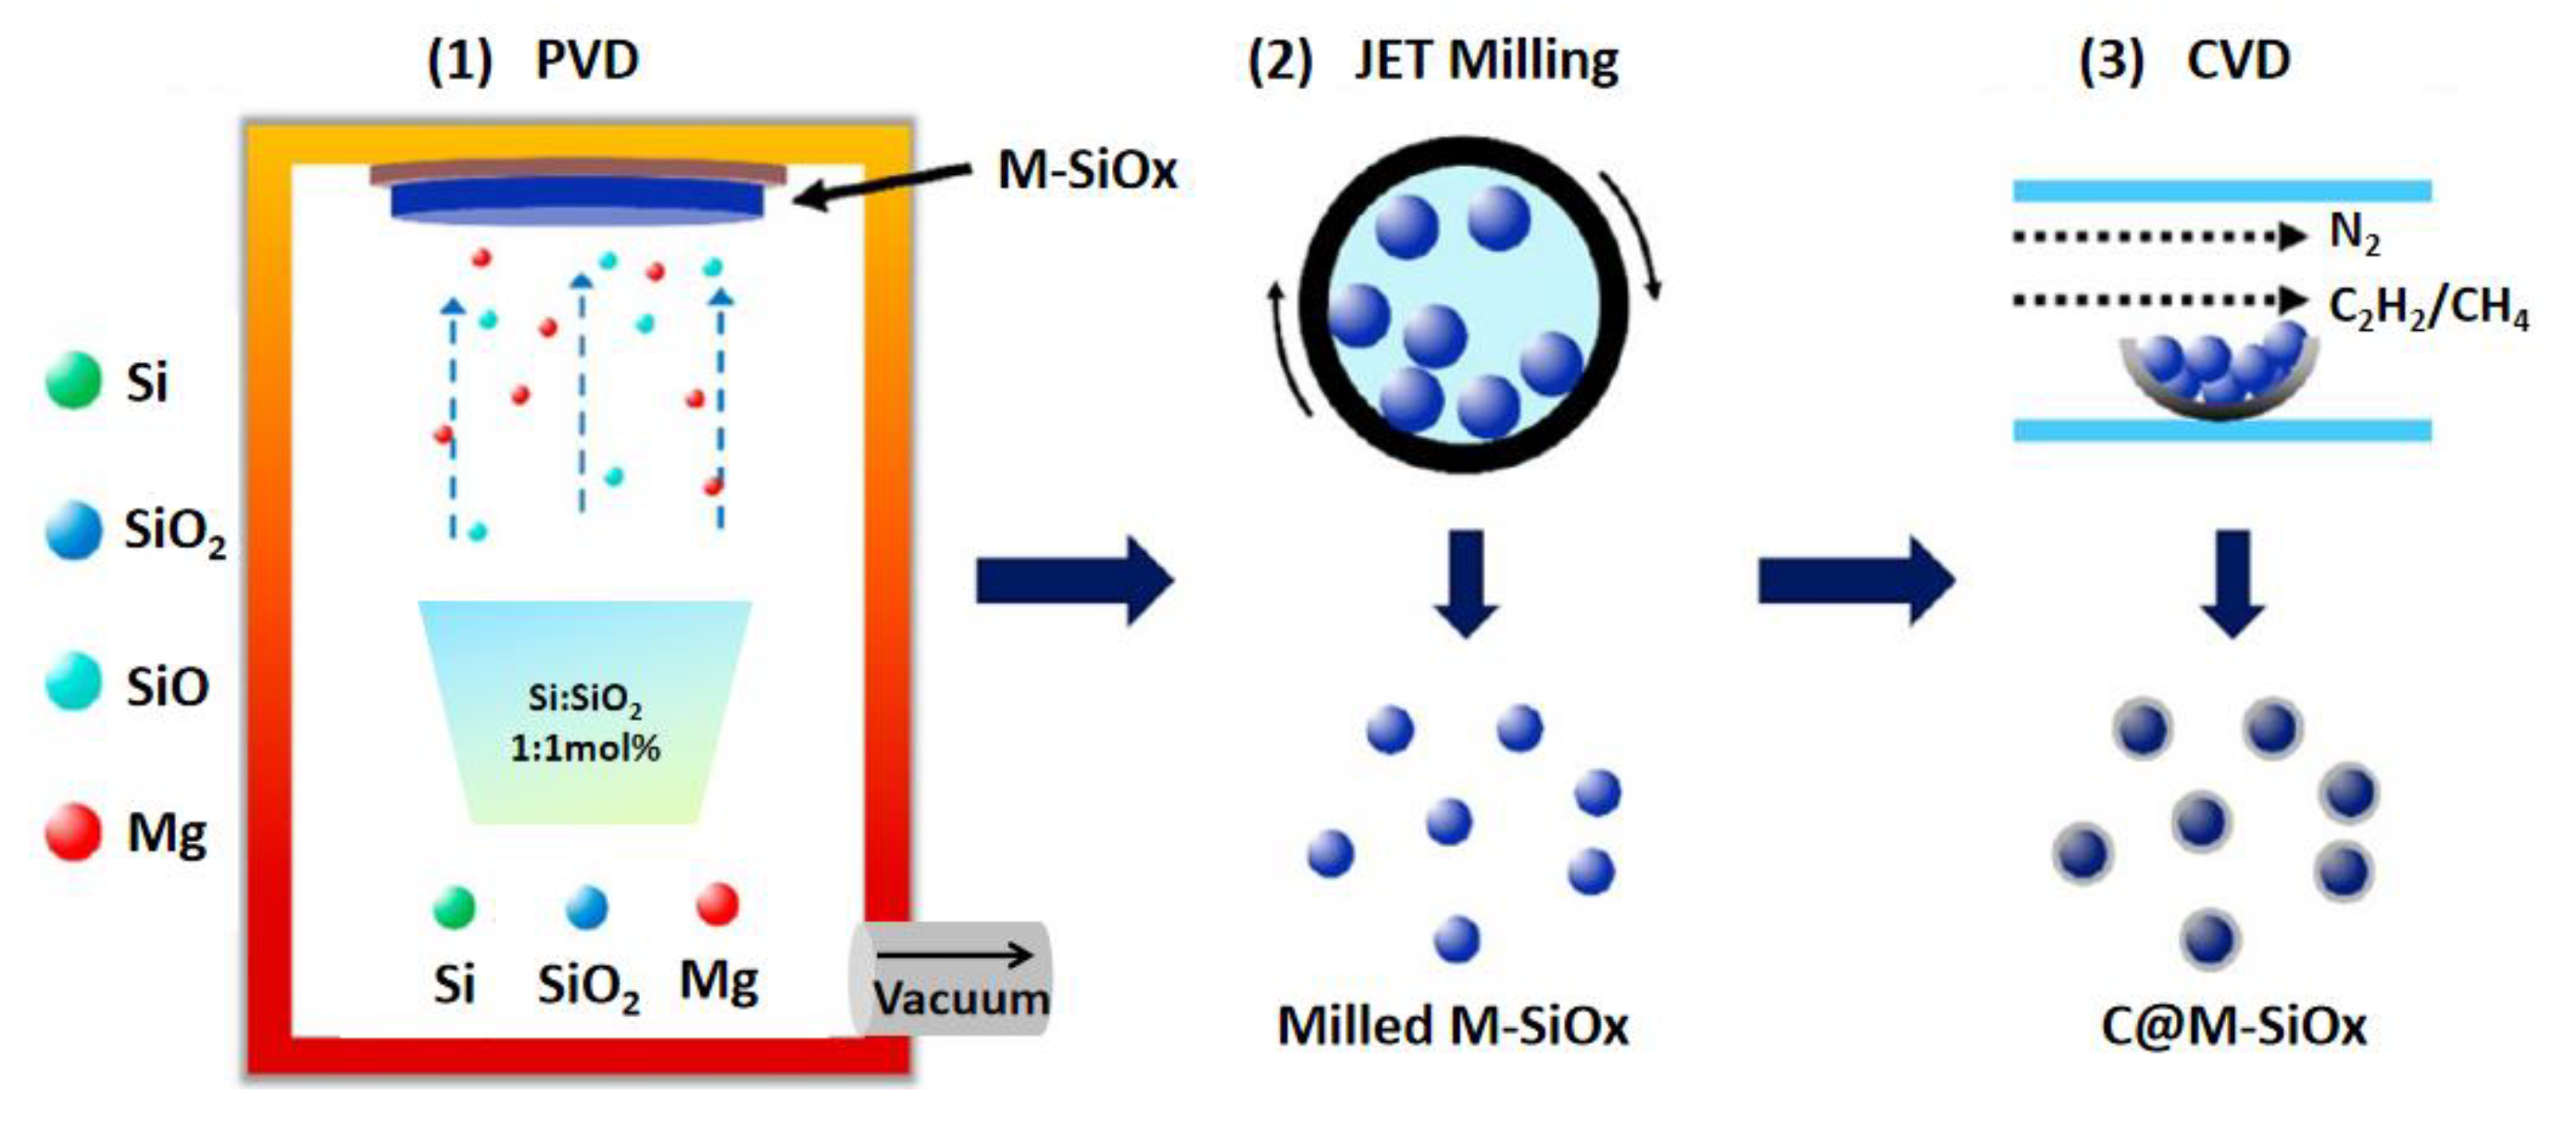
Figure 1.
(a) The particle size distribution of M-SiOx,XRD Patterns of M-SiOx and C@M-SiOx,(c) N2 adsorption-desorption isotherms of M-SiOx.
Figure 1.
(a) The particle size distribution of M-SiOx,XRD Patterns of M-SiOx and C@M-SiOx,(c) N2 adsorption-desorption isotherms of M-SiOx.
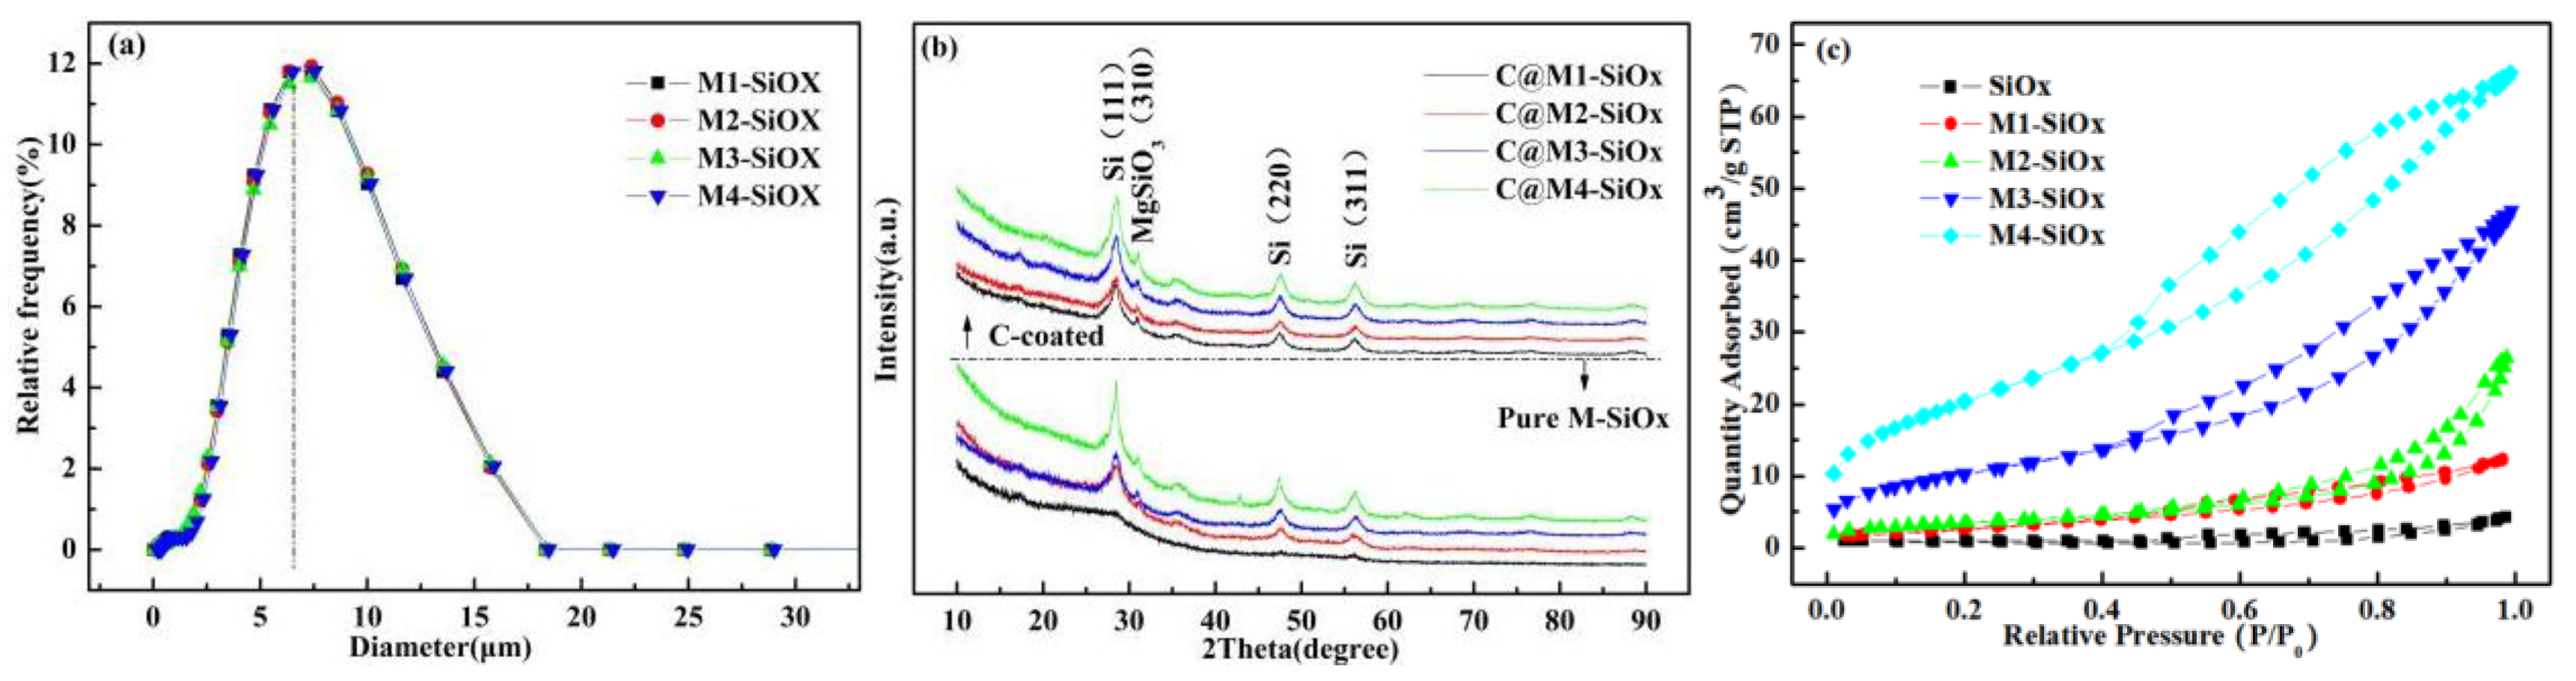
Figure 2.
SEM and EDS Characterization of C@M-SiOx: (a) C@M1-SiOx, (b) C@M2-SiOx,(c) C@M3-SiOx,(d) C@M4-SiOx,(e) Medium-magnification SEM image of C@M3-SiOx particles,(f) High-magnification SEM image of C@M3-SiOx particles, (g) EDS elemental mapping of C@M3-SiOx,(h-1-4) Raman spectra of C@M-SiOx.
Figure 2.
SEM and EDS Characterization of C@M-SiOx: (a) C@M1-SiOx, (b) C@M2-SiOx,(c) C@M3-SiOx,(d) C@M4-SiOx,(e) Medium-magnification SEM image of C@M3-SiOx particles,(f) High-magnification SEM image of C@M3-SiOx particles, (g) EDS elemental mapping of C@M3-SiOx,(h-1-4) Raman spectra of C@M-SiOx.
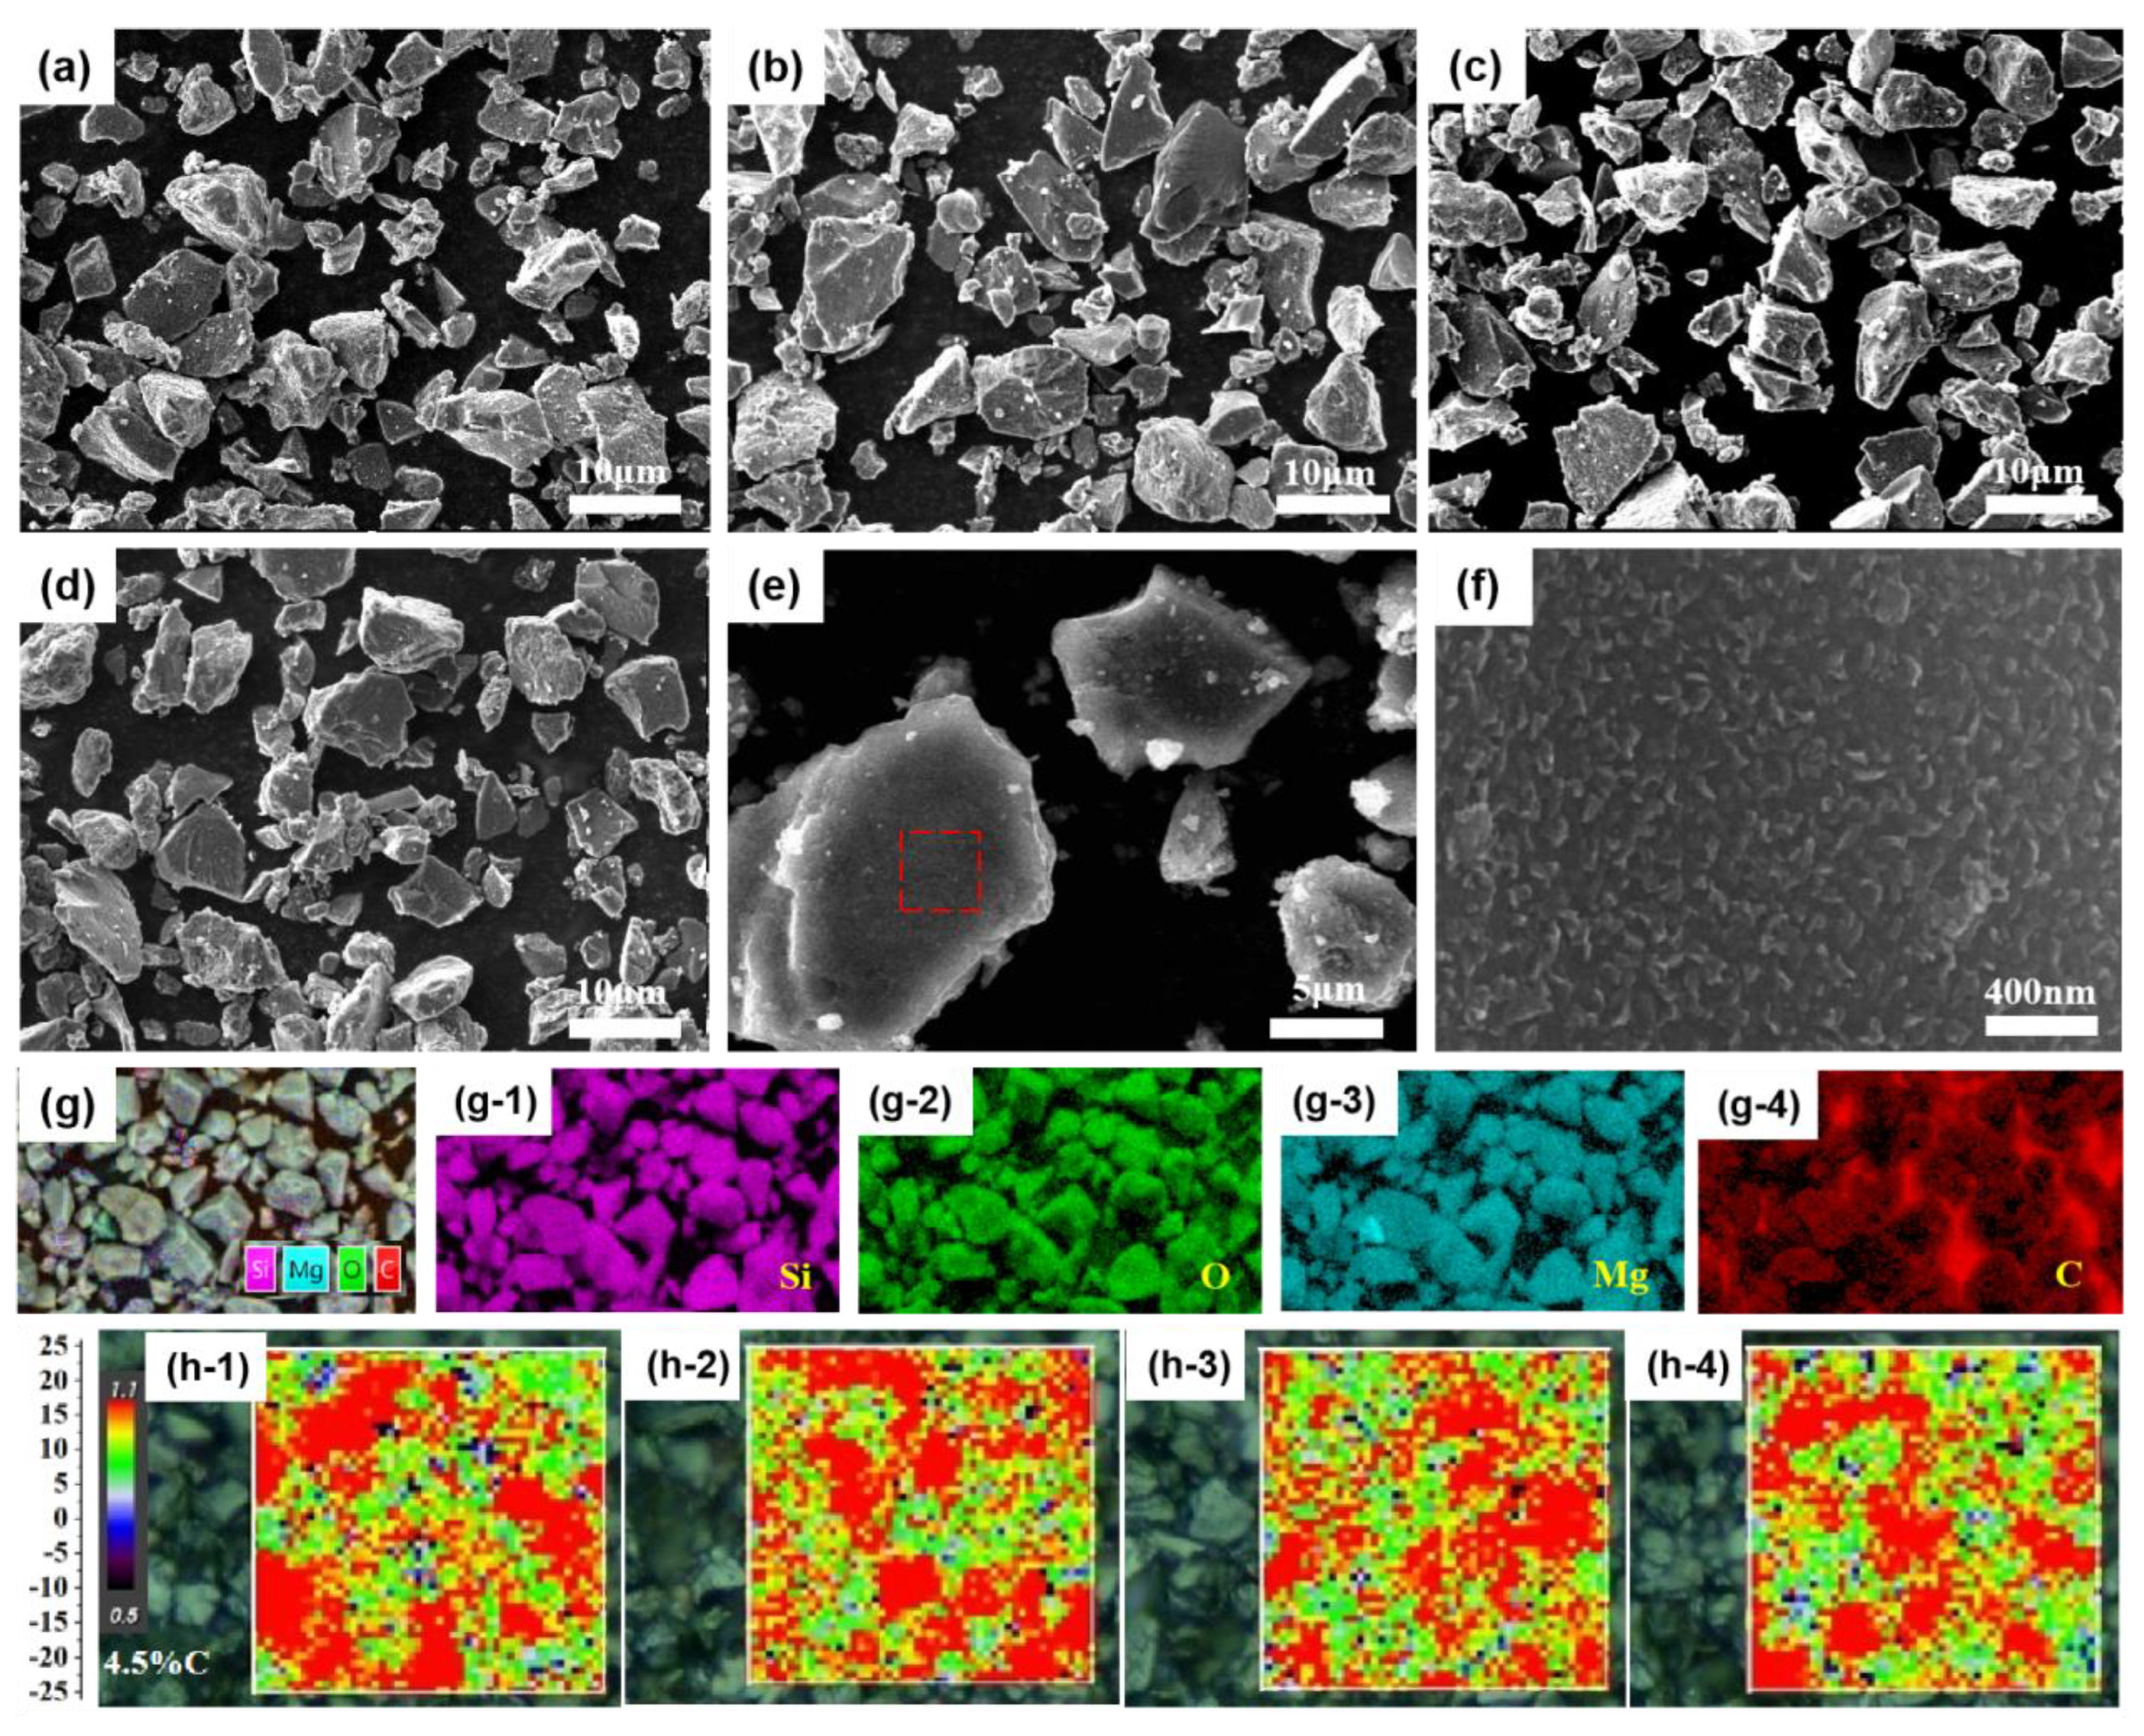
Figure 3.
(a) Voltage-Capacity Profiles of C@M-SiOx Prepared under different silicon microcrystalline structures, (b) dQ/dV Curves of C@M-SiOx.
Figure 3.
(a) Voltage-Capacity Profiles of C@M-SiOx Prepared under different silicon microcrystalline structures, (b) dQ/dV Curves of C@M-SiOx.
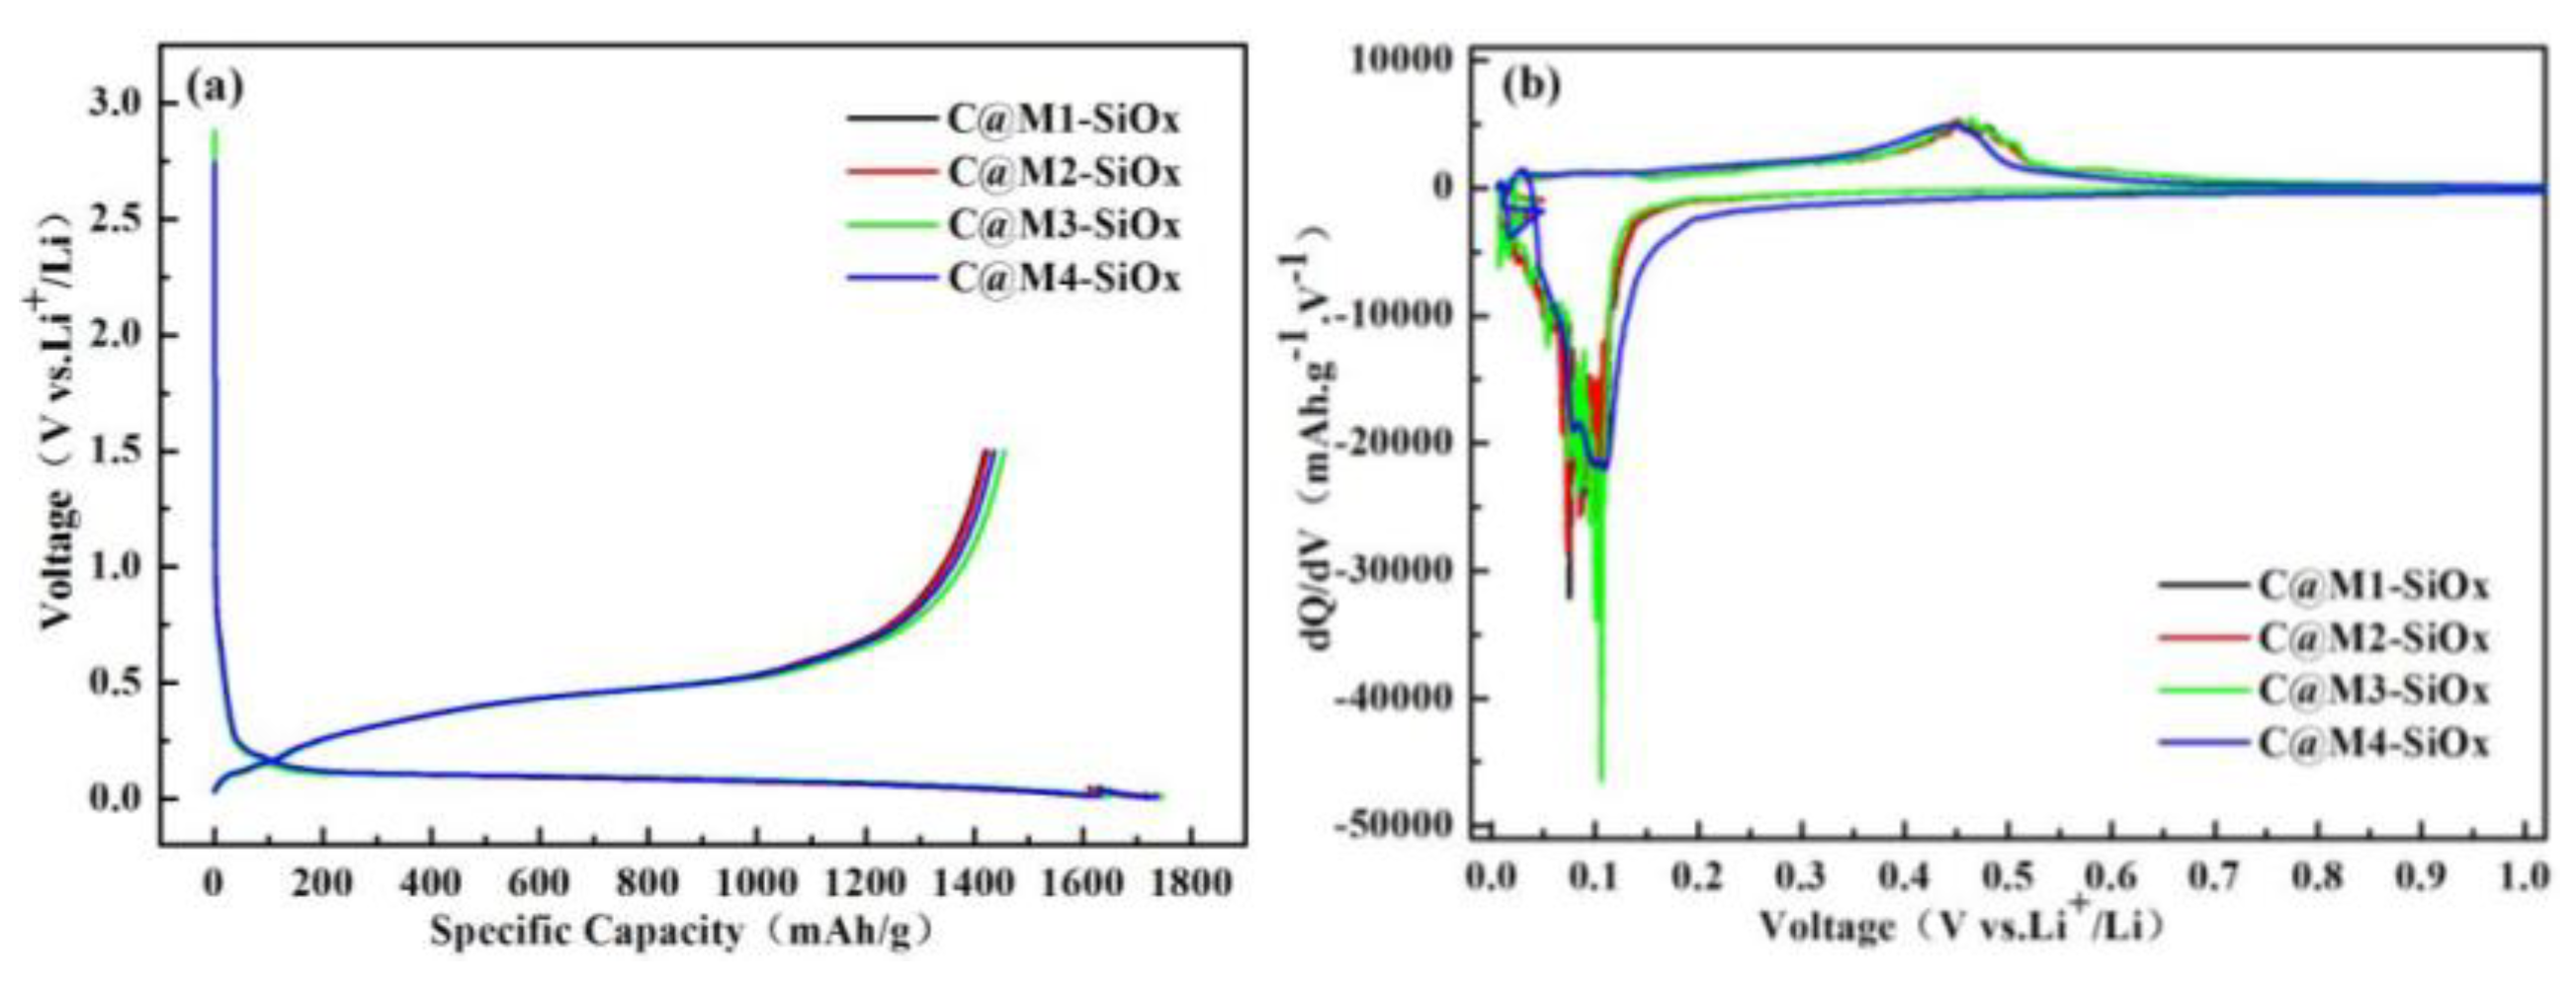
Figure 4.
(a) Comparison of the cycling performance and Coulombic efficiency of C@M-SiOx at 0.1C,(b) Rate performance comparison of C@M-SiOx prepared under different silicon microcrystalline structures.
Figure 4.
(a) Comparison of the cycling performance and Coulombic efficiency of C@M-SiOx at 0.1C,(b) Rate performance comparison of C@M-SiOx prepared under different silicon microcrystalline structures.
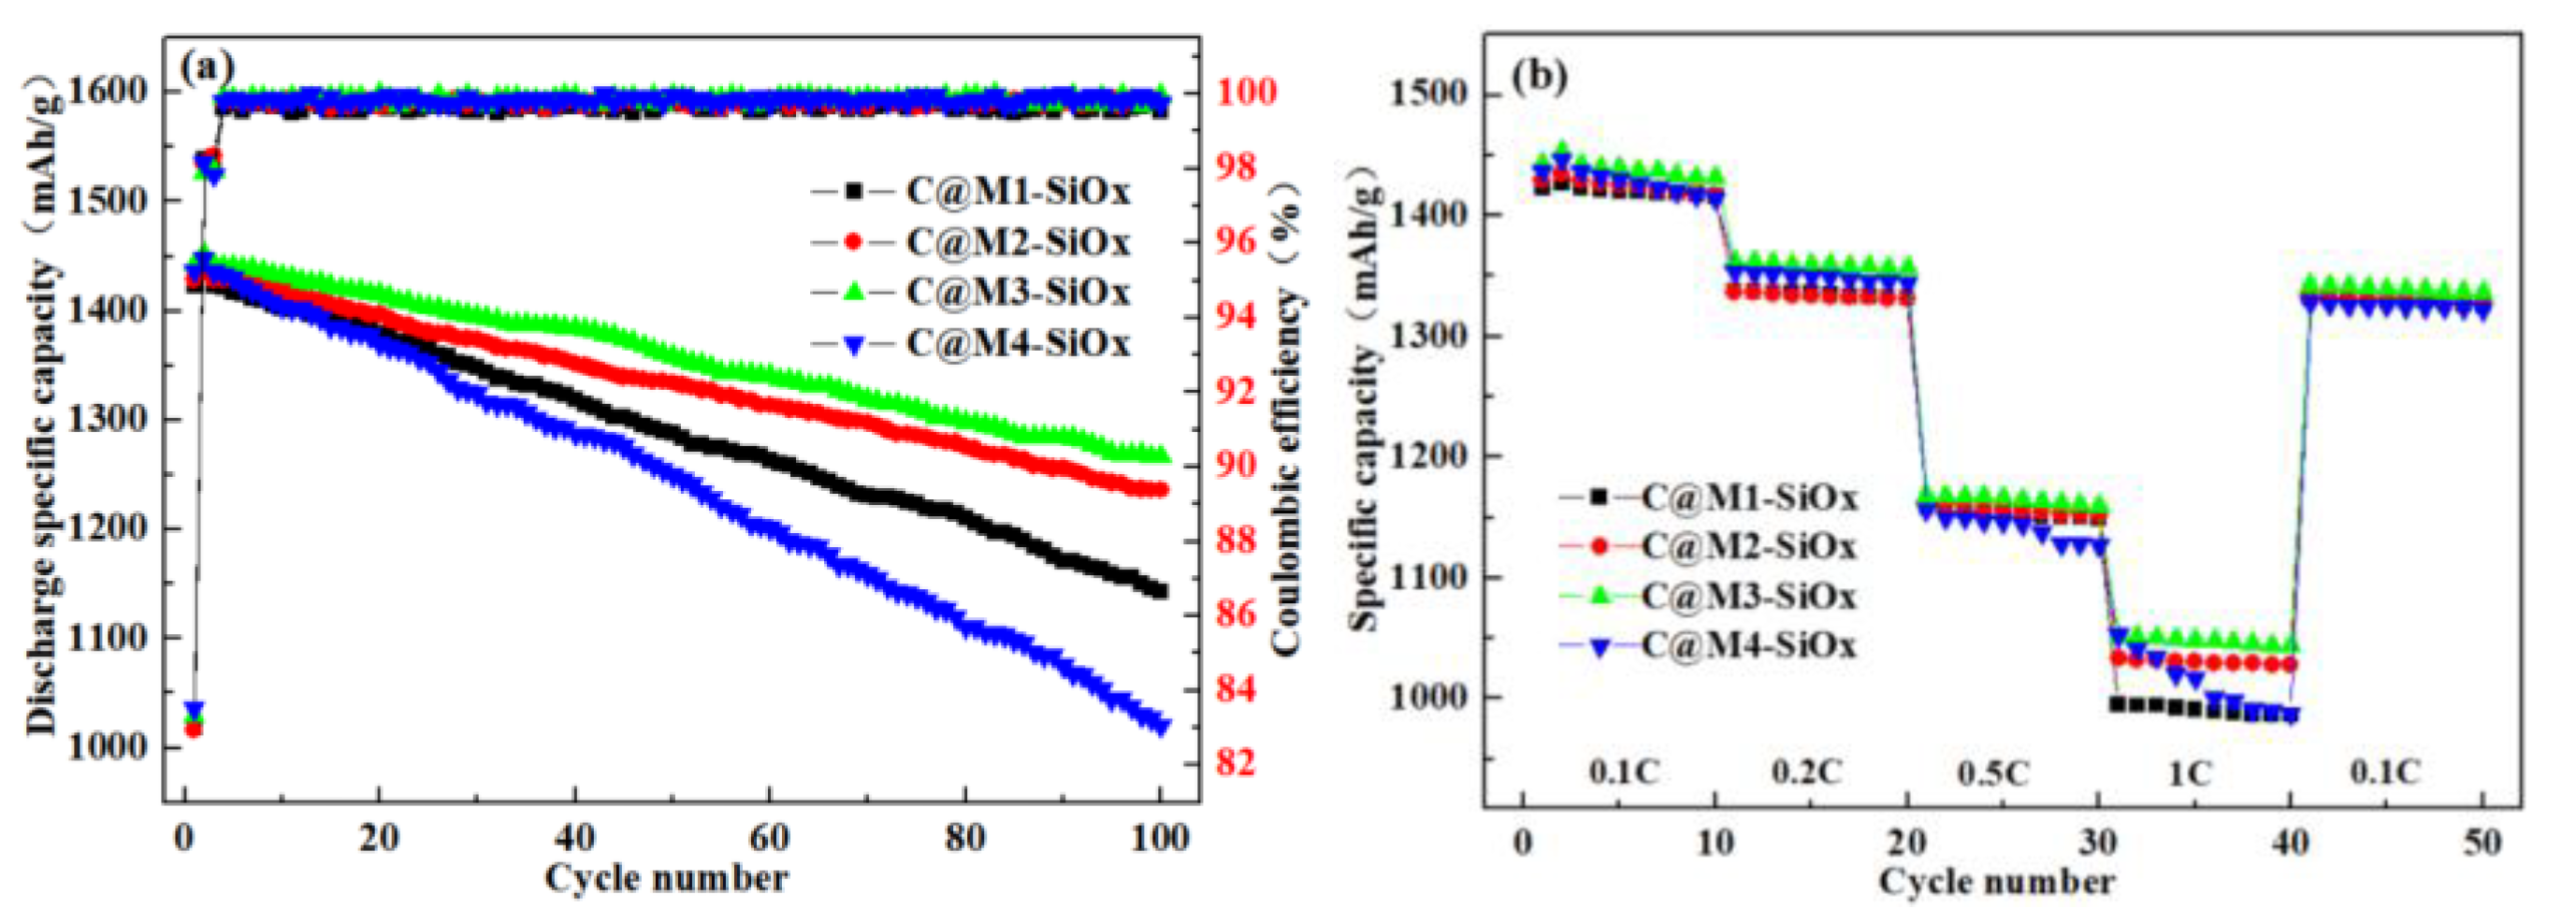
Figure 5.
Schematic of a Li storage process into (a)Small grain particle and (b)Large grain particle.
Figure 5.
Schematic of a Li storage process into (a)Small grain particle and (b)Large grain particle.
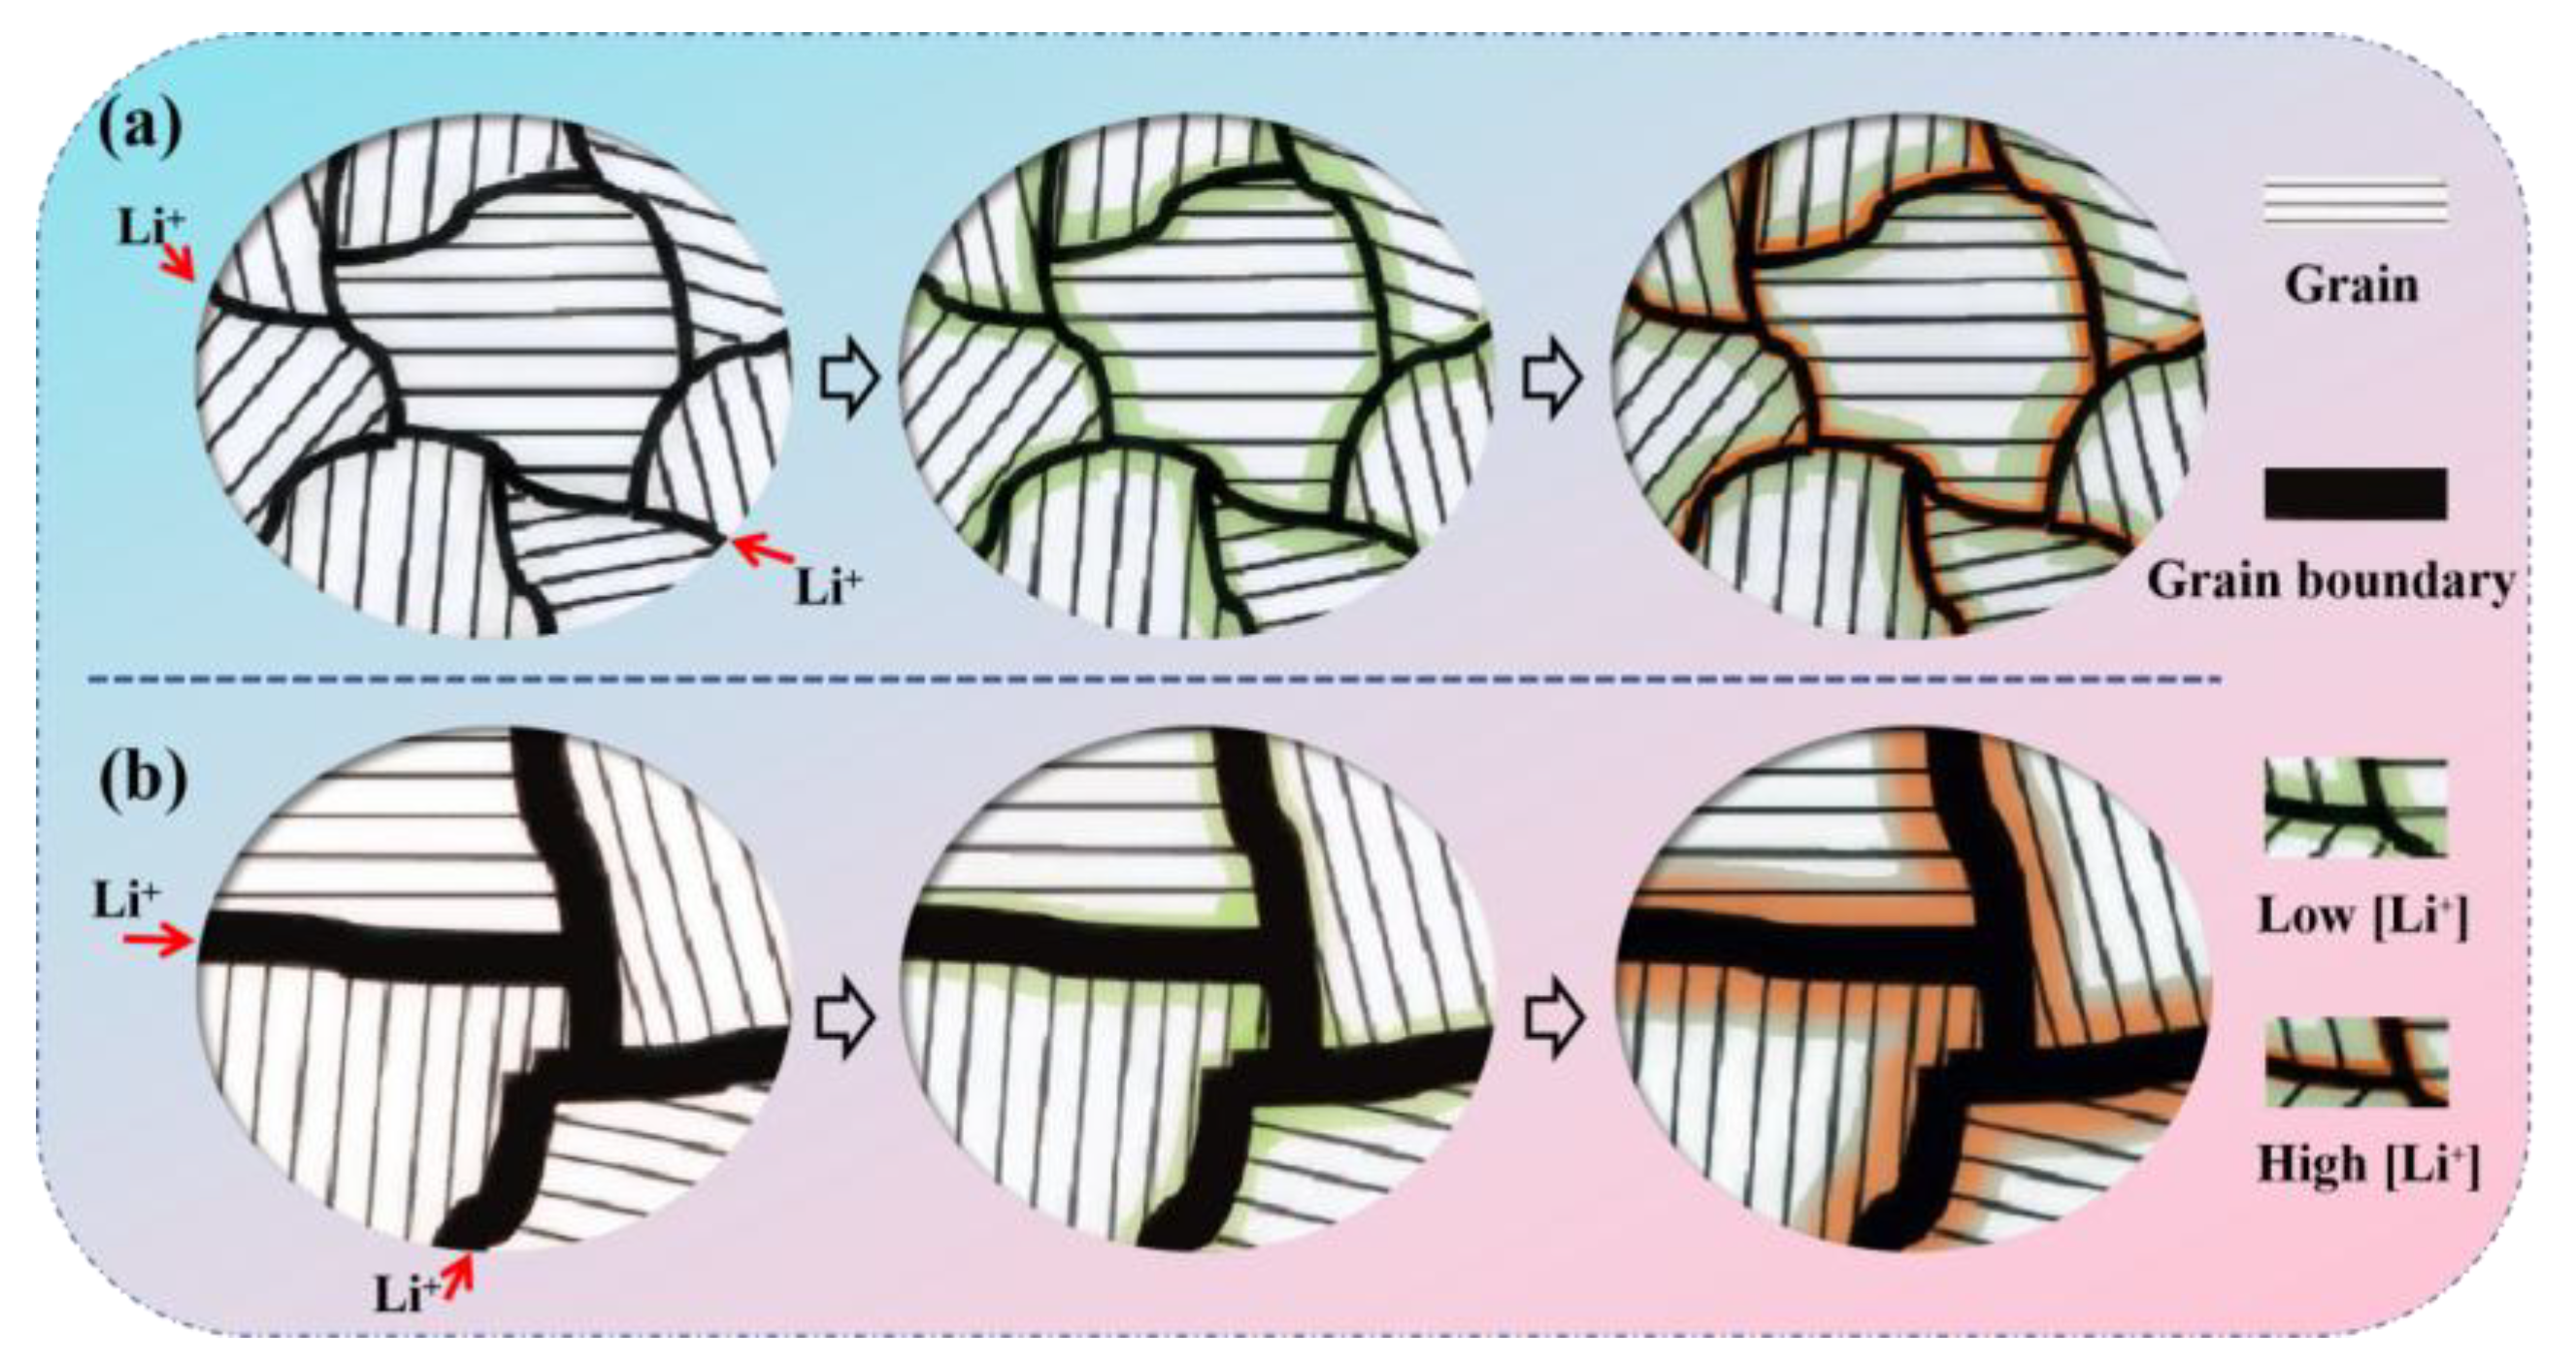
Figure 6.
STEM (DF-I) micrographs of C@My-SiOx: (a) C@M1-SiOx,(b) C@M3-SiOx, (c) C@M4-SiOx.
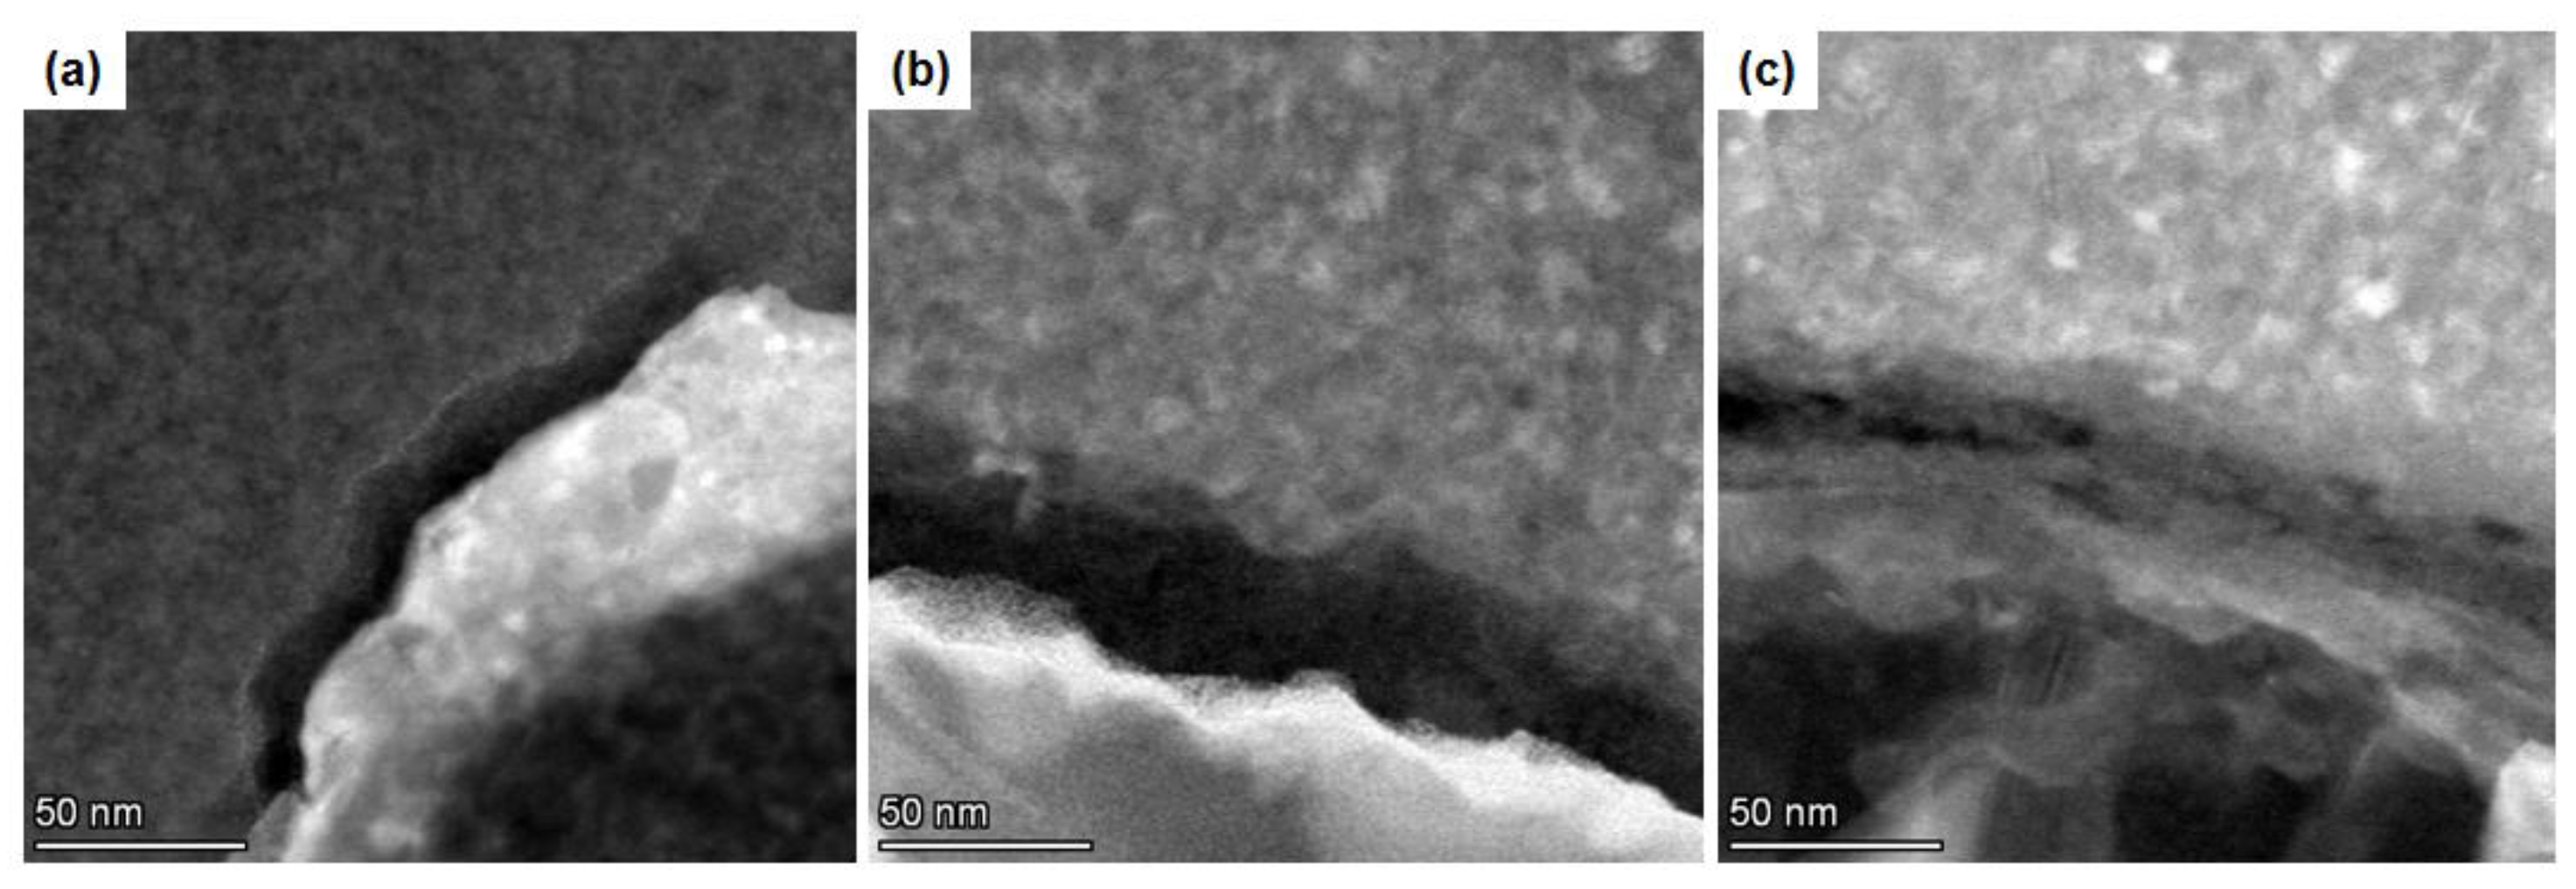
Figure 7.
(a) Nyquist plots of C@M-SiOx, (b) Warburg factor analysis.
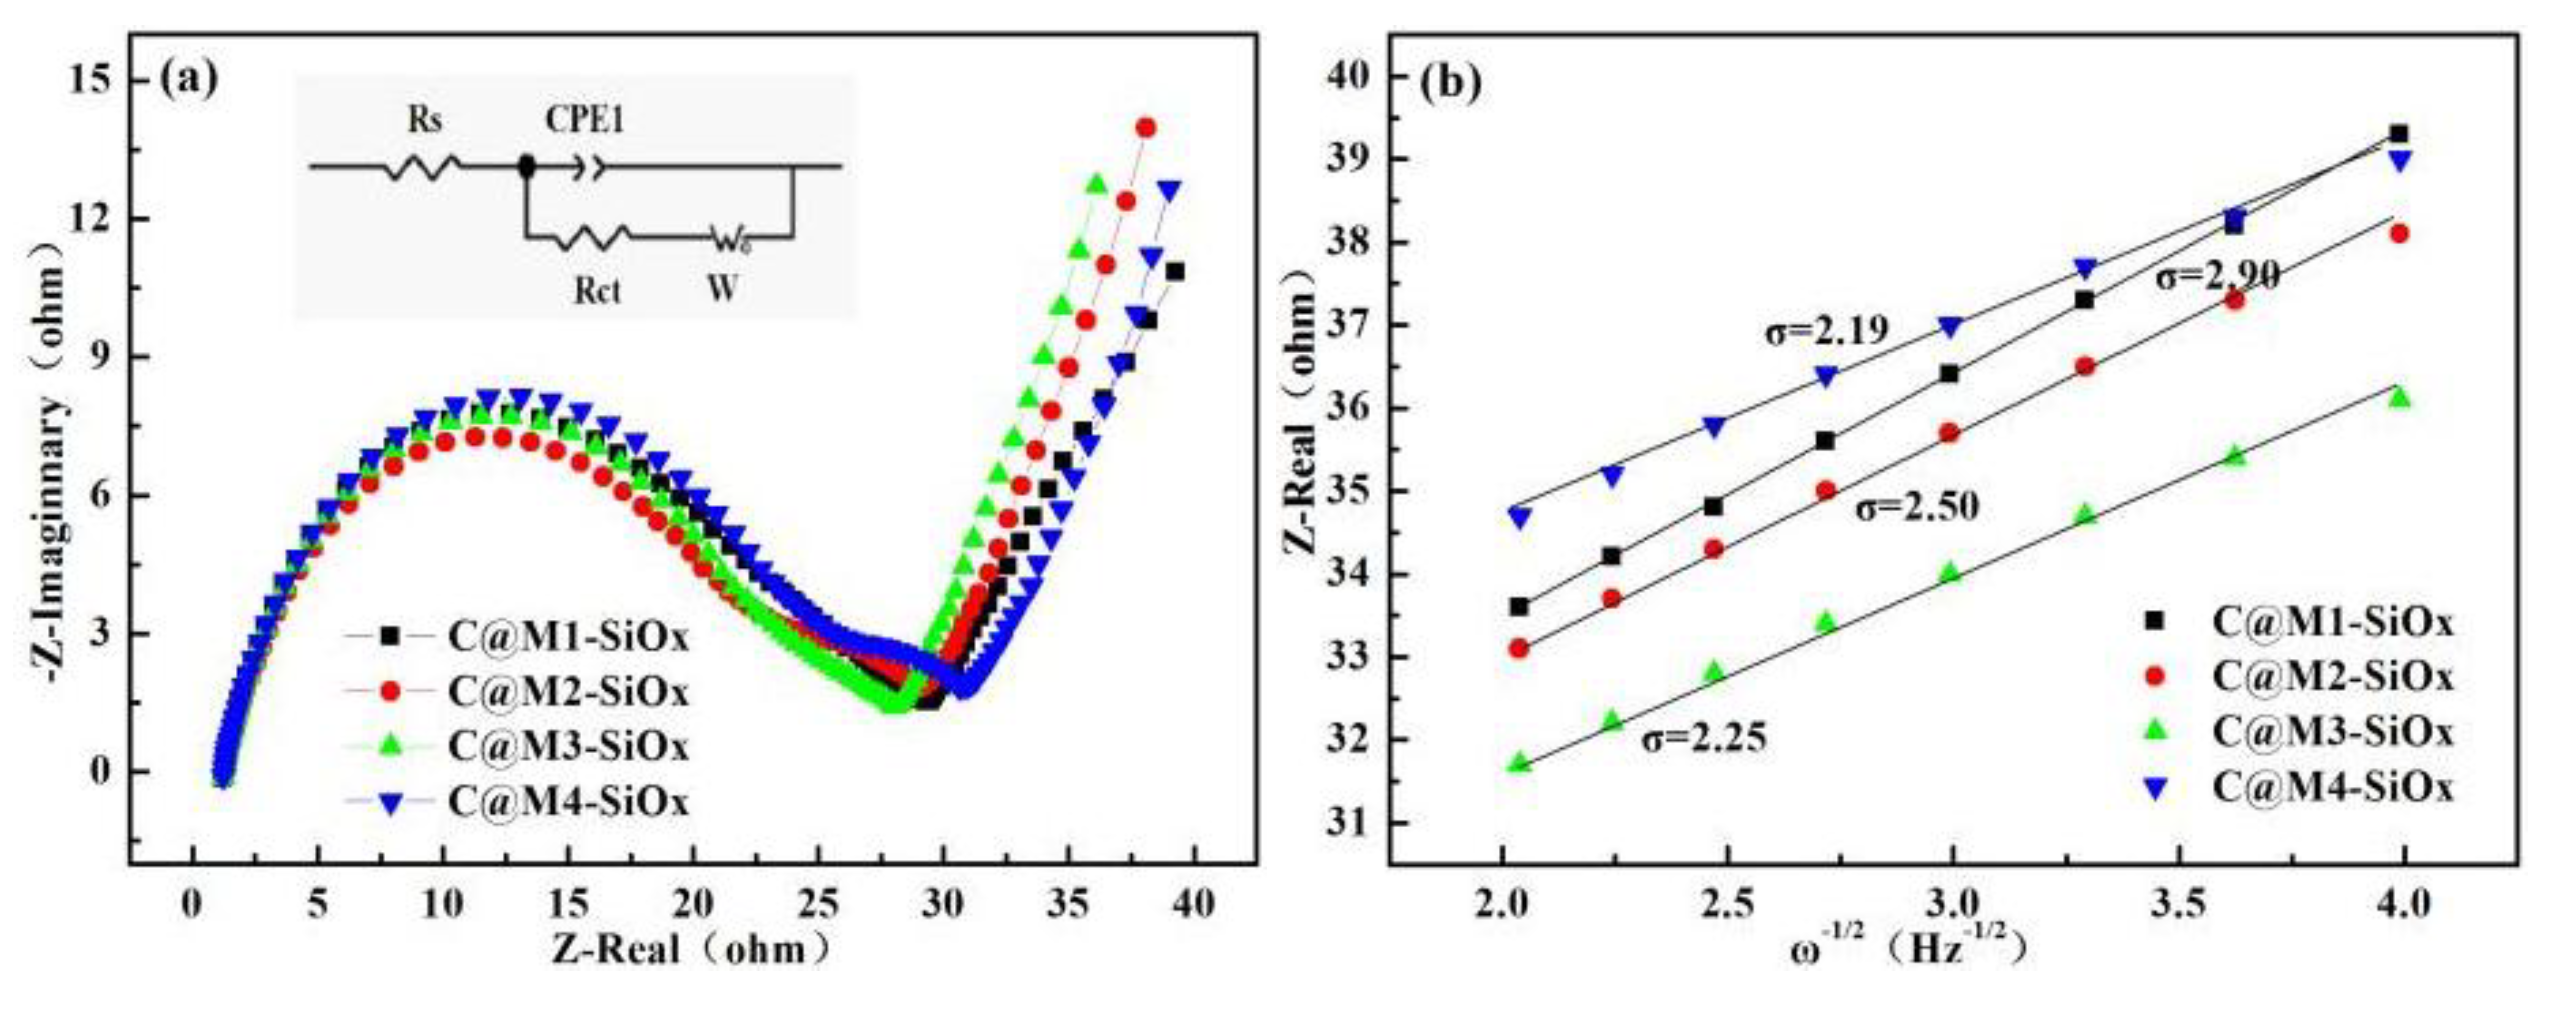

Table 1.
impedance fitting data of C@M-SiOx prepared under different silicon crystals.
| Electrodes | Rs(Ω) | Rct(Ω) | σ | DLi+(cm2.S-1) |
|---|---|---|---|---|
| C@M1-SiOx | 1.2 | 29.45 | 2.9 | 1.112*10-10 |
| C@M2-SiOx | 1.21 | 29.43 | 2.56 | 1.427*10-10 |
| C@M3-SiOx | 1.28 | 28.34 | 2.25 | 1.847*10-10 |
| C@M4-SiOx | 1.23 | 31.18 | 2.19 | 1.950*10-10 |
Disclaimer/Publisher’s Note: The statements, opinions and data contained in all publications are solely those of the individual author(s) and contributor(s) and not of MDPI and/or the editor(s). MDPI and/or the editor(s) disclaim responsibility for any injury to people or property resulting from any ideas, methods, instructions or products referred to in the content. |
© 2025 by the authors. Licensee MDPI, Basel, Switzerland. This article is an open access article distributed under the terms and conditions of the Creative Commons Attribution (CC BY) license (http://creativecommons.org/licenses/by/4.0/).
Copyright: This open access article is published under a Creative Commons CC BY 4.0 license, which permit the free download, distribution, and reuse, provided that the author and preprint are cited in any reuse.


