Submitted:
28 September 2025
Posted:
29 September 2025
You are already at the latest version
Abstract
As global efforts to achieve the Sustainable Development Goals (SDGs) enter a critical phase, there is a growing need for analytical tools that reflect the complexity and heterogeneity of development pathways. This study introduces a probabilistic classification framework designed to uncover latent typologies of national performance across the seventeen Sustainable Development Goals. Unlike traditional ranking systems or composite indices, the proposed method uses raw, standardised goal-level indicators and accounts for both structural variation and classification uncertainty. The model integrates a Bayesian decision tree with penalised spline regressions and includes regional covariates to capture context-sensitive dynamics. Based on publicly available global datasets covering more than 150 countries, the analysis identifies three distinct development profiles: structurally vulnerable systems, transitional configurations, and consolidated performers. Posterior probabilities enable soft classification, highlighting ambiguous or hybrid country profiles that do not fit neatly into a single category. Results reveal both monotonic and non-monotonic indicator behaviours, including saturation effects in infrastructure-related goals and paradoxical patterns in climate performance. This typology-sensitive approach provides a transparent and interpretable alternative to aggregated indices, supporting more differentiated and evidence-based sustainability assessments. The findings provide a practical basis for tailoring national strategies in alignment with structural conditions and the multidimensional nature of sustainable development.
Keywords:
Bayesian classification
; Sustainable Development Goals (SDGs)
; soft clustering
; country typologies
; probabilistic modelling
; development policy
; progress
1. Introduction
As global efforts to achieve the Sustainable Development Goals (SDGs) enter a critical phase, there is a growing need for analytical tools that reflect the complexity and heterogeneity of development pathways. Traditional approaches, such as the SDG Index and composite dashboards, primarily focus on country rankings and aggregate scores [1,2,3], often failing to account for structural differences, inter-goal trade-offs, and context-specific dynamics [4,5]. These approaches tend to obscure nonlinear patterns and saturation effects that are increasingly recognised in empirical sustainability research [6,7].
Recent studies highlight the limitations of unidimensional assessments and the risks associated with using simplified indicators to inform complex policy decisions [8,9]. Scholars have called for typology-sensitive, multidimensional frameworks that can better capture the diversity of national development profiles [10,11]. In particular, machine learning and probabilistic models have emerged as promising alternatives for uncovering latent patterns in high-dimensional SDG data [12,13,14]. However, many of these tools prioritise predictive accuracy over interpretability, making them less accessible to policymakers [15,16].
Efforts to address these challenges include unsupervised learning techniques such as K-means clustering [17], Gaussian mixture models [18], and Bayesian additive regression trees (BART) [19], which offer ways to explore development heterogeneity beyond traditional rankings. Nonetheless, few studies combine soft classification with policy-relevant typologies that can inform differentiated strategies across countries [20,21].
From a theoretical perspective, the capabilities approach, developed by Sen and Nussbaum, provides a compelling lens for assessing progress [22,23,24]. This framework shifts the focus from outcomes to opportunities and freedoms, challenging universalist development models and aggregate benchmarking [25]. It argues that development should be assessed in terms of what people can do and be — a viewpoint that supports structural differentiation rather than convergence.
Furthermore, sustainability science has increasingly recognised the value of typological analysis for capturing development diversity [26,27,28]. Typologies help bridge the gap between abstract indicators and grounded policy responses, primarily when they reflect uncertainty and transition dynamics. Recent typology work within the SDG domain includes region-based groupings [29], performance quartiles [30], and cluster analyses based on thematic goal families [31]. Yet, most of these studies impose sharp boundaries and rigid categories, overlooking ambiguous or hybrid cases that do not fit neatly within predefined classes [32].
At the same time, Bayesian approaches have gained traction for their ability to model uncertainty, integrate prior knowledge, and produce probabilistic outputs that reflect ambiguity in real-world data [33,34]. In development contexts, Bayesian decision trees and spline regressions offer interpretable, nonparametric tools for classification that retain transparency while capturing nonlinearity [35,36,37]. These methods are particularly suitable for analysing sustainability indicators, where threshold effects and goal interdependencies often produce complex patterns [38,39].
Despite their promise, few studies have combined Bayesian soft classification with typology construction in the context of the SDGs. The gap persists in models that are (1) interpretable, (2) capable of capturing nonlinear behaviour and trade-offs, and (3) sensitive to uncertainty and structural heterogeneity. Moreover, regional covariates and contextual effects are often excluded, limiting the explanatory power of existing classification systems [40,41].
This study addresses the above research gap by proposing a Bayesian Tree-Spline Classification Model for constructing probabilistic country typologies based on raw SDG goal-level indicators. The model avoids composite indices and instead focuses on direct, standardised goal scores. It combines Bayesian decision tree logic (for interpretability), penalised spline regressions (to capture nonlinear trends and saturation), and region-level covariates (to account for structural context).
Using publicly available SDG datasets covering more than 150 countries, the model identifies three latent development profiles and assigns countries to them via soft membership vectors. This enables the detection of ambiguous or transitional configurations that are often lost in conventional clustering.
We address the following research questions:
- RQ1: Can countries be classified into meaningful development typologies based on raw SDG indicators, accounting for structural uncertainty and contextual variation?
- RQ2: What nonlinear patterns and threshold effects emerge across goals, and how do they influence typological transitions?
- RQ3: How can soft classification improve the interpretability and policy relevance of sustainability assessments?
In answering these questions, we contribute a methodologically transparent and policy-usable model that challenges standard SDG ranking systems. Our framework enables more nuanced interpretations of sustainability performance and supports context-aware strategies that align with structural conditions.
2. Methodology
This study proposes a hybrid research design that integrates exploratory clustering and supervised Bayesian classification to identify latent typologies of national SDG performance. The methodological pipeline progresses through four stages: dimensionality reduction, unsupervised clustering, Bayesian tree-based classification with splines, and soft probabilistic assignment of countries to development profiles.
Data
The study draws on SDG performance data provided by the Sustainable Development Solutions Network (SDSN), as presented in the Sustainable Development Report, published annually, and the UN SDG Global Database. The dataset comprises yearly indicator scores for all 17 Sustainable Development Goals (SDGs), as well as the composite SDG Index Score [1]. To maintain analytical robustness, the sample was restricted to countries with complete coverage of indicators for all 17 Sustainable Development Goals.
Each country is represented by a 17-dimensional continuous vector , corresponding to z-standardised performance scores on each of the 17 Sustainable Development Goals (SDGs). Each country is also annotated with a categorical regional label , used as an additional covariate in the model.
Exploratory Dimensionality Reduction and Clustering
To uncover initial structure in the SDG space, we apply Principal Component Analysis (PCA) to project the data into a low-dimensional latent space. The first two principal components are retained for visualisation and clustering. Next, we use K-means clustering on the PCA projection to produce an initial, unsupervised 3-cluster solution, denoted:
These clusters serve as a benchmark and guide the subsequent structure of the supervised Bayesian model, without being used as inputs.
Bayesian Tree-Spline Classification Model
We implement a Bayesian Classification and Regression Tree (CART) model extended with penalised spline regression and regional interactions. The latent class assignment for each country is denoted by . Each terminal node t of the decision tree defines a local classification model for a given goal-level covariate , specified as:
where:
- a univariate penalised cubic B-spline for SDG indicator j,
- is a region-specific offset (categorical),
- and is the local intercept.
We use hierarchical priors on tree depth, split thresholds, and spline coefficients to regularise complexity. Posterior inference is performed using Metropolis-within-Gibbs sampling, and spline penalties are optimised via marginal likelihood maximisation.
Soft Clustering and Uncertainty Quantification
To allow for ambiguous or transitional country profiles, we estimate posterior-like class probabilities using a multinomial logistic regression on the same predictor set . The probability that country i belongs to cluster k is modelled as:
where - are the goal-specific regression coefficients for cluster k, is the regional adjustment term. This soft classification yields country-level triplets , from which we compute Shannon entropy to identify ambiguous or hybrid development profiles.
Model Evaluation and Robustness
Model fit is assessed using Leave-One-Out Cross-Validation (LOO-CV) and Watanabe-Akaike Information Criterion (WAIC). To test robustness, we re-ran the model excluding the regional covariate , and the posterior classifications are compared. We also benchmark the Bayesian results against the K-means solution in the PCA space.
To enhance clarity for interdisciplinary audiences, Figure 1 presents a conceptual flowchart of the modelling approach, from initial SDG data processing through to the extraction of policy insights.
3. Results
Exploratory Clustering of SDG Profiles
To uncover preliminary structure in the multidimensional space of Sustainable Development Goals (SDGs), we performed an exploratory analysis using Principal Component Analysis (PCA) and unsupervised clustering. This step aimed to visualise the data, identify latent groupings, and inform the subsequent supervised Bayesian classification. Figure 2 presents the two-dimensional PCA projection based on z-standardised values for all 17 SDG indicators across 167 countries.
The two principal components account for a substantial portion of the total variance and exhibit a straightforward spatial arrangement of countries. Notably, countries from Sub-Saharan Africa and South-East Asia cluster in separate regions of the latent space, reflecting shared development patterns. In contrast, countries from Latin America and the Caribbean (LAC) occupy a more central position, indicating a mixed pattern of progress.
To further explore the underlying typologies, we applied the K-means algorithm to the PCA-reduced data, resulting in a three-cluster solution (Figure 3). This clustering served not as a final classification but as an exploratory benchmark to guide our Bayesian model.
The characteristics of each cluster are summarised in Figure 4, which displays the median z-scores for all SDGs across the three groups. Cluster 0 primarily comprises countries with low performance across most goals, particularly in Goals 1 (No Poverty), 3 (Good Health), and 4 (Quality Education). Cluster 1 represents a transitional profile, with scores close to the global average and moderate strength in Goals 2 and 4. Cluster 2 consists mainly of high-income and OECD countries, characterised by strong performance in education, health, infrastructure, and environmental sustainability.
These initial patterns underscore the existence of coherent, latent developmental trajectories in the SDG space. Importantly, they support the rationale for incorporating regional covariates and soft clustering mechanisms in subsequent modelling steps.
Structure of Latent Development Typologies
Building upon the initial clustering, we developed a supervised Bayesian Tree-Spline Classification Model to reveal structured patterns of SDG performance across countries. Unlike static or linear classifiers, this approach combines the interpretability of decision trees with the flexibility of penalised splines, capturing nonlinear thresholds and interactions between goals.
Figure 4 presents the resulting classification tree, where each node splits the country set based on goal-specific indicator thresholds. The top-level split is defined by SDG 1 (No Poverty), indicating that foundational economic deprivation is the primary global differentiator. Countries with lower scores on Goal 1 were further distinguished by their performance on Goal 13 (Climate Action) and Goal 3 (Good Health), highlighting that environmental and health factors are influential in low-income contexts.
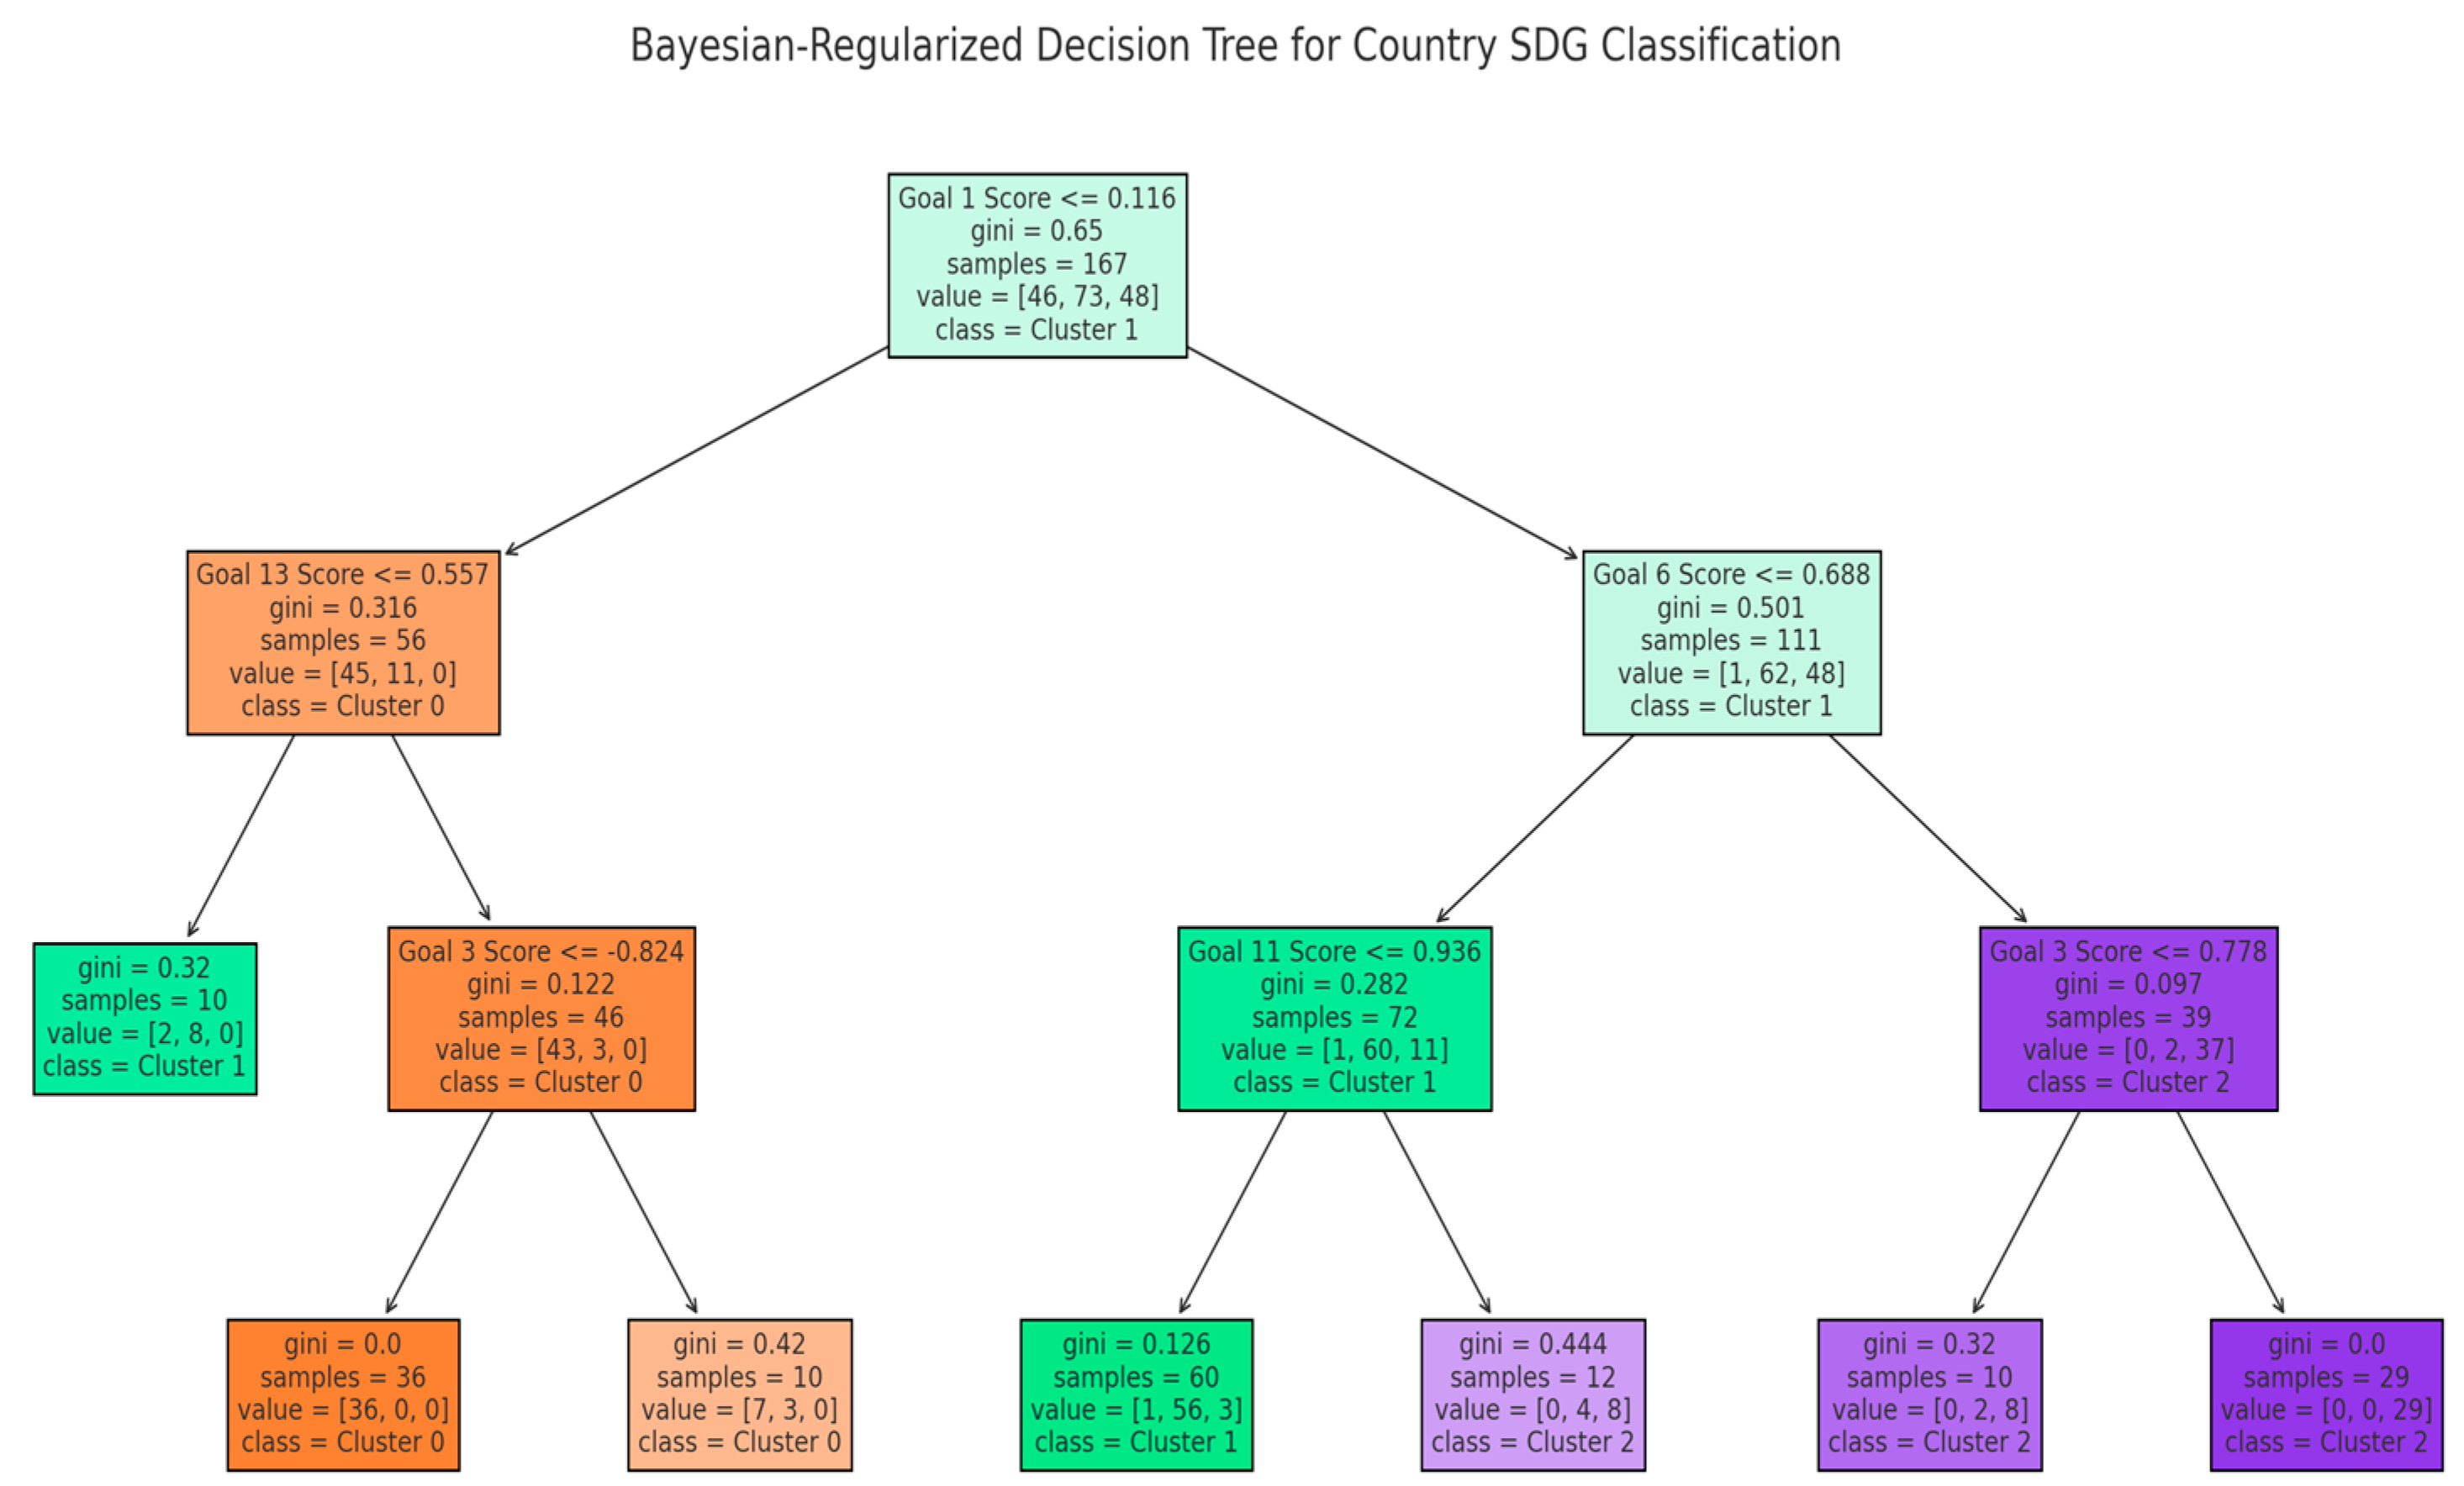
Figure 5.
Resulting classification tree from the Bayesian Tree-Spline model, illustrating goal-specific thresholds used to differentiate between country clusters. The top-level split is based on Goal 1 (No Poverty), indicating its central role in defining structural vulnerability. Subsequent branches incorporate Goals 3, 6, 11, and 13, capturing both monotonic and non-monotonic development patterns. The tree reflects a non-linear, layered progression of sustainability pathways across the global system.
Conversely, countries with better poverty scores were segmented based on Goal 6 (Clean Water and Sanitation), followed by Goal 11 (Sustainable Cities) and again Goal 3, suggesting that access to urban infrastructure and public health investment defines deeper stages of development. This multi-layered structure reflects a dynamic and non-linear architecture of sustainable progress.
Interestingly, regional affiliation did not emerge as a splitting variable, despite being included in the model. This implies that SDG-specific indicators provided stronger discriminative power than geographic labels, pointing to a convergence in regional performance or the dominance of policy-relevant structural factors.
The structure of the tree demonstrates several key insights:
- SDG 1 serves as a global baseline discriminator;
- SDG 13 behaves non-monotonically, often interacting with economic level and climate exposure;
- SDG 3 appears across multiple branches, reinforcing its importance as a second-order differentiator;
- SDGs 6 and 11 emerge in later branches, indicating their role in consolidating development stages.
Overall, the tree captures a layered, asymmetric logic of development progression. It validates our theoretical stance that countries do not follow a single linear path, but instead navigate intersecting and goal-specific trajectories. This typological differentiation underlines the limitations of composite indices and strengthens the case for indicator-level, interpretable classification tools.
Soft Clustering and Uncertainty Diagnostics
While the classification tree provides interpretable rules for cluster membership, it does not capture transitional or ambiguous profiles where countries may exhibit features of multiple development paths. To address this, we implemented a soft clustering approach using a multinomial logistic regression model trained on the same SDG indicators and regional covariates.
This model estimates the posterior-like probability that each country belongs to one of the three identified clusters. The resulting triplets (P₀, P₁, P₂) for each country allow us to quantify classification uncertainty and identify hybrid cases (see Table A1 in Appendix A). Figure 6 visualises these soft memberships in a three-dimensional simplex plot, where each vertex corresponds to a cluster and the position of each point reflects its probabilistic allocation.
To further assess ambiguity, we computed Shannon entropy for each country’s probability vector. High entropy values indicate uncertainty in classification, suggesting transitional or structurally mixed profiles. Table 1 presents a ranked list of the most ambiguous cases. For example:
- Russian Federation displays nearly equal probabilities for Clusters 1 and 2 (P₁ = 0.54, P₂ = 0.46), indicating both progress in institutional domains and persistent structural asymmetries.
- Senegal splits between Clusters 0 and 1, reflecting intermediate success in key SDGs despite ongoing foundational challenges.
- Argentina and Serbia also fall into this uncertain zone, suggesting hybrid or path-dependent development patterns.
These results highlight that not all countries neatly fit into a single development typology. Instead, many occupy liminal spaces between clusters. This nuance underscores the limitations of hard classification and reinforces the value of probabilistic models for policy design.
Countries with high entropy require adaptive and context-sensitive interventions, rather than being targeted with uniform policy frameworks. By embracing soft boundaries, the model accommodates real-world complexity and better supports differentiated SDG governance.
Regional and Structural Distribution Patterns
Beyond statistical clustering, it is essential to assess how the identified typologies align with conventional regional groupings. Our soft classification results reveal strong, though not exclusive, regional tendencies within each cluster.
Cluster 0, which we label as structurally vulnerable, is predominantly composed of countries from Sub-Saharan Africa (e.g., Chad, Niger, Democratic Republic of Congo) and South Asia (e.g., Afghanistan, Pakistan). These countries exhibit consistently low SDG scores across foundational goals, including poverty, health, education, and infrastructure. Notably, 38 out of 46 Sub-Saharan countries fall into this group.
Cluster 1 represents a transitional or hybrid typology. It is compositionally diverse, encompassing countries from Latin America (e.g., Argentina, Guyana), Eastern Europe (e.g., Armenia, Georgia), the Middle East and North Africa (e.g., Jordan, Iraq), and parts of Asia (e.g., India, Indonesia). These countries demonstrate moderate progress, often accompanied by high uncertainty in classification, reflecting both developmental gains and structural constraints. This cluster captures the volatility and path-dependence of middle-tier development trajectories.
Cluster 2 includes countries with consolidated and high-performing development profiles. This group encompasses most OECD members (e.g., Germany, Sweden, Canada), as well as advanced economies in East Asia (e.g., Korea, Singapore). These countries tend to exhibit high SDG scores across all dimensions, particularly governance, health, education, and environmental goals.
However, while these regional patterns are statistically present, they do not fully explain cluster membership. Several countries defy geographic expectations. For example:
- Uruguay and Chile, despite being in Latin America, align with Cluster 2.
- Russia, geographically located in Eastern Europe and Central Asia, shows ambiguous membership between Clusters 1 and 2.
- Côte d’Ivoire and Botswana, African countries, demonstrate proximity to transitional profiles.
This pattern indicates that developmental typologies transcend geography, reflecting deeper structural dynamics such as institutional quality, policy coherence, or socio-economic resilience. The use of regional labels as covariates enhances model robustness but does not dominate classification, reinforcing the need for data-driven, typology-sensitive policy approaches.
These findings underscore that development is not solely region-bound but follows latent structural logics. Recognising this distinction is critical for avoiding overly generalised regional strategies and for promoting nuanced SDG interventions grounded in actual performance profiles.
Saturation Effects and Goal-Specific Differentiation
To better understand the internal structure of each cluster, we analysed the distribution of key SDG indicators using spline-based diagnostics and visualisations. Figure 7 displays smoothed distributions (violin plots) of the five most influential SDGs across clusters, highlighting both monotonic and non-monotonic trends.
Two goals Goal 1 (No Poverty) and Goal 3 (Good Health and Well-being) exhibit clear monotonic increases across clusters, from structurally vulnerable (Cluster 0) to consolidated high performers (Cluster 2). This pattern aligns with theoretical expectations: poverty alleviation and access to health are fundamental prerequisites for development and display consistent differentiation power.
Goals 6 (Clean Water and Sanitation) and 11 (Sustainable Cities and Communities) reveal more complex, nonlinear trajectories, particularly within Cluster 1. Here, we observe saturation effects: marginal improvements become less pronounced beyond a certain threshold. This plateauing suggests that after meeting basic infrastructure needs, further investments may yield diminishing returns unless accompanied by deeper institutional reform or innovation.
The most intriguing case is Goal 13 (Climate Action), which displays a non-monotonic distribution. Surprisingly, countries in Cluster 0 often score higher on Goal 13 than those in Cluster 2. This paradox likely reflects baseline effects — low-income countries may have lower emissions or benefit from international support, leading to inflated scores that do not necessarily indicate strong climate policies.
These findings reinforce several important insights:
- -
- SDG indicators differ in their discriminatory power and developmental sensitivity.
- -
- Saturation points complicate linear assumptions about progress and should be factored into policy prioritisation and cost-effectiveness analysis.
- -
- Not all goals are equally aligned with income or institutional maturity; some, like Goal 13, require context-specific interpretation.
By capturing these nuanced patterns, our model supports a shift from generic performance assessments toward goal-specific, typology-sensitive diagnostics. This enables policymakers to distinguish between foundational gaps, transitional bottlenecks, and advanced sustainability challenges — a distinction that is crucial for targeted SDG interventions.
Robustness and Model Evaluation
To assess the robustness and generalizability of our classification framework, we conducted a series of validation checks that spanned methodological comparisons, cross-validation metrics, and model sensitivity analyses.
First, we benchmarked the Bayesian Tree-Spline model against the unsupervised K-means clustering performed earlier on the PCA-reduced space. While the K-means approach served as a useful exploratory tool, it offered no mechanism for handling ambiguity or incorporating covariate structures. In contrast, the Bayesian model not only preserves cluster continuity but also adds interpretability through goal-level thresholds and soft classification. Visual comparison shows substantial overlap between the core of each cluster across both methods, with divergences primarily in transitional or boundary cases — precisely where uncertainty-aware modelling is most critical.
Second, we evaluated model fit using Leave-One-Out Cross-Validation (LOO-CV) and the Watanabe-Akaike Information Criterion (WAIC). The model achieved low values (WAIC ≈ 0.411; LOO-CV ≈ 0.206), indicating strong generalisability and favourable complexity-control trade-offs. These results suggest that the model avoids overfitting, even with hierarchical priors and spline components.
Third, we tested the model’s sensitivity to the inclusion of the regional covariate. Rerunning the model without regional labels resulted in slightly higher entropy in cluster probabilities and reduced alignment with real-world groupings, particularly in Cluster 1. While the region did not emerge as a direct splitting variable in the decision tree, its inclusion as a background covariate improved posterior estimates and enhanced the plausibility of soft assignments. This supports the interpretation that development is not determined by geography per se, but that regional context still modulates how SDG structures manifest.
Finally, we verified internal model coherence by examining posterior distributions of spline coefficients and classification tree thresholds. The most influential SDGs (e.g., Goals 1, 3, 6, 11, 13) consistently shaped cluster assignment across multiple posterior draws, confirming that the typology is not an artefact of sampling variance. Moreover, countries with high classification entropy (e.g., Argentina, Serbia, and Senegal) retained their ambiguous profiles across model specifications, further reinforcing the validity of soft classification.
Taken together, these robustness checks strengthen the reliability of our model. They demonstrate that the identified typologies are not only interpretable but also structurally stable and methodologically justified. As such, the framework offers a dependable foundation for deriving differentiated policy insights, especially in cases where linear models, hard classifications, or composite indices fall short.
4. Discussion
The findings of this study underline the added value of a probabilistic typology for interpreting cross-national sustainability trajectories. While standardised indices and dashboards remain influential, they are anchored in composite scores and league-table style comparisons that can flatten structural diversity and obscure the interplay of goals [1,2,3,4]. This critique is hardly new, yet it acquires renewed force as evidence accumulates that national progress is uneven across regions and scales, with spatial disparities persisting even where headline performance looks strong [5]. Our Bayesian Tree–Spline Classification Model addresses these concerns by revealing latent configurations of development and clarifying where pathways converge and diverge.
A central contribution of the model is its capacity to surface non-linearities and threshold effects. The saturation we observe in infrastructure- and urban-related outcomes aligns with recent applications of adaptive and spline-based methods in sustainability analysis, which demonstrate that marginal gains taper once systems exceed certain performance thresholds [6,7]. Such patterns mirror broader theoretical discussions in environmental and development economics on diminishing returns and dynamic system behaviour [8], suggesting that policy premised on linear improvement may be ill-suited to late-stage transitions.
Relative to the clustering literature on the Sustainable Development Goals, our results corroborate established regularities while extending them in two important directions. Earlier work has mapped the thematic and bibliometric contours of SDG research [12], and comparative analyses have grouped countries by performance levels or regional characteristics in Europe and beyond [9,10,17,18,28]. However, these contributions largely rely on rigid partitions with fixed assignments. By contrast, our soft membership probabilities acknowledge liminal cases and hybrid profiles that straddle categories, thus capturing the transitional nature of development modes that might otherwise be misclassified or ignored. This refinement also aligns with recent country- and region-focused studies that emphasise structural differentiation and evolving disparities [5,28,39].
The typologies developed here also resonate with long-standing debates in normative development theory. The capability approach insists that assessment should attend to substantive freedoms and opportunities rather than only to aggregate outputs [22,23,24]. Our empirical emphasis on structural heterogeneity and coexisting (sometimes conflicting) development profiles provides an evidential basis for this view and helps counter universalist narratives of convergence. Related arguments about the normative scope of sustainability—its ethical and evaluative dimensions—reinforce the case for classification frameworks that can accommodate plurality without sacrificing analytical clarity [25].
From a governance standpoint, the distinctions we draw between structurally vulnerable, transitional, and consolidated groups align with calls for differentiated strategies and more sophisticated institutional architectures. The literature has highlighted both the complexity of governance arrangements and the need for reform to strengthen SDG delivery in context-sensitive ways [20,21,26,27,37]. Our typology offers a diagnostic complement: rather than treating countries as points on a single scale, it groups them by latent structure, thereby offering a clearer analytic footing for aligning instruments and targets with systemic conditions. This perspective also extends arguments about differentiated responsibilities by grounding them in measurable development configurations rather than in generic status labels [1,21,27].
Methodologically, combining Bayesian decision-tree logic with penalised splines balances transparency and flexibility. Tree-based Bayesian approaches are well-suited to representing uncertainty and model adequacy [15,19], whilst spline-based techniques capture curvature, plateaus and saturation with parsimony [32,33,34]. In practice, this hybrid design yields outputs that remain interpretable to non-specialist audiences, an advantage over purely predictive tools (e.g., deep neural models) that often raise barriers to policy uptake [16]. It also aligns with recent work on SDG interlinkages and sensitivity, where causal and network-oriented approaches require methods that can capture non-linearity without compromising explainability [11,35,38].
Taken together, the discussion points to three contributions. First, it advances typology-sensitive SDG analysis beyond rigid classification by incorporating soft membership and explicit uncertainty. Secondly, it lends empirical substance to capability-based and governance-oriented perspectives, demonstrating that plural development futures are not an abstraction but a measurable reality [22,23,24,27]. Thirdly, it introduces a transparent probabilistic framework that can register thresholds and heterogeneity, thereby helping analysts and decision-makers move beyond composite indexation and simplistic dimensionality reduction [1,2,3,4,40,41].
5. Policy and Practical Implications
The typology has direct implications for policy design. For the structurally vulnerable cluster—typically marked by shortfalls in basic infrastructure, institutional capacity and social outcomes—priority should be given to foundational investments that stabilise progress across multiple goals. Cross-country evidence suggests that without such strengthening, advances remain brittle and prone to reversal [9,10,24,25]. International cooperation and targeted financing through the UN system, European institutions, and multilateral development banks can help address capacity constraints and reduce exposure to adverse shocks [1,21,27,37].
Countries in the transitional cluster exhibit ‘dual-speed’ development, with advancement on some goals offset by stagnation or regression on others. Here, the challenge is to balance prosperity with equity and ecological resilience, avoiding trade-offs that undermine long-term progress. Integrated governance approaches and policy coordination across goal domains are essential [37], with empirical reviews underscoring how early gains may falter when interventions are siloed [9]. Our results, including non-monotonic patterns in climate- and city-related outcomes, suggest that targeted measures to relieve bottlenecks—rather than uniform scaling of existing programmes—are more likely to produce durable gains [27,28,29].
For the consolidated cluster, where performance is high across most goals, the emphasis should shift from expansion to consolidation and innovation. Saturation effects in infrastructure- and prosperity-related domains imply diminishing returns to conventional capital deepening; therefore, strategic focus should pivot towards regenerative development, climate leadership, and reduced ecological footprints [28,29]. These countries are also well-positioned to pilot advanced policy instruments and to assume a greater share of global stewardship, consistent with forward-looking governance agendas [1,21,27].
Across all clusters, the probabilistic nature of the classification adds practical value. Hybrid or ambiguous memberships can be flagged for closer monitoring and adaptive management, reducing the risks associated with one-size-fits-all interventions. Because the framework works with goal-level indicators, it can be coupled with analyses of interlinkages and sensitivity to identify where targeted changes are most likely to tip systems towards more resilient configurations [11,35,38,39,40,41]. In short, the approach complements existing dashboards by supplying a meso-level diagnostic that is both structurally aware and policy-usable.
6. Limitations and Future Research
While this study introduces a novel framework for uncertainty-aware, typology-sensitive classification of SDG progress, several limitations must be acknowledged — not as caveats to be excused, but as entry points for the next generation of sustainability research.
First, the analysis is based on cross-sectional, static data. As such, it captures snapshots of development configurations, rather than their temporal dynamics. This is a standard limitation in SDG research, where longitudinal data coverage remains sparse. Yet in a context where sustainability is increasingly defined by tipping points, feedback loops, and policy reversibility, there is a growing need to shift toward dynamic typology models. Future work should explore how country trajectories evolve, specifically whether transitions between clusters are linear, cyclical, or path-dependent, and whether entropy decreases or intensifies as systems consolidate or destabilise. Bayesian dynamic models, including time-varying hierarchical trees or state-space clustering frameworks, hold promise in this area.
Second, while our model accounts for uncertainty and soft boundaries, it does not directly incorporate spatial dependence or network interlinkages between countries. Development, however, is not spatially independent: spillovers, regional convergence, and cross-border dynamics all shape SDG performance. Extending the framework to include spatial priors, regional adjacency matrices, or goal-specific network effects would provide a richer understanding of how structural similarities diffuse, cluster, or diverge across the global system. This could be particularly relevant for climate spillovers, migration-linked health pressures, or transnational governance patterns.
Third, the model relies on standardised SDG indicators, which, although comparable and widely used, may contain normative and methodological biases. Some indicators measure outcomes, others measure capacities; some are affected by reporting standards, while others are limited by data availability. Although our rejection of composite indices reduces this issue, a goal-specific measurement audit remains an essential step for future research. Mixed-method approaches could integrate our probabilistic classifications with qualitative typologies from ethnographic, institutional, or participatory research, especially in high-entropy countries.
Finally, while the model focuses on classification, it does not yet model causality or inter-goal dynamics. Bayesian graphical models, Granger causality extensions, or structural equation frameworks could enrich the current approach by uncovering the causal architectures that underpin development modes. This could enable not just classification, but intervention mapping: identifying which goal-level investments are most likely to shift a system across thresholds, reduce entropy, or sustain typological transitions.
In sum, the limitations of this study are not methodological deficits but structural invitations. They point toward a new research agenda — one that moves beyond benchmarking to the dynamic, causal, and spatial articulation of sustainable development pathways. Such work will be essential not only for tracking the final stretch of the 2030 Agenda but for shaping the post-2030 governance era, where resilience, reflexivity, and typology-sensitive thinking will define the next frontier of sustainability science.
7. Conclusions
This study has proposed a new framework for understanding global progress on the Sustainable Development Goals — one that moves beyond aggregate rankings and instead embraces the structural, nonlinear, and uncertain nature of development. By integrating Bayesian decision trees, penalised splines, and soft probabilistic classification, we construct a typology of national SDG performance that respects ambiguity, reveals saturation dynamics, and foregrounds goal-specific trade-offs.
Rather than imposing externally defined categories or composite scores, our model inductively derives three latent development modes from raw SDG indicator data: structurally vulnerable systems, transitional configurations, and consolidated but tension-laden regimes. Importantly, this classification is not rigid or deterministic. It accommodates cases of hybridity and high entropy, providing a richer vocabulary for describing the complex and ambiguous realities of sustainability governance.
The theoretical grounding in the capabilities approach and critical sustainability science allows us to interpret these typologies not merely as statistical artefacts, but as manifestations of what societies are structurally able — or unable — to achieve. The developmental architecture captured by our model highlights that pathways to sustainability are not only divergent but also deeply conditioned by internal asymmetries, institutional feedback, and threshold effects. Our findings carry both empirical and epistemological significance. Empirically, they offer a tool for soft, interpretable classification that can guide differentiated policy design — especially in transitional or liminal contexts where rigid models often fail. Epistemologically, they suggest a shift in how development is conceptualised: from linear progression toward plural configurations, from benchmarking to navigation, and from targets to typologies.
As the international community moves into the final phase of the 2030 Agenda — and increasingly contemplates the contours of the post-2030 order — such frameworks will be vital. The SDGs were conceived as universal goals, but their implementation requires tools that honour diversity, recognise uncertainty, and respond to complexity. By linking structure to policy, uncertainty to governance, and typology to justice, this study contributes to the emergence of a more grounded, reflexive, and adaptive sustainability science.
Author Contributions
Conceptualization, O.L., O.P., K.P., R.С., A.C., A.S., and T.V.; methodology, O.L., O.P., K.P., R.С., A.C., A.S., and T.V.; analysis and selection of sources and the literature, O.L., O.P., K.P., R.С., A.C., A.S., and T.V.; consultations on material and technical issues, O.L., O.P., K.P., R.С., A.C., A.S., and T.V.; literature review, O.L., O.P., K.P., R.С., A.C., A.S., and T.V.; writing—original draft O.L., O.P., K.P., R.С., A.C., A.S., and T.V.; writing—review and editing, O.L., O.P., K.P., R.С., A.C., A.S., and T.V.; supervision, O.L., K.P. and O.P.; funding acquisition, R.C. All authors have read and agreed to the published version of the manuscript.
Funding
This work was supported by a subsidy from the Ministry of Education and Science for the WSEI (Project No 8/121/226upf).
Data Availability Statement
The study utilises separate Index Scores for each SDG and SDG Index Score compiled by the Sustainable Development Solutions Network (SDSN) and published annually in the Sustainable Development Report. These scores are also disseminated via the UN SDG Global Database. All data are openly accessible at: https://dashboards.sdgindex.org/downloads/ (accessed on 12 August 2025), https://unstats.un.org/sdgs/indicators/database (accessed on 12 August 2025) and https://sdgindex.org/reports/ (accessed on 12 August 2025). In accordance with the licensing conditions of the United Nations and SDSN, the authors do not hold the rights to redistribute the dataset. Researchers are therefore encouraged to access it directly through the official portal. The complete output files generated during the study are available from the corresponding author upon reasonable request.
Conflicts of Interest
The authors declare that they have no conflicts of interest.
Appendix A

Table A1.
Full posterior soft classification results.
| Country | Region |
P (Cluster 0) |
P (Cluster 1) |
P (Cluster2) |
Entropy |
| Afghanistan | E. Europe & C. Asia | 0.99991 | 9E-05 | 1.23E-14 | 0.000928 |
| Angola | Sub-Saharan Africa | 0.99627 | 0.00373 | 1.9E-10 | 0.024581 |
| Albania | E. Europe & C. Asia | 0.000131 | 0.891032 | 0.108836 | 0.345364 |
| United Arab Emirates | MENA | 1.21E-05 | 0.898077 | 0.101911 | 0.329409 |
| Argentina | LAC | 4.07E-05 | 0.380812 | 0.619147 | 0.664893 |
| Armenia | E. Europe & C. Asia | 0.000638 | 0.962965 | 0.036396 | 0.161628 |
| Australia | OECD | 1.38E-10 | 0.000509 | 0.999491 | 0.004369 |
| Austria | OECD | 6.84E-12 | 0.00013 | 0.99987 | 0.001297 |
| Azerbaijan | E. Europe & C. Asia | 0.000643 | 0.98968 | 0.009678 | 0.059874 |
| Burundi | Sub-Saharan Africa | 0.997601 | 0.002399 | 3.5E-08 | 0.01687 |
| Belgium | OECD | 8.41E-11 | 0.000432 | 0.999568 | 0.003777 |
| Benin | Sub-Saharan Africa | 0.970835 | 0.029165 | 6.68E-09 | 0.131828 |
| Burkina Faso | Sub-Saharan Africa | 0.999482 | 0.000518 | 1.59E-10 | 0.004434 |
| Bangladesh | East & South Asia | 0.048297 | 0.951696 | 6.99E-06 | 0.193559 |
| Bulgaria | E. Europe & C. Asia | 1.29E-06 | 0.06339 | 0.936609 | 0.236213 |
| Bahrain | MENA | 0.000268 | 0.995674 | 0.004058 | 0.028869 |
| Bahamas. The | LAC | 0.014025 | 0.9731 | 0.012875 | 0.142415 |
| Bosnia and Herzegovina | E. Europe & C. Asia | 8.23E-05 | 0.827181 | 0.172737 | 0.461041 |
| Belarus | E. Europe & C. Asia | 2.04E-06 | 0.11785 | 0.882148 | 0.362647 |
| Belize | LAC | 0.025596 | 0.969255 | 0.00515 | 0.151217 |
| Bolivia | LAC | 0.003426 | 0.995239 | 0.001335 | 0.033035 |
| Brazil | LAC | 1.66E-05 | 0.328122 | 0.671861 | 0.633033 |
| Barbados | LAC | 0.000832 | 0.82002 | 0.179148 | 0.476666 |
| Brunei Darussalam | East & South Asia | 4.93E-06 | 0.339657 | 0.660338 | 0.640871 |
| Bhutan | East & South Asia | 0.000857 | 0.951483 | 0.04766 | 0.198433 |
| Botswana | Sub-Saharan Africa | 0.231067 | 0.768476 | 0.000457 | 0.544413 |
| Central African Republic | Sub-Saharan Africa | 0.999997 | 2.82E-06 | 2.25E-15 | 3.89E-05 |
| Canada | OECD | 1.65E-10 | 0.000784 | 0.999216 | 0.006388 |
| Switzerland | OECD | 1.56E-10 | 0.000467 | 0.999533 | 0.004049 |
| Chile | OECD | 1.06E-07 | 0.020316 | 0.979683 | 0.09927 |
| China | East & South Asia | 2.89E-05 | 0.8067 | 0.193271 | 0.491256 |
| Cote d'Ivoire | Sub-Saharan Africa | 0.681918 | 0.318079 | 2.9E-06 | 0.625452 |
| Cameroon | Sub-Saharan Africa | 0.96876 | 0.03124 | 5.52E-08 | 0.139028 |
| Congo. Dem. Rep. | Sub-Saharan Africa | 0.999929 | 7.14E-05 | 6.61E-13 | 0.000753 |
| Congo. Rep. | Sub-Saharan Africa | 0.998652 | 0.001348 | 3.95E-10 | 0.010253 |
| Colombia | OECD | 0.001173 | 0.88737 | 0.111458 | 0.358499 |
| Comoros | Sub-Saharan Africa | 0.998566 | 0.001434 | 1.97E-11 | 0.010822 |
| Cabo Verde | Sub-Saharan Africa | 0.098534 | 0.900906 | 0.00056 | 0.326544 |
| Costa Rica | OECD | 0.00034 | 0.769861 | 0.229799 | 0.542 |
| Cuba | LAC | 8.04E-06 | 0.089052 | 0.91094 | 0.300441 |
| Cyprus | E. Europe & C. Asia | 4.49E-06 | 0.184486 | 0.81551 | 0.478187 |
| Czechia | OECD | 1.64E-09 | 0.000813 | 0.999187 | 0.006598 |
| Germany | OECD | 7.82E-12 | 8.27E-05 | 0.999917 | 0.00086 |
| Djibouti | Sub-Saharan Africa | 0.992541 | 0.007459 | 1.91E-10 | 0.043969 |
| Denmark | OECD | 1.78E-13 | 1.11E-05 | 0.999989 | 0.000137 |
| Dominican Republic | LAC | 0.000524 | 0.946233 | 0.053243 | 0.212411 |
| Algeria | MENA | 0.00368 | 0.995956 | 0.000364 | 0.027545 |
| Ecuador | LAC | 0.002822 | 0.984216 | 0.012962 | 0.088556 |
| Egypt. Arab Rep. | MENA | 0.006397 | 0.993176 | 0.000427 | 0.042431 |
| Spain | OECD | 9.01E-09 | 0.003756 | 0.996244 | 0.024726 |
| Estonia | OECD | 5.05E-10 | 0.000459 | 0.999541 | 0.00399 |
| Ethiopia | Sub-Saharan Africa | 0.997014 | 0.002986 | 1.83E-10 | 0.020341 |
| Finland | OECD | 3.42E-12 | 4.1E-05 | 0.999959 | 0.000455 |
| Fiji | Oceania | 0.00141 | 0.996984 | 0.001605 | 0.022597 |
| France | OECD | 1.76E-10 | 0.000387 | 0.999613 | 0.003427 |
| Gabon | Sub-Saharan Africa | 0.164069 | 0.835822 | 0.000109 | 0.447443 |
| United Kingdom | OECD | 2.6E-10 | 0.000256 | 0.999744 | 0.002374 |
| Georgia | E. Europe & C. Asia | 0.000146 | 0.788318 | 0.211535 | 0.517386 |
| Ghana | Sub-Saharan Africa | 0.19325 | 0.806627 | 0.000123 | 0.492102 |
| Guinea | Sub-Saharan Africa | 0.985059 | 0.014941 | 1.22E-09 | 0.077637 |
| Gambia. The | Sub-Saharan Africa | 0.98891 | 0.01109 | 4.66E-08 | 0.060952 |
| Guinea-Bissau | Sub-Saharan Africa | 0.999793 | 0.000207 | 2.45E-12 | 0.001961 |
| Greece | OECD | 1.11E-07 | 0.012212 | 0.987788 | 0.065936 |
| Guatemala | LAC | 0.713152 | 0.286846 | 2.25E-06 | 0.599334 |
| Guyana | LAC | 0.000567 | 0.923288 | 0.076145 | 0.27401 |
| Honduras | LAC | 0.370109 | 0.629846 | 4.5E-05 | 0.659489 |
| Croatia | E. Europe & C. Asia | 1.76E-09 | 0.001347 | 0.998653 | 0.010248 |
| Haiti | LAC | 0.995915 | 0.004085 | 5.82E-11 | 0.026547 |
| Hungary | OECD | 2.92E-07 | 0.015903 | 0.984096 | 0.08164 |
| Indonesia | East & South Asia | 0.001937 | 0.996433 | 0.00163 | 0.026125 |
| India | East & South Asia | 0.041448 | 0.958511 | 4.13E-05 | 0.172976 |
| Ireland | OECD | 1.23E-10 | 0.000312 | 0.999688 | 0.002831 |
| Iran. Islamic Rep. | MENA | 0.004611 | 0.993747 | 0.001642 | 0.041565 |
| Iraq | MENA | 0.036828 | 0.963171 | 8.67E-07 | 0.157743 |
| Iceland | OECD | 3.65E-09 | 0.011069 | 0.988931 | 0.060857 |
| Israel | OECD | 6.28E-06 | 0.235905 | 0.764089 | 0.546393 |
| Italy | OECD | 6.39E-08 | 0.010733 | 0.989266 | 0.059347 |
| Jamaica | LAC | 0.001644 | 0.987481 | 0.010875 | 0.072148 |
| Jordan | MENA | 0.024262 | 0.975721 | 1.72E-05 | 0.114397 |
| Japan | OECD | 5.12E-09 | 0.007804 | 0.992196 | 0.045648 |
| Kazakhstan | E. Europe & C. Asia | 0.00023 | 0.934639 | 0.065131 | 0.243003 |
| Kenya | Sub-Saharan Africa | 0.764937 | 0.235055 | 7.57E-06 | 0.545407 |
| Kyrgyz Republic | E. Europe & C. Asia | 0.000699 | 0.986561 | 0.012741 | 0.074011 |
| Cambodia | East & South Asia | 0.036446 | 0.963492 | 6.22E-05 | 0.157142 |
| Korea. Rep. | OECD | 7.23E-08 | 0.060705 | 0.939295 | 0.228903 |
| Kuwait | MENA | 0.000146 | 0.994512 | 0.005342 | 0.034712 |
| Lao PDR | East & South Asia | 0.061756 | 0.938029 | 0.000216 | 0.233794 |
| Lebanon | MENA | 0.062044 | 0.93795 | 5.52E-06 | 0.232627 |
| Liberia | Sub-Saharan Africa | 0.999698 | 0.000302 | 4.56E-12 | 0.002751 |
| Sri Lanka | East & South Asia | 0.027009 | 0.972026 | 0.000965 | 0.131827 |
| Lesotho | Sub-Saharan Africa | 0.99526 | 0.00474 | 3.66E-09 | 0.030096 |
| Lithuania | OECD | 5.56E-08 | 0.004601 | 0.995398 | 0.029354 |
| Luxembourg | OECD | 9.89E-11 | 0.000286 | 0.999714 | 0.002623 |
| Latvia | OECD | 1.84E-09 | 0.0006 | 0.9994 | 0.005049 |
| Morocco | MENA | 0.004726 | 0.991791 | 0.003484 | 0.053197 |
| Moldova | E. Europe & C. Asia | 1.23E-05 | 0.288865 | 0.711123 | 0.60128 |
| Madagascar | Sub-Saharan Africa | 0.999303 | 0.000697 | 1.06E-10 | 0.005763 |
| Maldives | East & South Asia | 0.001863 | 0.988992 | 0.009145 | 0.065591 |
| Mexico | OECD | 0.003682 | 0.985157 | 0.011161 | 0.08554 |
| North Macedonia | E. Europe & C. Asia | 0.000267 | 0.902377 | 0.097356 | 0.321673 |
| Mali | Sub-Saharan Africa | 0.990868 | 0.009132 | 2.01E-08 | 0.051974 |
| Malta | E. Europe & C. Asia | 1.12E-07 | 0.013048 | 0.986951 | 0.069583 |
| Myanmar | East & South Asia | 0.114636 | 0.885361 | 2.97E-06 | 0.35614 |
| Montenegro | E. Europe & C. Asia | 6.74E-05 | 0.957 | 0.042932 | 0.177865 |
| Mongolia | East & South Asia | 0.00153 | 0.990218 | 0.008252 | 0.05924 |
| Mozambique | Sub-Saharan Africa | 0.993431 | 0.006569 | 2.64E-08 | 0.039561 |
| Mauritania | Sub-Saharan Africa | 0.982034 | 0.017966 | 5.71E-10 | 0.090014 |
| Mauritius | Sub-Saharan Africa | 0.000602 | 0.939324 | 0.060074 | 0.232199 |
| Malawi | Sub-Saharan Africa | 0.982107 | 0.017893 | 1.16E-07 | 0.089724 |
| Malaysia | East & South Asia | 0.000383 | 0.982871 | 0.016746 | 0.088481 |
| Namibia | Sub-Saharan Africa | 0.130065 | 0.863426 | 0.006508 | 0.424856 |
| Niger | Sub-Saharan Africa | 0.999857 | 0.000143 | 9.25E-13 | 0.001412 |
| Nigeria | Sub-Saharan Africa | 0.983258 | 0.016742 | 5.71E-10 | 0.085073 |
| Nicaragua | LAC | 0.179756 | 0.819783 | 0.000461 | 0.474934 |
| Netherlands | OECD | 5.45E-12 | 0.000103 | 0.999897 | 0.001048 |
| Norway | OECD | 3.76E-13 | 3.5E-05 | 0.999965 | 0.000394 |
| Nepal | East & South Asia | 0.021061 | 0.978877 | 6.29E-05 | 0.102809 |
| New Zealand | OECD | 8.9E-10 | 0.001504 | 0.998496 | 0.011279 |
| Oman | MENA | 0.000575 | 0.991465 | 0.007959 | 0.051262 |
| Pakistan | East & South Asia | 0.945619 | 0.054381 | 4.61E-10 | 0.211218 |
| Panama | LAC | 0.004388 | 0.960285 | 0.035326 | 0.180839 |
| Peru | LAC | 0.001022 | 0.985128 | 0.01385 | 0.081069 |
| Philippines | East & South Asia | 0.009761 | 0.989793 | 0.000445 | 0.058779 |
| Papua New Guinea | Oceania | 0.999602 | 0.000398 | 4.15E-11 | 0.003517 |
| Poland | OECD | 1.47E-08 | 0.003414 | 0.996586 | 0.0228 |
| Portugal | OECD | 2.07E-08 | 0.006977 | 0.993023 | 0.041596 |
| Paraguay | LAC | 0.000936 | 0.993252 | 0.005812 | 0.043171 |
| Qatar | MENA | 1.81E-05 | 0.901165 | 0.098817 | 0.322689 |
| Romania | E. Europe & C. Asia | 1.56E-05 | 0.23269 | 0.767295 | 0.54269 |
| Russian Federation | E. Europe & C. Asia | 3.22E-05 | 0.543567 | 0.456401 | 0.689687 |
| Rwanda | Sub-Saharan Africa | 0.814667 | 0.185286 | 4.77E-05 | 0.479827 |
| Saudi Arabia | MENA | 0.000153 | 0.996708 | 0.003139 | 0.022725 |
| Sudan | Sub-Saharan Africa | 0.999959 | 4.06E-05 | 8.44E-15 | 0.000451 |
| Senegal | Sub-Saharan Africa | 0.423052 | 0.576872 | 7.57E-05 | 0.68201 |
| Singapore | East & South Asia | 2.62E-07 | 0.109261 | 0.890739 | 0.344972 |
| Sierra Leone | Sub-Saharan Africa | 0.98463 | 0.01537 | 2.8E-09 | 0.079427 |
| El Salvador | LAC | 0.005395 | 0.992997 | 0.001608 | 0.045496 |
| Somalia | Sub-Saharan Africa | 0.999994 | 6.32E-06 | 8.09E-15 | 8.19E-05 |
| Serbia | E. Europe & C. Asia | 3.79E-06 | 0.369445 | 0.630551 | 0.658709 |
| South Sudan | Sub-Saharan Africa | 1 | 2.12E-07 | 3.49E-18 | 3.47E-06 |
| Sao Tome and Principe | Sub-Saharan Africa | 0.897682 | 0.102317 | 1.09E-06 | 0.330161 |
| Suriname | LAC | 0.001943 | 0.995283 | 0.002773 | 0.033167 |
| Slovak Republic | OECD | 1.72E-07 | 0.016431 | 0.983569 | 0.083807 |
| Slovenia | OECD | 1.08E-09 | 0.000857 | 0.999143 | 0.00691 |
| Sweden | OECD | 2.79E-12 | 8.68E-05 | 0.999913 | 0.000899 |
| Eswatini | Sub-Saharan Africa | 0.88614 | 0.113859 | 8.3E-07 | 0.354521 |
| Syrian Arab Republic | MENA | 0.860305 | 0.139695 | 2E-07 | 0.404412 |
| Chad | Sub-Saharan Africa | 0.999994 | 5.61E-06 | 2.11E-15 | 7.34E-05 |
| Togo | Sub-Saharan Africa | 0.979007 | 0.020993 | 6.53E-08 | 0.101881 |
| Thailand | East & South Asia | 6.65E-05 | 0.807558 | 0.192375 | 0.490341 |
| Tajikistan | E. Europe & C. Asia | 0.013111 | 0.986505 | 0.000384 | 0.073249 |
| Turkmenistan | E. Europe & C. Asia | 0.006373 | 0.991771 | 0.001856 | 0.052088 |
| Trinidad and Tobago | LAC | 0.00248 | 0.962612 | 0.034908 | 0.168679 |
| Tunisia | MENA | 0.001343 | 0.995444 | 0.003212 | 0.031871 |
| Türkiye | OECD | 0.000489 | 0.982014 | 0.017497 | 0.092336 |
| Tanzania | Sub-Saharan Africa | 0.976932 | 0.023068 | 4.17E-07 | 0.109756 |
| Uganda | Sub-Saharan Africa | 0.984456 | 0.015544 | 3.36E-08 | 0.080148 |
| Ukraine | E. Europe & C. Asia | 0.00016 | 0.879948 | 0.119893 | 0.368246 |
| Uruguay | LAC | 1.9E-07 | 0.046723 | 0.953277 | 0.188753 |
| United States | OECD | 1.62E-07 | 0.034709 | 0.965291 | 0.150751 |
| Uzbekistan | E. Europe & C. Asia | 0.006646 | 0.992148 | 0.001206 | 0.04925 |
| Venezuela. RB | LAC | 0.276924 | 0.718023 | 0.005054 | 0.620144 |
| Vietnam | East & South Asia | 3.33E-05 | 0.913207 | 0.086759 | 0.295349 |
| Yemen. Rep. | MENA | 0.999974 | 2.61E-05 | 6.93E-15 | 0.000301 |
| South Africa | Sub-Saharan Africa | 0.037377 | 0.961184 | 0.001439 | 0.170317 |
| Zambia | Sub-Saharan Africa | 0.989075 | 0.010925 | 1.91E-08 | 0.060209 |
| Zimbabwe | Sub-Saharan Africa | 0.987932 | 0.012068 | 2.64E-07 | 0.065304 |
Appendix A.2. Analytical Procedure and Computational Environment
All analyses presented in this study were conducted in Python 3.11. The computational workflow involved data preparation, dimensionality reduction, clustering, supervised classification, probabilistic modelling, and exploratory regressions. The following open-source Python libraries were used at different stages:
pandas, numpy – for data preprocessing, merging, and z-score standardisation of SDG indicators;
scikit-learn – for principal component analysis (PCA), K-means clustering, decision tree classification, and exploratory regressions;
pymc – for Bayesian modelling, including tree-based classifiers and spline regressions capturing nonlinear goal-level patterns;
bambi – used in selected stages for specifying Bayesian models, including spline terms;
statsmodels – used for regressions, including estimation of soft cluster membership;
arviz – for Bayesian model diagnostics, including posterior predictive checks, WAIC, and leave-one-out cross-validation (LOO-CV);
matplotlib, seaborn, plotly – for visualisation of SDG distributions, decision tree, etc.
The analytical procedure included:
1. Data import, cleaning, and standardisation of 17 SDG indicators;
2. Dimensionality reduction via PCA for visual exploration;
3. K-means clustering to derive an initial three-cluster typology;
4. Supervised classification using a decision tree to identify goal-level thresholds;
5. Probabilistic soft clustering via multinomial logistic regression based on SDG indicators and regional covariates;
6. Penalised spline regressions to identify nonlinear goal dynamics (e.g., saturation, non-monotonicity);
7. Robustness checks using alternative models and specification testing.
All outputs were generated in Python using the libraries above. Full computational reproducibility is supported through version-controlled scripts, which will be made available upon reasonable request.
References
- Sachs, J.D.; Lafortune, G.; Fuller, G. The SDGs and the UN Summit of the Future. Sustainable Development Report 2024; SDSN: Paris, France; Dublin University Press: Dublin, Ireland, 2024. [CrossRef]
- Griggs, D.; Nilsson, M.; Stevance, A.; McCollum, D. A Guide to SDG Interactions: From Science to Implementation; International Council for Science (ICSU): Paris, France, 2017; Available online: https://council.science/wp-content/uploads/2017/05/SDGs-Guide-to-Interactions.pdf (accessed on 28 June 2025).
- OECD. Measuring Distance to the SDG Targets 2019: An Assessment of Where OECD Countries Stand; OECD Publishing: Paris, France, 2019. [Google Scholar] [CrossRef]
- Miola, A.; Schiltz, F. Measuring Sustainable Development Goals Performance: How to Monitor Policy Action in the 2030 Agenda Implementation? Ecol. Econ. 2019, 164, 106373. [Google Scholar] [CrossRef] [PubMed]
- Gracia-de-Rentería, P.; Ramos, R.; Artal-Tur, A. Sustainable Development Goals in the European Union and Its Regions: Measuring Progress and Spatial Disparities. Sustain. Dev. 2023, 31, 456–472. [Google Scholar] [CrossRef]
- Liashenko, O.; Pavlova, O.; Pavlov, K.; Lechowicz, T.; Szarota, R.; Nagara, M.; Hrytsiyk, N. Unveiling Tipping Points in European Sustainability: A Nonlinear MARS Approach to People, Planet, and Prosperity. Sustainability 2025, 17, 8692. [Google Scholar] [CrossRef]
- Naser, A.; Badr, A.; Henedy, S.N.; Ostrowski, K.A.; Imran, H. Application of Multivariate Adaptive Regression Splines (MARS) Approach in Prediction of Compressive Strength of Eco-Friendly Concrete. Case Stud. Constr. Mater. 2022, 17, e01262. [Google Scholar] [CrossRef]
- Barbier, E.B.; Burgess, J.C. Sustainable Development and the Dynamics of Economic and Environmental Systems. Environ. Dev. Econ. 2019, 24, 451–470. [Google Scholar] [CrossRef]
- Allen, C.; Metternicht, G.; Wiedmann, T. Initial Progress in Implementing the Sustainable Development Goals (SDGs): A Review of Evidence from Countries. Sustain. Sci. 2018, 13, 1453–1467. [Google Scholar] [CrossRef]
- Lopatkova, Y. Achieving Sustainable Development: A Baseline Analysis of Western and Eastern European Countries. R-Econ. 2021, 7, 18–27. [Google Scholar] [CrossRef]
- Dörgő, G.; Sebestyén, V.; Abonyi, J. Evaluating the Interconnectedness of the Sustainable Development Goals Based on the Causality Analysis of Sustainability Indicators. Sustainability 2018, 10, 3766. [Google Scholar] [CrossRef]
- Mishra, M.; Sudarsan, D.; Santos, C.; Mishra, S.; Kamal, A.; Goswami, S.; et al. A Bibliometric Analysis of Sustainable Development Goals (SDGs): A Review of Progress, Challenges, and Opportunities. Environ. Dev. Sustain. 2023, 26, 11101–11143. [Google Scholar] [CrossRef]
- Hossain, M.; Rahman, A.; Uddin, M.; Zinia, F. The Double Burden of Malnutrition among Women of Reproductive Age in Bangladesh: A Comparative Study of Classical and Bayesian Logistic Regression Approaches. Food Sci. Nutr. 2023, 11, 1785–1796. [Google Scholar] [CrossRef]
- Leonelli, M.; Riccomagno, E. A Geometric Characterisation of Sensitivity Analysis in Monomial Models. arXiv arXiv:1901.02058, 2019. [CrossRef]
- Vehtari, A.; Gelman, A.; Gabry, J. Practical Bayesian Model Evaluation Using Leave-One-Out Cross-Validation and WAIC. Stat. Comput. 2017, 27, 1413–1432. [Google Scholar] [CrossRef]
- Yang, T.; Yang, T. Classified as Unknown: A Novel Bayesian Neural Network. arXiv preprint arXiv:2301.13401, 2023. [CrossRef]
- Grzebyk, M.; Stec, M. Sustainable Development in EU Countries: Concept and Rating of Levels of Development. Sustain. Dev. 2015, 23, 110–123. [Google Scholar] [CrossRef]
- Zhou, K.; Chen, H.; Ismail, M.; Yang, T. Assessment of Sustainable Development Levels, Country Disparities, and Dynamic Evolution Trends of ASEAN-10 Countries. Sustain. Dev. 2025, 1–22. [Google Scholar] [CrossRef]
- Chipman, H.A.; George, E.I.; McCulloch, R.E. BART: Bayesian Additive Regression Trees. Ann. Appl. Stat. 2010, 4, 266–298. [Google Scholar] [CrossRef]
- Brogna, V. Governing through Goals: Sustainable Development Goals as Governance Innovation. Int. Aff. 2018, 94, 441–442. [Google Scholar] [CrossRef]
- Biermann, F.; Sun, Y.; Banik, D.; Beisheim, M.; Bloomfield, M.J.; Charles, A.; Chasek, P.; Hickmann, T.; Pradhan, P.; Sénit, A. Four Governance Reforms to Strengthen the SDGs. Science 2023. [Google Scholar] [CrossRef]
- Sen, A. The Ends and Means of Sustainability. J. Hum. Dev. Capab. 2013, 14, 6–20. [Google Scholar] [CrossRef]
- Nussbaum, M.C. Creating Capabilities: The Human Development Approach; The Belknap Press of Harvard University Press: Cambridge, MA, USA, 2011. [Google Scholar] [CrossRef]
- Robeyns, I. The Capability Approach: A Theoretical Survey. J. Hum. Dev. 2005, 6, 93–117. [Google Scholar] [CrossRef]
- Demals, T.; Hyard, A. Is Amartya Sen’s Sustainable Freedom a Broader Vision of Sustainability? Ecol. Econ. 2014, 102, 33–38. [Google Scholar] [CrossRef]
- Biermann, F.; Kim, R.E. The Boundaries of the Planetary Boundary Framework: A Critical Appraisal of Approaches to Define a “Safe Operating Space” for Humanity. Annu. Rev. Environ. Resour. 2020, 45, 497–521. [Google Scholar] [CrossRef]
- Biermann, F.; Kim, R.E. Architectures of Earth System Governance: Institutional Complexity and Structural Transformation. Curr. Opin. Environ. Sustain. 2020, 42, 51–57. [Google Scholar] [CrossRef]
- Kudełko, J. Development Sustainability Levels in EU Countries. Sustain. Dev. 2024, 32, 1234–1251. [Google Scholar] [CrossRef]
- Carlsen, L. The State of the ‘Prosperity’ Pillar by 2022: A Partial Ordering-Based Analysis of the Sustainable Development Goals 7–11. J. Clean. Prod. 2022, 368, 133140. [Google Scholar] [CrossRef]
- Idris, A.; Razak, A.R. Energy Transition, Green Growth and Emission on Economic Growth Using Spline Approach: Evidence from Asia-Pacific Countries. Econ. Innov. Econ. Res. J. 2025, 13, 139–159. [Google Scholar] [CrossRef]
- Saeed, U.F. Achieving SDGs in Developing Economies: A CS-ARDL Analysis of the Effects of Industrial Growth and Foreign Investment on Carbon and Ecological Footprints. J. Sustain. Financ. Account. 2025, 8, 100025. [Google Scholar] [CrossRef]
- Perperoglou, A.; Sauerbrei, W.; Abrahamowicz, M. A Review of Spline Function Procedures in R. BMC Med. Res. Methodol. 2019, 19, 46. [Google Scholar] [CrossRef]
- Eilers, P.H.C.; Marx, B.D. Splines, Knots, and Penalties. Wiley Interdiscip. Rev. Comput. Stat. 2010, 2, 637–653. [Google Scholar] [CrossRef]
- Friedman, J.H. Multivariate Adaptive Regression Splines. Ann. Stat. 1991, 19, 1–67. [Google Scholar] [CrossRef]
- Liashenko, O.; Dluhopolskyi, O. The Statistical Approach to Understanding the Interdependencies among Sustainable Development Goals. Econ.-Innov. Econ. Res. J. 2025, 13, 449–467. [Google Scholar] [CrossRef]
- Charbonneau, B.; Giguère, A. The Poly-Crisis and the Uncertain Possibility Space. Glob. Sustain. 2025, 8, e9. [Google Scholar] [CrossRef]
- Kanie, N.; Biermann, F. (Eds.) Governing Through Goals: Sustainable Development Goals as Governance Innovation; MIT Press: Cambridge, MA, USA, 2017. [Google Scholar]
- Kuc-Czarnecka, M.; Markowicz, I.; Sompolska-Rzechuła, A. SDGs Implementation, Their Synergies, and Trade-Offs in EU Countries—Sensitivity Analysis-Based Approach. Ecol. Indic. 2023, 146, 109888. [Google Scholar] [CrossRef]
- Košíková, M.; Vašaničová, P. Exploring the Link between Digital Readiness and Sustainable Development: A Cluster Analysis of EU Countries. Sustainability 2025, 17, 5080. [Google Scholar] [CrossRef]
- Mazziotta, M.; Pareto, A. Methods for Constructing Composite Indices: One for All or All for One? Ital. Econ. J. 2016, 2, 229–253, https://scispace.com/pdf/methods-for-constructing-composite-indices-one-for-allor-g1ws6c33dz.pdf (accessed on 20 August 2025).. [Google Scholar]
- Mazziotta, M.; Pareto, A. Use and Misuse of PCA for Measuring Well-Being. Soc. Indic. Res. 2018, 142, 451–476. [Google Scholar] [CrossRef]
Figure 1.
Conceptual flowchart of the modelling pipeline for SDG-based country classification and policy interpretation.
Figure 1.
Conceptual flowchart of the modelling pipeline for SDG-based country classification and policy interpretation.
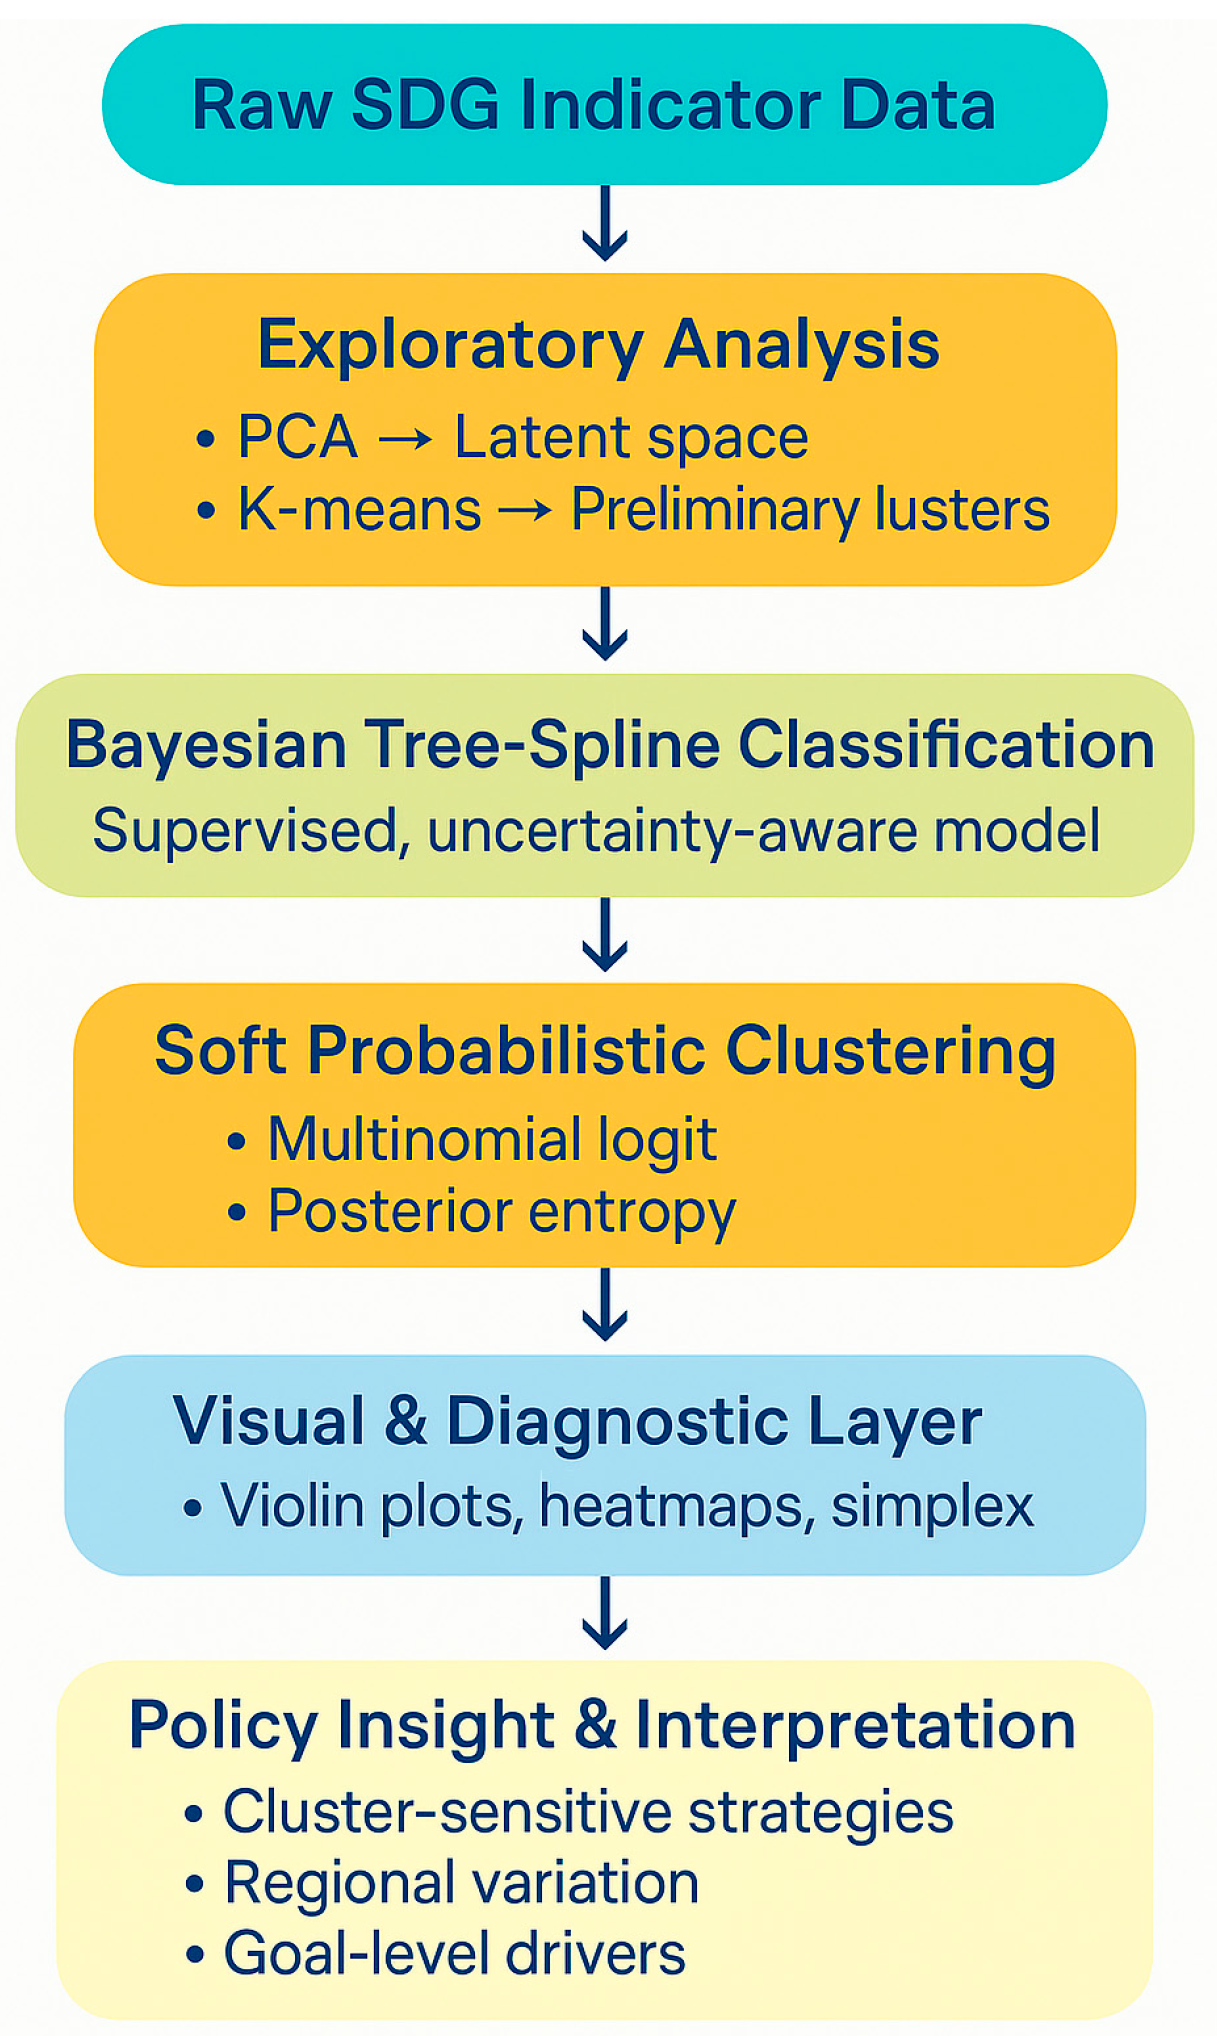
Figure 2.
PCA projection of SDG performance across countries, coloured by regional affiliation. The first two principal components capture the majority of variance in the 17-dimensional SDG indicator space. Countries in Sub-Saharan Africa and South-East Asia tend to cluster closely, suggesting shared development patterns, while Latin American countries are more centrally distributed, reflecting transitional or mixed performance profiles.
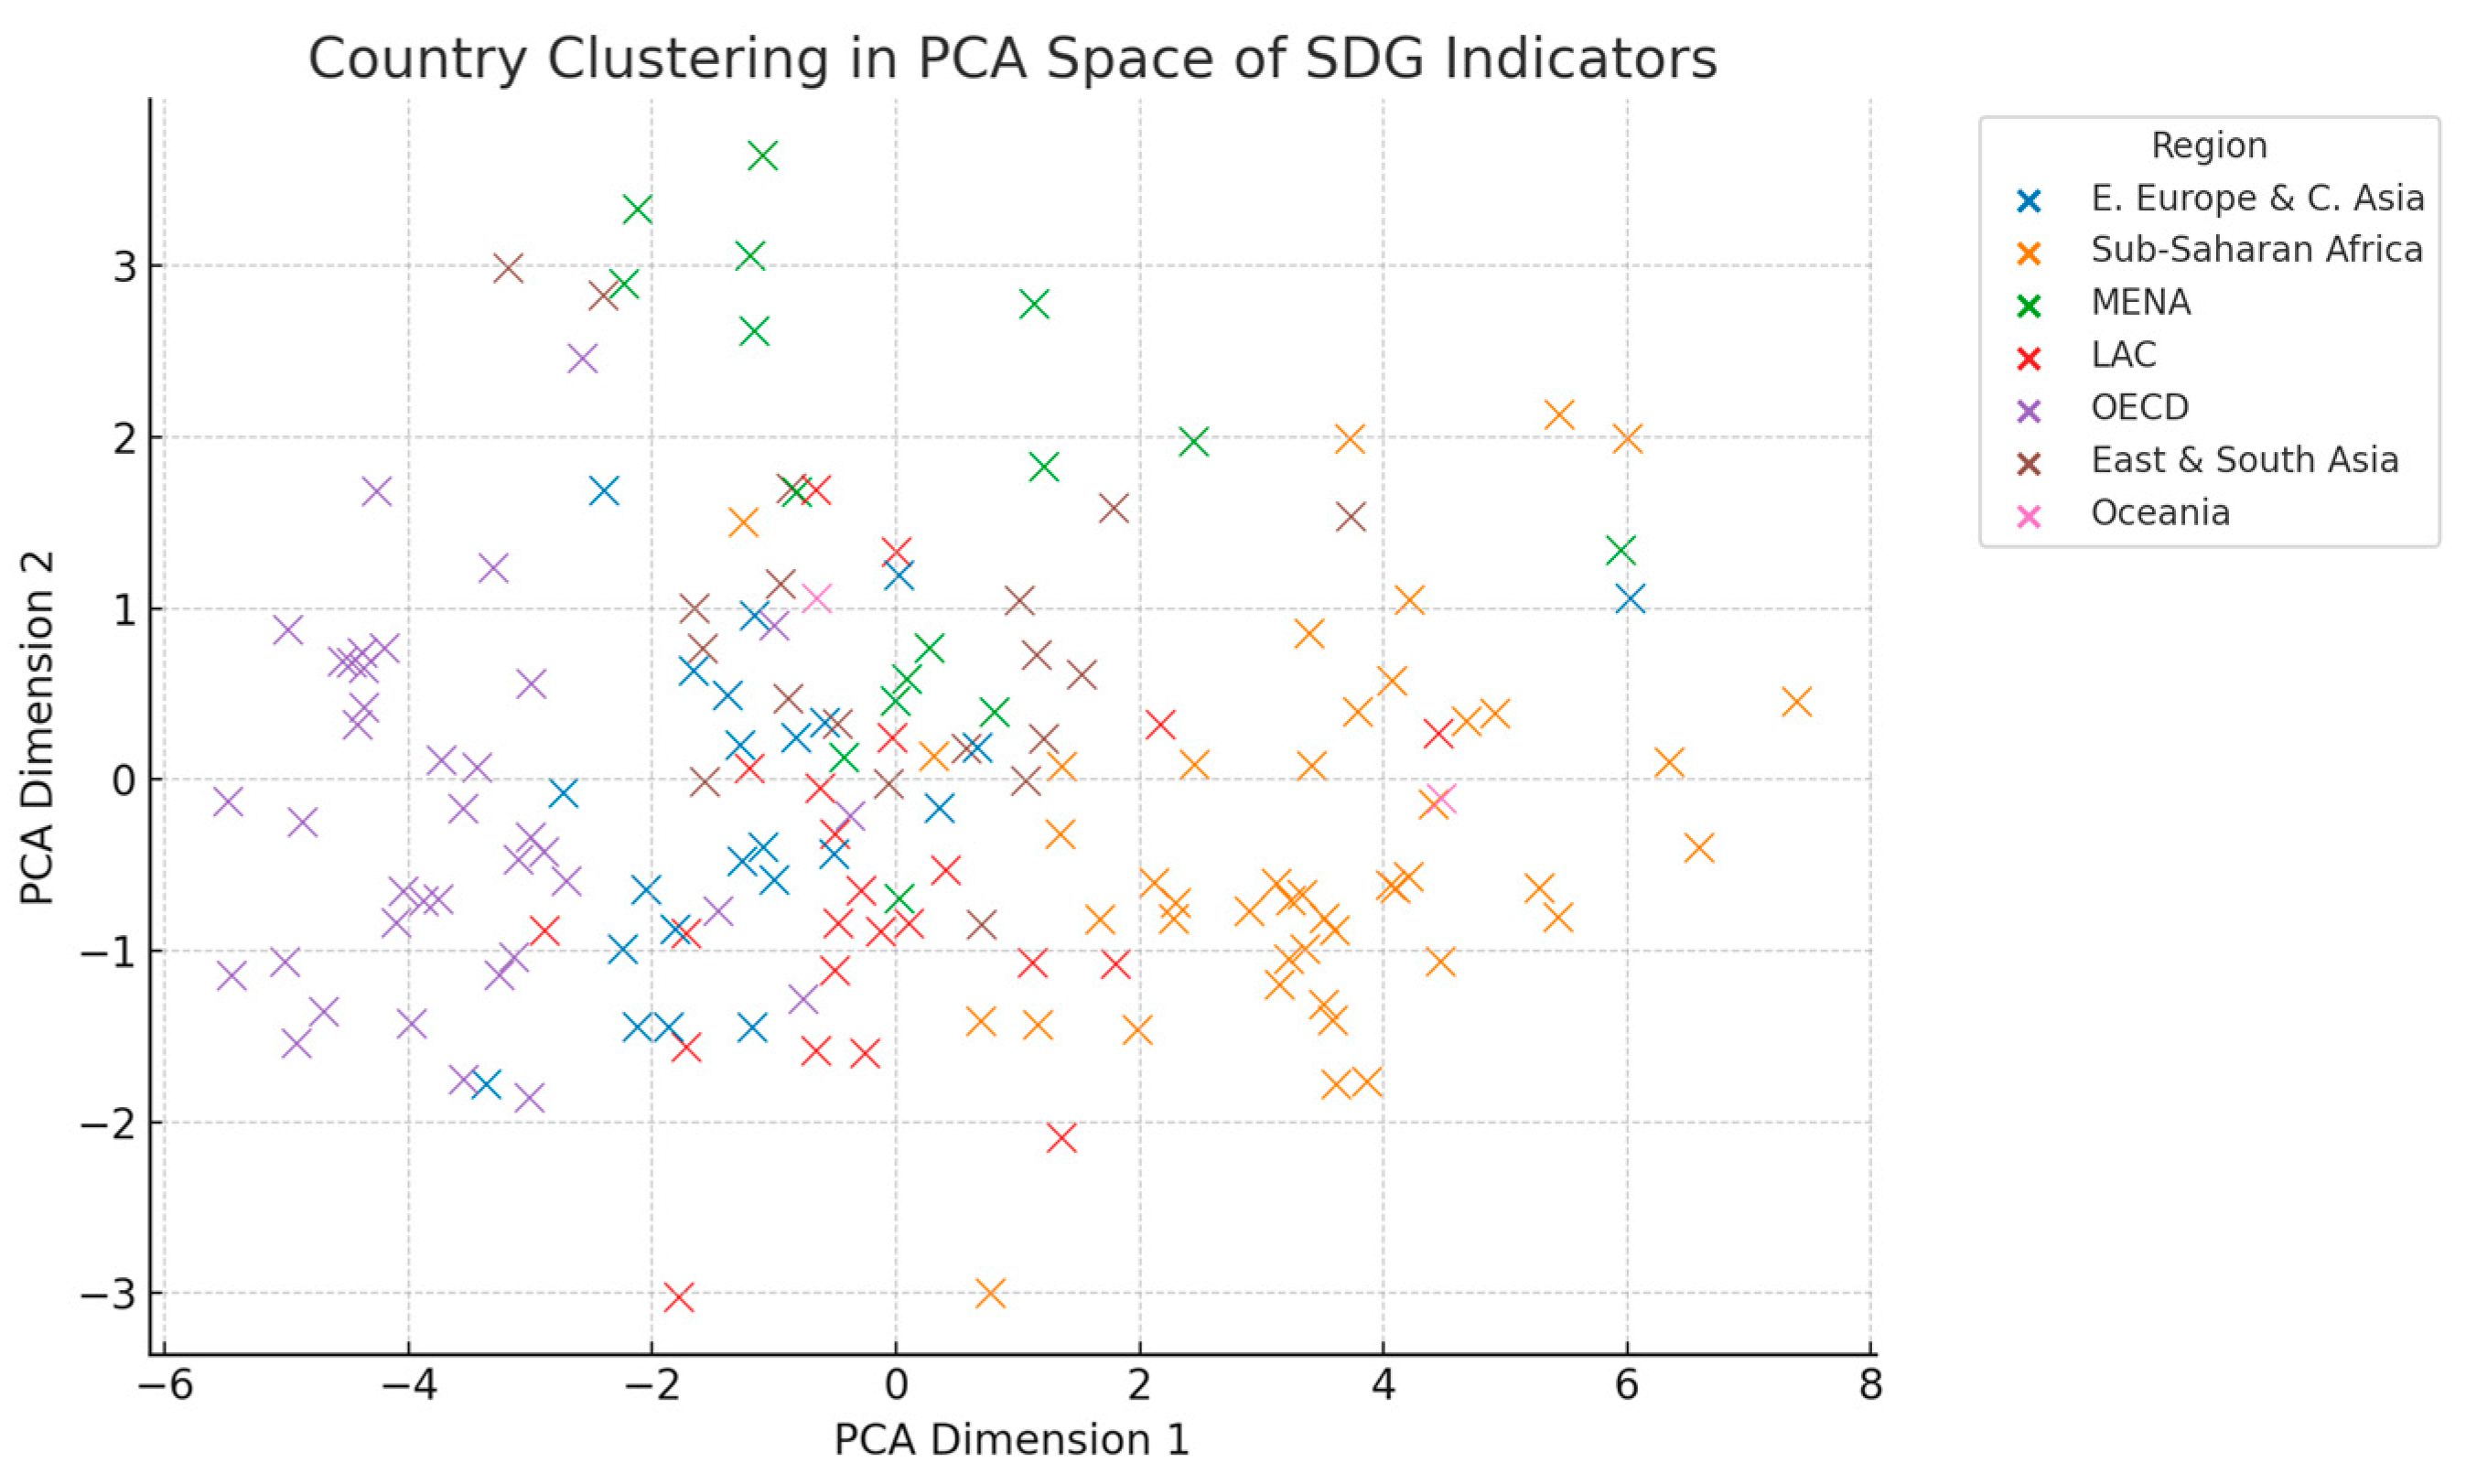
Figure 3.
Unsupervised K-means clustering of countries based on SDG indicators, projected onto the first two principal components. The three-cluster solution reveals latent groupings in the SDG space, serving as an exploratory benchmark before Bayesian modelling. While this clustering is not used for final classification, it provides initial insight into potential typological boundaries across different development profiles.
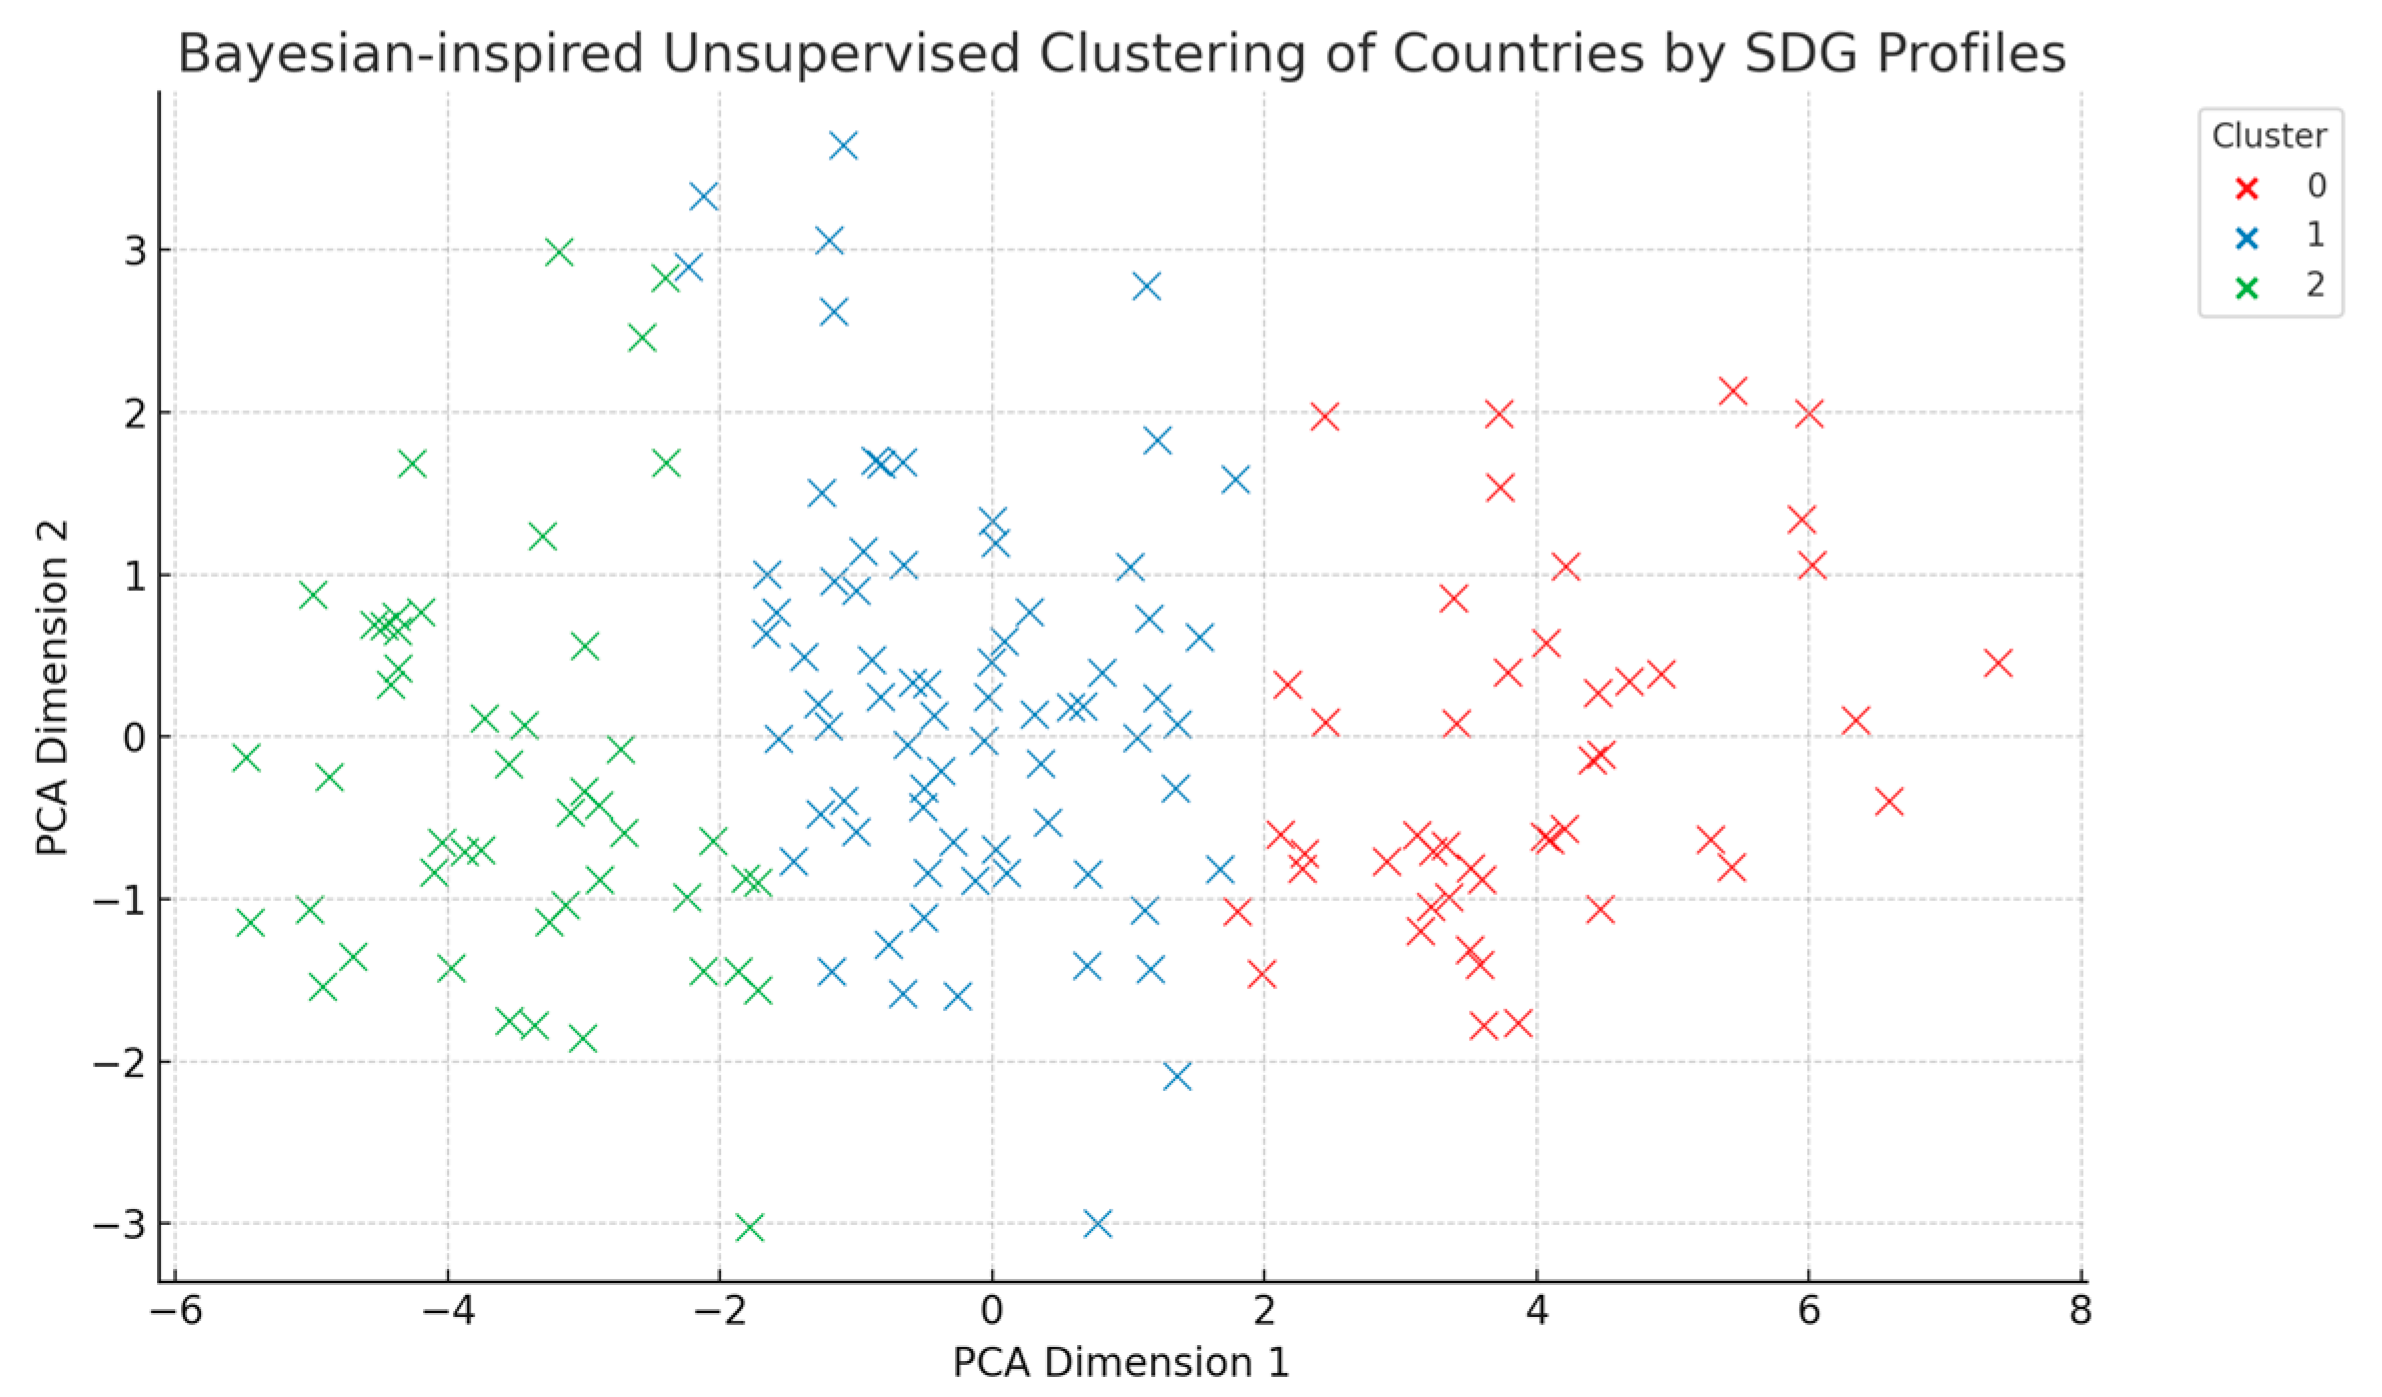
Figure 4.
Heatmap of median standardised SDG scores by clusters. Cluster 0 consistently shows low performance across most goals, particularly in poverty, health, and education (Goals 1, 3, and 4). Cluster 1 reflects a transitional profile with mixed scores near the global median, while Cluster 2 exhibits strong performance on most SDGs, particularly in institutional and environmental areas. The heatmap underscores clear differentiation in development modes across clusters.
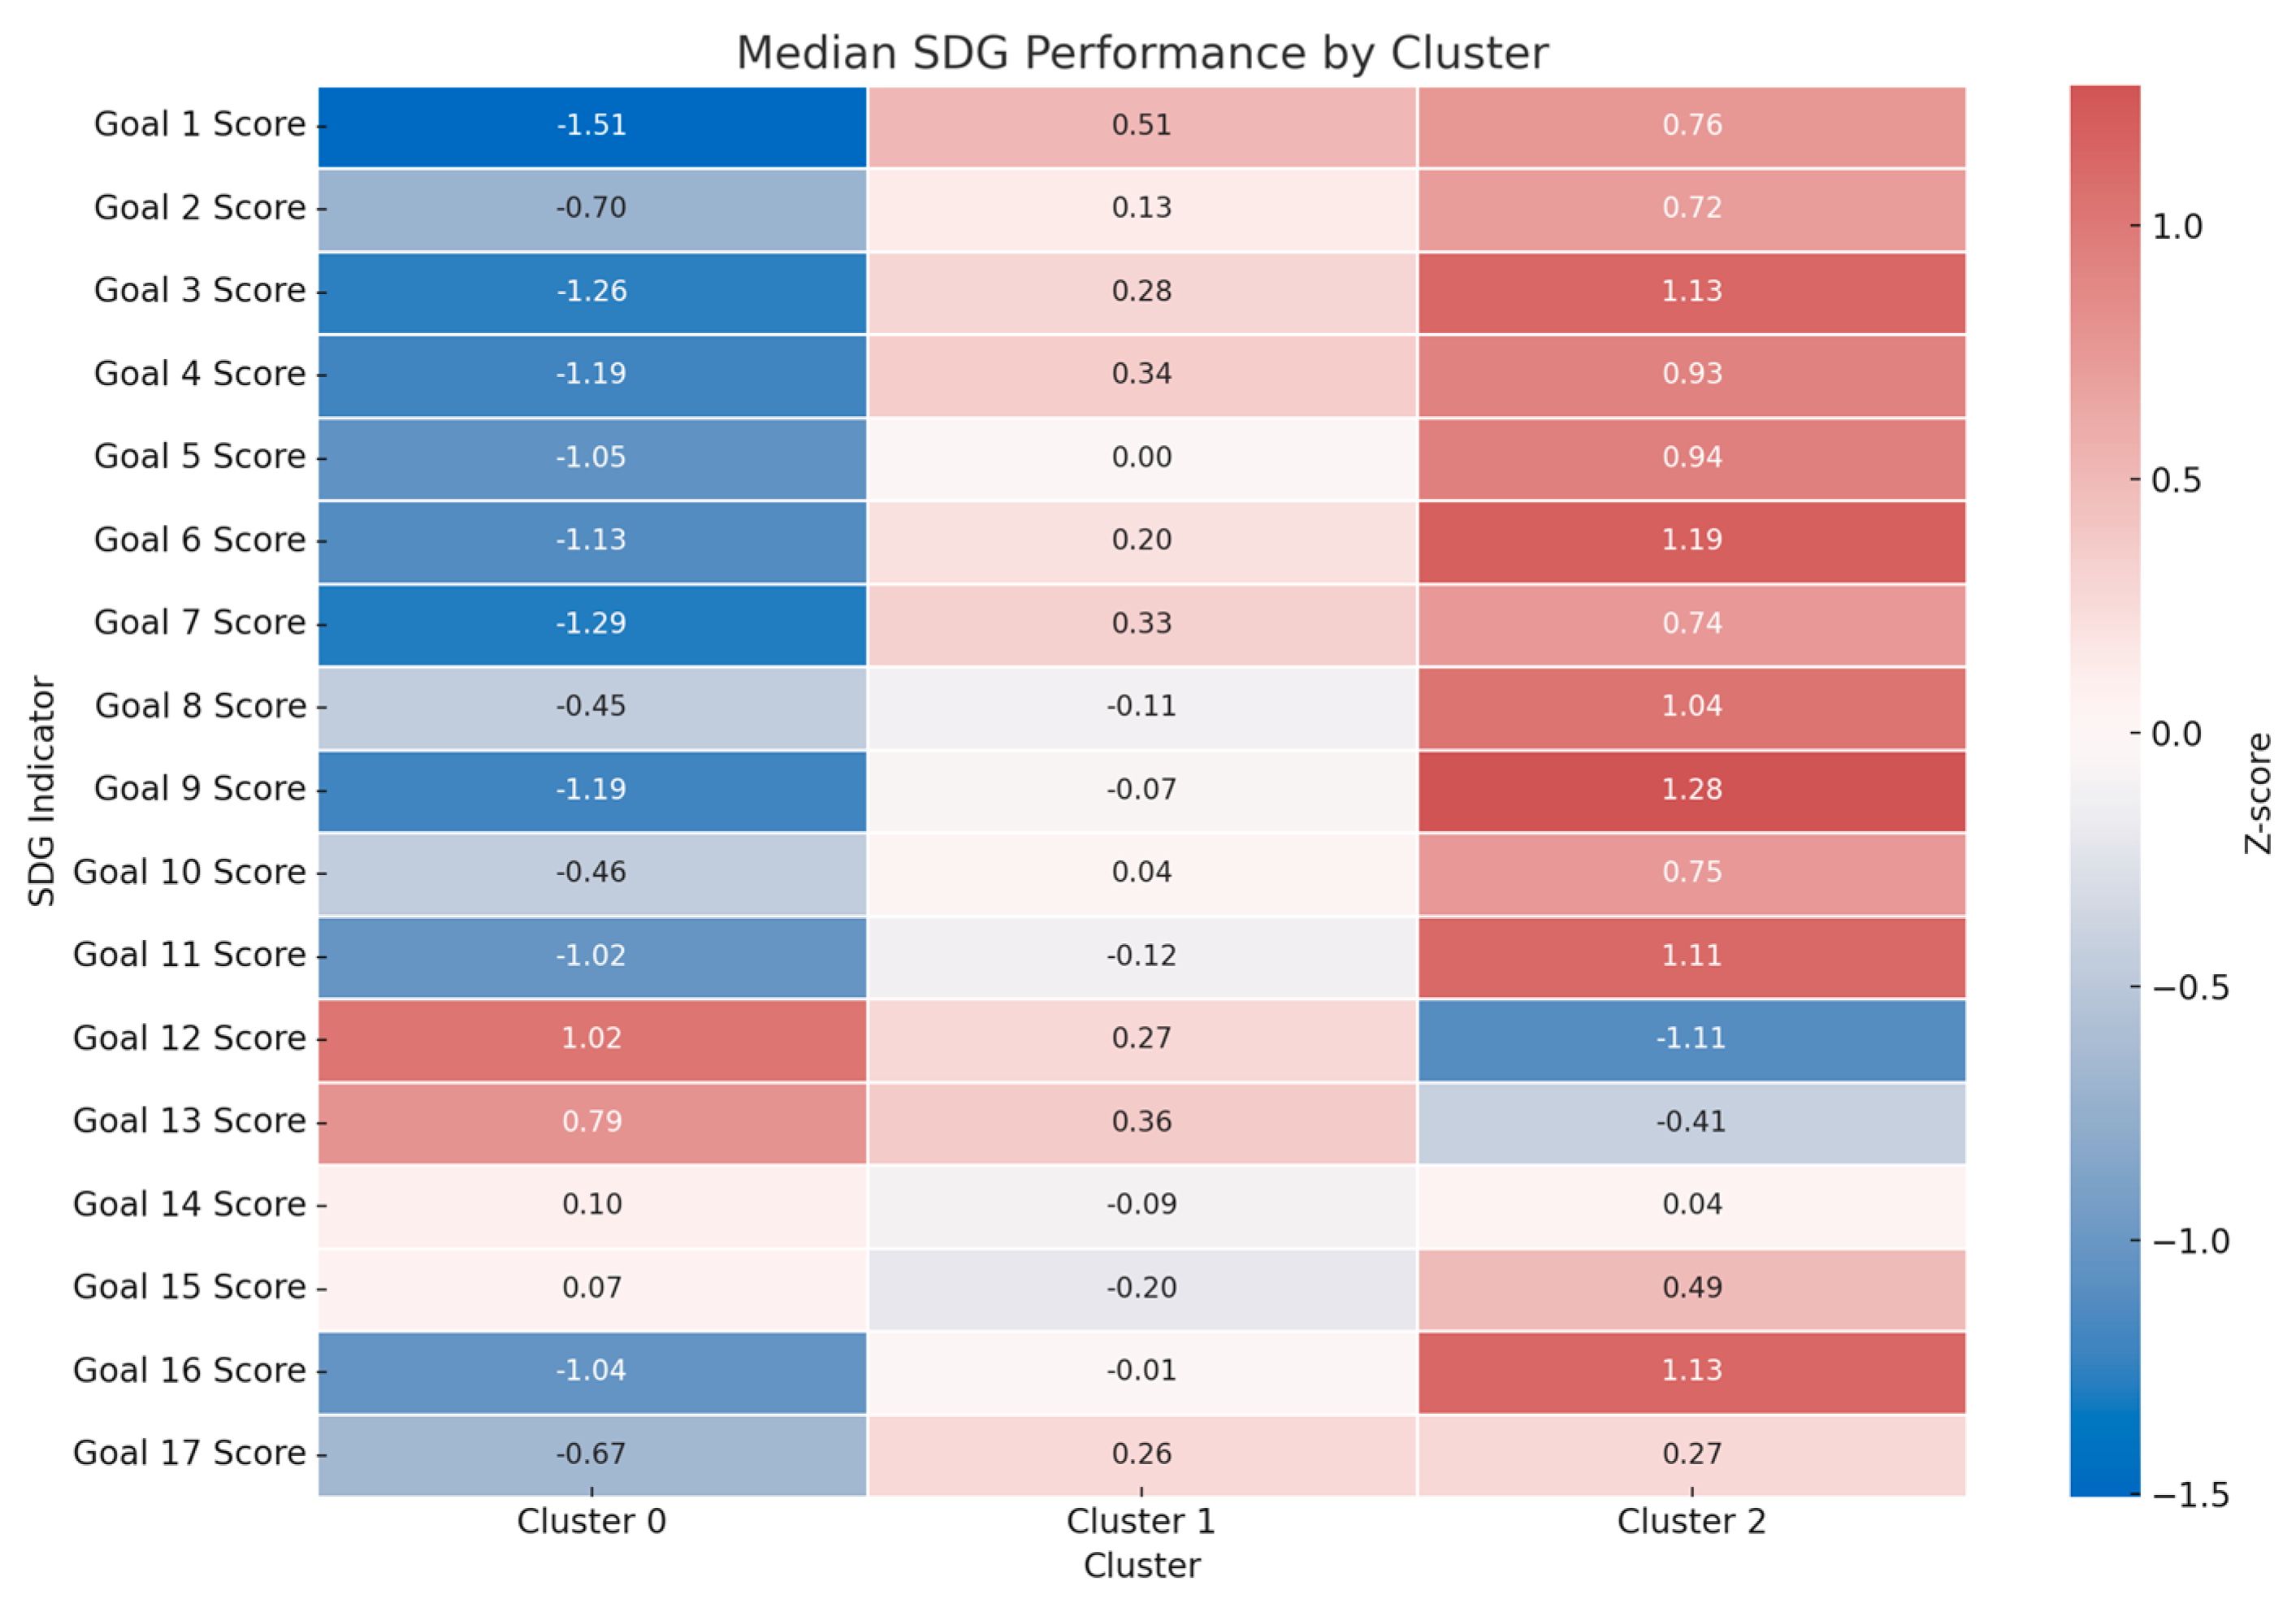
Figure 6.
Three-dimensional visualisation of soft clustering results. Each point represents a country, plotted according to its posterior probability of belonging to Clusters 0, 1, and 2. Countries located near the vertices tend to exhibit a strong affiliation with a single cluster, while those nearer to the centre often represent ambiguous or hybrid development profiles. This probabilistic representation enables the identification of transitional cases and quantifies uncertainty in typological classification.
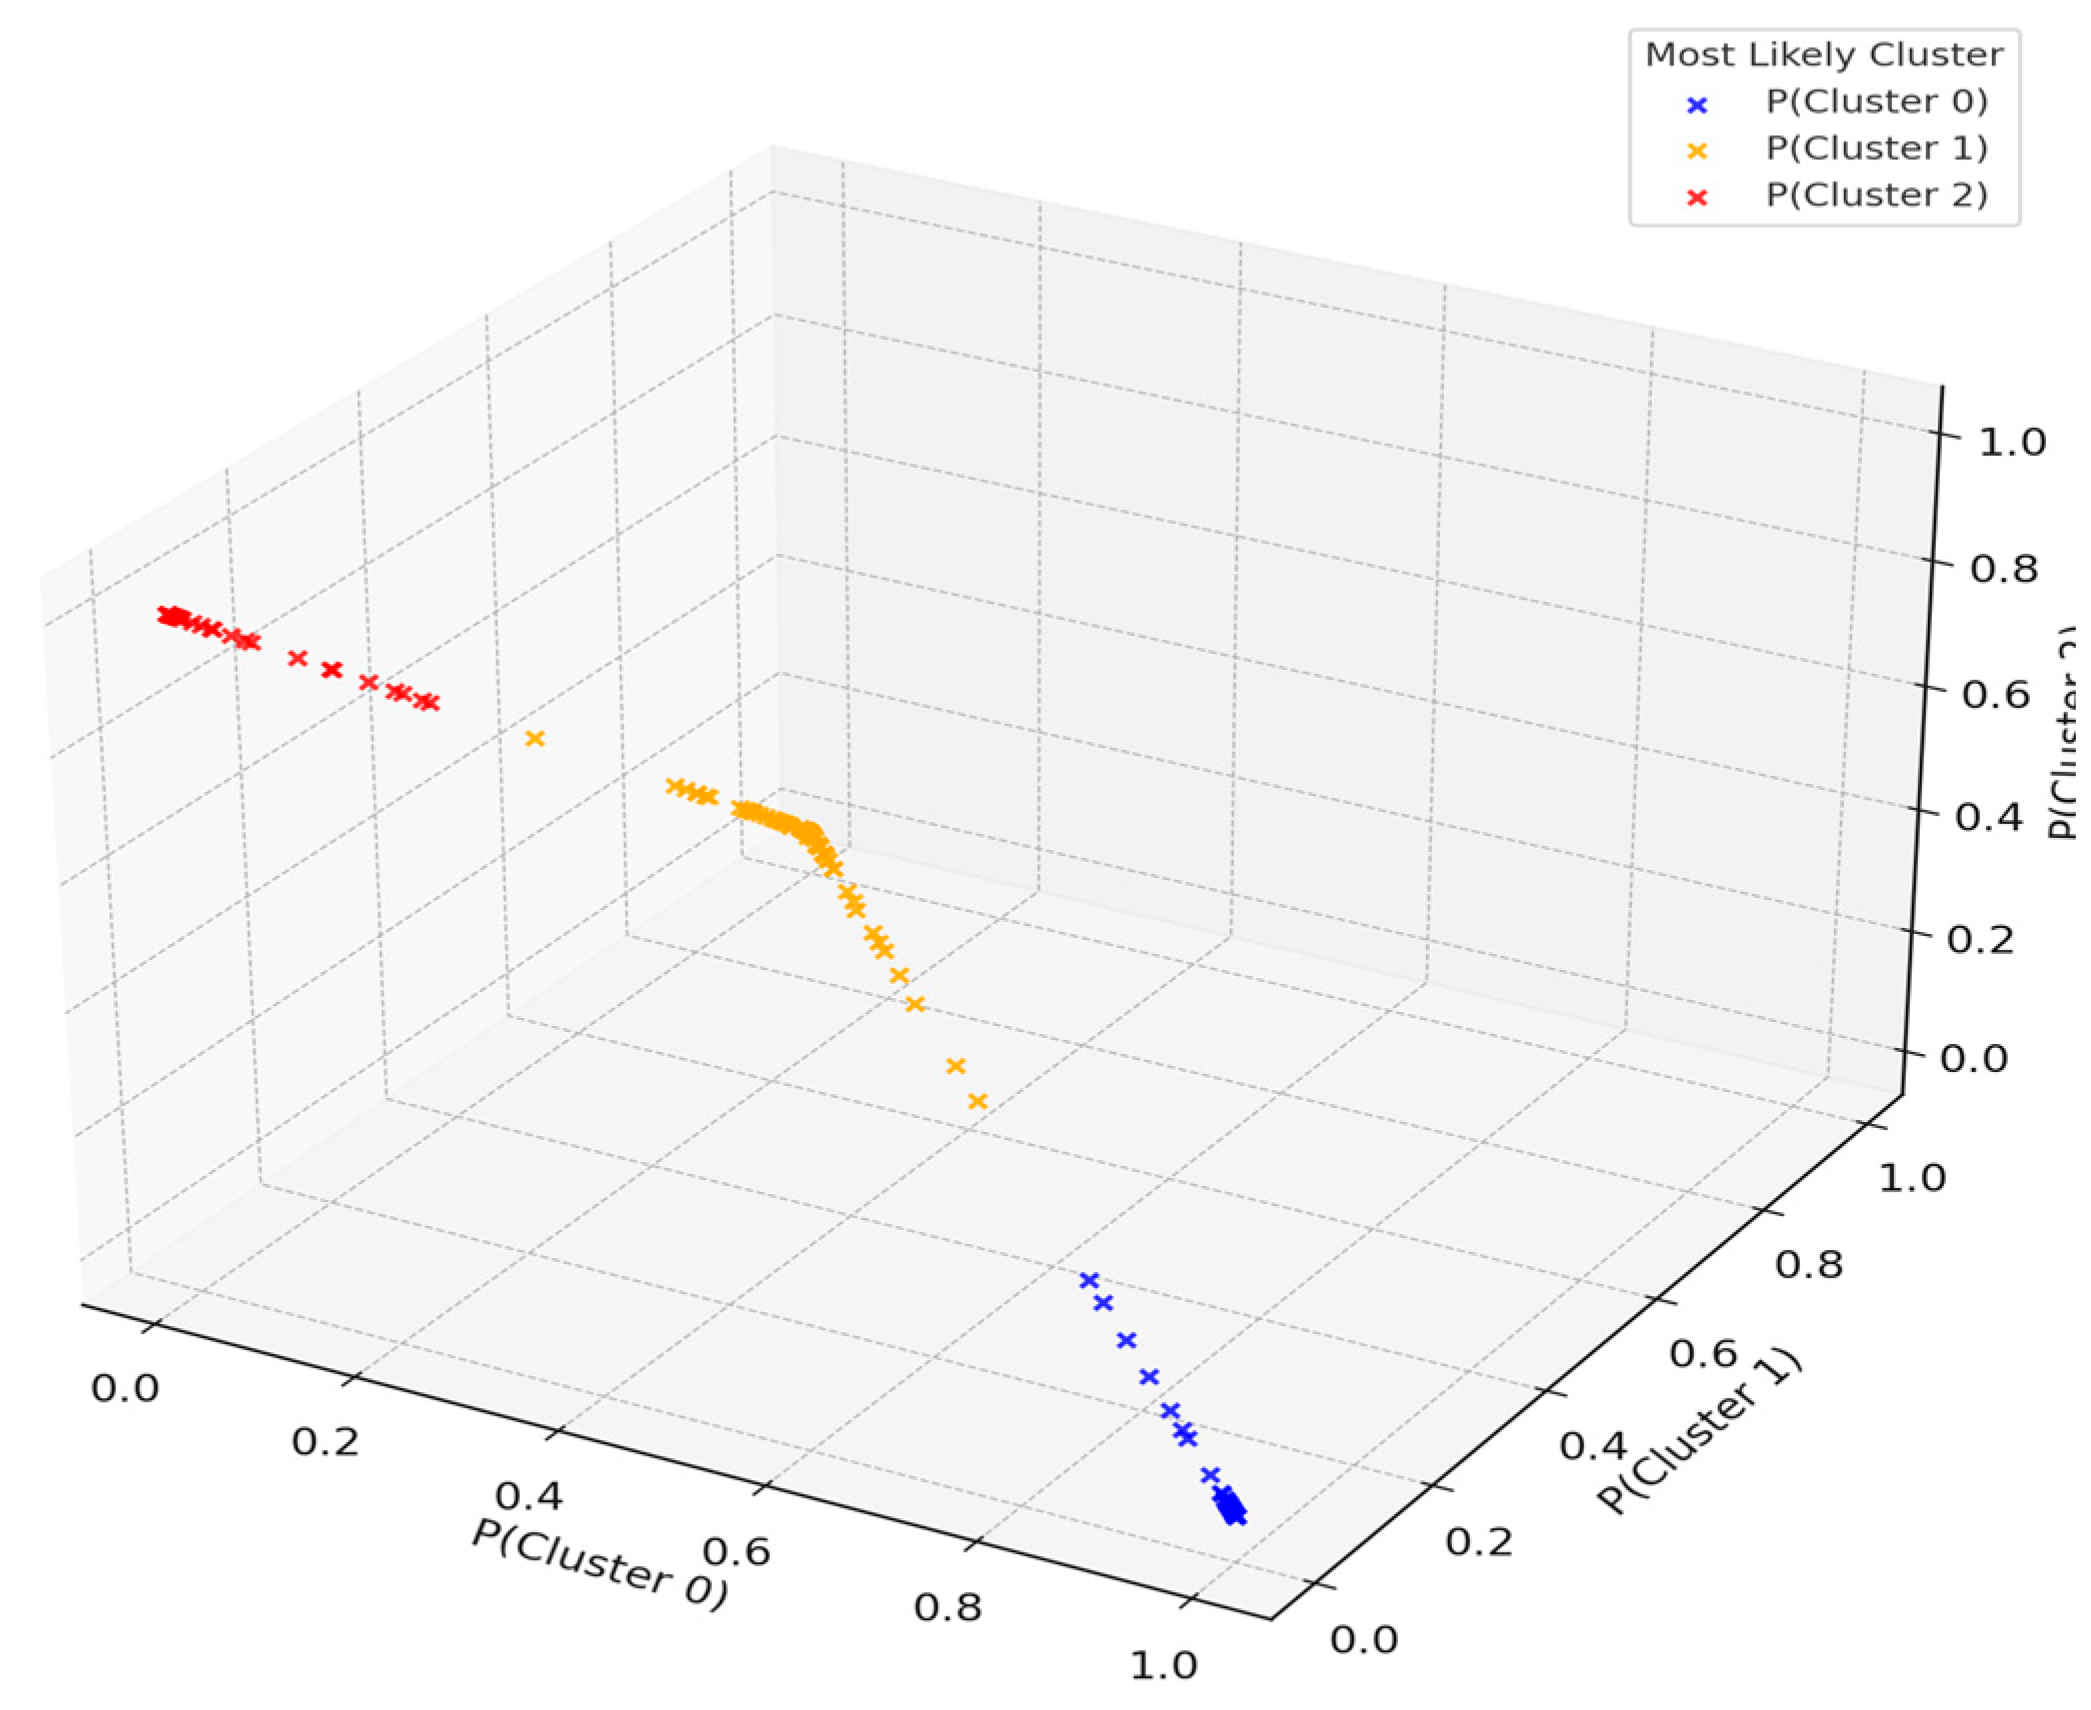
Figure 7.
Distributions of selected SDG indicators by cluster, visualised using spline-based density plots. Goals 1 (No Poverty) and 3 (Good Health) exhibit monotonic improvements from structurally vulnerable to consolidated countries, marking foundational progress. Goals 6 (Clean Water) and 11 (Sustainable Cities) display saturation effects, with diminishing returns beyond certain thresholds. Goal 13 (Climate Action) exhibits a non-monotonic pattern, where some low-income countries outperform advanced economies, likely due to their lower baseline emissions and external support, rather than robust environmental policies.
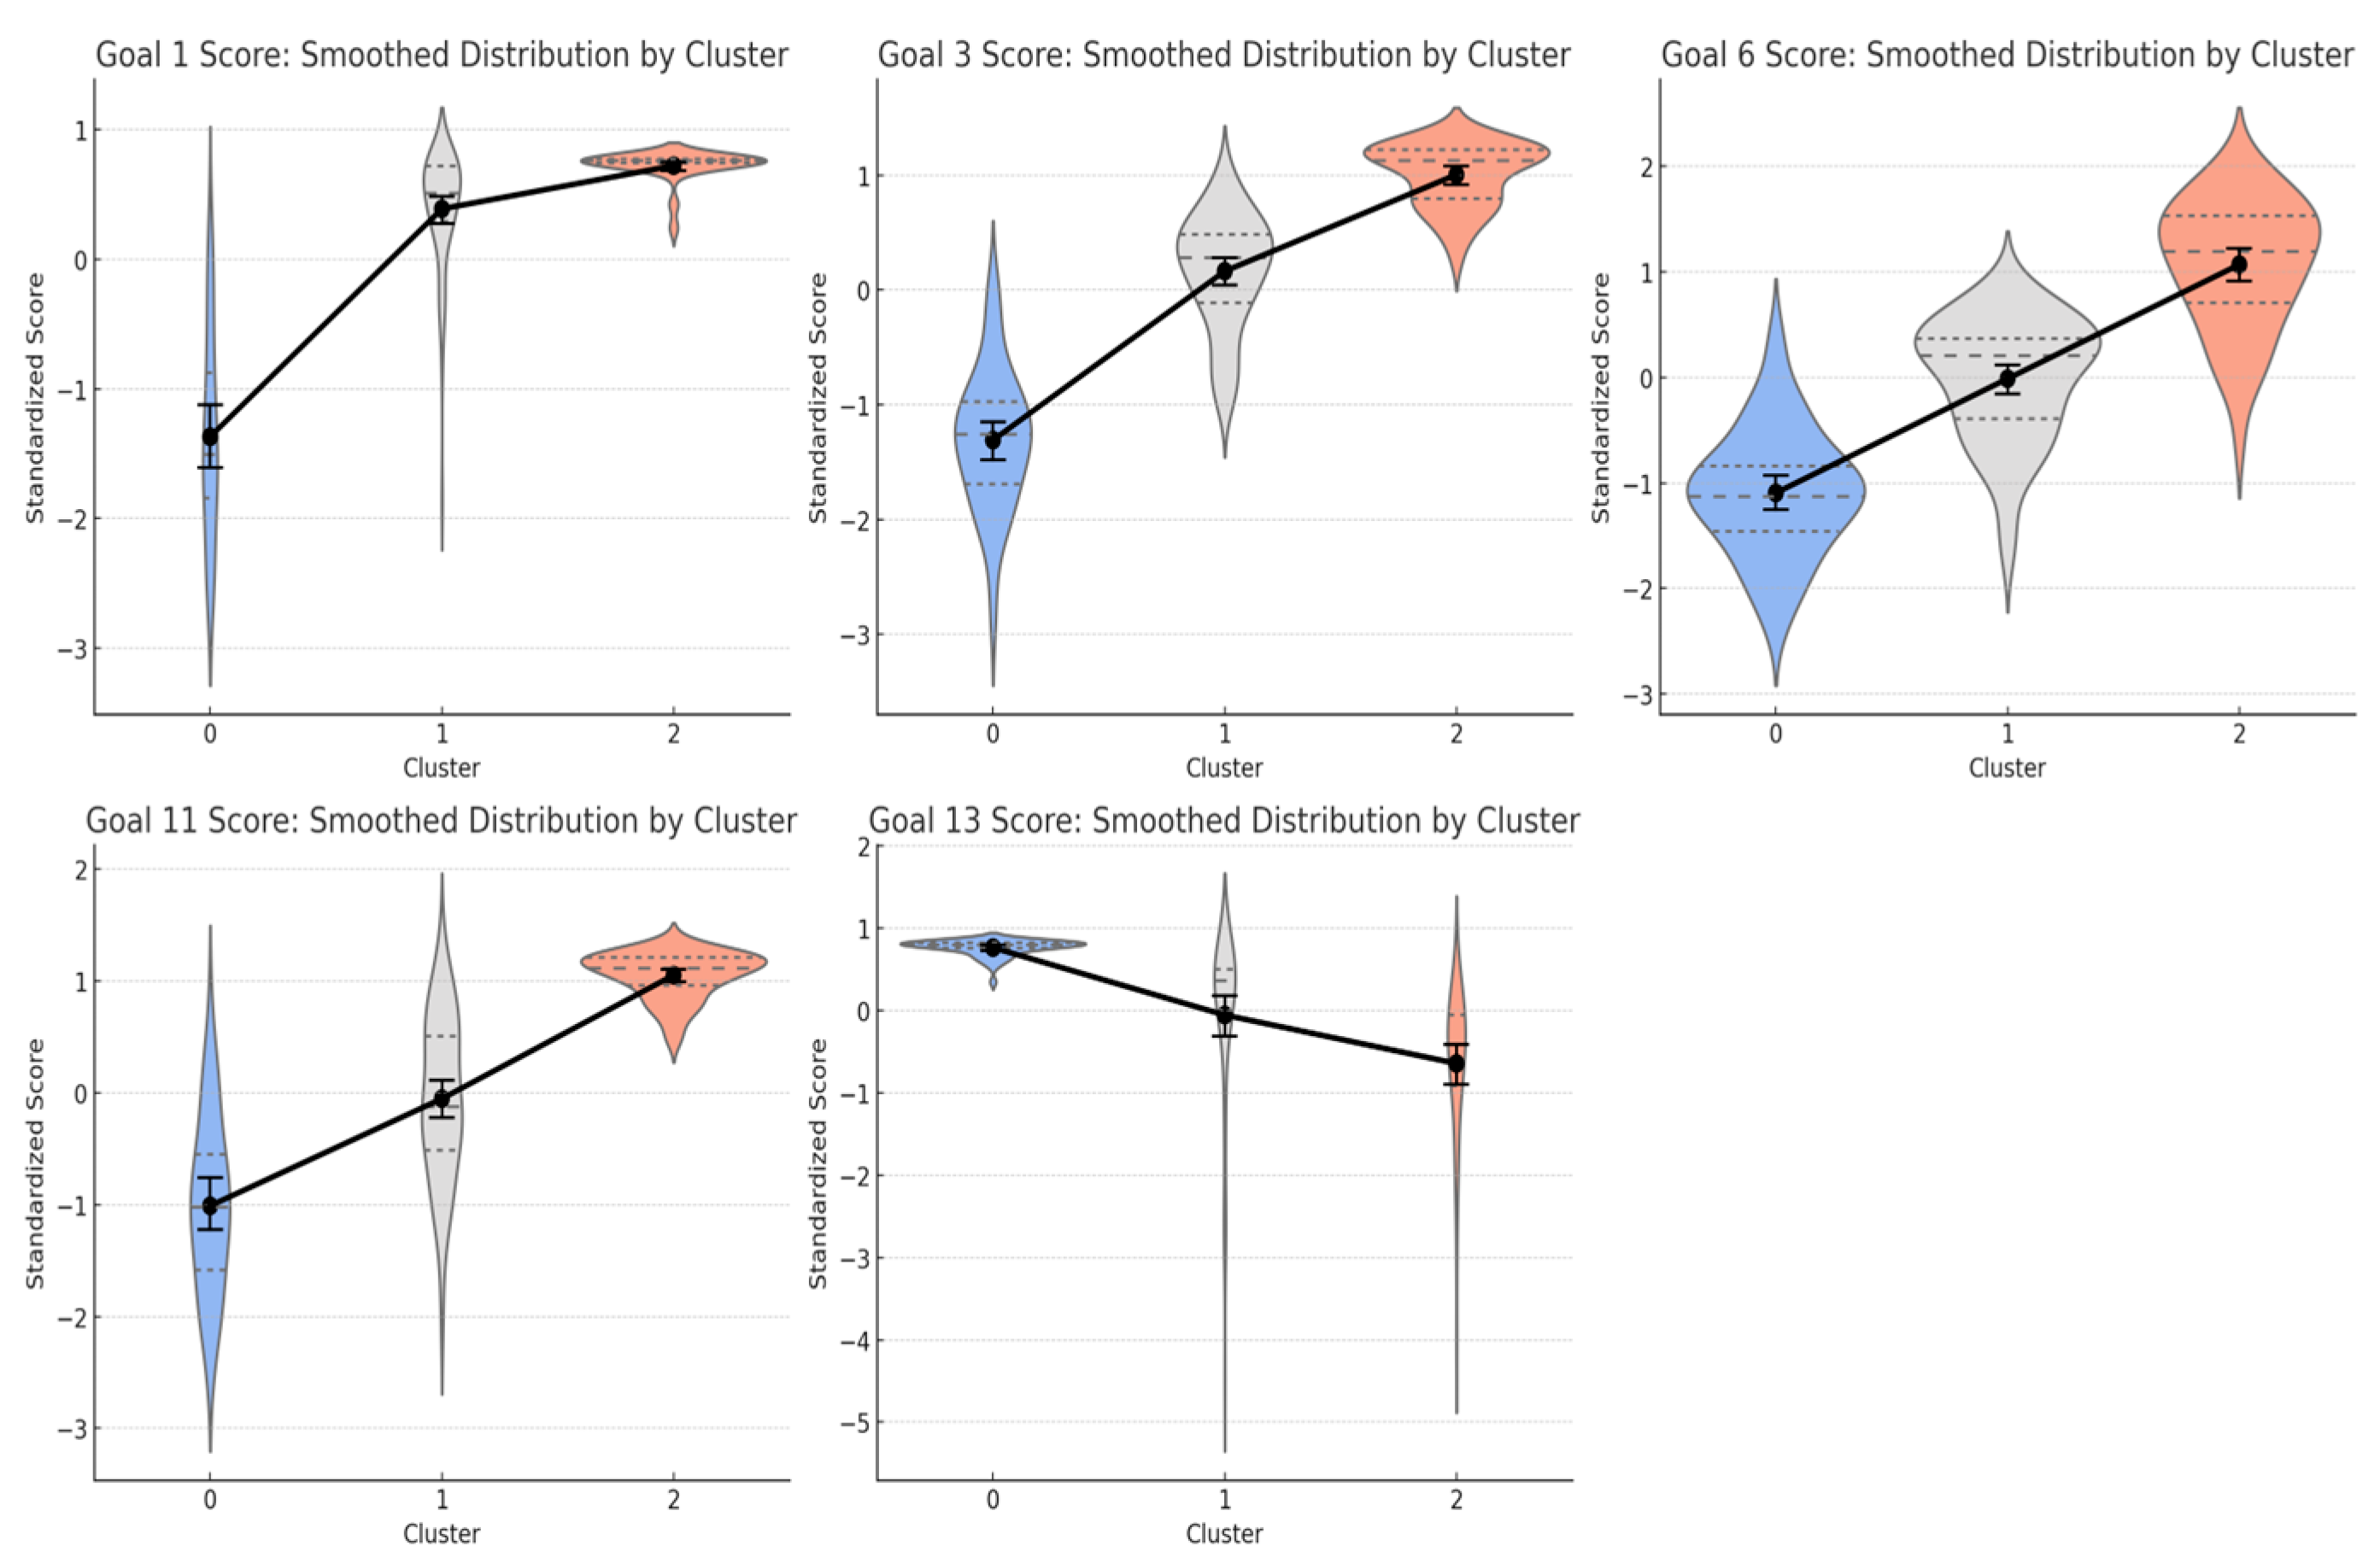
Table 1.
Ambiguous cases, ranked by Shannon entropy.
| Country | P(Cluster 0) | P(Cluster 1) | P(Cluster 2) | Entropy | |
| Russian Federation | 0.00003 | 0.5436 | 0.4564 | 0.69 | |
| Senegal | 0.4231 | 0.5769 | 0.00008 | 0.68 | |
| Argentina | 0.00004 | 0.3808 | 0.6191 | 0.66 | |
| Honduras | 0.3701 | 0.6298 | 0.00005 | 0.66 | |
| Serbia | 0.00000 | 0.3694 | 0.6306 | 0.66 | |
| Brunei Darussalam | 0 | 0.34 | 0.66 | 0.641 | |
| Brazil | 0 | 0.328 | 0.672 | 0.633 | |
| Cote d'Ivoire | 0.682 | 0.318 | 0 | 0.625 | |
| Venezuela | 0.277 | 0.718 | 0.005 | 0.62 | |
| Moldova | 0 | 0.289 | 0.711 | 0.601 | |
Disclaimer/Publisher’s Note: The statements, opinions and data contained in all publications are solely those of the individual author(s) and contributor(s) and not of MDPI and/or the editor(s). MDPI and/or the editor(s) disclaim responsibility for any injury to people or property resulting from any ideas, methods, instructions or products referred to in the content. |
© 2025 by the authors. Licensee MDPI, Basel, Switzerland. This article is an open access article distributed under the terms and conditions of the Creative Commons Attribution (CC BY) license (http://creativecommons.org/licenses/by/4.0/).
Copyright: This open access article is published under a Creative Commons CC BY 4.0 license, which permit the free download, distribution, and reuse, provided that the author and preprint are cited in any reuse.


