Submitted:
26 September 2025
Posted:
30 September 2025
You are already at the latest version
Abstract
Determination of the right price is vital for the success of newly developed food products. This study examined the market prices and their determinants for five ready-to-cook catfish products: Panko Breaded Standard Strips (PBSS), Panko Breaded Standard Fillet (PBSF), Panko Breaded Delacata Fillet (PBDF), Sriracha Marinated Delacata Fillet (SMDF), and Sesame-Ginger Marinated Delacata Fillet (SGMDF). Market prices were derived using Vickrey's second-price auction, where the second-highest bid represents the market price. We analyzed experimental auction data from 121 consumers with a logit model to estimate the probability of offering the market price based on product sensory attributes, socio-demographic characteristics of the participants, and competition level (panel size). Consumers' willingness-to-pay (WTP) was elicited in two rounds: before tasting (visual evaluation) and after tasting (organoleptic evaluation) the products. Breaded products received higher market prices than marinated products, with PBDF ranked highest. Sensory traits, especially taste, along with income, education, and grocery shopping involvement, significantly influenced the market price formation. Increased competition elevated the market prices. Both product features and consumer characteristics strongly affect market price outcomes, and experimental auctions provide a robust tool for understanding consumer behavior toward newly developed food products.
Keywords:
catfish products
; Vickrey auction
; willingness to pay
; market price
1. Introduction
Consumers continuously make choices about which food products to purchase, often comparing available alternatives or relying on prior experiences when only one option is available [1]. These choices are shaped by both external and internal processes in the consumer's mind, particularly the type and quality of information available. For most food products, however, consumers rarely possess complete information. While prices are observable, quality, especially sensory attributes such as taste or texture, is more difficult to obtain [2,3]. Consequently, food purchasing behavior reflects the combined influence of product properties, socio-demographic characteristics such as age, household size, and income, as well as broader market conditions [4,5,6]. Personal traits, including psychological and physiological factors, further shape preferences and needs that drive individual choices [7,8].
Given this complexity, no single framework fully explains consumer food choice [9]. Kotler and Keller's [10] five-stage buying process, for example, highlights structured steps—problem recognition, information search, evaluation, purchase, and post-purchase evaluation. In contrast, behavioral scholars emphasize heuristics, noting that consumers often rely on simplified decision rules based on salient product attributes [11,12]. More recently, researchers have integrated sensory science and applied economics to capture the interplay between psychological and behavioral drivers of food choice [9,13,14,15].
From a producer's and processors' perspective, accurate price determination is central to market success. Consumer's willingness to pay (WTP) can be measured in two ways: 1) the revealed preference method (actual market data or experiments) and 2) the stated preference method (direct or indirect consumer surveys) [16]. Traditional stated preference methods, such as contingent valuation or choice experiments, often overestimate willingness to pay (WTP) because they are not incentive compatible. Many seafood studies also relied on scanner data to estimate demand [4,17,18,19,20], which provides valuable but limited insights, particularly when consumers encounter novel products or sensory experiences.
Researchers have been conducting experimental auctions to study consumer behavior. Numerous studies confirm the usefulness of experimental auctions in eliciting consumer WTP for food products [21,22,23,24,25,26], and evidence suggests that auction behavior is consistent with economic theory [27]. Even within auction studies, reliance on average bids as a proxy for market price is problematic. Average bids can be distorted by overbidding or underbidding behavior, thereby misrepresenting actual market-clearing prices. Previous analyses of experimental auction data on ready-to-cook catfish products [28,29,30], safer fish [31], followed this convention, generating valuable insights into consumer WTP but overlooking the fact that in Vickrey auctions, transactions occur at the second-highest bid, not the mean. Ignoring this distinction risks mischaracterizing how prices form in practice.
The market price (i.e., second-highest bid in Vickrey's auction) addresses this issue. It reflects the market-clearing price better than the average bid, aligning more closely with real-world dynamics [32]. In Vickrey's auction, the highest bidder wins but pays the second-highest bid. Because the winning price does not depend on one's own bid, participants are incentivized to reveal their true valuation. This study seeks to address that gap by examining how market prices form under Vickrey second-price auctions and by exploring how sensory experience shapes consumers' WTP for the market price for five newly developed ready-to-cook catfish products: Panko Breaded Standard Strips (PBSS), Panko Breaded Standard Fillet (PBSF), Panko Breaded Delacata Fillet (PBDF), Sriracha Marinated Delacata Fillet (SMDF), and Sesame-Ginger Marinated Delacata Fillet (SGMDF). The three panko-breaded products (differing in weight (size) and fillet type) are ready-to-bake products, and two marinated items (differentiated by sauce) are ready-to-microwave products. These products are developed by the University of Arkansas at Pine Bluff, in collaboration with the USDA-ARS Food Processing and Sensory Quality Research Lab in New Orleans and Texas State University. Deb et al. (2020) and Bland et al. (2021) reported the product details, including their preparation processes, proximate composition, nutritional attributes, and consumer sensory evaluations. In the first round, participants bid without tasting, reflecting purchase decisions based on appearance and expectations. In the second round, participants bid after tasting, allowing observation of how direct experience altered WTP. This design provides insights into the factors driving initial purchase (trial) and influencing long-term consumer acceptance and repeat purchasing behavior.
The primary objective of this study is to examine how market prices for innovative food products are formed in experimental auctions and to identify the underlying factors that drive both market-clearing prices and consumers' willingness to pay the market price. Since the Vickrey auction determines the transaction price based on the second-highest bid, this mechanism provides a unique opportunity to disentangle individual valuations from the actual market price that producers can expect. To achieve this, we model the determinants of market price formation by incorporating consumer characteristics, product attributes, and contextual factors such as previous purchasing experience and sensory perceptions. At the same time, we investigate how these factors influence consumers' willingness to pay at the established market price, thereby linking individual demand behavior with market-level outcomes. This study provides a rigorous framework for understanding price dynamics in emerging food markets by integrating econometric analysis with applied market insights. It offers actionable insights for producers seeking to optimize pricing strategies for successful product introduction.
2. Materials and Methods
We have used data from 121 catfish consumers from Arkansas, generated through Vickrey's second-price auctions of five ready-to-cook catfish products, to accomplish our objectives. Experimental auctions were conducted in 18 auction sessions, which can be considered as 18 panels of consumers. The number of participants (panelists) in the auction sessions ranged between 3 and 11. Ninety-two catfish consumers participated in 14 auction sessions conducted in Pine Bluff. On the other hand, 29 catfish consumers attended four sessions held in Lonoke, Arkansas. Participation in the auctions was skewed toward African American and Asian populations, compared to national and state (Arkansas) demographics. According to the U.S. Census Bureau [33], the racial composition of the U.S. (Arkansas) population is 13.6% (15.7%) African American, 58.9% (71.0%) Caucasian, 6.3% (1.8%) Asian, 18.9% (8.5%) Hispanic, and 19.3% (9.1%) other races. This discrepancy between our sample and the broader population is a limitation of our study for the generalizability of the results. To address this issue, we incorporated a dummy for African Americans into our econometric model, allowing us to control for racial differences and produce generalizable results.
The five ready-to-cook catfish products were developed at the Food Processing and Sensory Quality Research Unit of the USDA-ARS Southern Regional Research Center (SSRC) in New Orleans, Louisiana. These are: Panko Breaded Standard Strips (PBSS), Panko Breaded Standard Fillet (PBSF), Panko Breaded Delacata Fillet (PBDF), Sriracha Marinated Delacata Fillet (SMDF), and Sesame-Ginger Marinated Delacata Fillet (SGMDF). Panko breaded products are ready-to-bake products, and marinated products are ready-to-microwave products. Two breaded products (PBSS and PBSF) were prepared from standard fillet, and all other products were prepared from Delacata fillet. The weight of a packet of PBSS was 80 gm (2.8 oz), and all other products weighed 110 gm (3.8 oz). Delacata fillet is considered a premium product – a thick fillet that has undergone deep skinning, resulting in less skin and the skin fat layer, and a more uniform color and a superior appearance. PBSF and PBDF differ only in terms of the fillet (Standard vs Delacata), while SMDF and SGMDF differ only in terms of marination (sriracha vs sesame-ginger). Detailed information about the products, development process, product characteristics, proximate composition, nutritional attributes, and consumer sensory evaluations is reported in Bland et al. [34] and Deb et al. [29].
2.1. Experimental Auction Protocol
In this study, we have used data generated by Deb et al. [29], which elaborates on the data generation procedure, experimental protocols, and all related information in detail. For the sake of completeness, we have summarized it here. Catfish consumers likely to participate in the experimental auctions were invited through announcements in the class, visiting nearby catfish restaurants, and contacting regular customers of UAPB fish sales. More people were invited through email and advertisements on social media. Each participant was paid $20 for attending the event, which was facilitated to cover their transportation and incidental costs, who came from nearby and faraway places (up to 30 miles away from the venue) to attend the auction events.
Upon arriving at the experimental laboratories, participants were requested to register for the auctions. They were given a unique identification number to maintain anonymity. Then, the participants took seats and watched a short video (five minutes) about the newly developed convenient catfish products. The video featured the convenient catfish products, ingredients used, preparation process, and suggested cooking methods. The video also described Vickrey's second-price auction. To avoid the possible influence of peers in the bids, participants were requested not to communicate with each other until the auctions were completed and they had complied with our request. Immediately after the video session, participants were trained on how to bid in an auction using candy bars and were asked to answer questions for a sensory evaluation. The real auctions took place in the following steps: (i) participants saw the product, (ii) completed the sensory evaluation, and (iii) submitted a bid in dollars per packet of newly developed convenient catfish products. After the training, participants were guided to the auction room for two rounds of real auctions. In the first round, participants placed bids based on the products' visual attributes—appearance, color, glossiness, and serving size. In the second round, they bid based on sensory evaluations after tasting the products. All participants took part in both rounds. Adhikari et al. [28] reported the findings on the participants' average WTP from the first round. The results from the second round about the participants' average WTP are presented in Khanal et al. [30]. The present study identified the market price offered by the auction participants before and after tasting the catfish products and factors (product characteristics, socioeconomic background of the auction participants, and competition level in auctions) influencing them to offer the market price.
Convenient catfish products were characterized through sensory analysis of visual sensory attributes (appearance, color, glossiness, and serving size) and organoleptic sensory attributes (smell, taste, texture, oiliness, juiciness, and saltiness). Sensory evaluations of the products were carried out with the help of two types of scales: a five-point Likert scale and a five-point "Just About Right (JAR)" scale. Product appearance, color, smell, taste, and texture were evaluated with the Likert scale as: 1= like not at all, 2= like slightly, 3= like somewhat, 4= like very much, and 5= like extremely. On the other hand, glossiness, serving size, oiliness, juiciness, and saltiness of the product were evaluated with the "Just About Right (JAR)" scale as: 1= much too low, 2= little too low, 3= just about right, 4= little too high, and 5= much too high. For analysis in this study, we have reconstructed the JAR response into two categories: JAR = 1 (for all responses that indicated 3, i.e., just about right), and JAR = 0, otherwise. Participants finally provided an overall liking score for the products on a nine-point hedonic scale from 1 to 9 (1 = dislike extremely, and 9 = like extremely). Consumers' WTP was measured in US$ per packet of ready-to-cook catfish products.
After completing the auction for one product, participants went for another. They continued until each participant saw, evaluated, and bid for all five products. Participants also provided their socioeconomic information through a self-administered questionnaire immediately after the auctions. Winners and market prices, i.e., the second-highest price in the auctions, were announced after all the individual auctions were completed. Therefore, each auction had at least one winner and one market price in every panel.
2.2. Market Price and Market Demand of Catfish Products
At the start of every session, panelists were informed that they could bid zero for a product if they did not want to buy it on that day, irrespective of their acceptance rating for the product. Most of the panelists submitted positive bids; however, some panelists did not win any of the products because their bids were never higher than the market price (i.e., second-highest price in that auction session). During the first round (before tasting the products), 36.2% of the panelists were willing to pay to the tune of the market price at least for one product. During the second round (after tasting the products), 35.4% of the panelists' WTP was at the level of the market price at least for one product.
If a sealed bid Vickrey auction is truly demand-revealing, the principles of consumers' demand should hold true in a second-price auction [27,32]. Studies dealing with catfish products have shown that sales of catfish products depend on product characteristics such as product form and size [35,36], consumer characteristics such as ethnicity and family size [37,38,39,40] and market environment, such as substitute fish prices, income, advertising, expenditures on food at home and away from home [37,38,41], and region [35].
Empirical studies have shown that product characteristics, consumer characteristics, and the market environment determine prices of catfish products at different levels of the seafood supply chain: at the harvest level [42,43], the wholesale level [44] and the retail price in the supermarket [4]. These studies have found that the attributes and their values differ at different levels in the chain, but these are the main factors influencing price. Based on the insights from existing literature, we have assumed that market prices of catfish products in the auctions (the second-highest price) are determined by product characteristics, consumer characteristics, and the market environment.
We employed a binary logit regression model to examine the market price determinants for ready-to-cook catfish products. The model was selected because the dependent variable is dichotomous, capturing whether an individual participant's bid was at or above the market price (coded as 1) or below the market price (coded as 0). The "market price" was operationalized as the second-highest bid in the Vickrey auction, which serves as the transaction price in incentive-compatible auction settings.
The binary logit model estimates the probability that a participant’s bid equals or exceeds the market price as a function of explanatory variables. Formally, the model is specified as:
where denotes the probability that the bid of individual i is at or above the market price, is the intercept, are the coefficients, and represent explanatory variables. The explanatory variables comprised three sets of factors. First, product attributes included both visual (e.g., appearance, glossiness, serving style) and organoleptic sensory characteristics (e.g., smell, taste, texture, crispiness, saltiness, oiliness, and juiciness). Second, socioeconomic and demographic characteristics of the participants, such as age, gender, education level, race, income, and fish consumption habits, were included to capture heterogeneity in consumer preferences. Third, the market environment (panel size) was added to account for the competitive dynamics of the auction process.
The logit model estimates the probability that a participant bids at or above the market price given these explanatory variables. The probability function for the binary outcome is expressed as:
To facilitate interpretation, marginal effects were computed for each explanatory variable, showing the change in the probability of bidding at or above market price with respect to a unit change in the predictor. The analysis was conducted separately for before tasting (appearance-based valuation) and after tasting (organoleptic sensory-based valuation), allowing us to capture differences between expectation-driven and experience-driven willingness to pay.
According to the principles of consumer demand, we hypothesized that an increase in average rating for product characteristics and panel size should increase the market price if there is no change in supply.
3. Results
3.1. Basic Characteristics of the Participants
Out of the 121 auction participants, most of the participants were African Americans (47%), half of the participants (50%) had frequent fish consumption habits of eating fish at least once a week, one-fourth of the participants were younger (aged ≤21 years), and 29% participants had an annual household income $60,000 or more.
3.2. Sensory Evaluation of the Ready-to-Cook Catfish Products
Participants' evaluations of visual and organoleptic attributes of the ready-to-cook catfish products revealed valuable insights (Table 1). Appearance, color, smell, taste, and in-mouth texture of the products were evaluated through a Likert scale in a 1 to 5 rating scale (1 indicating that the product attribute is not liked at all, and 5 indicating that this attribute is extremely liked). Therefore, an average rating of more than 2.50 for any of these attributes indicates that the majority of the auction participants rated the corresponding attribute favorably. The average score for the above-mentioned characteristics ranged between 3.34 and 3.82 for the panko breaded products, indicating that most of the auction participants liked these attributes of breaded products. For the marinated products, the majority of the participants liked the taste, smell, and texture, but did not like the appearance and color of these products. PBDF received the most favorable rating for appearance (3.61), color (3.54), smell (3.68), taste (3.82), and texture (3.70).
Attributes assessed on the Just About Right (JAR) scale revealed further insights. Most participants rated all breaded products favorably for glossiness, serving size, oiliness, and juiciness. About three-fifths of the participants opined that the saltiness of PBDF was just about right. In contrast, slightly more than half of the participants viewed the saltiness of PBSF as at the optimum level. Only 45.5% of the participants rated the saltiness of PBSS as just about right. Most participants rated the breaded products' crispiness unfavorably, except for PBSS. In the case of the marinated products, the majority of the participants rated the oiliness and juiciness of both SMDF and SGMDF as just about right. The majority of the participants opined that the glossiness of both marinated products failed to attain the JAR level. More than half of the participants (54.5%) rated the saltiness of SMDF as optimum, but only 48.8% found that saltiness was either less or more than their desired level. PBDF demonstrated the most favorable consumer ratings for both visual and organoleptic sensory dimensions. The average value of the “overall liking” score was highest for PBDF (6.8), followed by PBSS (6.2), PBSF (6.0), SMDF (5.7), and SGMDF (5.5). All the catfish products were accepted with “overall liking” scores greater than 5.
3.3. Market Price for Ready-to-Cook Catfish Products
The average market prices for all products and the mean market prices for each panel size before and after tasting the products are reported in Table 2 and Table 3. Before tasting the products, the average market price was the highest for Panko Breaded Delacata Fillet ($4.45 per packet), followed by Panko Breaded Standard Fillet ($4.19), Panko Breaded Standard Strips ($3.60), Sriracha Marinated Delacata Fillet ($3.33), and Sesame-Ginger Marinated Delacata Fillet ($3.10). After tasting the products, the average market price was the highest for Panko Breaded Delacata Fillet ($4.43 per packet), followed by Sesame-Ginger Marinated Delacata Fillet ($3.81), Panko Breaded Standard Strips ($3.40), Panko Breaded Standard Fillet ($3.36), and Sriracha Marinated Delacata Fillet ($3.36).
The average market prices are summarized and presented in Table 4. Before tasting the products, the market price for one packet of catfish product was highest for PBDF ($4.45 per packet), followed by PBSF ($4.19), PBSS ($3.60), SMDF ($3.33), and SGMDF ($3.10). On the other hand, after tasting the products, the average WTP was highest for PBDF ($4.43), followed by SGMDF ($3.81), PBSS ($3.40), PBSF ($3.36), and SMDF ($3.36). Figure 1 showed that market prices were significantly different (P< 0.05) between before and after product tasting only for both PBSF and SGMDF, where participants bid lower for PBSF and higher for SGMDF after tasting the product.
Generally, panko breaded catfish products were liked by the consumers in our study. It coincides with the fact that auction participants were used to consuming fried catfish products, and the baked breaded catfish products appeared more like the fried catfish. Participants were less accepting of the marinated catfish products cooked in a microwave. The marinated products' visual sensory attributes rating and WTP were also lower. This clearly indicates that Panko breaded catfish products are more likely to succeed in the market than the marinated ones before tasting them. However, after tasting the products, participants raised their bid for marinated products and lowered their bid for breaded products, indicating that they liked the taste of marinated products.
3.4. Factors Influencing Market Price
Table 5 reports the marginal effects from logit regressions predicting the probability that participants bid at or above the market price for ready-to-cook catfish products, before and after tasting. Pairwise correlation between relative ratings of the products and consumers' characteristics is reported in Appendix Table A1. Before tasting, appearance significantly increased the likelihood of bidding above market price (p<0.01), highlighting the importance of visual cues in shaping initial willingness to pay. Glossiness at a "just-about-right" (JAR) level was also a consistent positive driver both before and after tasting (p<0.05). However, once the participants tasted the products, appearance lost significance, and intrinsic sensory attributes became more influential. Specifically, taste (p<0.01) and smell (p<0.05) emerged as strong predictors of higher bids, underscoring the decisive role of sensory experience in final valuation. Other sensory traits, including texture, crispiness, saltiness, oiliness, and juiciness, did not significantly affect market price willingness.
Consumer characteristics also shaped bidding behavior. Older participants were slightly less likely to bid above market price before tasting (p<0.1), though this effect disappeared afterward. Graduate-educated participants consistently displayed lower probabilities of bidding above market price (p<0.01), suggesting greater price sensitivity. Conversely, frequent fish eaters (weekly or more) and higher-income individuals (≥$60,000) were significantly more willing to pay higher prices in both conditions. African American participants exhibited higher bids before tasting (p<0.1), but this effect diminished after tasting. Interestingly, those who indicated they personally purchase catfish were less likely to bid above market price in both cases (p<0.01), reflecting more cautious valuation when considering personal responsibility. Finally, larger panel sizes consistently reduced the probability of bidding above market price (p<0.01), aligning with auction competition dynamics.
Overall, the results indicate a clear shift from reliance on appearance cues before tasting to taste and smell after tasting, highlighting the central role of sensory quality in determining consumer willingness to pay for catfish products.
4. Discussion
The successful introduction of new food products requires careful pricing strategies, informed by an understanding of consumer purchasing behavior. Identifying the factors that influence consumer decisions provides insights for effective marketing strategies [45]. Experimental auction procedures, such as those described by Umberger and Feuz [27], are particularly useful because they simulate real-world market scenarios in controlled settings. In this study, participants' willingness to pay (WTP) to the tune of the market price in experimental auctions mirrored their likely purchasing behavior in an actual market.
Approximately 36% of participants expressed WTP to the tune of the market price for at least one product before tasting, while 35.4% did so after tasting, suggesting strong potential for repeat purchases for ready-to-cook catfish products. Consistent with previous studies [46,47,48], positive attitudes toward product attributes, especially taste, significantly increased the probability of offering the market price. Household income also positively influenced WTP to the tune of the market price, aligning with earlier findings that higher-income consumers purchase fish and seafood more frequently [6,39,49]. Conversely, participants with a Bachelor's degree were less likely to pay the market price, consistent with evidence that higher education is associated with reduced consumption of processed foods (Brunner, Van der Horst, & Siegrist, 2010). Those who shopped alone also showed lower WTP, reflecting earlier findings on seafood consumption patterns [6].
Experimental auctions further revealed that market prices can serve as proxies for market demand, since demand depends on both price and income distribution [50]. Higher panel sizes increased competition, raised bids, and market prices, but reduced the probability of any individual achieving the market price. Breaded (ready-to-bake) products consistently commanded higher market prices than marinated (ready-to-microwave) products, suggesting stronger market potential for breaded products. Nevertheless, consumers' lower ratings for the appearance of marinated products were negatively associated with demand for marinated products, supporting earlier evidence that visual appeal strongly influences catfish purchase decisions [46,47,48].
These findings align with broader literature indicating that food preferences are shaped by product attributes and consumer characteristics [51]. Quality, flavor, freshness, and ease of preparation remain critical determinants of catfish consumption [38]. Even minor price variations, coupled with shifts in consumer behavior, can significantly affect revenues and profitability [52]. In this study, breaded products received higher ratings for both visual and organoleptic sensory attributes, though differences with marinated products were not substantial. Thus, both product types may achieve market success, with taste emerging as the most decisive factor influencing consumer purchasing decisions.
Although no identical product exists on the market, there are breaded products available that are designed for frying purposes. We compare the prices of breaded fillet products available at local grocery stores around the auction locations, Pine Bluff, AR, and Lonoke, AR, with our products individually. For this comparison, prices were converted into $/lb units. In 2019 (the time of experimental auctions conducted for this study), the average price of breaded products in local retail stores was $6.61 per pound [30]. Before tasting the products, the market price per pound determined in this study was $20.57 for PBSS, $17.64 for PBSF, $18.74 for PBDF, $14.02 for SMDF, and $13.05 for SGMDF. On the other hand, after tasting the products, the auction participants offered a market price per pound was $19.43 for PBSS, $14.15 for PBSF, $18.65 for PBDF, $14.15 for SMDF, and $16.04 for SGMDF. The higher market prices offered for the ready-to-cook catfish products may be due to their superior sensory quality and perceived health benefits. Since these products do not require frying, they help reduce the intake of unhealthy fats and overall fat consumption—both of which are key risk factors for heart disease [53,54,55,56,57].
5. Conclusions
This study analyzed consumer bidding behavior in experimental auctions to determine market prices for five newly developed ready-to-cook catfish products and to identify the factors influencing willingness to pay the market price. Results showed that breaded products (ready-to-bake) consistently achieved higher market prices than marinated products (ready-to-microwave), with Panko Breaded Delacata Fillet (PBDF) ranked the highest. Consumers' purchasing decisions were significantly shaped by sensory attributes—particularly taste—as well as socioeconomic characteristics such as income, education, and involvement in grocery shopping. Importantly, market prices differed between visual sensory evaluation (before tasting) and organoleptic evaluation (after tasting), underscoring the dynamic nature of consumer preferences.
The findings reveal that "first impressions" based on product appearance, color, glossiness, and serving size influenced initial bids, but sustained willingness to pay depended on sensory experiences after tasting. While breaded products lost some price advantage after tasting, marinated products gained higher market prices, suggesting that improvements in appearance could further enhance their competitiveness. These results highlight the importance of aligning product development with both visual appeal and sensory quality. From a marketing perspective, promoting marinated catfish products through targeted demonstrations and consumer education could increase their acceptance and expand their market potential in the U.S. seafood sector.
Author Contributions
Conceptualization, U.D., S.A., N.K., M.D., and L.X.; methodology, U.D., S.A., N.K., M.D., and L.X.; data analysis, U.D., and S.A.; writing—original draft preparation, U.D., and S.A.; writing—review and editing, U.D., S.A., N.K., M.D., and L.X. All authors have read and agreed to the published version of the manuscript.
Funding
This work was supported by the USDA-NIFA under the grant "Designing and Testing New Catfish Products to Enhance Competitiveness of the US Catfish Industry" (Award No: 2014-38821-22458).
Institutional Review Board Statement
The UAPB Institutional Review Board (IRB) granted ethics approval to conduct this study. Registration Number: 101118. Approval Date: October 11, 2018.
Informed Consent Statement
Informed consent was obtained from all subjects involved in the study.
Data Availability Statement
Data is unavailable due to a privacy commitment made to the auction participants of the study.
Acknowledgments
The authors gratefully acknowledge the contribution of the co-investigators (Drs. Peter J. Bechtel, John M. Bland, and Casey C. Grimm) and research support team (Kamal Gosh and Suzanne Brashear) to the project.
Conflicts of Interest
The authors declare no conflicts of interest.
Abbreviations
The following abbreviations are used in this manuscript:
| PBSS | Panko breaded standard catfish strips |
| PBSF | Panko breaded standard catfish fillet |
| PBDF | Panko breaded standard catfish fillet |
| SMDF | Sriracha marinated delacata catfish fillet |
| SGMDF | Sesame-ginger marinated delacata catfish fillet |
| JAR | Just About Right |
Appendix A

Table A1.
Pairwise correlation between relative ratings of the products and consumers' characteristics.
Table A1.
Pairwise correlation between relative ratings of the products and consumers' characteristics.
| Appearance | Color | Glossiness | Serving size | Smell | Taste | |
|---|---|---|---|---|---|---|
| Appearance | 1.00 | |||||
| Color | 0.82*** | 1.00 | ||||
| Glossiness | 0.30*** | 0.25*** | 1.00 | |||
| Serving size | 0.12*** | 0.07 | 0.23*** | 1.00 | ||
| Smell | 0.19*** | 0.16*** | 0.09** | 0.06 | 1.00 | |
| Taste | 0.14*** | 0.14*** | 0.08** | 0.04 | 0.61*** | 1.00 |
| Texture | 0.19*** | 0.21*** | 0.13*** | -0.03 | 0.51*** | 0.64*** |
| Smell intensity | -0.03 | 0.00 | 0.00 | -0.01 | -0.16*** | -0.12*** |
| Crispy | 0.13*** | 0.15*** | 0.04 | -0.09** | 0.24*** | 0.32*** |
| Saltiness | 0.06 | 0.07* | 0.02 | 0.04 | 0.02 | 0.11*** |
| Oily | 0.01 | 0.07 | -0.01 | 0.09** | 0.07* | 0.05 |
| Juicy | 0.05 | 0.09** | 0.00 | 0.08** | 0.12*** | 0.21*** |
| JAR glossiness | 0.53*** | 0.49*** | 0.37*** | -0.05 | 0.15*** | 0.11*** |
| JAR serving | 0.06 | 0.05 | 0.05 | 0.35*** | 0.05 | 0.03 |
| JAR saltiness | -0.03 | -0.03 | -0.03 | -0.03 | 0.18*** | 0.28*** |
| JAR oiliness | 0.14*** | 0.19*** | 0.04 | -0.00 | 0.19*** | 0.32*** |
| JAR juiciness | 0.09** | 0.13*** | 0.06 | 0.02 | 0.24*** | 0.27*** |
| Age | 0.10** | 0.08** | 0.09** | 0.03 | 0.05 | -0.02 |
| DFemale | -0.01 | -0.04 | -0.04 | 0.09*** | -0.02 | -0.09** |
| DAfrAm | -0.15*** | -0.11*** | -0.12*** | -0.11*** | -0.03 | -0.05 |
| DGradaute | 0.18*** | 0.15*** | 0.15*** | 0.14*** | 0.01 | 0.05 |
| DMyself | 0.06 | 0.05 | 0.05 | -.02 | 0.03 | -0.04 |
| DIncA60k | 0.07* | 0.12*** | 0.12*** | 0.05 | 0.08** | 0.16*** |
| Panel size | -0.08** | -0.08* | -0.10** | -0.09** | -0.09** | -0.06 |
Table A1.
Continued.
| Texture | Smell intensity | Crispy | Saltiness | Oily | Juicy | |
| Texture | 1.00 | |||||
| Smell intensity | 0.02 | 1.00 | ||||
| Crispy | 0.44*** | 0.03 | 1.00 | |||
| Saltiness | -0.02 | 0.10** | 0.03 | 1.00 | ||
| Oily | 0.06 | 0.16*** | 0.02 | 0.13*** | 1.00 | |
| Juicy | 0.25*** | 0.05 | 0.12*** | 0.08** | 0.37*** | 1.00 |
| JAR glossiness | 0.12*** | -0.03 | 0.12*** | 0.04 | 0.01 | -0.02 |
| JAR serving | -0.01 | 0.05 | 0.01 | 0.02 | 0.11*** | 0.03 |
| JAR saltiness | 0.20*** | -0.03 | 0.11*** | -0.58*** | 0.00 | 0.08* |
| JAR oiliness | 0.37*** | 0.03 | 0.24*** | -0.08** | 0.21*** | 0.24*** |
| JAR juiciness | 0.37*** | -0.02 | 0.21*** | -0.03 | 0.16*** | 0.38*** |
| Age | 0.06 | -0.03 | 0.11*** | 0.15*** | -0.03 | -0.03 |
| DFemale | -0.07* | 0.03 | -0.11*** | 0.08* | 0.01 | -0.01 |
| DAfrAm | -0.06 | -0.07* | -.00 | -0.13*** | -0.08** | -0.05 |
| DGradaute | 0.08* | 0.05 | 0.08** | 0.24*** | 0.05 | 0.06 |
| DMyself | 0.03 | -0.1** | 0.06 | 0.09** | 0.02 | 0.01 |
| DIncA60k | 0.12*** | 0.02 | 0.04 | 0.07* | 0.02 | 0.03 |
| Panel size | -0.17*** | 0.00 | -0.03 | -0.03 | 0.09** | -0.00 |
Table A1.
Continued.
| JAR glossiness | JAR serving | JAR saltiness | JAR oiliness | JAR juiciness | Age | |
|---|---|---|---|---|---|---|
| JAR glossiness | 1.00 | |||||
| JAR serving | 0.22*** | 1.00 | ||||
| JAR saltiness | -0.05 | -0.05 | 1.00 | |||
| JAR oiliness | 0.11*** | 0.06 | 0.24*** | 1.00 | ||
| JAR juiciness | 0.05 | 0.11*** | 0.15*** | 0.38*** | 1.00 | |
| Age | 0.14*** | 0.01 | -0.11*** | -0.06 | -0.04 | 1.00 |
| DFemale | -0.03 | 0.23*** | -0.13*** | -0.04 | 0.02 | 0.11*** |
| DAfrAm | -0.08* | 0.08* | 0.10** | -0.01 | 0.01 | -0.17*** |
| DGradaute | 0.07* | -0.02 | -0.18*** | 0.02 | -0.05 | 0.18*** |
| DMyself | 0.07* | -0.03 | -0.06 | -0.04 | 0.01 | 0.23*** |
| DIncA60k | 0.04 | 0.07* | -0.09** | -0.02 | -0.00 | 0.17*** |
| Panel size | -0.04 | -0.06 | 0.04 | -0.00 | -0.02 | -0.09** |
Table A1.
Continued.
| DFemale | DAfrAm | DGrad. | DMyself | DIncA60k | Panel size | |
|---|---|---|---|---|---|---|
| DFemale | 1.00 | |||||
| DAfrAm | 0.12*** | 1.00 | ||||
| DGradaute | -0.10** | -0.51*** | 1.00 | |||
| DMyself | 0.05 | 0.00 | 0.06 | 1.00 | ||
| DIncA60k | 0.05 | -0.24*** | 0.14*** | -0.13*** | 1.00 | |
| Panel size | 0 | 0.23*** | -0.18*** | 0.08 | -0.28*** | 1.00 |
References
- Harris JM, Shiptsova R. Consumer Demand for Convenience Foods: Demographics and Expenditures. Journal of Food Distribution Research. 2007;38: 15. [CrossRef]
- Carrigan M, Attalla A. The myth of the ethical consumer – do ethics matter in purchase behaviour? Journal of Consumer Marketing. 2001;18: 560–578. [CrossRef]
- Nelson P. Information and Consumer Behavior. Journal of Political Economy. 1970;78: 311–329. Available: http://www.jstor.org.wvu.idm.oclc.org/stable/1830691.
- Dey MM, Rabbani AG, Singh K, Engle CR. Determinants of retail price and sales volume of catfish products in the United States: An application of retail scanner data. Aquaculture Economics & Management. 2014;18: 120–148. [CrossRef]
- Govindasamy R, Italia J, Zurbriggen M, Hossain F. Predicting Consumer Willingness-to-Purchase Value-Added Products at Direct Agricultural Markets. Journal of Food Products Marketing. 2002;8: 1–15. [CrossRef]
- Thong NT, Solgaard HS. Consumer’s food motives and seafood consumption. Food Quality and Preference. 2017;56: 181–188. [CrossRef]
- Furst T, Connors M, Bisogni CA, Sobal J, Falk LW. Food Choice: A Conceptual Model of the Process. Appetite. 1996;26: 247–266. [CrossRef]
- Shepherd R. Factors influencing food preferences and choice. Handbook of the Psychophysiology of Human Eating. New York: John Wiley and Sons; 1989. pp. 3–24.
- Gallardo RK, Kupferman E, Colonna A. Willingness to pay for optimal ’Anjou’pear quality. HortScience. 2011;46: 452–456. Available: https://s3.wp.wsu.edu/uploads/sites/290/2015/04/Willingness-to-pay-for-optimal-Anjou-pear-quality.pdf.
- Kotler P, Keller KL. Marketing management. 14th [ed.]. Upper Saddle River, N.J: Prentice Hall; 2012.
- Ainslie A, Rossi PE. Similarities in Choice Behavior Across Product Categories. Marketing Science. 1998;17: 91–106. [CrossRef]
- Rabin M. Psychology and Economics. Journal of Economic Literature. 1998;36: 11–46. Available: http://www.jstor.org.wvu.idm.oclc.org/stable/2564950.
- Bi X, House L, Gao Z, Gmitter F. Sensory Evaluation and Experimental Auctions: Measuring Willingness to Pay for Specific Sensory Attributes. American J Agri Economics. 2012;94: 562–568. [CrossRef]
- Costanigro M, Kroll S, Thilmany D, Bunning M. Is it love for local/organic or hate for conventional? Asymmetric effects of information and taste on label preferences in an experimental auction. Food Quality and Preference. 2014;31: 94–105. [CrossRef]
- Dinis I, Simoes O, Moreira J. Using sensory experiments to determine consumers’ willingness to pay for traditional apple varieties. Span j agric res. 2011;9: 351–362. [CrossRef]
- Breidert C, Hahsler M, Reutterer T. A review of methods for measuring willingness-to-pay. Innovative Marketing. 2006;2: 8–32. Available: https://www.scopus.com/inward/record.uri?eid=2-s2.0-85075173403&partnerID=40&md5=4482db78504a3abe1e10646b4cec8557.
- Dey MM, Surathkal P, Chen OL, Engle CR. Market trends for seafood products in the USA: Implication for Southern aquaculture products. Aquaculture Economics & Management. 2017;21: 25–43. [CrossRef]
- Singh K, Dey MM, Surathkal P. Analysis of a Demand System for Unbreaded Frozen Seafood in the United States Using Store-level Scanner Data. Marine Resource Economics. 2012;27: 371–387. [CrossRef]
- Singh K, Dey MM, Surathkal P. Seasonal and Spatial Variations in Demand for and Elasticities of Fish Products in the United States: An Analysis Based on Market-Level Scanner Data. Canadian J Agri Economics. 2014;62: 343–363. [CrossRef]
- Surathkal P, Dey MM, Engle CR, Chidmi B, Singh K. Consumer demand for frozen seafood product categories in the United States. Aquaculture Economics & Management. 2017;21: 9–24. [CrossRef]
- Alfnes F, Rickertsen K. European Consumers’ Willingness to Pay for U.S. Beef in Experimental Auction Markets. American J Agri Economics. 2003;85: 396–405. [CrossRef]
- Demont M, Rutsaert P, Ndour M, Verbeke W, Seck PA, Tollens E. Experimental auctions, collective induction and choice shift: willingness-to-pay for rice quality in Senegal. European Review of Agricultural Economics. 2013;40: 261–286. [CrossRef]
- Hung Y, Verbeke W. Sensory attributes shaping consumers’ willingness-to-pay for newly developed processed meat products with natural compounds and a reduced level of nitrite. Food Quality and Preference. 2018;70: 21–31. [CrossRef]
- Melton BE, Huffman WE, Shogren JF. Economic Values of Pork Attributes: Hedonic Price Analysis of Experimental Auction Data. Applied Eco Perspectives Pol. 1996;18: 613–627. [CrossRef]
- Uchida H, Onozaka Y, Morita T, Managi S. Demand for ecolabeled seafood in the Japanese market: A conjoint analysis of the impact of information and interaction with other labels. Food Policy. 2014;44: 68–76. [CrossRef]
- Wakamatsu H, Anderson CM, Uchida H, Roheim CA. Pricing Ecolabeled Seafood Products with Heterogeneous Preferences: An Auction Experiment in Japan. Marine Resource Economics. 2017;32: 277–294. [CrossRef]
- Umberger WJ, Feuz DM. The Usefulness of Experimental Auctions in Determining Consumers’ Willingness-to-Pay for Quality-Differentiated Products. Review of Agricultural Economics. 2004;26: 170–185. Available: http://www.jstor.org.wvu.idm.oclc.org/stable/3700829.
- Adhikari S, Deb U, Dey MM, Xie L, Khanal NB, Grimm CC, et al. Consumers’ willingness-to-pay for convenient catfish products: Results from experimental auctions in Arkansas. Aquaculture Economics & Management. 2021;25: 135–158. [CrossRef]
- Deb UK, Dey MM, Adhikari S, Khanal NB, Gosh K, Xie L, et al. Convenient (Ready-to-Cook) Catfish Products: The Development Process, Sensory Attributes, and Consumers’ Evaluation. Journal of Agricultural, Environmental and Consumer Sciences. 2020;20: 5–18.
- Khanal NB, Deb UK, Adhikari S, Dey MM. Taste and value: Exploring sensory acceptance and willingness-to-pay for convenient farm-raised catfish products through experimental auction. Aquaculture Economics & Management. 2025; 1–27. [CrossRef]
- Dey MM, Rahman MdS, Dewan MdF, Sudhakaran PO, Deb U, Khan MdA. Consumers’ willingness to pay for safer fish: Evidence from experimental auctions in Bangladesh. Aquaculture Economics & Management. 2024;28: 460–490. [CrossRef]
- Lusk J, Shogren JF. Experimental auctions: methods and applications in economic and marketing research. Cambridge ; New York: Cambridge University Press; 2007.
- USCB. U.S. Census Bureau QuickFacts: United States. 2024. Available: https://www.census.gov/quickfacts/fact/table/US/RHI125223.
- Bland JM, Grimm CC, Bechtel PJ, Deb U, Dey MM. Proximate Composition and Nutritional Attributes of Ready-to-Cook Catfish Products. Foods. 2021;10: 2716. [CrossRef]
- Engle CR, Dellenbarger LE, Hatch U, Capps OJ, Dillare J, Kinnucan H, et al. The U.S. market for farm-raised catfish: an overview of consumer, supermarket and restaurant surveys. University of Arkansas, Pine Bluff, Arkansas, USA: Arkansas Agricultural Experiment Station; 1990 Jan p. 25. Report No.: 925.
- Riepe R. Marketing Seafood to Restaurants in the north Central Region. North Central Regional Aquaculture Center in cooperation with USDA; 1998. Available: https://www.ncrac.org/files/inline-files/ncrac110_0.pdf.
- Cheng H, Capps O. Demand Analysis of Fresh and Frozen Finfish and Shellfish in the United States. American J Agri Economics. 1988;70: 533–542. [CrossRef]
- Kinnucan HW, Venkateswaran M. Effects of Generic Advertising on Perceptions and Behavior: The Case of Catfish. J Agric Appl Econ. 1990;22: 137–151. [CrossRef]
- Myrland Ø, Trondsen T, Johnston RS, Lund E. Determinants of seafood consumption in Norway: lifestyle, revealed preferences, and barriers to consumption. Food Quality and Preference. 2000;11: 169–188. [CrossRef]
- Nayga RM, Capps O. Factors Affecting the Probability of Consuming Fish and Shellfish in the Away from Home and at Home Markets. J Agric Appl Econ. 1995;27: 161–171. [CrossRef]
- Brooks PM, Andersen JL. Effects of retail pricing, seasonality and advertising on fresh seafood sales. Journal of Business and Economic Studies. 1991;1: 77–90.
- Carroll MT, Anderson JL, Martínez-Garmendia J. Pricing U.S. North Atlantic bluefin tuna and implications for management. Agribusiness. 2001;17: 243–254. [CrossRef]
- McConnell KE, Strand IE. Hedonic Prices for Fish: Tuna Prices in Hawaii. American J Agri Economics. 2000;82: 133–144. [CrossRef]
- Asche F, Guillen J. The importance of fishing method, gear and origin: The Spanish hake market. Marine Policy. 2012;36: 365–369. [CrossRef]
- Nurse Rainbolt G, Onozaka Y, McFadden DT. Consumer Motivations and Buying Behavior: The Case of the Local Food System Movement. Journal of Food Products Marketing. 2012;18: 385–396. [CrossRef]
- Boleware V, Dillard JG. Consumer Awareness and Acceptance of Farm Raised Catfish-Second Survey. MAFES Information Bulletins. 1984;14. Available: https://scholarsjunction.msstate.edu/mafes-info-bulletins/14?utm_source=scholarsjunction.msstate.edu%2Fmafes-info-bulletins%2F14&utm_medium=PDF&utm_campaign=PDFCoverPages.
- Dixon DAJr, Miller JS, Conner JR, Waldrop JE. Survey of Market Channels for Farm-raised Catfish. AEC research report - Mississippi State University, Dept. of Agricultural Economics, Agricultural and Forestry Experiment Station | AEC Res Rep Miss State Univ Dep Agric Econ Agric For Exp Sta; 1982.
- Drammeh L, House L, Sureshwaran S, Selassie H. Analysis of factors influencing the frequency of catfish consumption in the United States. 2002 [cited 10 Sep 2025]. [CrossRef]
- Dellenbarger LE, Dillard J, Schupp AR, Zapata HO, Young BT. Socioeconomic factors associated with at-home and away-from home catfish consumption in the United States. Agribusiness. 1992;8: 35–46. [CrossRef]
- Shafer W, Sonnenschein H. Chapter 14 Market demand and excess demand functions. Handbook of Mathematical Economics. Elsevier; 1982. pp. 671–693. [CrossRef]
- Froehlich EJ, Carlberg JG, Ward CE. Willingness-to-Pay for Fresh Brand Name Beef. Canadian J Agri Economics. 2009;57: 119–137. [CrossRef]
- Marn MV, Roegner EV, Zawada CC. The power of pricing. McKinsey and Company; 2002. Available: https://www.mckinsey.com/capabilities/growth-marketing-and-sales/our-insights/the-power-of-pricing.
- Gall KL, Otwell WS, Koburgier JA, Appledorf H. Effects of Four Cooking Methods on the Proximate, Mineral and Fatty Acid Composition of Fish Fillets. Journal of Food Science. 1983;48: 1068–1074. [CrossRef]
- Gulati S, Misra A. Abdominal obesity and type 2 diabetes in Asian Indians: dietary strategies including edible oils, cooking practices and sugar intake. Eur J Clin Nutr. 2017;71: 850–857. [CrossRef]
- Moumtaz S, Percival BC, Parmar D, Grootveld KL, Jansson P, Grootveld M. Toxic aldehyde generation in and food uptake from culinary oils during frying practices: peroxidative resistance of a monounsaturate-rich algae oil. Sci Rep. 2019;9: 4125. [CrossRef]
- Raatz SK, Golovko MY, Brose SA, Rosenberger TA, Burr GS, Wolters WR, et al. Baking Reduces Prostaglandin, Resolvin, and Hydroxy-Fatty Acid Content of Farm-Raised Atlantic Salmon ( Salmo salar ). J Agric Food Chem. 2011;59: 11278–11286. [CrossRef]
- Rodríguez-Ayala M, Banegas JR, Ortolá R, Gorostidi M, Donat-Vargas C, Rodríguez-Artalejo F, et al. Cooking methods are associated with inflammatory factors, renal function, and other hormones and nutritional biomarkers in older adults. Sci Rep. 2022;12: 16483. [CrossRef]
Figure 1.
Average market price ($/packet) determined through experimental auctions for different catfish products before and after tasting. Different letters in the graph indicate a significant difference (p ≤ 0.05) between WTP before and after tasting the same product.
Figure 1.
Average market price ($/packet) determined through experimental auctions for different catfish products before and after tasting. Different letters in the graph indicate a significant difference (p ≤ 0.05) between WTP before and after tasting the same product.
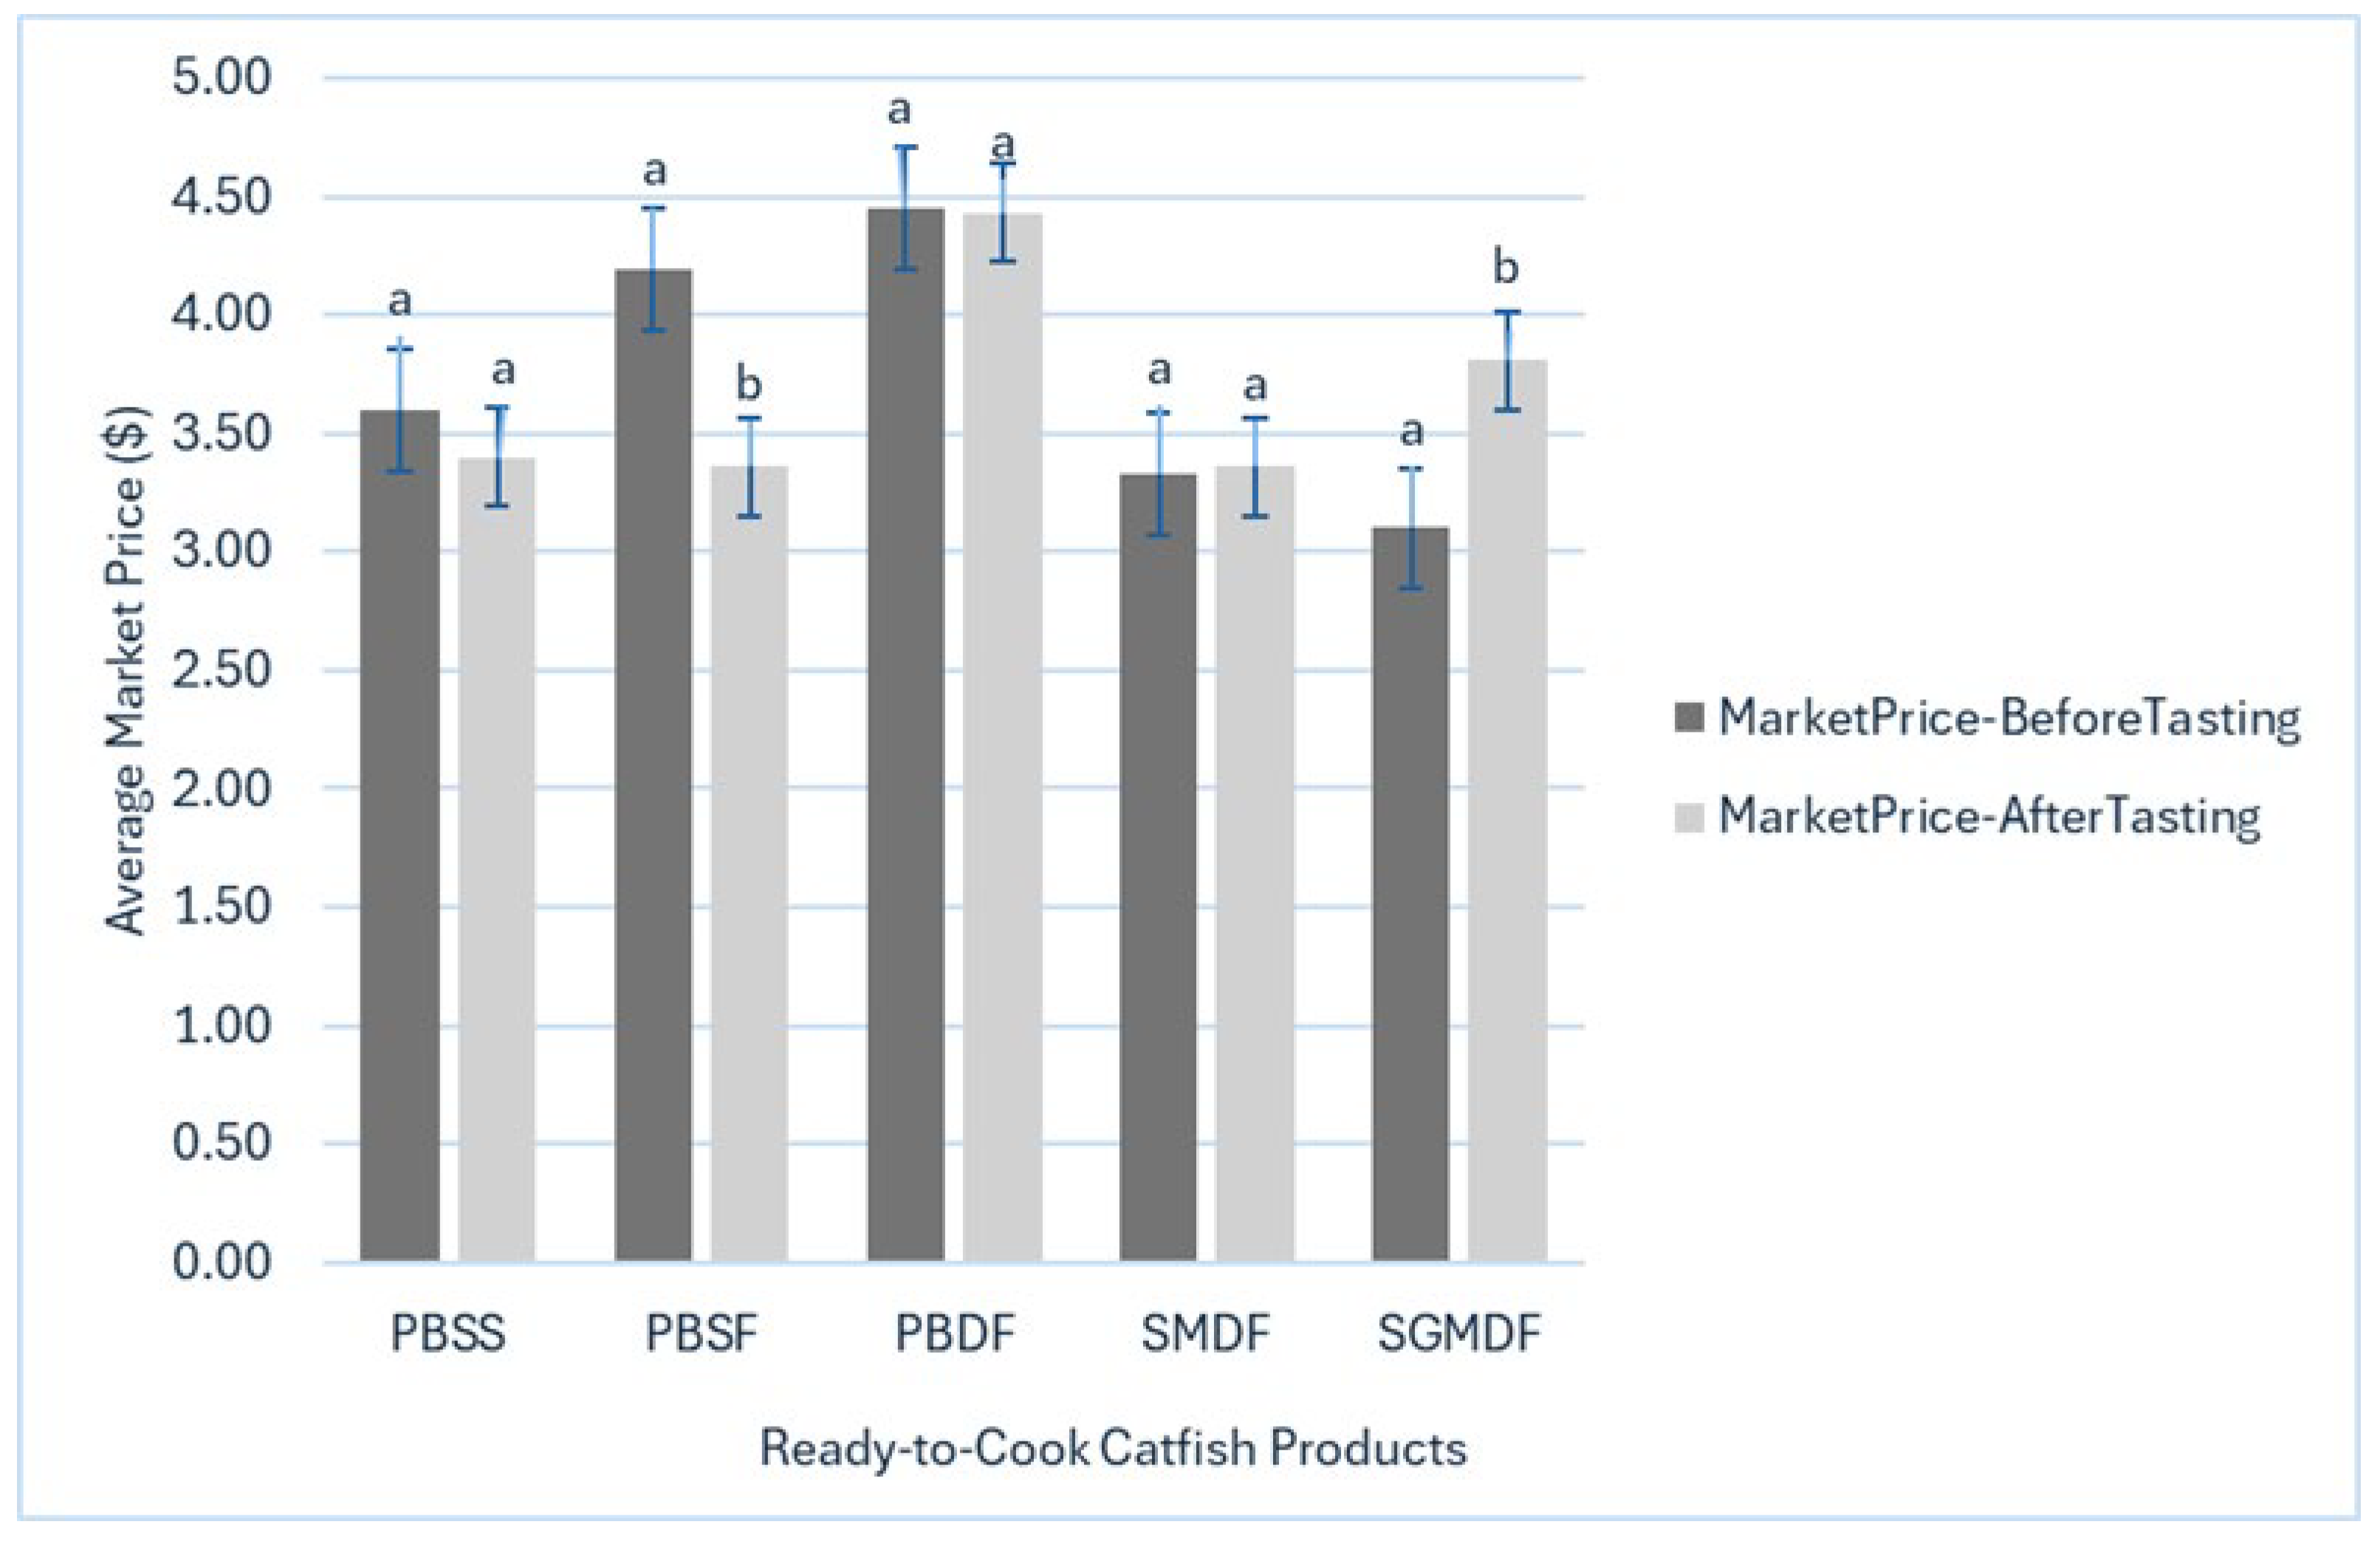
Table 1.
Sensory evaluation ratings of the ready-to-cook catfish products.
| Participants Rating |
PBSS | PBSF | PBDF | SMDF | SGMDF |
|---|---|---|---|---|---|
| Appearance score (1 to 5) | 3.34 (0.84) |
3.34 (0.87) |
3.61 (0.80) |
2.26 (1.14) |
1.80 (0.98) |
| Color score (1 to 5) | 3.46 (0.82) |
3.45 (0.94) |
3.54 (0.91) |
2.45 (1.22) |
1.81 (0.93) |
| Smell score (1 to 5) | 3.43 (0.81) |
3.35 (0.74) |
3.68 (0.86) |
3.33 (0.85) |
3.22 (0.95) |
| Taste score (1 to 5) | 3.54 (0.96) |
3.36 (1.02) |
3.82 (0.84) |
3.38 (1.03) |
3.31 (1.04) |
| Texture score (1 to 5) | 3.63 (0.85) |
3.51 (0.88) |
3.70 (0.92) |
3.27 (1.00) |
3.31 (1.04) |
| Glossiness JAR (% of participants) |
69.4 | 70.2 | 73.6 | 47.9 | 33.9 |
| Serving size JAR (% of participants) |
55.4 | 73.6 | 73.6 | 63.6 | 66.9 |
| Crispiness JAR (% of participants) |
52.9 | 45.5 | 42.1 | NA | NA |
| Saltiness JAR (% of participants) |
45.5 | 52.9 | 59.5 | 54.5 | 48.8 |
| Oiliness JAR (% of participants) |
71.9 | 74.4 | 85.1 | 68.6 | 61.2 |
| Juiciness JAR (% of participants) |
71.9 | 71.1 | 77.7 | 58.7 | 64.5 |
| Overall liking score (1 to 9) |
6.22 (1.80) |
5.98 (1.92) |
6.77 (1.51) |
5.70 (2.01) |
5.51 (2.11) |
| Appearance score (1 to 5) | 3.34 (0.84) |
3.34 (0.87) |
3.61 (0.80) |
2.26 (1.14) |
1.80 (0.98) |
| Color score (1 to 5) | 3.46 (0.82) |
3.45 (0.94) |
3.54 (0.91) |
2.45 (1.22) |
1.81 (0.93) |
Note: Standard deviations are reported in parentheses. PBSS = Panko Breaded Standard Strips, PBSF = Panko Breaded Standard Fillet, PBDF = Panko Breaded Delacata Fillet, SMDF = Sriracha Marinated Delacata Fillet, SGMDF = Sesame-Ginger Marinated Delacata Fillet. Source: Authors' calculation.
Table 2.
Average market prices ($/packet) of ready-to-cook catfish products before tasting (Round I).
Table 2.
Average market prices ($/packet) of ready-to-cook catfish products before tasting (Round I).
| Panel sizea | Number of Observationsb |
Average market price for the product (before tasting) | ||||
|---|---|---|---|---|---|---|
| PBSS (80 gm) |
PBSF (110 gm) |
PBDF (110 gm) |
SMDF (110 gm) |
SGMDF (110 gm) |
||
| 3 | 1 | 2.25 (NA) |
3.00 (NA) |
3.50 (NA) |
2.50 (NA) |
2.00 (NA) |
| 4 | 3 | 4.33 (2.31) |
4.50 (1.32) |
4.55 (2.21) |
2.19 (0.65) |
3.18 (0.99) |
| 5 | 2 | 2.63 (0.88) |
3.13 (0.53 |
3.00 (0.70) |
2.50 (0.71) |
2.50 (0.71) |
| 6 | 4 | 3.44 (1.26) |
3.75 (1.50) |
3.88 (1.09) |
3.81 (0.55) |
2.69 (0.85) |
| 7 | 1 | 5.00 (NA) |
5.00 (NA) |
5.00 (NA) |
1.10 (NA) |
1.50 (NA) |
| 8 | 2 | 2.88 (0.18) |
3.75 (0.35) |
5.00 (1.41) |
3.50 (0.71) |
4.25 (1.06) |
| 9 | 2 | 3.38 (0.88) |
4.50 (0.00) |
4.38 (0.88) |
4.50 (0.71) |
3.75 (0.35) |
| 10 | 2 | 4.50 (0.71) |
4.63 (0.53) |
5.33 (0.46) |
4.75 (0.35) |
4.00 (0.00) |
| 11 | 1 | 4.11 (NA) |
7.00 (NA) |
7.00 (NA) |
4.00 (NA) |
3.00 (NA) |
| All Panels | 18 | 3.60 (1.28) |
4.19 (1.22) |
4.45 (1.38) |
3.33 (1.15) |
3.10 (0.98) |
Note: Standard deviations are reported in parentheses. PBSS = Panko Breaded Standard Strips, PBSF = Panko Breaded Standard Fillet, PBDF = Panko Breaded Delacata Fillet, SMDF = Sriracha Marinated Delacata Fillet, SGMDF = Sesame-Ginger Marinated Delacata Fillet. a Panel size is equal to the number of consumers in each panel. b Number of observations is equal to the number of panels of the same panel size. Source: Authors' calculation.
Table 3.
Average market prices ($/packet) of ready-to-cook catfish products after tasting (Round II).
Table 3.
Average market prices ($/packet) of ready-to-cook catfish products after tasting (Round II).
| Panel sizea | Number of Observationsb |
Average market price for the product (before tasting) | ||||
|---|---|---|---|---|---|---|
| PBSS (80 gm) |
PBSF (110 gm) |
PBDF (110 gm) |
SMDF (110 gm) |
SGMDF (110 gm) |
||
| 3 | 1 | 1.50 (NA) |
3.00 (NA) |
3.50 (NA) |
2.50 (NA) |
2.00 (NA) |
| 4 | 3 | 2.66 (2.08) |
2.00 (1.00) |
3.50 (1.32) |
2.46 (0.50) |
4.17 (2.02) |
| 5 | 2 | 2.63 (1.24) |
3.00 (0.71) |
3.13 (0.88) |
2.08 (0.11) |
2.50 (0.71) |
| 6 | 4 | 2.94 (0.97) |
2.81 (1.25) |
3.75 (1.32) |
3.19 (0.94) |
3.69 (0.94) |
| 7 | 1 | 5.00 (NA) |
3.00 (NA) |
5.00 (NA) |
2.00 (NA) |
3.00 (NA) |
| 8 | 2 | 3.75 (1.06) |
3.50 (0.71) |
4.50 (0.71) |
3.88 (0.18) |
3.75 (1.06) |
| 9 | 2 | 2.88 (0.53) |
3.13 (0.88) |
4.00 (0.00) |
3.00 (0.00) |
3.50 (0.71) |
| 10 | 2 | 5.75 (0.35) |
5.00 (0.01) |
6.78 (1.73) |
6.00 (0.00) |
4.94 (1.33) |
| 11 | 1 | 5.00 (NA) |
8.00 (NA) |
8.99 (NA) |
6.00 (NA) |
7.00 (NA) |
| All Panels | 18 | 3.40 (1.51) |
3.36 (1.59) |
4.43 (1.79) |
3.36 (1.40) |
3.81 (1.44) |
Note: Standard deviations are reported in parentheses. PBSS = Panko Breaded Standard Strips, PBSF = Panko Breaded Standard Fillet, PBDF = Panko Breaded Delacata Fillet, SMDF = Sriracha Marinated Delacata Fillet, SGMDF = Sesame-Ginger Marinated Delacata Fillet. a Panel size is equal to the number of consumers in each panel. b Number of observations is equal to the number of panels of the same panel size. Source: Authors' calculation.
Table 4.
Summary statistics of market price ($/packet) revealed through auctions before and after tasting the ready-to-cook catfish products.
Table 4.
Summary statistics of market price ($/packet) revealed through auctions before and after tasting the ready-to-cook catfish products.
| Products | Market Price in Round I (Before tasting) |
Market Price in Round II (After tasting) |
||
|---|---|---|---|---|
| Mean | SD | Mean | SD | |
| PBSS (80 gm) | 3.60 | 1.28 | 3.40 | 1.51 |
| PBSF (110 gm) | 4.19 | 1.22 | 3.36 | 1.59 |
| PBDF (110 gm) | 4.45 | 1.38 | 4.43 | 1.79 |
| SMDF (110 gm) | 3.33 | 1.15 | 3.36 | 1.40 |
| SGMDF(110 gm) | 3.10 | 0.98 | 3.81 | 1.44 |
Note: Total number of participants = 121. PBSS = Panko breaded standard catfish strips, PBSF = Panko breaded standard catfish fillet, PBDF = Panko breaded standard catfish fillet, SMDF = Sriracha marinated delacata catfish fillet, and SMGDF = Sesame-ginger marinated delacata catfish fillet.
Table 5.
Marginal effects from logit regression predicting the market price of ready-to-cook catfish products.
Table 5.
Marginal effects from logit regression predicting the market price of ready-to-cook catfish products.
| Variable | Before tasting the products | After tasting the products | ||
|---|---|---|---|---|
| Coefficient | Std. Err. | Coefficient | Std. Err. | |
| Appearance | 0.064*** | 0.022 | -0.007 | 0.021 |
| Glossiness JAR | 0.127** | 0.052 | 0.127** | 0.052 |
| Serving size JAR | 0.009 | 0.048 | -0.043 | 0.047 |
| Smell | - | - | 0.066** | 0.034 |
| Taste | - | - | 0.128*** | 0.032 |
| Texture | - | - | -0.006 | 0.032 |
| Smell Intensity | - | - | -0.020 | 0.039 |
| Crispiness JAR | - | - | 0.036 | 0.046 |
| Saltiness JAR | - | - | 0.065 | 0.045 |
| Oiliness JAR | - | - | 0.065 | 0.057 |
| Juiciness JAR | - | - | 0.012 | 0.052 |
| Age | -0.003* | 0.002 | -0.001 | 0.002 |
| Dummy for Female | -0.039 | 0.045 | 0.012 | 0.044 |
| Dummy for African American | 0.095* | 0.052 | 0.043 | 0.052 |
| Dummy for Graduate | -0.236*** | 0.056 | -0.308*** | 0.058 |
| Dummy for Myself | -0.117*** | 0.044 | -0.168*** | 0.044 |
| Consumes fish frequently | 0.096** | 0.045 | 0.165*** | 0.046 |
| Family Income >= $60k | 0.185*** | 0.049 | 0.132*** | 0.049 |
| Panel Size | -0.062*** | 0.010 | -0.060*** | 0.010 |
Note: ***p<0.01, **p<0.05, and *p<0.10; n = 121. Source: Authors' estimate.
Disclaimer/Publisher’s Note: The statements, opinions and data contained in all publications are solely those of the individual author(s) and contributor(s) and not of MDPI and/or the editor(s). MDPI and/or the editor(s) disclaim responsibility for any injury to people or property resulting from any ideas, methods, instructions or products referred to in the content. |
© 2025 by the authors. Licensee MDPI, Basel, Switzerland. This article is an open access article distributed under the terms and conditions of the Creative Commons Attribution (CC BY) license (http://creativecommons.org/licenses/by/4.0/).
Copyright: This open access article is published under a Creative Commons CC BY 4.0 license, which permit the free download, distribution, and reuse, provided that the author and preprint are cited in any reuse.


