Submitted:
25 September 2025
Posted:
26 September 2025
You are already at the latest version
Abstract
Background: Poly (ADP-ribose) polymerase inhibitors (PARPi) are the standard of care for first-line maintenance in advanced ovarian cancer, but their benefit varies by BRCA and homologous recombination deficiency (HRD) status, and no head-to-head comparisons are available. Methods: We conducted an indirect comparison of PARPi regimens using reconstructed individual patient data (IPD) from Kaplan–Meier curves of phase III randomized trials (SOLO1, PRIMA, PAOLA1, ATHENA, FLAMES). Progression-free survival (PFS) was the primary endpoint; overall survival (OS) was exploratory. Subgroups were defined as BRCA-mutated (BRCA+), BRCA-/HRD+, and BRCA-/HRD-. Safety outcomes were assessed through a network meta-analysis of adverse drug reactions (ADRs). Results: In BRCA+ patients, olaparib+bevacizumab achieved the largest PFS improvement (HR = 0.27, 95% CI 0.19–0.39), followed by olaparib monotherapy, while niraparib performed significantly worse. In BRCA-/HRD+, olaparib+bevacizumab was superior to niraparib and rucaparib, with restricted mean survival time (RMST) gains of 3–4 months. In BRCA-/HRD-, PARPi produced only modest benefit, with no advantage over bevacizumab monotherapy. Exploratory OS analysis confirmed long-term survival with olaparib in BRCA+ but not in the other subgroups. Safety analysis indicated olaparib had the most favorable hematological profile, while niraparib was associated with the highest rates of severe anemia, thrombocytopenia, and neutropenia, despite showing lower gastrointestinal toxicity and fatigue incidence. Conclusions: PARPi efficacy depends strongly on BRCA and HRD status. Olaparib-based regimens provide the greatest clinical benefit with acceptable safety in BRCA+ and HRD+ disease, whereas PARPi appear of limited value in HRD-negative ovarian cancer.
Keywords:
advanced ovarian cancer
; PARP-inhibitors
; IPDfromKM
; indirect comparison
; meta-analysis
1. Introduction
Ovarian cancer is the fourteenth leading cause of cancer death worldwide, accounting for over 200,000 deaths per year, and the fifth leading cause of cancer death among women in the United States [1,2]. The treatment approach for newly diagnosed advanced ovarian cancer consists of cytoreductive surgery and systemic therapy [3,4]. However, half of all patients present with distant metastases at diagnosis, and most patients treated with curative intent experience relapse within three years [5]. The need for first-line treatments that maintain a response to platinum therapy over time has encouraged the development of effective maintenance therapies that are potentially capable of delaying relapse. Adding bevacizumab to platinum therapy, followed by bevacizumab alone, led to prolonged progression-free survival (PFS), but no improvement in overall survival (OS) [6,7,8,9]. The introduction of poly (ADP-ribose) polymerase (PARP) inhibitors as a therapeutic option has expanded the treatment landscape for ovarian cancer [10]. and PARP inhibitors (PARPi) currently represent the standard of care for first-line maintenance treatment [11,12,13,14,15,16,17,18,19]. In addition, the introduction of PARPi has highlighted differences in efficacy among subpopulations, confirming the expression of BRCA and HRD genes as important stratification biomarkers for optimal clinical decision. The current treatment scenario reimbursed by the Italian National Health Service envisages the potential use of olaparib as monotherapy only for patients with a BRCA mutation, and olaparib in combination with bevacizumab for patients with no BRCA mutation and HR deficient. Niraparib and rucaparib could potentially be used to treat patients regardless of their mutational status. However, as there is no direct comparison between the various PARPi in different subpopulations, several questions remain unanswered. For example, is the use of PARi such as niraparib and rucaparib in HR-proficient patients clinically appropriate? Are currently available PARPi equally effective? Could the combination of bevacizumab and olaparib be more beneficial for patients with BRCA mutations than monotherapy with other PARPi? In a scenario with many new features, such as the one described, it is crucial to select the most effective molecularly targeted therapy to maintain disease control as long as possible. This study aims to indirectly compare currently available treatments and combinations for first-line maintenance treatment of ovarian cancer. In our analysis, we used the IPDfromKM methodology to reconstruct individual patient data from the main randomized clinical trials on maintenance therapy with PARPi and provide an indirect comparison of the differential efficacy of the various treatment options, including also an overview on their different safety profiles [20].
2. Materials and Methods
2.1. Literature Search
We conducted a systematic search of the PubMed database to identify randomised controlled trials (RCTs) that were relevant to our analysis. The last search was performed on 02 Jul 2025. The search strategy was as follows: [(“Ovarian Cancer” OR “ovarian carcinoma”) AND (“Parp inhibitor” OR “Parp inhibitors” OR “parpi” OR Olaparib OR Niraparib OR Rucaparib OR Veliparib OR Senaparib OR Talazoparib OR Pamiparib) AND (“first-line” OR “first line” OR maintenance OR “newly diagnosed”)]. The selection process adhered to the PRISMA guidelines [21]. The inclusion criteria were as follows: (a) phase III RCT phase III; (b) first-line maintenance treatment of advanced ovarian cancer; (c) availability of progression-free survival (PFS) outcomes; (d) data presented through Kaplan-Meier (KM) survival curves. We excluded studies in which KM curves reported survival data starting not from the beginning of the maintenance phase, but including also the previous chemotherapy treatment (VELIA and FIRST RCTs [22,23].). To avoid duplication of data, the most recent and complete version was selected for inclusion when multiple publications from the same trial were available.
2.2. Reconstruction of Individual Patient Data
The IPDfromKM method [20]. was used to reconstruct individual patient-level data (IPD) from the KM survival curves of the treatment and control arms reported in the selected RCTs. The KM curves were digitized using WebPlotDigitizer (version 4.7; available online at https://apps.automeris.io/wpd/, accessed August 18, 2025). The extracted X–Y coordinates, together with the number of enrolled patients and events, were then processed using the IPDfromKM software (version 1.2.3.0; last updated March 22, 2022). This generated reconstructed dataset providing survival times (defined as the interval from trial enrollment to the last available follow-up) and patient outcomes, which were categorized as alive/censored or dead/progressed. This procedure yielded reconstructed IPD for each RCT arm.
2.3. Study Design and Data Analysis
This analysis aimed to evaluate the relative efficacy of maintenance treatments for patients with newly diagnosed advanced ovarian cancer following first-line platinum-based chemotherapy, with progression-free survival (PFS) as the primary endpoint and overall survival (OS) assessed as an exploratory outcome. The regimens evaluated included the PARPi olaparib, niraparib, rucaparib, and senaparib, as well as a treatment arm combining olaparib with bevacizumab.
KM curves for PFS were reconstructed for each trial arm, while OS curves were available only for SOLO1, PAOLA1, and PRIMA trials. For comparative analyses, placebo was adopted as the common comparator across the included trials. An exception was made for the subgroup of patients with BRCA-/HRD-, for whom the control arm of the PAOLA1 trial (bevacizumab) was treated as an independent comparator. All patients receiving placebo across the included studies were pooled and analyzed together to constitute the control group.Subgroup analyses were conducted according to molecular characteristics of the primary tumor (BRCA+, BRCA-/HRD+, BRCA-/HRD-).
Treatment effects were estimated using a Cox proportional hazards model, with the results expressed as hazard ratios (HR) and 95% confidence intervals (CI). Homogeneity of the control groups across the trials was evaluated using likelihood ratio tests and concordance statistics. Indirect pairwise comparisons among active regimens were also performed through Cox regression models. Restricted Mean Survival Time (RMST) was calculated as an additional measure of treatment effect for PFS only, with KM curves truncated at 33, 30 and 26 months for BRCA+, BRCA-/HRD+, BRCA-/HRD- subgroups, respectively, which corresponds to the minimum follow-up time available across the included RCTs. As PFS results at longer follow-up time were available for SOLO1 and PRIMA, for these studies a further comparative analysis based on RMST at 75 months was performed. All statistical analyses were performed with R software (version 4.3.2).
Finally, the most frequently reported adverse drug reactions (ADRs), both of any grade and grade ≥3, were collected from the included trials. A frequentist network meta-analysis with a random-effects model was conducted using MetaInsight software [24]. to estimate the relative risk (RR) of developing each ADR, with placebo defined as the reference comparator. In addition, forest plots were generated using the Meta-Mar software (version 4.0.2) [25].
3. Results
3.1. Indirect Comparison Efficacy Analysis
A comprehensive literature search retrieved 993 records, which were screened based on predefined inclusion and exclusion criteria to capture the most recent RCTs evaluating maintenance therapy with PARPi in patients with newly diagnosed advanced ovarian cancer following first-line platinum-based chemotherapy. The selection process, illustrated in Figure 1 according to PRISMA recommendations, resulted in the identification of five RCTs eligible for indirect comparison analysis on progression-free survival (PFS) outcomes. Results from the VELIA and FIRST studies have been excluded, as these studies reported PFS starting from the first cycle of chemotherapy, rather than from the first cycle of maintenance therapy with a PARP inhibitor. This would have resulted in an artificial elongation of PFS times compared to other RCTs.
The trials included in the analysis enrolled patients with newly diagnosed ovarian cancer, mainly FIGO stage III or IV, that underwent primary or interval cytoreductive surgery and received either neoadjuvant or adjuvant chemotherapy with platinum-based regimens. The populations included in the studies are homogeneous in terms of histology, stage and visible residual disease. FLAMES study included only asiatic patients while the proportion of this ethnicity on the other RCTs varies from 19% in the ATHENA trial or it was not disclosed in the other RCTs.
The SOLO1 RCT compared olaparib maintenance therapy in patients with a BRCA mutation. The other RCTs included a more heterogeneous population composed of patients with BRCA mutations, patients with HR deficiency, and patients without BRCA or HR alterations (wild-type, WT).
The ATHENA, PRIMA and FLAMES RCTs investigated the efficacy of maintenance therapy with the PARP inhibitors niraparib, rucaparib and senaparib, respectively. All studies compared the efficacy of a PARPi to a placebo, which was used as the common comparator in our analysis, except for the PAOLA1 and ATHENA study. All patients enrolled in PAOLA1 RCT and 20% of patients included in the ATHENA trial received also bevacizumab alongside either with PARP inhibitor or placebo during the maintenance phase.
As there were three main subgroups present in the cohorts that could be classified based on BRCA and HR status, we decided to split our analysis into three parts, considering patients with BRCA mutations (BRCA+), patients without BRCA mutation but HR deficient (BRCA-/HRD+) and patients wild-type for BRCA and HR proficient (BRCA-/HRD-). BRCA+ populations were present in all studies while results on BRCA-/HRD+ were derived from ATHENA, PAOLA1 and PRIMA RCTs. Data for BRCA-/HRD- were present only for ATHENA and PRIMA studies.

Table 1.
Summary of the main clinical characteristics of patients treated with PARP inhibitors included in the analysis. Pts: patients, HRD: homologous recombination deficient, CR: complete response, PR: partial response, CT: chemotherapy, NA: not available. Median PFS and median OS are expressed in months.
| Trial [Reference] | Treatments under Comparison |
N. of Pts |
FIGO III/IV | % CR/PR to CT |
% PDS/IDS |
% BRCA+ |
% HRD+ |
Median PFS |
HR for PFS (95%CI) |
Median OS |
HR for OS (95%CI) |
|---|---|---|---|---|---|---|---|---|---|---|---|
| SOLO1 [11,12,13] |
Olaparib vs Placebo |
260 131 |
85/15% 80/20% |
82/18% 82/18% |
62/36% 65/33% |
100% 100% |
100% 100% |
56 13.8 |
0.33 (0.25 -0.43) |
NR 75.2 |
0.55 (0.40 - 0.76) |
| PAOLA1 [14,15] |
Olaparib + Bevacizumab vs Placebo + Bevacizumab |
537 269 |
70/30% 69/31% |
20/26% 20/28% |
50/42% 51/41% |
30% 30% |
47% 49% |
22.1 16.6 |
0.59 (0.49-0.72) |
56.5 51.6 |
0.92 (0.76-1.12) |
| ATHENA [16] |
Rucaparib vs Placebo |
427 111 |
76/24% 70/30% |
17/18% 10/20% |
49/51% 49/51% |
21% 22% |
43% 44% |
20.2 9.2 |
0.47 (0.31-0.72% |
NR 46.2 |
0.83 (0.58-1.17) |
| PRIMA [17,18,19] |
Niraparib vs Placebo |
487 246 |
65/35% 64/36% |
70/30% 70/30% |
32/65% 32/67% |
32% 56% |
34% 60% |
13.8 8.2 |
0.62 (0.50 -0.76) |
46.6 48.8 |
1.01 (0.84 -1.23) |
| FLAMES [10] |
Senaparib vs Placebo |
271 133 |
69/31% 74/26% |
87/13% 89/11% |
NA |
35% 33% |
75% 66% |
NR 13.6 |
0.43 (0.32 -0.58) |
NR NR |
NA |
Although each group was homogeneous in terms of genetic profile, there were some differences due to the different proportions of complete responses achieved after chemotherapy and the addition of bevacizumab to PARP inhibitors in all patients from the PAOLA1 study and a certain proportion of patients from the ATHENA RCTs. Therefore, an analysis of heterogeneity was conducted to ascertain whether the control groups in the RCTs behaved similarly in terms of PFS. The heterogeneity test revealed no substantial heterogeneity between the PFS of controls arms in the BRCA+ cohort (likelihood ratio test = 7.03 with four degrees of freedom, p = 0.1) and in the BRCA-/HRD+ population (likelihood ratio test = 3.14 with two degrees of freedom, p = 0.2). Conversely, in the BRCA-/HRD- population, the use of bevacizumab in the control arms of the PAOLA1 RCT increased the heterogeneity of the analysis. Therefore, in this subgroup, we opted to use the pooled reconstructed IPD from the ATHENA and PRIMA RCTs as the control arms and to consider the bevacizumab arm of the PAOLA1 study as an independent treatment arm.
PFS Kaplan–Meier curves of control arms of the three groups are reported in Supplementary Figure S1.
After ensuring the comparability of the RCTs, we indirectly compared the efficacy of maintenance treatment with PARP inhibitors in BRCA+, BRCA-/HRD+, and BRCA-/HRD- subgroups. The primary endpoint was PFS.
In the BRCA+ population, maintenance therapy with PARPi significantly improved both HR and median PFS. Figure 2 shows cumulative KM curves for PFS.
Indirect comparisons of the PFS benefits of different PARPi indicated that the combination of olaparib and bevacizumab was the most effective treatment for this patient subgroup (HR=0.27, 95% CI 0.19–0.39), with median PFS not yet reached at a median follow-up of 40 months and a median restricted mean survival time (RMST) of 28.6 months (95% CI 27.19–30.00). Olaparib monotherapy was the second most effective treatment in terms of PFS benefit, followed by rucaparib, senaparib and niraparib. Compared to the other PARPi, niraparib showed significantly worse survival outcomes, compared to the best in class, with a median PFS of 30.9 months (95% CI 21.9–51.8) and a median RMST of 23.3 months (95% CI 21.53–25.06), which was 5.3 months lower than the olaparib+bevacizumab RMST (HR for PFS 0.51, 95% CI 0.33–0.79). As olaparib and niraparib are widely used in clinical practice, we have also investigated the difference between these two PARPinhibitors at longer follow-up times (RMST truncated at 75 months). Olaparib still remained the most effective PARPi with a RMST of 48.94 months (95%CI 45.26 - 52.62) that was 8.5 months longer than niraparib’s one (HR=0.65 95%CI 0.46 - 0.94).
In the BRCA-/HRD+ population, KM curves for PFS were available only from ATHENA, PAOLA1 and PRIMA studies. In this subgroup the combination of olaparib+bevacizumab was superior to both rucaparib (HR=0.58 95%CI 0.33 - 1.03) and niraparib (HR=0.56 95%CI 0.33 - 0.97) in terms of PFS benefit. Olaparib+bevacizumab presented a RMST of 23 months (95% CI 20.98 - 25.02) that was 3.7 months longer than rucaparib and 4.2 longer than niraparib. Cumulative KM curves for PFS in the BRCA-/HRD+ population are depicted in Figure 3.
The BRCA-/HRD- subgroup experienced a lower survival benefit from PARP inhibitors compared to other subgroups. In this population, the median PFS ranged from 16.74 months with olaparib+bevacizumab (95%CI: 15.13–18.78) to 8.92 months with niraparib (95% CI: 7.78–11.15). Indirect comparisons between PARP inhibitors indicated that there were no significant differences among these regimens, but niraparib tended to perform worse than the others (HR=1.57, 95% CI 1.07–2.31 compared to rucaparib). In terms of RMST, olaparib+bevacizumab and rucaparib produced similar results, with an RMST of 15 months — 4 months longer than that of niraparib. As the control arm of the PAOLA1 study (i.e., bevacizumab monotherapy) showed a significant difference in PFS compared to placebo controls in this population, we decided to include bevacizumab monotherapy in the indirect comparison. Our results indicated that the addition of olaparib to bevacizumab did not improve survival compared to bevacizumab monotherapy (HR=1.0, 95% CI 0.67–1.51). PFS results in the BRCA-/HRD- population are showed in Figure 4.
In an exploratory analysis of OS, KM curves were available for SOLO1, PAOLA1 and PRIMA RCTs. Cumulative KM curves for OS in the BRCA+, BRCA-/HRD+ and BCRA-/HRD- populations are available as Supplementary Figure S2. In the BRCA+population, the use of olaparib produced a significant OS advantage over placebo (HR=0.58 95%CI 0.45 - 0.75), but the addition of bevacizumab did not produce any additional increase in OS. On the other hand, niraparib maintenance failed to demonstrate a survival benefit compared to placebo (HR=1.04 95%CI 0.79 - 1.36). In the HRD+/BRCA- population the survival advance was not as evident as in the BRCA+ subgroup. Olaparib+bevacizumab demonstrated a slightly better result in terms of OS compared to placebo (HR=0.70 95%CI 0.48 - 1.0) and to niraparib (HR vs placebo=0.8 95%CI 0.56-1-15). In the BRCA-/HRD- population the survival benefit of PARP inhibitors (+/- bevacizumab) was not evident compared to placebo.
3.2. Adverse Drug Reactions Analysis
The analysis of any grade ADR showed that most PARPi were well tolerated with no substantial difference on the incidence of any-grade ADR compared to placebo. Incidence of any grade and severe ADR (higher than grade 3, >G3) is showed in Supplementary Figures S3 and S4, respectively.
In the meta-analysis of safety profiles, niraparib showed a worse safety profile with a RR of developing any grade ADR equal to 1.32 (95%CI 1.21-1.44) compared to placebo. When severe ADR have been considered in the analysis, olaparib+bevacizumab presented the best safety profile with a RR of >G3 ADR equal to 1.11 (95%CI 0.97-1.28) compared to placebo and significantly lower RR compared to other treatments. On the contrary, niraparib showed the worst safety profile also in terms of severe ADR with a RR of 6.39 (95%CI 4.16-9.84) compared to placebo, and a significantly higher RR for severe ADR compared to all other regimens. Results are reported in Figure 5.
Network meta-analysis revealed significant differences in specific ADR patterns. The results for the main hematological and gastrointestinal/systemic ADRs are presented in Figure 6 and Figure 7, respectively.
Hematological toxicities (particularly anemia and thrombocytopenia) were the predominant major concerns linked to the use of PARP inhibitors, particularly anemia, which is a class effect with homogeneous incidence alongside the different PARP inhibitors across all regimens. Olaparib demonstrated the most favourable profile in terms of hematological toxicity, with significantly reduced incidence of any-grade neutropenia compared to senaparib, rucaparib and niraparib (RR = 0.44 (95%CI 0.22 - 0.89), and a significantly reduced incidence of thrombocytopenia compared to niraparib and rucaparib (RR = 0.11 (95%CI 0.01; 0.97)). Overall, senaparib was associated with the highest incidence of severe anaemia (grade ≥3: 29%), thrombocytopenia (grade ≥3: 27%) and neutropenia (grade ≥3: 25%), reflecting the myelosuppressive effects of the treatment. Despite dose optimisation strategies, niraparib still demonstrated significant hematological toxicity, with grade ≥3 anemia occurring in 24% of patients, and significantly increased incidence of thrombocytopenia and neutropenia compared to olaparib (RR for severe thrombocytopenia olaparib vs niraparib = 0.01 (95%CI 0.00 - 0.15); RR for severe neutropenia olaparib vs niraparib= 0.20 (95%CI 0.05- 0.79)).
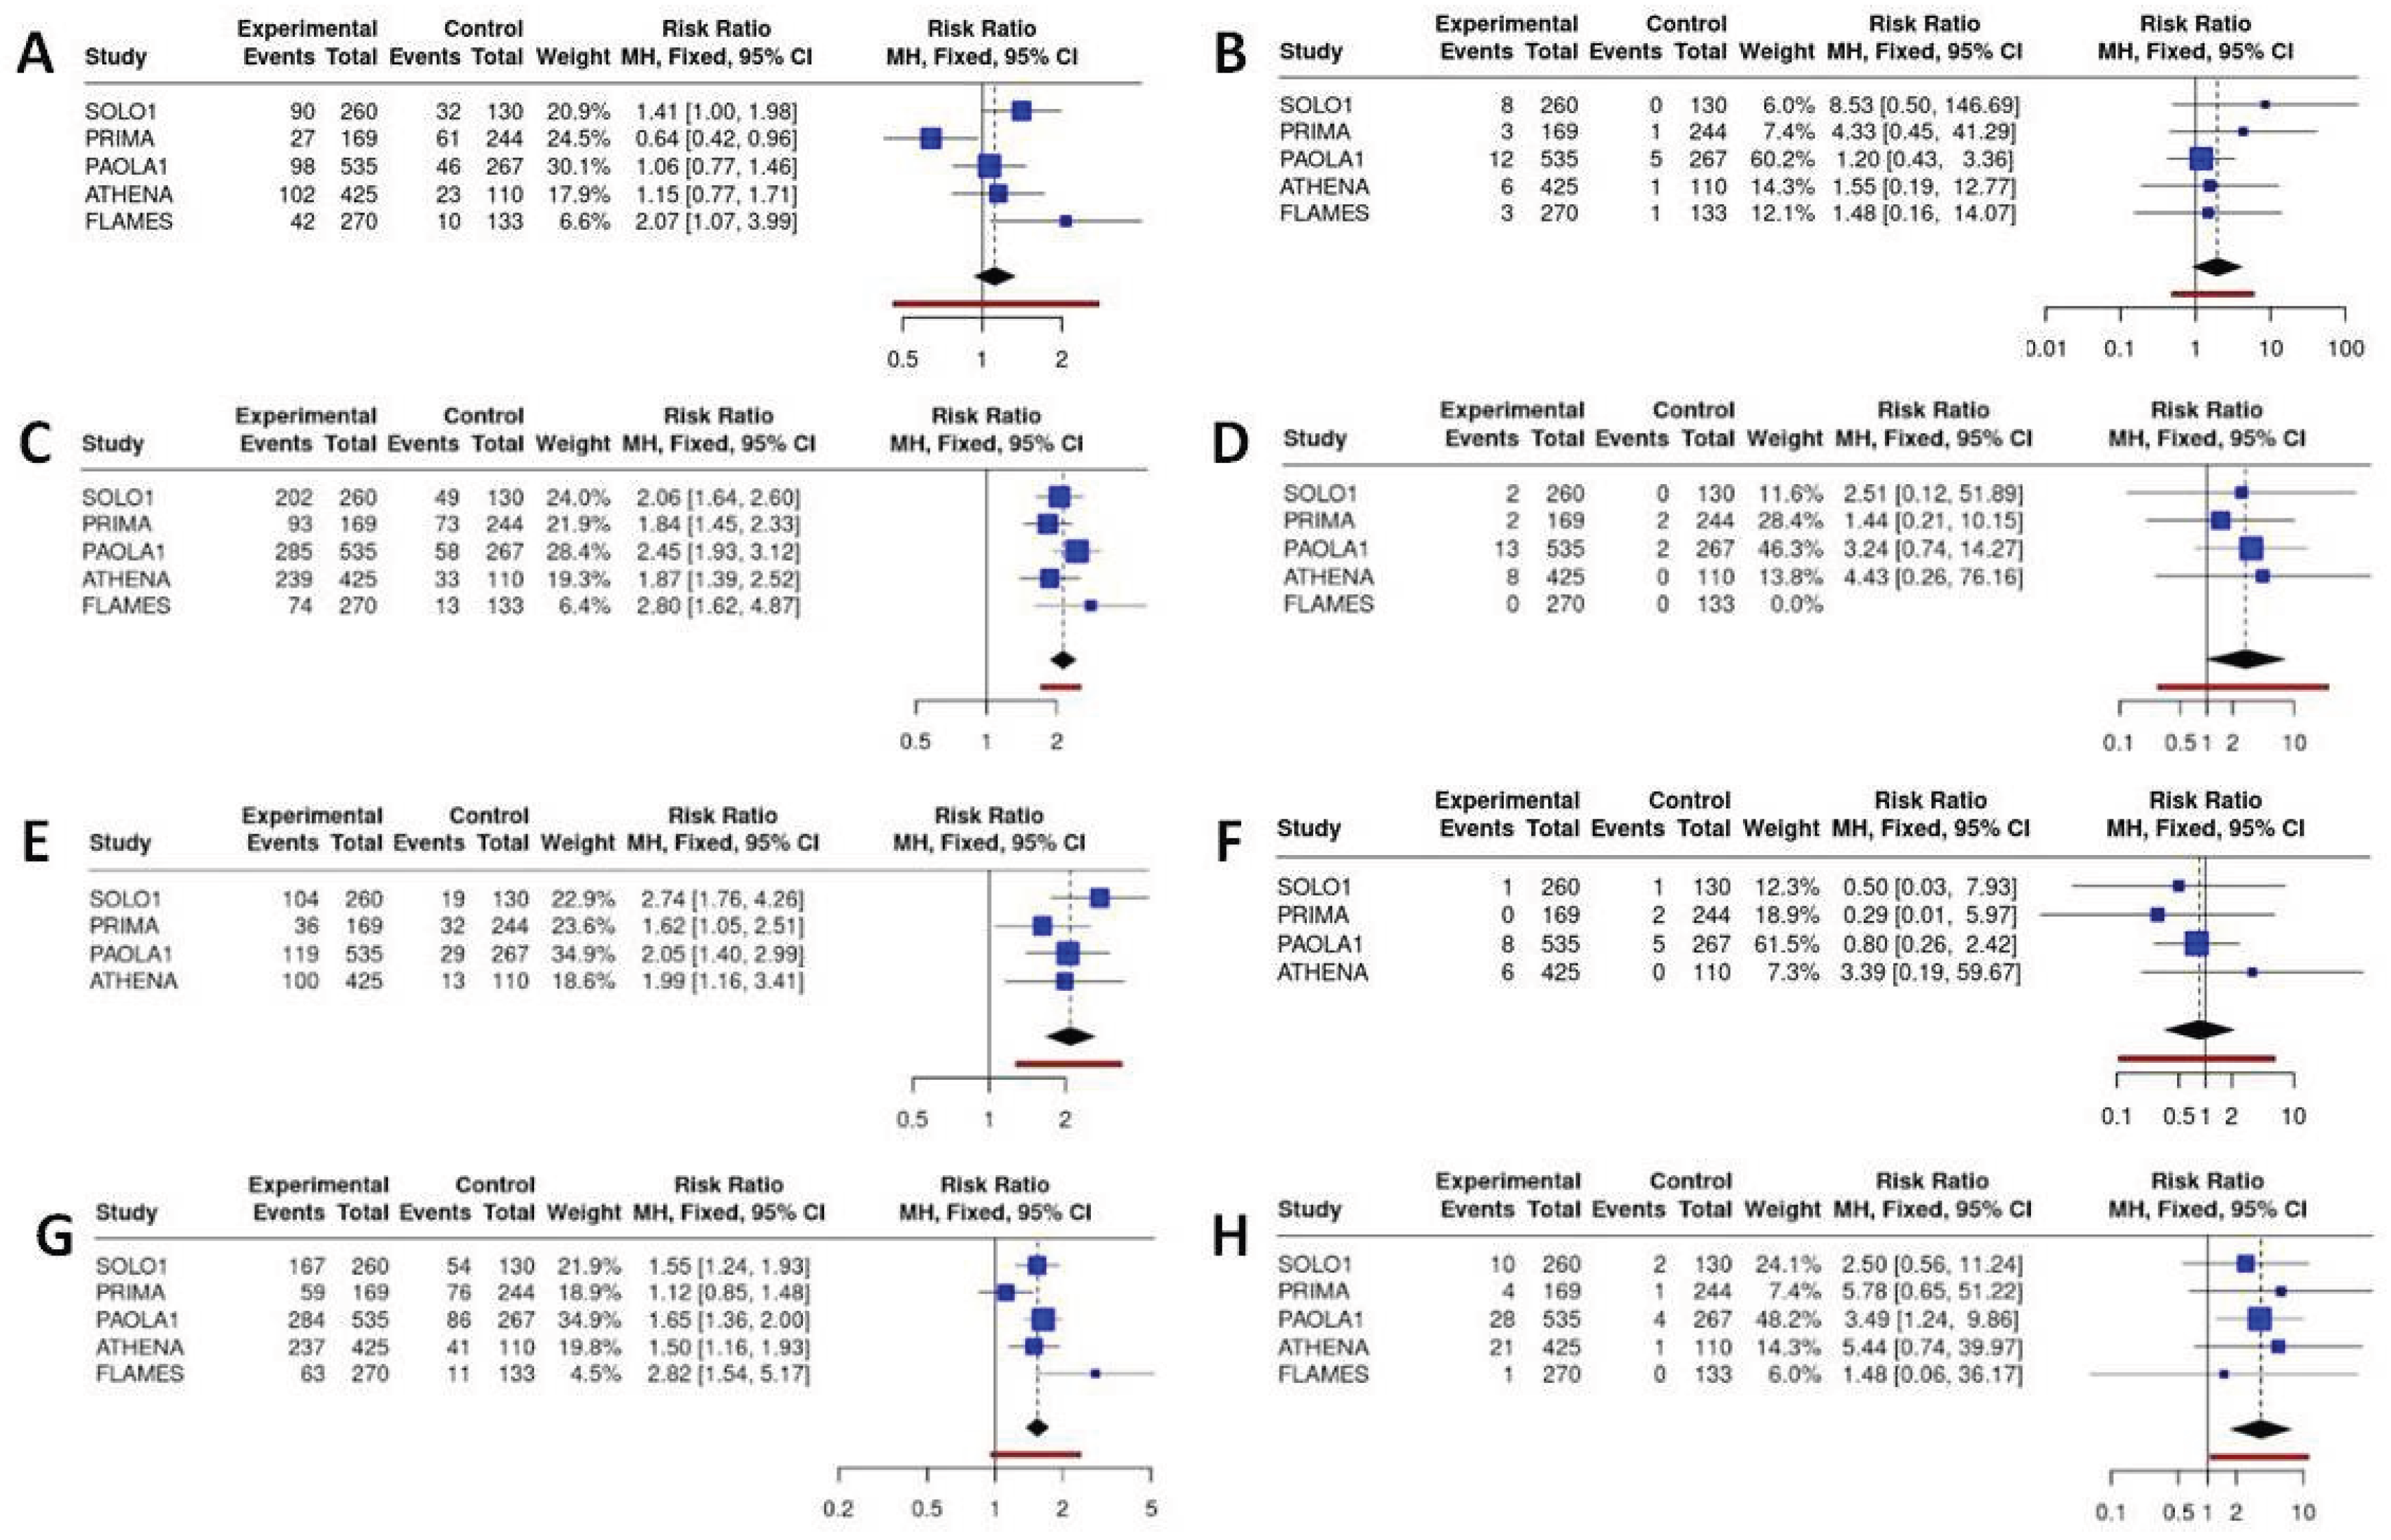
Gastrointestinal and systemic toxicities, although with a lower incidence than hematological toxicities, were still an important major category of concern. Niraparib demonstrated the best safety profile in terms of nausea (RR compared to senaparib = 0.66, 95% CI 0.36–1.20), diarrhoea (RR compared to senaparib = 0.31, 95% CI 0.14–0.67) and vomiting (RR compared to olaparib = 0.59, 95% CI 0.32–1.10), while senaparib and olaparib exhibited the poorest profiles. One of the major ADRs that has a significant impact on the quality of life of ovarian cancer patients is asthenia and fatigue. Niraparib demonstrated a lower incidence of fatigue, which was significantly lower than that observed with senaparib (RR=0.40, 95% CI 0.20–0.77) and olaparib+bevacizumab (RR=0.68, 95% CI 0.49–0.95). However, these differences were less evident when considering severe fatigue and asthenia.
4. Discussion
In this study, we conducted an indirect comparison of RCTs evaluating the efficacy and safety of PARPi, either as monotherapy or in combination with bevacizumab, across molecularly defined subgroups of ovarian cancer patients. After confirming the comparability of control arms, we were able to pool reconstructed IPD and derive clinically meaningful insights into the relative benefit of different PARPi strategies.
Consistent with prior evidence, our findings reinforce that the greatest benefit from PARPi maintenance is observed in patients with BRCA+ tumors [26]. In this subgroup, olaparib—either alone or in combination with bevacizumab—provided the most pronounced PFS benefit, with RMST analyses demonstrating durable efficacy beyond 6 years of follow-up. Notably, niraparib seems to underperform compared to other agents, both in early and long-term analyses. Nonetheless, the approach is limited by its dependence on the availability of subgroup-specific survival curves, which are not consistently reported across trials. In our case, the partial availability of KM curves also hinders the possibility of investigating PFS in patients with different risk classes. In the PRIMA study, for example, R0 patients were not enrolled; therefore, the population was entirely high risk when compared to other PARPi, which could introduce a selection bias. Nevertheless, our heterogeneity analysis, based on the PFS of the control arms in different studies, indicated that, although all patients in the PRIMA study were high risk, they behaved similarly to patients enrolled in other RCTs when observed for PFS in a placebo-receiving setting.
Multiple phase III trials are ongoing, evaluating combinations of PARPi with immune checkpoint inhibitors (ICIs), anti-angiogenic agents, or chemotherapy, with key results expected between 2025 and 2030. Early-phase studies already suggest that integrating PARPi with ICIs or anti-angiogenesis agents yields promising antitumor activity, particularly in BRCA-mutated or HRD-positive disease [27].
In the BRCA-/HRD+ subgroup, the addition of bevacizumab to olaparib also demonstrated superior PFS outcomes compared to niraparib and rucaparib, with RMST gains of up to 4 months. These results highlight a possible synergistic interaction between PARPi and anti-angiogenic therapy in HRD-positive, BRCA wild-type tumors, a biologically plausible finding given preclinical evidence of VEGF-mediated modulation of DNA repair pathways. In addition, in HRD patients, emerging evidence highlights the potential of novel maintenance strategies in ovarian cancer beyond conventional PARP inhibition. Preclinical studies demonstrate that PI3K inhibition enhances tumor sensitivity to PARP inhibitors by disrupting homologous recombination repair, underscoring the rationale for combination therapy, however recent results from the EPIK-O/ENGOT-ov61 trial, combining alpelisib+olaparib, failed to demonstrate a significant PFS advantage in BRCA- patients [28].
Conversely, in the BRCA-/HRD- subgroup, PARPi efficacy was markedly reduced. PFS improvements were modest and did not translate into significant OS advantages. Importantly, the addition of olaparib to bevacizumab did not improve outcomes compared to bevacizumab alone, raising concerns about overtreatment in this molecularly defined population. The ongoing MITO 25 trial (NCT03462212) might provide additional direct evidence to this observation. This study compares the efficacy of carboplatin-paclitaxel and rucaparib maintenance versus carboplatin-paclitaxel-bevacizumab and bevacizumab plus rucaparib maintenance also in HR proficient patients. Nevertheless, this population is actually orphaned by effective treatment strategies and is therefore the one in which biomarker-driven approaches are gaining traction. Lipid metabolism is emerging as a therapeutic target, with inhibitors of fatty acid synthase, cholesterol synthesis, and fatty acid oxidation showing potential to overcome resistance. Additionally, novel immunotherapy combinations—such as ICIs with bevacizumab, chemotherapy, PARPi, or antibody–drug conjugates like mirvetuximab soravtansine—have shown encouraging response rates in recurrent disease and may be beneficial also moved upfront in the patient’s therapeutic program. Finally, precision oncology is expanding with agents targeting specific genomic alterations, including larotrectinib (NTRK fusions) and selpercatinib (RET fusions), emphasizing the importance of biomarker testing in guiding individualized treatment [29].
While current clinical research predominantly aims to extend PFS, future studies should place stronger emphasis on OS and patient quality of life. Our exploratory OS analyses confirmed the long-term survival benefit of olaparib in BRCA+ patients, while the addition of bevacizumab did not confer further OS advantage despite its PFS benefit. In HRD+ patients without BRCA mutations, a modest OS improvement was observed with olaparib+bevacizumab, but this did not reach clear statistical significance. In the HRD- subgroup, no OS advantage was apparent for any PARPi regimen, underscoring the need for biomarker-driven treatment selection.
Our comparative safety analysis revealed important differences among PARPi regimens. Niraparib was consistently associated with the highest rates of both all-grade and severe ADR, particularly hematological toxicities such as thrombocytopenia and neutropenia, despite dose optimization strategies. Senaparib also demonstrated substantial myelosuppressive activity, whereas olaparib displayed the most favorable hematological safety profile. When combined with bevacizumab, olaparib maintained a relatively low risk of severe ADRs, highlighting its favorable risk–benefit balance in appropriate patient subgroups. Non-hematological toxicities were generally less frequent, but gastrointestinal events and fatigue remained clinically relevant. Interestingly, niraparib was associated with fewer gastrointestinal toxicities and a lower incidence of fatigue compared to other PARPi, which could partially mitigate its less favorable hematological profile in patient-centered decision-making.
The IPDfromKM methodology, which reconstructs IPD from published KM survival curves, is increasingly applied in oncology to facilitate indirect survival comparisons. In this study, it allowed us to pool patients derived from control arms of RCTs, thereby increasing the size and robustness of the common comparator arm. An important advantage of this technique is the preservation of event timing, a feature usually lost in conventional meta-analyses that rely on binary endpoints, and the possibility to generate overlaid KM plots that improve visualization and interpretability of outcomes. Despite efforts to harmonize control arms and reconstruct IPD, residual heterogeneity across trials cannot be excluded, particularly regarding patient selection criteria, prior chemotherapy response, and follow-up duration. Moreover, mature OS data are lacking for several agents, and ongoing follow-up will be needed to validate long-term survival effects. Finally, real-world data are essential to complement RCT evidence, especially given differences in toxicity management outside clinical trial settings.
Nowadays, the median OS in ovarian cancer CRTs is higher close to 50 months [30], and that the vast majority of patients experience disease relapse within 3 years of diagnosis [3]. Thus, a clever long-term strategy is fundamental to take advantage of the beneficial effect of each drug. Our data strongly support the essential role of pretreatment assessment of mutational status, in order to offer the more comprehensive and personalized approach to each patient [31].
Women diagnosed with BRCA+/HRD- disease experience the higher sensitivity to platinum-based chemotherapy and to PARPi and the longer median OS [32]. This subset of ovarian cancer patients should be considered for a PARP inhibitor as first line maintenance strategy, according to patients’ characteristics (i.e comorbidities and concomitant medications) and drug safety profile. The best setting for the use of bevacizumab will probably be the second line.
On the other hand, the majority of HRD+ patients without clinical contraindication should receive olaparib + bevacizumab, due to the favorable safety profile and strong efficacy data of the combination in this population.
The real unmet clinical need remains the HRD- patients, which experience the lower drug sensitivity and the worst prognosis. According to a recent Consensus, patients with high-risk disease should receive bevacizumab upfront, regardless of BRCA/HRD status [31]. Matching this statement and our data, the preferable strategy in HRD- patients should be the use of bevacizumab in first-line and a PARPi (i.e., rucaparib or niraparib, which are indicated in the all-comers population) eventually as second-line maintenance.
5. Conclusions
In conclusion, despite the methodological limitations of indirect comparisons, this comparative analysis confirms that the magnitude of benefit from PARP inhibition is strongly dependent on BRCA and HRD status. Olaparib-based regimens provide the greatest efficacy with a favorable safety profile in BRCA+ and HRD+ populations, whereas the clinical utility of PARPi in HRD-negative patients remains questionable. Future work should focus on optimizing patient selection, identifying predictive biomarkers beyond BRCA/HRD status, and integrating PARPi with emerging therapeutic strategies.
Supplementary Materials
The following supporting information can be downloaded at the website of this paper posted on Preprints.org. Figure S1: Visual representation of indirect treatment comparisons of PFS in BRCA+, BRCA-/HRD+ and BRCA-/HRD- cohorts of the included trials.; Figure S2: OS of PARP inhibitors after reconstruction of individual patient data (IPD) from three trials available: SOLO1, PAOLA1 and PRIMA RCTs in BRCA+, BRCA-/HRD+ and BRCA-/HRD- cohorts. Figure S3: Graphical representation of incidence of any grade ADR in SOLO1, PRIMA, PAOLA1, ATHENA and FLAMES studies. Figure S4: Graphical representation of incidence of severe ADR ≥G3 in SOLO1, PRIMA, PAOLA1, ATHENA and FLAMES studies.
Author Contributions
Conceptualization, Lorenzo Gasperoni; Data curation, Luca Cancanelli, Luna Del Bono, Andrea Ossato and Vera Damuzzo; Formal analysis, Luca Cancanelli, Andrea Ossato, Luna Del Bono, and Vera Damuzzo; Investigation, Lorenzo Gasperoni, Vera Damuzzo, Caterina Fontanella; Methodology, Luca Cancanelli, Lorenzo Gasperoni, Andrea Messori and Vera Damuzzo; Software, Luca Cancanelli, Luna Del Bono, Andrea Ossato and Vera Damuzzo; Writing – original draft, Caterina Fontanella, Lorenzo Gasperoni, Luna Del Bono and Vera Damuzzo; Writing – review & editing, Caterina Fontanella, Lorenzo Gasperoni and Andrea Messori. All authors have read and agreed to the published version of the manuscript.
Funding
This research received no external funding.
Institutional Review Board Statement
Not applicable.
Informed Consent Statement
Not applicable.
Data Availability Statement
The data presented in this study are available in the article and in the Supplementary Material.
Acknowledgments
Italian Society for Clinical Pharmacy and Therapeutics (SIFaCT), Turin, Italy.
Conflicts of Interest
The authors declare no conflicts of interest.
References
- Ferlay J, Ervik M, Lam F, Laversanne M, Colombet M, Méry L, Piñeros M, Znaor A, Soerjomataram I, Bray F. Global Cancer Observatory: Cancer Today. Lyon, France: International Agency for Research on Cancer; 2024. Available from: https://gco.iarc.who.int/today (accessed on 25 August 2025).
- Siegel RL, Kratzer TB, Giaquinto AN, Sung H, Jemal A. Cancer statistics, 2025. CA Cancer J Clin. 2025;75(1):10–45. [CrossRef]
- Ledermann JA, Raja FA, Fotopoulou C, Gonzalez-Martin A, Colombo N, Sessa C; ESMO Guidelines Working Group. Newly diagnosed and relapsed epithelial ovarian carcinoma: ESMO Clinical Practice Guidelines for diagnosis, treatment and follow-up. Ann Oncol. 2013;24(Suppl 6):vi24–32. Erratum in: Ann Oncol. 2018;29(Suppl 4):iv259. doi:10.1093/annonc/mdy157. [CrossRef]
- Berek JS, Renz M, Kehoe S, Kumar L, Friedlander M. Cancer of the ovary, fallopian tube, and peritoneum: 2021 update. Int J Gynaecol Obstet. 2021;155(Suppl 1):61–85. [CrossRef]
- You B, Van Wagensveld L, Tod M, Sonke GS, Horlings HM, Kruitwagen RFPM, Du Bois A, Selle F, Perren T, Pfisterer J, et al. Low probability of disease cure in advanced ovarian carcinomas before the PARP inhibitor era. Br J Cancer. 2022;127(1):79–83. [CrossRef]
- Burger RA, Brady MF, Bookman MA, Fleming GF, Monk BJ, Huang H, Mannel RS, Homesley HD, Fowler J, Greer BE, et al. Incorporation of bevacizumab in the primary treatment of ovarian cancer. N Engl J Med. 2011;365(26):2473–83. [CrossRef]
- Perren TJ, Swart AM, Pfisterer J, Ledermann JA, Pujade-Lauraine E, Kristensen G, Carey MS, Beale P, Cervantes A, Kurzeder C, et al. A phase 3 trial of bevacizumab in ovarian cancer. N Engl J Med. 2011;365(26):2484–96. [CrossRef]
- Tewari KS, Burger RA, Enserro D, Norquist BM, Swisher EM, Brady MF, Bookman MA, Fleming GF, Huang H, Homesley HD, et al. Final Overall Survival of a Randomized Trial of Bevacizumab for Primary Treatment of Ovarian Cancer. J Clin Oncol. 2019;37(26):2317–28. [CrossRef]
- Oza AM, Cook AD, Pfisterer J, Embleton A, Ledermann JA, Pujade-Lauraine E, Kristensen G, Carey MS, Beale P, Cervantes A, et al. Standard chemotherapy with or without bevacizumab for women with newly diagnosed ovarian cancer (ICON7): overall survival results of a phase 3 randomised trial. Lancet Oncol. 2015;16(8):928–36. [CrossRef]
- Wu X, Liu J, Wang J, et al. Senaparib as first-line maintenance therapy in advanced ovarian cancer: a randomized phase 3 trial. Nat Med. 2024;30(6):1612–21. [CrossRef]
- Moore K, Colombo N, Scambia G, Kim BG, Oaknin A, Friedlander M, Lisyanskaya A, Floquet A, Leary A, Sonke GS, et al. Maintenance Olaparib in Patients with Newly Diagnosed Advanced Ovarian Cancer. N Engl J Med. 2018;379(26):2495–505. [CrossRef]
- Banerjee S, Moore KN, Colombo N, Scambia G, Kim BG, Oaknin A, Friedlander M, Lisyanskaya A, Floquet A, Leary A, et al. Maintenance olaparib for patients with newly diagnosed advanced ovarian cancer and a BRCA mutation (SOLO1/GOG 3004): 5-year follow-up of a randomised, double-blind, placebo-controlled, phase 3 trial. Lancet Oncol. 2021;22(12):1721–31. Epub 2021 Oct 26. Erratum in: Lancet Oncol. 2021;22(12):e539. doi:10.1016/S1470-2045(21)00672-0. [CrossRef]
- DiSilvestro P, Banerjee S, Colombo N, Scambia G, Kim BG, Oaknin A, Friedlander M, Lisyanskaya A, Floquet A, Leary A, et al. Overall Survival With Maintenance Olaparib at a 7-Year Follow-Up in Patients With Newly Diagnosed Advanced Ovarian Cancer and a BRCA Mutation: The SOLO1/GOG 3004 Trial. J Clin Oncol. 2023;41(3):609–17. [CrossRef]
- Ray-Coquard I, Pautier P, Pignata S, Pérol D, González-Martín A, Berger R, Fujiwara K, Vergote I, Colombo N, Mäenpää J, et al. Olaparib plus Bevacizumab as First-Line Maintenance in Ovarian Cancer. N Engl J Med. 2019;381(25):2416–28. [CrossRef]
- Ray-Coquard I, Leary A, Pignata S, et al. Olaparib plus bevacizumab first-line maintenance in ovarian cancer: final overall survival results from the PAOLA-1/ENGOT-ov25 trial. Ann Oncol. 2023;34(8):681–92. [CrossRef]
- Monk BJ, Parkinson C, Lim MC, et al. A Randomized, Phase III Trial to Evaluate Rucaparib Monotherapy as Maintenance Treatment in Patients With Newly Diagnosed Ovarian Cancer (ATHENA-MONO/GOG-3020/ENGOT-ov45). J Clin Oncol. 2022;40(34):3952–64. [CrossRef]
- Monk BJ, Barretina-Ginesta MP, Pothuri B, et al. Niraparib first-line maintenance therapy in patients with newly diagnosed advanced ovarian cancer: final overall survival results from the PRIMA/ENGOT-OV26/GOG-3012 trial. Ann Oncol. 2024;35(11):981–92. [CrossRef]
- González-Martín A, Pothuri B, Vergote I, DePont Christensen R, Graybill W, Mirza MR, McCormick C, Lorusso D, Hoskins P, Freyer G, et al. Niraparib in Patients with Newly Diagnosed Advanced Ovarian Cancer. N Engl J Med. 2019;381(25):2391–402. [CrossRef]
- González-Martín A, Pothuri B, Vergote I, Graybill W, Lorusso D, McCormick CC, Freyer G, Backes F, Heitz F, Redondo A, et al. Progression-free survival and safety at 3.5 years of follow-up: results from the randomised phase 3 PRIMA/ENGOT-OV26/GOG-3012 trial of niraparib maintenance treatment in patients with newly diagnosed ovarian cancer. Eur J Cancer. 2023;189:112908. [CrossRef]
- Liu N, Zhou Y, Lee JJ. IPDfromKM: reconstruct individual patient data from published Kaplan-Meier survival curves. BMC Med Res Methodol. 2021;21:111. [CrossRef]
- Page MJ, McKenzie JE, Bossuyt PM, et al. The PRISMA 2020 statement: an updated guideline for reporting systematic reviews. BMJ. 2021;372:n71. Published 2021 Mar 29. [CrossRef]
- Coleman RL, Fleming GF, Brady MF, et al. Veliparib with First-Line Chemotherapy and as Maintenance Therapy in Ovarian Cancer. N Engl J Med. 2019;381(25):2403–15. [CrossRef]
- Hardy-Bessard AC, Pujade-Lauraine E, Moore RG, et al. Dostarlimab and niraparib in primary advanced ovarian cancer. Ann Oncol. 2025; [published online 30 May 2025]. [CrossRef]
- Owen RK, Bradbury N, Xin Y, Cooper N, Sutton A. MetaInsight: An interactive web-based tool for analyzing, interrogating, and visualizing network meta-analyses using R-shiny and netmeta. Res Synth Methods. 2019;10(4):569–81. [CrossRef]
- Beheshti A, Chavanon ML, Christiansen H. Emotion dysregulation in adults with attention deficit hyperactivity disorder: a meta-analysis. BMC Psychiatry. 2020;20:1–11. Available from: https://www.meta-mar.com.
- Alrosan K, Alrosan AZ, Heilat GB, et al. Treatment of ovarian cancer: From the past to the new era (Review). Oncol Lett. 2025;30(2):384. Published 3 June 2025. [CrossRef]
- Wang G, Yang H, Wang Y, Qin J. Ovarian cancer targeted therapy: current landscape and future challenges. Front Oncol. 2025;15:1535235. Published 6 May 2025. [CrossRef]
- Konstantinopoulos PA, Kim JW, Freyer G, et al. Primary Analysis of EPIK-O/ENGOT-ov61: Alpelisib Plus Olaparib Versus Chemotherapy in Platinum-Resistant or Platinum-Refractory High-Grade Serous Ovarian Cancer Without BRCA Mutation. J Clin Oncol. 2025; [published online 23 July 2025]. [CrossRef]
- Stiegeler N, Garsed DW, Au-Yeung G, Bowtell DDL, Heinzelmann-Schwarz V, Zwimpfer TA. Homologous recombination proficient subtypes of high-grade serous ovarian cancer: treatment options for a poor prognosis group. Front Oncol. 2024;14:1387281. Published 4 June 2024. [CrossRef]
- Wu J, Sun H, Yang L, Deng Y, Yan Y, Wang S, Yang G, Ma H. Improved survival in ovarian cancer, with widening survival gaps of races and socioeconomic status: a period analysis, 1983-2012. J Cancer. 2018;8;9(19):3548-3556. [CrossRef]
- Perez-Fidalgo A, Schmalfeldt B, George A, Gourley C, Pignata S, Lorusso D, Barretina-Ginesta MP, Romero I, Grimm C, Van Gorp T, Rossing M, Collins DC, Fernebro J, Bjørge L, Leary A, Rouge TM, Harter P, Kurzeder C, Savva-Bordalo J, You B. Consensus on drivers of maintenance treatment choice and patterns of care in advanced ovarian cancer. Int J Gynecol Cancer. 2025;35(7):101863. [CrossRef]
- Tomao F, Bardhi E, Di Pinto A, Sassu CM, Biagioli E, Petrella MC, Palaia I, Muzii L, Colombo N, Panici PB. Parp inhibitors as maintenance treatment in platinum sensitive recurrent ovarian cancer: An updated meta-analysis of randomized clinical trials according to BRCA mutational status. Cancer Treat Rev. 2019;80:101909. [CrossRef]
Figure 1.
PRISMA flowchart of the process of trial selection.
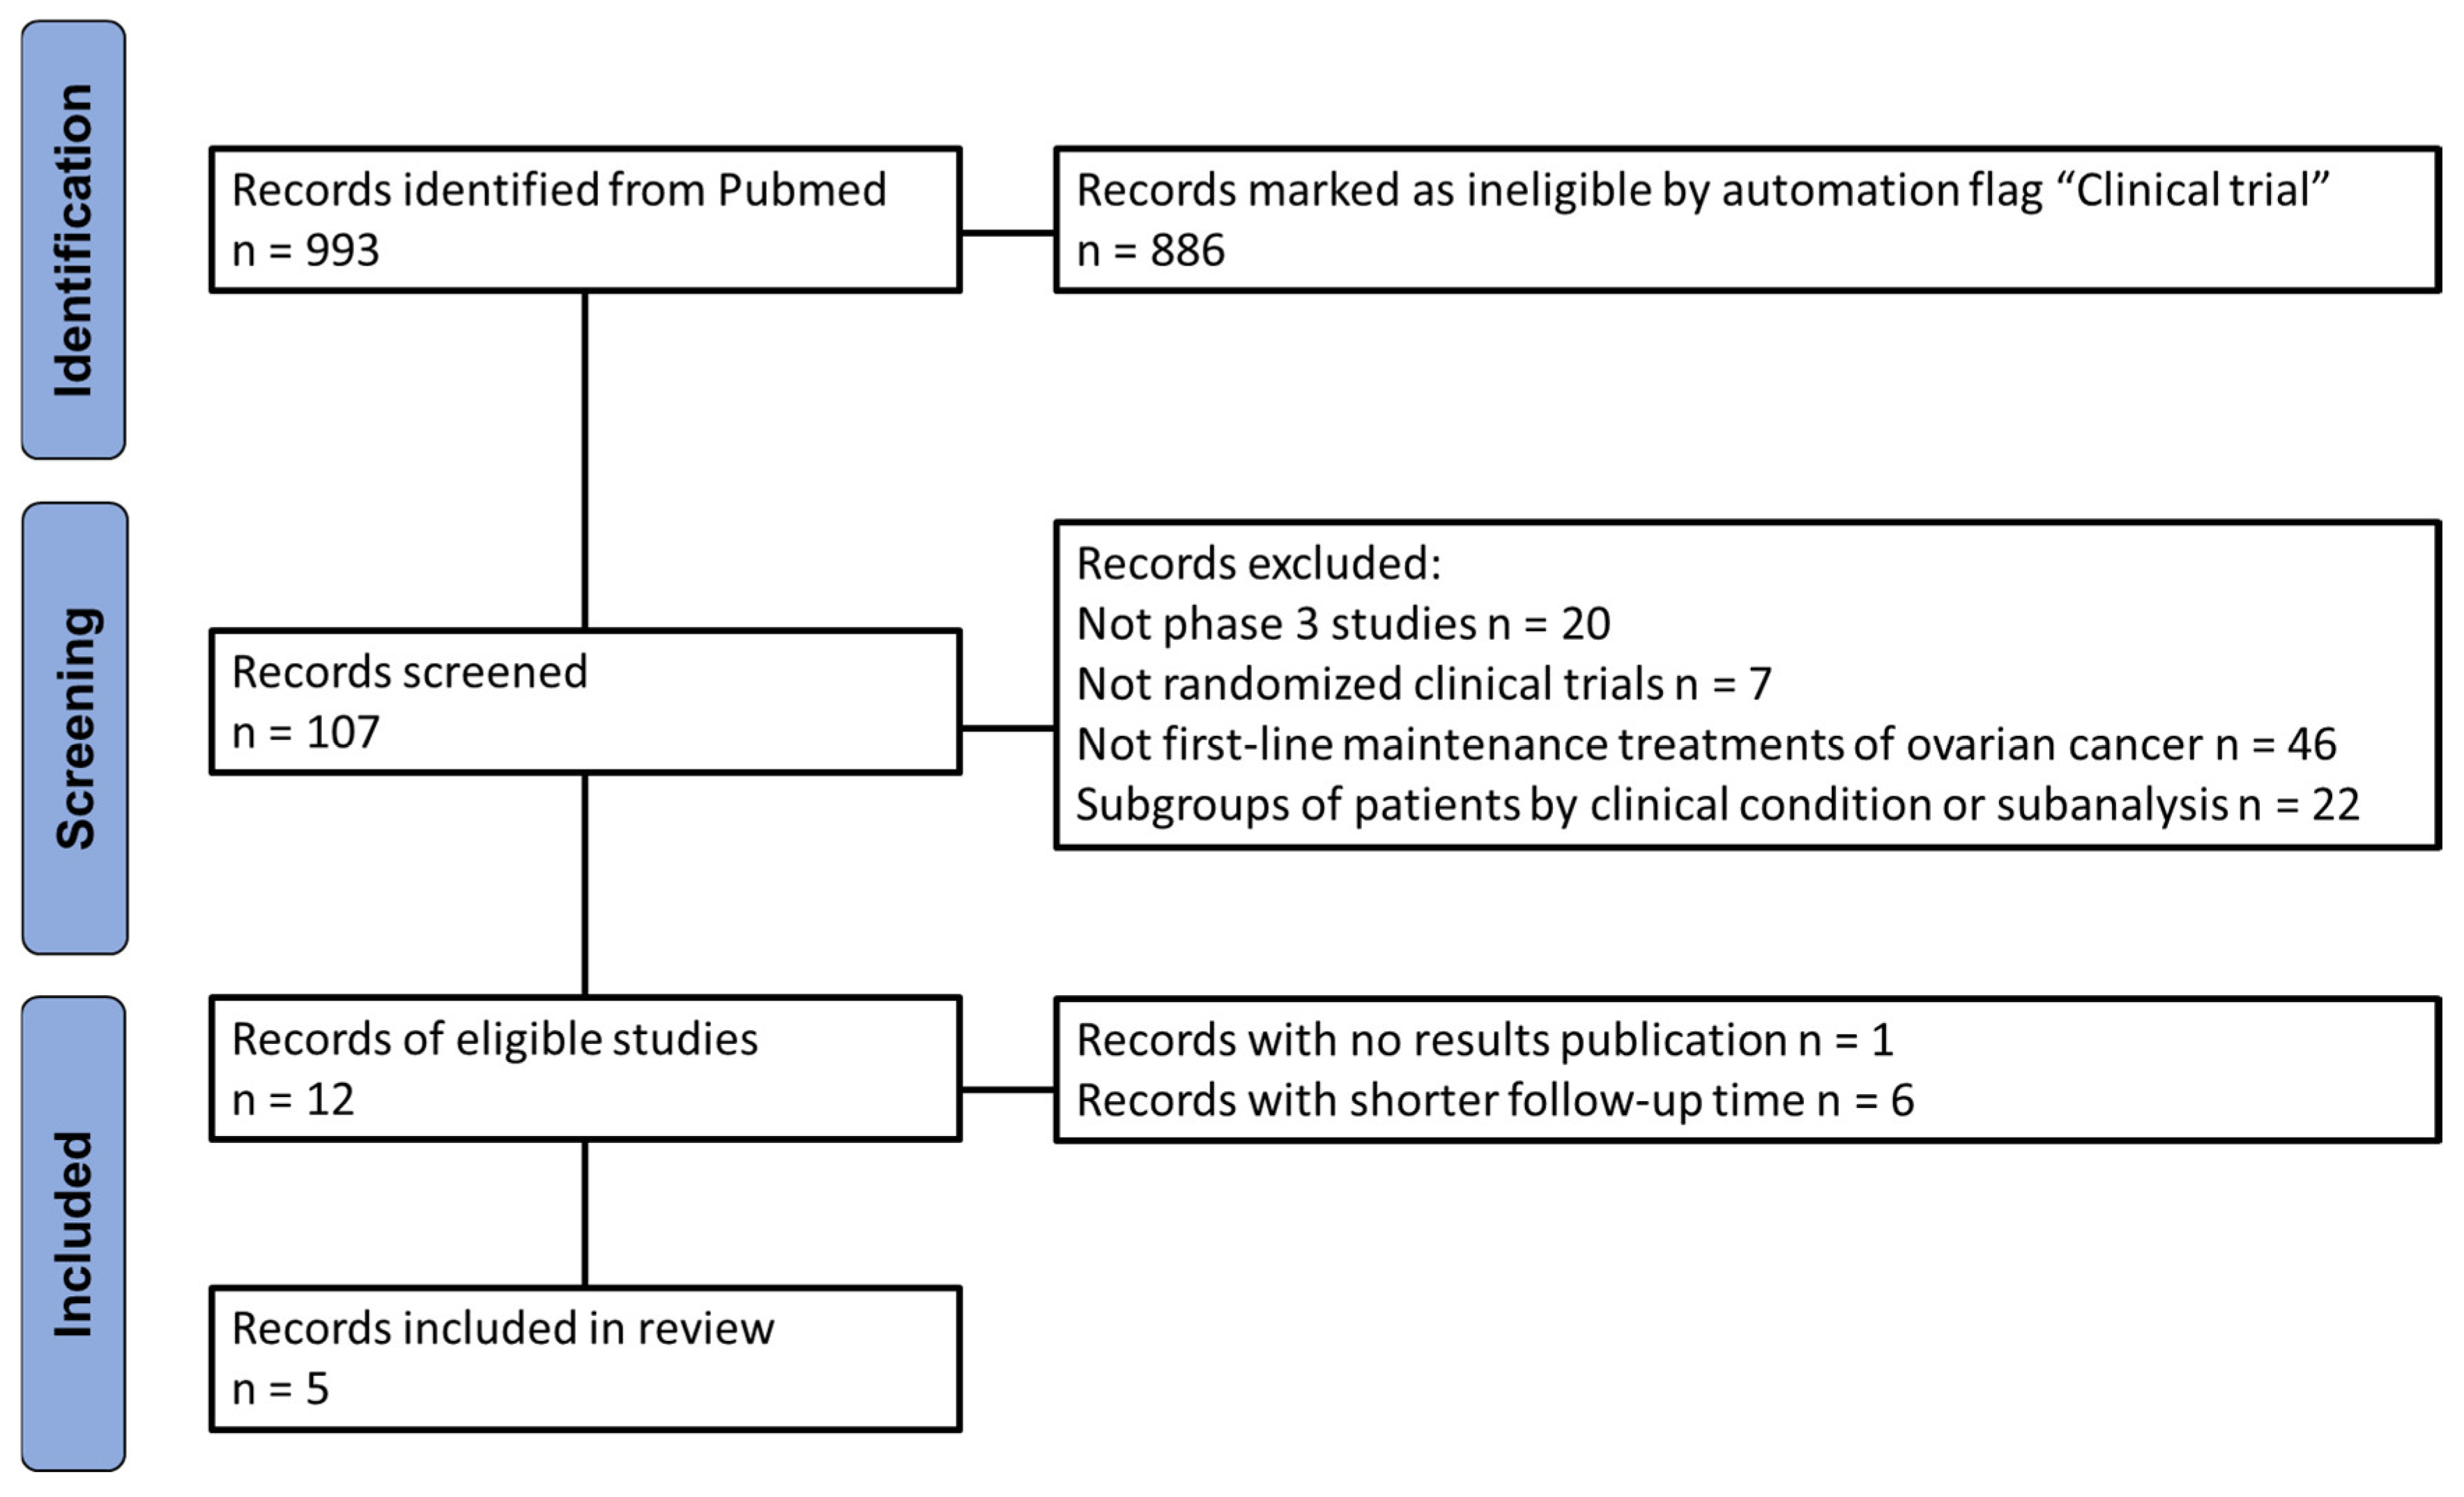
Figure 2.
PFS of PARP inhibitors in BRCA+ population. After reconstruction of individual patient data (IPD) from five trials, the following PFS KM curves were generated: olaparib+bevacizumab (n = 157; in gold); rucaparib (n = 91; in green); senaparib (n = 94; in turquoise); niraparib (n = 152; in light blue) and olaparib (n = 260; in pink). Control arm (n=350; in red) has been generated pooling IPD from the control arms of the five trials. Abbreviations: n, number of patients.
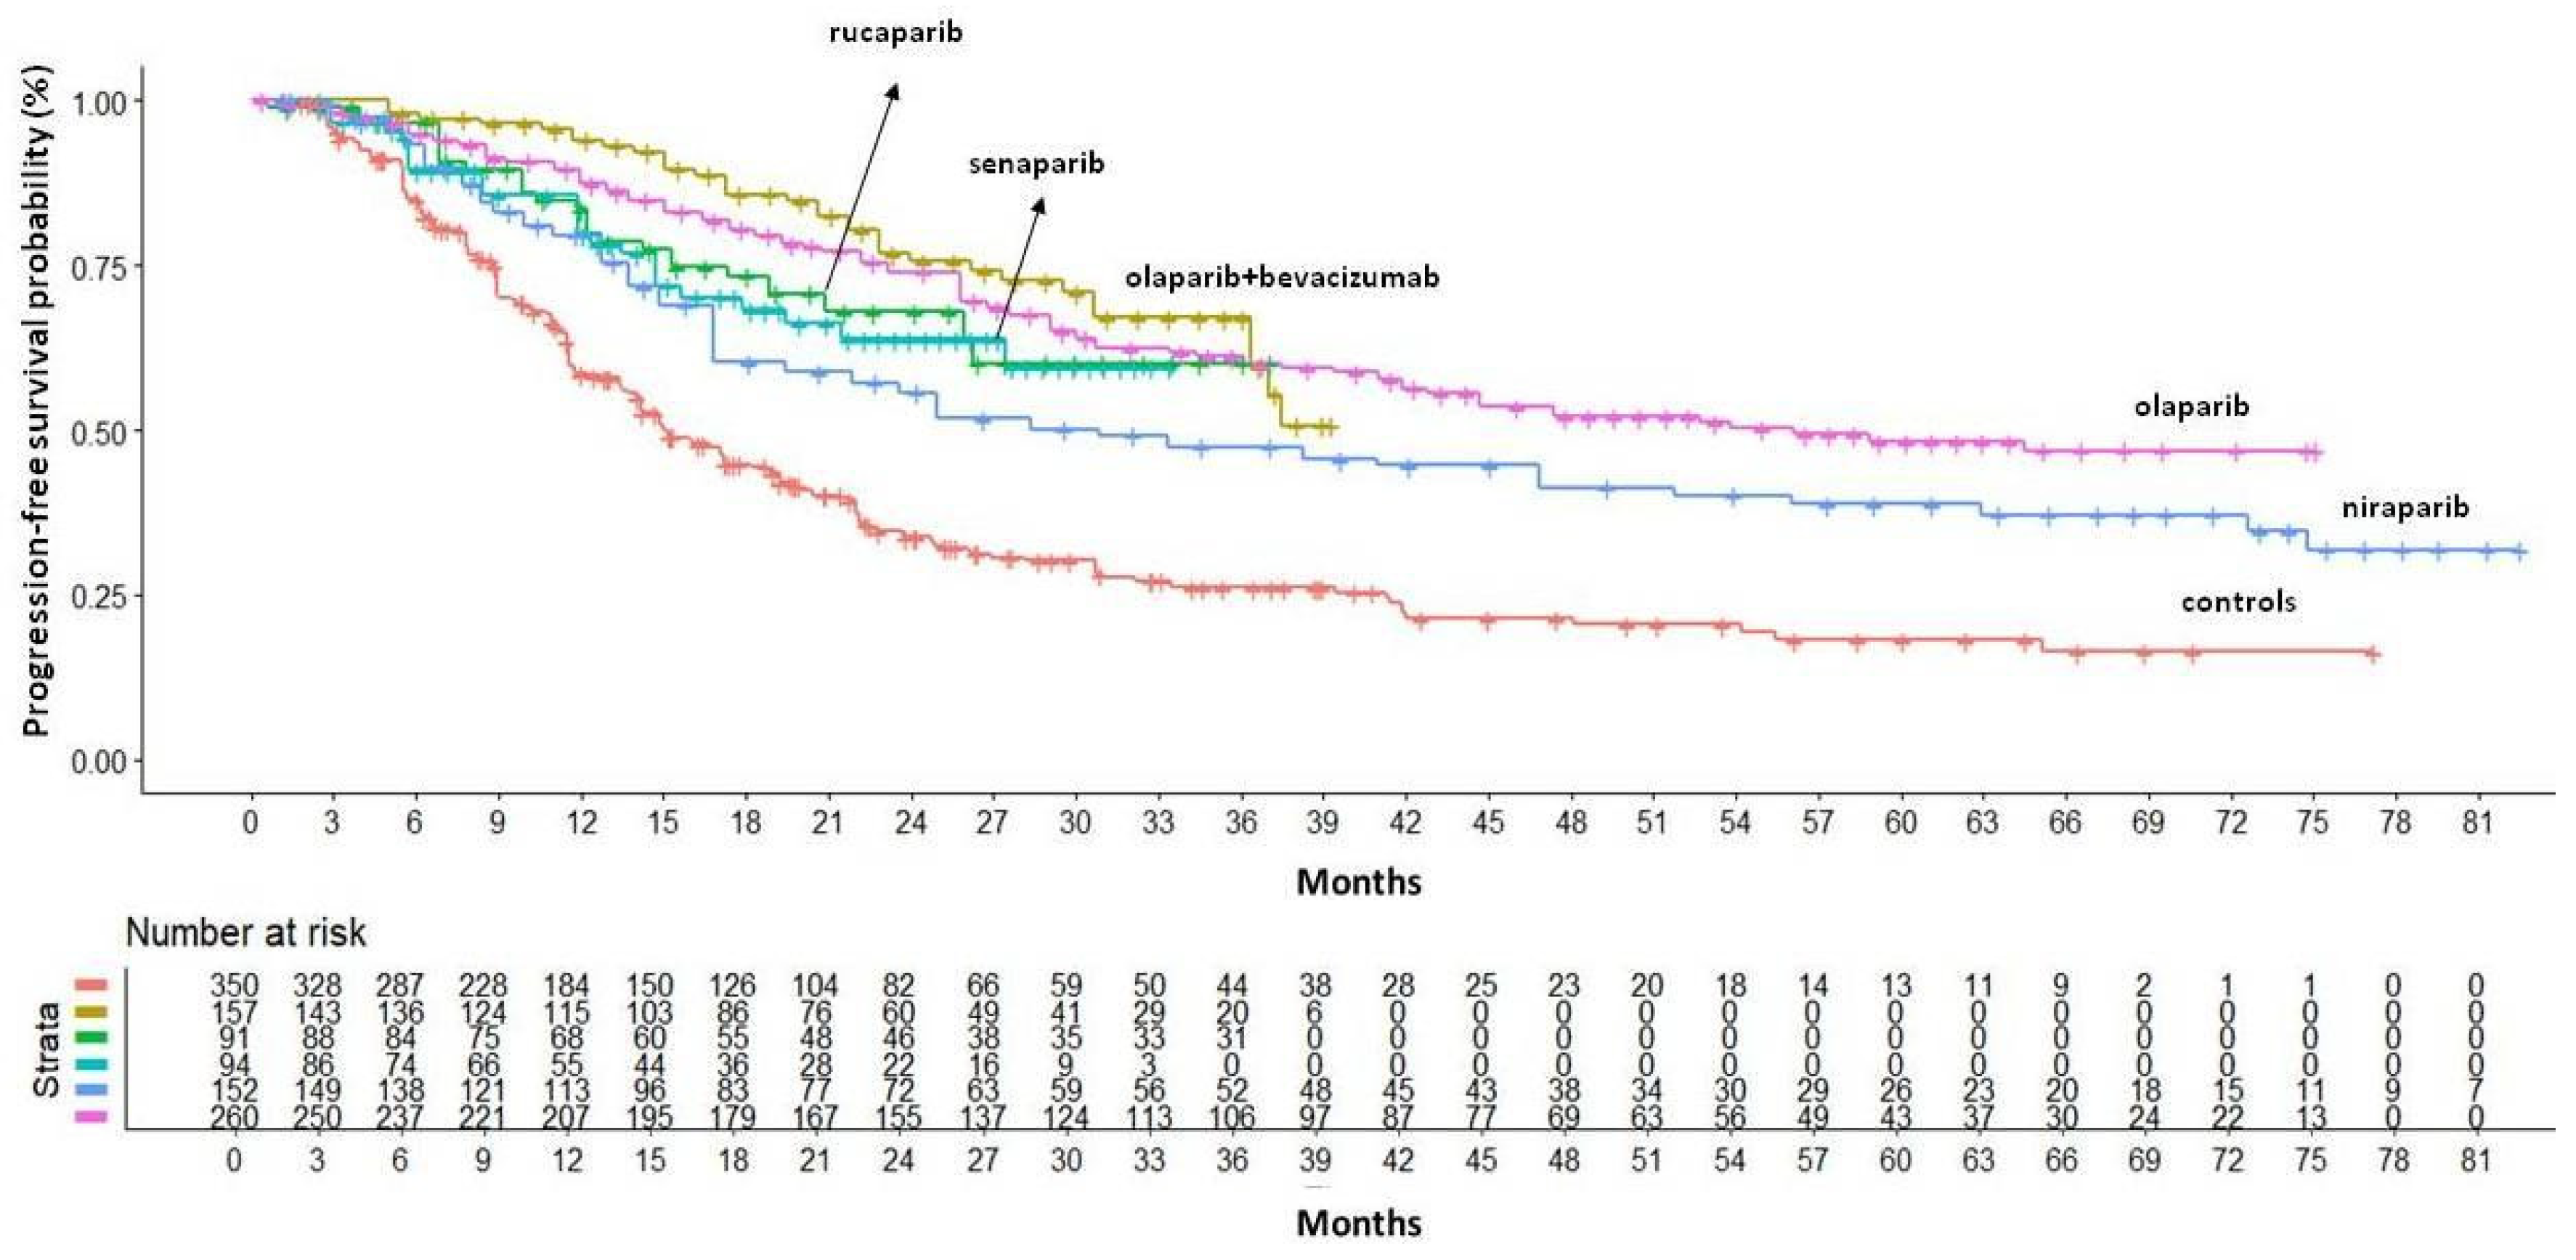
Figure 3.
PFS of PARP inhibitors in BRCA-/HRD+ population. After reconstruction of individual patient data (IPD) from three trials, the following PFS KM curves were generated: rucaparib (n = 94; in green); olaparib+bevacizumab (n = 97; in turquoise); niraparib (n = 94; in violet). Control arm (n=135; in red) has been generated pooling IPD from the control arms of the three trials. Abbreviations: n, number of patients.
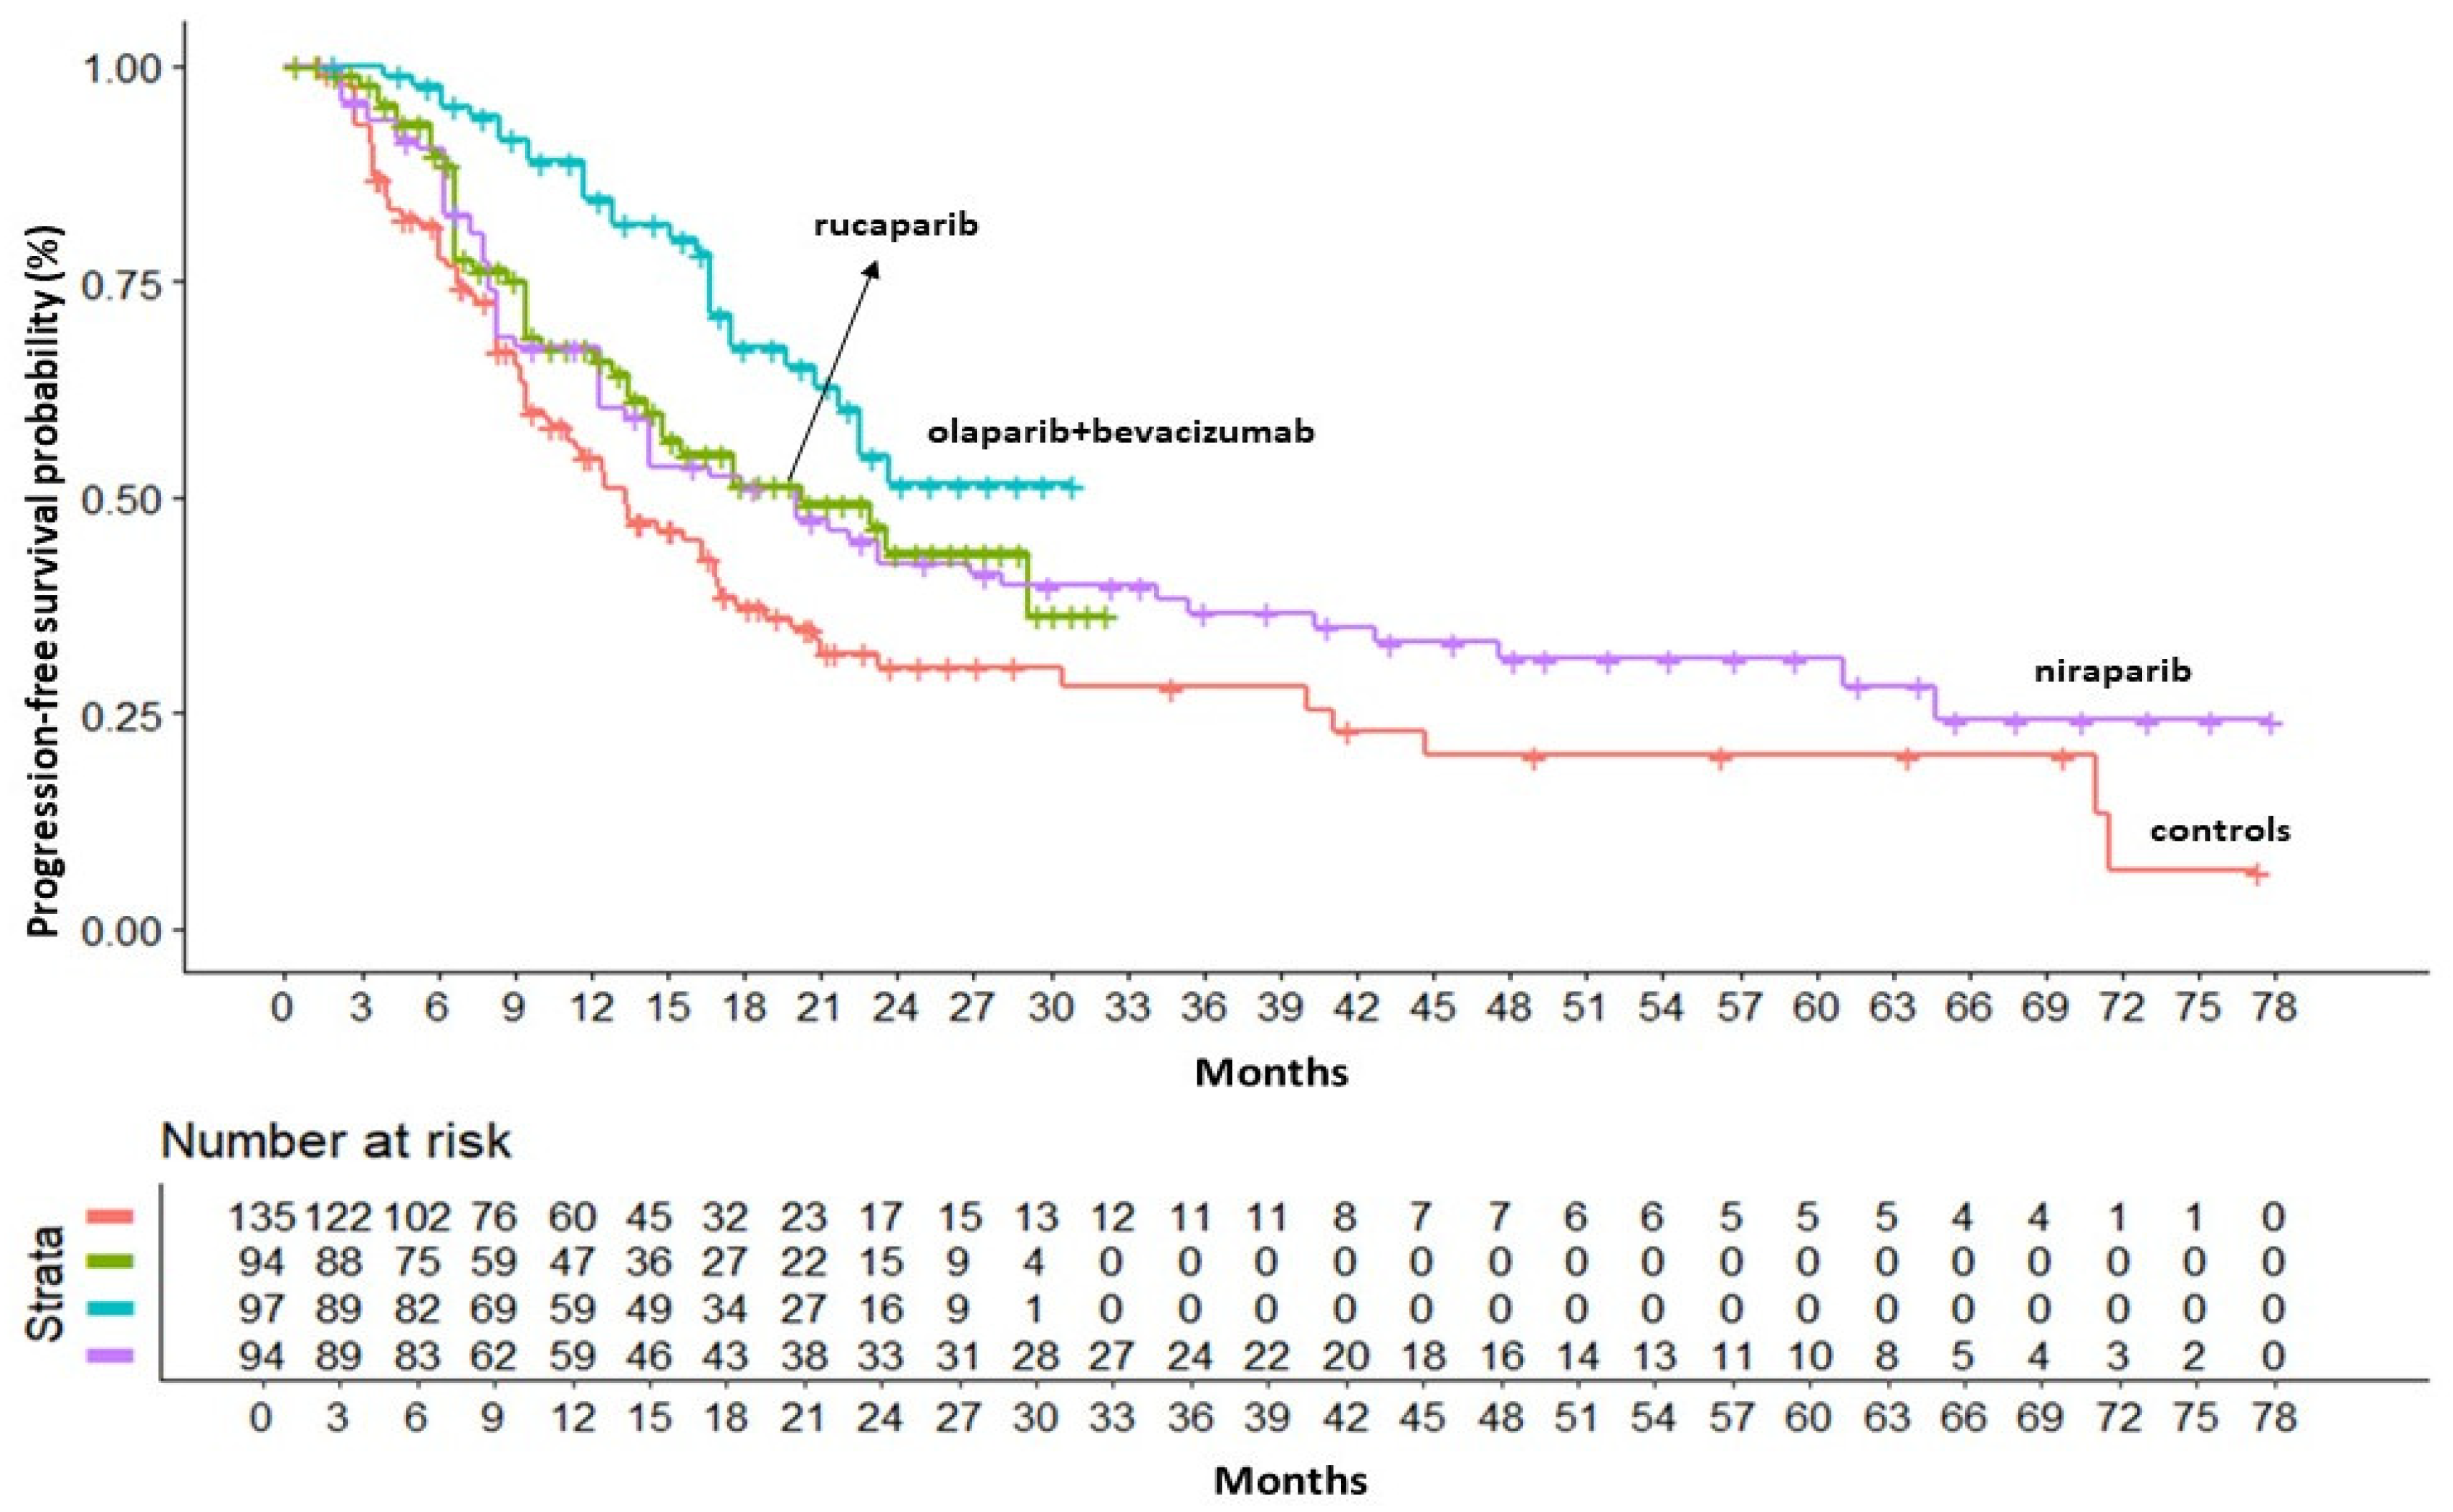
Figure 4.
PFS of PARP inhibitors in BRCA-/HRD- population. After reconstruction of individual patient data (IPD) from three trials, the following PFS KM curves were generated: bevacizumab (n = 85; in gold); olaparib+bevacizumab (n = 192; in green); rucaparib (n=189; in light blue); niraparib (n = 169; in violet). Control arm (n=129; in red) has been generated pooling IPD from the control arms of the three trials. Abbreviations: n, number of patients.
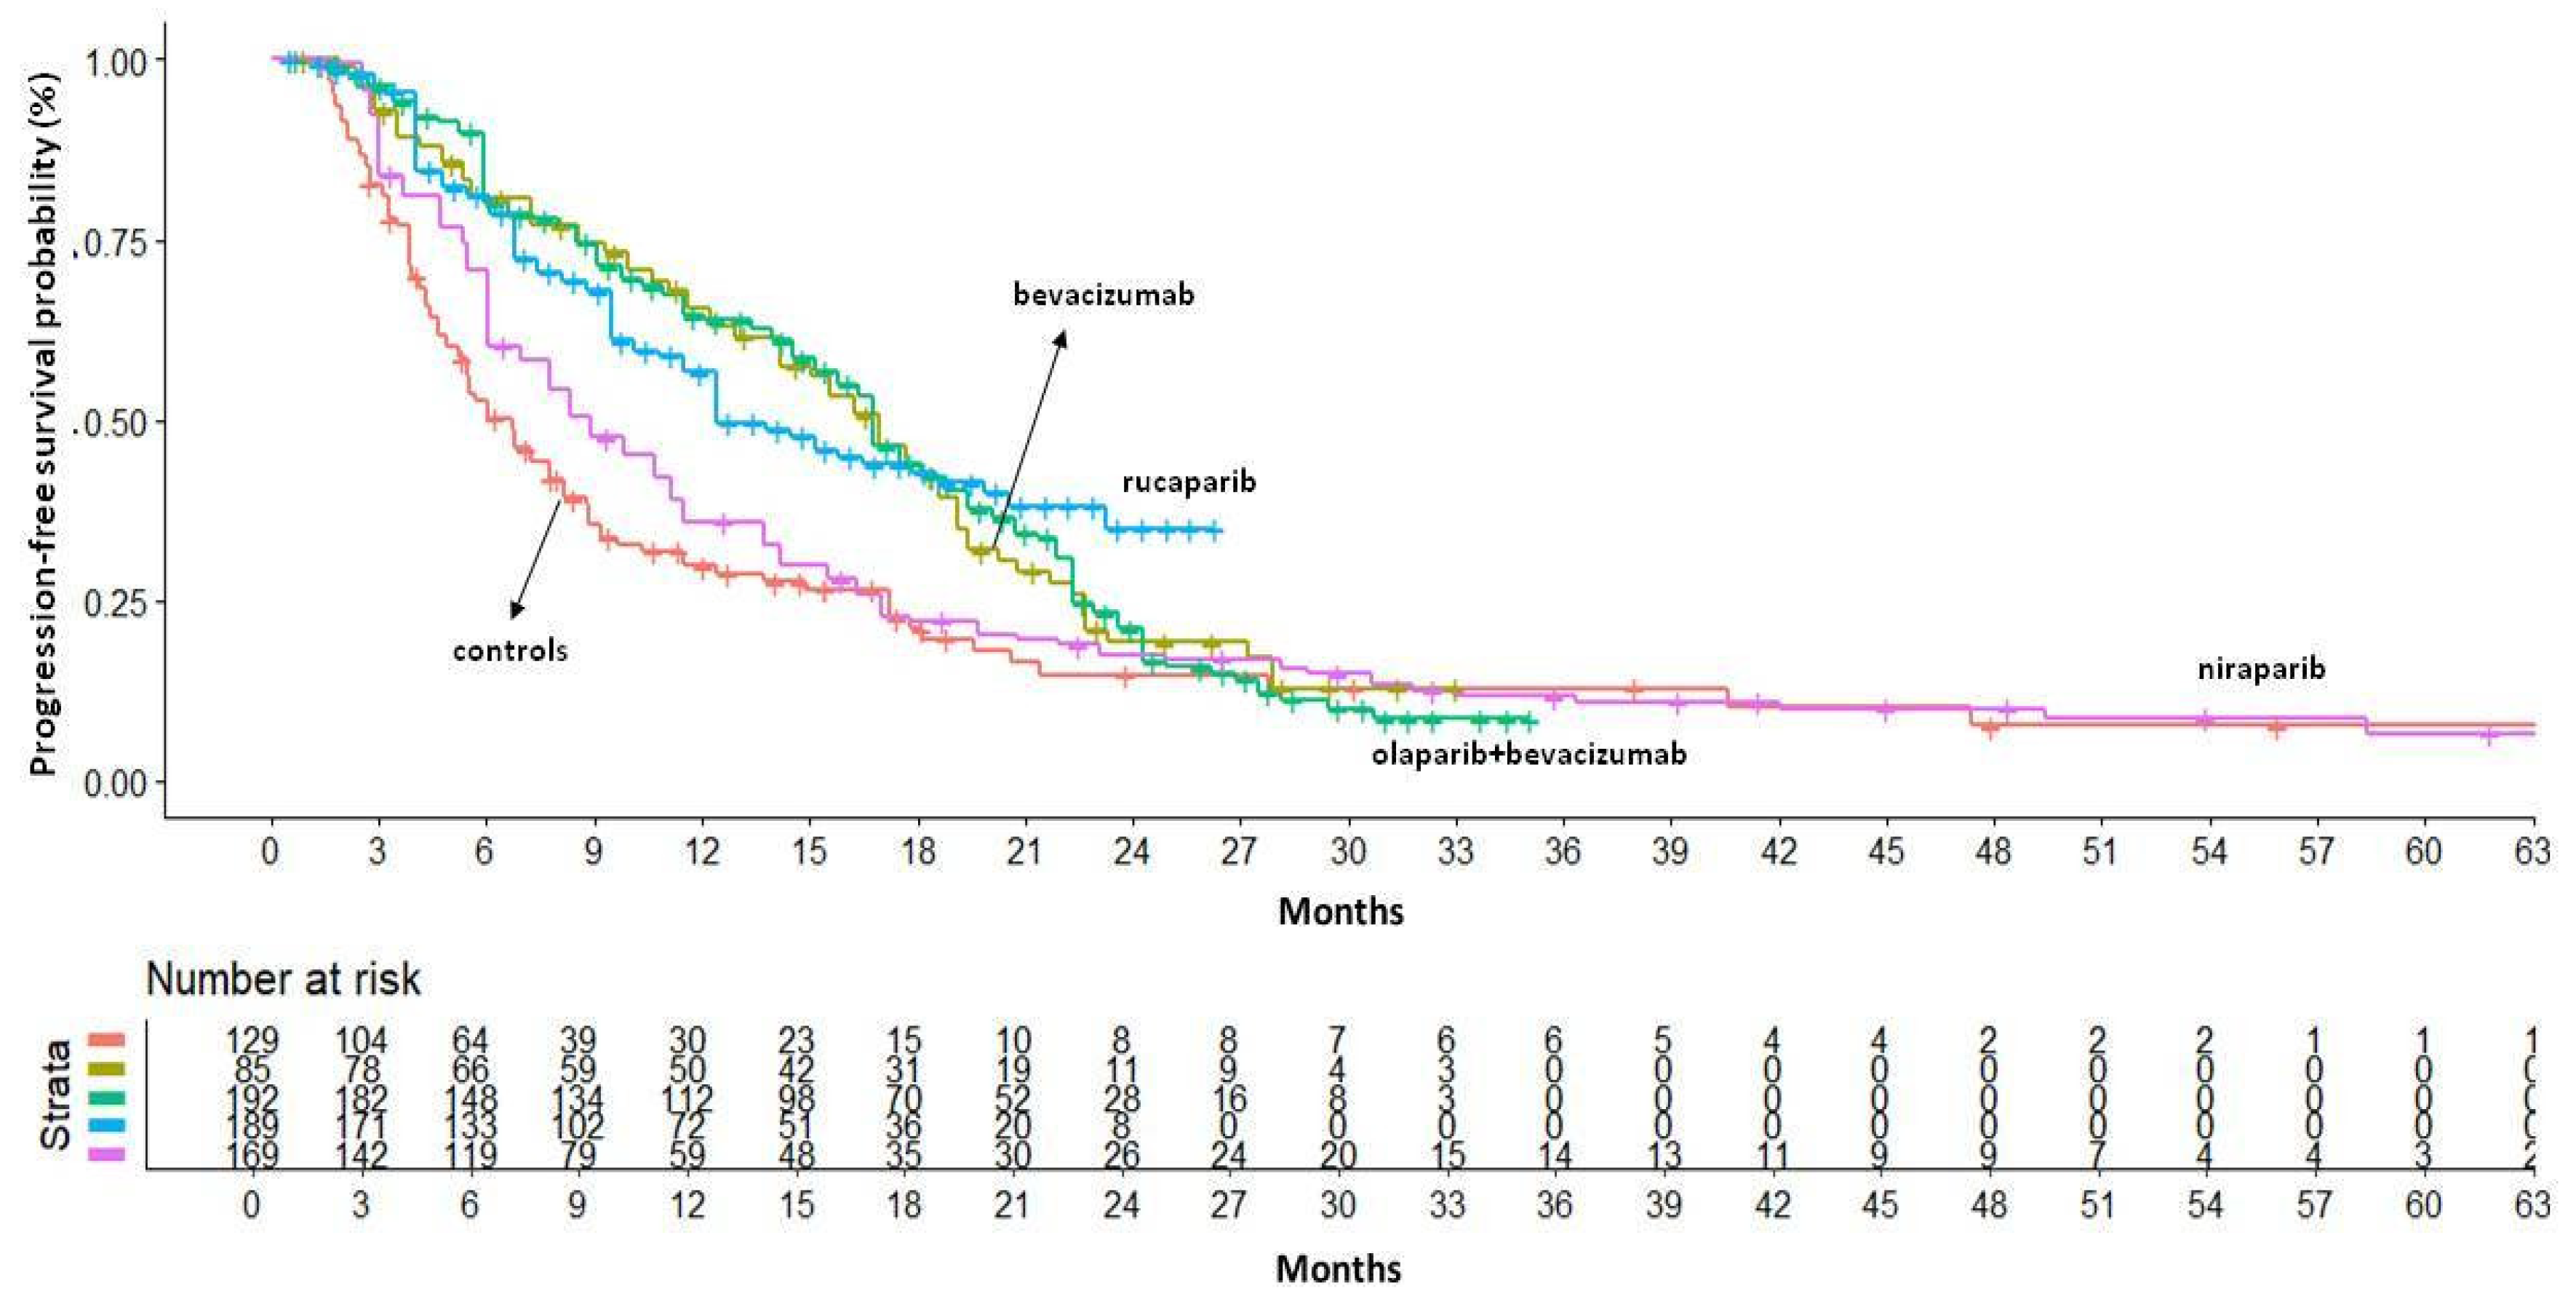
Figure 5.
Binary meta-analysis comparing incidence of any grade ADR (panel A) and severe >G3 ADR (panel B) in patients treated with olaparib (SOLO1 study), niraparib (PRIMA study), olaparib+bevacizumab (PAOLA1 study), rucaparib (ATHENA study) and senaparib (FLAMES study) compared to placebo. Risk ratio estimates with 95%CI and crude rates in the active and control arms are reported.
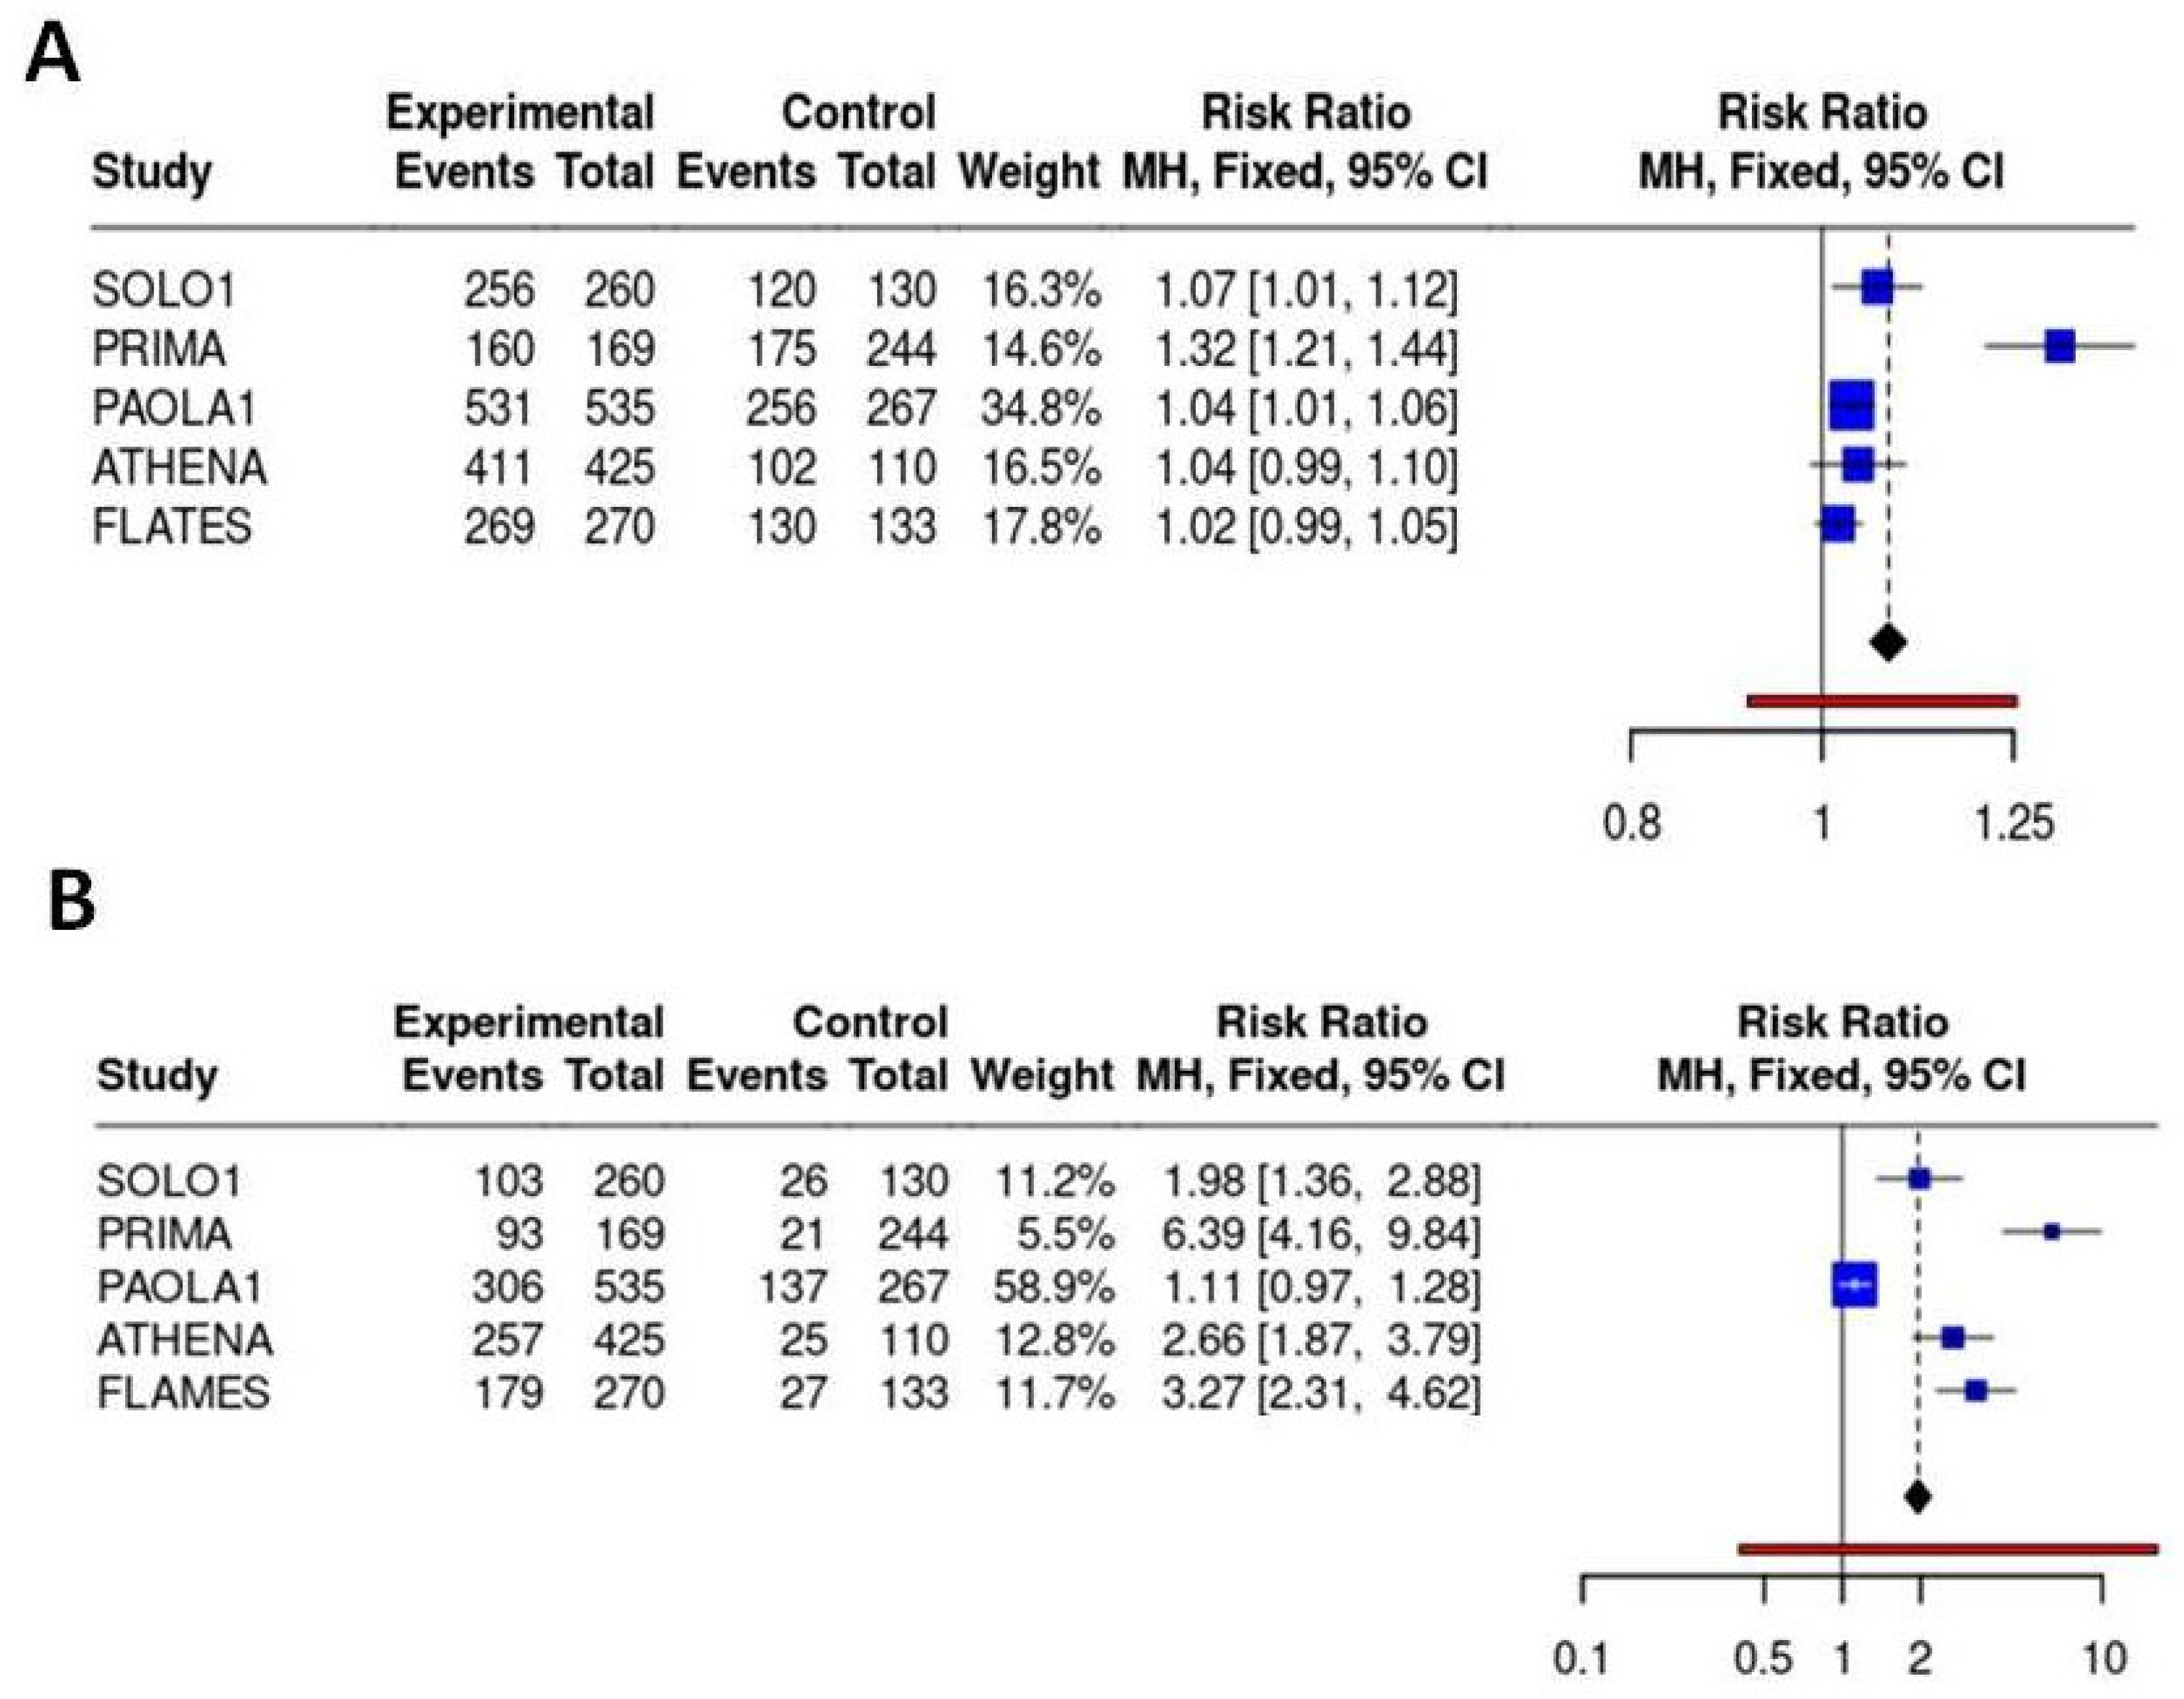
Figure 6.
Binary meta-analysis comparing incidence of hematological ADR in patients treated with olaparib (SOLO1 study), niraparib (PRIMA study), olaparib+bevacizumab (PAOLA1 study), rucaparib (ATHENA study) and senaparib (FLAMES study) compared to placebo. Risk ratio estimates with 95%CI and crude rates in the active and control arms are reported for anemia (A, B), neutropenia (C, D) and thrombocytopenia (E, F) respectively for any grade and severe ADR (≥G3).
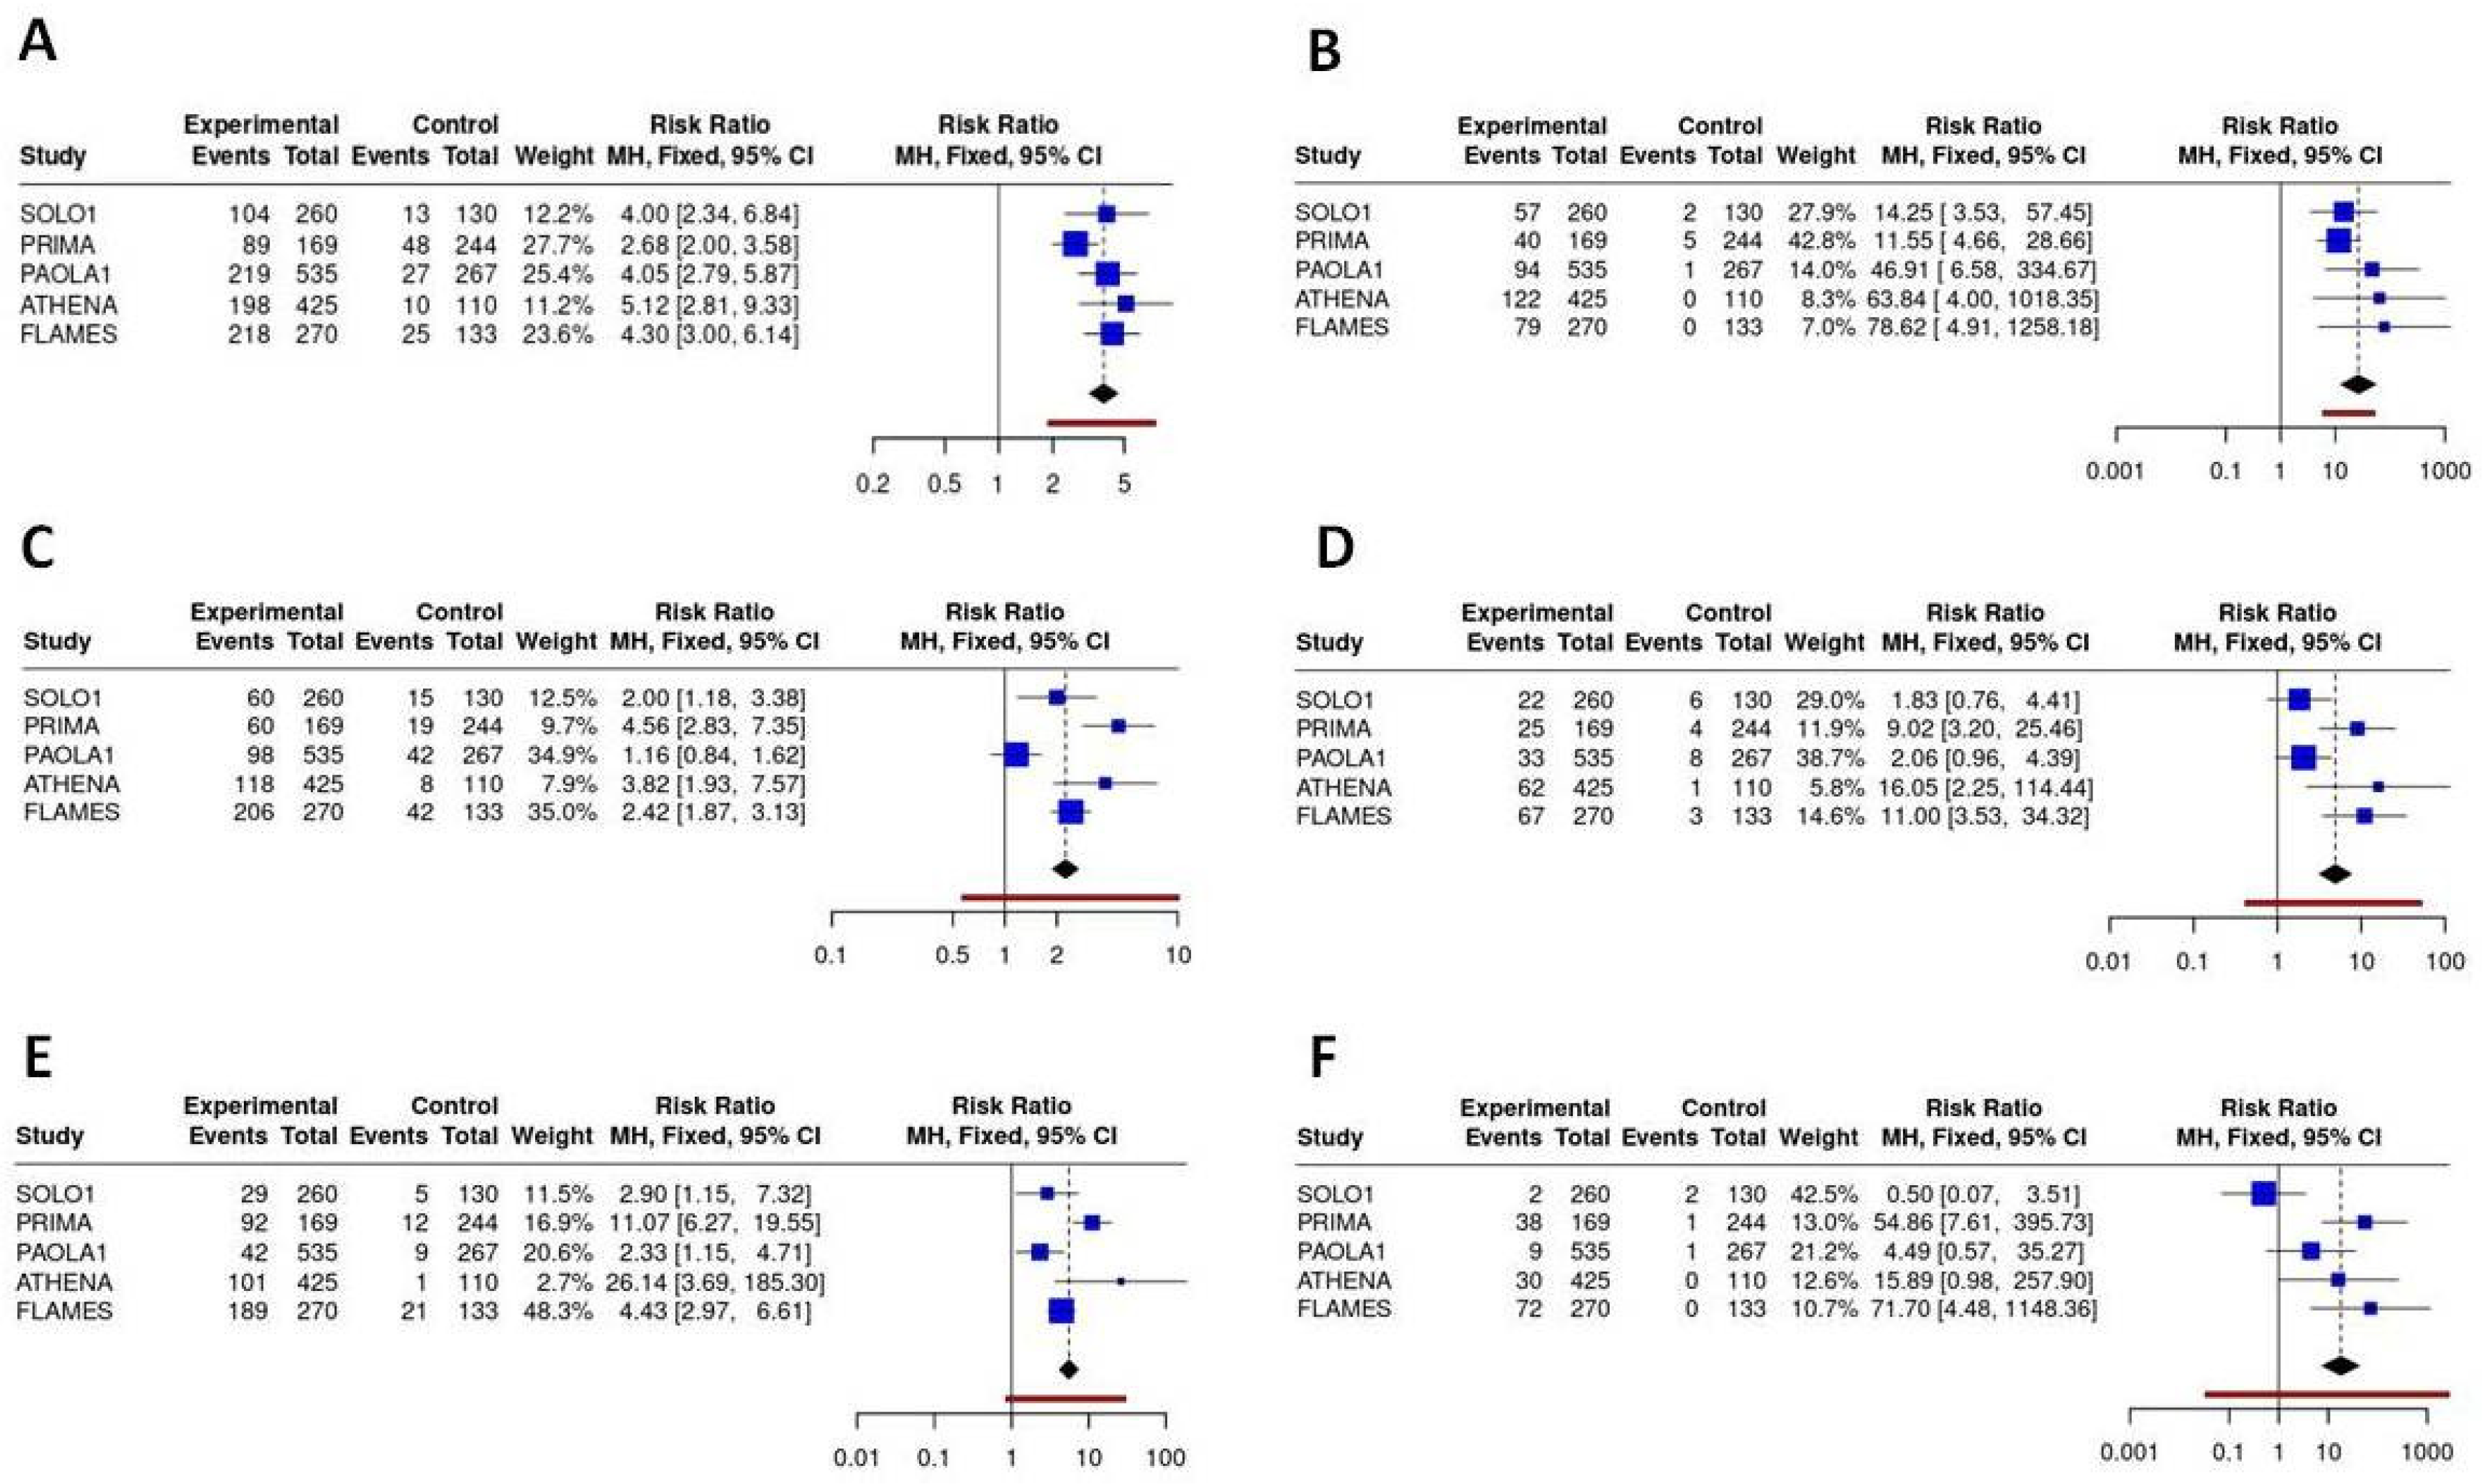
Figure 7.
Binary meta-analysis comparing incidence of gastrointestinal ADR in patients treated with olaparib (SOLO1 study), niraparib (PRIMA study), olaparib+bevacizumab (PAOLA1 study), rucaparib (ATHENA study) and senaparib (FLAMES study) compared to placebo. Risk ratio estimates with 95%CI and crude rates in the active and control arms are reported for diarrhea (A, B), nausea (C, D), vomiting (E, F) and ftigue or asthenia (G, H) respectively for any grade and severe ADR (≥G3).
Disclaimer/Publisher’s Note: The statements, opinions and data contained in all publications are solely those of the individual author(s) and contributor(s) and not of MDPI and/or the editor(s). MDPI and/or the editor(s) disclaim responsibility for any injury to people or property resulting from any ideas, methods, instructions or products referred to in the content. |
© 2025 by the authors. Licensee MDPI, Basel, Switzerland. This article is an open access article distributed under the terms and conditions of the Creative Commons Attribution (CC BY) license (http://creativecommons.org/licenses/by/4.0/).
Copyright: This open access article is published under a Creative Commons CC BY 4.0 license, which permit the free download, distribution, and reuse, provided that the author and preprint are cited in any reuse.


