Preprint
Article

This version is not peer-reviewed.

Advancing the Neurosphere Assay as a Regulatory-Ready NAM: Multiparametric Assessment of CPF and PFAS Mixtures Across Key Neurodevelopmental Endpoints

Submitted:

25 September 2025

Posted:

26 September 2025

You are already at the latest version

Abstract

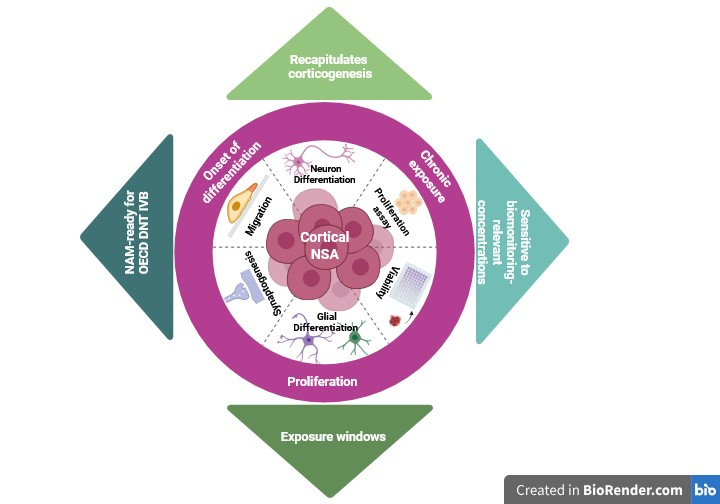
Background: Developmental neurotoxicity (DNT) arises from disruption of key neurodevelopmental processes, including proliferation, differentiation, migration, and synaptogenesis. Traditional in vivo testing is costly and lacks mechanistic resolution, prompting OECD and EFSA to endorse new approach methodologies (NAMs) such as the neurosphere assay (NSA). Methods: We validated a mouse-derived NSA over a three-week differentiation period using multiparametric endpoints—proliferation, neuronal and glial differentiation, radial migration, synaptogenesis, and astrocytic maturation. Baseline characterization was established by flow cytometry, confocal immunofluorescence, and qPCR. Toxicants were applied under two exposure scenarios: (i) chronically during the 7-day proliferation phase, and (ii) chronically after three days of proliferation and maintained throughout the three-week differentiation period. Chlorpyrifos (CPF) served as a DNT-positive reference, and a biomonitoring-relevant mixture of PFAS (PFOS, PFOA, PFUnDA, PFHxS) was designed from the French Esteban study. Results: Baseline analyses confirmed progressive neuronal and glial differentiation, synaptic maturation, and growth factor responsiveness. CPF induced biphasic effects: early enlargement, subsequent growth arrest, migration impairment, overt cytotoxicity at 250 µM, and GFAP downregulation. PFAS mixtures produced modest viability effects but consistently reduced migration and downregulated GFAP and SYP at low-nM levels, consistent with epidemiological and experimental evidence linking PFAS to neurodevelopmental disorders. Migration emerged as a more sensitive endpoint than bulk viability, revealing functional impairments below overt toxicity thresholds. Conclusions: The NSA faithfully recapitulates corticogenesis and detects toxicant-specific liabilities, with CPF impairing astrocytic maturation and PFAS mixtures disrupting astrocytic and synaptic programs at environmentally relevant levels. By integrating complementary endpoints under chronic exposure conditions across proliferation and differentiation, this study advances the NSA as a mechanistic, human-relevant, and regulatory-ready NAM for DNT assessment.

Keywords: 
;  ;  ;  ;  ;  ;  

1. Introduction

Brain development is governed by highly orchestrated cellular and molecular events, including neural stem cell (NSC) proliferation, neuronal and glial differentiation, radial migration, neurite extension, and synaptogenesis. These processes form the foundation of cortical circuit assembly, and their disruption by chemicals can lead to irreversible impairments manifesting later in life as neurodevelopmental and neurodegenerative disorders [1,2,3]. The sensitivity of these key developmental events to toxicants underpins regulatory concern for developmental neurotoxicity (DNT) [4].
Traditional DNT testing has relied on in vivo guideline studies, which are costly, time-consuming, and provide limited mechanistic insight [5,6]. In response, significant progress has been made toward developing human-relevant new approach methodologies (NAMs). Central to these efforts is the DNT in vitro battery (DNT IVB), endorsed by OECD and EFSA, which comprises assays targeting defined key neurodevelopmental processes[4,6,7,8,9,10,11,12]. Among them, the neurosphere assay (NSA) has gained attention for its ability to model NSC-driven corticogenesis in vitro. Derived from rodent or human NSCs, neurospheres undergo proliferation, differentiation, migration, and early network formation, thereby recapitulating essential features of brain development in a scalable 3D format [13,14]. The OECD Guidance Document 310 (2023) [15] and EFSA opinions [6] emphasize the need for validated assays like the NSA that can capture multiple developmental key events with mechanistic resolution and reproducibility.
As part of this validation, characterization of baseline differentiation is essential. Multiparametric readouts—including flow cytometry, confocal imaging, and transcriptional profiling—allow the detection of neuronal, astrocytic, and synaptic markers and the identification of sensitive endpoints. Migration, in particular, has emerged as a critical functional readout of cortical development, as radial glia provide scaffolds for neuronal positioning and astrocytic networks modulate neurite extension [16,17,18,19]. Evidence suggests that migration may reveal functional impairments at sub-cytotoxic levels, complementing cytotoxicity assays [15,20,21]
To evaluate the assay’s ability to detect toxicant-induced liabilities, positive and environmentally relevant test compounds are required. Chlorpyrifos (CPF), an organophosphate pesticide, is a well-established DNT-positive reference compound that disrupts proliferation, astrocytic differentiation, neurite outgrowth, and synaptogenesis across models [22,23,24,25,26,27,28,29,30]. In parallel, per- and polyfluoroalkyl substances (PFAS) are of increasing concern for regulatory agencies. Due to their persistence and widespread human exposure [31,32,33,34], PFAS have been linked to neurodevelopmental disorders, including attention deficit hyperactivity disorder and reduced cognitive function [31,35,36]. EFSA (2020) specifically highlight the need for mixture-based testing, as humans are exposed to PFAS as complex mixtures rather than single compounds [10,11].
In this study, we sought to validate the cortical NSA using a mechanistic rationale approach. First, we characterized baseline differentiation over a three-week period, establishing lineage dynamics and synaptic maturation through multiparametric endpoints. Second, we tested the assay’s ability to detect toxicant-specific effects using CPF as a positive control and a PFAS mixture designed from the French Esteban biomonitoring program (2014–2016) [37], which quantified PFOS, PFOA, PFUnDA, and PFHxS in over 40% of children. This mixture reflects environmentally realistic concentrations in the low-nM range, aligning with regulatory calls for human-relevant, chronic exposures. Toxicants were applied after three days of proliferation, a developmental window coinciding with the onset of differentiation and migration, thereby capturing a critical transition in corticogenesis. Most neurosphere-based studies have focused on exposures during continuous proliferation or at later differentiation stages [38,39,40,41]. By contrast, our design specifically targeted this intermediate transition, enabling the detection of subtle toxicant-induced liabilities that may be overlooked in other windows. Similarly, in vivo studies of developmental neurotoxicity typically examine prenatal (gestational) or postnatal exposures [42,43,44,45] but rarely isolate the precise perinatal transition when neural progenitors exit the cell cycle, astrocytes and neurons differentiate, and radial migration is initiated. By aligning the exposure window with this critical developmental shift, our study complements both in vitro and in vivo approaches and provides mechanistic insight into a stage of corticogenesis that is particularly vulnerable yet underexplored in DNT testing.
We hypothesized that CPF and PFAS would elicit distinct mechanistic signatures within the cortical NSA. By integrating complementary endpoints—proliferation, neuronal and glial differentiation, migration, and synaptogenesis—into a single framework, this study aims to advance the assay toward regulatory readiness as a NAM within the DNT IVB.

2. Materials and Methods

2.1. Neurosphere Culture and Differentiation into 3D Mixed Population of Neurons and Glia

Mouse cortical neural stem cells (NSCs) (Sigma Aldrich, Cat. No. SCR029) were maintained and expanded as adherent cultures in DMEM/F12 with GlutaMAX™ Supplement (Gibco™, Cat. No. 11320033) supplemented with B27 (Gibco™, Cat. No. 17504044), N2 (Gibco™, Cat. No. 17502048), 20 ng/mL recombinant human epidermal growth factor (EGF; Thermo Fisher Scientific, Cat. No. PHG0311), and 1% penicillin–streptomycin (Gibco™, Cat. No. 15140122). Culture flasks (T75) were coated with poly-D-lysine (Gibco™, 10 µg/mL; Cat. No. A3890401) overnight, rinsed with Dulbecco’s PBS (Gibco™, Cat. No. 14190250), and subsequently coated with laminin (Gibco™, 5–7 µg/mL; Cat. No. 23017015) for 1 h at 37 °C. NSCs were seeded at 2 × 10⁶ cells per flask and incubated at 37 °C, 5% CO₂, and 95% relative humidity. The medium was refreshed the following day and subsequently every 2–3 days. Cells were passaged at 75–90% confluency, and passage 3 (P3) cells were used for subsequent neurosphere culture.
For neurosphere formation, P3 NSCs were seeded at a density of 1 × 10⁶ cells/mL (2 mL/well) in ultra-low-attachment 6-well plates (Corning®, Cat. No. 3471) and cultured at 37 °C, 5% CO₂, and 95% relative humidity in complete medium containing EGF. Medium was replenished every 2–3 days, and necrotic or irregularly shaped spheres (dark core >200 µm) were manually discarded. When neurospheres reached a diameter of approximately 250–350 µm, typically after 3/4 days (Figure 1A-B), differentiation was initiated by removing EGF.
Differentiation was carried out for a total of three weeks. During the first week (Day 0–7), cultures were maintained in growth factor–free medium, refreshed every other day. From Day 7 to Day 14, cells were transferred to Maturation Medium 1, consisting of a 1:1 mixture of DMEM/F12 with GlutaMAX™ (Gibco™, Cat. No. 11320033) and Neurobasal™ (Gibco™, Cat. No. 21103049), supplemented with 2% B27 (Gibco™, Cat. No. 17504044) and 0.5% N2 (Gibco™, Cat. No. 17502048). From Day 14 to Day 21, cells were switched to Maturation Medium 2, composed of a 1:1 mixture of DMEM/F12 with GlutaMAX™ (Gibco™, Cat. No. 11320033) and Neurobasal™ Plus (Gibco™, Cat. No. A3582901), supplemented with 2% B27 Plus (Cat. No. A3582801), 0.5% N2 (Cat. No. 17502048), 1% CultureOne Supplement (Gibco™, Cat. No. A3320201), and 200 µM L-ascorbic acid (Sigma Aldrich, Cat. No. A4544).

2.2. Repeated Dose Treatment with CPF and PFAS Mixture

Neurospheres were exposed to chlorpyrifos (CPF) and to a defined PFAS mixture (Table 1) during either the proliferative stage or the differentiation stage, according to the experimental design. During the proliferative stage, spheroids were first generated for 3 days and then exposed from Day 3 to Day 10 (7 consecutive days) to CPF or PFAS to assess effects on viability, stemness,proliferation and expression of SATB2 cortical marker. During the differentiation stage, neurospheres were exposed from Day 0 to Day 21 under repeated medium renewal every 2–3 days to mimic chronic conditions; radial migration was quantified from Day 0 to Day 3 in Geltrex-adherent cultures, and viability was assessed by XTT at Day 10 for migration assays and at Day 21 for long-term differentiated neurospheres. Chlorpyrifos (≥98% purity, CAS 2921-88-2, Cat. No. C45582, Sigma-Aldrich) was prepared as a 300 mM stock in DMSO (Sigma-Aldrich, Cat. No. D8418) and diluted in culture medium to final concentrations of 37.1, 125, and 250 µM, with vehicle concentration kept ≤0.01% v/v in all conditions. The two higher doses served as positive controls to induce overt, concentration-dependent toxicity, while the lower concentration (37.1 µM) was selected as a sub-toxic reference dose, corresponding to levels below the IC₂₀ for CPF cytotoxicity in neurosphere assays as reported by Pistollato et al. [46]. The PFAS mixture was applied at the following final concentrations in culture medium: perfluorooctane sulfonic acid (PFOS, ≥98% purity, CAS 1763-23-1, Cat. No. 77283, Sigma-Aldrich) 2.22 µg/L; perfluorooctanoic acid (PFOA, ≥96% purity, CAS 335-67-1, Cat. No. 171468, Sigma-Aldrich) 1.56 µg/L; perfluoroundecanoic acid (PFUnDA, ≥97% purity, CAS 2058-94-8, Cat. No. 651538, Sigma-Aldrich) 0.12 µg/L; and 1H,1H,2H,2H-perfluorohexane sulfonic acid (PFHxS, ≥97% purity, CAS 355-46-4, Cat. No. 406020, Sigma-Aldrich) 0.79 µg/L, corresponding to a total PFAS concentration (ΣPFAS) of 4.69 µg/L, reflecting environmentally relevant levels reported in Frensh ESTEBAN biomonitoring study [37] .PFAS stocks were prepared in DMSO and diluted in culture medium so that the final solvent concentration was ≤0.01% v/v.
In all experiments, a single vehicle control (DMSO ≤0.01% v/v) was used as the reference condition. Endpoints evaluated after CPF and PFAS exposure included viability, proliferation, lineage marker expression, neurosphere diameter (growth kinetics), radial migration, and transcriptional profiling by qPCR, as detailed in Section 2.3–2.8.

2.3. Flow Cytometry Analysis

Flow cytometry was performed for baseline characterization of differentiated neurospheres (n = 5 biological replicates) and for toxicant-exposed neurospheres in both proliferative (n = 3) and differentiation (n = 3) stages. For viability (XTT), six biological replicates were used.
Neurospheres were collected in 15 mL tubes, allowed to settle, washed once with pre-warmed PBS (without calcium and magnesium), and dissociated enzymatically using the Neurosphere Dissociation Kit (Miltenyi Biotec, Cat. No. 130-095-943) for 10 min at 37 °C with constant shaking. After centrifugation (300 g, 5 min), cells were resuspended in PBS, and viability was assessed by trypan blue exclusion (75–80%). Cells were fixed with 0.1% formaldehyde in PBS for 10 min at room temperature, washed twice with cold PBS, and permeabilized/blocked in PBS containing 3.5% BSA and 0.1% Triton X-100 (Sigma-Aldrich) for 15 min.
Cells were stained for 30 min at room temperature with the following conjugated antibodies: SOX2-PerCP-Cy5.5 (BD Biosciences, Cat. No. 561506, 1:100), βIII-tubulin-APC (Thermo Fisher Scientific, Cat. No. 13437495, 1:100), GFAP-PE (Thermo Fisher Scientific, Cat. No. 15831069, 1:100), MAP2-Alexa 488 (Thermo Fisher Scientific, Cat. No. 13-1500, 1:200), Ki67-Alexa 488 (Thermo Fisher Scientific, Cat. No. 15890819, 1:100). Primary antibodies were: BDNF (Thermo Fisher Scientific, Cat. No. 16324455, 1:50), SATB2 (Thermo Fisher Scientific, Cat. No. 16386194, 1:50), PSD95 (Thermo Fisher Scientific, Cat. No. 17481243, 1:50), Neurofilament (NF, Cliniscience, Cat. No. 172132, 1:100). Secondary antibodies were goat anti-rabbit APC (Thermo Fisher Scientific, Cat. No. A10931, 1:200) or goat anti-mouse Alexa 488 (Thermo Fisher Scientific, Cat. No. A11008, 1:200).
For cell cycle analysis, cells were stained with Ki67-Alexa 488 in combination with propidium iodide (PI)/RNase staining solution (FxCycle™ PI/RNase, Thermo Fisher Scientific, Cat. No. F10797), according to the manufacturer’s instructions. PI fluorescence intensity was used to define G0/G1 (2N), S (intermediate), and G2/M (4N) phases, while Ki67 expression distinguished quiescent (Ki67⁻) from actively cycling (Ki67⁺) populations.
After staining, cells were washed twice with cold PBS, resuspended in PBS containing 3.5% BSA, and analyzed on a CytoFLEX flow cytometer (Beckman Coulter), acquiring 20,000 events per sample. Gating included exclusion of debris, dead cells, and doublets. Unstained controls were used to set gates, and compensation was applied to correct for spectral overlap. Data were analyzed using CytExpert software (Beckman Coulter) to determine the percentage of marker-positive cells and the mean fluorescence intensity (MFI) within gated populations. Results were expressed as mean ± SD from three independent biological replicates.

2.4. XTT Cytotoxicity Assay for Cell Viability

Cell viability was measured using the In Vitro Toxicology Assay Kit, XTT based (Sigma-Aldrich, Cat. No. TOX2-1KT), after exposures as described above. Cells were incubated with XTT reagent (final concentration 0.3 mg/mL in culture medium) for 4 h at 37 °C and 5% CO₂. Following incubation, 200 µL of medium/reagent mixture was transferred into a 1 cm path length cuvette, and absorbance was recorded at 450 nm (reference 690 nm) using a spectrophotometer. Blank values (complete DMEM/F12 medium with XTT reagent but no cells) were subtracted from all readings. Data were normalized to solvent control cells (complete DMEM/F12 medium with DMSO <0.01% v/v). Results are expressed as mean ± SD from six independent biological replicates.

2.5. Growth Factor–Dependent Proliferation Assay

As an endpoint-specific positive control confirming that the assay detects reductions in neurosphere proliferation, neurospheres were first cultured until they reached ~400–450 µm in diameter (baseline, 0 h). Neurospheres were cultivated in DMEME/F12 medium without EGF (EGF⁻) compared with standard conditions containing 20 ng/mL EGF (Thermo Fisher Scientific, Cat. No. PHG0311). For the assessment of sphere size, images of neurospheres were acquired at 0 h, 48 h, and 96 h using a Leica inverted microscope equipped with a Moticam camera and Motic Images software, with a 10× objective. For each condition and time point, six neurospheres were measured in duplicate. Diameters were quantified using the Moticam software measurement tool. Data are expressed as mean ± SD from six independent experiments.

2.6. Immunofluorescence Staining and Confocal Microscopy

Neurospheres (3,000 cells/well) were generated in ultra-low attachment 96-well plates and maintained in proliferative conditions until they reached ~550–600 µm in diameter (Day 6). They were then transferred to 6-well plates for differentiation (Figure 1C-D). For immunostaining, neurospheres were fixed at Week 1, Week 2, and Week 3, and stained for TUBB3, GFAP, and Synaptophysin (SYP).
For outgrowth and migration dynamics, neurospheres of comparable size (~550–600 µm) were embedded in Geltrex™ matrix at the onset of differentiation (adapted from Nickels et al., [47]. Embedded neurospheres were maintained under differentiation conditions and collected at Week 1 and Week 2 for TUBB3 and GFAP staining.
All samples were fixed in 4% PFA (20 min, RT), permeabilized and blocked (0.1% Triton X-100, 3.5% BSA in PBS), and incubated overnight at 4 °C under gentle gyratory shaking with the following primary antibodies diluted in blocking solution: TUBB3-APC (Thermo Fisher Scientific, Cat. No. 13437495, 1:100), GFAP-AF488 (Santa Cruz/Cliniscience, Cat. No. sc-33673 AF488, 1:100), and SYP-AF488 (Santa Cruz/Cliniscience, Cat. No. sc-17750 AF488, 1:100). The next day, neurospheres were washed twice in PBS (15 min, 37 °C, gentle shaking), transferred onto Lab-Tek™ II Chambered Coverglass Slides (Thermo Fisher Scientific, Cat. No. 155411), and mounted with ProLong™ Glass Antifade (Thermo Fisher Scientific). Three independent biological replicates were analyzed per condition.
Confocal imaging was performed on a Leica TCS SP5 microscope. Suspended neurospheres were imaged with a 40× water-immersion objective, and embedded neurospheres with a 10× dry objective. Excitation was performed at 488 nm and 630 nm, with emission windows adjusted to the fluorophores. Z-stacks were acquired and reconstructed using Leica LAS AF software. Maximum-intensity projections and channel merges were generated in ImageJ (Fiji, NIH, Bethesda, MD, USA), and representative images were prepared for figures.

2.7. Migration Assay

Neurospheres (2,000 cells/well) were generated in ultra-low attachment 96-well plates and maintained in proliferative medium until they reached ~200–300 µm in diameter (Day 3). Individual neurospheres were then transferred into 24-well adherent plates pre-coated with poly-D-lysine and laminin (as described in the Cell culture section), and subsequently coated with Geltrex™ (1:100, 100 µL/well, 10 min at 37 °C; Thermo Fisher Scientific, Cat. No. A1413302). After a 10-min incubation at 37 °C to allow partial gelling of the Geltrex layer, one neurosphere was seeded per well in 200 µL of differentiation medium containing CPF (125 or 250 µM) or a PFAS mixture, allowed to adhere for 5 minutes, and then overlaid with 1 mL of the same medium. For migration assays, smaller neurospheres (~200–300 µm) were intentionally used to optimize radial outgrowth, as larger spheroids (>500 µm) become too compact and restrict peripheral dispersal, consistent with previous reports highlighting the impact of spheroid size on migration and differentiation outcomes [48,49].
Radial migration was monitored by bright-field microscopy using 10× objective at baseline (20 min post-seeding, Day 0), and 4× objective for daily measurements from Day 1 to Day 3.
Medium -containing the test compounds was renewed every 3 days, and cultures were maintained under repeated exposure until Day 10, when cell viability was assessed using the XTT assay. Migration distance was quantified as the distance between the neurosphere edge and the outermost migration front and compared with control neurospheres.

2.8. Measurement of Neurosphere Size During Differentiation

Neurosphere diameter was monitored longitudinally at defined time points (Day –3 pre-exposure, Day 0, Week 1, Week 2, and Week 3) under control and toxicant conditions. Bright-field images were acquired using a Leica inverted microscope equipped with a Moticam camera and Motic Images software, with a 10× objective. For each condition and time point, six neurospheres were measured in duplicate. Diameters were quantified using the Moticam software measurement tool. Growth kinetics were analyzed as described in the Results section.

2.9. RNA Extraction and Quantitative Real-Time PCR (qPCR) Analyses

Total RNA was extracted from 3D cortical neurospheres after 3 weeks of differentiation under control and treatment conditions using the PureLink™ RNA Mini Kit (Thermo Fisher Scientific, Cat. No. 12183018A), according to the manufacturer’s instructions. RNA concentration and purity were assessed using a NanoDrop™ One spectrophotometer (Thermo Fisher Scientific), and 500 ng total RNA per sample were reverse transcribed with the iScript™ cDNA Synthesis Kit (Bio-Rad, Cat. No. 1708891). qPCR was performed on a CFX96 Real-Time PCR Detection System (Bio-Rad) using iTaq™ Universal SYBR Green Supermix (Bio-Rad, Cat. No. 1725121) with primers corresponding to TaqMan™ Gene Expression Assays (Thermo Fisher Scientific, Table 2). Cycling conditions consisted of 40 cycles of 95 °C with primer annealing at 60 °C, followed by a final melt-curve analysis (65–95 °C) to confirm specificity.
For baseline characterization, Ct values were normalized to Gapdh (ΔCt), and relative expression was expressed as log₂(2–ΔCt) to illustrate marker expression levels in solvent-control neurospheres (Ctr, 0.01% DMSO). For exposure experiments, relative transcript levels were calculated using the ΔΔCt method, with solvent-control neurospheres as the calibrator condition, and data are presented as fold changes (2–ΔΔCt) relative to Ctr. All reactions were run in technical duplicates, and results represent three independent biological replicates. Genes detected in only two biological replicates (Mbp, Gabbr3, Slc18a, Ntrk1, Cd140a) were reported descriptively but excluded from quantitative analysis. For CPF at 250 µM, reliable quantification was limited; therefore, only Gfap expression was consistently evaluated at this concentration.

2.10. Statistical Analysis

Statistical analyses were performed using GraphPad Prism (version 8.0.2). Data represent the mean of independent biological replicates ± standard deviation (SD), with the number of replicates (n) indicated in the Results and figure legends.
Statistical significance was assessed by unpaired two-tailed Student’s t-test (when comparing treatment vs. vehicle controls). Welch’s correction was applied when variances were unequal. For longitudinal datasets such as neurosphere growth kinetics (Figure 9C) and radial migration (Figure 11B), two-way repeated-measures ANOVA was performed, followed by Tukey’s post-hoc test to evaluate pairwise differences between groups at specific time points. A significance threshold of p < 0.05 was applied for all analyses.
For figures, asterisks indicate significant differences vs. vehicle controls (p < 0.05, *p < 0.01, **p < 0.001).

3. Results

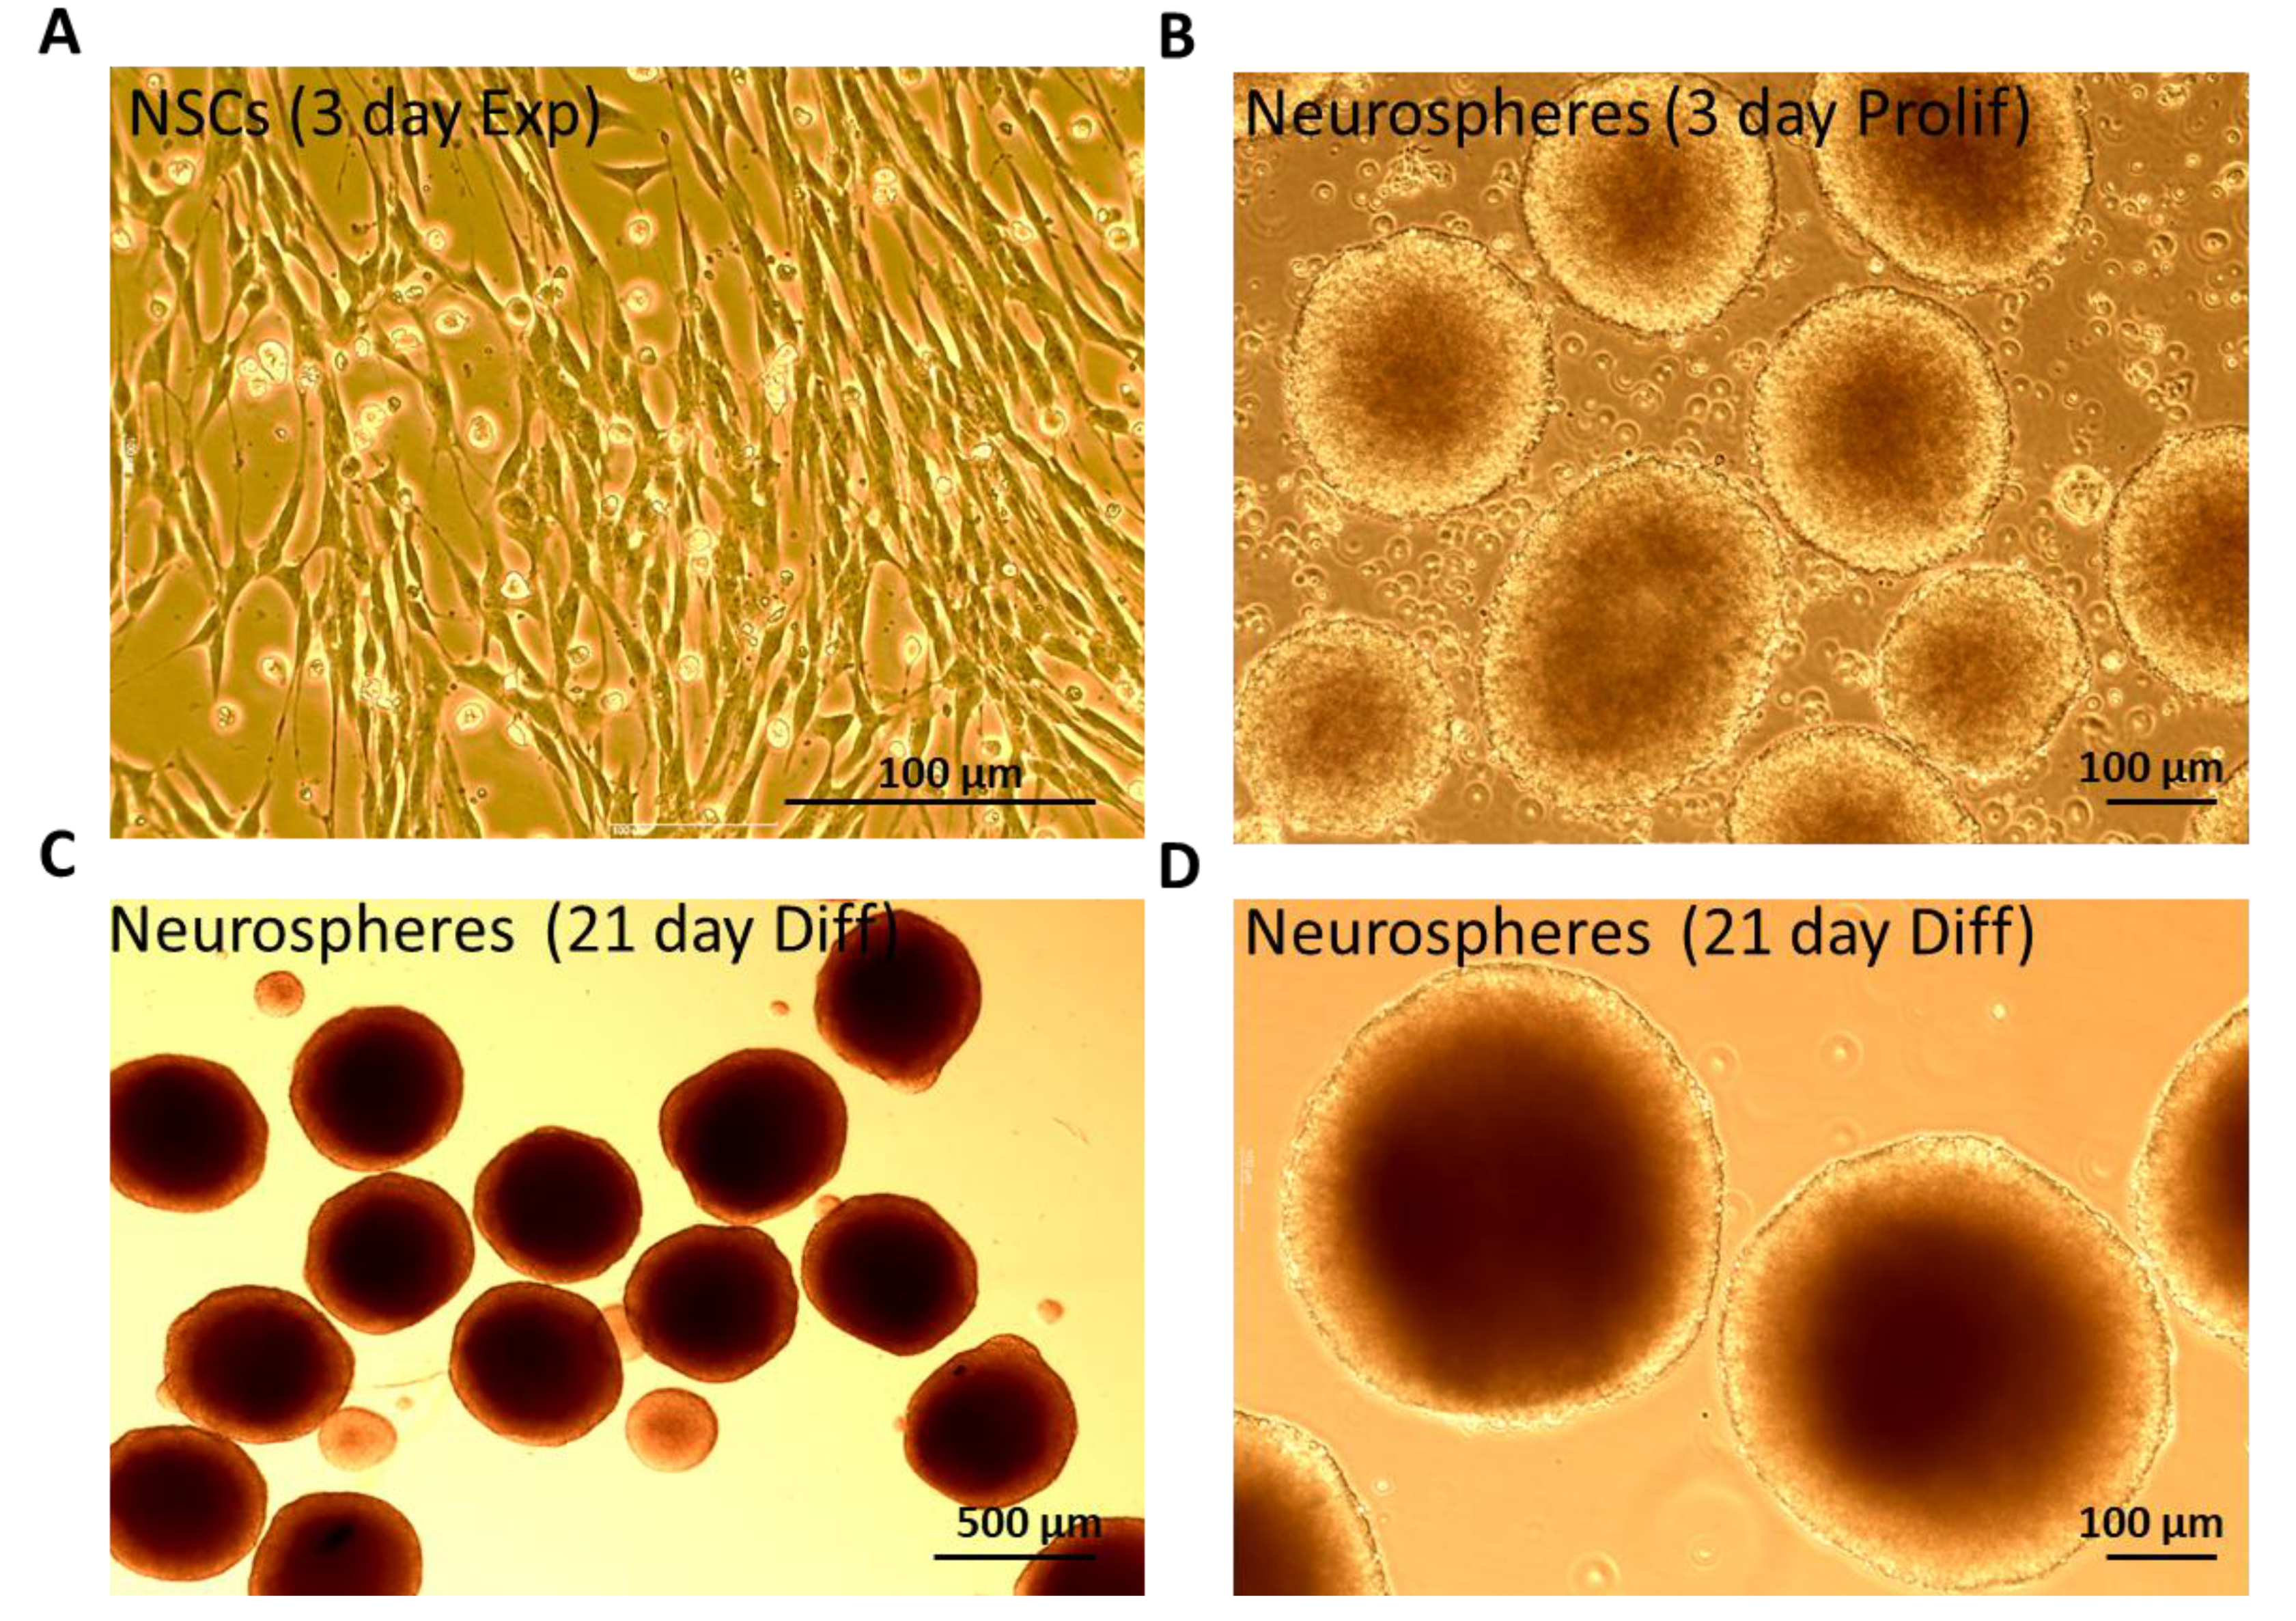
3.1. Characterization of Mouse- Derived NSCs Differentiated Towards Neurons and Glia as 3D Neurospheres

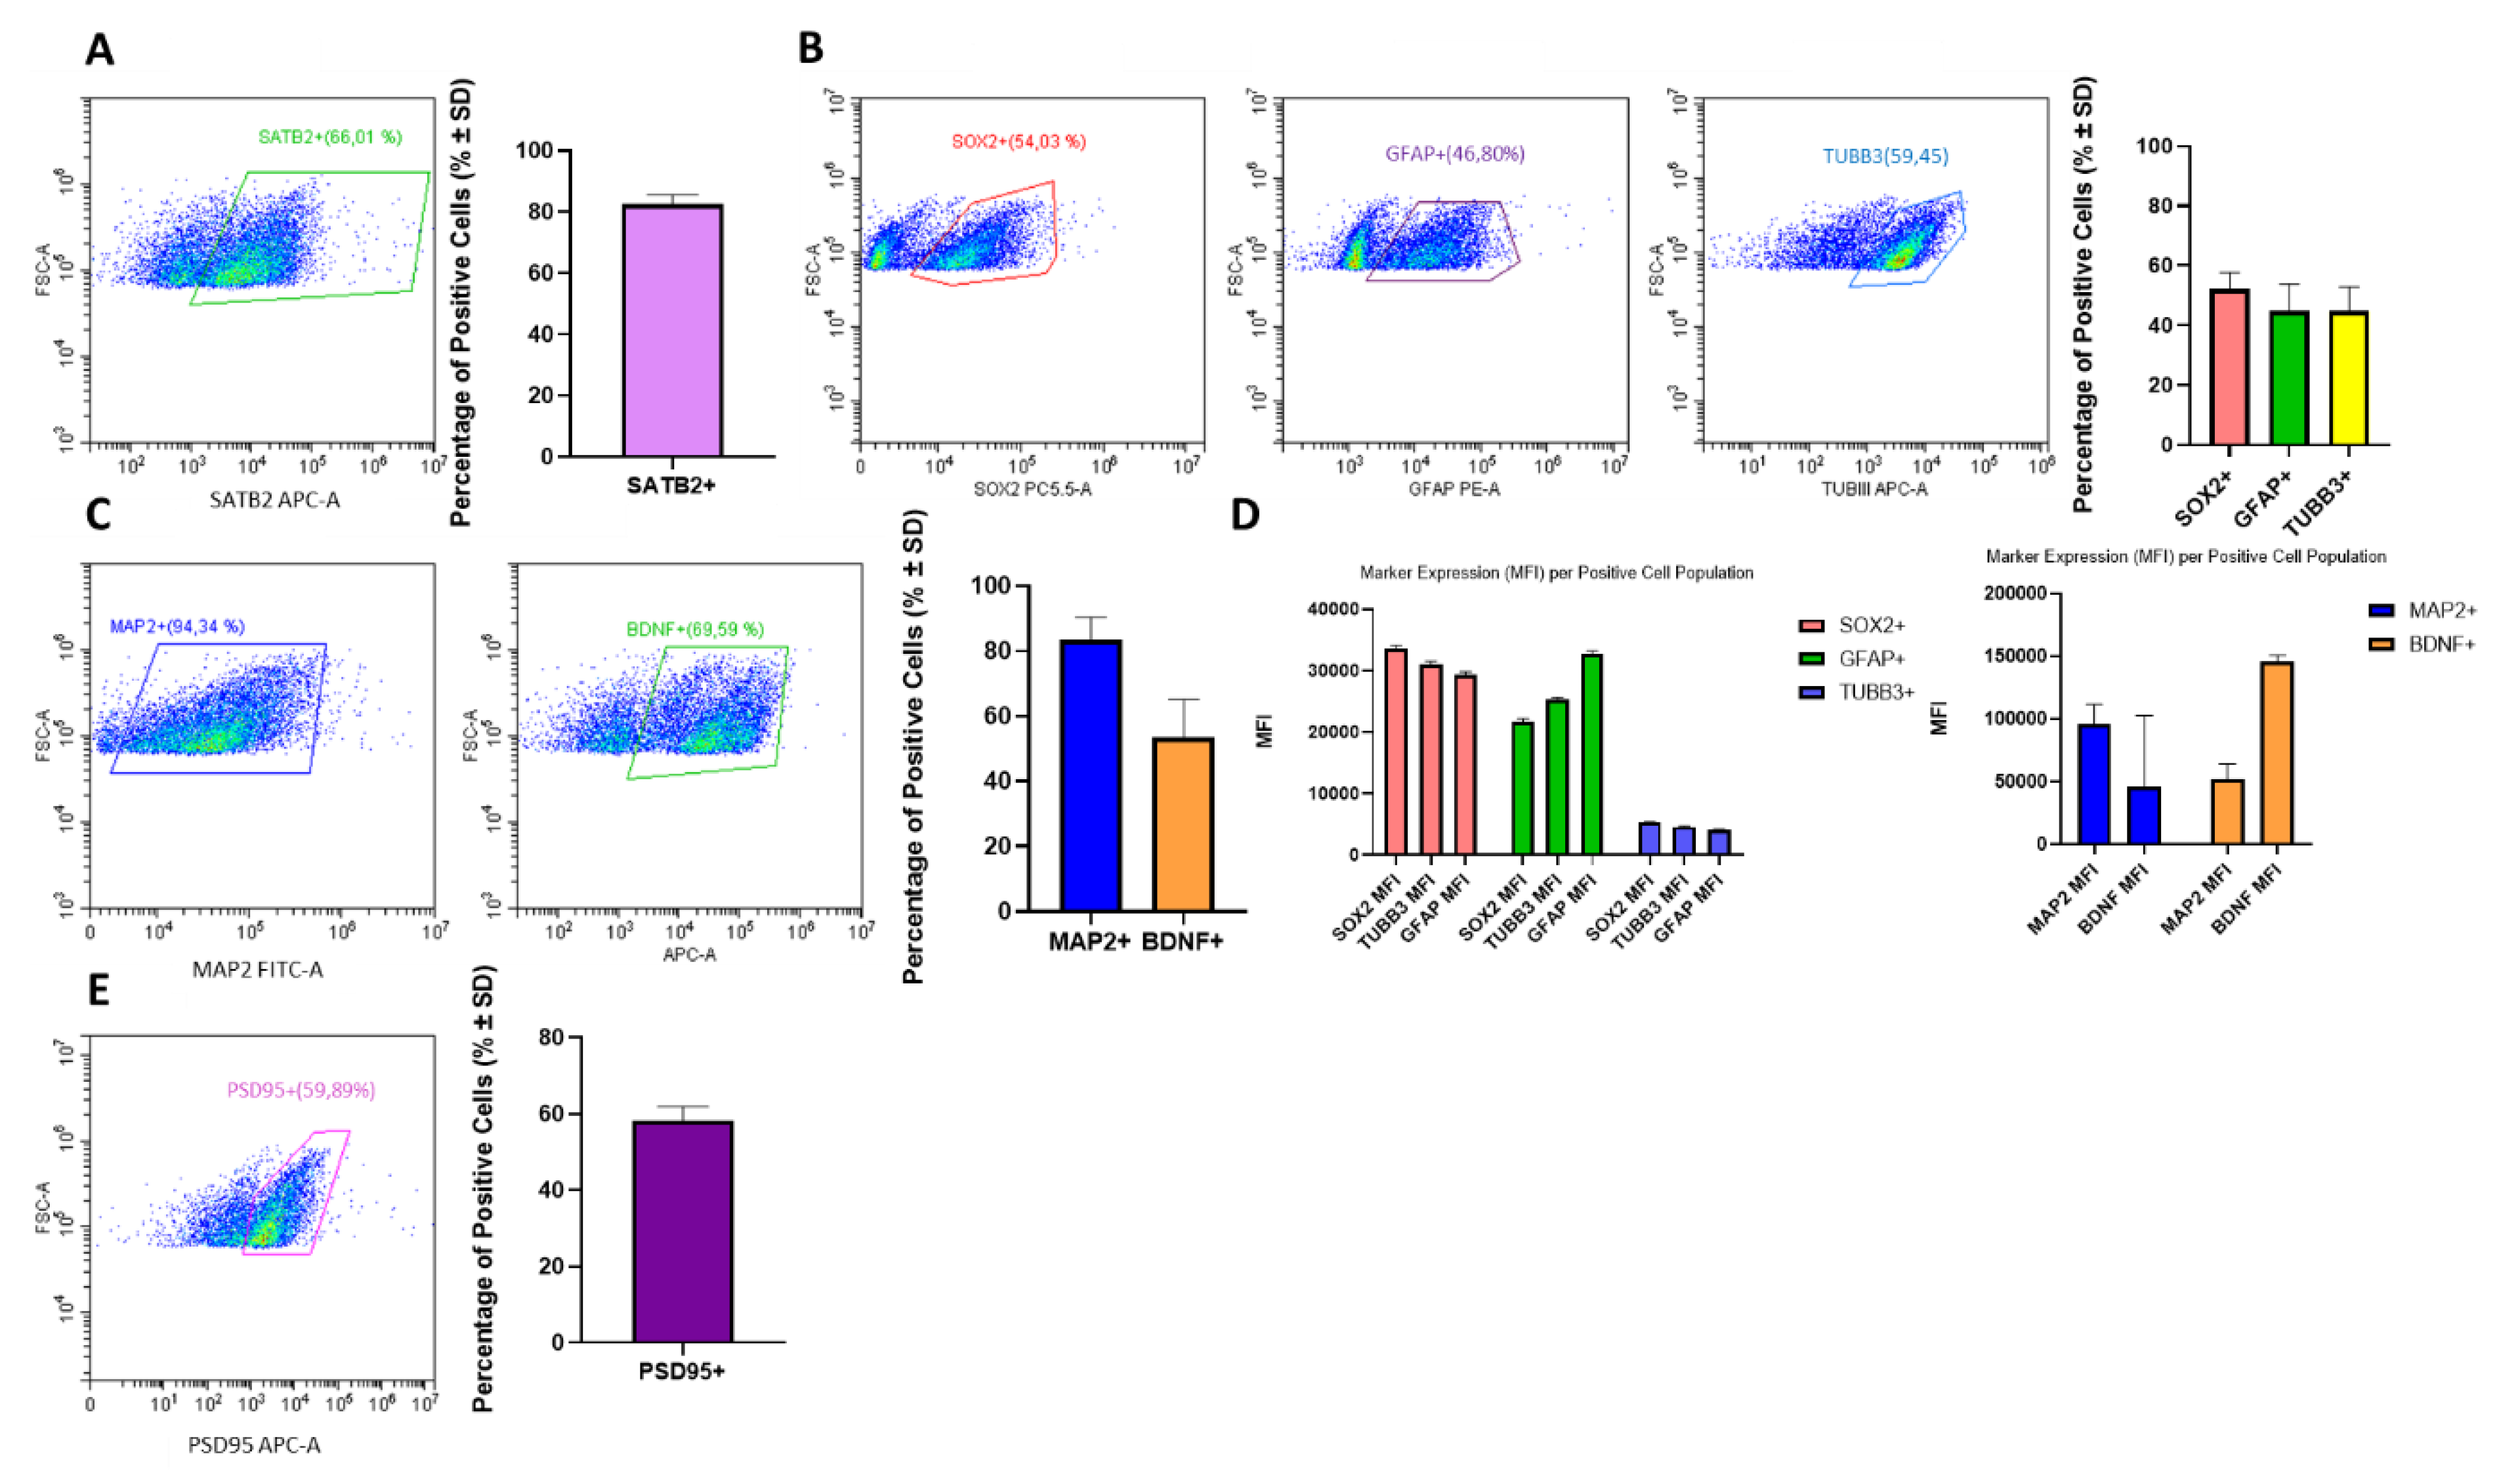
3.1.1. Model Characterization by Cytometry

Flow cytometry confirmed the heterogeneous cellular composition of the differentiating neurospheres, including SOX2⁺ (Sox2, SRY-box transcription factor 2) progenitors, GFAP⁺ (Gfap, glial fibrillary acidic protein) astrocytic precursors, TBB3+ (Tubb3, class III beta-tubulin) immature neurons, and SATB2⁺ (Satb2, special AT-rich sequence-binding protein 2) post-mitotic cortical neurons (Figure 2A–B). Quantification of SATB2 confirmed the presence of post-mitotic neurons, while SOX2, GFAP, and βIII-tubulin identified progenitor, astrocytic, and neuronal lineages [50,51].
To complement percentages, mean fluorescence intensity (MFI) was assessed within each gated population (Figure 2D). SOX2⁺ cells displayed high SOX2 expression but also measurable GFAP and TUBB3 signals, suggesting transitional progenitors initiating glial or neuronal programs. Similarly, GFAP⁺ cells retained detectable SOX2 and TUBB3, consistent with persistence of progenitor traits alongside early neuronal priming. In contrast, the average TUBB3 MFI was lower in the broad TUBB3⁺ population compared with the SOX2⁺ gate. This discrepancy reflects differences in population composition: the TUBB3⁺ gate encompasses many TUBB3^dim (low-expressing) early neurons, which reduces the mean signal, whereas the SOX2⁺ gate is enriched in TUBB3^bright (high-expressing) transitional neurons co-expressing progenitor and neuronal markers, elevating its MFI [50,51].
Markers of neuronal maturation showed strong expression: MAP2⁺ (Map2, microtubule-associated protein 2) and BDNF⁺ (Bdnf, brain-derived neurotrophic factor) populations exhibited high intensities of their respective markers and measurable cross-expression (Figure 2C–D), consistent with advancing neuronal differentiation. PSD95⁺ (Dlg4, postsynaptic density protein 95) cells were also identified, indicating acquisition of postsynaptic features (Figure 2E) [52].
Together, these results establish that neurospheres contain both distinct and transitional neuronal/glial populations, faithfully mirroring lineage dynamics of cortical development and providing a relevant baseline for subsequent mechanistic analyses [53].

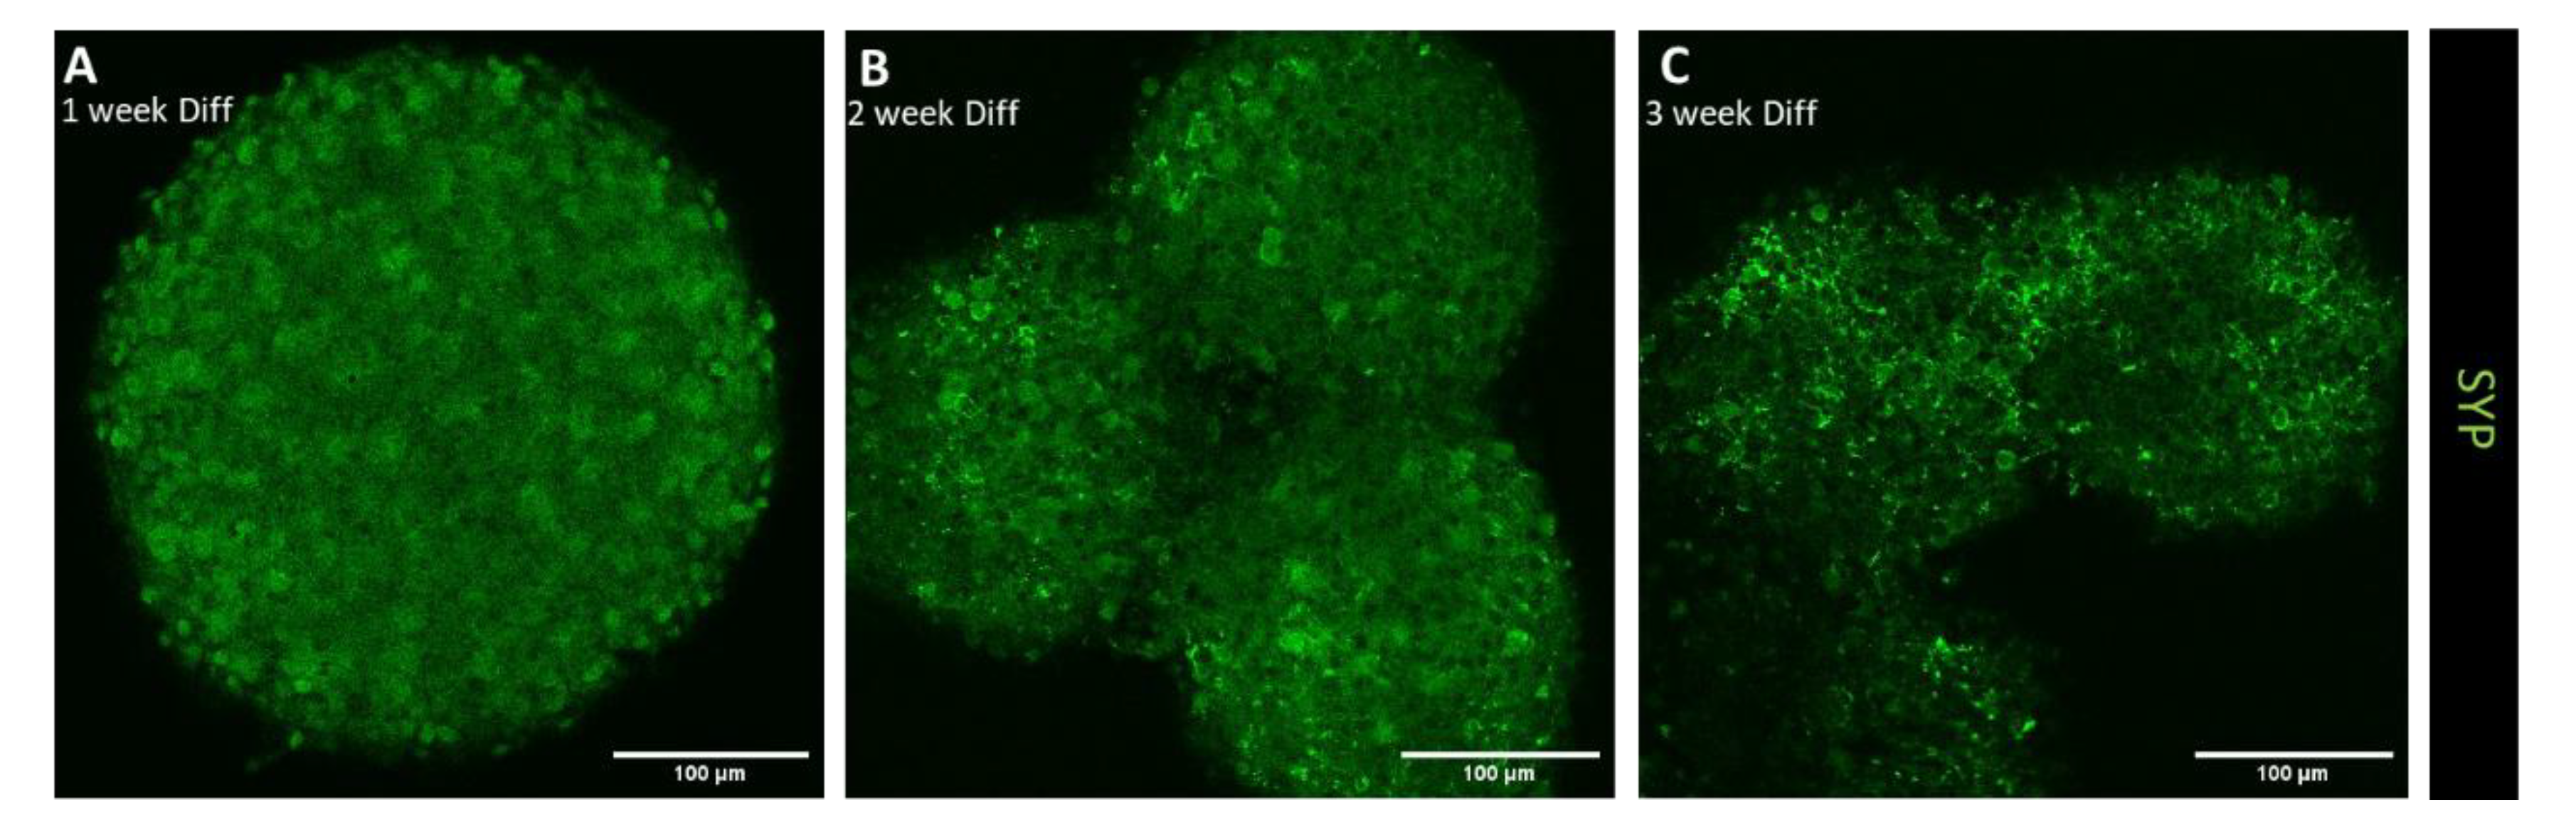
3.1.2. Confocal Immunofluorescence Analysis of Differentiation, Migration, and Synaptic Maturation

To complement flow cytometry and assess spatial organization, we first examined neuronal and astrocytic differentiation of neurospheres over three weeks by confocal immunofluorescence of GFAP⁺ astrocytes and TUBB3⁺ neurons (Figure 3). At week 1, neurospheres were compact and well delimited, with GFAP⁺ processes and TUBB3⁺ neuronal somas already detectable throughout the spheroid. Fine neuronal prolongations (neuritic processes) were visible, marking the onset of differentiation. By week 2, neurospheres increased in size and displayed irregular contours, with partial fusion of aggregates. Neuronal marker TUBB3⁺ became abundant, with numerous somas and neuritic processes distributed across the spheroid, suggesting a peak in neuronal density. GFAP⁺ processes expanded widely and frequently overlapped with neuronal structures, spanning fusion interfaces and supporting emerging neuron–glia interactions. By week 3, neuronal somas appeared less numerous than at week 2, but neuronal prolongations were longer, branched, and interconnected, forming mesh-like networks. Astrocytic processes also remained abundant, contributing to an integrated neuronal–glial architecture. This establishes that neurospheres undergo a temporal shift from cellular expansion to structural integration, reflecting the coordinated dynamics of cortical differentiation [54].
To further assess peripheral dynamics in 3D, neurospheres were embedded in Geltrex and examined after one and two weeks (Figure 4). At week 1 (A–C), compact spheroids displayed thin outward projections emanating from the contour, visible in both GFAP⁺ astrocytes (A) and TUBB3⁺ neurons (B), with denser GFAP⁺ filaments at the periphery. The merged image (C) illustrates overlapping neuronal and astrocytic extensions. These projections were also evident in bright-field imaging (G). By week 2 (D–F), such discrete filaments were largely lost; instead, cells accumulated at the spheroid border, forming a continuous rim with an epithelial-like appearance. In this configuration, GFAP⁺ processes localized along the surface (D), while TUBB3⁺ networks remained predominantly within the spheroid core (E). The merged panel (F) highlights this rim-like distribution, consistent with the bright-field appearance (H). Taken together, these observations suggest an early phase of filamentous outgrowth at week 1 that transitions by week 2 to surface-restricted organization, likely reflecting the confining properties of the dense Geltrex matrix [55].
Preprints 178167 i001
To assess synaptic maturation, neurospheres were immunostained for Synaptophysin (SYP; Syp) at weeks 1, 2, and 3 of differentiation (Figure 5). At week 1 (A), SYP staining appeared as a diffuse pattern with scattered puncta distributed across the spheroid, consistent with early protein expression before its concentration at synaptic vesicles. By week 2 (B), puncta became more numerous and clearly localized, particularly along neuritic profiles and at the periphery of neuronal clusters, reflecting ongoing synaptogenesis within emerging networks. At week 3 (C), neurospheres displayed a dense and clustered pattern of SYP puncta, indicative of more mature presynaptic specializations. This temporal progression from diffuse to punctate to clustered staining demonstrates a progressive, stepwise maturation of presynaptic structures during differentiation. Importantly, this trajectory mirrors in vivo cortical development, where synaptogenesis accompanies neuronal differentiation and network assembly [56,57].
Together, these confocal analyses demonstrate that cortical neurospheres undergo coordinated differentiation into neuronal and glial lineages, display early migration-like projections, and show the progressive, stepwise maturation of synaptic networks. To complement these morphological and protein-level observations, we next examined the transcriptional landscape of neurodevelopmental genes by qPCR to determine whether molecular signatures support the phenotypic changes observed.

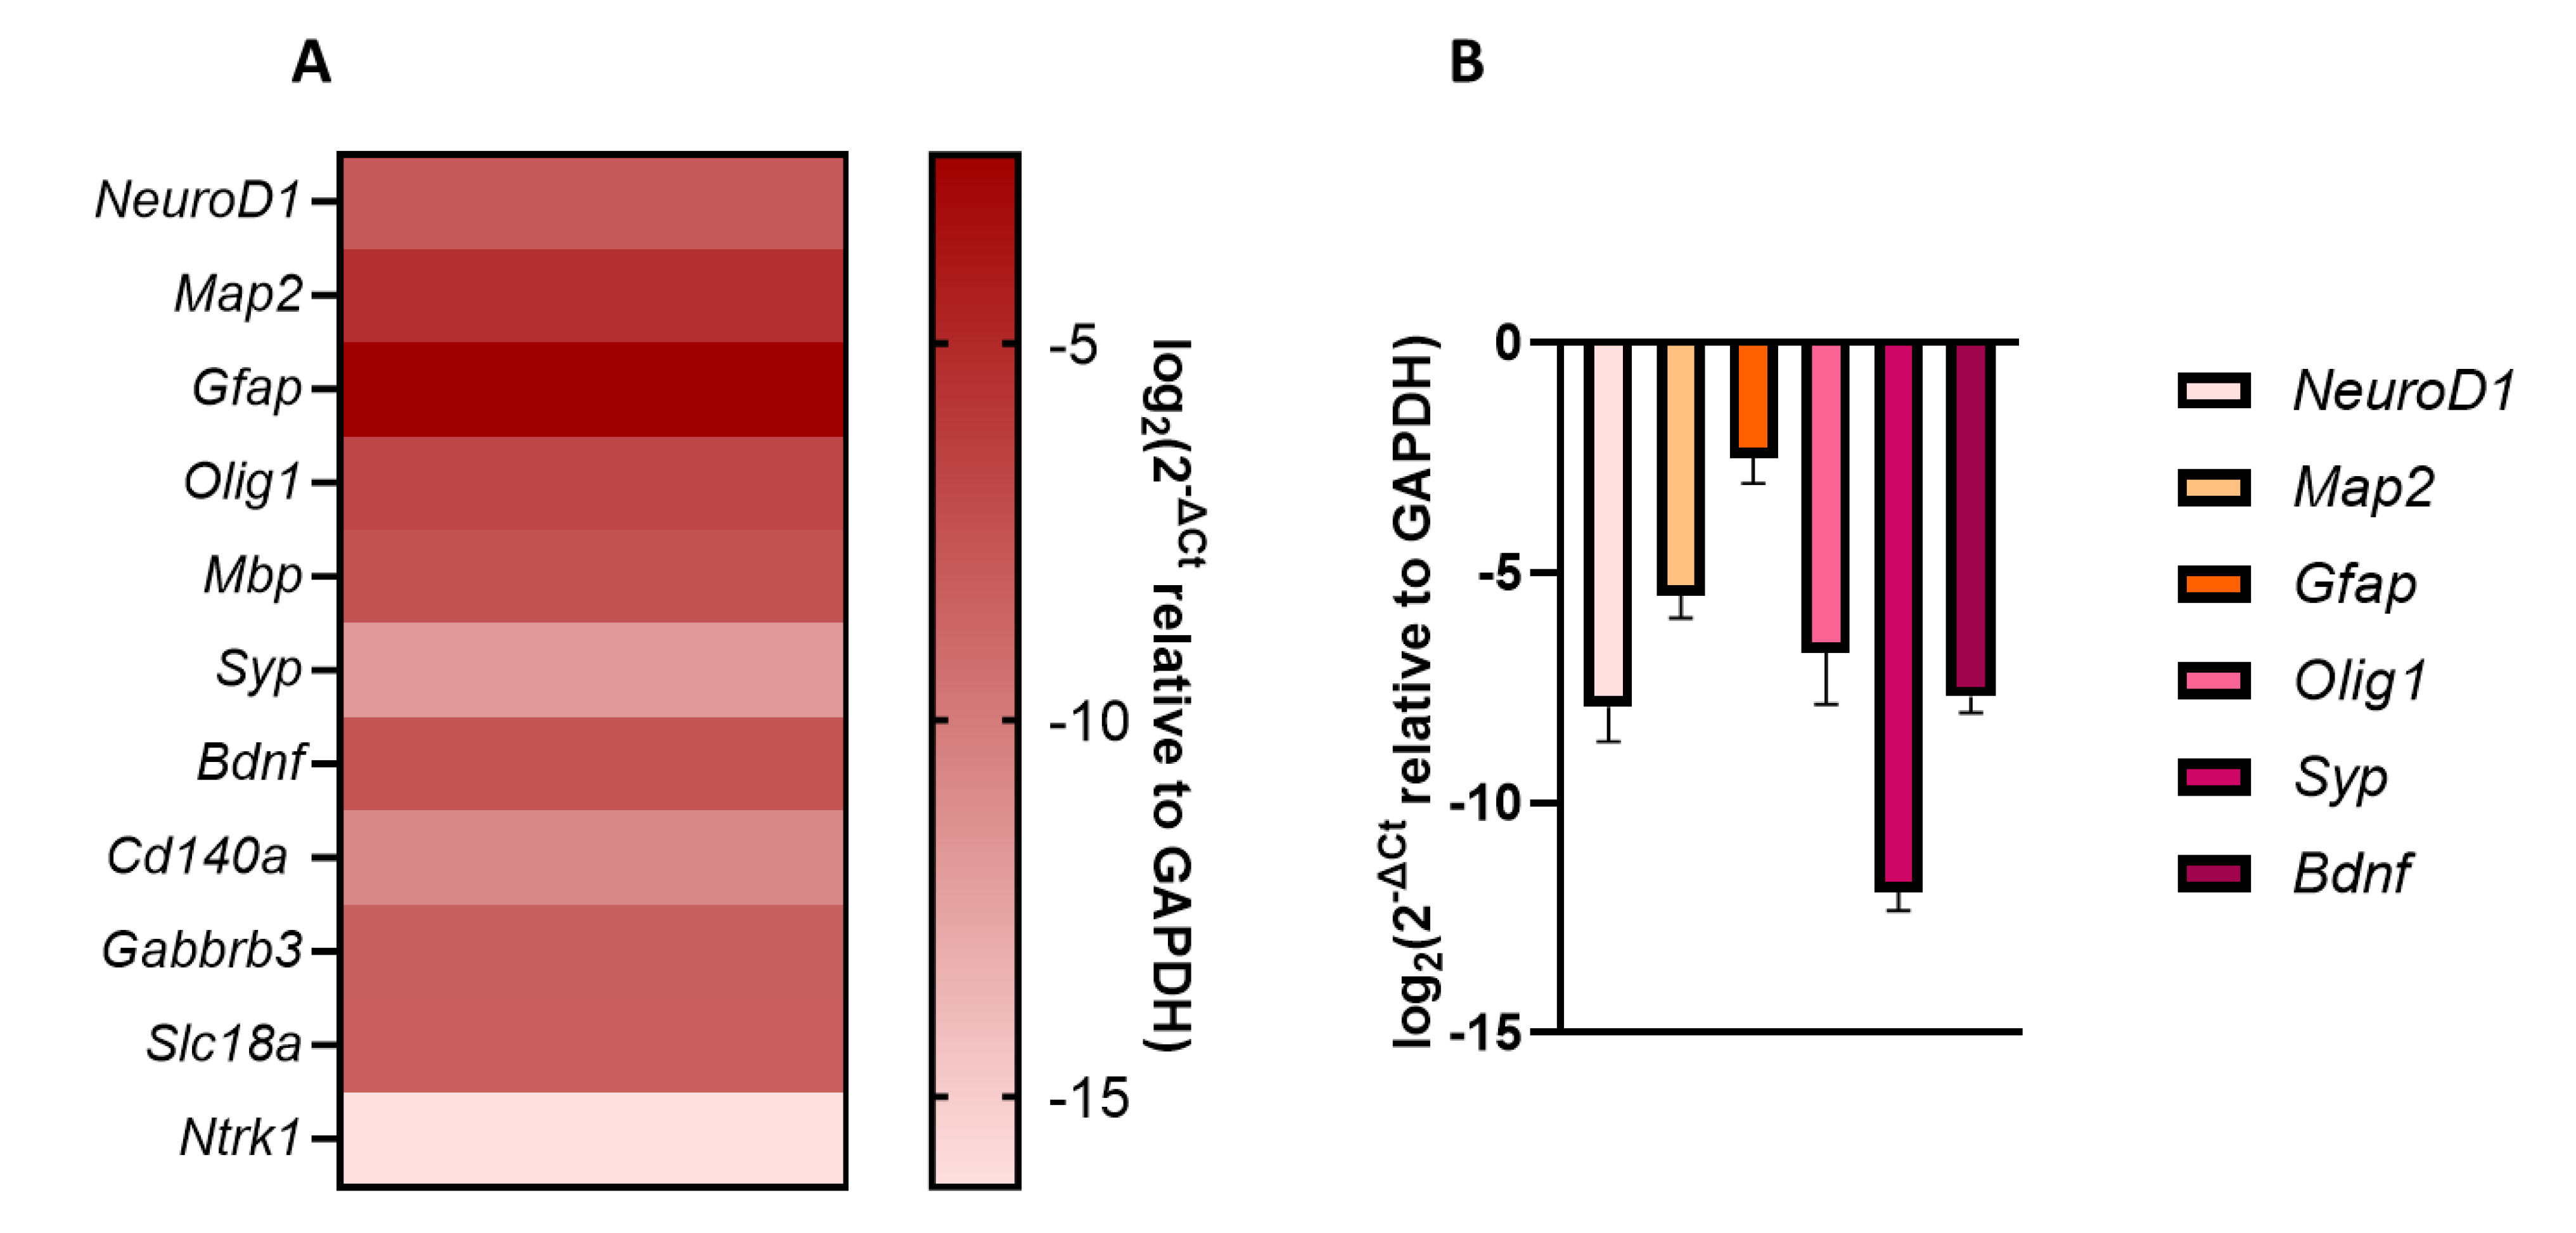
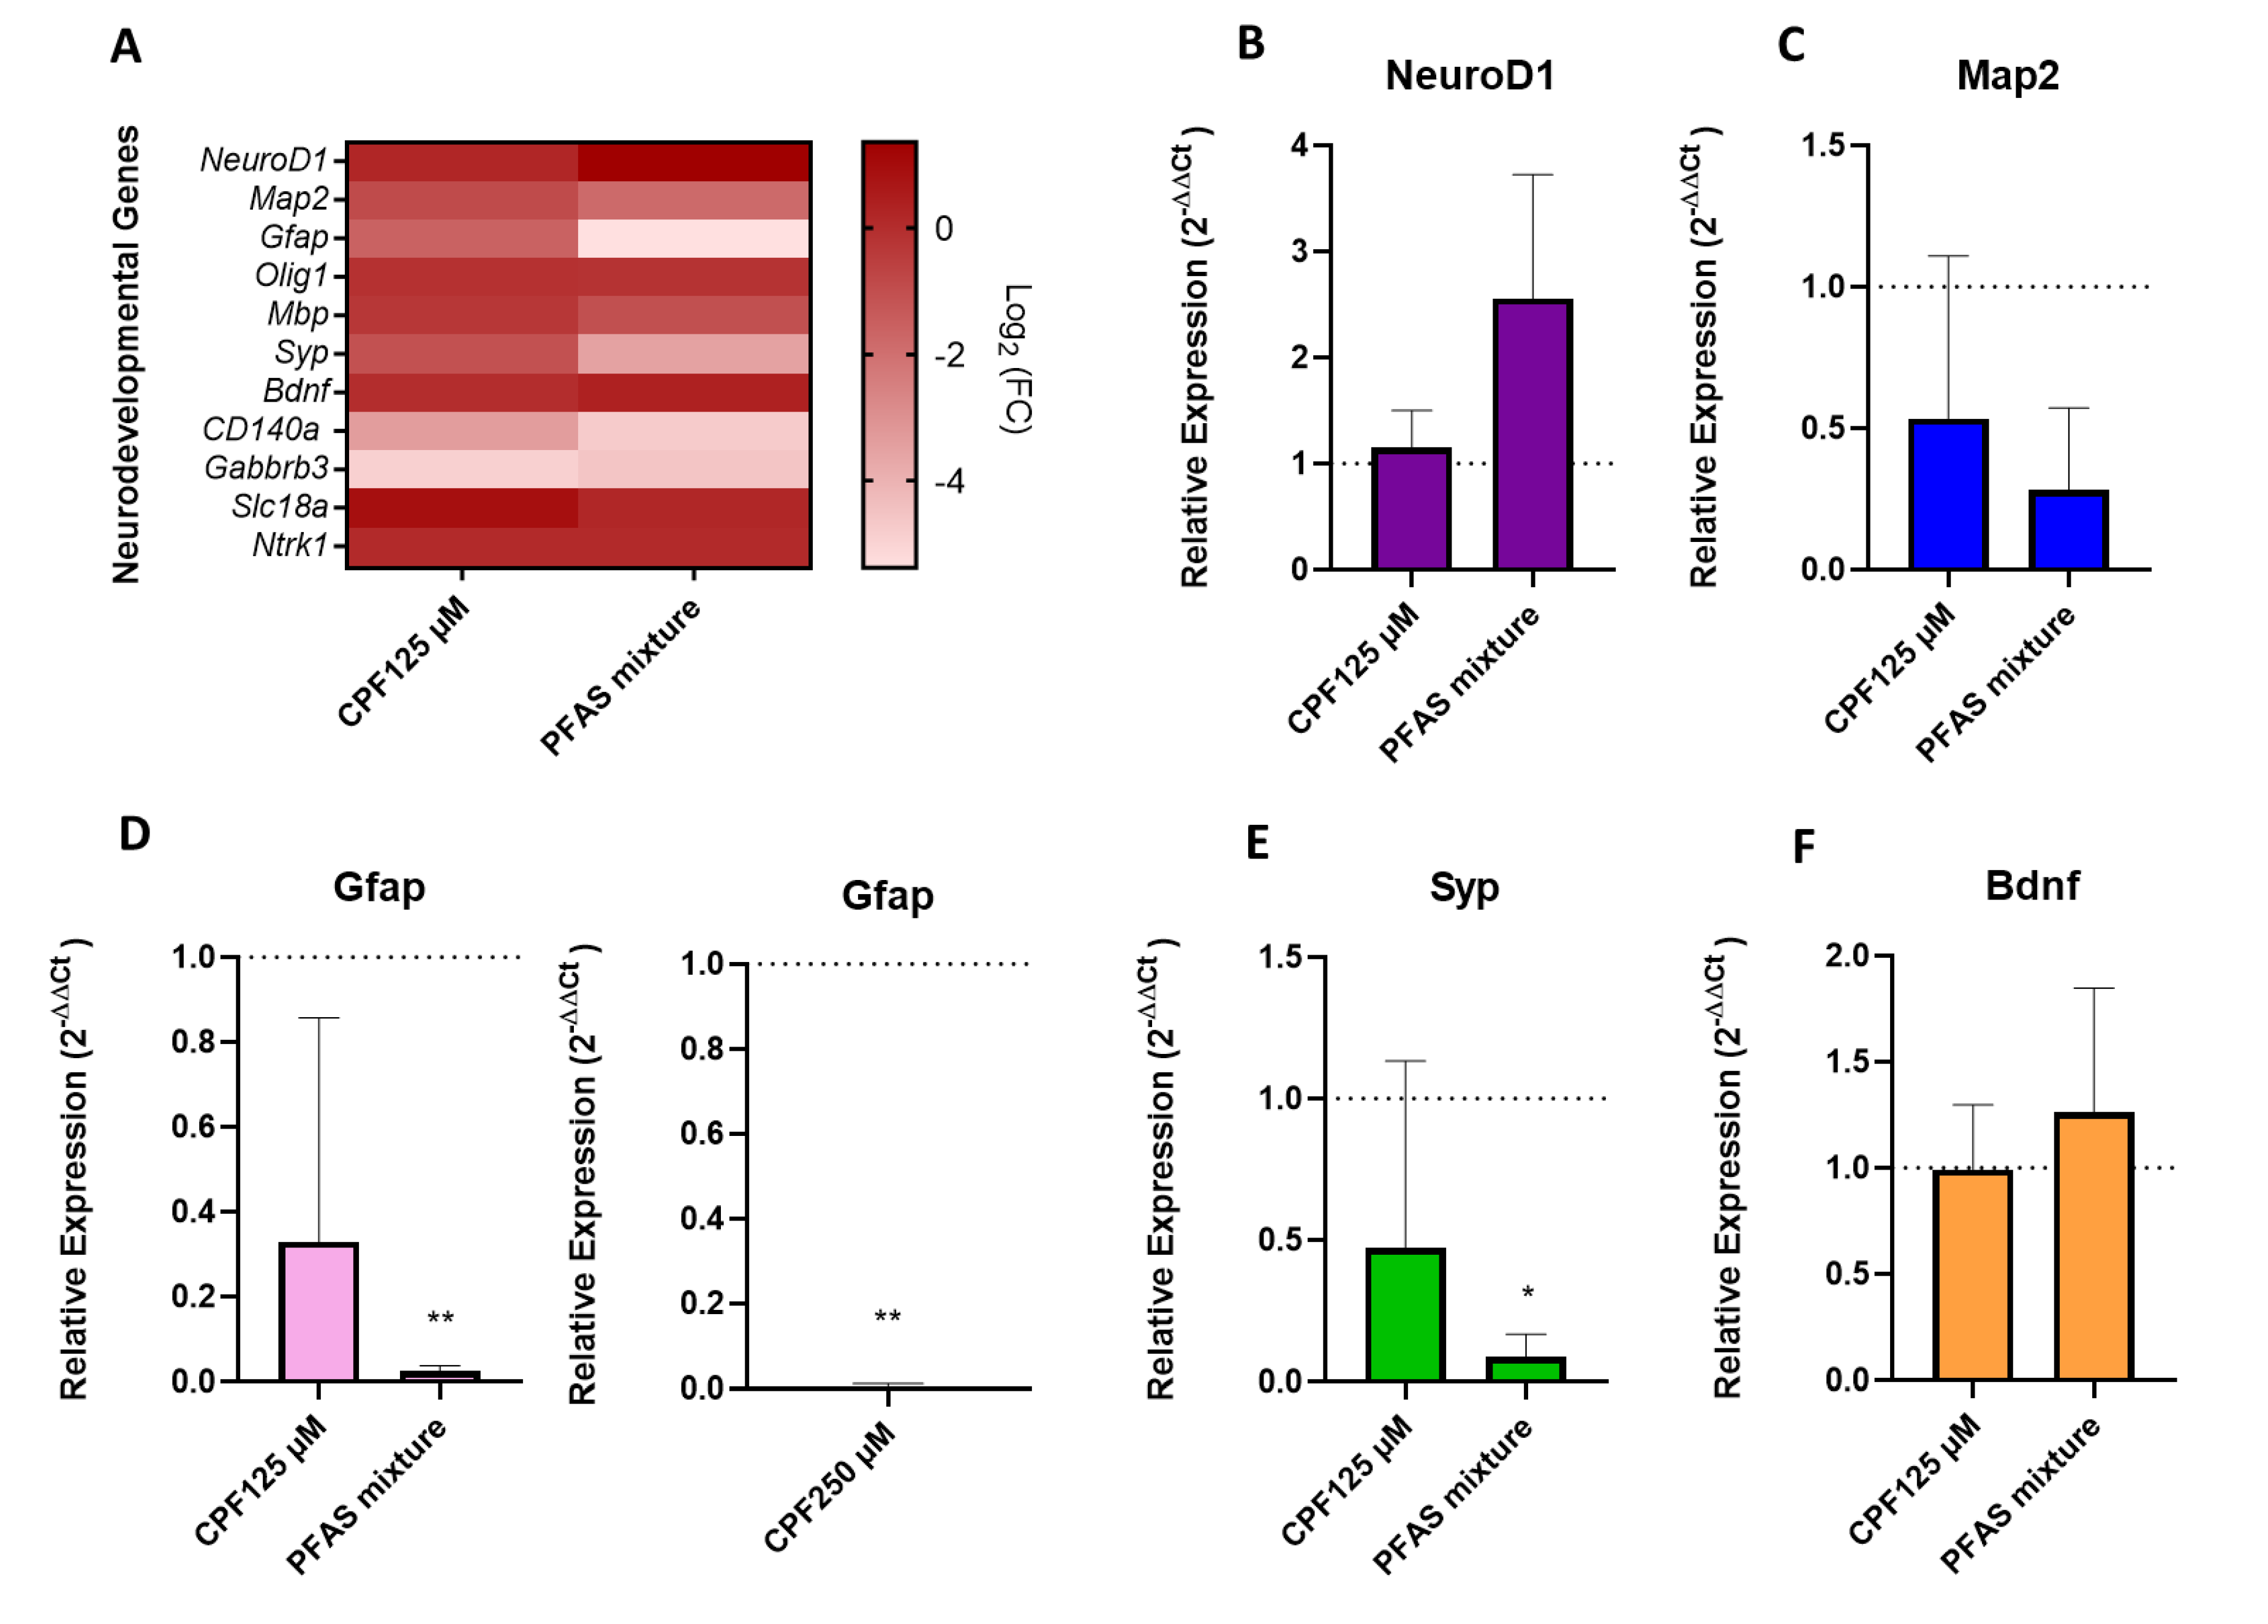
3.1.3. Basal Transcriptional Profiling of Neurodevelopmental Genes

To complement the phenotypic and structural characterization, we profiled the expression of a panel of neurodevelopmental genes by qPCR (Figure 6). The heatmap (Figure 6A) illustrates log₂(2–ΔCt relative to GAPDH) values for all detected genes, encompassing neuronal (Neurod1, Map2, Syp, Bdnf), astrocytic (Gfap), and oligodendrocytic markers (Olig1, Mbp), as well as genes related to neurotransmission and trophic signaling (Gabbr3, Slc18a, Ntrk1, Cd140a). Relative transcript levels spanned several orders of magnitude, reflecting heterogeneous lineage commitment within the neurospheres.
Quantitative bar plots were generated for genes with three biological replicates (Neurod1, Map2, Gfap, Olig1, Syp, and Bdnf; Figure 6B). Neurod1 and Map2 were consistently expressed at moderate levels, consistent with early neuronal commitment and dendritic specialization, respectively, in agreement with the presence of TUBB3⁺ neurons observed by flow cytometry and confocal imaging. Gfap expression confirmed astrocytic differentiation, while Syp and Bdnf transcripts indicated activation of synaptic and trophic programs.
Other transcripts (Mbp, Gabbr3, Slc18a, Ntrk1, Cd140a) were also detected but only in two biological replicates; therefore, they were shown descriptively in the heatmap but excluded from the quantitative bar plot. Their partial detection likely reflects early or partial lineage specification without full maturation, consistent with the three-week culture period. Notably, the absence of strong Mbp or Cd140a expression aligns with the later developmental timing of oligodendrocytic maturation in the cerebral cortex, which is not captured by short-term differentiation protocols [58,59,60,61].
Overall, core lineage markers (Neurod1, Map2, Gfap, Syp, Bdnf) were consistently detected across replicates, whereas Olig1 expression showed greater variability, consistent with its lower and more heterogeneous expression in neurospheres [58,59,60,61].
Taken together, these transcriptional data confirm that cortical neurospheres recapitulate key developmental programs, with active neuronal commitment, astrocytic differentiation, and initial synaptic maturation. The relative abundance of Gfap compared with neuronal markers indicates a prominent astrocytic contribution at this stage [54], while synaptic and trophic transcripts (Syp, Bdnf) support the emergence of functional neuronal networks [54]. Importantly, the detection of PSD95⁺ cells by flow cytometry further supports that neurospheres acquire both presynaptic (SYP) and postsynaptic (PSD95) features, indicating the initiation of synaptic maturation during the three-week differentiation period [54].

3.1.4. Proliferation Assay Under Growth Factor Conditions

To evaluate the proliferative responsiveness of cortical neurospheres, we monitored their growth in the presence or absence of epidermal growth factor (EGF) for 96 h (Figure 7). Under EGF⁺ conditions, neurospheres exhibited a progressive increase in diameter between 0 h, 48 h, and 96 h, reflecting active proliferation. In contrast, neurospheres cultured without EGF (EGF⁻) showed only limited size increase, with diameters remaining close to baseline levels. Quantification confirmed a significant difference between EGF⁺ and EGF⁻ conditions at 48 h and 96 h. These findings confirm that neurospheres respond to EGF as expected, demonstrating proliferative capacity under mitogenic stimulation. Importantly, this growth factor responsiveness provides a functional baseline for subsequent toxicant exposure experiments, ensuring that observed effects can be distinguished from normal growth dynamics.

3.2. Effects of CPF and PFAS on 3D Neuronal/Glial Culture

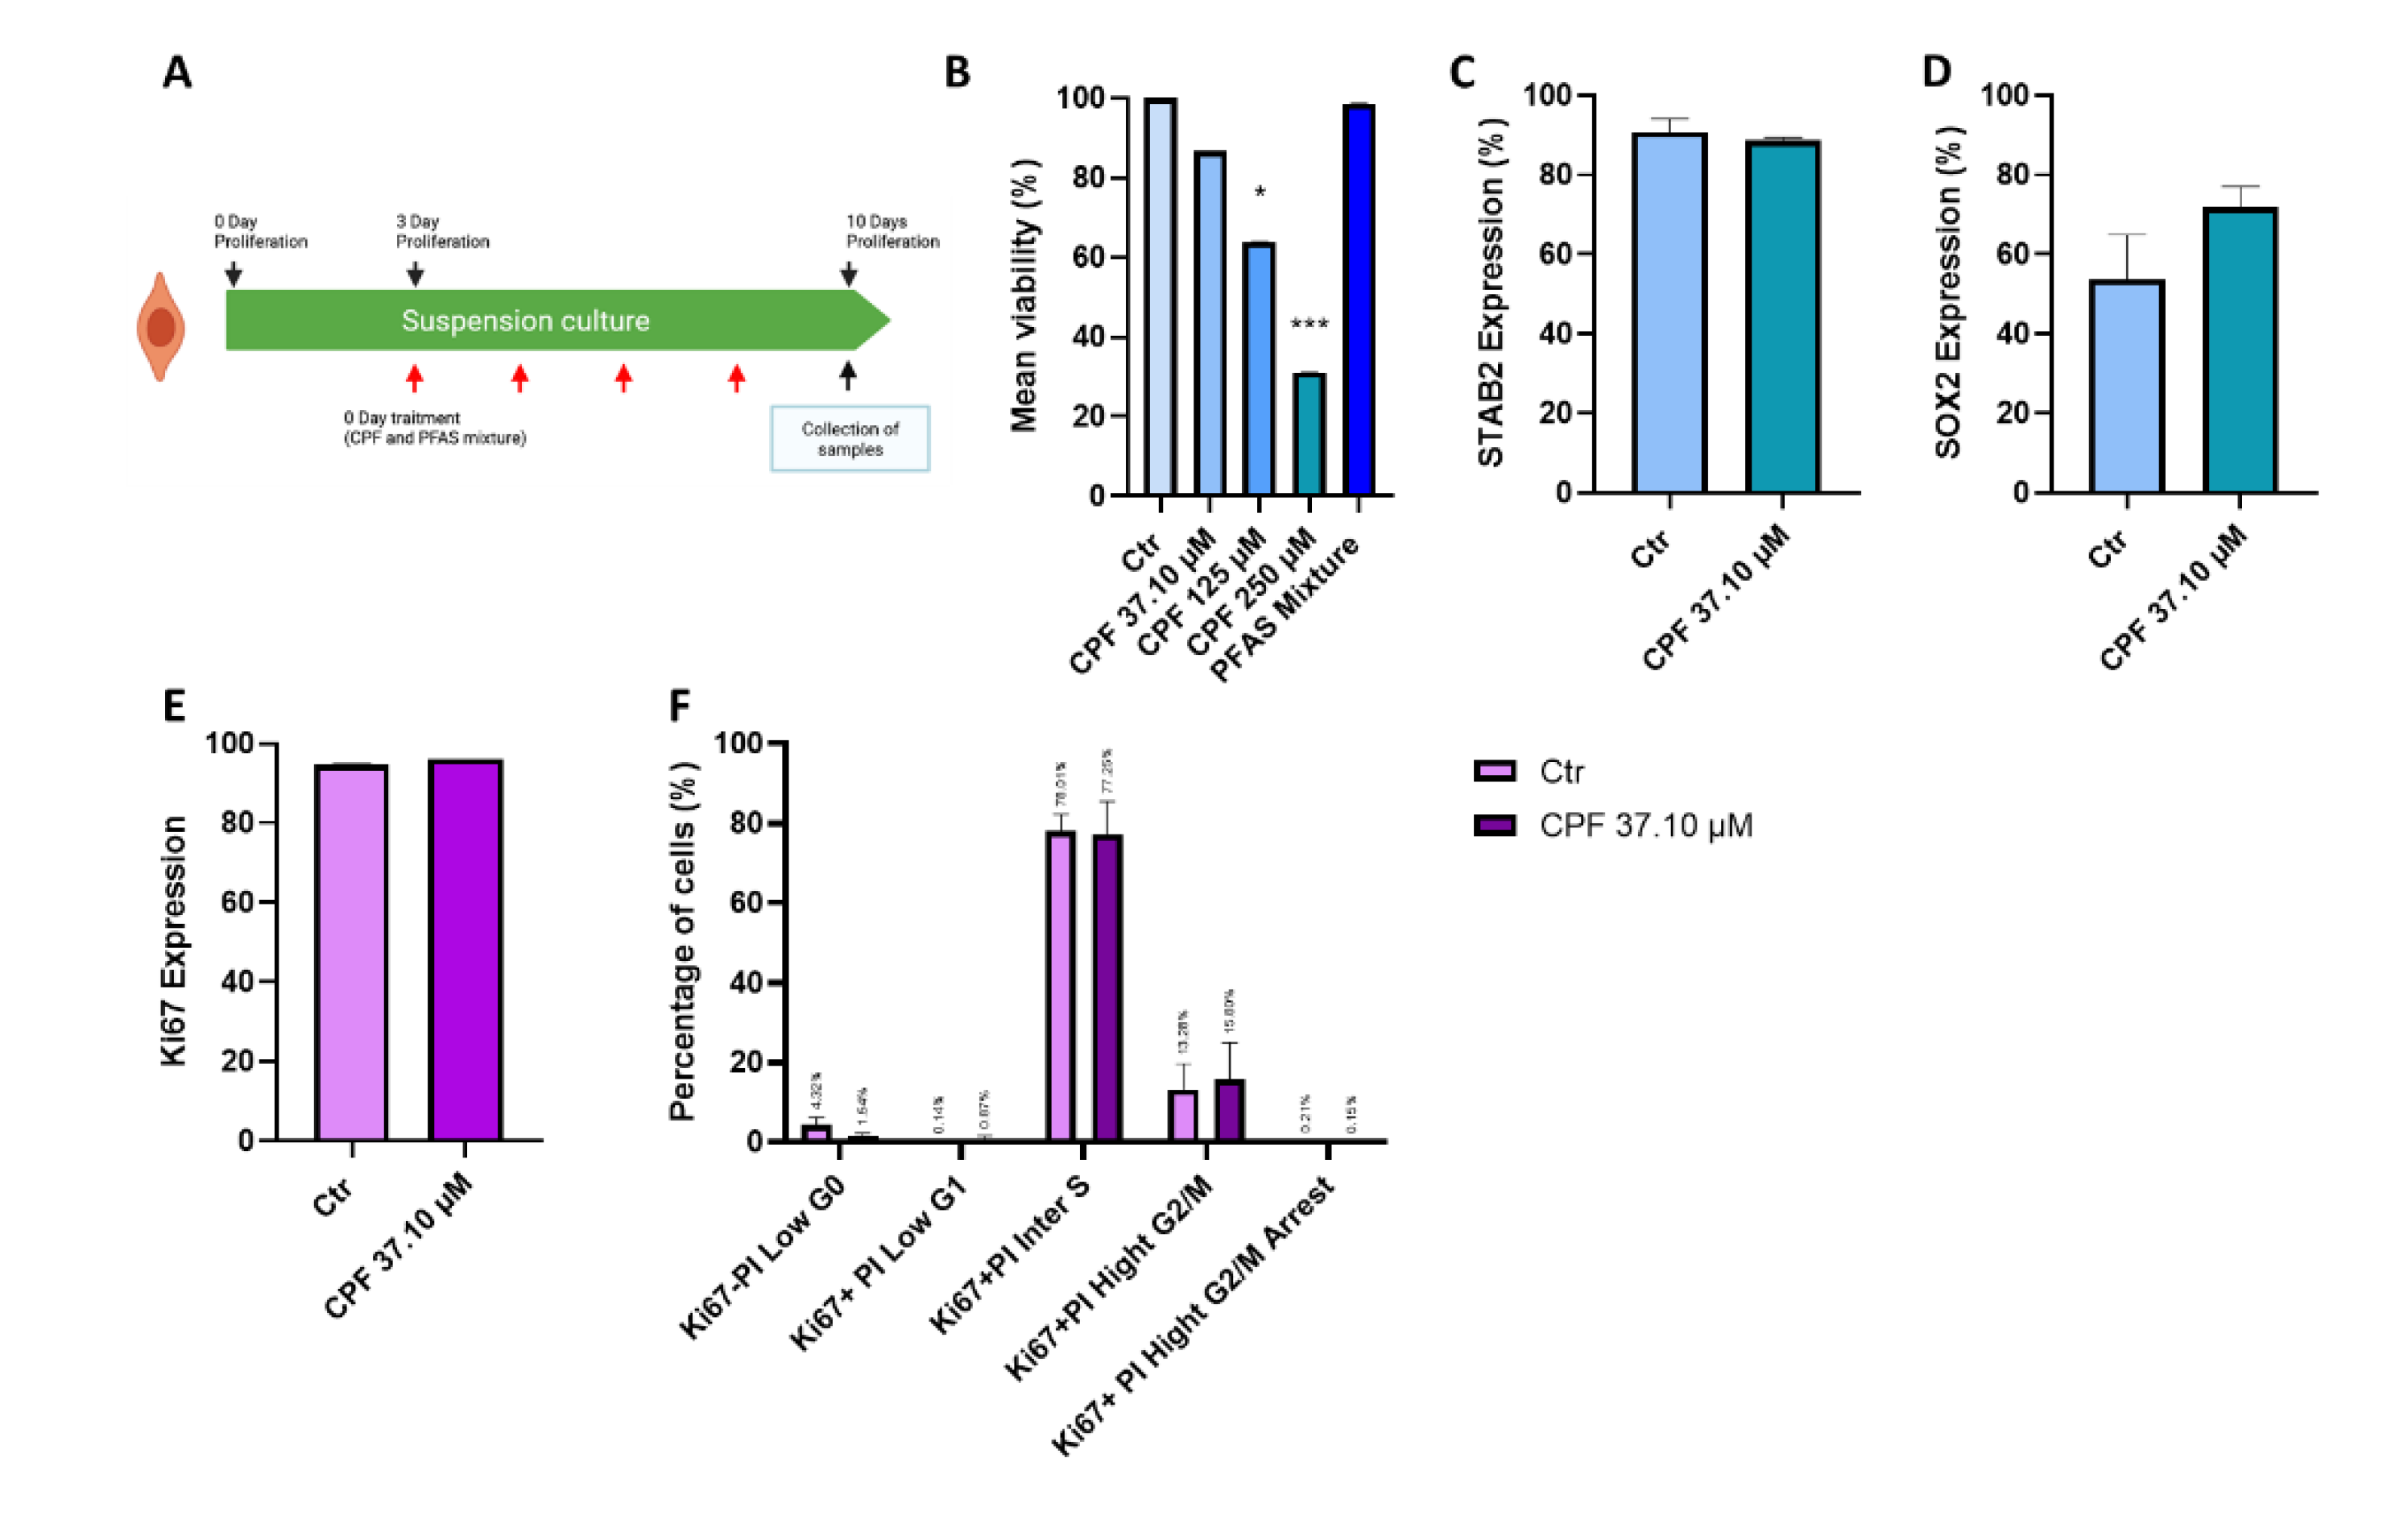
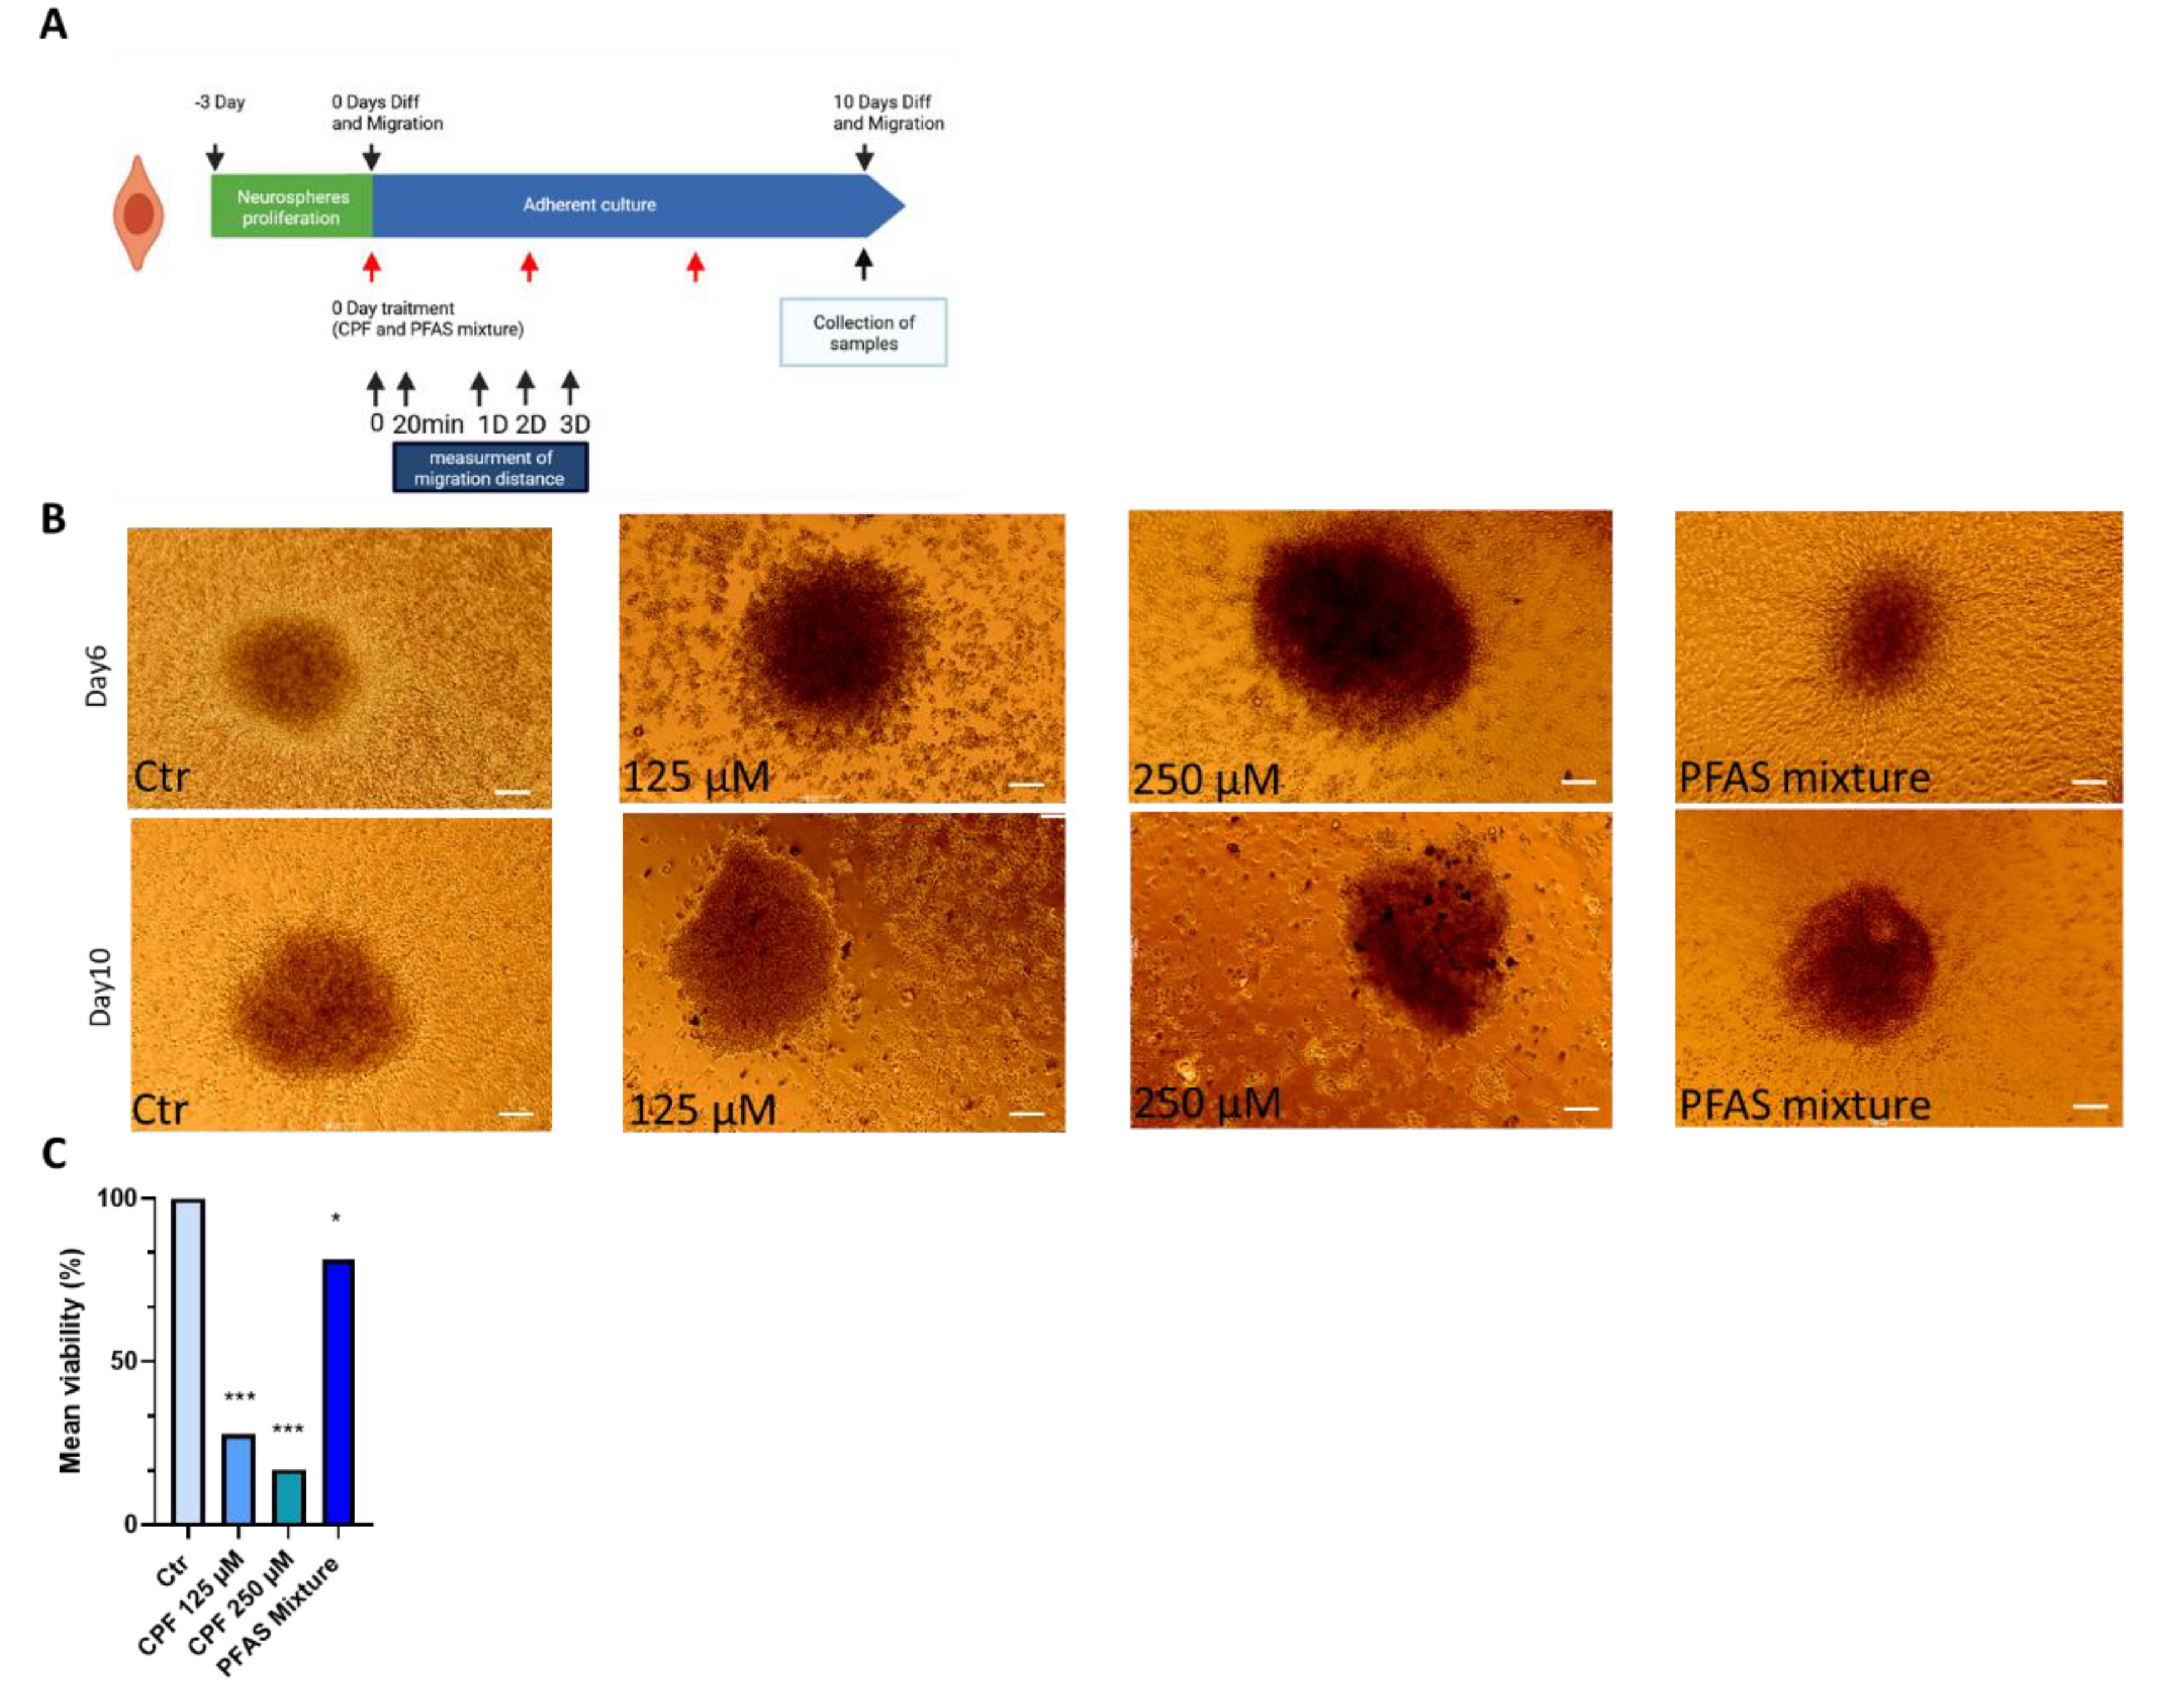
3.2.1. Effects of CPF and PFAS on Proliferative Neurospheres

To evaluate the sensitivity of proliferative neurospheres (undifferentiated stage) to toxicant exposure, cultures were treated with chlorpyrifos (CPF) or a PFAS mixture for 10 days (Figure 8A). Viability assays revealed a clear dose-dependent effect of CPF (Figure 8B), with significant cytotoxicity at 125 µM and 250 µM consistent with previous reports in neurosphere assays [62]. At 37.1 µM, CPF did not significantly reduce viability in our model, and PFAS exposure likewise yielded values comparable to controls.
Because higher CPF doses induced overt cytotoxicity, mechanistic analyses were restricted to the sub-toxic concentration (37.1 µM) to probe effects on stemness and proliferation. As PFAS did not significantly alter viability at this stage, marker expression (SOX2, SATB2, Ki67, and cell cycle) was not further assessed in PFAS-exposed proliferative neurospheres. Flow cytometry showed that the proportion of SOX2⁺ progenitors (Figure 8D) was largely maintained, with a consistent upward tendency across replicates. SATB2⁺ cortical neurons (Figure 8C) also remained stable. Similarly, Ki67 expression (Figure 8E) and cell cycle distribution assessed by Ki67/PI double staining (Figure 8F) showed no detectable deviations from controls.
Altogether, these findings demonstrate that CPF induces cytotoxicity only at high concentrations, whereas Sub-toxic CPF exposure preserved SOX2⁺ progenitors, with a tendency toward higher percentages across replicates. Cortical neurons identified by SATB2 were maintained, and proliferation markers (Ki67 expression and cell cycle distribution) remained stable under CPF exposure. PFAS did not significantly affect viability at this stage. As mechanistic analyses were focused on CPF as a reference neurotoxicant, marker expression (SOX2, SATB2, Ki67, and cell cycle) was not assessed for PFAS in proliferative neurospheres, but PFAS effects were evaluated in detail during the differentiation phase (section 3.2.2).

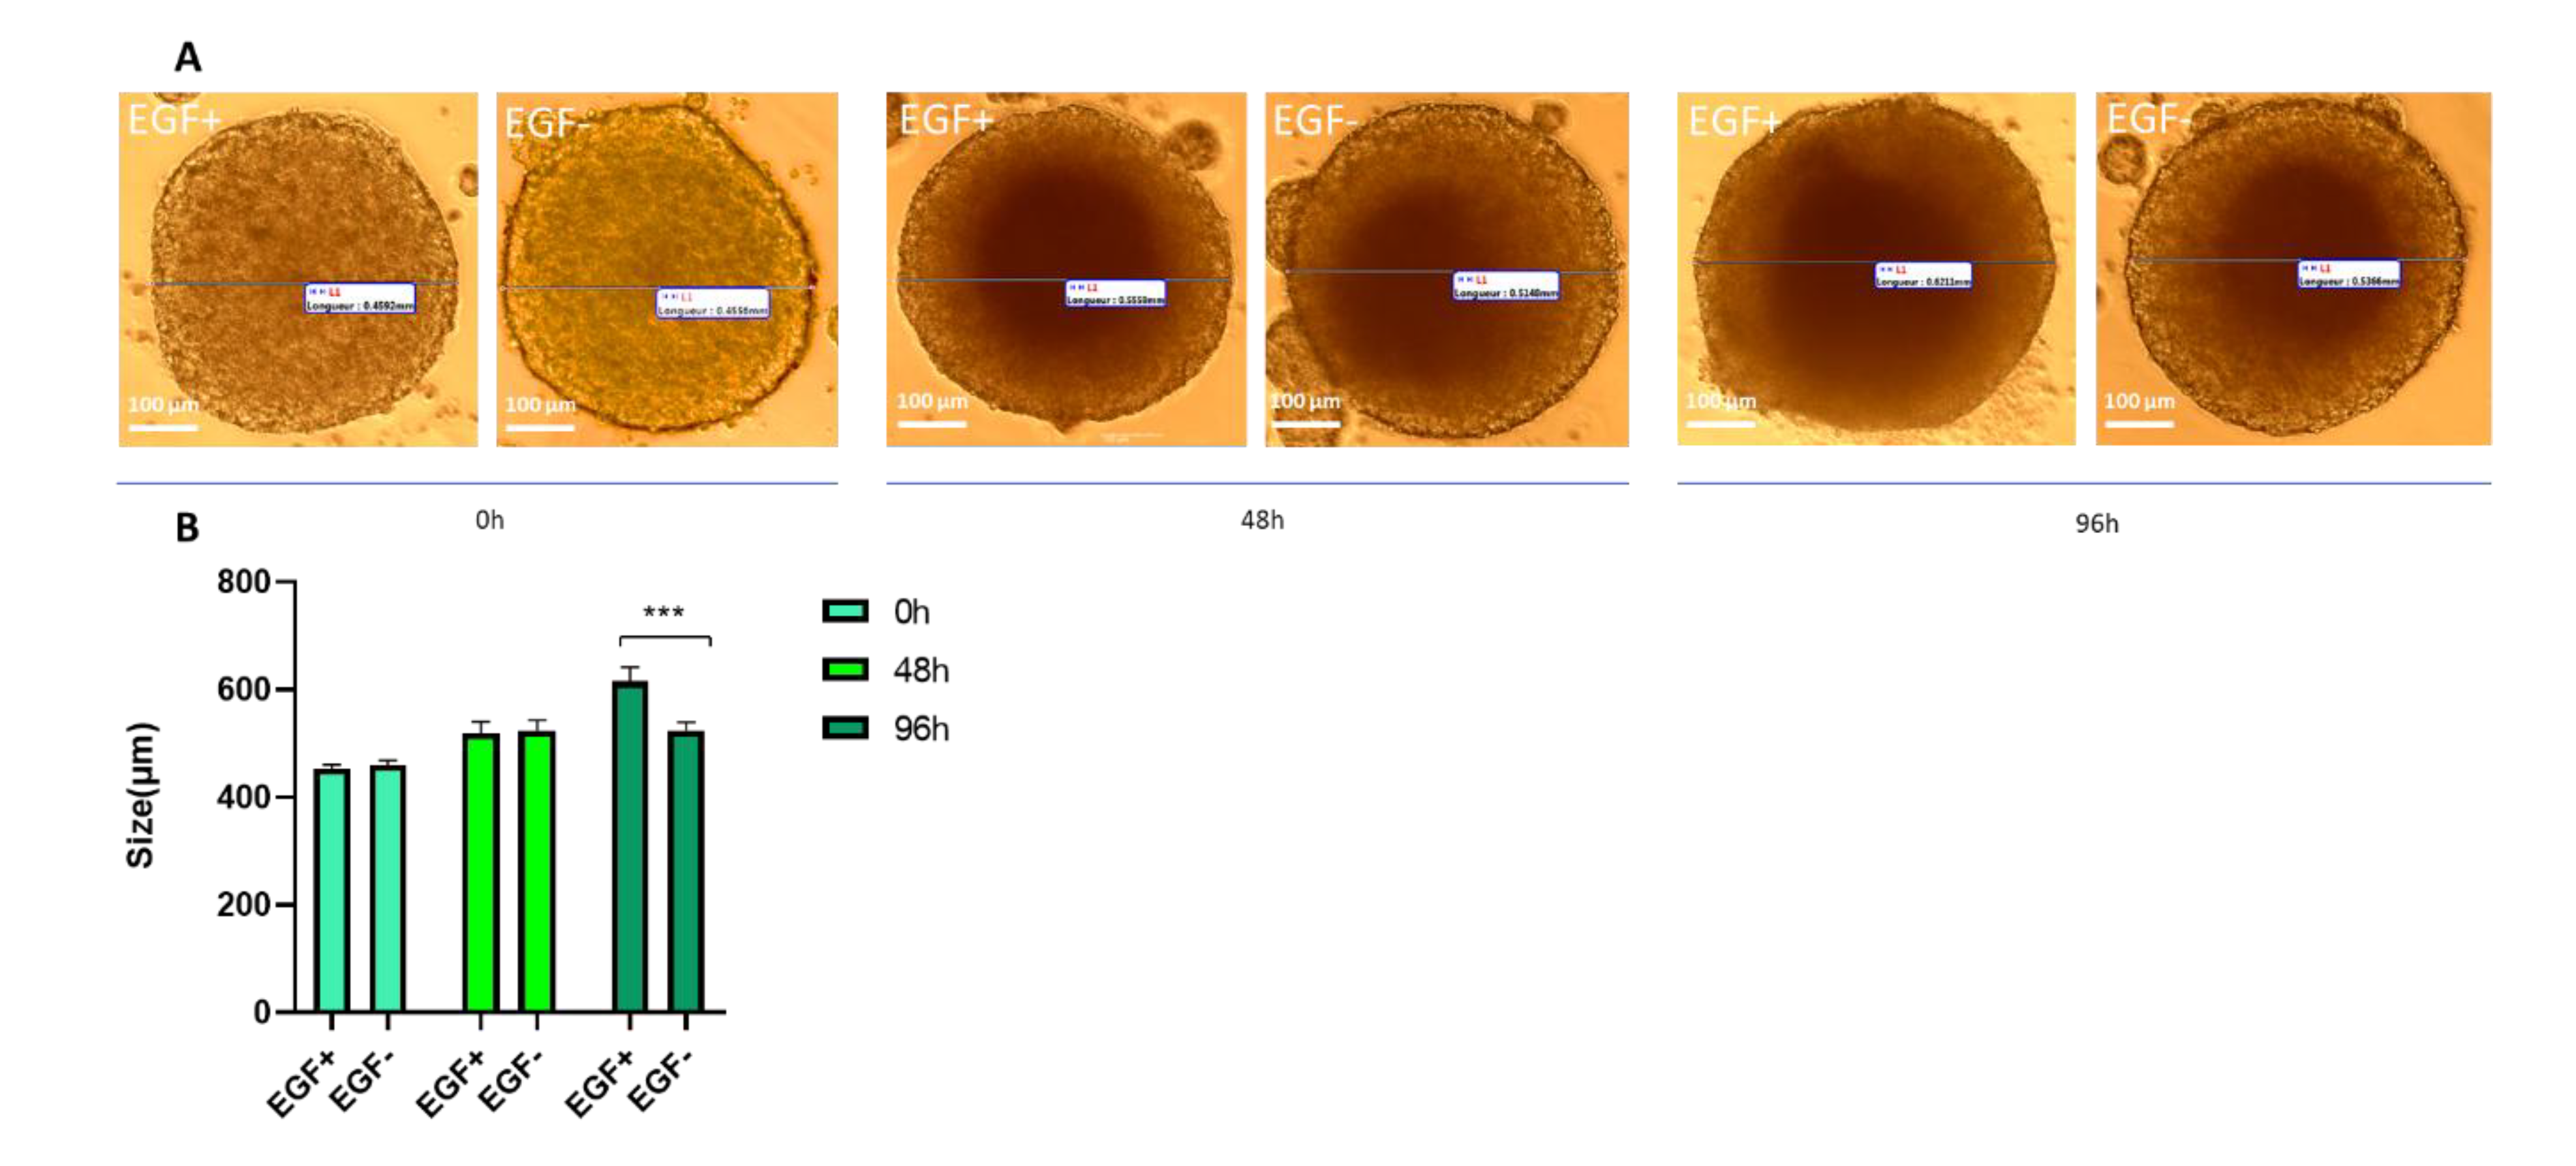
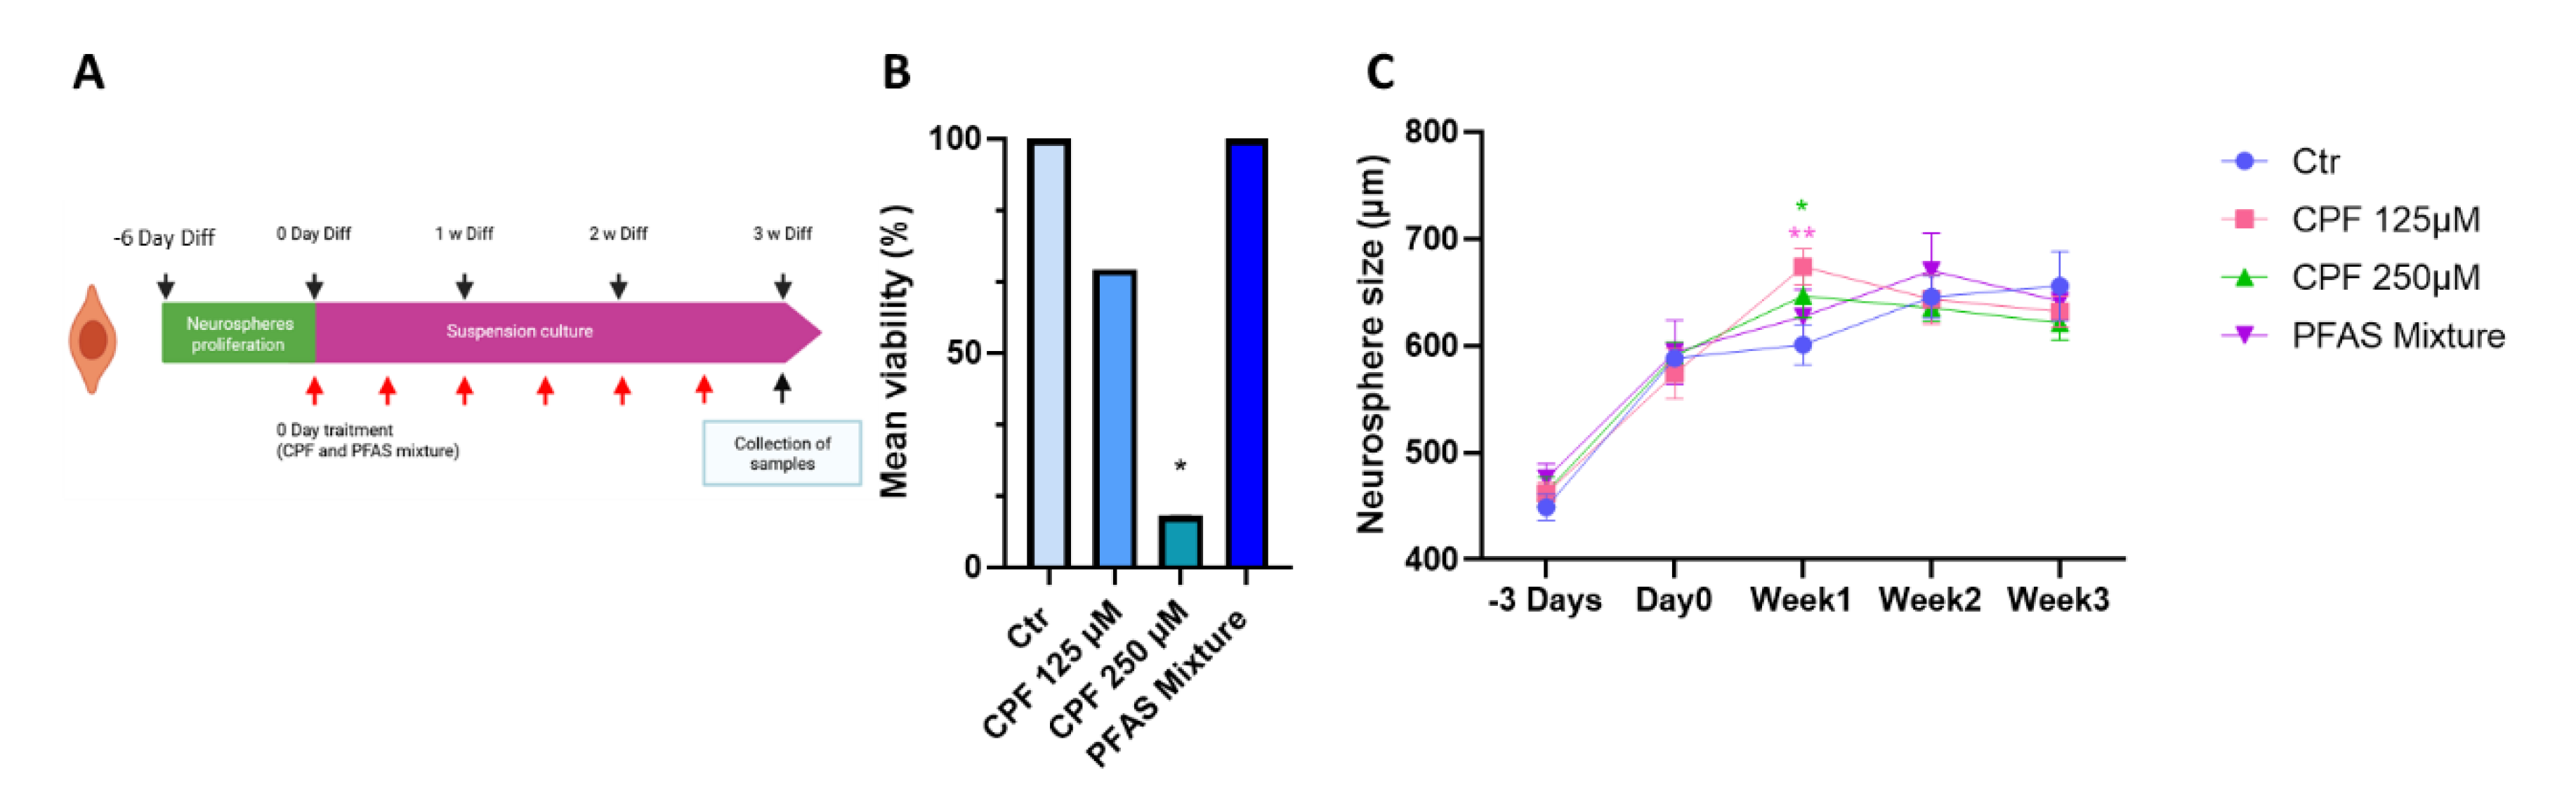
3.2.2. Effects of CPF and PFAS on Differentiated Neurospheres3.2.2.1. Effects of CPF and PFAS Mixture on Neurosphere Viability and Growth During Differentiation

The 37.1 µM CPF condition, identified as a probable sub-toxic concentration, was not further analyzed during differentiation or migration since it did not produce measurable viability changes in our preliminary assays.
To assess the long-term impact of toxicant exposure during differentiation, cortical neurospheres were treated with CPF (125 or 250 µM) or a PFAS mixture from day 0 and monitored for three weeks repeated exposure with medium renewal to mimic chronic conditions (Figure 9A). In controls, neurosphere diameter increased between Day 0 and Week 1, then reached a plateau phase (Figure 9C). Size kinetics were therefore tracked as a longitudinal, non-destructive readout to determine whether toxicants altered the early expansion phase—which reflects residual proliferation and process outgrowth after induction—and/or the timing of the plateau associated with maturation.
Cell viability measured at day 21 revealed a concentration-dependent effect of CPF, with a significant reduction at 250 µM. At 125 µM, CPF reduced viability to ~69.5% of control, which represents moderate cytotoxicity but did not reach statistical significance due to replicate variability. Importantly, this level remains above the OECD overt cytotoxicity threshold (~55% relative survival), and was therefore not considered maximally cytotoxic. PFAS exposure induced only a modest but significant decrease compared with controls(Figure 9B).
Growth kinetics further highlighted divergent trajectories across treatments (Figure 9C). Two-way repeated measures ANOVA showed a strong effect of time and a significant treatment × time interaction, indicating that growth trajectories differed across groups, whereas the overall main effect of treatment was not significant. Post-hoc Tukey’s tests indicated that at Week 1, both CPF125 and CPF250 spheroids were significantly larger than controls. By Week 2, none of the treatment groups differed from control. By Week 3, CPF-treated spheroids were no longer enlarged, with CPF250 showing a tendency toward reduced size relative to controls. PFAS-treated spheroids did not differ significantly from controls at any time point.
Within-group time-course analyses confirmed these patterns. Control neurospheres grew significantly from pre-exposure (–3 days) to Week 1 but plateaued thereafter. CPF125 spheroids also expanded from Day 0 to later time points, with a modest additional increase between Week 1 and Week 3. In contrast, CPF250 spheroids failed to grow significantly beyond Week 1, indicating growth arrest. PFAS-treated spheroids followed a trajectory similar to controls, with early expansion until Week 1 and stabilization thereafter.
Together, these results demonstrate that CPF exerted a biphasic effect during differentiation, with initial enlargement at 125 µM followed by growth arrest and reduced viability at 250 µM, in agreement with previous reports of CPF-induced toxicity at high micromolar concentrations in neurosphere models [30]. Importantly, the moderate reduction in viability at 125 µM (~69.5% of control) remained above the OECD overt cytotoxicity threshold of 55% relative survival [63]. PFAS exposure induced only a modest but significant viability reduction without altering growth dynamics, consistent with environmentally relevant exposure levels.
3.2.2.2. Effects of CPF and PFAS Mixture on Neurosphere Migration and Viability
To investigate the impact of chronic exposure on neuronal–glial dynamics, migration assays were performed under repeated exposure with medium renewal to mimic chronic conditions (Figure 10A). Bright-field imaging revealed marked differences in radial migration across treatments. Control neurospheres displayed regular and homogeneous migration by Day 6, which further expanded by Day 10. In contrast, CPF-exposed neurospheres showed dose-dependent impairments: at 125 µM, migration was visibly reduced and spheroids retained a denser core, whereas at 250 µM, migration was strongly suppressed, with disrupted borders and limited cell dispersal. PFAS exposure also restricted migration, although the effect was less pronounced than that observed with CPF.
Cell viability quantified at Day 10 confirmed significant cytotoxicity under CPF exposure, while PFAS induced a milder but significant reduction (Figure 10B). Notably, the magnitude of toxicity observed in the migration assay was greater than that detected in viability assays on proliferative neurospheres, where PFAS showed no effect and CPF cytotoxicity was restricted to high concentrations. Compared with differentiated neurospheres assessed at 21 days, migration measured at Day 10 revealed CPF- and PFAS-induced impairments that were not as apparent in bulk viability assays.

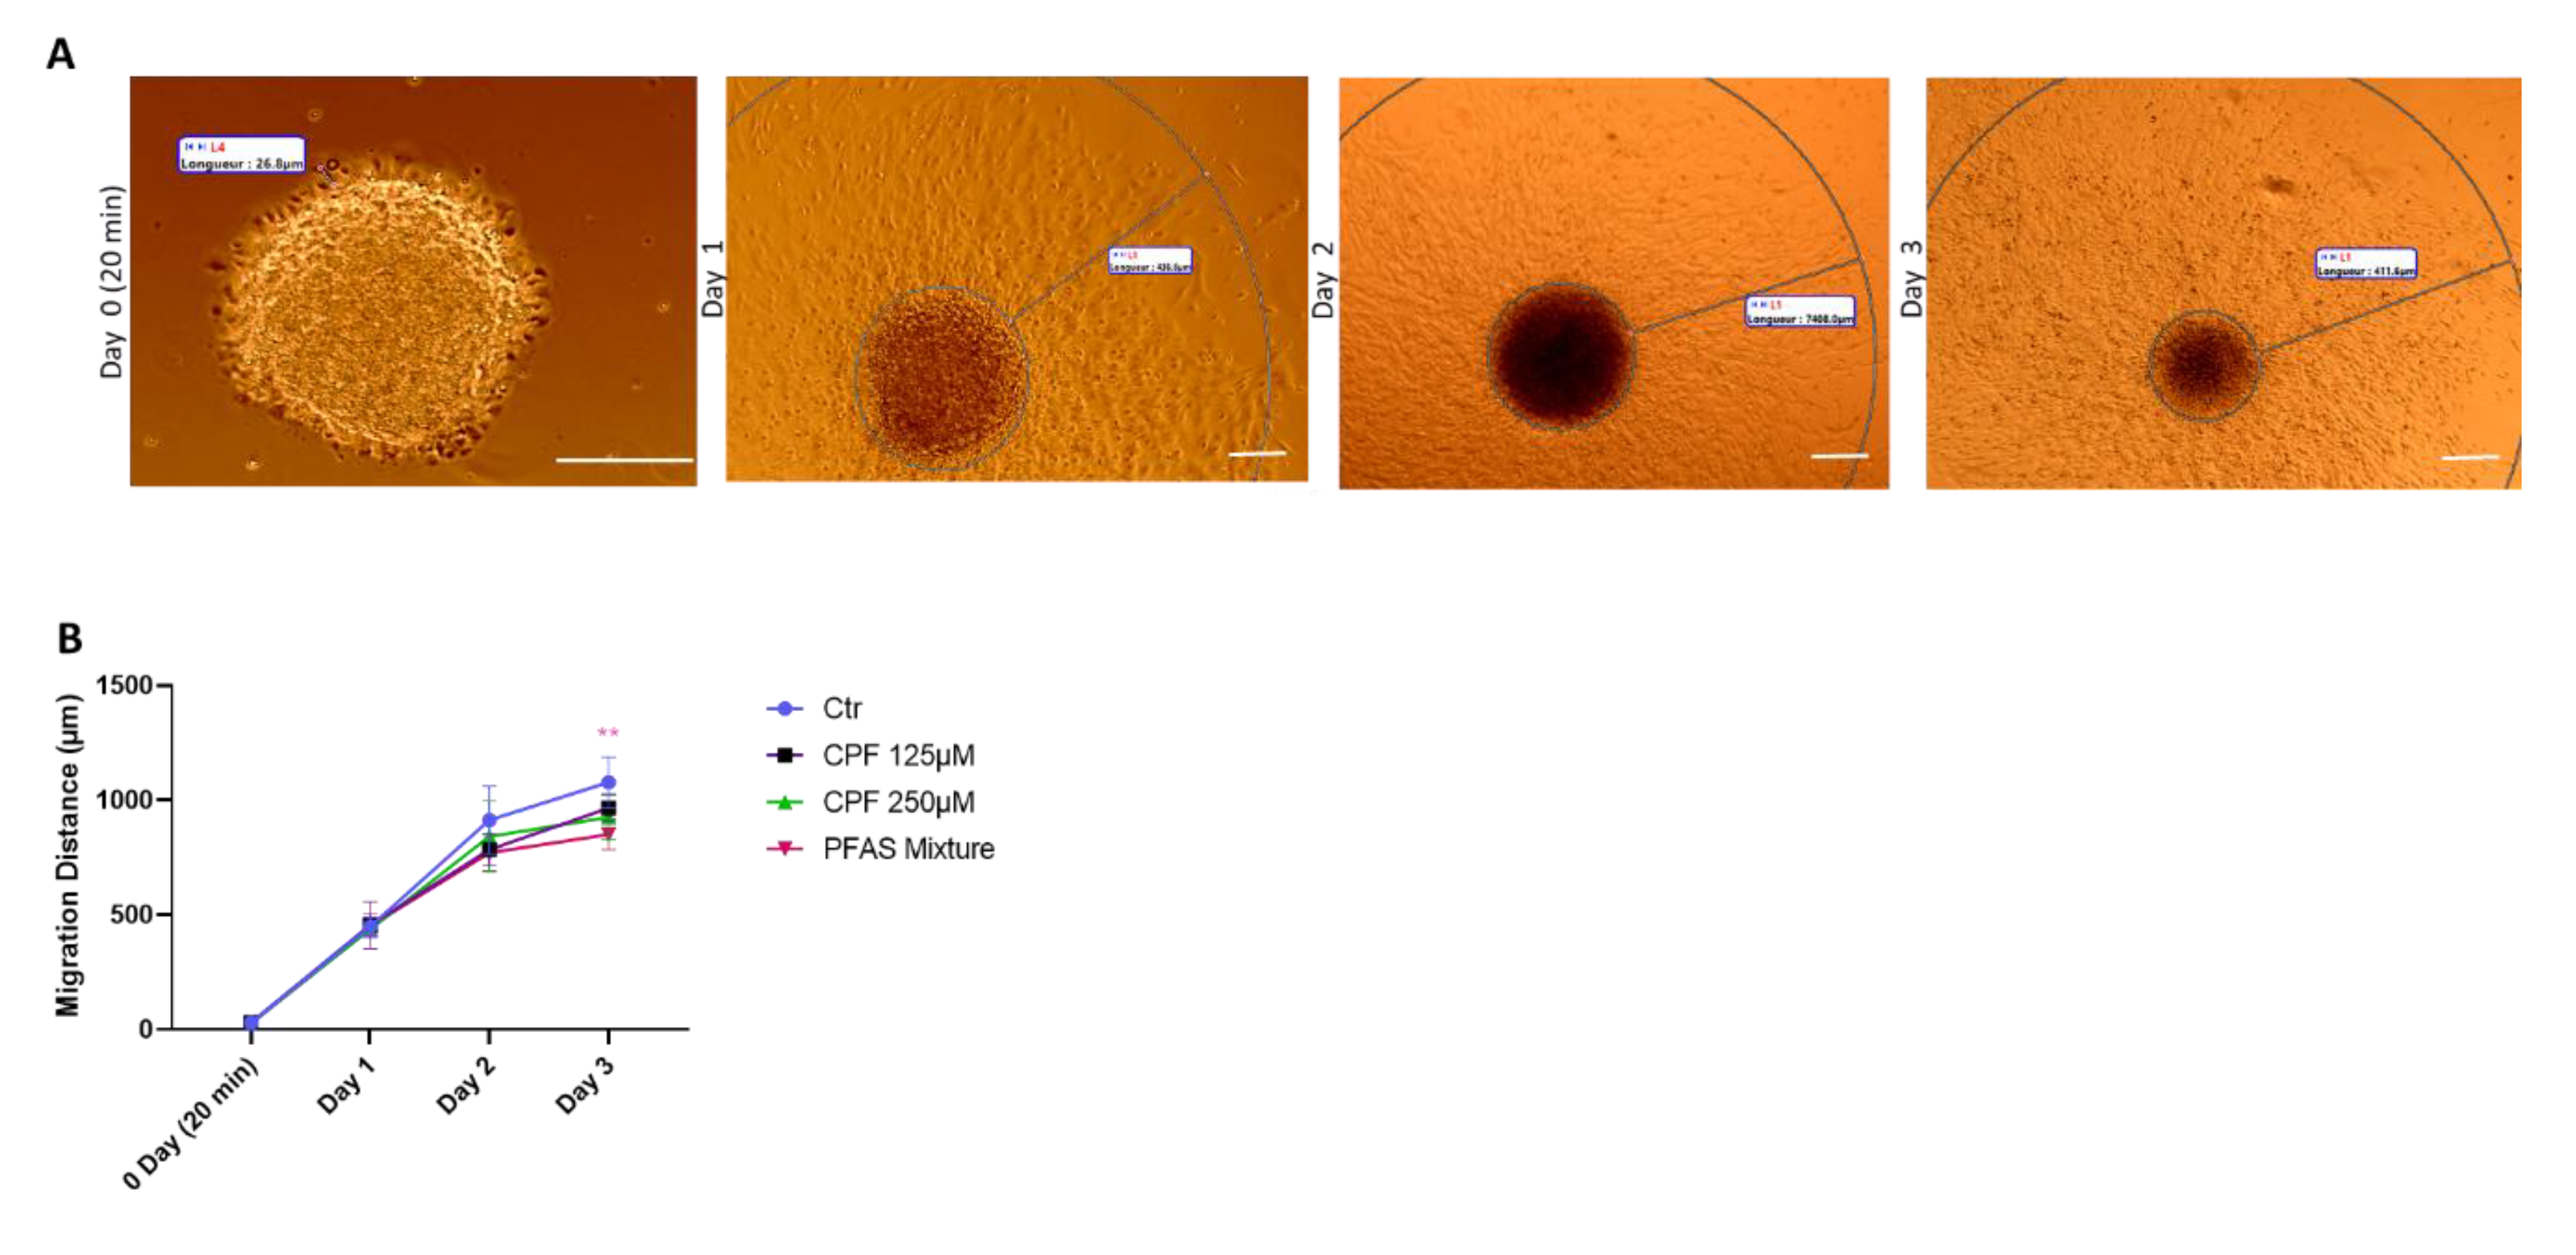
3.2.2.3. Quantitative Analysis of Early Radial Migration Dynamic

Radial migration was quantified during the first three days of differentiation under repeated exposure with medium renewal (Figure 11A–B). In controls, migration distance increased sharply between Day 0→1 (p < 0.0001, paired t-test) and Day 1→2 (p < 0.01), but then reached a plateau between Day 2→3 (ns). CPF125-treated neurospheres followed a similar early pattern (Day 0→1, p < 0.001; Day 1→2, p < 0.001), but unlike controls, they continued to expand between Day 2→3 (p < 0.05). However, despite this delayed plateau, the final migration distance at Day 3 was not significantly different from controls. CPF250 exposure also induced significant migration between Day 0→1 (p < 0.01) and Day 1→2 (p < 0.01), but no further increase thereafter, closely mirroring the control plateau. At Day 3, CPF250 neurospheres showed a downward trend versus control (Welch’s t-test, p = 0.02), but this did not remain significant after correction for multiple comparisons (Tukey’s post-hoc test).
PFAS exposure induced significant migration during the first two days (Day 0→1, p < 0.0001; Day 1→2, p < 0.0001), but migration prematurely arrested between Day 2→3 (ns). At Day 3, PFAS significantly reduced migration compared with both control (p < 0.01) and CPF125 (p < 0.05, Tukey’s test).
Together, these results indicate that CPF and PFAS differentially affect radial migration dynamics. CPF125 delayed the plateau phase without altering final migration distance, CPF250 did not exert robust effects, and PFAS consistently impaired migration by prematurely halting expansion and reducing final migration distance.
3.2.2.4. CPF and PFAS Mixture Differentially Affect Neuronal and Glial Gene Expression in Differentiated Neurospheres
To further investigate the molecular underpinnings of CPF- and PFAS-induced effects, we assessed the expression of neurodevelopmental genes by qPCR after 21 days of differentiation. Heatmap visualization revealed distinct transcriptional responses between treatments (Figure 12A). CPF at 125 µM did not significantly alter most markers but showed a trend toward reduced Gfap expression. At the higher concentration (250 µM), CPF significantly suppressed Gfap levels (Figure 12D–E), indicating impaired astrocytic maturation at cytotoxic doses. PFAS exposure significantly downregulated both Gfap and Syp, pointing to dual effects on astrocytic and synaptic programs (Figure 12D, F). By contrast, Neurod1, Map2, and Bdnf remained unaffected (Figure 12B–C, G), suggesting preserved neuronal commitment and trophic signaling under these conditions. Additional transcripts (Mbp, Gabbr3, Slc18a, Ntrk1, and Cd140a) were detected but only in two biological replicates; these are presented descriptively in the heatmap (Figure 12A) and excluded from quantitative analysis due to insufficient power. Notably, inclusion of CPF250 µM was limited to Gfap because of excessive variability or lack of replicates for other markers at this concentration. Overall, these results demonstrate that CPF and PFAS disrupt neurodevelopmental gene programs in distinct ways: CPF primarily reduces astrocytic maturation at high concentrations, whereas PFAS affects both astrocytic (Gfap) and synaptic (Syp) markers without overt cytotoxicity, revealing lineage-specific transcriptional vulnerabilities.

4. Discussion

The present study aimed to validate the neurosphere assay (NSA) as part of the DNT in vitro battery, combining baseline characterization with toxicant testing under environmentally relevant exposures. Previous reports have shown that neurosphere models can recapitulate key developmental processes such as proliferation, neuronal and glial differentiation, migration, and synaptogenesis, making them promising tools for developmental neurotoxicity assessment [14,54,57,64,65,66,67]. By aligning our observations with mechanistic insights from in vivo corticogenesis and other in vitro studies, we highlight the translational relevance of NSA endpoints and their potential integration into regulatory new approach methodologies (NAMs) [68,69,70,71,72].
Our multiparametric baseline characterization confirmed that the NSA reproduces key lineage dynamics over a three-week differentiation period, with progenitors (SOX2⁺), astrocytic precursors (GFAP⁺), immature neurons (TUBB3⁺), and post-mitotic cortical neurons (SATB2⁺) coexisting alongside transitional subpopulations. This pattern is consistent with rodent and human neurosphere studies describing heterogeneous yet developmentally ordered differentiation [46,73,74,75,76]. Confocal imaging further highlighted the temporal dynamics of differentiation: compact, cell-dense neurospheres at week one, peak neuronal density and extensive neuron–glia interconnection at week two, and more integrated neuritic networks at week three. Automated fluorescence microscopy and confocal imaging allow quantification of GFAP+ and TUBB3+ populations, revealing dynamic changes in marker expression as neurospheres differentiate. For example, neurospheres differentiated for several days show both markers, with proportions shifting over time [77,78]. The apparent reduction of neuronal soma at week three likely reflects redistribution into interconnected neuritic meshes rather than neuronal loss, consistent with persistent expression of Neurod1, Map2, and Syp, a phenomenon previously observed in maturing neural networks [79,80]. Synaptic maturation was evidenced by the progressive accumulation of Synaptophysin (SYP) puncta and the detection of PSD95⁺ cells, while qPCR confirmed stable expression of Neurod1, Map2, Gfap, Syp, and Bdnf. However, oligodendrocytic markers Olig1 and Mbp show weak and variable expression after three weeks of differentiation, reflecting the later onset of oligodendrocyte maturation and myelination in cortical development. This timing aligns with in vivo studies, where Olig1 and Mbp expression increases as oligodendrocyte precursor cells mature and myelination begins, typically after neuronal and astrocytic lineages are established [58,59,60,61]
Importantly, embedding assays revealed thin outward GFAP⁺ filaments at week one, consistent with glial-driven motility. GFAP is a key intermediate filament protein in astrocytes, providing structural support for process extension and modulating cell shape and movement during development and migration [81,82]. This migration transitioned into a dense rim at the spheroid surface under Geltrex confinement by week two, whereas adherent cultures better captured the radial expansion of migration fronts. Finally, the proliferation assay confirmed that neurospheres require mitogenic signaling for sustained growth: removal of EGF markedly reduced expansion, whereas EGF⁺ conditions supported continued proliferation. This mirrors in vivo NSC biology, where EGF and FGF act as essential mitogens [Reynolds & Weiss, 1992; Sun et al., 2005], and validates proliferation as a functional endpoint within the DNT IVB [83,84,85,86]. Together, these features establish the NSA as a biologically faithful NAM that integrates cellular, functional, and molecular readouts of corticogenesis.
A central methodological choice was the exposure window: toxicants were applied after three days of proliferation and maintained chronically throughout the three-week differentiation period, coinciding with the onset of differentiation and migration. This window reflects a critical developmental transition when neural progenitors exit the cell cycle, begin to differentiate into astrocytes and neurons, and establish migration scaffolds. During this period, neural progenitors undergo tightly regulated fate transitions, driven by both intrinsic genetic programs and extrinsic signaling cues, such as changes in Wnt and BMP signaling, which orchestrate the shift from proliferative progenitors to differentiating neurons and glia [87,88,89]. Single-cell transcriptomic studies have shown that these transitions are marked by dynamic changes in gene expression, independent of cell cycle status, and are essential for generating neuronal diversity and proper cortical organization [89,90]. Most developmental neurotoxicity studies, however, evaluate exposure windows that occur either earlier (prenatally) or later (postnatally), and do not specifically target this precise point of differentiation and migration, despite evidence that vulnerability to toxicants can vary greatly depending on the developmental stage [91]. This makes the chosen window particularly relevant, as it captures a phase when progenitor identity, differentiation, and migration are most sensitive to disruption by toxicants.
Our results confirm that toxicant effects depend on both the developmental stage and the endpoint measured, a finding supported by research showing that sensitivity to toxicants can vary widely across life stages and according to the specific biological outcome assessed [92,93,94]
In proliferative neurospheres, CPF reduced viability only at ≥125 µM, while a sub-toxic concentration (37 µM) left progenitors, SATB2⁺ neurons, Ki67 expression, and cell-cycle distribution largely unchanged. In differentiating neurospheres, however, CPF altered growth kinetics: spheroids enlarged at week one but subsequently arrested, with overt cytotoxicity at 250 µM, illustrating how developmental stage influences toxicant response [92]. PFAS mixture exposure caused only modest but significant viability reduction at day 21, consistent with findings from both in vitro and animal studies. Research using human stem cell and zebrafish models shows that PFAS, including PFOS and PFOA, can decrease viability or survival at certain concentrations, but these effects are often limited or subtle at environmentally relevant doses, especially during differentiation stages [95,96,97]. Similarly, studies in human stem cell models report that PFAS can reduce embryoid body size and affect differentiation at higher concentrations, but overt cytotoxicity is generally not observed at lower, more relevant exposures [95]. These findings suggest that while PFAS mixtures can impair viability during differentiation, the effects are typically modest, highlighting the importance of using sensitive and stage-specific endpoints to detect subtle developmental toxicity.
Strikingly, radial migration proved more sensitive than bulk viability: CPF impaired migration in a dose-dependent manner, while PFAS consistently reduced migration distance by halting expansion prematurely between days two and three, despite limited effects on size or viability. This demonstrates that viability assays alone can underestimate functionally relevant neurodevelopmental liabilities and highlights migration as a particularly valuable endpoint for developmental neurotoxicity (DNT) assessment, as supported by previous research emphasizing the sensitivity and specificity of migration disturbances as early indicators of neurotoxicant exposure [63,98,99].
Comparison of CPF and PFAS revealed divergent mechanistic signatures. CPF, a validated DNT-positive compound, produced a biphasic phenotype: early enlargement, later growth arrest, overt viability loss at 250 µM, dose-dependent migration impairment, and transcriptional down-regulation of Gfap. At 250 µM, only Gfap expression could be reliably assessed due to variability in other markers, but this consistent down-regulation highlights astrocytic vulnerability under overtly toxic conditions. These findings align with literature showing that CPF disrupts progenitor proliferation, astrocytic maturation, neurite extension, and cytoskeletal remodeling in rodent and human models [26,27,29,100]. Astrocytes have been repeatedly highlighted as CPF targets, with reduced GFAP expression impairing guidance, extracellular matrix remodeling, and neuronal support [28,101].
By contrast, PFAS exposure yielded a distinct phenotype characterized by functional impairments in migration and selective down-regulation of both Gfap and Syp, which emerged before overt cytotoxicity, while Neurod1, Map2, and Bdnf remained unaffected. This suggests that PFAS target astrocytic and synaptic maturation rather than global survival, consistent with mechanistic evidence of PFAS interfering with lipid metabolism, calcium regulation, and nuclear receptor signaling [102,103,104].
Several studies support this interpretation. In vitro, PFOS reduced synaptic protein levels and altered neuronal gene expression at concentrations as low as 0.1 µM (100 nM), with effects on GABA_A receptor function observed at this level, and broader neuronal network activity changes at 100 µM [105]. In differentiated neuronal cells, PFAS mixtures inhibited neurite outgrowth at concentrations around or below cytotoxicity, which were comparable to those found in human blood and the environment—often in the low nanomolar to micromolar range [106]. Animal studies have shown that PFOS exposure impairs astrocyte and neuron function, with effects on glutamate cycling and neurite outgrowth observed at micromolar concentrations [107,108]. Human epidemiological studies converge with these findings, linking PFAS serum levels in the nM range to increased risk of ADHD, reduced IQ, and impaired executive function [31,32,33,35,109,110,111,112]. Notably, whereas CPF required relatively high concentrations to induce modest transcriptional changes, PFAS mixtures affected astrocytic and synaptic markers at biomonitoring-relevant nM levels. This is consistent with recent evidence that mixtures act additively [106] and that even low-dose PFAS exposures can synergistically trigger oxidative stress and DNA damage [Kebieche et al., 2025]. Altogether, this highlights the higher sensitivity of astrocytic and synaptic endpoints to PFAS, even under chronic, low-nanomolar exposure.
The PFAS mixture tested here was directly based on the French Esteban biomonitoring study (2014–2016), which quantified PFOS, PFOA, PFUnDA, and PFHxS in more than 40% of children at 0.1–2.2 µg/L [37]. Thus, our exposures reflect environmentally realistic, chronic, low-nM conditions. Observing functional effects at these levels is coherent with the broader literature, where sub- to low-µM PFAS exposures impair migration, synaptogenesis, and cognition in animals, while nM-range serum levels correlate with neurodevelopmental disorders in humans. By bridging mechanistic in vitro observations with biomonitoring data, our results strengthen the argument that PFAS mixtures contribute to developmental neurotoxicity below cytotoxic thresholds [113].
These results also resonate with regulatory priorities. Both EFSA and OECD [6,10,11,63] have emphasized the need for mixture-based testing and the use of NAMs addressing human-relevant concentrations [114,115]. Our approach responds directly to these calls by demonstrating that mouse neurospheres, assessed through a complementary battery of endpoints—including proliferation, neuronal and glial differentiation, radial migration, synaptogenesis, astrocytic maturation, and viability—can reveal toxicant-specific signatures at biomonitoring-relevant levels. The use of stage-resolved testing ensures developmental windows of susceptibility are captured, enhancing the biological relevance and regulatory utility of the approach. Together, these features demonstrate that the NSA is not only biologically faithful but also reproducible, robust, and fit-for-purpose in the context of regulatory DNT testing , supporting the integration of mixture-based and NAM-driven strategies in regulatory framework [106,114,115].
Some limitations must be acknowledged. The three-week differentiation period models early neuron–glia interactions but not later oligodendrocyte maturation and myelination, which would require six- to eight-week cultures [116,117]. Another consideration is that the present model is mouse-derived rather than human. While rodent-based neurospheres are included in OECD and EFSA frameworks, the use of human iPSC-derived neurospheres could enhance translational relevance [118,119,120,121]. Thus, mouse and human systems should be viewed as complementary within the NAM landscape. Rodent-derived neurospheres offer robust, reproducible models that are well established in developmental neurotoxicity testing and enable mechanistic anchoring to in vivo reference data . Human iPSC-derived neurospheres, on the other hand, provide higher translational relevance by capturing human-specific developmental trajectories and genetic variability [57,122]. Together, the parallel use of mouse and human systems can strengthen confidence in hazard identification and facilitate regulatory acceptance of neurosphere assays within the DNT IVB. Finally, although Synaptophysin and PSD95 confirmed presynaptic and postsynaptic marker acquisition, co-localization and electrophysiological recordings are needed to confirm functional synaptogenesis.

5. Conclusion

This study provides proof-of-concept that CPF primarily impairs astrocytic maturation under overtly toxic conditions, whereas PFAS mixtures disrupt astrocytic and synaptic programs and impair migration at biomonitoring-relevant levels. Migration consistently emerged as more sensitive than viability, underscoring its value for developmental neurotoxicity testing. A key strength of this work lies in the integration of complementary endpoints—proliferation, differentiation, migration, synaptogenesis, and astrocytic maturation—within a single assay, together with a stage-resolved exposure design. Toxicants were applied both during the proliferative stage and at the onset of differentiation, and were maintained under chronic conditions across the three-week differentiation period, thereby capturing distinct developmental windows of susceptibility. By combining multiparametric endpoints with environmentally realistic PFAS mixtures, this study extends the canonical neurosphere assay beyond existing validation efforts and positions it as a mechanistic, regulatory-ready NAM for DNT assessment, supporting its potential integration into the OECD DNT IVB framework.

Author Contributions

Conceptualization, N.K., R.S. and C.L.; methodology, N.K., C.L. and S.Y.; formal analysis, N.K. and C.L.; investigation, N.K. and S.Y.; resources, R.S.; data curation, N.K.; writing—original draft preparation, N.K.; writing—review and editing, N.K. and R.S.; supervision, R.S.; project administration, R.S.; funding acquisition, R.S. All authors have read and agreed to the published version of the manuscript.

Funding

This review received financial support from the Eurométropole (PredctTox 2023) and the University of Lorraine.

Institutional Review Board Statement

Not applicable.

Informed Consent Statement

Not applicable.

Data Availability Statement

No new data were created or analyzed in this study.

Data Availability Statement

The datasets generated and analyzed during the current study are available from the corresponding author upon reasonable request.

Acknowledgments

We thank Dominique Dumas from the Imaging Core Facility (PTIBC) of UMS2008 IBSLor (Université de Lorraine–CNRS–INSERM) for technical support and access to the confocal platform. We also thank Jean-Michel Girardet from the qPCR Platform (Plateforme ASIA, Université de Lorraine) for providing access and technical assistance. During the preparation of this manuscript, the authors used ChatGPT (OpenAI, GPT-5, 2025) for language editing and text refinement, and Consensus.app for literature searching and evidence aggregation. The authors have reviewed and edited the outputs and take full responsibility for the content of this publication.

Conflicts of Interest

The authors declare no conflicts of interest.

Conflicts of Interest

The authors declare no conflicts of interest.

Abbreviations

The following abbreviations are used in this manuscript:
ADHD Attention Deficit Hyperactivity Disorder
ANOVA Analysis of Variance
BDNF Brain-Derived Neurotrophic Factor
BMP Bone Morphogenetic Protein
CPF Chlorpyrifos
Dlg4 / PSD95 Discs Large MAGUK Scaffold Protein 4 / Postsynaptic Density Protein 95
DMEM/F12 Dulbecco’s Modified Eagle Medium/Nutrient Mixture F-12
DMSO Dimethyl Sulfoxide
DNT Developmental Neurotoxicity
DNT IVB Developmental Neurotoxicity In Vitro Battery
EGF Epidermal Growth Factor
EFSA European Food Safety Authority
FGF Fibroblast Growth Factor
GAPDH Glyceraldehyde-3-Phosphate Dehydrogenase
GFAP Glial Fibrillary Acidic Protein
IC20 20% Inhibitory Concentration
MAP2 Microtubule-Associated Protein 2
Mbp Myelin Basic Protein
NAM New Approach Methodology
Neurod1 Neurogenic Differentiation 1
NSA Neurosphere Assay
NSC Neural Stem Cell
OECD Organisation for Economic Co-operation and Development
Olig1 Oligodendrocyte Transcription Factor 1
PFA Paraformaldehyde
PFAS Per- and Polyfluoroalkyl Substances
PFHxS Perfluorohexane Sulfonic Acid
PFOS Perfluorooctane Sulfonic Acid
PFOA Perfluorooctanoic Acid
PFUnDA Perfluoroundecanoic Acid
qPCR Quantitative Polymerase Chain Reaction
SYP Synaptophysin
SATB2 Special AT-Rich Sequence-Binding Protein 2
SD Standard Deviation
SOX2 SRY-Box Transcription Factor 2
Tubb3 / βIII-tubulin Class III Beta-Tubulin
XTT 2,3-Bis(2-Methoxy-4-Nitro-5-Sulfophenyl)-2H-Tetrazolium-5-Carboxanilide Sodium Salt

References

  1. Smirnova, L. Developmental Neurotoxicity – Challenges in the 21st Century and In Vitro Opportunities. ALTEX 2014. [Google Scholar] [CrossRef]
  2. Tsuji, R.; Crofton, K.M. Developmental Neurotoxicity Guideline Study: Issues with Methodology, Evaluation and Regulation*: DNT Guideline Study. Congenital Anomalies 2012, 52, 122–128. [Google Scholar] [CrossRef] [PubMed]
  3. Crofton, K.M.; Bassan, A.; Behl, M.; Chushak, Y.G.; Fritsche, E.; Gearhart, J.M.; Marty, M.S.; Mumtaz, M.; Pavan, M.; Ruiz, P.; et al. Current Status and Future Directions for a Neurotoxicity Hazard Assessment Framework That Integrates in Silico Approaches. Computational Toxicology 2022, 22, 100223. [Google Scholar] [CrossRef] [PubMed]
  4. Bal-Price, A.; Lein, P.J.; Keil, K.P.; Sethi, S.; Shafer, T.; Barenys, M.; Fritsche, E.; Sachana, M.; Meek, M.E. (Bette) Developing and Applying the Adverse Outcome Pathway Concept for Understanding and Predicting Neurotoxicity. NeuroToxicology 2017, 59, 240–255. [Google Scholar] [CrossRef] [PubMed]
  5. Paparella, M.; Bennekou, S.H.; Bal-Price, A. An Analysis of the Limitations and Uncertainties of in Vivo Developmental Neurotoxicity Testing and Assessment to Identify the Potential for Alternative Approaches. Reprod Toxicol 2020, 96, 327–336. [Google Scholar] [CrossRef]
  6. Fritsche, E.; Crofton, K.M.; Hernandez, A.F.; Hougaard Bennekou, S.; Leist, M.; Bal-Price, A.; Reaves, E.; Wilks, M.F.; Terron, A.; Solecki, R.; et al. OECD/EFSA Workshop on Developmental Neurotoxicity (DNT): The Use of Non-Animal Test Methods for Regulatory Purposes. ALTEX 2017, 34, 311–315. [Google Scholar] [CrossRef]
  7. Bal-Price, A. Advancing the Science of Developmental Neurotoxicity (DNT): Testing for Better Safety Evaluation. ALTEX 2012, 29, 202–215. [Google Scholar] [CrossRef]
  8. Bal-Price, A.K.; Hogberg, H.T.; Buzanska, L.; Lenas, P.; van Vliet, E.; Hartung, T. In Vitro Developmental Neurotoxicity (DNT) Testing: Relevant Models and Endpoints. NeuroToxicology 2010, 31, 545–554. [Google Scholar] [CrossRef]
  9. Bal-Price, A.; Crofton, K.M.; Sachana, M.; Shafer, T.J.; Behl, M.; Forsby, A.; Hargreaves, A.; Landesmann, B.; Lein, P.J.; Louisse, J.; et al. Putative Adverse Outcome Pathways Relevant to Neurotoxicity. Critical Reviews in Toxicology 2015, 45, 83–91. [Google Scholar] [CrossRef]
  10. Panel), E.P. on C. in the F.C. (EFSA C.; Schrenk, D.; Bignami, M.; Bodin, L.; Chipman, J.K.; del Mazo, J.; Grasl-Kraupp, B.; Hogstrand, C.; Hoogenboom, L. (Ron); Leblanc, J.-C.; et al. Risk to Human Health Related to the Presence of Perfluoroalkyl Substances in Food. EFSA Journal 2020, 18, e06223. [Google Scholar] [CrossRef]
  11. Chain (CONTAM), E.P. on C. in the F.; Knutsen, H.K.; Alexander, J.; Barregård, L.; Bignami, M.; Brüschweiler, B.; Ceccatelli, S.; Cottrill, B.; Dinovi, M.; Edler, L.; et al. Risk to Human Health Related to the Presence of Perfluorooctane Sulfonic Acid and Perfluorooctanoic Acid in Food. EFSA Journal 2018, 16, e05194. [Google Scholar] [CrossRef]
  12. Masjosthusmann, S.; Blum, J.; Bartmann, K.; Dolde, X.; Holzer, A.; Stürzl, L.; Keßel, E.H.; Förster, N.; Dönmez, A.; Klose, J.; et al. Establishment of an a Priori Protocol for the Implementation and Interpretation of an In-vitro Testing Battery for the Assessment of Developmental Neurotoxicity. EFS3 2020, 17. [Google Scholar] [CrossRef]
  13. Baumann, J.; Barenys, M.; Gassmann, K.; Fritsche, E. Comparative Human and Rat “Neurosphere Assay” for Developmental Neurotoxicity Testing. CP Toxicology 2014, 59. [Google Scholar] [CrossRef] [PubMed]
  14. Koch, K.; Bartmann, K.; Hartmann, J.; Kapr, J.; Klose, J.; Kuchovská, E.; Pahl, M.; Schlüppmann, K.; Zühr, E.; Fritsche, E. Scientific Validation of Human Neurosphere Assays for Developmental Neurotoxicity Evaluation. Front Toxicol 2022, 4, 816370. [Google Scholar] [CrossRef] [PubMed]
  15. Crofton, K.M.; Mundy, W.R. External Scientific Report on the Interpretation of Data from the Developmental Neurotoxicity In Vitro Testing Assays for Use in Integrated Approaches for Testing and Assessment. EFS3 2021, 18. [Google Scholar] [CrossRef]
  16. Nyffeler, J.; Dolde, X.; Krebs, A.; Pinto-Gil, K.; Pastor, M.; Behl, M.; Waldmann, T.; Leist, M. Combination of Multiple Neural Crest Migration Assays to Identify Environmental Toxicants from a Proof-of-Concept Chemical Library. Arch Toxicol 2017, 91, 3613–3632. [Google Scholar] [CrossRef]
  17. Pallocca, G.; Grinberg, M.; Henry, M.; Frickey, T.; Hengstler, J.G.; Waldmann, T.; Sachinidis, A.; Rahnenführer, J.; Leist, M. Identification of Transcriptome Signatures and Biomarkers Specific for Potential Developmental Toxicants Inhibiting Human Neural Crest Cell Migration. Arch Toxicol 2016, 90, 159–180. [Google Scholar] [CrossRef]
  18. Li, S.; Kumar T, P.; Joshee, S.; Kirschstein, T.; Subburaju, S.; Khalili, J.S.; Kloepper, J.; Du, C.; Elkhal, A.; Szabó, G.; et al. Endothelial Cell-Derived GABA Signaling Modulates Neuronal Migration and Postnatal Behavior. Cell Res 2018, 28, 221–248. [Google Scholar] [CrossRef]
  19. Xiang, Y.; Tanaka, Y.; Patterson, B.; Kang, Y.-J.; Govindaiah, G.; Roselaar, N.; Cakir, B.; Kim, K.-Y.; Lombroso, A.P.; Hwang, S.-M.; et al. Fusion of Regionally Specified hPSC-Derived Organoids Models Human Brain Development and Interneuron Migration. Cell Stem Cell 2017, 21, 383–398.e7. [Google Scholar] [CrossRef]
  20. Delp, J. A High-Throughput Approach to Identify Specific Neurotoxicants / Developmental Toxicants in Human Neuronal Cell Function Assays. ALTEX 2018, 235–253. [Google Scholar] [CrossRef]
  21. Zimmer, B.; Lee, G.; Balmer, N.V.; Meganathan, K.; Sachinidis, A.; Studer, L.; Leist, M. Evaluation of Developmental Toxicants and Signaling Pathways in a Functional Test Based on the Migration of Human Neural Crest Cells. Environ Health Perspect 2012, 120, 1116–1122. [Google Scholar] [CrossRef]
  22. Pistollato, F.; de Gyves, E.M.; Carpi, D.; Bopp, S.K.; Nunes, C.; Worth, A.; Bal-Price, A. Assessment of Developmental Neurotoxicity Induced by Chemical Mixtures Using an Adverse Outcome Pathway Concept. Environ Health 2020, 19, 23. [Google Scholar] [CrossRef]
  23. Yamada, S.; Kubo, Y.; Yamazaki, D.; Sekino, Y.; Kanda, Y. Chlorpyrifos Inhibits Neural Induction via Mfn1-Mediated Mitochondrial Dysfunction in Human Induced Pluripotent Stem Cells. Sci Rep 2017, 7, 40925. [Google Scholar] [CrossRef] [PubMed]
  24. Pistollato, F.; Carpi, D.; Mendoza-de Gyves, E.; Paini, A.; Bopp, S.K.; Worth, A.; Bal-Price, A. Combining in Vitro Assays and Mathematical Modelling to Study Developmental Neurotoxicity Induced by Chemical Mixtures. Reproductive Toxicology 2021, 105, 101–119. [Google Scholar] [CrossRef] [PubMed]
  25. Buzanska, L.; Sypecka, J.; Nerini-Molteni, S.; Compagnoni, A.; Hogberg, H.T.; del Torchio, R.; Domanska-Janik, K.; Zimmer, J.; Coecke, S. A Human Stem Cell-Based Model for Identifying Adverse Effects of Organic and Inorganic Chemicals on the Developing Nervous System. Stem Cells 2009, 27, 2591–2601. [Google Scholar] [CrossRef] [PubMed]
  26. Zhou, W.; Zhang, C.; Wang, P.; Deng, Y.; Dai, H.; Tian, J.; Wu, G.; Zhao, L. Chlorpyrifos-Induced Dysregulation of Synaptic Plasticity in Rat Hippocampal Neurons. Journal of Environmental Science and Health, Part B 2023, 58, 100–109. [Google Scholar] [CrossRef]
  27. Garcia, S.J.; Seidler, F.J.; Slotkin, T.A. Developmental Neurotoxicity of Chlorpyrifos: Targeting Glial Cells. Environmental Toxicology and Pharmacology 2005, 19, 455–461. [Google Scholar] [CrossRef]
  28. Wang, P.-P.; Zhao, L.-L. Effect of Chlorpyrifos and Lipopolysaccharide on Primary Cultured Astrocytes. dtbh 2017. [Google Scholar] [CrossRef]
  29. Sandoval, L.; Rosca, A.; Oniga, A.; Zambrano, A.; Ramos, J.J.; González, M.C.; Liste, I.; Motas, M. Effects of Chlorpyrifos on Cell Death and Cellular Phenotypic Specification of Human Neural Stem Cells. Science of The Total Environment 2019, 683, 445–454. [Google Scholar] [CrossRef]
  30. Di Consiglio, E.; Pistollato, F.; Mendoza-De Gyves, E.; Bal-Price, A.; Testai, E. Integrating Biokinetics and in Vitro Studies to Evaluate Developmental Neurotoxicity Induced by Chlorpyrifos in Human iPSC-Derived Neural Stem Cells Undergoing Differentiation towards Neuronal and Glial Cells. Reprod Toxicol 2020, 98, 174–188. [Google Scholar] [CrossRef]
  31. Starnes, H.M.; Rock, K.D.; Jackson, T.W.; Belcher, S.M. A Critical Review and Meta-Analysis of Impacts of Per- and Polyfluorinated Substances on the Brain and Behavior. Front. Toxicol. 2022, 4, 881584. [Google Scholar] [CrossRef]
  32. Bharal, B.; Ruchitha, C.; Kumar, P.; Pandey, R.; Rachamalla, M.; Niyogi, S.; Naidu, R.; Kaundal, R.K. Neurotoxicity of Per- and Polyfluoroalkyl Substances: Evidence and Future Directions. Science of The Total Environment 2024, 955, 176941. [Google Scholar] [CrossRef]
  33. Olsen, G.W.; Mair, D.C.; Lange, C.C.; Harrington, L.M.; Church, T.R.; Goldberg, C.L.; Herron, R.M.; Hanna, H.; Nobiletti, J.B.; Rios, J.A.; et al. Per- and Polyfluoroalkyl Substances (PFAS) in American Red Cross Adult Blood Donors, 2000–2015. Environmental Research 2017, 157, 87–95. [Google Scholar] [CrossRef] [PubMed]
  34. Maddalon, A.; Pierzchalski, A.; Kretschmer, T.; Bauer, M.; Zenclussen, A.C.; Marinovich, M.; Corsini, E.; Herberth, G. Mixtures of Per- and Poly-Fluoroalkyl Substances (PFAS) Reduce the in Vitro Activation of Human T Cells and Basophils. Chemosphere 2023, 336, 139204. [Google Scholar] [CrossRef] [PubMed]
  35. Li, S.; Qin, S.; Zeng, H.; Chou, W.; Oudin, A.; Kanninen, K.M.; Jalava, P.; Dong, G.; Zeng, X. Adverse Outcome Pathway for the Neurotoxicity of Per- and Polyfluoroalkyl Substances: A Systematic Review. Eco-Environment & Health 2024, 3, 476–493. [Google Scholar] [CrossRef] [PubMed]
  36. He, Q.; Yang, Q.; Wu, L.; He, Y.; Zeng, N.; Wang, Z. Neurotoxic Effects of Per- and Polyfluoroalkyl Substances (PFAS) Mixture Exposure in Mice: Accumulations in Brain and Associated Changes of Behaviors, Metabolome, and Transcriptome. Journal of Hazardous Materials 2025, 489, 137699. [Google Scholar] [CrossRef]
  37. Santé publique France Imprégnation de la population française par les composés perfluorés. Programme national de biosurveillance, Esteban 2014–2016; Santé publique France: Saint-Maurice, 2019; p. 58. [Google Scholar]
  38. Tukker, A.M.; Bouwman, L.M.S.; van Kleef, R.G.D.M.; Hendriks, H.S.; Legler, J.; Westerink, R.H.S. Perfluorooctane Sulfonate (PFOS) and Perfluorooctanoate (PFOA) Acutely Affect Human α1β2γ2L GABAA Receptor and Spontaneous Neuronal Network Function in Vitro. Sci Rep 2020, 10, 5311. [Google Scholar] [CrossRef]
  39. Tukker, A.M.; Wijnolts, F.M.J.; de Groot, A.; Westerink, R.H.S. Applicability of hiPSC-Derived Neuronal Cocultures and Rodent Primary Cortical Cultures for In Vitro Seizure Liability Assessment. Toxicological Sciences 2020, 178, 71–87. [Google Scholar] [CrossRef]
  40. Pamies, D.; Wiersma, D.; Katt, M.E.; Zhao, L.; Burtscher, J.; Harris, G.; Smirnova, L.; Searson, P.C.; Hartung, T.; Hogberg, H.T. Human IPSC 3D Brain Model as a Tool to Study Chemical-Induced Dopaminergic Neuronal Toxicity. Neurobiology of Disease 2022, 169, 105719. [Google Scholar] [CrossRef]
  41. Nunes, C.; Gorczyca, G.; Mendoza-deGyves, E.; Ponti, J.; Bogni, A.; Carpi, D.; Bal-Price, A.; Pistollato, F. Upscaling Biological Complexity to Boost Neuronal and Oligodendroglia Maturation and Improve in Vitro Developmental Neurotoxicity (DNT) Evaluation. Reproductive Toxicology 2022, 110, 124–140. [Google Scholar] [CrossRef]
  42. Feng, J.; Soto-Moreno, E.J.; Prakash, A.; Balboula, A.Z.; Qiao, H. Adverse PFAS Effects on Mouse Oocyte in Vitro Maturation Are Associated with Carbon-chain Length and Inclusion of a Sulfonate Group. Cell Proliferation 2023, 56, e13353. [Google Scholar] [CrossRef] [PubMed]
  43. Tsai, W.-J.; Hsieh, W.-S.; Chen, P.-C.; Liu, C.-Y. Prenatal Perfluoroalkyl Substance Exposure in Association with Global Histone Post-Translational Methylation in 2-Year-Old Children. Toxics 2024, 12, 876. [Google Scholar] [CrossRef] [PubMed]
  44. Haimbaugh, A.; Wu, C.-C.; Akemann, C.; Meyer, D.N.; Connell, M.; Abdi, M.; Khalaf, A.; Johnson, D.; Baker, T.R. Multi- and Transgenerational Effects of Developmental Exposure to Environmental Levels of PFAS and PFAS Mixture in Zebrafish (Danio Rerio). Toxics 2022, 10, 334. [Google Scholar] [CrossRef]
  45. Abdulkadir, A.; Kandel, S.; Lewis, N.; Dauvergne, O.; Rosby, R.; Hossain, E. Epigenetic Consequences of In Utero PFAS Exposure: Implications for Development and Long-Term Health 2025.
  46. Pistollato, F.; de Gyves, E.M.; Carpi, D.; Bopp, S.K.; Nunes, C.; Worth, A.; Bal-Price, A. Assessment of Developmental Neurotoxicity Induced by Chemical Mixtures Using an Adverse Outcome Pathway Concept. Environ Health 2020, 19, 23. [Google Scholar] [CrossRef]
  47. Zagare, A.; Gobin, M.; Monzel, A.S.; Schwamborn, J.C. A Robust Protocol for the Generation of Human Midbrain Organoids. STAR Protocols 2021, 2. [Google Scholar] [CrossRef]
  48. Wan, F.; Zhang, S.; Xie, R.; Gao, B.; Campos, B.; Herold-Mende, C.; Lei, T. The Utility and Limitations of Neurosphere Assay, CD133 Immunophenotyping and Side Population Assay in Glioma Stem Cell Research. Brain Pathology 2010, 20, 877–889. [Google Scholar] [CrossRef]
  49. Weible Ii, M.W.; Lovelace, M.D.; Mundell, H.D.; Pang, T.W.R.; Chan-Ling, T. BMPRII+ Neural Precursor Cells Isolated and Characterized from Organotypic Neurospheres: An in Vitro Model of Human Fetal Spinal Cord Development. Neural Regen Res 2024, 19, 447–457. [Google Scholar] [CrossRef]
  50. Fracaro, L.; Hochuli, A.H.D.; Selenko, A.H.; Capriglione, L.G.A.; Brofman, P.R.S.; Senegaglia, A.C. Mesenchymal Stromal Cells Derived from Exfoliated Deciduous Teeth Express Neuronal Markers before Differentiation Induction. J. Appl. Oral Sci. 2023, 31, e20220489. [Google Scholar] [CrossRef]
  51. Ma, G.; Abbasi, F.; Koch, W.T.; Mostowski, H.; Varadkar, P.; Mccright, B. Evaluation of the Differentiation Status of Neural Stem Cells Based on Cell Morphology and the Expression of Notch and Sox2. Cytotherapy 2018, 20, 1472–1485. [Google Scholar] [CrossRef]
  52. Lislien, M.; Kuchovska, E.; Kapr, J.; Duale, N.; Andersen, J.M.; Dirven, H.; Myhre, O.; Fritsche, E.; Koch, K.; Wojewodzic, M.W. Transcriptomic Characterization of 2D and 3D Human Induced Pluripotent Stem Cell-Based in Vitro Models as New Approach Methodologies for Developmental Neurotoxicity Testing. Toxicology 2025, 510, 154000. [Google Scholar] [CrossRef] [PubMed]
  53. Fritsche, E.; Barenys, M.; Hogberg, H.T. Editorial: Methods and Protocols in Neurotoxicology. Front Toxicol 2022, 4, 1031667. [Google Scholar] [CrossRef] [PubMed]
  54. Lee, J.-H.; Shaker, M.R.; Lee, E.; Lee, B.; Sun, W. NeuroCore Formation during Differentiation of Neurospheres of Mouse Embryonic Neural Stem Cells. Stem Cell Research 2020, 43, 101691. [Google Scholar] [CrossRef] [PubMed]
  55. Heng, B.C.; Gong, T.; Wang, S.; Lim, L.W.; Wu, W.; Zhang, C. Decellularized Matrix Derived from Neural Differentiation of Embryonic Stem Cells Enhances the Neurogenic Potential of Dental Follicle Stem Cells. Journal of Endodontics 2017, 43, 409–416. [Google Scholar] [CrossRef] [PubMed]
  56. Pamies, D. A Human Brain Microphysiological System Derived from Induced Pluripotent Stem Cells to Study Neurological Diseases and Toxicity. ALTEX 2017, 362–376. [Google Scholar] [CrossRef]
  57. Kobolak, J.; Teglasi, A.; Bellak, T.; Janstova, Z.; Molnar, K.; Zana, M.; Bock, I.; Laszlo, L.; Dinnyes, A. Human Induced Pluripotent Stem Cell-Derived 3D-Neurospheres Are Suitable for Neurotoxicity Screening. Cells 2020, 9, 1122. [Google Scholar] [CrossRef]
  58. Yang, L.; Li, Z.; Liu, G.; Li, X.; Yang, Z. Developmental Origins of Human Cortical Oligodendrocytes and Astrocytes. Neurosci. Bull. 2022, 38, 47–68. [Google Scholar] [CrossRef]
  59. Yang, L.; Li, Z.; Liu, G.; Li, X.; Yang, Z. Developmental Origins of Human Cortical Oligodendrocytes and Astrocytes. Neurosci. Bull. 2022, 38, 47–68. [Google Scholar] [CrossRef]
  60. Xin, M.; Yue, T.; Ma, Z.; Wu, F.; Gow, A.; Lu, Q.R. Myelinogenesis and Axonal Recognition by Oligodendrocytes in Brain Are Uncoupled in Olig1 -Null Mice. J. Neurosci. 2005, 25, 1354–1365. [Google Scholar] [CrossRef]
  61. Ligon, K.L.; Fancy, S.P.J.; Franklin, R.J.M.; Rowitch, D.H. Olig Gene Function in CNS Development and Disease. Glia 2006, 54, 1–10. [Google Scholar] [CrossRef]
  62. Di Consiglio, E.; Pistollato, F.; Mendoza-De Gyves, E.; Bal-Price, A.; Testai, E. Integrating Biokinetics and in Vitro Studies to Evaluate Developmental Neurotoxicity Induced by Chlorpyrifos in Human iPSC-Derived Neural Stem Cells Undergoing Differentiation towards Neuronal and Glial Cells. Reprod Toxicol 2020, 98, 174–188. [Google Scholar] [CrossRef]
  63. Mundy, W.R.; Crofton, K.M. Recommended DNT Reference Chemical Test Set For In Vitro Assay Development*. EFS3 2024, 21. [Google Scholar] [CrossRef]
  64. Chandrasekaran, A.; Avci, H.X.; Ochalek, A.; Rösingh, L.N.; Molnár, K.; László, L.; Bellák, T.; Téglási, A.; Pesti, K.; Mike, A.; et al. Comparison of 2D and 3D Neural Induction Methods for the Generation of Neural Progenitor Cells from Human Induced Pluripotent Stem Cells. Stem Cell Research 2017, 25, 139–151. [Google Scholar] [CrossRef] [PubMed]
  65. Lee, C.-T.; Bendriem, R.M.; Wu, W.W.; Shen, R.-F. 3D Brain Organoids Derived from Pluripotent Stem Cells: Promising Experimental Models for Brain Development and Neurodegenerative Disorders. J Biomed Sci 2017, 24, 59. [Google Scholar] [CrossRef] [PubMed]
  66. Centeno, E.G.Z.; Cimarosti, H.; Bithell, A. 2D versus 3D Human Induced Pluripotent Stem Cell-Derived Cultures for Neurodegenerative Disease Modelling. Mol Neurodegener 2018, 13, 27. [Google Scholar] [CrossRef]
  67. Kim, J.Y.; Lee, J.-H.; Sun, W. Isolation and Culture of Adult Neural Stem Cells from the Mouse Subcallosal Zone. J Vis Exp 2016, 54929. [Google Scholar] [CrossRef]
  68. Rovida, C. Internationalization of Read-across as a Validated New Approach Method (NAM) for Regulatory Toxicology. ALTEX 2020. [Google Scholar] [CrossRef]
  69. Mapping out Strategies to Further Develop Human-Relevant, New Approach Methodology (NAM)-Based Developmental Neurotoxicity (DNT) Testing. ALTEX 2025. [CrossRef]
  70. Hristozov, D.; Badetti, E.; Bigini, P.; Brunelli, A.; Dekkers, S.; Diomede, L.; Doak, S.H.; Fransman, W.; Gajewicz-Skretna, A.; Giubilato, E.; et al. Next Generation Risk Assessment Approaches for Advanced Nanomaterials: Current Status and Future Perspectives. NanoImpact 2024, 35, 100523. [Google Scholar] [CrossRef]
  71. Nymark, P.; Bakker, M.; Dekkers, S.; Franken, R.; Fransman, W.; García-Bilbao, A.; Greco, D.; Gulumian, M.; Hadrup, N.; Halappanavar, S.; et al. Toward Rigorous Materials Production: New Approach Methodologies Have Extensive Potential to Improve Current Safety Assessment Practices. Small 2020, 16, 1904749. [Google Scholar] [CrossRef]
  72. Escher, S.E.; Kamp, H.; Bennekou, S.H.; Bitsch, A.; Fisher, C.; Graepel, R.; Hengstler, J.G.; Herzler, M.; Knight, D.; Leist, M.; et al. Towards Grouping Concepts Based on New Approach Methodologies in Chemical Hazard Assessment: The Read-across Approach of the EU-ToxRisk Project. Arch Toxicol 2019, 93, 3643–3667. [Google Scholar] [CrossRef]
  73. Pistollato, F.; Canovas-Jorda, D.; Zagoura, D.; Price, A. Protocol for the Differentiation of Human Induced Pluripotent Stem Cells into Mixed Cultures of Neurons and Glia for Neurotoxicity Testing. JoVE 2017, 55702. [Google Scholar] [CrossRef]
  74. Paşca, A.M.; Sloan, S.A.; Clarke, L.E.; Tian, Y.; Makinson, C.D.; Huber, N.; Kim, C.H.; Park, J.-Y.; O’Rourke, N.A.; Nguyen, K.D.; et al. Functional Cortical Neurons and Astrocytes from Human Pluripotent Stem Cells in 3D Culture. Nat Methods 2015, 12, 671–678. [Google Scholar] [CrossRef] [PubMed]
  75. Middelkamp, H.H.T.; Verboven, A.H.A.; De Sá Vivas, A.G.; Schoenmaker, C.; Klein Gunnewiek, T.M.; Passier, R.; Albers, C.A.; ‘t Hoen, P.A.C.; Nadif Kasri, N.; van der Meer, A.D. Cell Type-Specific Changes in Transcriptomic Profiles of Endothelial Cells, iPSC-Derived Neurons and Astrocytes Cultured on Microfluidic Chips. Sci Rep 2021, 11, 2281. [Google Scholar] [CrossRef] [PubMed]
  76. Liu, L.; Koo, Y.; Russell, T.; Gay, E.; Li, Y.; Yun, Y. Three-Dimensional Brain-on-Chip Model Using Human iPSC-Derived GABAergic Neurons and Astrocytes: Butyrylcholinesterase Post-Treatment for Acute Malathion Exposure. PLoS ONE 2020, 15, e0230335. [Google Scholar] [CrossRef]
  77. Chalmers, S.; Dalley, A.; Kalita-de Croft, P.; Saunus, J.; Bassett, J.; Sadras, F.; Roberts-Thomson, S.; Monteith, G. Abstract P1-19-05: Establishment of a Human Neural Progenitor Cell Microenvironment Model to Investigate Signalling Events in Triple Negative Breast Cancer Brain Metastases in a High-Throughput Setting. Cancer Research 2019, 79, P1-19-05-P1-19–05. [Google Scholar] [CrossRef]
  78. Dráberová, E.; Del Valle, L.; Gordon, J.; Marková, V.; Šmejkalová, B.; Bertrand, L.; De Chadarévian, J.-P.; Agamanolis, D.P.; Legido, A.; Khalili, K.; et al. Class III β-Tubulin Is Constitutively Coexpressed With Glial Fibrillary Acidic Protein and Nestin in Midgestational Human Fetal Astrocytes: Implications for Phenotypic Identity. J Neuropathol Exp Neurol 2008, 67, 341–354. [Google Scholar] [CrossRef]
  79. He, M.; Zhang, Z.; Guan, C.; Xia, D.; Yuan, X. Leading Tip Drives Soma Translocation via Forward F-Actin Flow during Neuronal Migration. J. Neurosci. 2010, 30, 10885–10898. [Google Scholar] [CrossRef]
  80. Carulli, D.; Verhaagen, J. An Extracellular Perspective on CNS Maturation: Perineuronal Nets and the Control of Plasticity. IJMS 2021, 22, 2434. [Google Scholar] [CrossRef]
  81. Eng, L.F.; Ghirnikar, R.S.; Lee, Y.L. Glial Fibrillary Acidic Protein: GFAP-Thirty-One Years (1969–2000). Neurochem Res 2000, 25, 1439–1451. [Google Scholar] [CrossRef]
  82. Duffy, P.E.; Huang, Y.-Y.; Rapport, M.M. The Relationship of Glial Fibrillary Acidic Protein to the Shape, Motility, and Differentiation of Human Astrocytoma Cells. Experimental Cell Research 1982, 139, 145–157. [Google Scholar] [CrossRef]
  83. Reimers, D.; López-Toledano, M.A.; Mason, I.; Cuevas, P.; Redondo, C.; Herranz, A.S.; Lobo, M.V.T.; Bazán, E. Developmental Expression of Fibroblast Growth Factor (FGF) Receptors in Neural Stem Cell Progeny. Modulation of Neuronal and Glial Lineages by Basic FGF Treatment. Neurological Research 2001, 23, 612–621. [Google Scholar] [CrossRef] [PubMed]
  84. Reynolds, B.A.; Weiss, S. Generation of Neurons and Astrocytes from Isolated Cells of the Adult Mammalian Central Nervous System. Science 1992, 255, 1707–1710. [Google Scholar] [CrossRef] [PubMed]
  85. Tunç, B.S.; Toprak, F.; Toprak, S.F.; Sozer, S. In Vitro Investigation of Growth Factors Including MGF and IGF-1 in Neural Stem Cell Activation, Proliferation, and Migration. Brain Research 2021, 1759, 147366. [Google Scholar] [CrossRef] [PubMed]
  86. Wong, R.W.C.; Guillaud, L. The Role of Epidermal Growth Factor and Its Receptors in Mammalian CNS. Cytokine & Growth Factor Reviews 2004, 15, 147–156. [Google Scholar] [CrossRef]
  87. Zhu, Y.; Huang, Y.; Tang, T.; Xie, Y. HDAC1 and HDAC2 Orchestrate Wnt Signaling to Regulate Neural Progenitor Transition during Brain Development. iScience 2024, 27, 110600. [Google Scholar] [CrossRef]
  88. Ma, T.C.; Vong, K.I.; Kwan, K.M. Spatiotemporal Decline of BMP Signaling Activity in Neural Progenitors Mediates Fate Transition and Safeguards Neurogenesis. Cell Reports 2020, 30, 3616–3624.e4. [Google Scholar] [CrossRef]
  89. Telley, L.; Agirman, G.; Prados, J.; Amberg, N.; Fièvre, S.; Oberst, P.; Bartolini, G.; Vitali, I.; Cadilhac, C.; Hippenmeyer, S.; et al. Temporal Patterning of Apical Progenitors and Their Daughter Neurons in the Developing Neocortex. Science 2019, 364, eaav2522. [Google Scholar] [CrossRef]
  90. Okamoto, M.; Miyata, T.; Konno, D.; Ueda, H.R.; Kasukawa, T.; Hashimoto, M.; Matsuzaki, F.; Kawaguchi, A. Cell-Cycle-Independent Transitions in Temporal Identity of Mammalian Neural Progenitor Cells. Nat Commun 2016, 7, 11349. [Google Scholar] [CrossRef]
  91. Heyer, D.B.; Meredith, R.M. Environmental Toxicology: Sensitive Periods of Development and Neurodevelopmental Disorders. NeuroToxicology 2017, 58, 23–41. [Google Scholar] [CrossRef]
  92. Schultz, D.R.; Tang, S.; Miller, C.; Gagnon, D.; Shekh, K.; Alcaraz, A.J.G.; Janz, D.M.; Hecker, M. A Multi–Life Stage Comparison of Silver Nanoparticle Toxicity on the Early Development of Three Canadian Fish Species. Environmental Toxicology and Chemistry 2021, 40, 3337–3350. [Google Scholar] [CrossRef]
  93. Osborne, R.K.; Ijzerman, M.M.; Venier, C.; Prosser, R.S. Development of an Embryo Toxicity Test to Assess the Comparative Toxicity of Metal Exposure on Different Life Stages of Freshwater Gastropods. Environmental Toxicology and Chemistry 2023, 42, 1791–1805. [Google Scholar] [CrossRef]
  94. Li, K.; Zhang, Y.; Li, L.; Cui, K.; Li, Y.; Li, C.; Dai, Y.; Xiao, W.; Wang, Q. Identification of Sensitive Endpoints for the Assessment of Phthalates-Induced Reproductive and Developmental Toxicity: A Literature Mining Study. Food and Chemical Toxicology 2024, 188, 114686. [Google Scholar] [CrossRef] [PubMed]
  95. Davidsen, N.; Rosenmai, A.K.; Lauschke, K.; Svingen, T.; Vinggaard, A.M. Developmental Effects of PFOS, PFOA and GenX in a 3D Human Induced Pluripotent Stem Cell Differentiation Model. Chemosphere 2021, 279, 130624. [Google Scholar] [CrossRef] [PubMed]
  96. Hamed, M.; Vats, A.; Lim, I.E.; Sapkota, B.; Abdelmoneim, A. Effects of Developmental Exposure to Individual and Combined PFAS on Development and Behavioral Stress Responses in Larval Zebrafish. Environmental Pollution 2024, 349, 123912. [Google Scholar] [CrossRef] [PubMed]
  97. Haimbaugh, A.; Wu, C.-C.; Akemann, C.; Meyer, D.N.; Connell, M.; Abdi, M.; Khalaf, A.; Johnson, D.; Baker, T.R. Multi- and Transgenerational Effects of Developmental Exposure to Environmental Levels of PFAS and PFAS Mixture in Zebrafish (Danio Rerio). Toxics 2022, 10, 334. [Google Scholar] [CrossRef]
  98. Nyffeler, J.; Dolde, X.; Krebs, A.; Pinto-Gil, K.; Pastor, M.; Behl, M.; Waldmann, T.; Leist, M. Combination of Multiple Neural Crest Migration Assays to Identify Environmental Toxicants from a Proof-of-Concept Chemical Library. Arch Toxicol 2017, 91, 3613–3632. [Google Scholar] [CrossRef]
  99. Fukumoto, K.; Morita, T.; Mayanagi, T.; Tanokashira, D.; Yoshida, T.; Sakai, A.; Sobue, K. Detrimental Effects of Glucocorticoids on Neuronal Migration during Brain Development. Mol Psychiatry 2009, 14, 1119–1131. [Google Scholar] [CrossRef]
  100. Guizzetti, M.; Pathak, S.; Giordano, G.; Costa, L.G. Effect of Organophosphorus Insecticides and Their Metabolites on Astroglial Cell Proliferation. Toxicology 2005, 215, 182–190. [Google Scholar] [CrossRef]
  101. Wang, P.; Zhao, L. The Expression Change of GFAP and HMGB1 in Primary Cultured Astrocytes Exposed to Chlorpyrifos and Lipopolysaccharide. In Proceedings from the ICERP 2016; De Gruyter Open, 2017; pp. 161–169 ISBN 978-3-11-055904-0.
  102. Abu-Salah, A.; Cesur, M.F.; Anchan, A.; Ay, M.; Langley, M.R.; Shah, A.; Reina-Gonzalez, P.; Strazdins, R.; Çakır, T.; Sarkar, S. Comparative Proteomics Highlights That GenX Exposure Leads to Metabolic Defects and Inflammation in Astrocytes. Environ. Sci. Technol. 2024, 58, 20525–20539. [Google Scholar] [CrossRef]
  103. Peixoto-Rodrigues, M.C.; Monteiro-Neto, J.R.; Teglas, T.; Toborek, M.; Soares Quinete, N.; Hauser-Davis, R.A.; Adesse, D. Early-Life Exposure to PCBs and PFAS Exerts Negative Effects on the Developing Central Nervous System. Journal of Hazardous Materials 2025, 485, 136832. [Google Scholar] [CrossRef]
  104. Running, L.; Cristobal, J.R.; Karageorgiou, C.; Camdzic, M.; Aguilar, J.M.N.; Gokcumen, O.; Aga, D.S.; Atilla-Gokcumen, G.E. Investigating the Mechanism of Neurotoxic Effects of PFAS in Differentiated Neuronal Cells through Transcriptomics and Lipidomics Analysis. ACS Chem. Neurosci. 2024, 15, 4568–4579. [Google Scholar] [CrossRef]
  105. Tukker, A.M.; Bouwman, L.M.S.; Van Kleef, R.G.D.M.; Hendriks, H.S.; Legler, J.; Westerink, R.H.S. Perfluorooctane Sulfonate (PFOS) and Perfluorooctanoate (PFOA) Acutely Affect Human α1β2γ2L GABAA Receptor and Spontaneous Neuronal Network Function in Vitro. Sci Rep 2020, 10, 5311. [Google Scholar] [CrossRef] [PubMed]
  106. Ríos-Bonilla, K.M.; Aga, D.S.; Lee, J.; König, M.; Qin, W.; Cristobal, J.R.; Atilla-Gokcumen, G.E.; Escher, B.I. Neurotoxic Effects of Mixtures of Perfluoroalkyl Substances (PFAS) at Environmental and Human Blood Concentrations. Environ. Sci. Technol. 2024; acs.est.4c06017. [Google Scholar] [CrossRef]
  107. Yang, J.; Wang, Y.; Xia, Y.; Ren, Y.; Wang, Z.; Meng, X.; Li, S.; Liu, X.; Shao, J. PFOS Elicits Cytotoxicity in Neuron Through Astrocyte-Derived CaMKII-DLG1 Signaling In Vitro Rat Hippocampal Model. Neurochem Res 2024, 49, 1226–1238. [Google Scholar] [CrossRef] [PubMed]
  108. Li, Z.; Liu, Q.; Liu, C.; Li, C.; Li, Y.; Li, S.; Liu, X.; Shao, J. Evaluation of PFOS-Mediated Neurotoxicity in Rat Primary Neurons and Astrocytes Cultured Separately or in Co-Culture. Toxicology in Vitro 2017, 38, 77–90. [Google Scholar] [CrossRef] [PubMed]
  109. Wan Ibrahim, W.N.; Tofighi, R.; Onishchenko, N.; Rebellato, P.; Bose, R.; Uhlén, P.; Ceccatelli, S. Perfluorooctane Sulfonate Induces Neuronal and Oligodendrocytic Differentiation in Neural Stem Cells and Alters the Expression of PPARγ in Vitro and in Vivo. Toxicology and Applied Pharmacology 2013, 269, 51–60. [Google Scholar] [CrossRef]
  110. Cao, Y.; Ng, C. Absorption, Distribution, and Toxicity of per- and Polyfluoroalkyl Substances (PFAS) in the Brain: A Review. Environ. Sci.: Processes Impacts 2021, 23, 1623–1640. [Google Scholar] [CrossRef]
  111. Hu, W.; Zhang, M.-Y.; Liu, L.-Y.; Zhang, Z.-F.; Guo, Y. Perfluoroalkyl and Polyfluoroalkyl Substances (PFASs) Crossing the Blood-Cerebrospinal Fluid Barrier: Their Occurrence in Human Cerebrospinal Fluid. Journal of Hazardous Materials 2023, 442, 130003. [Google Scholar] [CrossRef]
  112. Yu, Y.; Wang, C.; Zhang, X.; Zhu, J.; Wang, L.; Ji, M.; Zhang, Z.; Ji, X.-M.; Wang, S.-L. Perfluorooctane Sulfonate Disrupts the Blood Brain Barrier through the Crosstalk between Endothelial Cells and Astrocytes in Mice. Environmental Pollution 2020, 256, 113429. [Google Scholar] [CrossRef]
  113. Belay, M.H.; Robotti, E.; Ghignone, A.; Fabbris, A.; Brandi, J.; Cecconi, D.; Masini, M.A.; Dondero, F.; Marengo, E. Sensitive and Accurate Determination of 32 PFAS in Human Serum Using Online SPE-UHPLC-HRMS. Journal of Hazardous Materials 2025, 485, 136780. [Google Scholar] [CrossRef]
  114. Colnot, T.; Dekant, W. Commentary: Cumulative Risk Assessment of Perfluoroalkyl Carboxylic Acids and Perfluoralkyl Sulfonic Acids: What Is the Scientific Support for Deriving Tolerable Exposures by Assembling 27 PFAS into 1 Common Assessment Group? Arch Toxicol 2022, 96, 3127–3139. [Google Scholar] [CrossRef]
  115. McCarthy, C.J.; Roark, S.A.; Middleton, E.T. Considerations for Toxicity Experiments and Risk Assessments with PFAS Mixtures. Integrated Environmental Assessment and Management 2021, 17, 697–704. [Google Scholar] [CrossRef] [PubMed]
  116. Wan, R.; Cheli, V.T.; Santiago-González, D.A.; Rosenblum, S.L.; Wan, Q.; Paez, P.M. Impaired Postnatal Myelination in a Conditional Knockout Mouse for the Ferritin Heavy Chain in Oligodendroglial Cells. J. Neurosci. 2020, 40, 7609–7624. [Google Scholar] [CrossRef] [PubMed]
  117. Mason, J.L.; Jones, J.J.; Taniike, M.; Morell, P.; Suzuki, K.; Matsushima, G.K. Mature Oligodendrocyte Apoptosis Precedes IGF-1 Production and Oligodendrocyte Progenitor Accumulation and Differentiation during Demyelination/Remyelination. J. Neurosci. Res. 2000, 61, 251–262. [Google Scholar] [CrossRef] [PubMed]
  118. Faley, S.L.; Neal, E.H.; Wang, J.X.; Bosworth, A.M.; Weber, C.M.; Balotin, K.M.; Lippmann, E.S.; Bellan, L.M. iPSC-Derived Brain Endothelium Exhibits Stable, Long-Term Barrier Function in Perfused Hydrogel Scaffolds. Stem Cell Reports 2019, 12, 474–487. [Google Scholar] [CrossRef]
  119. Tukker, A. Is the Time Right for in Vitro Neurotoxicity Testing Using Human iPSC-Derived Neurons? ALTEX 2016. [Google Scholar] [CrossRef]
  120. Di Consiglio, E.; Pistollato, F.; Mendoza-De Gyves, E.; Bal-Price, A.; Testai, E. Integrating Biokinetics and in Vitro Studies to Evaluate Developmental Neurotoxicity Induced by Chlorpyrifos in Human iPSC-Derived Neural Stem Cells Undergoing Differentiation towards Neuronal and Glial Cells. Reproductive Toxicology 2020, 98, 174–188. [Google Scholar] [CrossRef]
  121. You, D.; Cohen, J.D.; Pustovalova, O.; Lewis, L.; Shen, L. Profiling Secreted miRNA Biomarkers of Chemical-Induced Neurodegeneration in Human iPSC-Derived Neurons. Toxicological Sciences 2022, 186, 221–241. [Google Scholar] [CrossRef]
  122. Hofrichter, M.; Nimtz, L.; Tigges, J.; Kabiri, Y.; Schröter, F.; Royer-Pokora, B.; Hildebrandt, B.; Schmuck, M.; Epanchintsev, A.; Theiss, S.; et al. Comparative Performance Analysis of Human iPSC-Derived and Primary Neural Progenitor Cells (NPC) Grown as Neurospheres in Vitro. Stem Cell Research 2017, 25, 72–82. [Google Scholar] [CrossRef]
Figure 1. Morphology of NSCs and neurospheres. (A) Neural stem cells (NSCs) after 3 days in suspension culture. (B) Neurospheres after 3 days of proliferation in suspension. (C) Neurospheres after 21 days of differentiation in 96-well low-adherent plates (10× objective). (D) Neurosphere after 21 days of differentiation in 96-well low-adherent plates (40× objective). Scale bars: 100 µm (A, B, D), 500 µm (C).
Preprints 178167 g001
Figure 2. Flow cytometry-based characterization of cortical neurospheres. (A) Representative dot plot and quantification of SATB2⁺ (Satb2) cells (% ± SD, n = 3), confirming the presence of post-mitotic neurons. (B) Dot plots and quantification of SOX2⁺ (Sox2) progenitors, GFAP⁺ (Gfap) astrocytic precursors, and TUBB3⁺ (Tubb3) immature neurons (% ± SD, n = 5), illustrating the coexistence of progenitor, astrocytic, and neuronal lineages. (C) Dot plots and quantification of MAP2⁺ (Map2) and BDNF⁺ (Bdnf) populations (% ± SD, n = 5), reflecting advancing neuronal maturation. (D) Mean fluorescence intensity (MFI) analysis of marker expression within positive populations. Left: SOX2⁺, GFAP⁺, and TUBBIII⁺ gates; right: MAP2⁺ and BDNF⁺ gates. MFI profiles reveal transitional subpopulations co-expressing lineage markers, including TUBBIII^dim (low-expressing) and TUBBIII^bright (high-expressing) neurons. (E) Dot plot and quantification of PSD95⁺ (Dlg4) cells (% ± SD, n = 3), confirming acquisition of postsynaptic features. Values represent mean ± SD from independent biological replicates.
Preprints 178167 g002
Figure 3. Neuronal and astrocytic differentiation in neurospheres over time. Confocal immunofluorescence staining of GFAP (astrocytes; green) and βIII-tubulin (neurons; blue) at week 1 (A–C), week 2 (D–F), and week 3 (G–I). GFAP⁺ processes progressively expand, while βIII-tubulin highlights neuronal soma-like structures and neuritic networks. Merged images (C, F, I) illustrate the progressive formation of mixed neuronal–glial networks. Representative maximum intensity projections of confocal Z-stacks are shown. Scale bar = 100 µm.
Preprints 178167 g003
Figure 4. Outgrowth and migration dynamics of neurospheres embedded in Geltrex. Immunofluorescence staining for GFAP (green) and TUBB3+ (blue). (A–C) Week 1: thin projections extend beyond the spheroid contour for both markers, with more abundant GFAP⁺ filaments at the periphery (A); neuronal somas and processes remain mainly interior (B); merged image shows overlapping projections (C). Bright-field (G) confirms outward extensions. (D–F) Week 2: discrete projections are reduced and a continuous rim forms at the border; GFAP⁺ processes localize along the surface (D), while TUBB3⁺ networks remain predominantly interior (E); merged image illustrates rim-like organization (F). Bright-field (H) shows similar peripheral accumulation. Representative maximum-intensity projections of confocal Z-stacks are shown. Scale bar = 100 µm.
Preprints 178167 g004aPreprints 178167 g004b
Figure 5. Synaptic maturation of neurospheres during differentiation. Immunofluorescence staining for Synaptophysin (SYP; Syp, green) in differentiating neurospheres at week 1 (A), week 2 (B), and week 3 (C). At week 1, SYP staining appeared as a diffuse signal with scattered puncta. By week 2, puncta became more abundant and localized along neurites and cluster peripheries. By week 3, puncta were dense and formed clusters, reflecting a progressive, stepwise maturation of presynaptic structures. Representative maximum-intensity projections of confocal Z-stacks are shown. Scale bar = 100 µm.
Preprints 178167 g005
Figure 6. Relative expression of neuronal and glial marker genes in 3D cortical neurospheres. (A) Heatmap showing log₂(2–ΔCt relative to GAPDH) values for all quantified genes (Neurod1, Map2, Gfap, Olig1, Syp, Bdnf, Mbp, Gabbr3, Slc18a, Ntrk1, Cd140a) in solvent-control neurospheres (Ctr < 0.01% DMSO). Biological replicates were n = 3 for Neurod1, Map2, Gfap, Syp, and Bdnf, and n = 2 for Mbp, Cd140a, Gabbr3, Slc18a, and Ntrk1. (B) Bar plot showing log₂(2–ΔCt relative to GAPDH) values for genes with n = 3 biological replicates only (Neurod1, Map2, Gfap, Olig1, Syp, Bdnf). Bars represent mean ± SD (n = 3). ΔCt values were calculated as Ct_target – Ct_GAPDH for each replicate, transformed to 2–ΔCt, and log₂-transformed before averaging. Negative log₂ values indicate expression levels lower than GAPDH.
Preprints 178167 g006
Figure 7. Proliferation assay of neurospheres under EGF+ and EGF– conditions. (A) Representative bright-field images of neurospheres at 0 h, 48 h, and 96 h in the presence (EGF⁺) or absence (EGF⁻) of growth factor. Scale bar = 100 µm. (B) Quantification of neurosphere diameter under EGF⁺ and EGF⁻ conditions over time. Data are mean ± SD (n = 6). Statistical significance was determined using Student’s t-test. ***p < 0.001 vs. EGF⁻ at the same time point.
Preprints 178167 g007
Figure 8. Effects of chlorpyrifos (CPF) and PFAS mixture on proliferative neurospheres. (A) Schematic representation of the experimental design: neurospheres were cultured in suspension, exposed at day 0, and maintained for 10 days before analysis. (B) Cell viability (XTT assay) after 10 days of exposure to CPF (37.1–250 µM) or PFAS mixture. CPF induced cytotoxicity at ≥125 µM, whereas the PFAS mixture did not significantly affect viability. Data are mean ± SD (n = 6). (C) Percentage of SATB2⁺ cortical neurons after 10 days of CPF exposure (37.1 µM). (D) Percentage of SOX2⁺ progenitors after 10 days of CPF exposure (37.1 µM). (E) Ki67 expression in control and CPF-exposed neurospheres after 10 days. (F) Cell cycle distribution determined by Ki67/PI double staining after 10 days of CPF exposure. Data in (C–F) are mean ± SD (n = 3). Statistical significance was determined using Student’s t-test or Welch’s correction when variances were unequal. p < 0.05 was considered significant compared to Ctr. While viability assays were performed after exposure to both CPF and PFAS mixture, marker expression and proliferation analyses were carried out after CPF exposure only.
Preprints 178167 g008
Figure 9. Effects of CPF and PFAS mixture on long-term neurosphere growth and viability. (A) Experimental design: cortical neurospheres were exposed to CPF (125 or 250 µM) or a PFAS mixture from the onset of differentiation (Day 0) and maintained under repeated exposure with medium renewal for 21 days to mimic chronic conditions. (B) Cell viability (XTT assay) at Day 21 showed a concentration-dependent decrease under CPF, with significant reduction at 250 µM, while PFAS induced a modest decrease. Data are mean ± SD (n = 6). (C) Growth kinetics from –3 days (pre-exposure) to Week 3 revealed distinct trajectories across treatments. Two-way repeated measures ANOVA indicated significant effects of time and treatment × time interaction, followed by Tukey’s post-hoc test (*p < 0.05, ***p < 0.001). PFAS-treated spheroids followed a control-like trajectory with early expansion and plateauing thereafter. Data are mean ± SD (n = 6). Statistical significance was determined using Student’s t-test for viability assays and two-way repeated measures ANOVA with Tukey’s post-hoc test for growth kinetics. p < 0.05 was considered significant compared to Ctr.
Preprints 178167 g009
Figure 10. Effects of CPF and PFAS mixture on neurosphere migration and viability. (A) Experimental design: neurospheres were pre-formed for 3 days and seeded on Day 0 in Geltrex-coated adherent culture, followed by exposure to CPF (125 or 250 µM) or a PFAS mixture. Radial migration was quantified at 20 min post-seeding (baseline) and daily until Day 3. Cultures were then maintained under repeated exposure with medium renewal until Day 10, when cell viability was assessed by XTT assay. (B) Representative bright-field images of cortical neurospheres exposed to CPF (125–250 µM) or PFAS mixture under repeated exposure with medium renewal. Control neurospheres (Ctr) displayed regular radial migration by Day 6 and Day 10, whereas CPF impaired migration in a dose-dependent manner and PFAS also restricted migration, albeit to a lesser extent. Scale bar = 100 µm. (C) Cell viability (XTT assay) at Day 10 showed significant cytotoxicity with CPF and a milder but significant reduction with PFAS. Data are mean ± SD (n = 3). Statistical significance was determined using Student’s t-test. p < 0.05, **p < 0.001 compared to Ctr.
Preprints 178167 g010
Figure 11. Effects of CPF and PFAS mixture on radial migration of differentiated neurospheres. (A) Representative bright-field images of neurospheres after 3 days of radial migration under control conditions or after exposure to CPF (125–250 µM) or PFAS mixture. Circles indicate the migration front used for distance quantification. Scale bar = 100 µm. (B) Quantification of migration distance from Day 0 (20 min post-seeding) to Day 3. Control neurospheres exhibited progressive expansion, whereas CPF- and PFAS-exposed spheroids showed impaired migration. Statistical significance between groups is indicated at Day 3 (p < 0.05, *p < 0.01 vs. control; Tukey’s post-hoc test) compared to Ctr. Within-group comparisons over time are described in the Results section. Data are mean ± SD (n = 6 independent experiments). Statistical analysis was performed using two-way repeated measures ANOVA followed by Tukey’s post-hoc test.
Preprints 178167 g011
Figure 12. Effects of CPF and PFAS mixture on the expression of neurodevelopmental genes in differentiated neurospheres. (A) Heatmap representation of log₂ fold change (2-ΔΔCt) values relative to control, normalized to GAPDH, for neuronal (Neurod1, Map2, Bdnf, Syp), astrocytic (Gfap), oligodendrocytic (Olig1, Mbp), and signaling-related (Gabbr3, Slc18a, Ntrk1, Cd140a) genes after 21 days of exposure to CPF (125 µM or 250 µM for Gfap) or PFAS mixture. Genes detected in only two biological replicates (Mbp, Gabbr3, Slc18a, Ntrk1, Cd140a) are shown descriptively in the heatmap only. (B–C) Relative expression of Neurod1 and Map2 (n = 3). (D) Gfap expression after CPF125 µM and PFAS exposure (n = 3), left panel, and after CPF250 µM exposure, right panel. (E) Gfap expression under CPF250 µM exposure (n = 3). (F) Syp expression after CPF125 µM and PFAS exposure (n = 3). (G) Bdnf expression (n = 3). Data are mean ± SD. Statistical significance was determined using Welch’s t-test (two-tailed, unequal variances). p < 0.05 was considered significant compared to Ctr.
Preprints 178167 g012
Table 1. Composition of the PFAS mixture used for exposure experiments.
Name Acronym Formula Chain Length Final conc. (µg/L) Final conc. (nM)
Perfluoro-octane sulfonic acid PFOS C8HF17O3S Long-chain (C8) 2.22 ~4.4
Perfluorooctanoic acid PFOA C8HF15O2 Long-chain (C8) 1.56 ~3.8
Perfluoroundecanoic acid PFUnDA C11HF21O2 Long-chain (C11) 0.12 ~0.23
1H,1H,2H, 2H-perfluorohexane sulfonic acid 1H,1H,2H, PFHxS C6H5F11O3S Short-chain (C6) 0.79 ~2
Table 2. Genes and probes ID used for qPCR analysis of neurospheres.
Gene name Gene Symbol Assay ID
Neurogenic differentiation 1 Neurod1 Mm01946604_s1
Microtubule-associated protein 2 Map2 Mm00485231_m1
Glial fibrillary acidic protein Gfap Mm01253033_m1
Oligodendrocyte transcription factor 1 Olig1 Mm00497537_s1
Myelin basic protein Mbp Mm01266402_m1
Synaptophysin Syp Mm00436850_m1
Brain-derived neurotrophic factor Bdnf Mm04230607_s1
PDGF receptor alpha (used as CD140a marker) Pdgfra (Cd140a) Mm00440701_m1
GABA-A receptor subunit beta-3 Gabrb3 Mm00433473_m1
Vesicular acetylcholine transporter Slc18a3 Mm00491465_s1
Neurotrophic receptor tyrosine kinase 1 Ntrk1 Mm01219406_m1
Glyceraldehyde-3-phosphate dehydrogenase (reference) Gapdh Mm99999915_g1
Disclaimer/Publisher’s Note: The statements, opinions and data contained in all publications are solely those of the individual author(s) and contributor(s) and not of MDPI and/or the editor(s). MDPI and/or the editor(s) disclaim responsibility for any injury to people or property resulting from any ideas, methods, instructions or products referred to in the content.
Copyright: This open access article is published under a Creative Commons CC BY 4.0 license, which permit the free download, distribution, and reuse, provided that the author and preprint are cited in any reuse.
Prerpints.org logo

Preprints.org is a free preprint server supported by MDPI in Basel, Switzerland.

Subscribe

Disclaimer

Terms of Use

Privacy Policy

Privacy Settings

© 2025 MDPI (Basel, Switzerland) unless otherwise stated