Submitted:
24 September 2025
Posted:
25 September 2025
You are already at the latest version
Abstract
α-MnO₂, β-MnO₂, and δ-MnO₂ catalysts were prepared by hydrothermal method and redox precipitation method. These catalysts show excellent formaldehyde oxidation performance at room temperature. Among them, the δ-MnO₂ catalyst performs best . The Ag/δ-MnO₂@ANF catalyst was prepared by hydrothermal method, redox method, etc., and its structure and morphology were deeply analyzed by means of multiple characterization methods. Experiments show that this catalyst shows excellent catalytic oxidation performance for formaldehyde at room temperature. Among them, 3% Ag/δ-MnO₂@ANF has the highest catalytic efficiency and can achieve 100% formal-dehyde conversion rate in a short time, and has good cycle stability. Its excellent per-formance stems from the synergistic effect of Ag, δ-MnO₂ and ANF. Ag promotes the generation of reactive oxygen species, δ-MnO₂ provides abundant active sites, and ANF increases the specific surface area to facilitate formaldehyde adsorption.
Keywords:
catalytic formaldehyde
; manganese dioxide
; Silver-loaded catalyst
1. Introduction
With the continuous improvement of people’s living standards [1], there is a growing concern about indoor air pollution problems caused by decoration materials, air pollution, and other factors in the home environment. The slow release of pollutants such as formaldehyde from furniture [2], as well as the breeding of viruses and bacteria induced by air pollution, pose a huge threat to human respiratory health. How to efficiently purify indoor air has become one of the important research topics in the field related to people’s livelihood and health [3].
The research team led by Professor Zhang Pengyi [4] from Tsinghua University has been committed to the research on the treatment of various indoor pollutants for more than 20 years, focusing on the development of formaldehyde-removing catalysts and the preparation of composite filter materials [5]. The activated manganese filter and activated manganese/HEPA composite filter developed by the team have been applied in air purifier products on the market [6]. On this basis, Ni et al. dispersed silane-modified MnO2 in polyacrylic acid resin, impregnated it on one side of cellulose paper [7], and prepared functional decorative paper through hot pressing. At 20℃, its formaldehyde removal rate can reach 90%. To further enhance the adsorption and catalytic oxidation performance of formaldehyde, Zhu et al. [8]. synthesized tubular g-C3N4 with high specific surface area by hydrothermal method, and loaded Fe2O3 on its surface through impregnation method [9], forming a Z-scheme heterojunction between g-C3N4 and Fe2O3. Under visible light irradiation at room temperature, Ye et al. [10]. ultrasonically dispersed carbon nanotubes (CNTs) grafted with polyethyleneimine (PEI) and graphene oxide (GO), and then prepared CNT-PEI@rGA aerogel through a series of processes such as hydrothermal assembly, pre-freezing, hydrazine vapor reduction, and freeze-drying [11]. Benefiting from this structured chemical-physical synergistic effect [12], the formaldehyde adsorption capacity of the aerogel is as high as 568.41 mg/g. Zhong et al. designed a new type of hybrid hydrogel coating with multi-scale channel structure and applied it to fiber-based polyurethane materials [13]. This coating achieves the functions of removing formaldehyde from the air and killing bacteria through the adsorption of amines in polydopamine and the synergistic effect of Ag/MgO nanoparticles in the hybrid hydrogel coating [14].
In this study, we aim to solve the environmental problems caused by various low-concentration pollutants such as formaldehyde and benzene derivatives continuously volatilized from indoor furniture and decorative materials, while addressing the existing problems of porous air purification materials, such as high gas adsorption competition, high energy consumption, and single function [15]. We propose to develop an environmentally friendly curtain material integrating multiple functions such as adsorption and catalysis. This research idea retains the traditional light-shielding and decorative functions of curtains, while endowing them with multi-level pore structure and photothermal conversion properties.
2. Materials and Methods
2.1. Materials
Mn(NO3)2,MnSO4,KMnO4,C2H6OS,HCHO,MBTH, NH4Fe(SO4)2·12H2O, NaBH4, AgNO3, NaOH were supplied by Nanjing Chemical Specimen Co. (Nanjing, China). All chemicals are analytical grade and used without further puriffcation.
2.2. Synthesis of Catalysts
Preparation of α-MnO2:Dissolve KMnO4 and MnSO4 in 20 mL of deionized water respectively, and stir until completely dissolved [16]. Transfer the mixed solution into a 100 mL high-pressure reaction kettle lined with polytetrafluoroethylene, seal it, and place it in an oven. Conduct the constant-temperature reaction at 140℃ for 12 hours. After naturally cooling to room temperature, collect the black precipitate by centrifugation. Wash it with deionized water 3 times and ethanol once to remove residual ions. Dry it under vacuum at 60℃ for 6 hours, and grind to obtain α-MnO2 nanowires
Preparation of β-MnO2:Dissolve Mn(NO3)2 in 50 mL of deionized water, and stir to form a transparent solution . Transfer the solution into a porcelain crucible and place it in a muffle furnace [17]. Heat up to 300℃ at a rate of 5℃/min, and perform constant-temperature calcination for 4 hours. After naturally cooling, grind to obtain dark brown β-MnO2 powder [18].
Preparation of δ-MnO2:Dissolve NaOH in 50 mL of water to prepare a 1 mol/L solution. Dissolve KMnO4 and MnCl2 in 25 mL of water respectively [19]. Drop the KMnO4 solution into the MnCl2 solution, and slowly add the NaOH solution under stirring (maintain pH > 12). Stir vigorously at room temperature for 2 hours, and the solution changes from purple-red to brownish-black. Collect the precipitate by centrifugation, and wash it with deionized water. Dry it under vacuum at 60℃ for 8 hours to obtain δ-MnO2 nanosheets.
Preparation of Ag/δ-MnO2:Weigh a certain amount of AgNO3, dissolve it in deionized water, and prepare a silver salt solution with the required concentration. Under continuous stirring, slowly add the silver salt solution to the δ-MnO2 suspension to ensure sufficient mixing. Continue stirring for 2 hours to allow silver ions to be fully adsorbed on the surface of δ-MnO2. Take an appropriate amount of NaBH4, dissolve it in deionized water, and prepare a reducing agent solution. Slowly add the NaBH4 solution to the δ-MnO2 suspension containing silver ions [20], react for 1 hour, and observe the color change of the solution to confirm whether the silver ions are successfully reduced. After the reaction is completed, wash the solid product with deionized water several times to remove unreacted silver salts and excess reducing agent. Dry the washed solid in an oven at 80℃ for 12 hours until the sample is completely dry.
Preparation of Aramid Nanofibers (ANF): Dissolve 0.5 g of KOH in 200 mL of DMSO solution and stir for half an hour [21]. Then add 0.8 g of 4 wt% PPTA fibers and continue stirring for 2 hours. Finally, slowly add 10 mL of deionized water to obtain aramid nanofibers.
2.3. Characterization
Powder X-ray diffraction patterns were obtained by a Rigaku SmartLab diffractometer (Tokyo, Japan) using Cu Kα (λ = 0.154178 nm) as a radiation source. The morphology of the samples was measured by scanning electron microscope (SEM, Ultra-55, Zeiss, Oberkochen, Germany). The samples were pretreated at 105 ◦C for 12 h before measurement. The electrochemical impedance was measured at the electrochemical workstation CH1660E. X-ray Photoelectron Spectroscopy (XPS) was performed on a spectrometer using a monochromatic Al Kα X-ray source to analyze the chemical composition of the catalyst surface and the content of the corresponding elements.
2.4. Catalytic Formaldehyde Performance Test
The room-temperature catalytic formaldehyde test was conducted in a 500 mL sealed glass reactor (Figure 1): formaldehyde solution was injected via a syringe to allow complete volatilization, after which the internal petri dish was uncovered to expose the catalyst. The concentrations of formaldehyde and CO2 in the reactor were measured to calculate the formaldehyde removal efficiency and the conversion rate of the composite material [22]. Specifically, the formaldehyde removal efficiency and conversion rate were calculated by detecting the concentrations of formaldehyde and CO2 at the inlet and outlet [23]. Their calculation methods are shown in Equations (1) and (2) respectively. The formaldehyde conversion rate of the catalyst was calculated based on the finally generated carbon dioxide, which was determined by an infrared multi-component gas detector or a gas chromatograph. The concentration of formaldehyde was measured by detecting the absorbance of the phenol reagent after formaldehyde absorption using a spectrophotometer.
Formaldehyde Removal Efficiency: η = (C −Ct)/ Ct
Formaldehyde Conversion Efficiency: λ =(Ct−C0)/CHCHO
In Equation (1), C0 is the initial formaldehyde concentration, and Ct is the formaldehyde concentration after the reaction has proceeded for t time.
In Equation (2), C0 is the initial CO2 concentration, Ct is the CO2 concentration after the reaction has proceeded for t time, and CHCHO is the initial formaldehyde concentration (800 ppm).
3. Results and Discussion
3.1. Morphology and Structure of α-MnO2, β-MnO2, and δ-MnO2
The XRD patterns of MnO2 samples with different crystal phases are shown in Figure 2. The diffraction peaks of β-MnO2 are sharp and intense, indicating high crystallinity, a relatively complete and regular crystal structure, and strong ordering of crystal plane arrangement [24]. In contrast, the diffraction peaks of α-MnO2 are relatively weak and broad, suggesting lower crystallinity. The crystal structure may have certain defects or smaller grain sizes, leading to the broadening of diffraction peaks. δ-MnO2 has a layered structure with cations and water between the layers [25]; this unique structure endows it with abundant active sites, which facilitate the adsorption and diffusion of reactants.
Figure 3 shows the Scanning Electron Microscope (SEM) images of α-MnO2, β-MnO2, and δ-MnO2. (a), (b): The images reveal that α-MnO2 exhibits a morphology aggregated by fine rod-like or fibrous structures [26]. These fine structures are intertwined and stacked with each other, forming relatively complex agglomerates. The overall appearance is relatively fluffy, reflecting its unique one-dimensional structural characteristics and aggregation state.(c), (d): β-MnO2 presents granular structural features, with particles stacked together. Compared with α-MnO2, its structure is more compact, and the shape of the particles is relatively regular, showing a certain crystalline morphology, which embodies the characteristics of β-MnO2 in terms of crystal growth and aggregation mode.(e), (f): δ-MnO2 has an obvious layered structure. In the images, flake-like structures can be clearly seen stacked with each other, forming a layered stacking morphology.
The N2 adsorption-desorption isotherms of MnO2 (Figure 4) exhibit a loop shape. δ-MnO2 shows an obvious peak at a pore size of approximately 10 nm, indicating that its pore volume is most concentrated around this pore size, with abundant mesoporous structures and a relatively large overall pore volume. The peak of β-MnO2 appears in a slightly smaller pore size region, and the curve drops rapidly, suggesting that its pore volume distribution is relatively concentrated in smaller pores, but the total pore volume is smaller than that of δ-MnO2. α-MnO2 has the lowest peak and a small rate of change in pore volume, indicating that its pore structure is underdeveloped and the pore volume is small. At high relative pressures, the adsorption capacity increases sharply, showing an obvious hysteresis loop. This is a typical characteristic of mesoporous or macroporous structures. At high relative pressures, nitrogen undergoes capillary condensation in the pores, leading to a rapid increase in adsorption capacity, which indicates that δ-MnO2 has a large specific surface area and pore volume, as well as strong adsorption capacity.
Pore distributions of δ-MnO2, α-MnO2 and β-MnO2
Figure 5 presents the X-ray Photoelectron Spectroscopy (XPS) test results of three catalysts: α-MnO2, β-MnO2, and δ-MnO2. (a) Survey spectrum: Different elements and their chemical states correspond to specific binding energy positions. The figure shows that all three catalysts have characteristic peaks of Mn 2p and O 1s, indicating that they all contain manganese and oxygen elements. The simultaneous appearance of the C 1s peak may originate from carbon-containing impurities adsorbed on the catalyst surface. (b) This subfigure shows the deconvolution fitting of the Mn 2p3/2 peak, which can distinguish the contribution peaks of two valence states: Mn3+ and Mn4+. It can be seen from the figure that there are differences in the proportions and peak positions of Mn3+ and Mn4+ among different MnO2 materials. For example, the proportion of the two valence states and the binding energy positions in δ-MnO2 are different from those in α-MnO2 and β-MnO2. These differences reflect the distinctions in their electronic structures and chemical environments [27]. (c) Mn 3s spectrum: Corresponding to the binding energy range of electrons in the Mn 3s orbital. The figure shows that the Mn 3s spectral peaks of the three MnO2 materials have differences in splitting energy (such as the marked 4.95 eV, 4.85 eV, and 4.55 eV). (d) O 1s deconvolution spectrum: Corresponding to the binding energy range of electrons in the O 1s orbital. Deconvolution fitting is performed on the O 1s peak to distinguish lattice oxygen (Oₗₐₜₜ), surface-adsorbed oxygen (Oₛᵤᵣf), and adsorbed water oxygen (OH2O). The proportions and binding energy positions of these oxygen species vary among different MnO2 materials. Lattice oxygen and surface-adsorbed oxygen play a crucial role in catalytic reactions. A higher content of surface-adsorbed oxygen may be beneficial to the progress of certain oxidation reactions, while the proportion of different oxygen species can affect the oxidation performance and reaction activity of the catalyst. The O 1s spectrum shows three peaks at 529.8 eV, 531.3-531.9 eV, and 532.6-533.6 eV, corresponding to lattice oxygen (Oₗₐₜₜ), surface-adsorbed oxygen (Oₛᵤᵣf), and OH groups of surface-adsorbed water in MnO2, respectively. This indicates that δ-MnO2 has the highest content of surface-adsorbed oxygen.
3.2. Morphology and Structure of Ag/δ-MnO2@ANF
The X-ray diffraction (XRD) patterns of the prepared δ-MnO2 and Ag/δ-MnO2 catalysts are shown in Figure 6. During the loading process, composite catalysts with different silver loadings were obtained by adjusting the concentration of the silver nitrate solution. As shown in the figure, δ-MnO2 was prepared by the hydrothermal reaction of KMnO4 and MnSO4•H2O at 175 °C [28]. If a broadened peak appears around 2θ ≈ 12°, it may correspond to the (001) crystal plane of δ-MnO2. This broadening phenomenon is related to the small thickness of the nanosheets or the disorder between layers, indicating the periodic stacking of the layered structure.
The morphologies of the as-prepared δ-MnO2 and Ag/δ-MnO2 catalysts are shown in Figure 7, exhibiting a typical layered stacking structure. The thickness of the flakes is approximately 5-10 nm, and the lateral size can reach several hundred nanometers, which is consistent with the periodic stacking result of the (001) crystal plane analyzed by XRD. Nanoscale pores (diameter < 10 nm) can be observed between the layers, which may originate from the partial dehydration process of hydrated manganese oxides. The aggregates are composed of a large number of flaky or layered nanostructured units [29]. These units stack and interweave with each other, forming a complex three-dimensional structure. This morphology may be the result of the combined action of self-assembly during the material preparation process and interparticle interactions (such as van der Waals forces and electrostatic forces). The presence of silver nanoparticles can be observed in the Mapping images, thereby confirming that the noble metal silver is successfully loaded.
The morphology of the prepared aramid nanofibers is shown in Figure 8. The SEM image is the scanning electron micrograph of the sample added with graphene and Ag/δ-MnO2 catalyst, while the photo shows the physical appearance of the aramid nanofibers.From the SEM image, it can be observed that after adding the graphene solution, the aramid nanofibers exhibit a complex porous network structure. The incorporation of graphene may promote tighter interweaving of the aramid nanofibers, resulting in the formation of abundant pores. This structure increases the specific surface area of the material, providing more sites for adsorption and loading of other substances. The porous structure is beneficial to improving the adsorption performance of the material; if used in the filtration field, it can enhance the ability to capture tiny particles.In the physical photo, the aramid nanofiber product has a regular shape and a relatively uniform surface, indicating that the material has good dispersibility during the preparation process without obvious agglomeration.
To understand the relationship between material structure and adsorption performance, as well as the influence mechanism of loading and compounding on the pore structure of materials, nitrogen adsorption-desorption analysis was performed on the Ag/δ-MnO2@ANF composite catalyst, Ag/δ-MnO2 sample, and pure δ-MnO2 sample. As shown in Figure 9, for δ-MnO2, the adsorption capacity increases slowly in the low relative pressure region, where nitrogen mainly undergoes monolayer adsorption on the surface of micropores and some mesopores. With the increase of relative pressure, the adsorption capacity rises gradually; when the relative pressure is close to 1, the adsorption capacity increases rapidly, corresponding to the multilayer adsorption and capillary condensation phenomena in macropores and mesopores. The curve trend of Ag/δ-MnO2 is similar to that of δ-MnO2, but there is an overall difference in adsorption capacity [30]. This may be due to the fact that silver loading changes the pore structure of δ-MnO2 (e.g., blocking some pores or introducing new pores), thereby affecting nitrogen adsorption. The variation trend of adsorption capacity of Ag/δ-MnO2@ANF is similar, but its adsorption capacity differs across the entire relative pressure range. This indicates that after the introduction of aramid nanofibers (ANF), the pore structure and adsorption performance of the composite material have changed, possibly because the interaction between ANF and Ag/δ-MnO2 affects the nitrogen adsorption behavior.
δ-MnO2 has obvious pore size distribution characteristics, with significant changes in pore volume in certain pore size ranges. This suggests that δ-MnO2 has a specific pore structure, which may be dominated by a certain type of pore size (e.g., mesopore range). The pore size distribution of Ag/δ-MnO2 is different from that of δ-MnO2, with differences in peak positions and variation trends. This indicates that silver loading changes the pore size distribution of δ-MnO2, possibly destroying the original pore structure or generating new pore structures, thereby affecting the proportion and quantity of pores with different sizes. The pore size distribution curve of Ag/δ-MnO2@ANF is unique and different from the previous two. This shows that after the introduction of ANF, the pore size distribution of the composite material changes significantly, which may be due to the filling or wrapping of ANF on the surface and pores of Ag/δ-MnO2, altering the overall pore structure and pore size distribution.
3.3. Catalyst Performance
Figure 10(a) depicts HCHO conversion over time for δ-MnO2, α-MnO2, and β-MnO2. δ-MnO2 rises fastest, reaching ~90% conversion around 20 minutes and remaining stable. α-MnO2 increases more slowly to ~75%, while β-MnO2 has the slowest initial rate, topping at ~65%. Figure 10(b) shows removal efficiency: δ-MnO2 quickly climbs to nearly 100% and sustains it, α-MnO2 reaches ~95%, and β-MnO2 ~90%. Overall, δ-MnO2 exhibits the best catalytic performance for HCHO conversion and removal, followed by α-MnO2, with β-MnO2 being relatively less effective.
As depicted in Figure 11, the change in HCHO concentration over time reflects the formaldehyde conversion rate of the composite catalysts. Initially, the HCHO concentration was 600 ppm. Under the action of Ag/δ-MnO2 catalysts with different Ag loadings, the HCHO concentration decreased rapidly. The 9% Ag/δ-MnO2 catalyst showed the fastest initial decrease in HCHO concentration, but the rate of decrease slowed down afterward. In contrast, although the 3% Ag/δ-MnO2 catalyst did not exhibit the fastest initial decrease rate, it ultimately achieved a significant reduction in HCHO concentration. After reaching a high removal efficiency, the 3% Ag/δ-MnO2 catalyst maintained a relatively stable removal effect and ranked among the top in terms of efficiency throughout the entire reaction period. This indicates that it can stably and efficiently remove HCHO within a certain period of time. Additionally, the 3% Ag/δ-MnO2 catalyst led in CO2 generation for most of the time, suggesting that it could more effectively convert HCHO into CO2, thereby promoting the oxidation reaction. This is further confirmed in Figure 11b. Within the same time frame, the HCHO conversion rate of the 3% Ag/δ-MnO2 catalyst was higher than that of catalysts with other Ag loadings, demonstrating its higher activity and ability to facilitate the conversion of more HCHO.
Figure 11.
Formaldehyde conversion rate of Ag/δ-MnO2 catalyst.
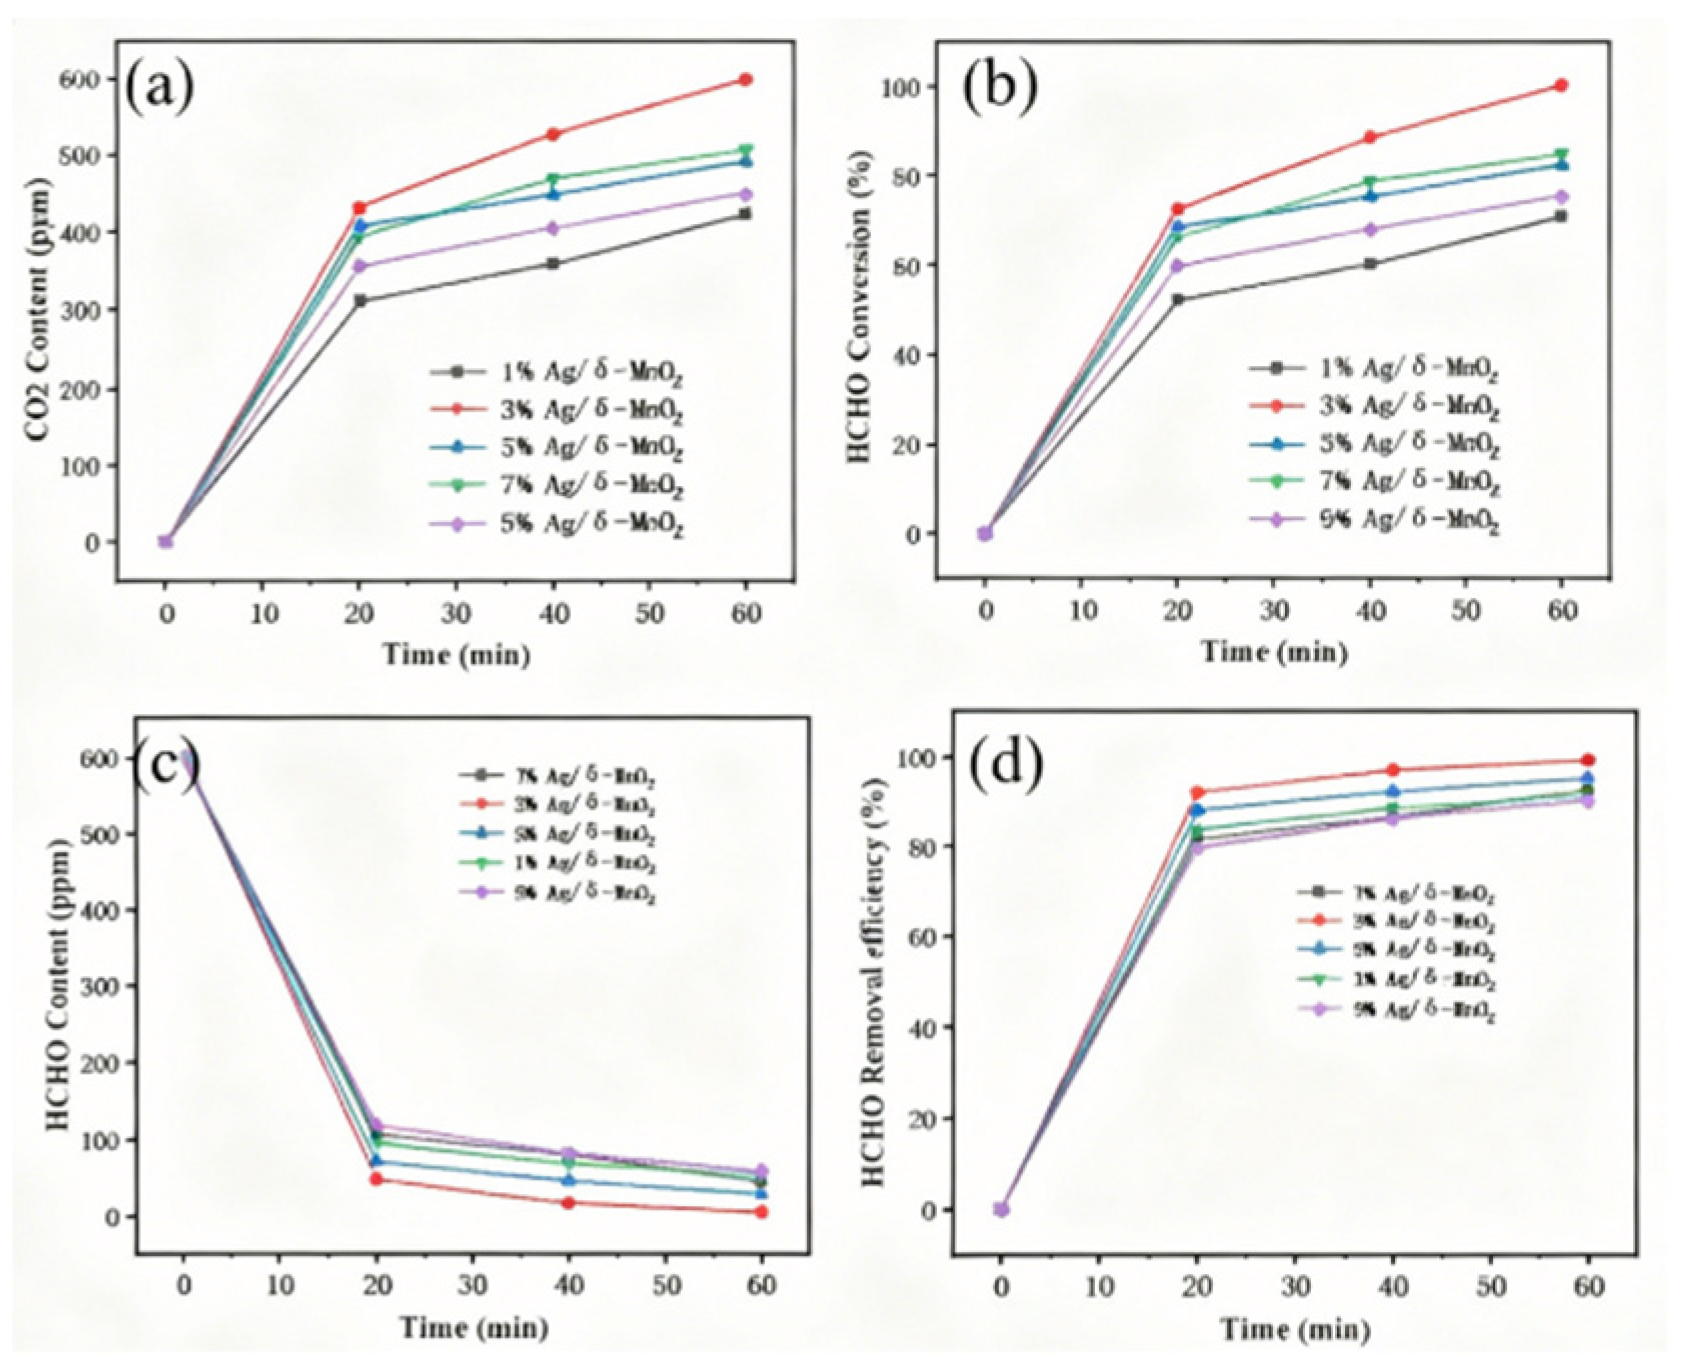
Figure 12.
Catalyst cycle stability test.
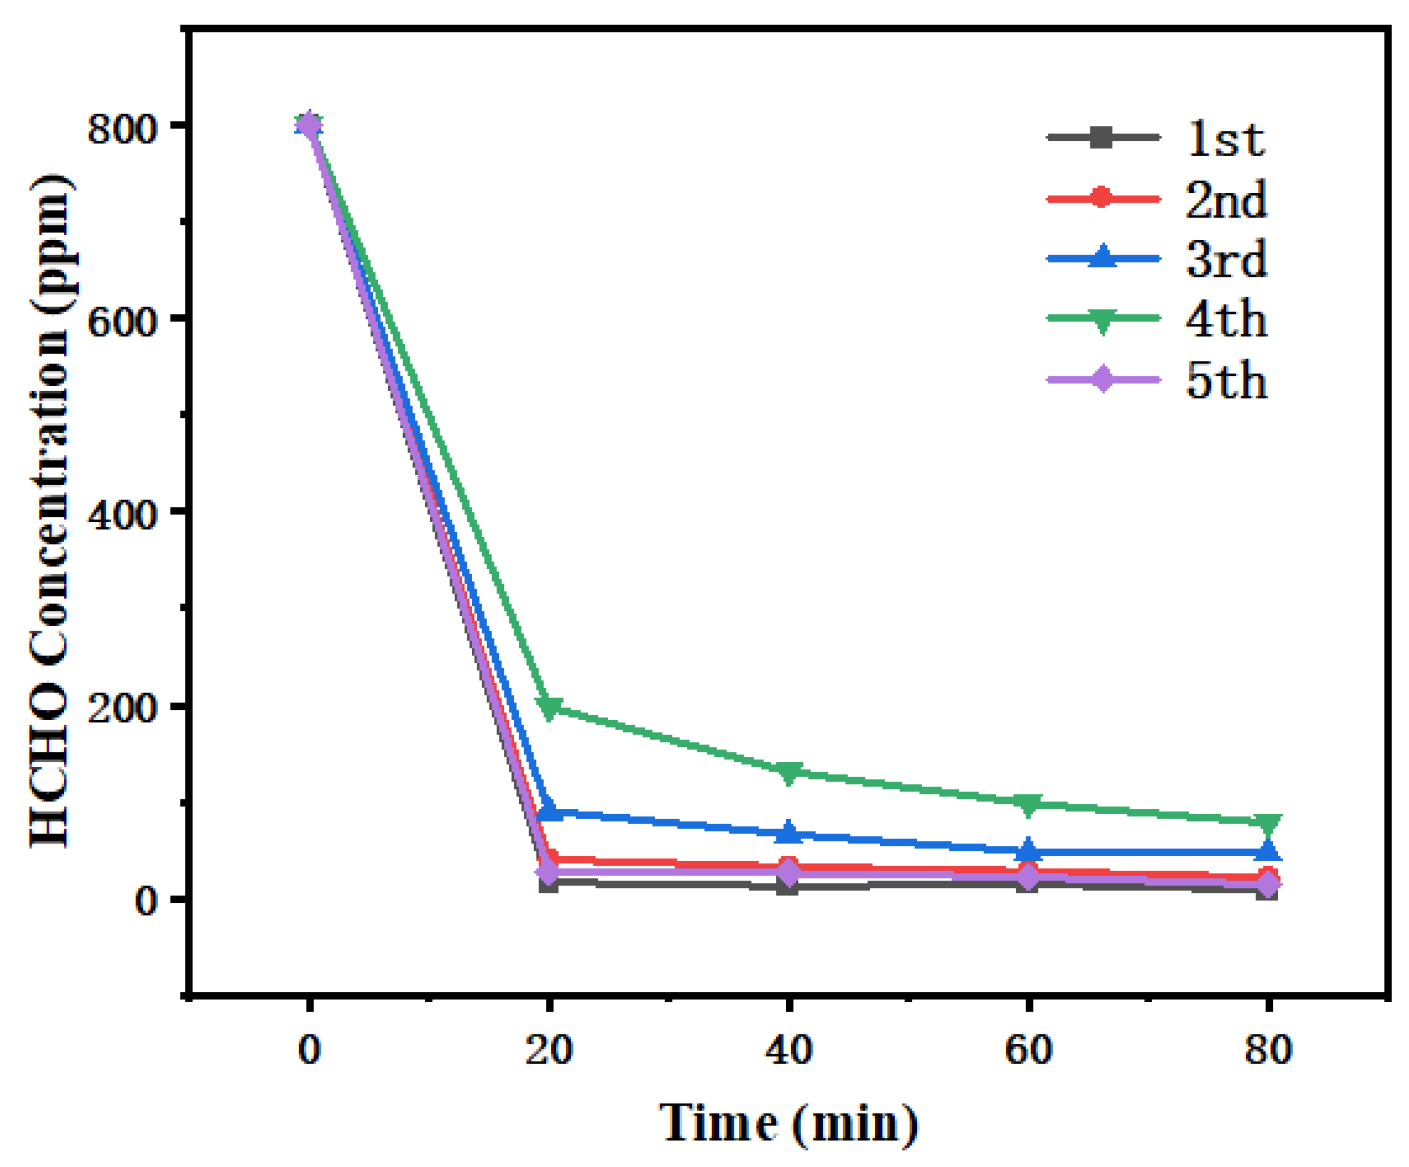
From the results of the cyclic tests, although the catalyst’s ability to reduce HCHO concentration declined slightly after multiple cycles, it could still significantly decrease the HCHO concentration in a relatively short time. In the first cycle, it rapidly reduced the HCHO concentration from 600 ppm to a low level. By the fifth cycle, although the initial rate of HCHO concentration decrease slowed down, a certain removal effect could still be achieved. This indicates that the Ag/δ-MnO2 catalyst has a certain degree of stability and durability, and can still maintain a certain catalytic ability to remove HCHO after multiple uses. In terms of HCHO catalytic efficiency, the 3% Ag/δ-MnO2 catalyst performed exceptionally well. It exhibited excellent performance in reducing HCHO concentration, improving removal efficiency, and promoting the conversion of HCHO to CO2, demonstrating outstanding comprehensive performance throughout the entire reaction period. The cyclic test results confirm that the Ag/δ-MnO2 catalyst possesses a certain level of stability.
3.5. The Impact of Reactive Oxygen Species on Catalytic Performance
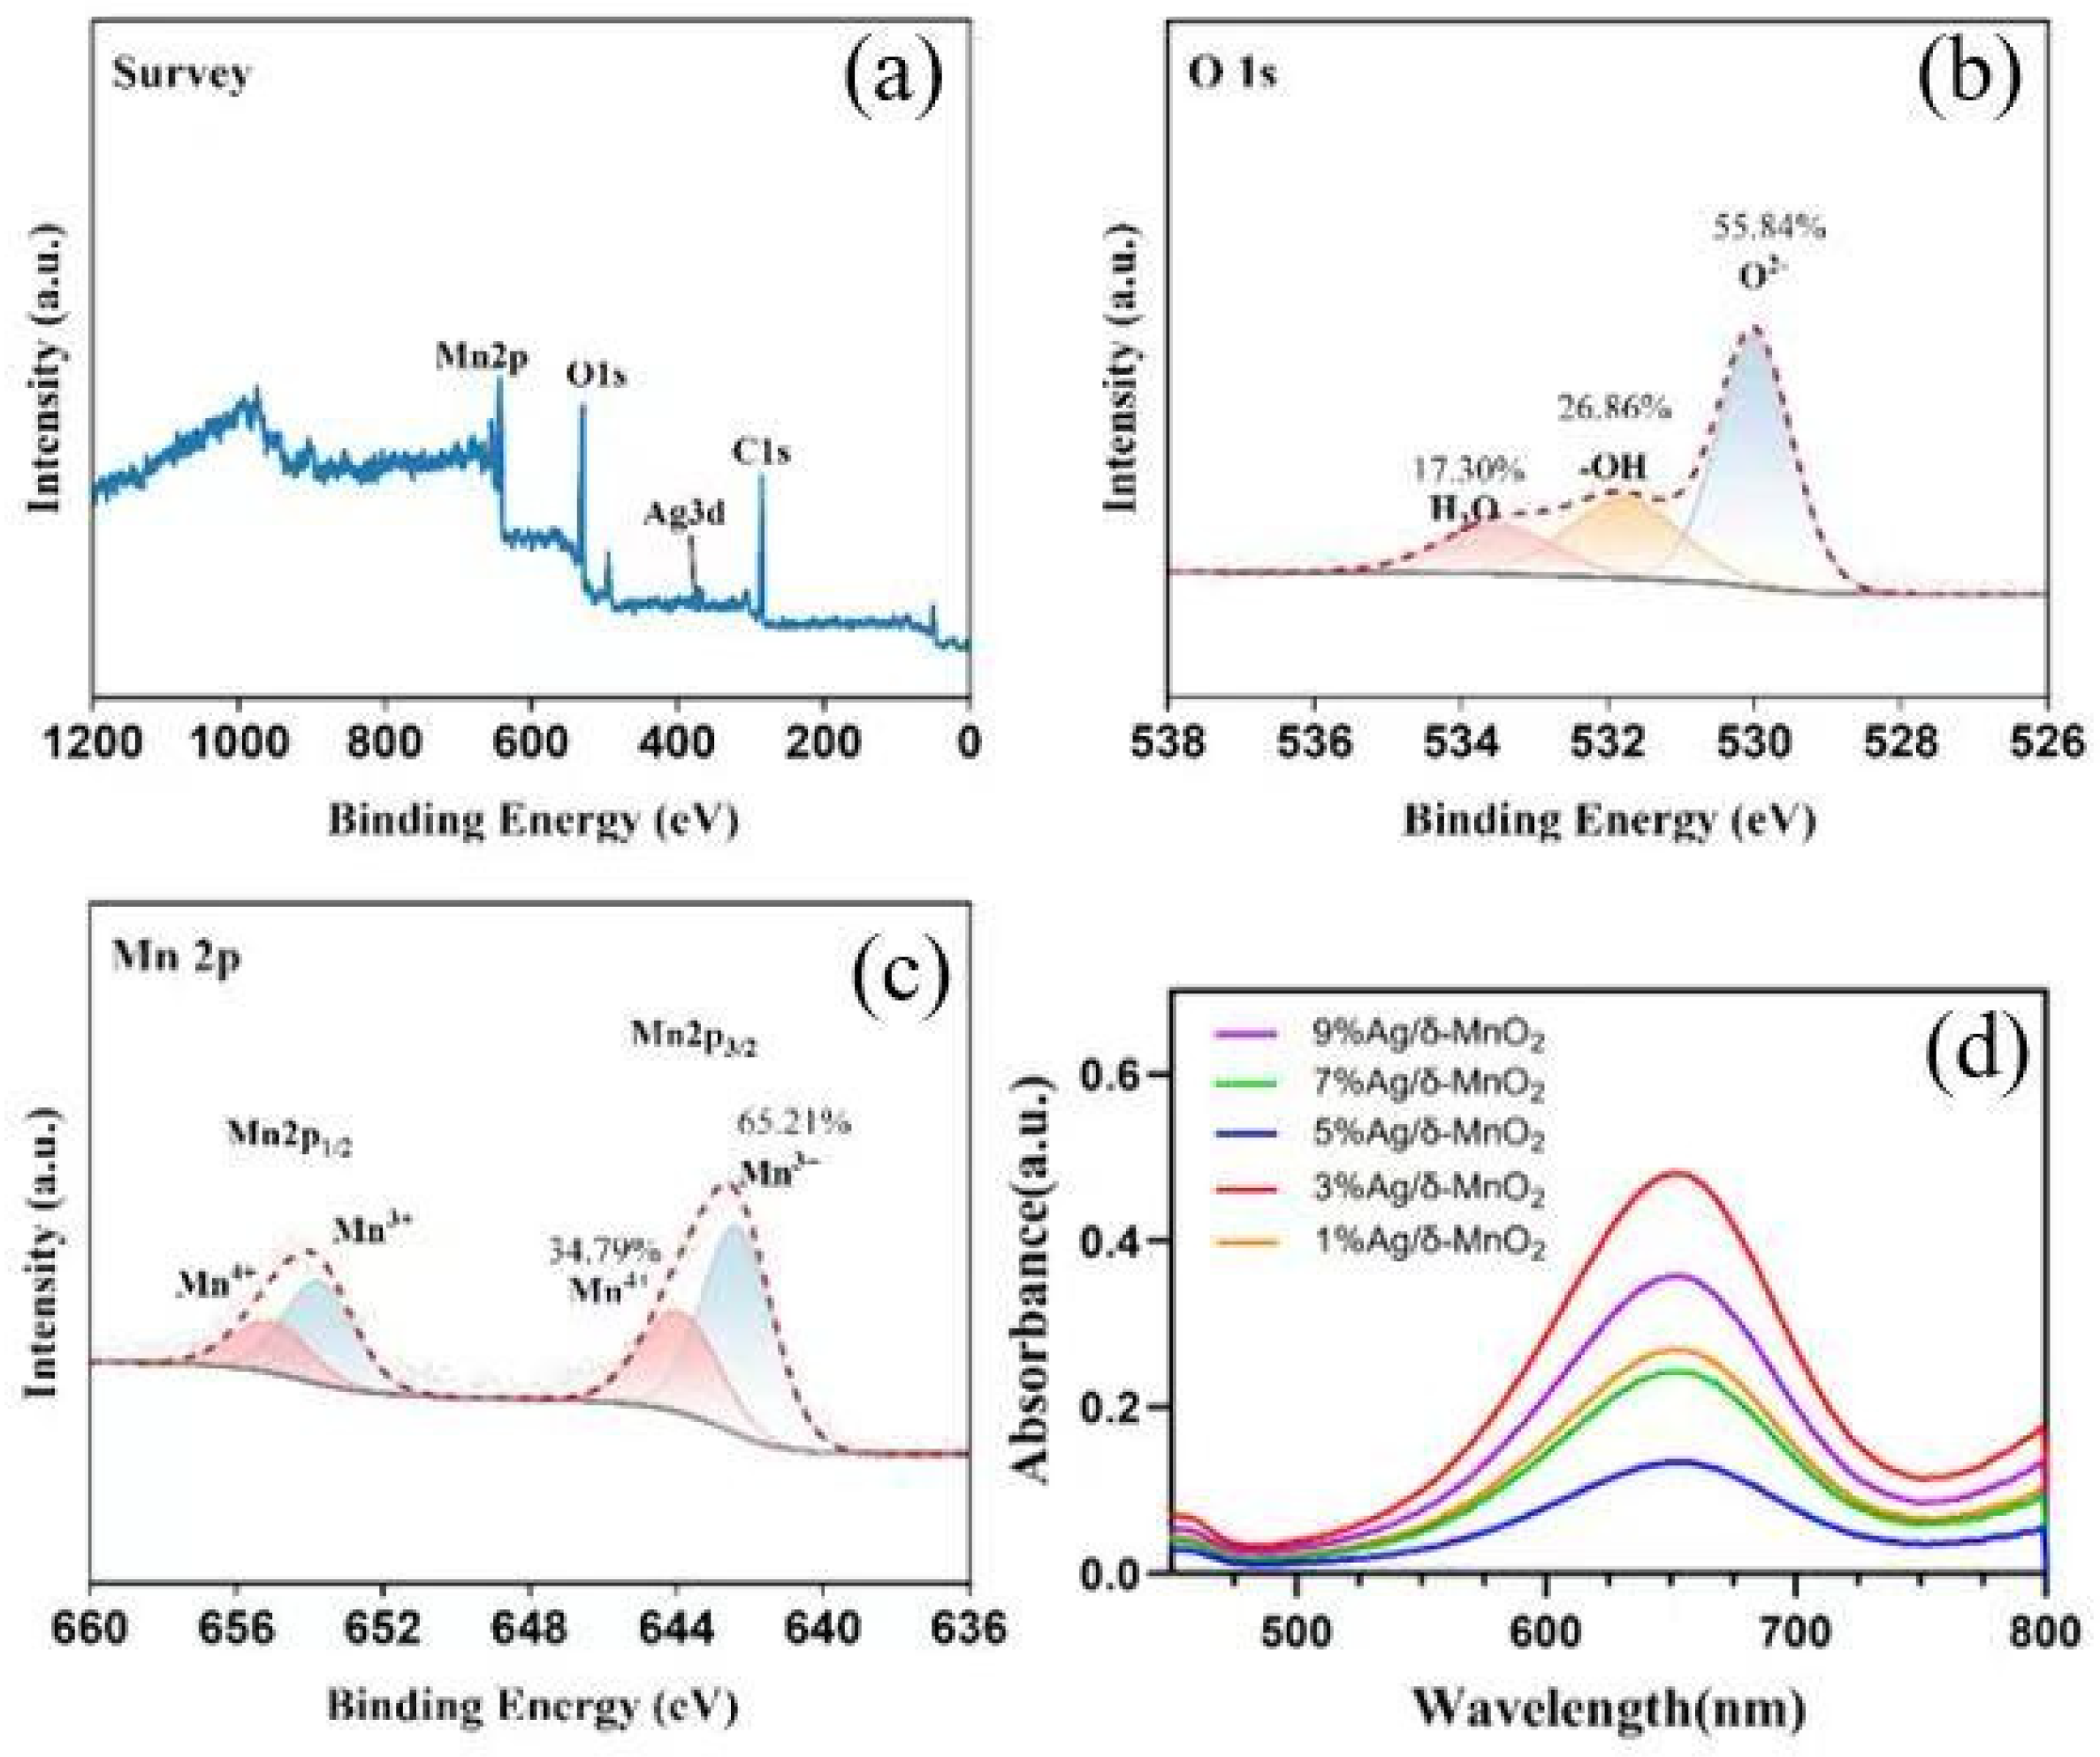
As shown in Figure 13, the spectrum exhibits two characteristic peaks, namely Mn 2p1/2 and Mn 2p3/2. The Mn 2p3/2 peak can be further deconvoluted into contribution peaks from Mn3+ and Mn4+. Among them, Mn4+ accounts for 34.79%, and Mn3+ accounts for 65.21%. The presence of manganese in different valence states has a crucial impact on the performance of the catalyst. The redox cycle between Mn3+ and Mn4+ is an important process in the catalytic reaction. Mn4+ can accept electrons and be reduced to Mn3+, while Mn3+ can lose electrons and be re-oxidized to Mn4+. This cycle provides active sites and electron transfer channels for the catalytic reaction. A relatively high proportion of Mn3+ indicates that the catalyst has stronger electron transfer capability and redox activity in redox reactions, which is beneficial to the catalytic oxidation of substances such as formaldehyde.
After spectral deconvolution, three oxygen species are shown to exist: O2− accounts for 55.84%, -OH for 26.86%, and H2O for 17.30%. Lattice oxygen (O2−) is an important active oxygen species involved in the catalytic oxidation reaction, and it can directly participate in the oxidation process of reactant molecules. As can be clearly seen from Figure 13b, the proportion of lattice oxygen is relatively high and occupies a dominant position.
Figure 13d shows the absorbance of δ-MnO2 catalysts with different Ag loadings in the wavelength range of 500 nm to 800 nm. The 3%Ag/δ-MnO2 curve exhibits the highest absorbance peak in the figure, which means that when the Ag content is 3%, the interaction between the catalyst and the indicator TMB is the strongest, resulting in the highest absorbance value. This indicates that among these catalysts, the 3%Ag/δ-MnO2 catalyst has the highest content of active oxygen species. Since active oxygen species play a crucial role in the catalytic oxidation process, this result is consistent with the previous catalytic performance results, further verifying that the 3%Ag/δ-MnO2 catalyst has relatively excellent catalytic activity. The content of active oxygen species in catalysts with different Ag loadings was tested through the reaction between the indicator TMB and the catalysts. It can be seen that when the Ag content is 3%, the absorbance value is the highest, and the content of active oxygen species is also the highest, which is consistent with the catalytic performance results
4. Conclusions
α-MnO2, β-MnO2, and δ-MnO2 catalysts with three different crystal phases were successfully synthesized via hydrothermal method and redox precipitation method, and the Ag/δ-MnO2@ANF composite catalyst was further prepared. The study revealed that all three MnO2 catalysts with different crystal phases exhibited certain activity for formaldehyde oxidation at room temperature, among which δ-MnO2 showed the best performance. On this basis, the Ag/δ-MnO2 composite catalyst was investigated. The Ag/δ-MnO2@ANF composite catalyst was successfully fabricated through hydrothermal method, redox method, and loading process. Multiple characterization techniques such as XRD, SEM, and XPS were employed to conduct in-depth analysis of its structure, morphology, and chemical composition. The results indicated that δ-MnO2 possessed a layered nanoflower structure, providing abundant active sites for the reaction; silver nanoparticles were highly dispersed on the surface of δ-MnO2, exerting little influence on the layered structure of δ-MnO2 at low loading amounts, while altering the interlayer spacing or inducing lattice distortion at high loading amounts; aramid nanofibers (ANF) featured high strength and high modulus, and their porous network structure increased the specific surface area of the material, which was beneficial to the adsorption and diffusion of formaldehyde molecules. Catalytic performance tests demonstrated that the Ag/δ-MnO2@ANF composite catalyst exhibited excellent catalytic oxidation performance for formaldehyde at room temperature.
Author Contributions
Conceptualization, H.W.; Methodology, H.W.; Validation, H.W.; Formal analysis, H.W.; Resources, H.Y. and H.Y.; Data curation, H.W.; Writing—original draft, H.W.; Writing—review & editing, H.Y. and H.Z.; Supervision, H.Z.; Project administration, H.Z.; Funding acquisition, H.Y. and H.Z. All authors have read and agreed to the published version of the manuscript.
Funding
No funding
Institutional Review Board Statement
Not applicable.
Informed Consent Statement
Not applicable.
Data Availability Statement
The data presented in this study are available on request from the corresponding author.
Acknowledgments
The authors gratefully acknowledge the assistance from Huangping Yang and Hongqing Zhou from Nanjing Tech University.
Conflicts of Interest
The authors declare no conflicts of interest
References
- Bernal, Y.P.; Alvaraod, J.; Juarezl, L. ; Synthesis and characterization of MCM-41 powder and its deposition by spin-coating. Optik, 2019, 185, 429–40. [Google Scholar] [CrossRef]
- Chen, J.; Chen, W.; Huang, M. ; Metal organic frameworks derived manganese dioxide catalyst with abundant chemisorbed oxygen and defects for the efficient removal of gaseous formaldehyde at room temperature. Applied Surface Science, 2021; 565. [Google Scholar]
- Chen, Y.; Lu, Z.; Chen, T. ; Template-free hydrothermal synthesis of δ-MnO2 hierarchical nanoflowers with potassium ions intercalation as cathodes for high-performing aqueous zinc ion batteries. Journal of Electroanalytical Chemistry, 2023; 929. [Google Scholar]
- Dhengale, S.D.; Bhosale, T.R.; Shinde, S.B. ; An efficient and convenient heterogeneous Cu/MCM-41 catalyst for the synthesis of 7,10,11,12-tetrahydrobenzo [c]acridin-8(9H)-one derivatives. Research on Chemical Intermediates, 2023, 49, 1581–600. [Google Scholar]
- Duan, C.; Meng, M.; Huang, H. ; Ag-promoted Cr/MnO2 catalyst for catalytic oxidation of low-concentration formaldehyde at room temperature. Physical Chemistry Chemical Physics, 2023, 25, 10155–65. [Google Scholar] [CrossRef]
- Ette,P.M.; Bosubabu, D.; Ramesha, K.Graphene anchored mesoporous MnO2 nanostructures as stable and high-performance anode materials for Li-ion batteries. Electrochimica Acta, 2022; 414.
- Fang,D.C.; Zheng, J.Y.; Han, C.B.; Electro-injection-enhanced catalytic formaldehyde degradation based on conductive MnO cellulose aerogels at room temperature. Applied Catalysis B: Environmental, 2023, 334.
- Gao, J.; Han, Y.; Mu, J. ; 2D, 3D mesostructured silicas templated mesoporous manganese dioxide for selective catalytic reduction of NOx with NH3. Journal of Colloid and Interface Science, 2018, 516, 254–62. [Google Scholar] [CrossRef]
- Hu, H.; Deng, X.; Song, Q. ; Mitochondria-targeted accumulation of oxygen-irrelevant free radicals for enhanced synergistic low-temperature photothermal and thermodynamic therapy. Journal of Nanobiotechnology, 2021; 19. [Google Scholar]
- Hua, Y.; Ahmadi, Y. ; Kim,K. H.; Thermocatalytic Degradation of Gaseous Formaldehyde Using Transition Metal-Based Catalysts. Advanced Science, 2023; 10. [Google Scholar]
- Ji, J.; Lu, X.; Chen.C.; Potassium-modulated δ-MnO2 as robust catalysts for formaldehyde oxidation at room temperature [J]. Applied Catalysis B: Environmental. 2020; Volume 260.
- Jiao, Y.; Jing, C.; Wang, Y. ; Electrospinning synthesis of Co3O4 porous nanofiber monolithic catalysts for the room-temperature indoor catalytic oxidation of formaldehyde at low concentrations. Applied Surface Science, 2023; 639. [Google Scholar]
- Jiang, Z.; Wang, T.; Wang, J. ; Oxygen vacancy-rich BiVO4 modified with mesoporous MIL-88A(Fe) Z-scheme heterojunction for enhanced photocatalytic formaldehyde degradation. Separation and Purification Technology, 2025; 353. [Google Scholar]
- Jing, W.; Yang, C.; Luo, S. ; One-Pot Method to Synthesize Silver Nanoparticle-Modified Bamboo-Based Carbon Aerogels for Formaldehyde Removal. Polymers (Basel), 2022; 14. [Google Scholar]
- Jo, C.; Kim, K.; Ryoo, R. ; Syntheses of high quality KIT-6 and SBA-15 mesoporous silicas using low-cost water glass, through rapid quenching of silicate structure in acidic solution. Microporous and Mesoporous Materials, 2009, 124, 45–51. [Google Scholar] [CrossRef]
- Li, D.; Chen, X.; Huang, Y. ; Selective catalytic oxidation of formaldehyde on single V- and Cr-atom decorated magnetic C4N3 substrate: A first principles study. Journal of Hazardous Materials, 2022; 439. [Google Scholar]
- Li, F.; Zhu, T.; Yang, J. ; Biodegradable porous adsorbent for efficient formaldehyde removal from indoor air. Environ Res, 2025, 275, 121453. [Google Scholar] [CrossRef] [PubMed]
- Li, G.; Sun, Y.; Zhang, Q. ; Ag quantum dots modified hierarchically porous and defective TiO2 nanoparticles for improved photocatalytic CO2 reduction. Chemical Engineering Journal, 2021; 410. [Google Scholar]
- Li, K.; Chen, C.; Zhang, H. ; Effects of phase structure of MnO2 and morphology of δ-MnO2 on toluene catalytic oxidation. Applied Surface Science, 2019; 496. [Google Scholar]
- Li, K.; Ji, J.; Gan, Y. ; Regulation of mixed Ag valence state by non-thermal plasma for complete oxidation of formaldehyde. Chinese Chemical Letters, 2022; 33, 434–437. [Google Scholar]
- Li, N.; Huang, B.; Dong, X. Bifunctional zeolites-silver catalyst enabled tandem oxidation of formaldehyde at low temperatures. Nature Communications, 2022, 13(1).
- Lin, H.; Chen, D.; Liu, H. ; Effect of MnO2 Crystalline Structure on the Catalytic Oxidation of Formaldehyde. Aerosol and Air Quality Research, 2017, 17, 1011–20. [Google Scholar] [CrossRef]
- Liu, F.; Rong, S.; Zhang, P. One-step synthesis of nanocarbon-decorated MnO2 with superior activity for indoor formaldehyde removal at room temperature. Applied Catalysis B: Environmental, 2018, 235: 158-67.
- Liu, X.; Ling, C.; Chen, X. ; Single Mn atom modulated molecular oxygen activation over TiO2 for photocatalytic formaldehyde oxidation. J Colloid Interface Sci, 2024, 666, 12–21. [Google Scholar] [CrossRef] [PubMed]
- Qian, J.; Mo, J.; Zhou, Y. Studyof manganese–cerium composite oxide catalysed oxidation for low concentration formaldehyde at room temperature. Materials Chemistry and Physics, 2022, 285.
- Qin, Z.; Zheng, Y.; Wang, Y. Versatile roles of silver in Ag-based nanoalloys for antibacterial applications. Coordination Chemistry Reviews, 2021, 449.
- Su, G.; Xiong, J.; Li, Q. Gaseous formaldehyde adsorption by eco-friendly, porous bamboo carbon microfibers obtained by steam explosion, carbonization, and plasma activation. Chemical Engineering Journal, 2023, 455.
- Teng, D.; Zheng, W.; Wu, L. Smart manufacturing of ZIF-8 photonic crystals: Catalytic formaldehyde degradation and colorful eco-friendly coatings. Chemical Engineering Journal, 2024, 495.
- Wang, J.; Zhang, G.; Zhang, P. ; Graphene-assisted photothermal effect on promoting catalytic activity of layered MnO2 for gaseous formaldehyde oxidation. Applied Catalysis B: Environmental, 2018, 239, 77–85. [Google Scholar] [CrossRef]
- Wang, Z.; Wang, W.; Zhang, L. ; Surface oxygen vacancies on Co3O4 mediated catalytic formaldehyde oxidation at room temperature. Catalysis Science & Technology, 2016, 6, 3845–53. [Google Scholar]
Figure 1.
Double-layer glass reactor.
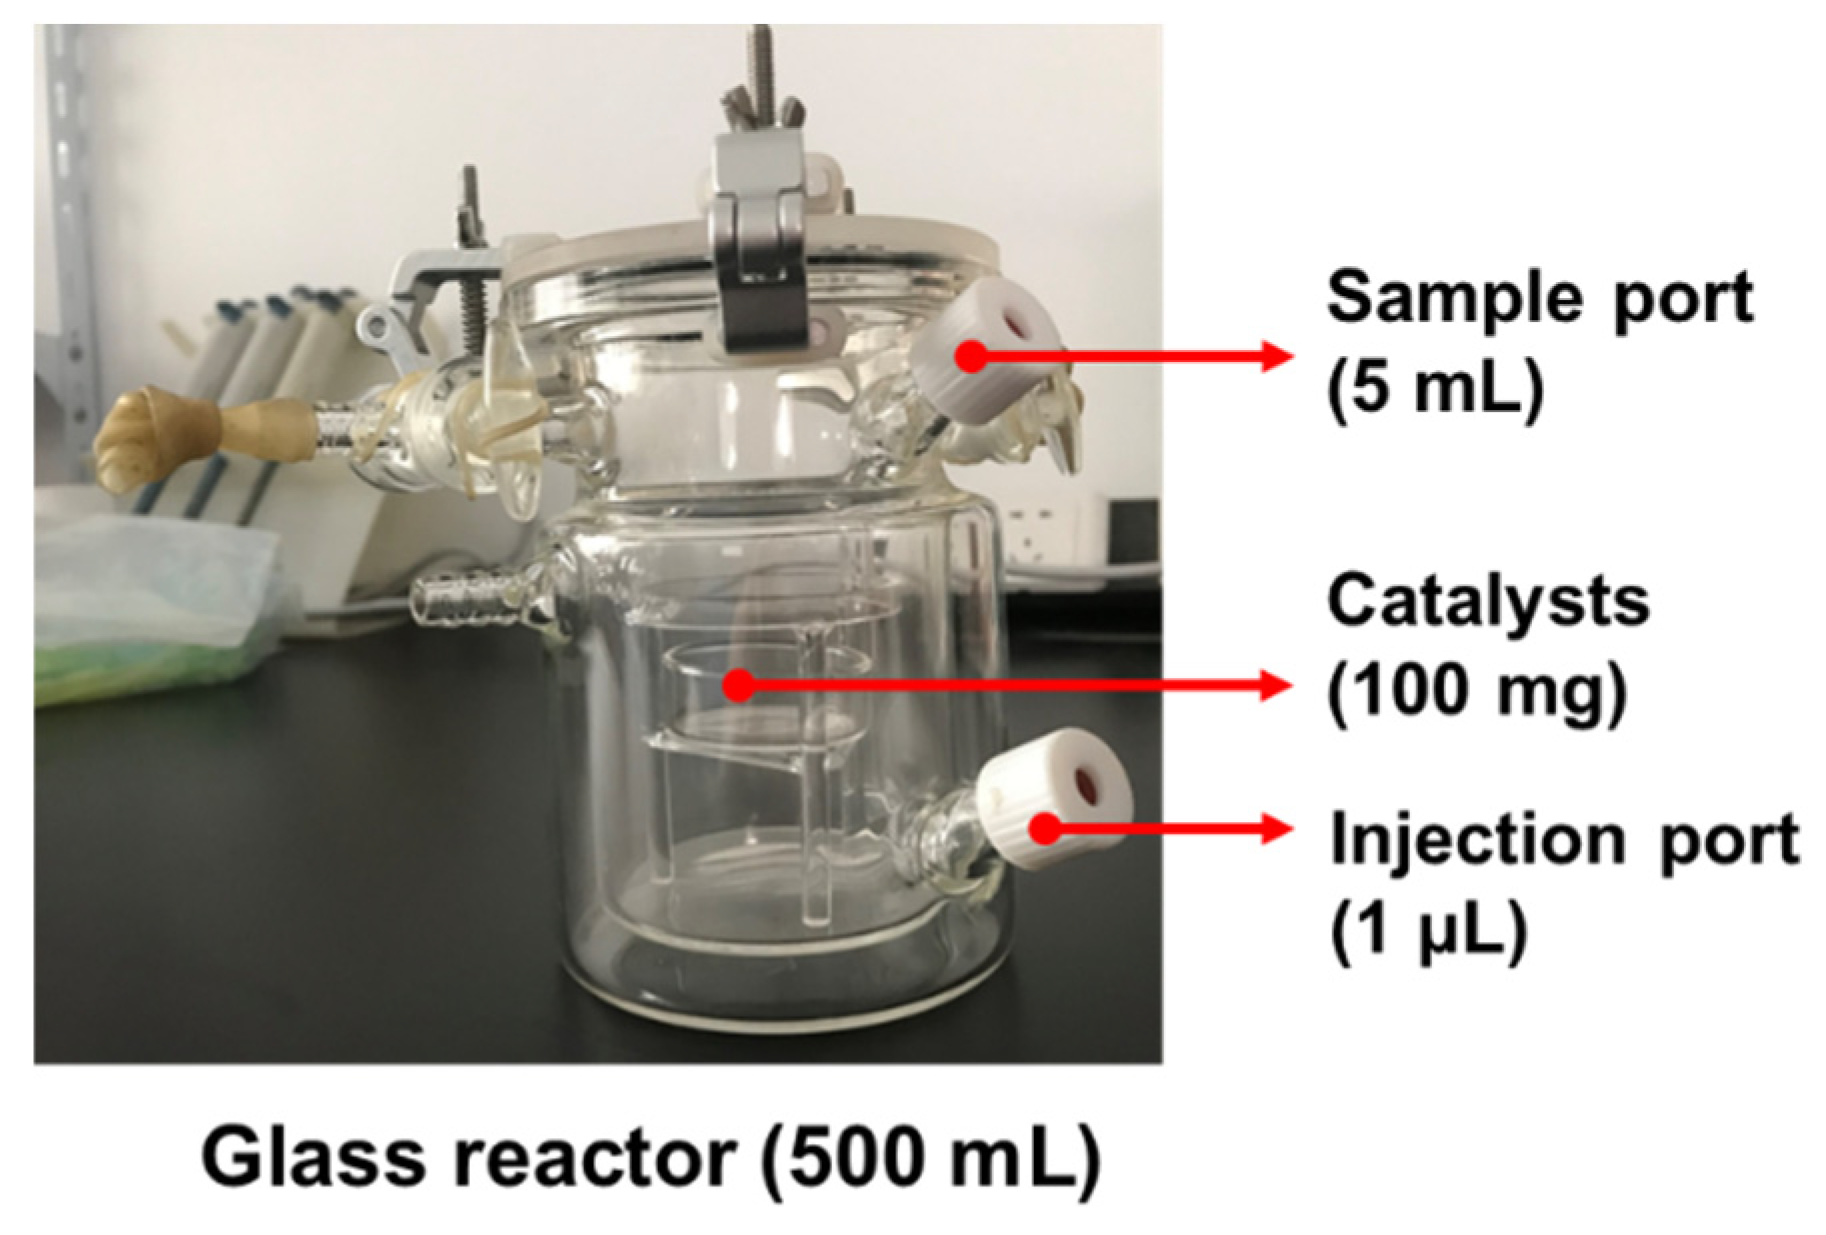
Figure 2.
XRD patterns of δ-MnO2, γ-MnO2 and β-MnO2.
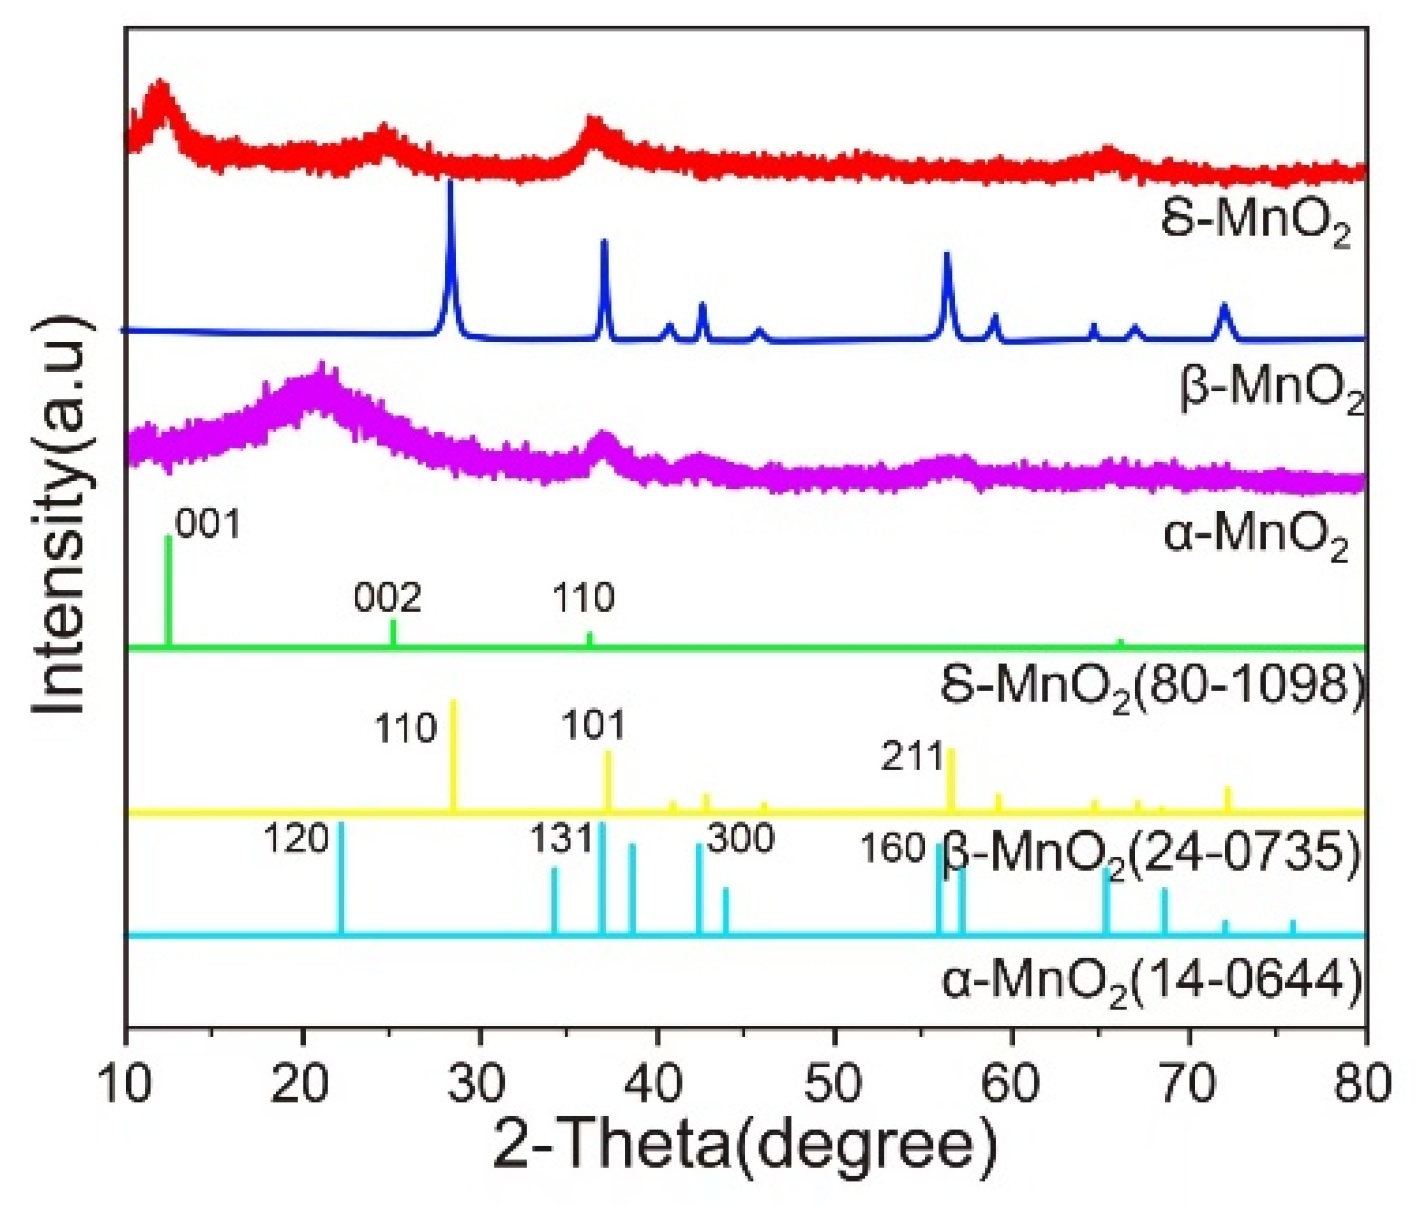
Figure 3.
SEM images of(a,b) α-MnO2, (c,d) β-MnO2 and (e,f) δ-MnO2.

Figure 4.
(a) N2 adsorption-desorption isotherm plots and (b).
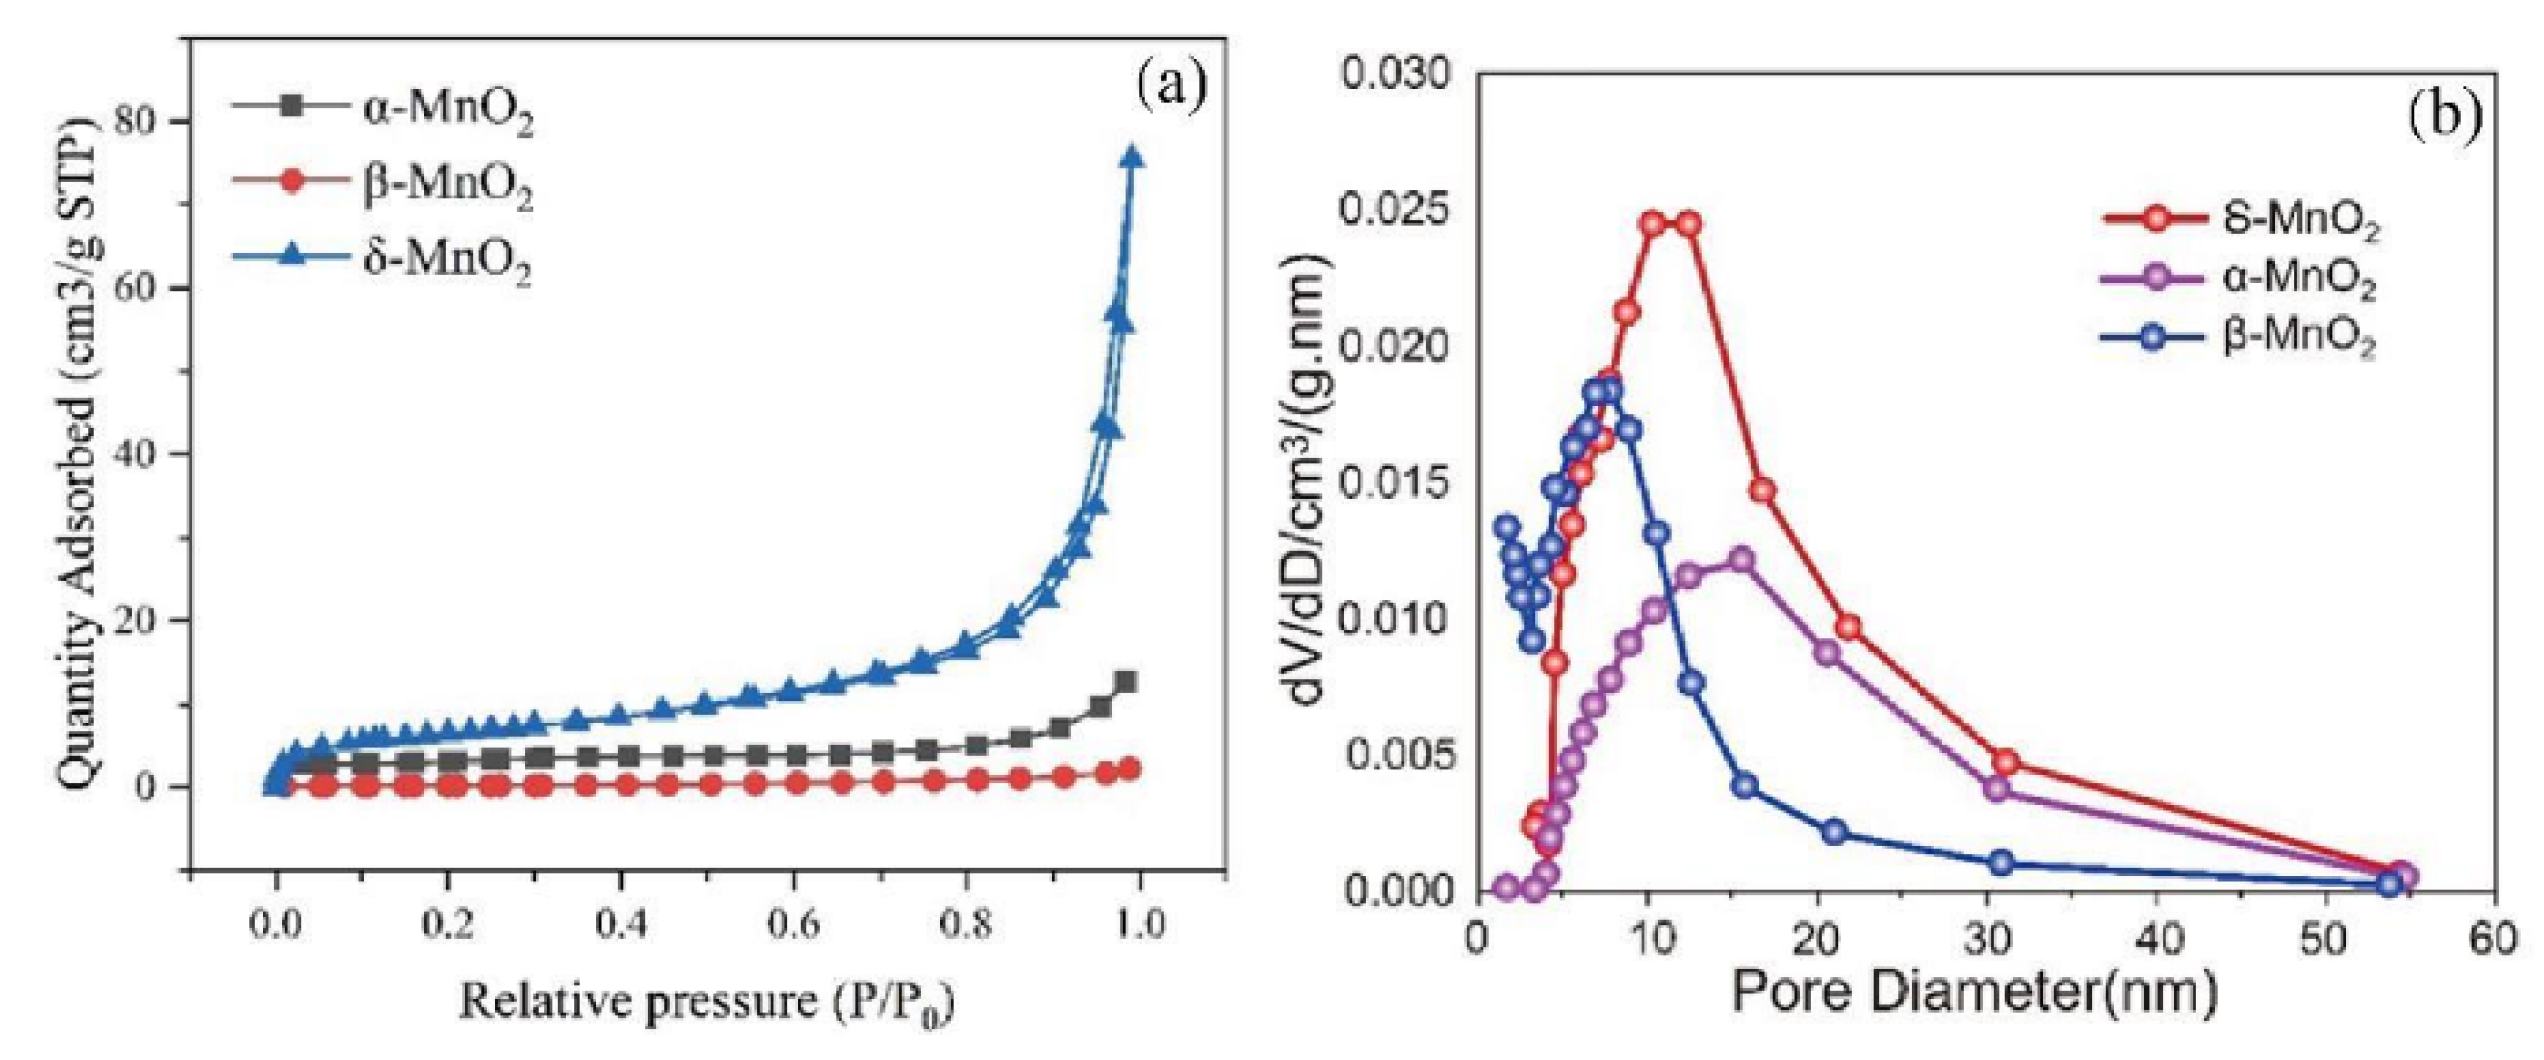
Figure 5.
XPS spectra of α-MnO2, β-MnO2 and δ-MnO2 samples.(a) elements survey, (b) Mn 2p3/2, (c) Mn 3s, (d) O 1s.
Figure 5.
XPS spectra of α-MnO2, β-MnO2 and δ-MnO2 samples.(a) elements survey, (b) Mn 2p3/2, (c) Mn 3s, (d) O 1s.
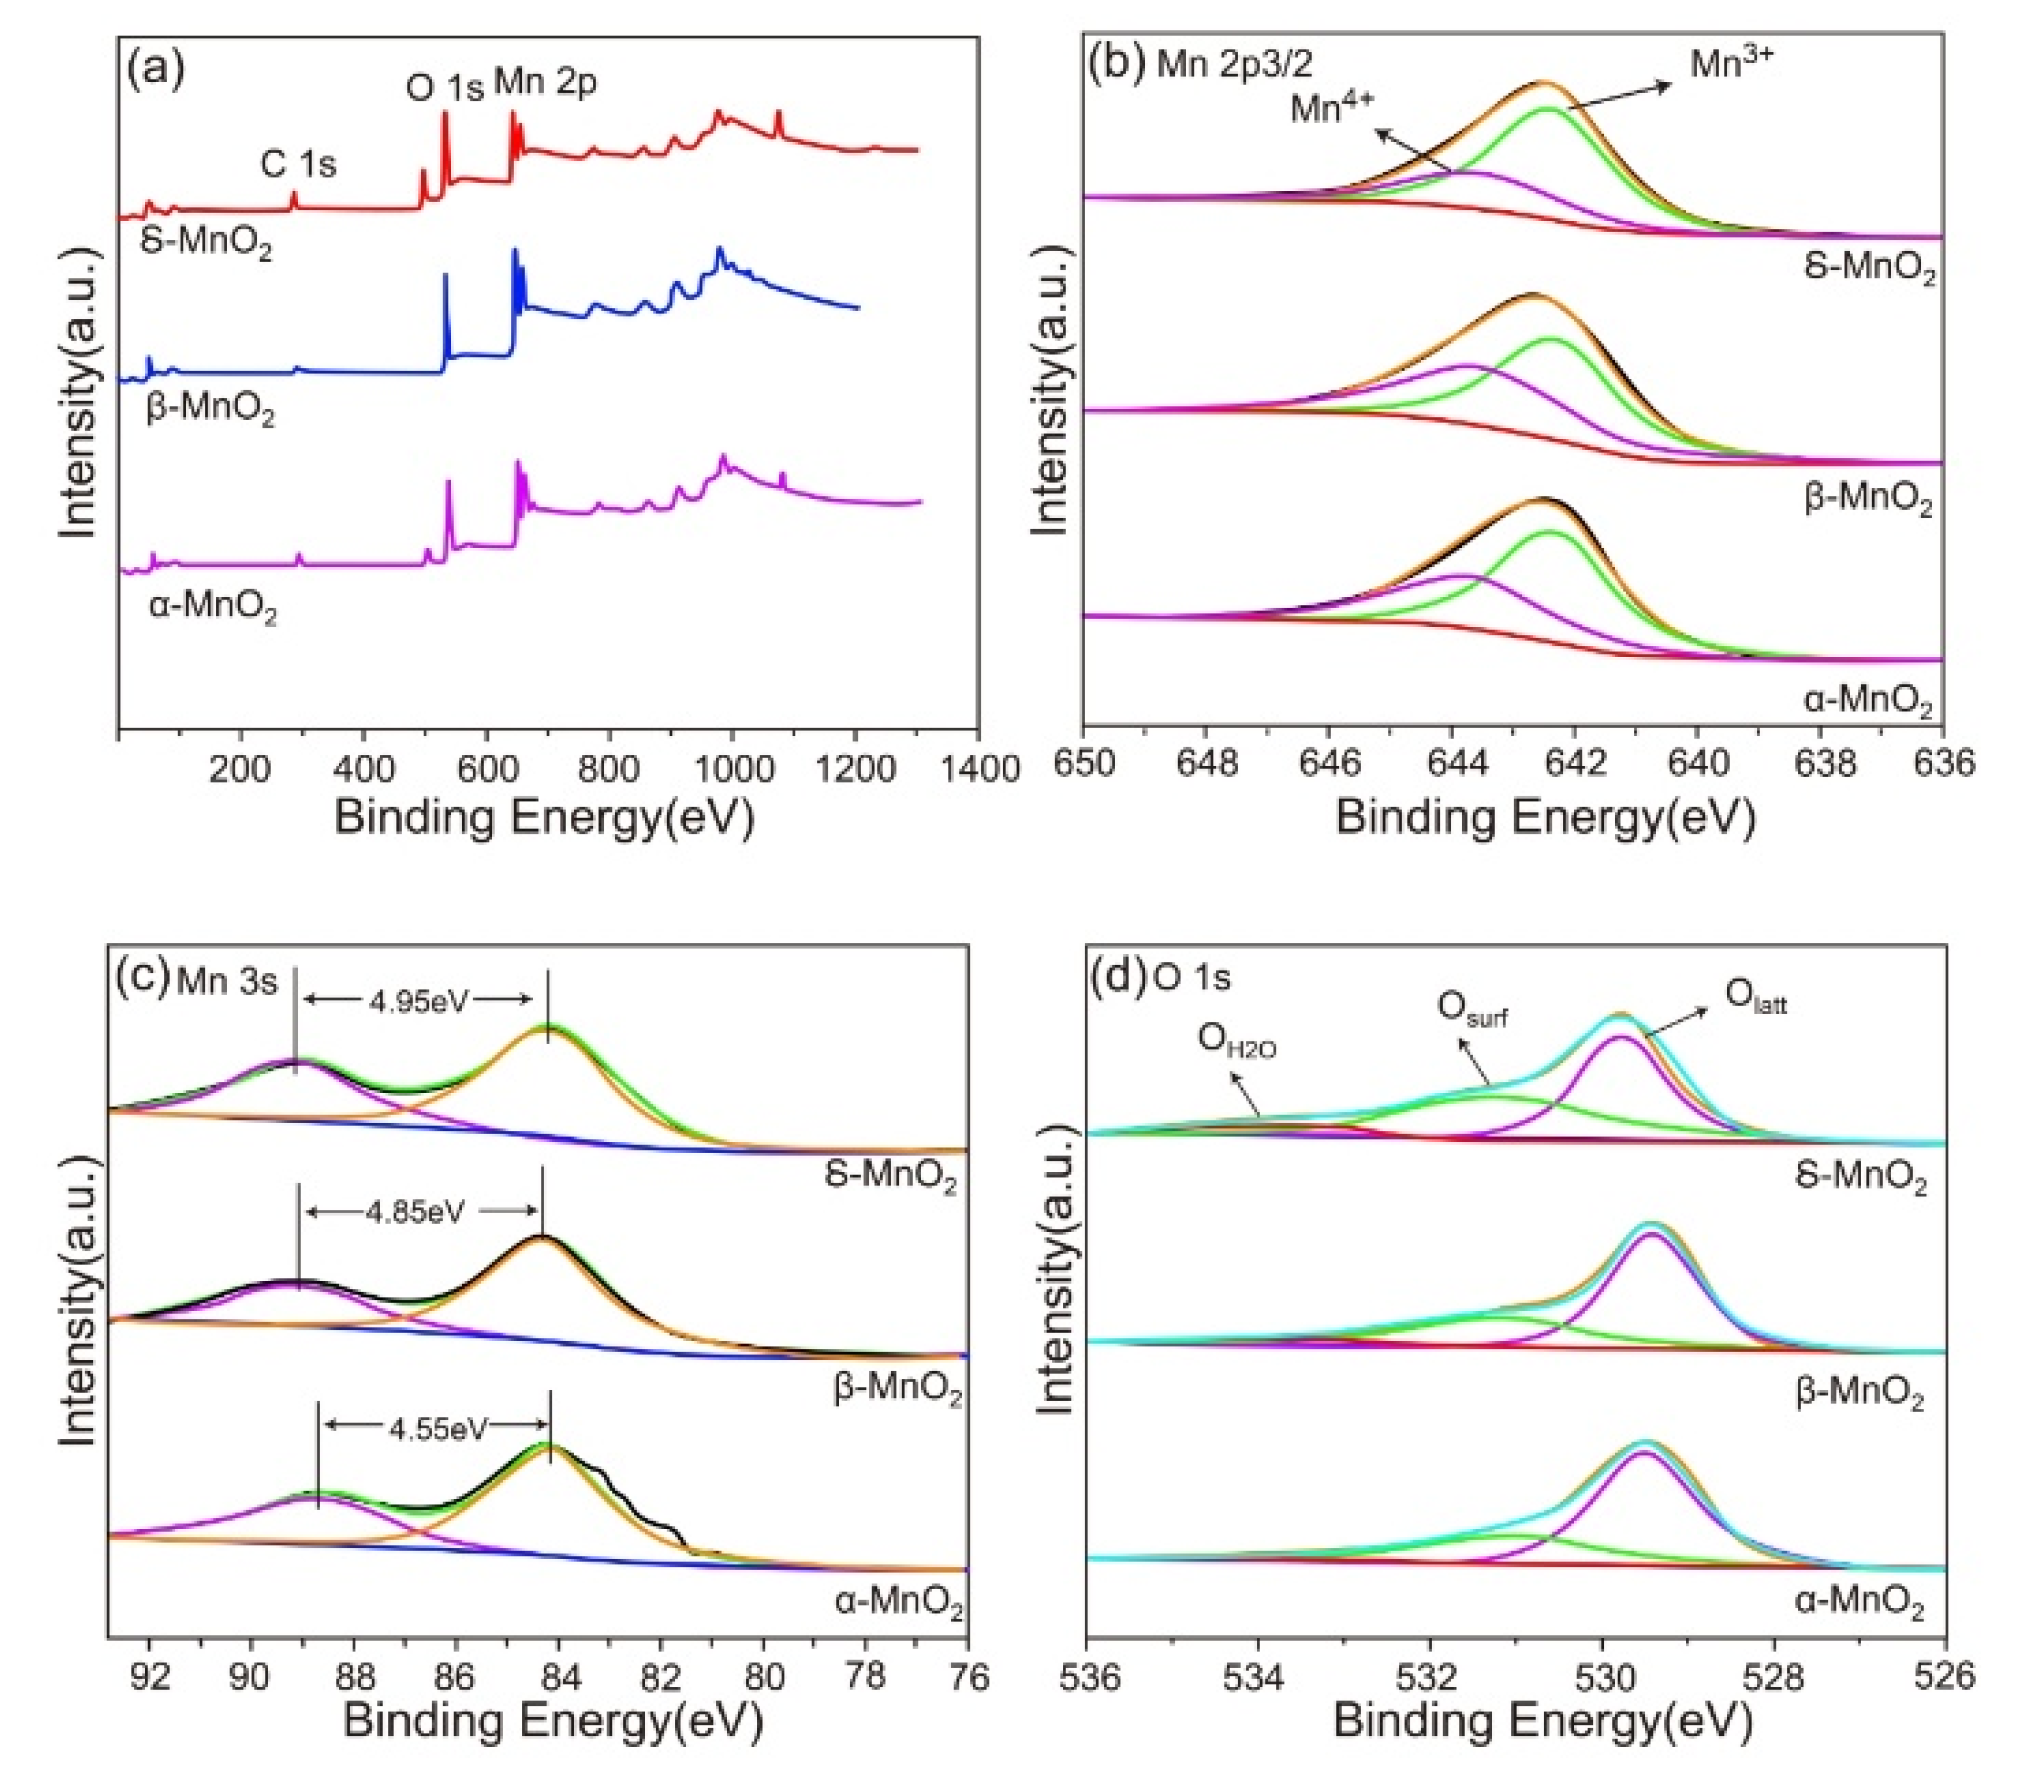
Figure 6.
XRD of δ-MnO2 and Ag/δ-MnO2 catalysts.
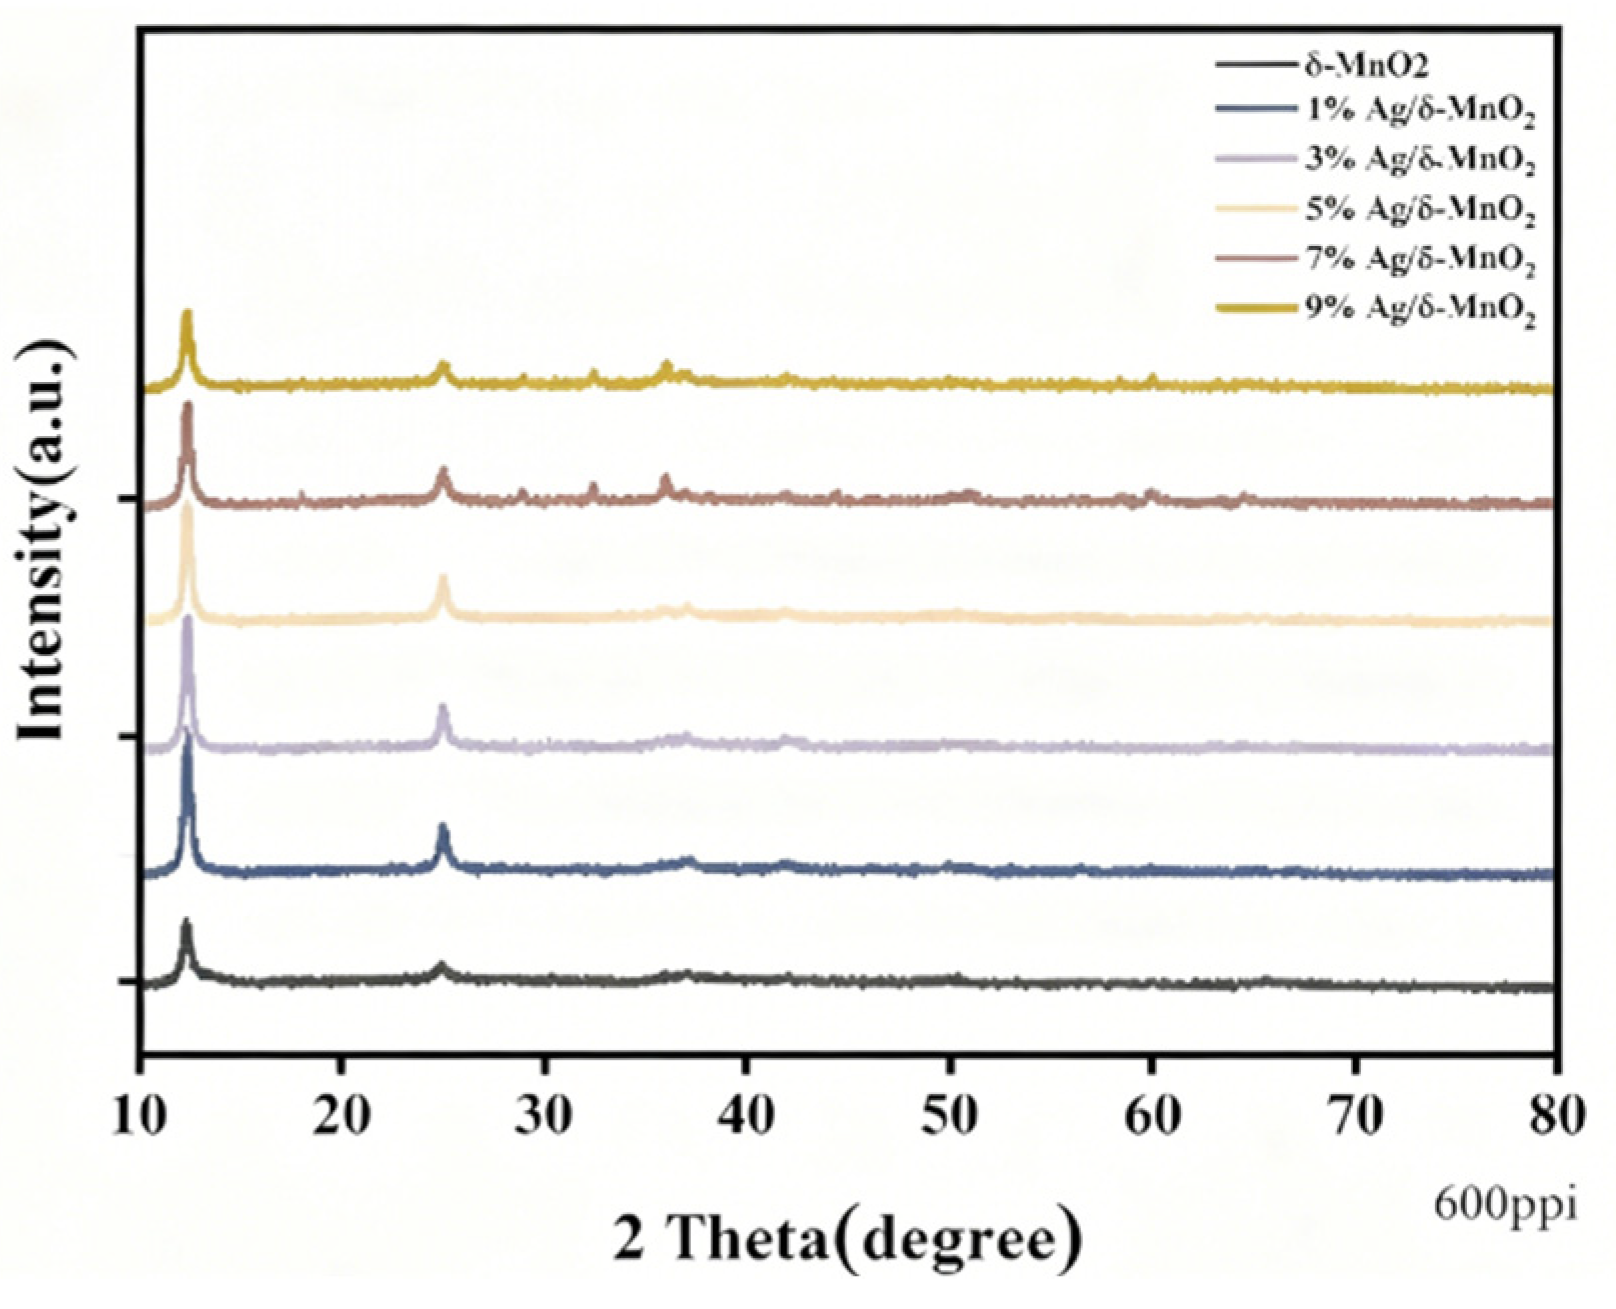
Figure 7.
SEM and EDS Mapping images of Ag/δ-MnO2 catalyst.
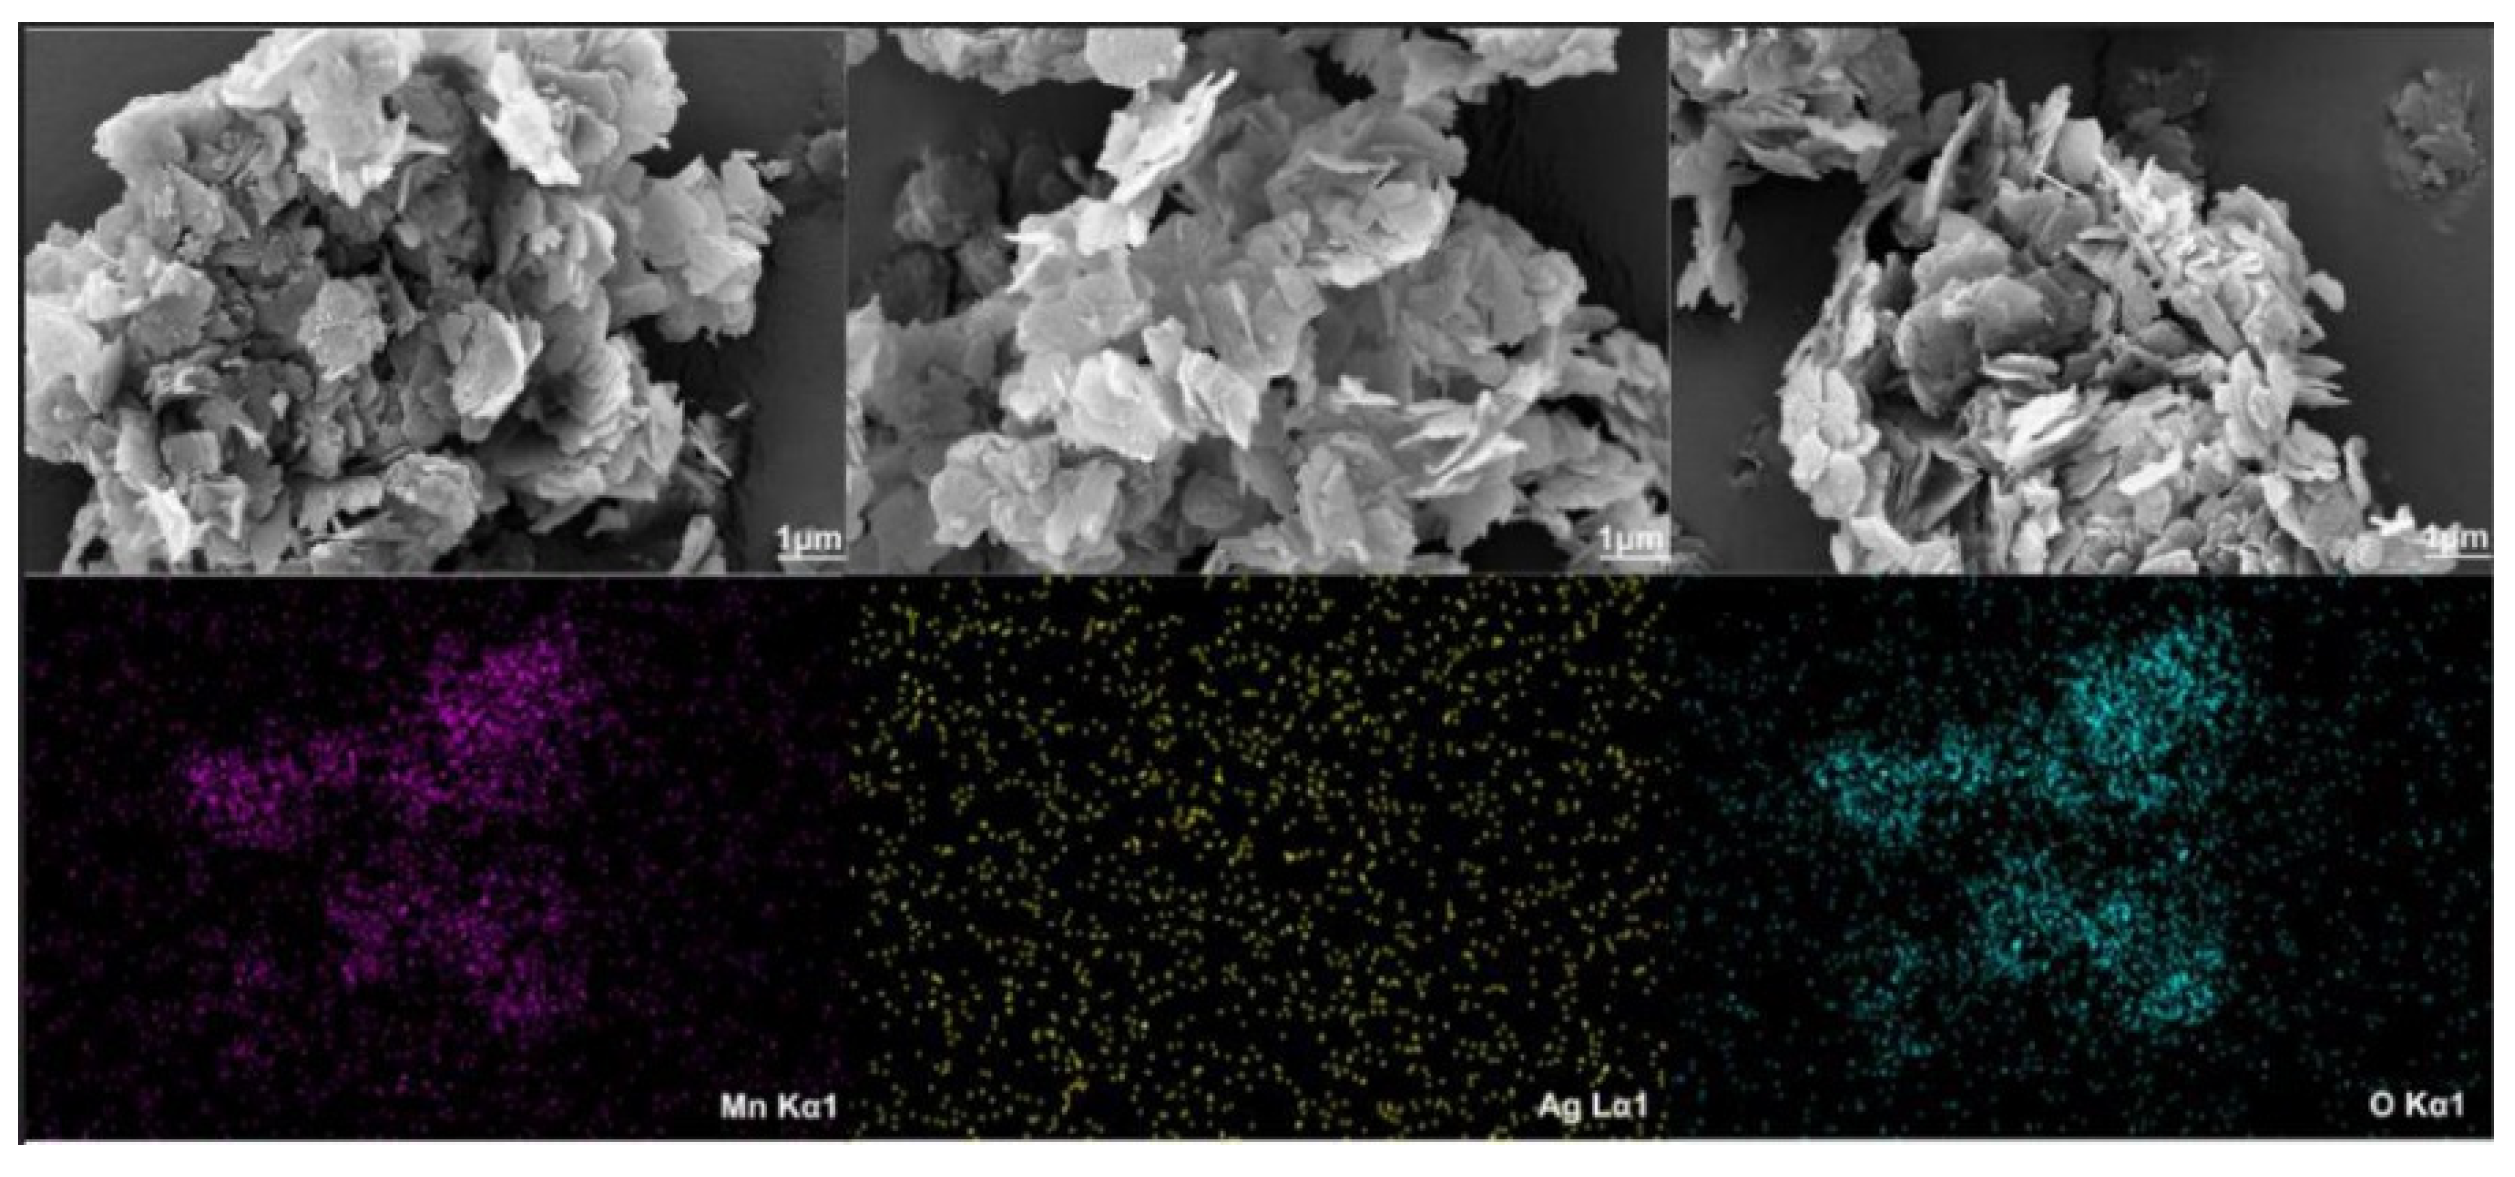
Figure 8.
Morphology of composite catalyst and physical picture of aramid nanofiber shee.
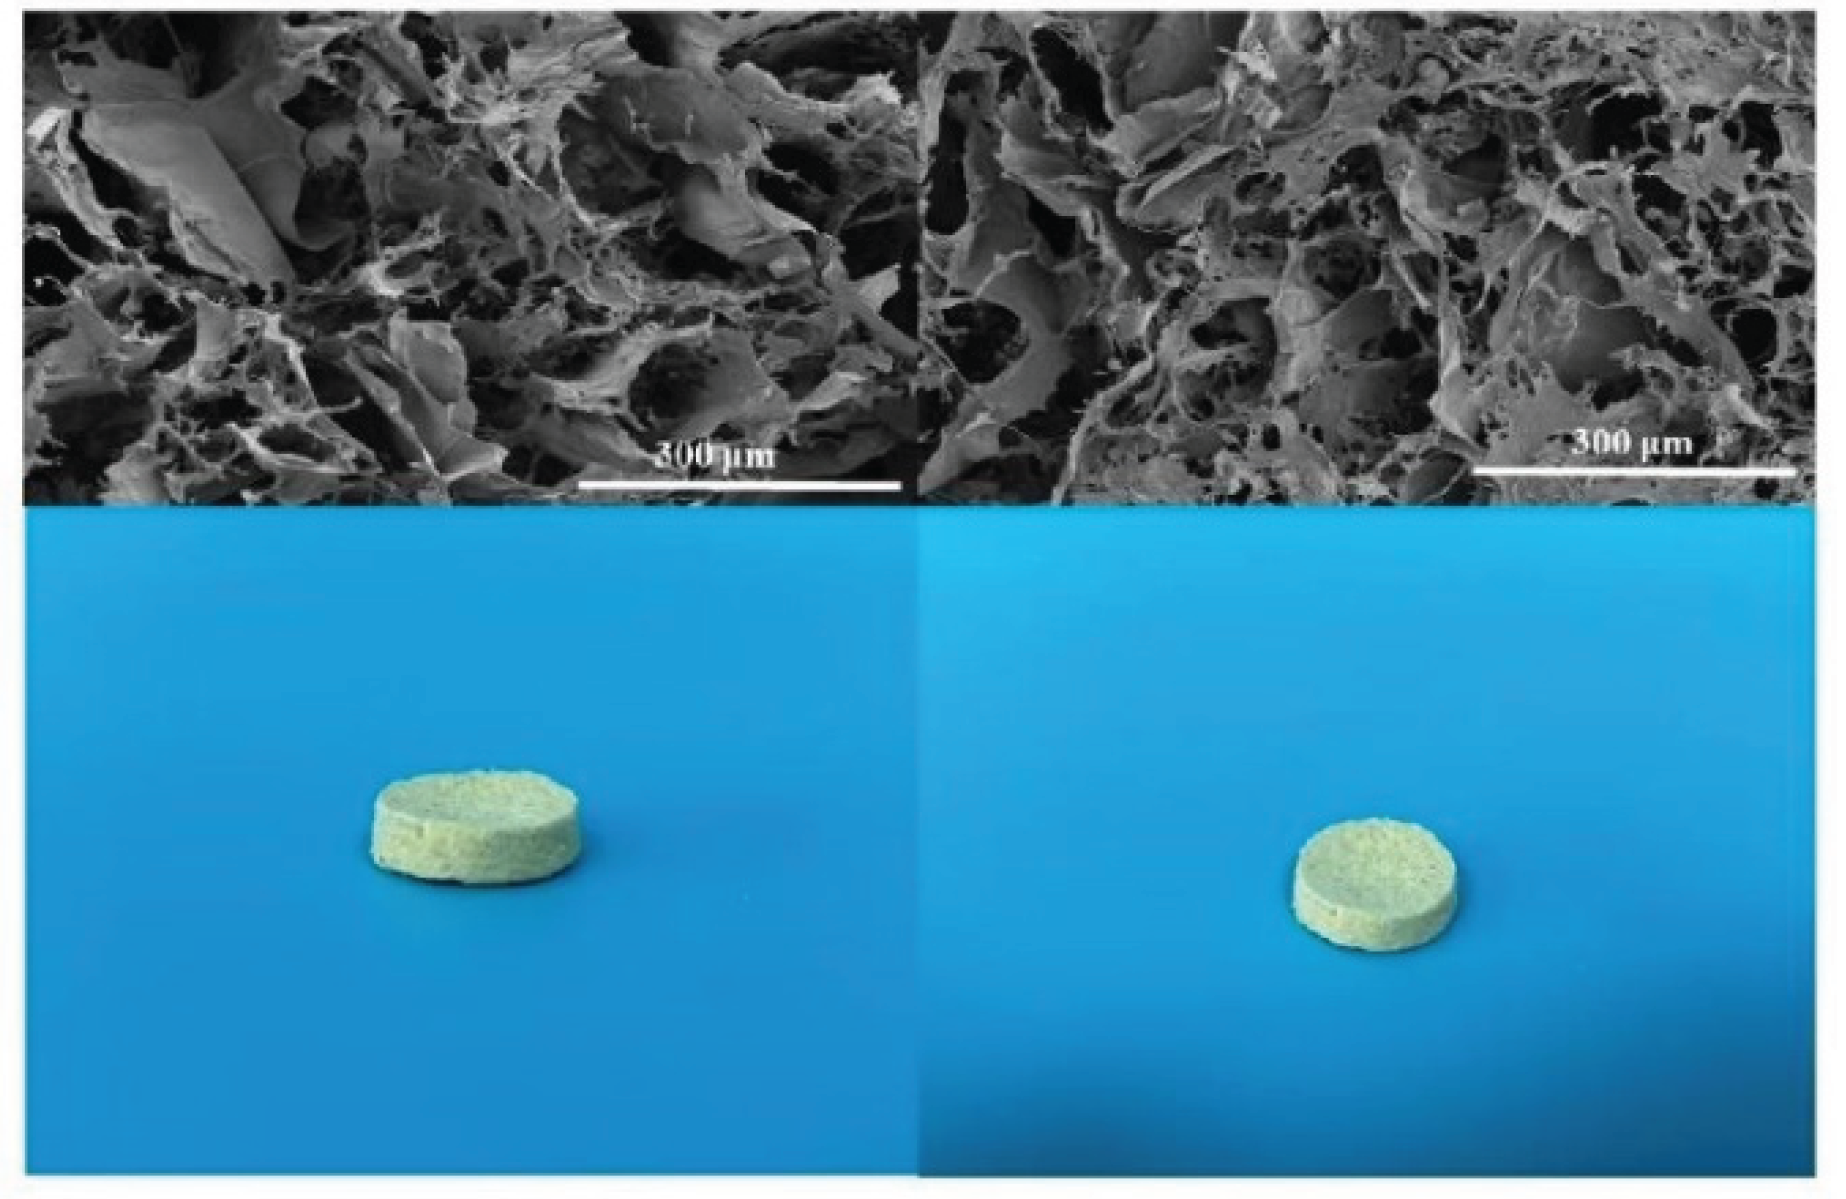
Figure 9.
The N2 adsorption - desorption isotherms (a) and pore size distributions (b) of the Ag/δ-MnO2@ANF, Ag/δ-MnO2,δ-MnO2.
Figure 9.
The N2 adsorption - desorption isotherms (a) and pore size distributions (b) of the Ag/δ-MnO2@ANF, Ag/δ-MnO2,δ-MnO2.
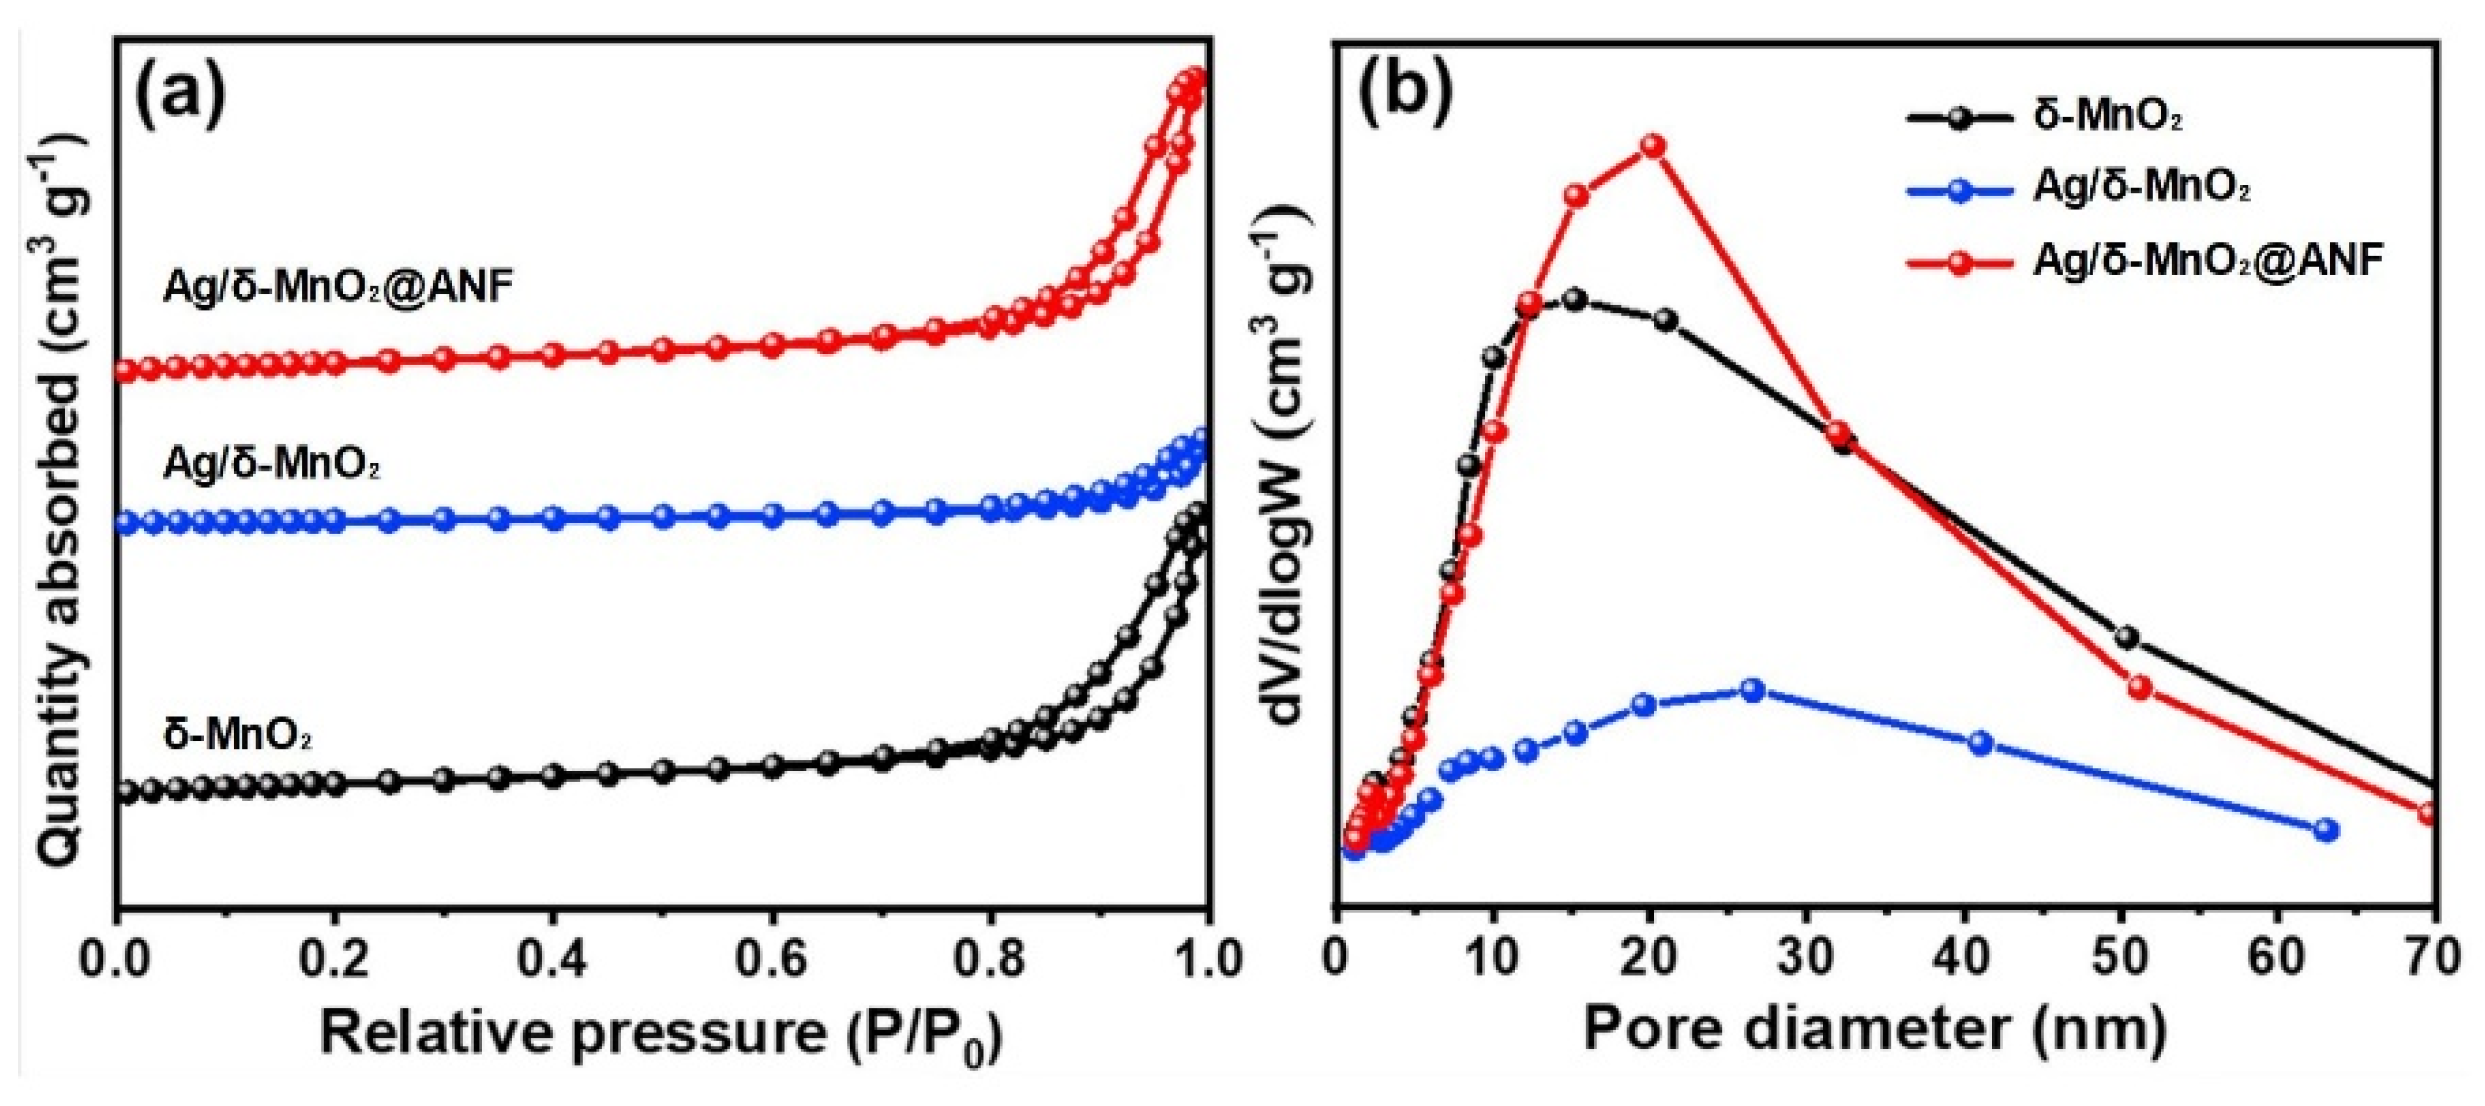
Figure 10.
Formaldehyde conversion rate and removal rate of manganese dioxide with different crystal phases.
Figure 10.
Formaldehyde conversion rate and removal rate of manganese dioxide with different crystal phases.
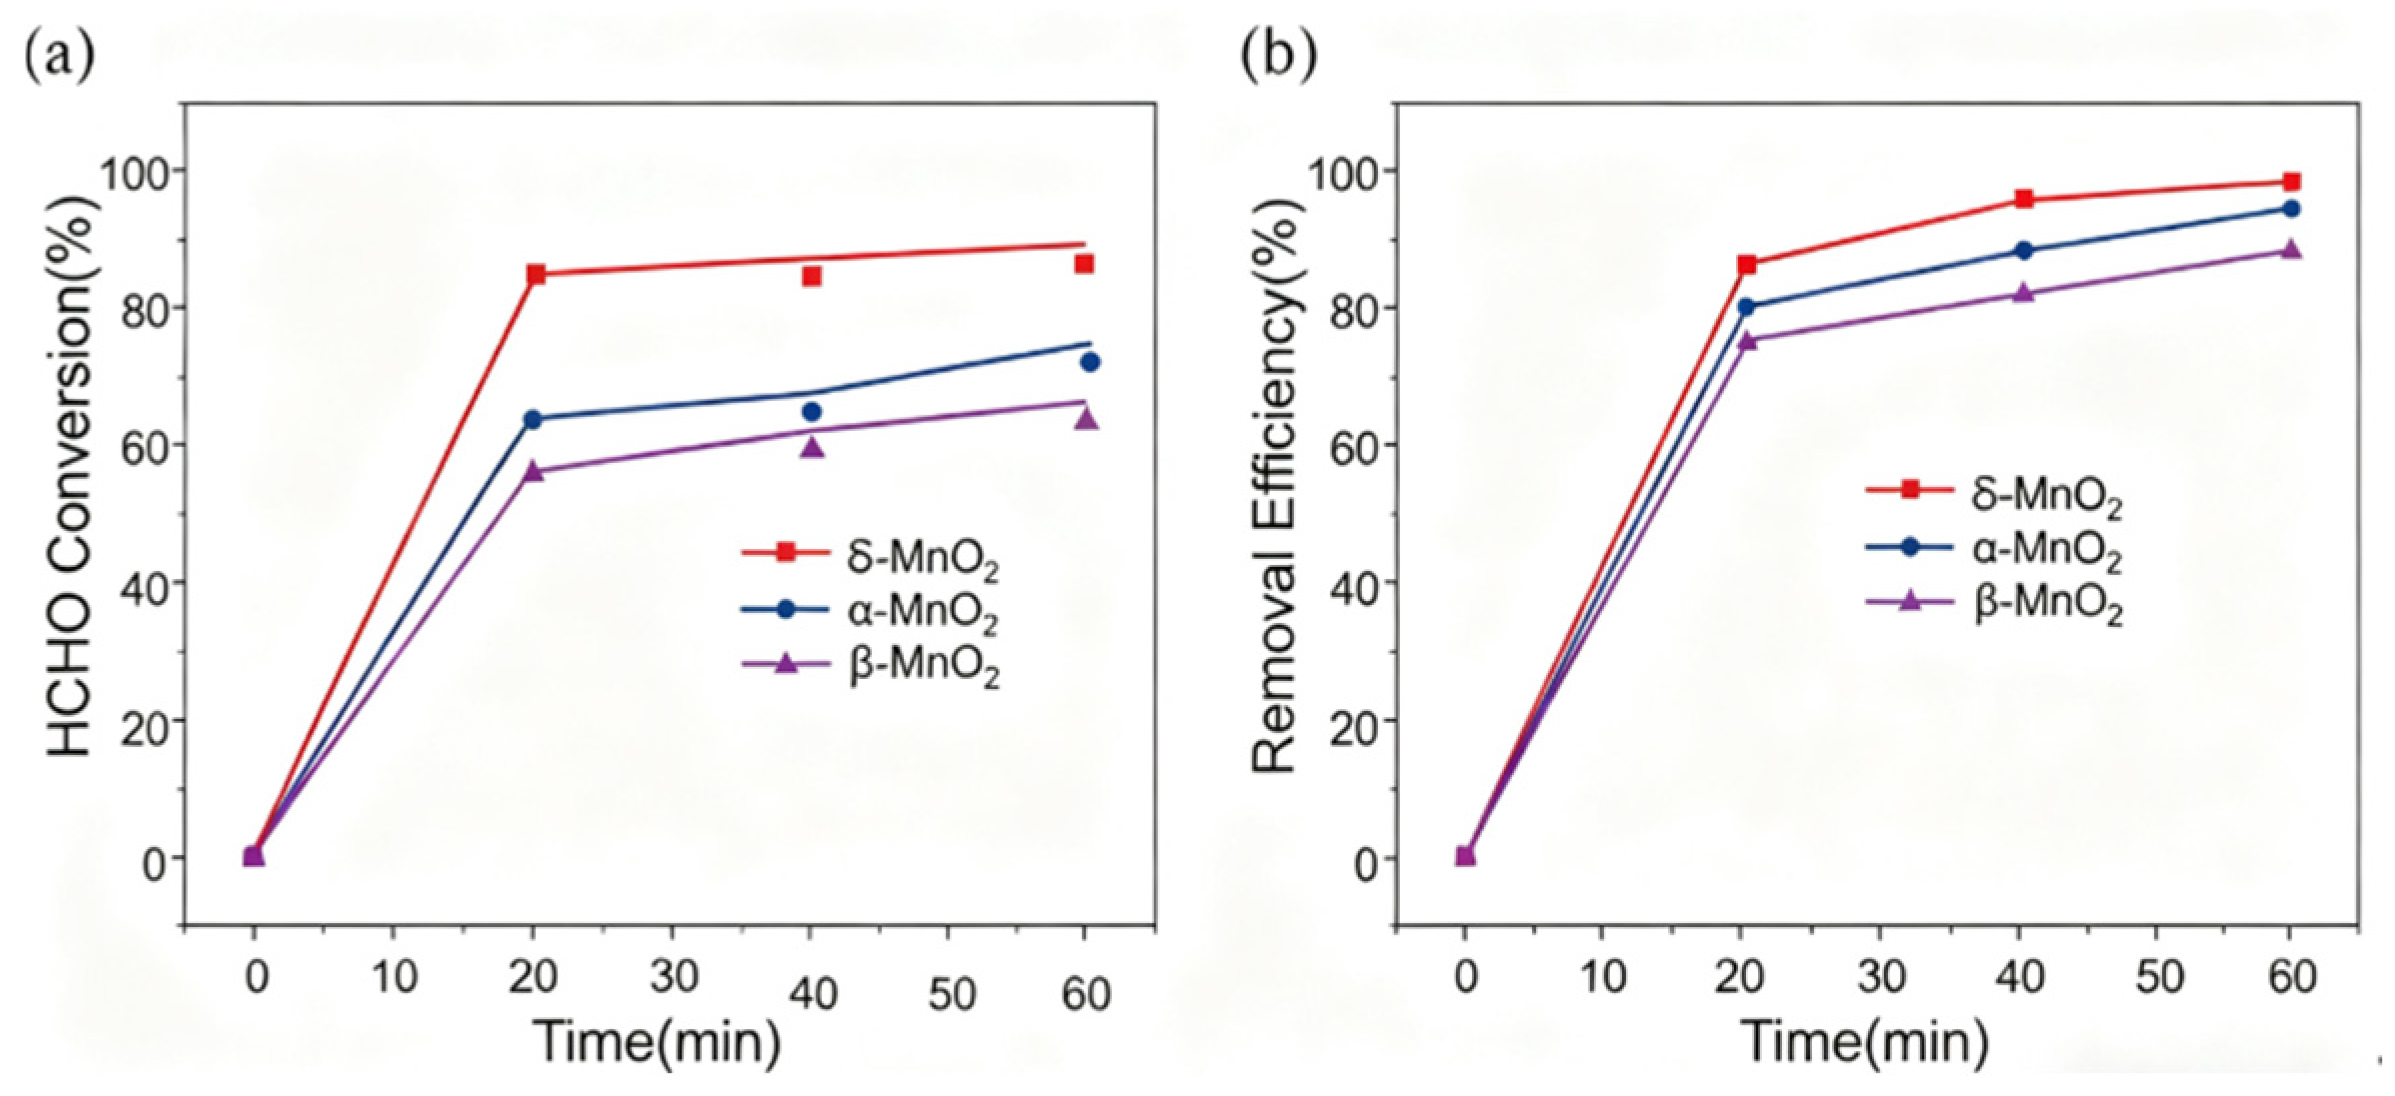
Figure 13.
XPS and TMB indicator UV spectrum of the Ag/δ-MnO2.
Disclaimer/Publisher’s Note: The statements, opinions and data contained in all publications are solely those of the individual author(s) and contributor(s) and not of MDPI and/or the editor(s). MDPI and/or the editor(s) disclaim responsibility for any injury to people or property resulting from any ideas, methods, instructions or products referred to in the content. |
© 2025 by the authors. Licensee MDPI, Basel, Switzerland. This article is an open access article distributed under the terms and conditions of the Creative Commons Attribution (CC BY) license (http://creativecommons.org/licenses/by/4.0/).
Copyright: This open access article is published under a Creative Commons CC BY 4.0 license, which permit the free download, distribution, and reuse, provided that the author and preprint are cited in any reuse.


