Submitted:
17 September 2025
Posted:
24 September 2025
You are already at the latest version
Abstract
As global supply chains face increasing disruptions due to pandemics, geopolitical tensions, and climate change, governments are exploring industrial policies aimed at enhancing resilience. This paper examines the theoretical foundations, implementation strategies, and governance challenges of these policies within the context of world trade rules. Using a threecountry model with sequential production and random disruptions, we analyze four key policy interventions—entry subsidies, production subsidies, tariffs on inputs, and export bans—to understand their impact on supply chain stability. Our results reveal that while entry subsidies reduce volatility at a high cost, small production subsidies may improve global welfare without significantly reducing supply fluctuations. Tariffs create a prisoner’s dilemma, and export bans can lead to inefficient outcomes without international cooperation. We highlight the importance of competition, strategic policy design, and focusing on critical sectors for enhancing resilience. Finally, we propose measures to improve international collaboration, such as expanding data collection and monitoring of global value chains, and discuss potential reforms to international trade frameworks to better accommodate resilience objectives.
Keywords:
business
1. Introduction
Around the world, industrial policies have proliferated in size and number, with a particularly steep uptick among high-income countries since 2020 (Figure 1). This trend has coincided with and responded to a growing policy interest in supply chain resilience, reflecting supply challenges in the depths of the COVID-19 pandemic as well as security anxieties arising from great power rivalry [1].
The pandemic demonstrated that global value chains (GVCs) are susceptible to disruption and that shocks to downstream or upstream sectors can reverberate throughout the chain, potentially with macroeconomic consequences. As pandemic risks have abated, geopolitical risks to supply chains have become the object of focus. Simultaneously, risks related to climate change have continued to rise.
While shocks are transmitted through GVCs, ’renationalising’ these chains does not, in general, make economies more resilient to those shocks, as a major study of COVID-19 lockdowns points out [2]. Access to international trade is a buffer against domestic shocks, and access to multilateral trade is a buffer against bilateral shocks. As Caselli, Koren, Lisicky, et al. [3] argues, in the presence of country-wide shocks, openness lowers volatility by allowing diversification of supply and demand. Their results indicate that this has been the case for most countries for decades. In a more immediate sense, the astonishing rebound of global merchandise trade in 2021 and early 2022 suggests that GVCs were more resilient than they may have appeared.
Research since the pandemic has also pointed to conditions in GVCs or supply networks that can give rise to market failures or amplify economic shocks. Some structures of supply networks are more fragile or transmit shocks more quickly than others [4]. The entry of new firms in a network prone to disruption is a positive externality, in terms of risk reduction, that markets may fail to price in [5]. `Bottleneck firms’ might systematically underproduce inputs, and regulatory or informational barriers might discourage efficient investment in risk management [6,7].
With notable exceptions like the work of the Productivity Commission [7] and Grossman, Helpman, and Lhuillier [8], economic research on supply chain resilience has tended not to address questions of optimal public policy, beyond sometimes pointing to a general role for it.1
As this literature has grown, so has the footprint of industrial policies on the global economy. It is evident that subsidies, first-best or otherwise, will play a central role in the green energy transition, a phenomenon that is reorganizing GVCs. These developments have intensified interest in supply chain resilience and industrial policy as governments seek both energy security and market shares in the future low-carbon global economy. This economy demands inputs, not just critical minerals but also manufactured goods, that today may be concentrated in relatively few hands.
The desire for diversification has been a stated motive for recent industrial policies in some countries, often on national security grounds. But diversification, though related to resilience, is not equivalent to it, particularly if diversifying means sacrificing optimal technology, comes at the price of other productive activities, or is pursued in a way that raises trade uncertainty or sparks retaliation. Likewise, the impacts of industrial policies on supply chain resilience are not clear-cut. There are negative and positive spillovers to consider, domestically and globally. A central question, posed by Bown [9], is whether optimal supply chain resilience policy from a domestic standpoint differs to that from a global standpoint.
To contribute to answering that question and to better understand these policies and spillovers, we proceed as follows. The next section reviews the theoretical bases for policies to manage supply chain risk, which policies countries are using, and how these policies are governed in the world trading system. We then present a simple three-country model with sequential production and random supply disruptions to explore these policies and illustrate their potential international spillovers. As performance indicators, we look at conventional measures of economic welfare as well as the variation in the initial supply of a product. We simulate four policy examples targeting upstream inputs: entry subsidies, specific production subsidies, import tariffs, and export bans.
The policy examples reflect and extend findings from trade policy models without disruption risk. Subsidies that target entry costs alone preserve the international composition of production while encouraging new firms, thus reducing disruption risk, though at a high cost to the subsidizer. Small production subsidies can increase global welfare and supply—most effectively if applied in tandem rather than unilaterally—though they do not make final supply less volatile. Tariffs exhibit a familiar prisoner’s dilemma game, pointing to a non-cooperative equilibrium that lowers welfare and supply without offering reduced volatility of consumption. The prospect of export bans to reduce the probability of a downstream shortage can elicit a globally inefficient equilibrium in the absence of cooperation.
In light of these examples, we conclude by discussing some emerging rules of thumb for domestic supply chain resilience policy, reviewing active policy proposals for international cooperation in that domain, and suggesting directions for future research.
2. Industry Policy, Supply Chain Resilience and the World Trading System
2.1. For and Against Industrial Policy for Supply Chain Resilience
Though in many respects, GVCs fared remarkably well through the pandemic, several experiences in recent years have led policymakers to question the adequacy of status-quo approaches to supply chain risk. The most severe examples were the shortages of personal protective equipment in many jurisdictions. Shortages of diesel exhaust fluid (DEF) in 2021 were another. A perfect storm of global influences, chiefly food price inflation, rebounding energy demand, and fertilizer export controls, saw exports of technical-grade urea—the main input to DEF—dry up, seriously threatening internal freight in countries like the Republic of Korea and Australia.
Against the backdrop of the pandemic, countries initiated, in the name of supply chain resilience, grant programs, strategic industrial plans, on-shoring subsidies, bilateral dialogues, and domestic advisory bodies. They imposed trade restrictions, created or expanded critical minerals lists, launched infrastructure program,s and announced regional supply chain initiatives. The Indo-Pacific Economic Partnership (IPEF), launched in May 2022, took on supply chains as one of its four foundational pillars [10].
Following Harrison and Rodríguez-Clare [11] and Bown [9], this paper defines industrial policy in broad terms as deviation from policy neutrality. While we focus our analysis on more conventional industrial policies, others like trade agreements, commercial diplomacy, competition policy, and regulatory reform are essential to the resilience toolkit. Lowering barriers to entering domestic or foreign markets expands the scope of risk management strategies available.2
There are several well-known economic arguments for industrial policy. Sometimes these arguments are based on internal economies of scale, such as learning by doing that occurs within a firm. More commonly, arguments refer to externalities. Benefits from technological development, knowledge generation, or human capital advancement in one firm can spill over to others. In recent decades, more emphasis has been placed on industrial policy’s role in discovering the costs and benefits of new economic activities and in addressing coordination issues through public-private cooperation [12].
In the subdomain of supply chain resilience, there are further arguments for industrial policy defined in this broad sense. All organizations and GVCs face some level of disruption risk, which can be thought of as the likelihood of some event that directly affects its usual functioning—its ability to deliver `the right products and services on time, with the required specifications, at the right place and to the right customer’ [13]. Following Baldwin and Freeman [14], we can think of socially excessive risk as a situation where firms’ decisions lead to a different bundle of risk and reward—reward such as cost savings—than what public interest would demand. Socially excessive supply chain risk can be a symptom of traditional market imperfections. For example, industries with few new entrants are more likely to see bottleneck firms emerge [6], which wields market power, restricts supply and concentrates risk.
A key example of potentially excessive supply chain risk is that modeled by Bimpikis, Candogan, and Ehsani [5]. The authors show that, under certain conditions, the equilibrium number of entrants in a supply network may be lower than the number that maximizes consumer surplus and profit. In an environment where firms face random disruptions, new firms, through the act of entry, benefit the rest of their supply network by diversifying supply or demand. Firms might be able to reap some of these external benefits—by profiting off their reputation as reliable suppliers, for example—but not all of them, without implausibly sophisticated contracting across all firms in a network.3
Conversely, there are areas where exposure to supply chain risk may appear high, but there is no clear policy rationale for addressing it directly. For example, in some cases, there is a trade-off between a lengthy, high-value-adding GVC and a shorter, more expensive, less volatile one [15]. Some network structures have been shown to propagate shocks more intensely than others [16]. Yet there is no case in principle for intervention unless that intervention might be expected to bring about a socially superior balance of risk. As Grossman, Helpman, and Lhuillier [8] [p. 3493] put it, while commentators have been quick to conclude governments should take a stronger role in promoting resilience, the welfare calculus around intervention is `subtle,’ and only `when the private incentives for resilience fall short of the social benefits will government encouragement be warranted.’
On that basis, as the Australian Productivity Commission [7] has outlined, policies to improve supply chain resilience are best targeted at vulnerable and essential products, where public risk appetites are lowest. `Essential’ may sound like a slippery concept, but it is one that governments regularly deal with; for example, in strategizing for disaster management or maintaining pharmaceutical or energy stockpiles. As vulnerability (or exposure to risk) and essentiality decline, private risk management is more likely to suffice. In addition to vulnerability and essentiality, the Productivity Commission [7] include a third criterion, criticality, or how difficult it is to substitute a given input for another.
The role of entry barriers in generating excessive supply chain risk suggests that industrial policy is more likely to aid resilience if it permits or encourages competition. A corollary is that policies are more likely to reduce resilience if they limit competition, either by restricting entry or favoring non-competitive incumbents. Empirical studies of industrial policy more broadly suggest competition is a critical variable. Evidence from China indicates that subsidies to more competitive sectors are most likely to boost productivity, while those to less competitive sectors tend to reduce it [17]. In Japan, the sectors that benefited from industrial policy in the 1970s, 80s ,and 90s succeeded internationally if there was a high level of domestic competition [18].4
The concentration of production by country is a flawed but sometimes informative proxy for competition issues that may present vulnerability. Concentrated production does not inherently mean there are barriers to entering and producing. It may be a temporary but desirable result of a firm or set of firms innovating. In some cases, however, concentration may be a signal of vulnerability to shocks—the key variable being whether alternative suppliers can enter or scale up quickly enough to deliver the socially optimal response if the main source is disrupted. Action to reduce this kind of risk may take the form of diversification, including through subsidies or agreements with third countries, or other risk management strategies, like emergency stockpiling or data sharing.
The choice of instrument matters and depends on institutional context. Subsidies and trade levers, though still common (Figure 2), are not the only tools available. Other industrial policy tools, such as infrastructure investment, manufacturing extension, and specialized training, may better serve both competition and productivity goals [20]. A survey of 50 years of US industrial policies points to research and development (R&D) programs as having by far the best track record of any instrument [21]. The authors also conclude that import protection rarely achieved its stated aims, except for when it successfully induced a world-class firm to relocate to the tariff-imposing country.5 Trade agreements, commercial diplomacy, and regulatory reform may all be beneficial for supply chain resilience to the extent that they address barriers to alternative sources of supply and demand.6 Sometimes, more security-focused policies like stockpiling may be reasonable alternatives if storage and other costs are low enough By way of example the Australian government’s response to DEF shortages was ultimately a combination of stockpiling, grants for sovereign capability, and greater industry data collection (DCCEEW, 2024).
Industrial policies have positive and negative international spillovers for supply chain resilience. On the positive side, industrial policies may accelerate the development of technology, which, with sufficient factor mobility, spreads internationally. They may facilitate new exporters, diversifying the supply or customer base. On the negative side, they may erode international competition, including by limiting export-competing countries’ access to third markets. These effects lower resilience by limiting the ability of new supply to enter. They may lead to wasteful subsidy races: if one country subsidizes, its competitor may be forced to subsidize too or exit markets.
Beyond subsidies, other policy instruments may have more direct implications for supply chain resilience. Local content requirements may impede responses to shocks by removing alternative supply options or at least by delaying the ability to adjust. Export bans similarly remove an input source from global markets. Cooperation is needed to identify and measure these spillovers to inform multilateral subsidy rules, especially where trade and climate change imperatives interact [9].
2.2. Supply Chain Resilience Policy and Multilateral Trade Rules
Current world trade rules and regional arrangements offer frameworks for managing some of these spillovers, but there are widely held doubts about their adequacy in addressing contemporary challenges. Diverse perspectives have long existed on how the WTO may best be reformed to address subsidies, with some scholars advocating for more flexibility and others emphasizing better definition, reporting, and discipline. Each has the goal of restoring the system. China’s pivotal position in GVCs and the massive, complex role of the state therein have intensified these debates.
The origins of the world trading system are deeply intertwined with concerns about the security of supply and its global strategic implications. One of the Atlantic Charter’s eight clauses concerns the access of all nations to trade and raw materials necessary for prosperity. This vision materialized in the GATT and carried through to the creation of the WTO. Yet the objectives of prosperity and security are today increasingly viewed in zero-sum terms [23], and the current state of the world trading system is marked by deadlock. The question of whether reform can proceed through multilateral channels depends on what reforms are actually desirable, especially to address challenges like climate change.
Most proposals for moving world trade rules forward against this backdrop are to do so through plurilateral channels, including WTO, and possibly through separate agreements between major economies in domains like the green energy transition. As Bown and Clausing [24] outline, an agreement between the United States, China, and the European Union could accommodate certain industrial policies for a green economy while agreeing to refrain from others, such as export restrictions. Forums like APEC or the RCEP economic cooperation agenda could present similar pathways in a regional context.
The WTO governs subsidies primarily through the Agreement on Subsidies and Countervailing Measures (ASCM), which defines a subsidy as a `financial contribution’ by a government or `public body’ that confers a benefit. The agreement categorizes subsidies into prohibited (namely export and local content subsidies) and actionable subsidies that cause adverse effects to other members. For the latter, the agreement offers two remedies: countervailing duties that can be imposed on subsidized imports causing injury to domestic producers; and dispute settlement, usually if the adverse effects are from displacing exports in the subsidizing market or a third market. Members are required to notify the WTO of their subsidies, but compliance with this requirement has been poor [25] [p. 570]. The ASCM only covers subsidies that are `specific’, either by firm, industry or region, or those that target exports.
There is a wide range of views on how subsidies should best be handled by multilateral trade rules. At one end, Sykes [26,27] argues the best approach to subsidies in the WTO may be, with the exception of the non-violation doctrine, an essential laissez-faire one, given the difficulties of properly identifying subsidization and of disentangling socially beneficial measures from protectionist ones. Bagwell and Staiger [28] also point to flaws in WTO subsidy rules, in contrast to those of the GATT, on the grounds that they risk undermining tariff negotiations as the primary mechanism for expanding market access. Hoekman and Nelson [29] highlight the need for an international work program on to identify common principles, such as citizen welfare as an objective, and develop simple, robust rules of thumb for subsidies governance.
Bown and Hillman [25], writing about China’s industrial policy, points out that work on measurement and identification of subsidies is critical for adequate governance and reform, given the high evidentiary burden for proving that subsidies exist. Beyond that, a ‘green, amber, red light’ system would be ideal, possibly with an expanded set of prohibited subsidies.7 The authors also raise an alternative approach of introducing competition policy concepts to the WTO, for example, requiring notifications on size and competition among large firms.
It is not surprising that much of this debate focuses on China, as state-owned enterprises are controversially exempt from the official definition of `public body’ [25] [p. 567]. A pioneering empirical study of industrial policy’s foreign spillovers is that of Barwick, Kalouptsidi, and Zahur [31] who look at China’s shipbuilding subsidies. While the net global benefits from cheaper shipping may be ultimately positive, about three-quarters of China’s expanded market share during its subsidy programs came from edging out Japanese and Korean firms—and the programs had decidedly mixed results for China itself. Another example relevant to supply chain resilience is solar photovoltaic (PV) cell production. By 2015, thanks in significant part to industrial policy, China had become the world’s top PV cell producer. There have been large, clear positive impacts on emissions reduction and innovation [32]. At the same time, overcapacity issues, coupled with high concentration at firm and facility levels, have led to concerns about global solar PV supply chain risk [33,34].
An interesting comparison is with Denmark’s use of industrial policy to become the world leader in wind power generation technology. Denmark began producing wind turbines in the 1980s, initially supported by price guarantees and favorable tax treatment, though not by trade restrictions. Studies suggest the subsidies enabled learning by doing, with benefits that likely exceeded future discounted costs [35]. Danish technology and know-how ultimately spread internationally, notably through direct investment in Spain and Germany. Despite initially high concentration—Denmark accounted for over 90 percent of global wind turbine exports in 2002—and overcapacity issues, concerns about competition and supply chain risk were muted. Few, in hindsight, would consider Denmark’s policy-driven dominance of the sector to be a global public bad.
The question of which policies, under which underlying conditions, should be expected to generate net global benefits depends on the balance of the international spillover effects. A better understanding of these effects would, therefore, inform how world trade rules should address supply chain resilience policies. Spillovers are often ambiguous and always multidimensional, with global welfare comprising the expected net pecuniary costs, the net supply chain risk, and (though out of scope for this paper) the environmental effects. The next section presents a simple model to illustrate some of these spillovers.
3. A Model of Trade with Input Disruptions
The model below provides stylized examples to illustrate potential spillovers from industrial policies for supply chain resilience. The aim is not to present sweeping policy conclusions but to highlight some mechanisms through which one country’s policies might help or harm others’ resilience and areas where international cooperation may be needed to avoid lose-lose outcomes. It also provides a novel approach to integrating stochastic supply chain risks into simple trade policy models, one that may be generalized and adapted to other policy tools and scenarios.
The model draws on that of Melitz and Redding [36], who show how trade can increase domestic productivity as the number of production stages increases. The setup and representation of profits are also similar to those of Venables [37] and Bagwell and Staiger [38].
The model has two sectors, an input I and a final good F, and three countries, A, B, and C. We use three countries as two-country models to miss some of the potential negative international spillovers from subsidies [25]. One country’s subsidies can carve out a competitor’s market share in a third country to which they both export. Here, C does not produce either good but represents the third market where A and B compete, thereby capturing some of these spillovers.
The model proceeds as follows. First, firms decide whether or not to enter the market for inputs. In doing so, they consider the prices they will face, which depend on policies, their risk of disruption, the costs of trade, and the price of raw materials. They also consider consumers’ demand for the final product, which depends on incomes and the elasticity of substitution between domestic and foreign goods. To enter the market, they need to pay an entry cost and purchase raw materials on a global exchange at a price , taken as given. If their expected profits are positive, they will enter.
Once they have entered, whether or not they produce and sell inputs depends on a stochastic disruption risk. A firm k in country j will make inputs with probability , but if it is disrupted, it will not produce, and the raw materials it purchased will be wasted. This process echoes the model of Bimpikis, Candogan, and Ehsani [5].
Disruption risk is modeled with both country-specific and idiosyncratic components. This reflects the fact that supply chain risks raised by policymakers are often geographically correlated, such as extreme weather events or geopolitically motivated trade curbs. The probability of no disruption, or the probability of successful production, can be defined as
where represents the event of a country-wide disruption occurring in country h, drawn from a beta distribution,
and represents the event of an idiosyncratic disruption occurring in firm k, independently of the country-wide disruption:
If occurs, then no firm in country h will produce. If occurs, then firm k will not produce.
Based on (1), (2) and (3), the expected probability of successful production for a firm in country h, is
After the entry process, prices are considered set, and production occurs. Input producers purchase raw materials and either make inputs or experience a disruption. The state is realized at this point. Each state s represents a different combination of firms that are disrupted or that successfully produce.
The inputs are sold to firms in the final goods sector in countries A and B, transformed into final goods, and and then sold to customers in countries A, B,, and C. We assume that if the quantity of inputs is higher or lower than expected pre-disruption, the inputs are still sold to customers in the same proportion.
Welfare is evaluated based on consumption of the final good and income after accounting for any revenue from tariffs or the costs of subsidies.
3.1. Consumers
Each country j has a representative consumer with constant elasticity of substitution (CES) preferences. These consumers maximise the expected utility given by
where represents consumption in country j of critical final goods produced by country i. This level of consumption is contingent on the state of the world , which is realized once each input-producing firm is either disrupted or produced successfully. The elasticity of substitution between goods from different countries is . Als,o .
Consumers maximize expected utility subject to the budget constraint
where is the price of final goods produced in country i and is income in country j. is labour income, normalised to one; is total revenue from any import tariffs and the total cost of any production or entry subsidies. captures net profits from the input-producing sector.
captures trade costs faced by importers from j of final goods from i. This term takes the value
where is the import tariff rate in country j, is the export tax rate in country i (if either apply) and is a generic international trade cost, such as freight.
As shown by Dixit and Stiglitz [39], a price index for final goods consumed in the country j can be defined as
Using the price index in (7), expected demand for final goods produced in country k and consumed in country j can be written as
The consumer’s remaining income is spent on the number of good, with the price set to one, for which expected demand can be written as
Consumers may not get the quantity they expect because of shocks. Once shocks have occurred, producers use the inputs available and sell final goods to each country in proportion to their demand.
where is total output of final goods from producers in country i, defined in the next section. Consumption of the numeraire good is then computed as total income, less expenditure on the critical good.
For simplicity, we assume the elasticity is constant across all stages of production. Our baseline considers an elasticity equal to 5. A comprehensive survey of Armington elasticities posits a `best guess’ of the range of empirical estimates at 2.5 to 5.1 with a median of 3.8 [40]. A value at the high end of that range was selected because we are interested in relatively specific, relatively similar varieties across the two countries.
Expected welfare is defined as follows to reflect the range of potential consumption outcomes and account for potential risk aversion in the traded good.
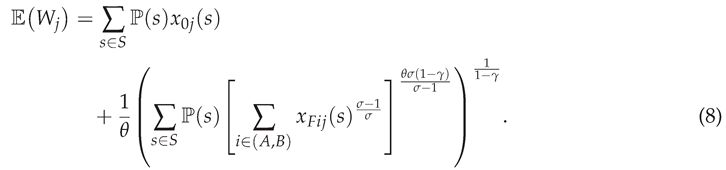
is the coefficient of relative risk aversion. The agent is risk averse if . If , the function is equivalent to the consumer’s expected utility in (5). Risk aversion is included to capture negative externalities from the volatile supply, that is if social risk tolerance exceeds private risk tolerance.
[Note any assumptions required for price to be greater than zero.]
3.2. Final Good Sector
The final good sector consists of a single representative firm per country, one in country A and one in country B. Country C consumes final goods but does not produce them. Since we are interested in market imperfections upstream, we assume perfect competition in the final good sector. Each firm in the sector sources a mix of domestic and foreign inputs and produces according to CES technology.
For final good producers in country i, production is given by
where are inputs sourced by country i from country h for production of goods in state of the world s.
The producers sell these goods to consumers in the three countries. For firms in country j, the production costs are
where input trade costs capture any tariffs and transport costs and are defined analogously with those in (6).
With perfect competition and constant returns to scale, price is equal to unit cost. We can also express this unit cost as a price index for inputs, that is,
with conditional demand for inputs then given by
3.3. Input Sector
Firms in the input sector procure raw materials, which are traded freely on a global commodity market at a price . They transform these materials directly into inputs unless they experience a disruption. The probability of successful production for a given firm in country h is . Other than disruption risk, which varies by country, input-producing firms face identical technologies and costs.
Each firm’s expected production can be written as
where is the number of raw materials purchased by each entrant in the country h. Prospective input producers decide whether to enter the market based on expected profits, which are given by
where is an optional specific production subsidy applied per unit of input produced by firms in the country h. is the rate of an optional entry subsidy, and represents a fixed barrier to entry. Once firms purchase raw materials, the materials may be used for production, but if there is a disruption, production cannot occur and the materials are sunk costs.
Because the total quantity of inputs produced by country i equals the sum of and , we can substitute the conditional demands in (10) into the expected profit function in (11). Doing so and solving for the profit-maximizing price, assuming that producers take price indexes as given, yields
where is defined as in (4).
Based on this price, firms in each country enter sequentially until the expected profits from one additional firm turn negative, given the fixed entry cost . If expected profits are still negative with only one firm, that country will not produce any inputs. If firms in neither country expect a profit, no raw materials are purchased, and nothing is produced.
Because there is free entry up until raw materials are purchased, expected profits in the input sector are essentially negligible. Yet they may be slightly above zero because the number of firms is required to be an integer so that the risk of disruption can be simulated for each firm. Accordingly, any profits are included in the welfare function (8).
3.4. Simulation of Policies
Once firms have procured raw materials, disruptions either occur or do not occur to each producer, and production begins. This section analyses four simple policy examples through simulations of this process: an entry subsidy, a specific production subsidy, a tariff on inputs, and an export ban on inputs. Since we are interested not just in expected welfare but in the variation of outcomes, for each example, we typically present the following indicators:
- expected welfare, measured by as defined in (8),
- expected production of inputs and final goods ,
- expected consumption of final goods , and
- the coefficient of variation (standard error of the mean divided by the mean) for the consumption of final goods .
The first example, an entry subsidy, is shown in Table 1. Since entry subsidies do not affect marginal revenues or costs, they do not change final production and consumption in this model, so these numbers are omitted from the table. The distribution of production and consumption, however, does change as more firms enter and spread risk. The small symmetric subsidy provides a greater reduction in variation than the large unilateral one and at a lower total subsidy cost ( firms firms). While not shown in the table, a very small entry subsidy can increase welfare, in line with the results of Bagwell and Lee [41], though it does not affect supply volatility because it is not large enough to induce additional entry. Consumers and final good producers in all countries benefit from lower volatility when new firms enter, but subsidizing countries are ultimately worse off in expected value terms because they have to pay for the policy.
In contrast to entry subsidies, production subsidies, shown in Table 2, did not typically reduce the variation of the final supply. An exception is in column 2, where a unilateral subsidy lowers variation by inducing an additional firm to enter—but if the subsidy gets bigger, a firm in the other country gets edged out, raising volatility again to initial levels. By raising average production, the subsidies do lower the probability of a shortage as defined above.
Symmetric production subsidies tend to enhance global welfare up to a certain rate, after which it starts declining (see Figure 3). If subsidies are unilateral, welfare exhibits kinks as firms in the subsidizing country enter and those in the other leave before plummeting after the last foreign firm exits. In general, consumers in subsidizing countries are made worse off—since they ultimately pay for the subsidy—while consumers in other countries are better off. Subsidized producers and downstream producers everywhere are made better off while competing input producers are made worse off. It is worth noting that in this simple example, with one final sector, the subsidies are not drawing resources from other, more productive sectors.
The third example, import tariffs on inputs, are shown in Table 5. Tariff rates of 0.1 and 0.2 are chosen to illustrate the prisoner’s dilemma dynamic. For the smaller tariff, welfare in the tariff-imposing country rises, and the Nash equilibrium is symmetrical small tariffs that reduce production and global welfare. The variance of supply and the shortage probability is not improved by tariffs.
One interesting result is the reduction in shortage probabilities under tariffs in columns 2 and 5, even though variation is unchanged and average supply is lower than in the free trade case. This result is an artifact of the number of firms and the chosen threshold for defining a shortage, which is half of the expected free-trade output. Under free trade, if any two firms are disrupted, consumption will drop by about half since there are four firms in total. Under small tariffs, if two firms are disrupted, but it is the two foreign firms, consumption will fall by less than half since foreign firms now make up less than half of expected consumption. In column 3, variation is reduced because another firm enters the tariff-imposing country. This outcome would not occur in equilibrium—under symmetric tariffs, shortage probability rises back to the free-trade level.
The fourth example is an export ban on inputs, shown in Table 4. Because there are only two producing countries, a ban on exports from Country A is equivalent to a 100 percent local content requirement for Country B’s final sector. Simulating the model with export bans requires a modification to prices. Since producers in B can no longer access inputs in A, their production technology becomes less efficient—one of the input quantities in 9 is set to zero—and their unit cost becomes equal to the price of inputs from their own country . Given perfect competition, the price of final goods changes to match this unit cost. Firms in the input sector anticipate this change when considering entry.
Any export ban reduces the expected welfare for all three countries. Behind this unsurprising result, there are some nuances. When country A alone bans exports of inputs, its domestic production of inputs grows, perhaps counterintuitively. Because B can no longer source foreign inputs, its production of final goods becomes much less efficient, causing A’s share of global final goods production to rise (in this example, to 65 percent). To meet this greater demand, a new firm enters in A, but conditions are not yet bad enough for a firm in B to drop out, resulting in more firms making fewer goods—and lower supply variation because the risk is spread more widely. An extension would be to incorporate country-specific risk, not just firm-specific risk, and check if this type of result is still feasible.
This result implies that if countries act solely to minimise variation or shortage probability for a critical final good, then under certain conditions, there will be a coordination failure. This makes the case for a trade agreement on risk-reducing grounds. However, if reducing shortage risk is not an objective and only expected welfare matters, export bans do not eventuate in this model.

Table 3.
Input tariff example.
| Ad valorem tariff rate on inputs | |||||
|---|---|---|---|---|---|
| None | Unilateral | Symmetric | |||
| Country A | |||||
| Input producers | 2 | 2 | 3 | 2 | 2 |
| 20.05 | 20.64 | 19.02 | 19.95 | 19.72 | |
| 19.66 | 21.03 | 21.99 | 19.29 | 19.19 | |
| 23.25 | 20.97 | 19.42 | 22.46 | 21.92 | |
| 15.80 | 15.44 | 15.21 | 15.26 | 14.89 | |
| 17.50% | 17.73% | 15.40% | 17.51% | 17.43% | |
| 2.00% | 1.18% | 0.84% | 2.02% | 1.19% | |
| Country B | |||||
| Input producers | 2 | 2 | 2 | 2 | 2 |
| 20.05 | 19.34 | 18.91 | 19.95 | 19.72 | |
| 19.66 | 17.95 | 16.91 | 19.29 | 19.19 | |
| 23.25 | 24.80 | 25.90 | 22.46 | 21.92 | |
| 15.80 | 15.66 | 15.58 | 15.26 | 14.89 | |
| 17.50% | 17.52% | 15.40% | 17.51% | 17.43% | |
| 2.00% | 1.18% | 0.84% | 2.02% | 1.19% | |
| Country C | |||||
| 17.73 | 17.44 | 17.25 | 17.13 | 16.72 | |
| 14.91 | 14.68 | 14.53 | 14.41 | 14.06 | |
| 17.49% | 17.61% | 15.36% | 17.46% | 17.35% | |
| 2.00% | 1.18% | 0.84% | 2.02% | 2.00% | |
| All countries | |||||
| Input producers | 4 | 4 | 5 | 4 | 4 |
| 57.82 | 57.42 | 55.17 | 57.03 | 56.16 | |
| 39.32 | 38.97 | 38.90 | 38.57 | 38.38 | |
| 46.50 | 45.77 | 45.32 | 44.93 | 43.84 | |
| 17.49% | 17.61% | 15.36% | 17.46% | 17.35% | |
| 2.00% | 1.18% | 0.84% | 2.02% | 2.00% | |
Note: Calculated with , , , and . Income for all countries is set to 10. Variation and probability are based on 30 samples of 20,000 simulations each. Bootstrap standard errors all .
Table 4.
Input export ban example.
| Export-banning country | |||
|---|---|---|---|
| Neither | A only | A and B | |
| Country A | |||
| Input producers | 2 | 3 | 2 |
| 18.64 | x | x | |
| 14.22 | x | x | |
| 19.66 | 25.46 | 20.41 | |
| 23.25 | 28.99 | 20.41 | |
| 15.80 | 15.45 | 13.87 | |
| 17.50% | 15.29% | 17.13% | |
| Country B | |||
| Input producers | 2 | 2 | 2 |
| 18.64 | x | x | |
| 14.22 | x | x | |
| 19.66 | 18.52 | 20.41 | |
| 23.25 | 15.36 | 20.41 | |
| 15.80 | 14.67 | 13.87 | |
| 17.50% | 15.55% | 17.12% | |
| Country C | |||
| 17.69 | x | x | |
| 13.52 | x | x | |
| 14.91 | 14.23 | 13.09 | |
| 17.49% | 15.30% | 16.68% | |
| All countries | |||
| Input producers | 4 | 5 | 4 |
| 54.97 | x | x | |
| 41.95 | x | x | |
| 39.32 | 43.97 | 40.83 | |
| 46.50 | 44.35 | 40.83 | |
| 17.49% | 15.30% | 16.68% | |
Note: Calculated with , , , and . Income for all countries is set to 10. Welfare and variation are based on 30 samples of 30,000 simulations each. Bootstrap standard errors all for welfare and for CV.
Table 5.
Export tax example.
| Tax rate on exports of inputs | |||||
|---|---|---|---|---|---|
| None | Unilateral | Symmetric | |||
| Country A | |||||
| Input producers | 2 | 2 | 3 | 2 | 2 |
| x | x | x | x | x | |
| x | x | x | x | x | |
| 19.66 | 21.03 | 21.99 | 19.29 | 19.19 | |
| 23.25 | 20.97 | 19.42 | 22.46 | 21.92 | |
| 15.80 | 15.44 | 15.21 | 15.26 | 14.89 | |
| 17.50% | 17.73% | 15.40% | 17.51% | 17.43% | |
| Country B | |||||
| Input producers | 2 | 2 | 2 | 2 | 2 |
| x | x | x | x | x | |
| x | x | x | x | x | |
| 19.66 | 17.95 | 16.91 | 19.29 | 19.19 | |
| 23.25 | 24.80 | 25.90 | 22.46 | 21.92 | |
| 15.80 | 15.66 | 15.58 | 15.26 | 14.89 | |
| 17.50% | 17.52% | 15.40% | 17.51% | 17.43% | |
| Country C | |||||
| x | x | x | x | x | |
| x | x | x | x | x | |
| 14.91 | 14.68 | 14.53 | 14.41 | 14.06 | |
| 17.49% | 17.61% | 15.36% | 17.46% | 17.35% | |
| All countries | |||||
| Input producers | 4 | 4 | 5 | 4 | 4 |
| x | x | x | x | x | |
| x | x | x | x | x | |
| 39.32 | 38.97 | 38.90 | 38.57 | 38.38 | |
| 46.50 | 45.77 | 45.32 | 44.93 | 43.84 | |
| 17.49% | 17.61% | 15.36% | 17.46% | 17.35% | |
Note: Calculated with , , , and . Income for all countries is set to 10. Variation and probability are based on 30 samples of 20,000 simulations each. Bootstrap standard errors all .
4. Towards Principles for Supply Chain Resilience Policy
In a highly stylized setting, the last section demonstrated some mechanisms through which different industrial policies might affect the performance and resilience of supply chains, domestically and internationally. Turning to active policy proposals, economic research to date suggests there are a few rules of thumb for domestic and international policymakers with the objective of supply chain resilience.
First, at a domestic level, industrial policies aimed at improving supply chain resilience should be designed to support competition and avoid raising unnecessary barriers for new entrants. Empirical work on industrial policy in Japan and China supports this conclusion on productivity grounds [17,18]. From a theoretical perspective, a competitive environment domestically means risk is spread more broadly and the persistence of bottlenecks is less likely.
To enhance resilience, policymakers might favor policy instruments that encourage firm entry while recognizing that, in some cases, there may be large trade-offs between resilience and productivity. (Barwick, Kalouptsidi, and Zahur [31], for example, found that entry subsidies in China’s shipbuilding sector made idleness and productivity issues worse, partly because of the industry’s economies of scale.) Such instruments might include temporary tax incentives for new entrants, expanded R&D incentives, or streamlined regulatory processes for sectors identified as vulnerable and essential. These measures can help diversify the supplier base and reduce dependency on a limited number of sources.
Second, the range of available policy instruments is broad, and the right tool depends on the task at hand. For example, if seeking to ensure the reliable supply of a critical product, purchasing from a diverse portfolio of global and local suppliers might be more cost-effective than investing commensurately in domestic production capacity, depending on the sector. An emphasis on measurement and evaluation of these policies seems essentially ’no regrets’ and would generate useful data.
Third, as the Productivity Commission [7] points out, a focus on essential and vulnerable sectors is crucial when supply chain resilience is the primary goal. These sectors are the nexus in which there is most likely to be a gap between private risk management outcomes and public risk tolerances.
Internationally, improving data collection on industrial policies and modeling their positive and negative spillovers is an important and rapidly growing space for researchers and policymakers. Tasking an organization with existing capacity in the area, such as the OECD, IEA, WTO, or potentially IPEF in the future, with independently reporting on essential supply chains and identifying vulnerabilities could provide valuable insights for policymakers globally. A recent IEA report, for example, points to alarming levels of concentration in PV wafer production and makes a brief, convincing case for intervention to alleviate it [34].
The question of whether and how the world trading system should address supply chain risk hinges at least as much on political and geopolitical contingencies as it does on economic welfare. The section above and conventional economic wisdom suggests that upstream export bans and local content requirements are generally inefficient means of attaining a secure supply. These measures already violate WTO rules. The European Union notably brought a case against Indonesia’s raw materials export bans with both China and the United States joining as third parties, a case which is under appeal as of 2024.
Greater political buy-in is needed to adequately discourage these policies, probably via plurilateral arrangements and in exchange for accommodating other, less distorting (or indeed, net-beneficial) policies. To that end, developing and reinforcing guardrails against policies that remove sources of supply will be important if the performance and stability of GVCs are an objective. This could include restrictions on export bans outside of immediate critical shortages, such as food shortages, ensuring that countries do not exacerbate supply chain disruptions through unilateral actions. Since some export restrictions are inevitable on defense grounds, a negative-list approach to restrictions would be the way forward to minimize certainty.
Following the model of the WTO Agreement on Agriculture, and as suggested by scholars like Aguayo Ayala and Gallagher [30] and Bown and Hillman [25], promoting a `green, amber, red light’ approach in the WTO could help manage supply chain-related policies more effectively. For example, policies that introduce a new source of supply for an extremely concentrated product—like PV wafers—using acceptable instruments could be classified as `green light’, indicating their general acceptability within world trade rules.
5. Concluding Remarks
This paper explores the theoretical grounds, current implementation, and international governance of industrial policies aimed at improving supply chain resilience. Through a simple three-country model, we illustrate potential spillovers from various policy instruments, including entry subsidies, production subsidies, import tariffs,s, and export bans. Since numerical methods are used here, a low-hanging area for future research would be to attempt to formalize the key conclusions. The model could also be generalized to include many countries, many stages of production, or non-CES preferences, as Grossman, Helpman, and Lhuillier [8] suggest. Supply chain resilience is an increasingly prominent topic for scholars and policymakers, and exploring the implications of new findings for international cooperation seems a particularly pressing need.
References
- Ilyina, A.; Pazarbasioglu, C.; Ruta, M. Industrial Policy is Back But the Bar to Get it Right Is High. IMF., 2024.
- Bonadio, B.; Huo, Z.; Levchenko, A.A.; Pandalai-Nayar, N. Global Supply Chains in the Pandemic. Journal of International Economics 2021, 133, 103534. [CrossRef]
- Caselli, F.; Koren, M.; Lisicky, M.; Tenreyro, S. Diversification Through Trade. The Quarterly Journal of Economics 2020, 135, 449–502. [CrossRef]
- Elliott, M.; Golub, B. Networks and Economic Fragility. Annual Review of Economics 2022, 14, 665–696. [CrossRef]
- Bimpikis, K.; Candogan, O.; Ehsani, S. Supply Disruptions and Optimal Network Structures. Management Science 2019, 65. [CrossRef]
- Carvalho, V.; Elliott, M.; Spray, J. Supply Chain Bottlenecks in a Pandemic.
- Productivity Commission. Vulnerable Supply Chains. Study Report, 2021.
- Grossman, G.M.; Helpman, E.; Lhuillier, H. Supply Chain Resilience: Should Policy Promote International Diversification or Reshoring? Journal of Political Economy 2023, 131. Publisher: The University of Chicago PressChicago, IL, . [CrossRef]
- Bown, C.P. Modern Industrial Policy and the World Trade Organization. Annual Review of Economics 2024, 16, 243–270. [CrossRef]
- Hardwick, S.; Joshi, R.; Shah, T.; Tabarias, J. Policy Approaches to Supply Chain Risk. Working Paper, East Asian Bureau of Economic Research, 2024.
- Harrison, A.; Rodríguez-Clare, A. Trade, Foreign Investment, and Industrial Policy for Developing Countries. In Handbook of Development Economics; Rodrik, D.; Rosenzweig, M., Eds.; Elsevier, 2010; Vol. 5, Handbooks in Economics, pp. 4039–4214.
- Rodrik, D. Industrial Policy for the Twenty-First Century. Working Paper, SSRN, 2004.
- Carvalho, H.; Barroso, A.P.; Machado, V.H.; Azevedo, S.; Cruz-Machado, V. Supply Chain Redesign for Resilience Using Simulation. Computers & Industrial Engineering 2012, 62, 329–341. [CrossRef]
- Baldwin, R.; Freeman, R. Risks and Global Supply Chains: What We Know and What We Need to Know. Annual Review of Economics 2022, 14, 153–180. Publisher: Annual Reviews, . [CrossRef]
- Levine, D.K. Production chains. Review of Economic Dynamics 2012, 15, 271–282. [CrossRef]
- Todo, Y.; Inoue, H. Propagation of Economic Shocks Through Supply Chains. VoxEU, 2019.
- Aghion, P.; Cai, J.; Dewatripont, M.; Du, L.; Harrison, A.; Legros, P. Industrial Policy and Competition. American Economic Journal: Macroeconomics 2015, 7, 1–32. [CrossRef]
- Porter, M.E.; Sakakibara, M. Competition in Japan. Journal of Economic Perspectives 2004, 18, 27–50. [CrossRef]
- Studwell, J. How Asia Works: Success and Failure in the World’s Most Dynamic Region; Profile Books: London, 2014.
- Juhász, R.; Lane, N.J.; Rodrik, D. The New Economics of Industrial Policy. Working Paper 31538, National Bureau of Economic Research, 2023.
- Hufbauer, G.C.; Jung, E. Scoring 50 Years of US Industrial Policy, 1970–2020. PIIE Briefing 21-5, Peterson Institute for International Economics, 2021.
- Fry-McKibbin, R.; Nguyen, T.T. Does Commercial Diplomacy Overcome Impediments to International Economic Flows? The Case of Australia. The Hague Journal of Diplomacy 2019, 14, 379–401. [CrossRef]
- Armstrong, S.; Quah, D. Economics for the Global Economic Order: The Tragedy of Epic Fail Equilibria. Working Paper arXiv:2310.18052, arXiv, 2023.
- Bown, C.P.; Clausing, K. How Trade Cooperation by the United States, the European Union, and China can Fight Climate Change. Working Paper 23-8, Peterson Institute for International Economics, 2023.
- Bown, C.P.; Hillman, J.A. WTO’ing a Resolution to the China Subsidy Problem. Journal of International Economic Law 2019, 22, 557–578. [CrossRef]
- Sykes, A.O. Subsidies and Countervailing Measures. In The World Trade Organization: Legal, Economic and Political Analysis; Macrory, P.F.J.; Appleton, A.E.; Plummer, M.G., Eds.; Springer US: Boston, MA, 2005; pp. 1682–1706. [CrossRef]
- Sykes, A.O. The Questionable Case for Subsidies Regulation: A Comparative Perspective. Journal of Legal Analysis 2010, 2, 473–523. [CrossRef]
- Bagwell, K.; Staiger, R.W. Will International Rules on Subsidies Disrupt the World Trading System? American Economic Review 2006, 96, 877–895. [CrossRef]
- Hoekman, B.; Nelson, D. Rethinking international subsidy rules. The World Economy 2020, 43, 3104–3132. [CrossRef]
- Aguayo Ayala, F.; Gallagher, K.P. Preserving Policy Space for Sustainable Development: The Subsidies Agreement at the WTO. Report, International Institute for Sustainable Development, 2005.
- Barwick, P.J.; Kalouptsidi, M.; Zahur, N.B. China’s Industrial Policy: an Empirical Evaluation. Working Paper 26075, National Bureau of Economic Research, 2019.
- Xu, X.; Cui, X.; Chen, X.; Zhou, Y. Impact of Government Subsidies on the Innovation Performance of the Photovoltaic Industry. Energy Policy 2022, 170, 113216. [CrossRef]
- Wang, Y.h.; Luo, G.l.; Guo, Y.w. Why Is There Overcapacity in China’s PV Industry in Its Early Growth Stage? Renewable Energy 2014, 72, 188–194. [CrossRef]
- IEA. Solar PV Global Supply Chains. Report, International Energy Agency, 2022.
- Hansen, J.D.; Jensen, C.; Madsen, E.S. The Establishment of the Danish Windmill Industry: Was It Worthwhile? Review of World Economics 2003, 139, 324–347. [CrossRef]
- Melitz, M.J.; Redding, S.J. Missing Gains from Trade? American Economic Review 2014, 104, 317–321. [CrossRef]
- Venables, A.J. Trade and Trade Policy with Differentiated Products: A Chamberlinian-Ricardian Model. The Economic Journal 1987, 97, 700–717. [CrossRef]
- Bagwell, K.; Staiger, R.W. The Design of Trade Agreements. In Handbook of Commercial Policy; Bagwell, K.; Staiger, R.W., Eds.; North-Holland, 2016; Vol. 1, pp. 435–529. [CrossRef]
- Dixit, A.K.; Stiglitz, J.E. Monopolistic Competition and Optimum Product Diversity. The American Economic Review 1977, 67, 297–308.
- Bajzik, J.; Havranek, T.; Irsova, Z.; Schwarz, J. Estimating the Armington Elasticity: The Importance of Study Design and Publication Bias. Journal of International Economics 2020, 127, 103383. [CrossRef]
- Bagwell, K.; Lee, S.H. Trade Policy under Monopolistic Competition with Heterogeneous Firms and Quasi-linear CES Preferences, 2018.
- DCCEEW (Department of Climate Change, Energy, the Environment and Water). Securing Supply of Diesel Exhaust Fluid to Keep Australia Moving, 2022.
| 1 | Grossman, Helpman, and Lhuillier [8] identify a business-stealing externality, where a firm’s profits, if they avoid supply disruption, come at the expense of other viable firms without creating new value. If this effect—which gives rise, perhaps counterintuitively, to overinvestment in resilience—dominates other externalities, overall welfare is reduced. The authors show that the government can achieve efficient sourcing with a combination of product-specific consumption subsidies and diversification taxes. |
| 2 | See Productivity Commission [7] [pp. 145–148] on the role of an open trading environment in managing supply chain risk. |
| 3 | |
| 4 | Studwell [19] explores this theme in depth for the East Asian region. |
| 5 | Toyota in the 1980s is presented as an example [21] |
| 6 | See Fry-McKibbin and Nguyen [22] for empirical evidence on the ability of commercial diplomacy to address informational and regulatory barriers to trade. |
| 7 | The `green light’ system would follow the 1995 WTO Agreement on Agriculture, which temporarily introduced it. Aguayo Ayala and Gallagher [30] offered an early proposal to revive this system. |
Figure 1.
Subsidy policies implemented since January 2009, cumulative, by income group
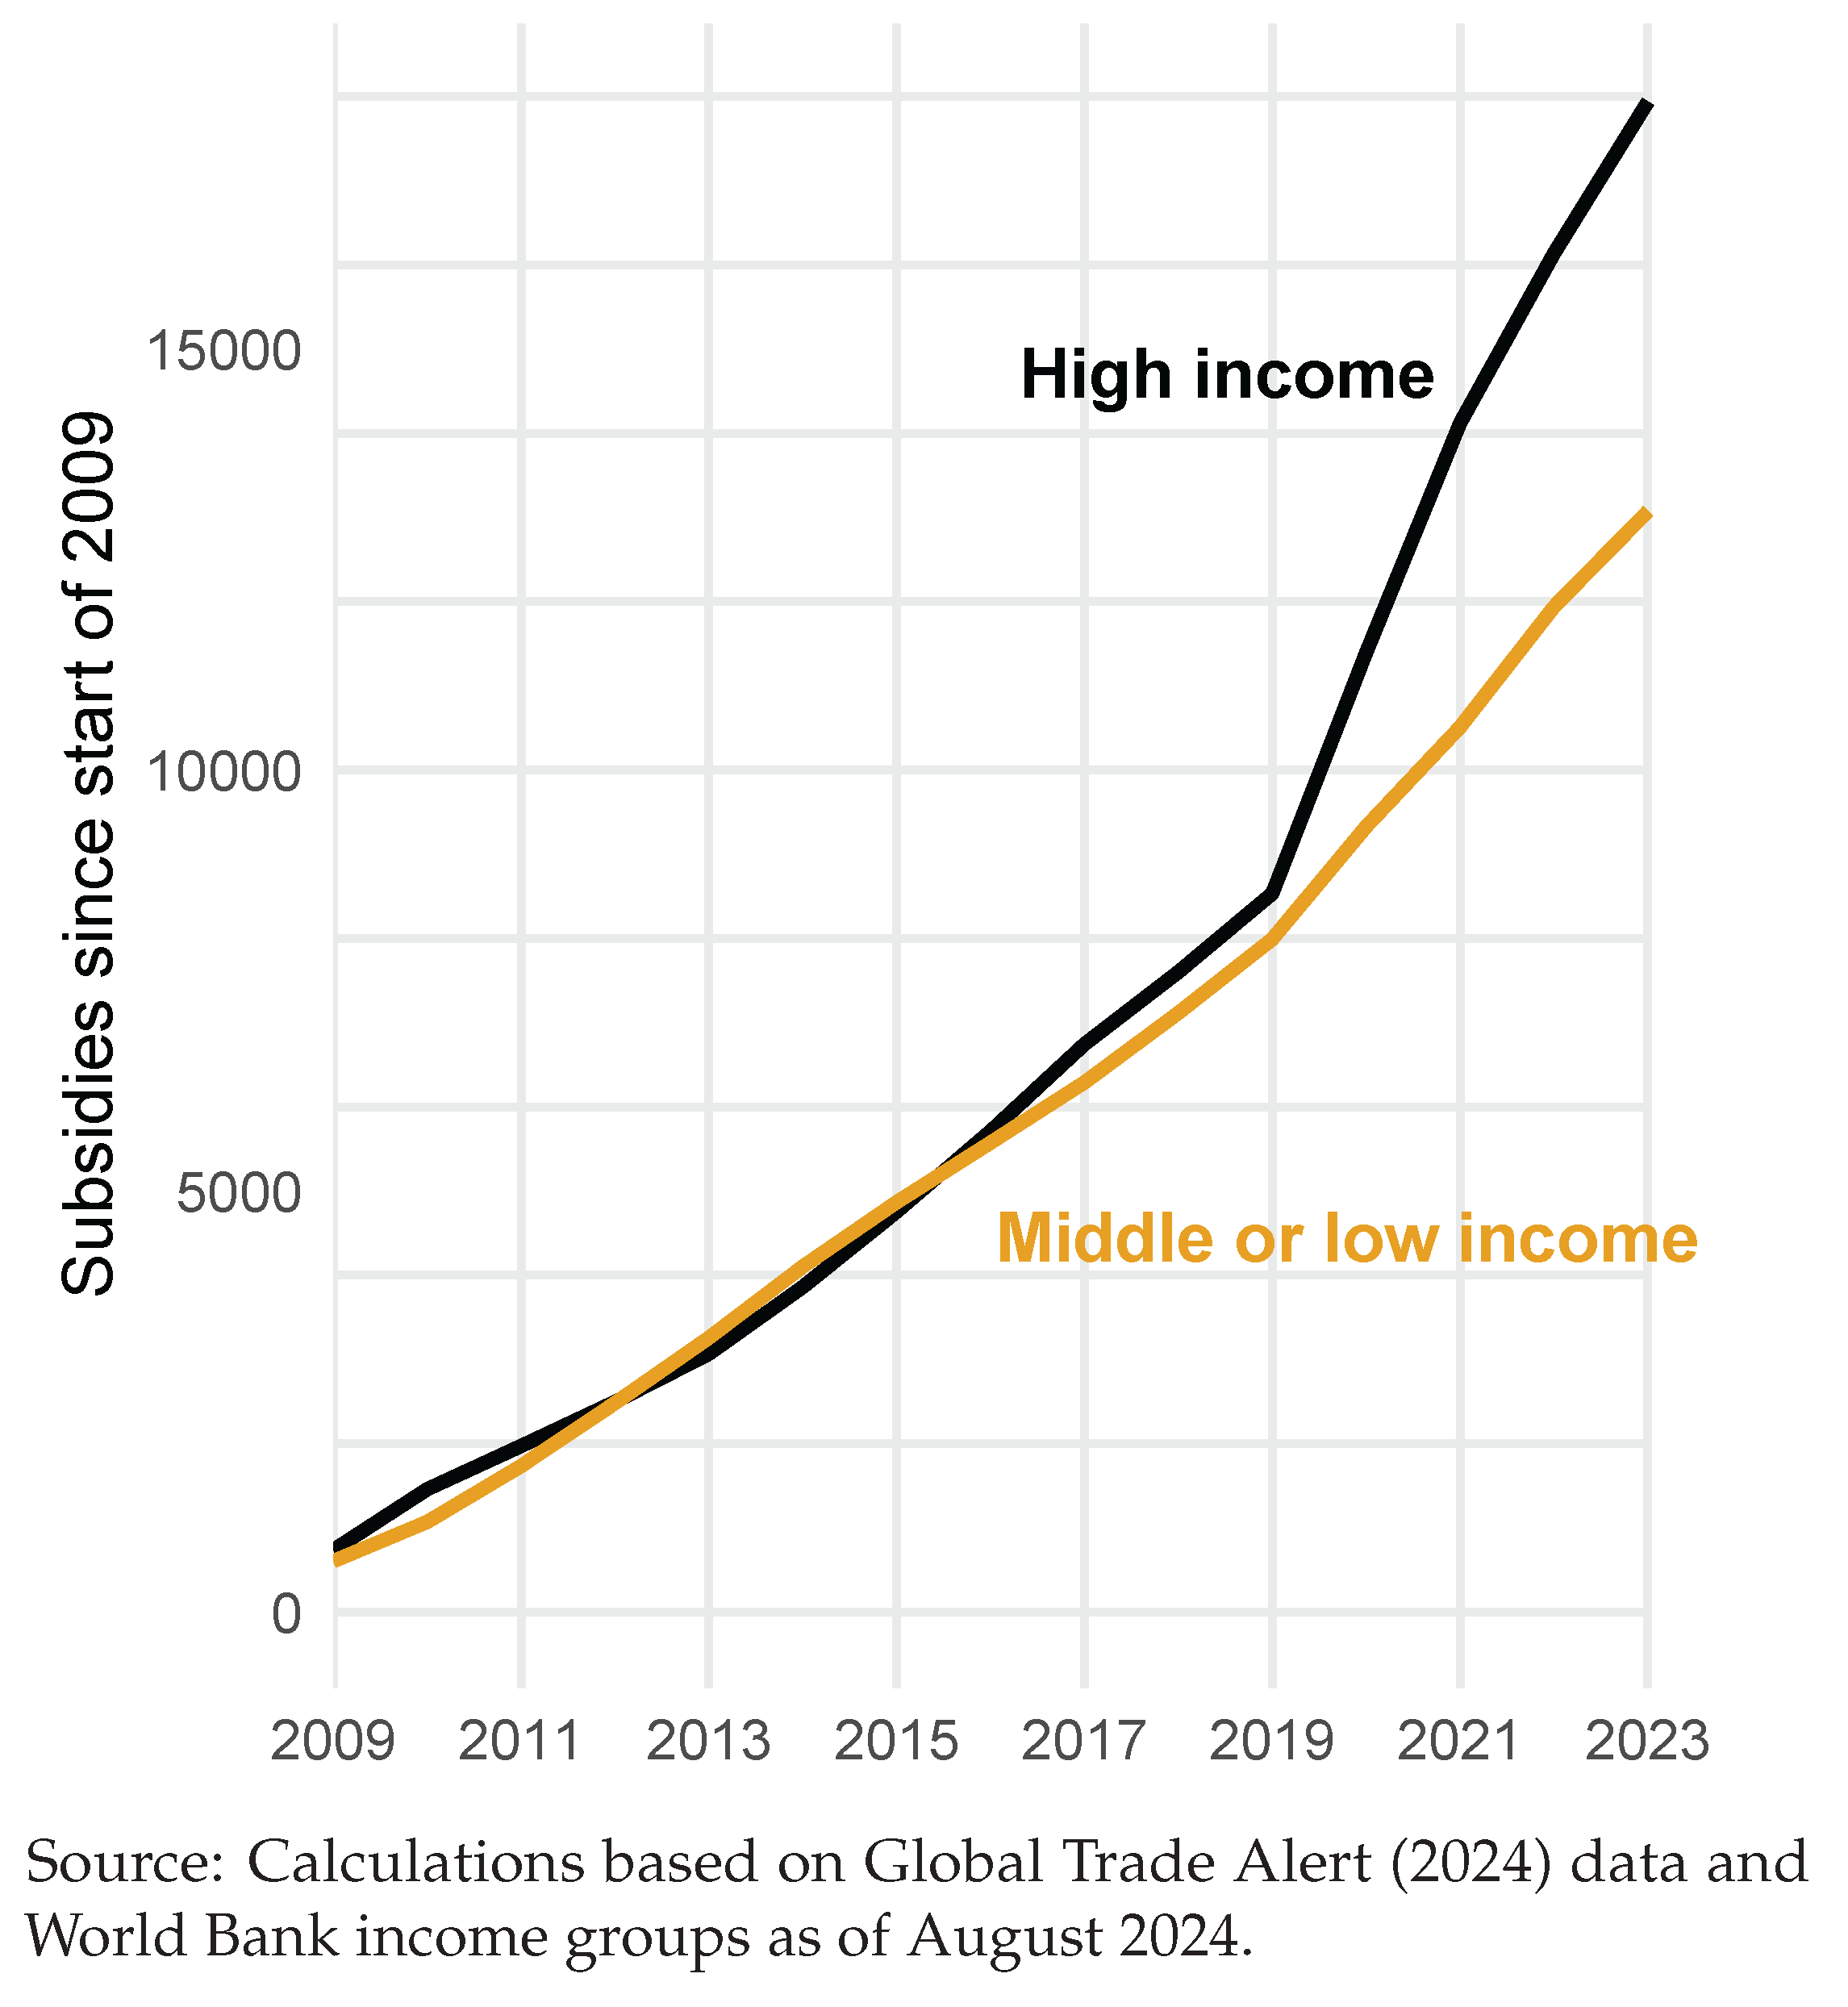
Figure 2.
Number of interventions by instrument in Global Trade Alert database, 2009–2023
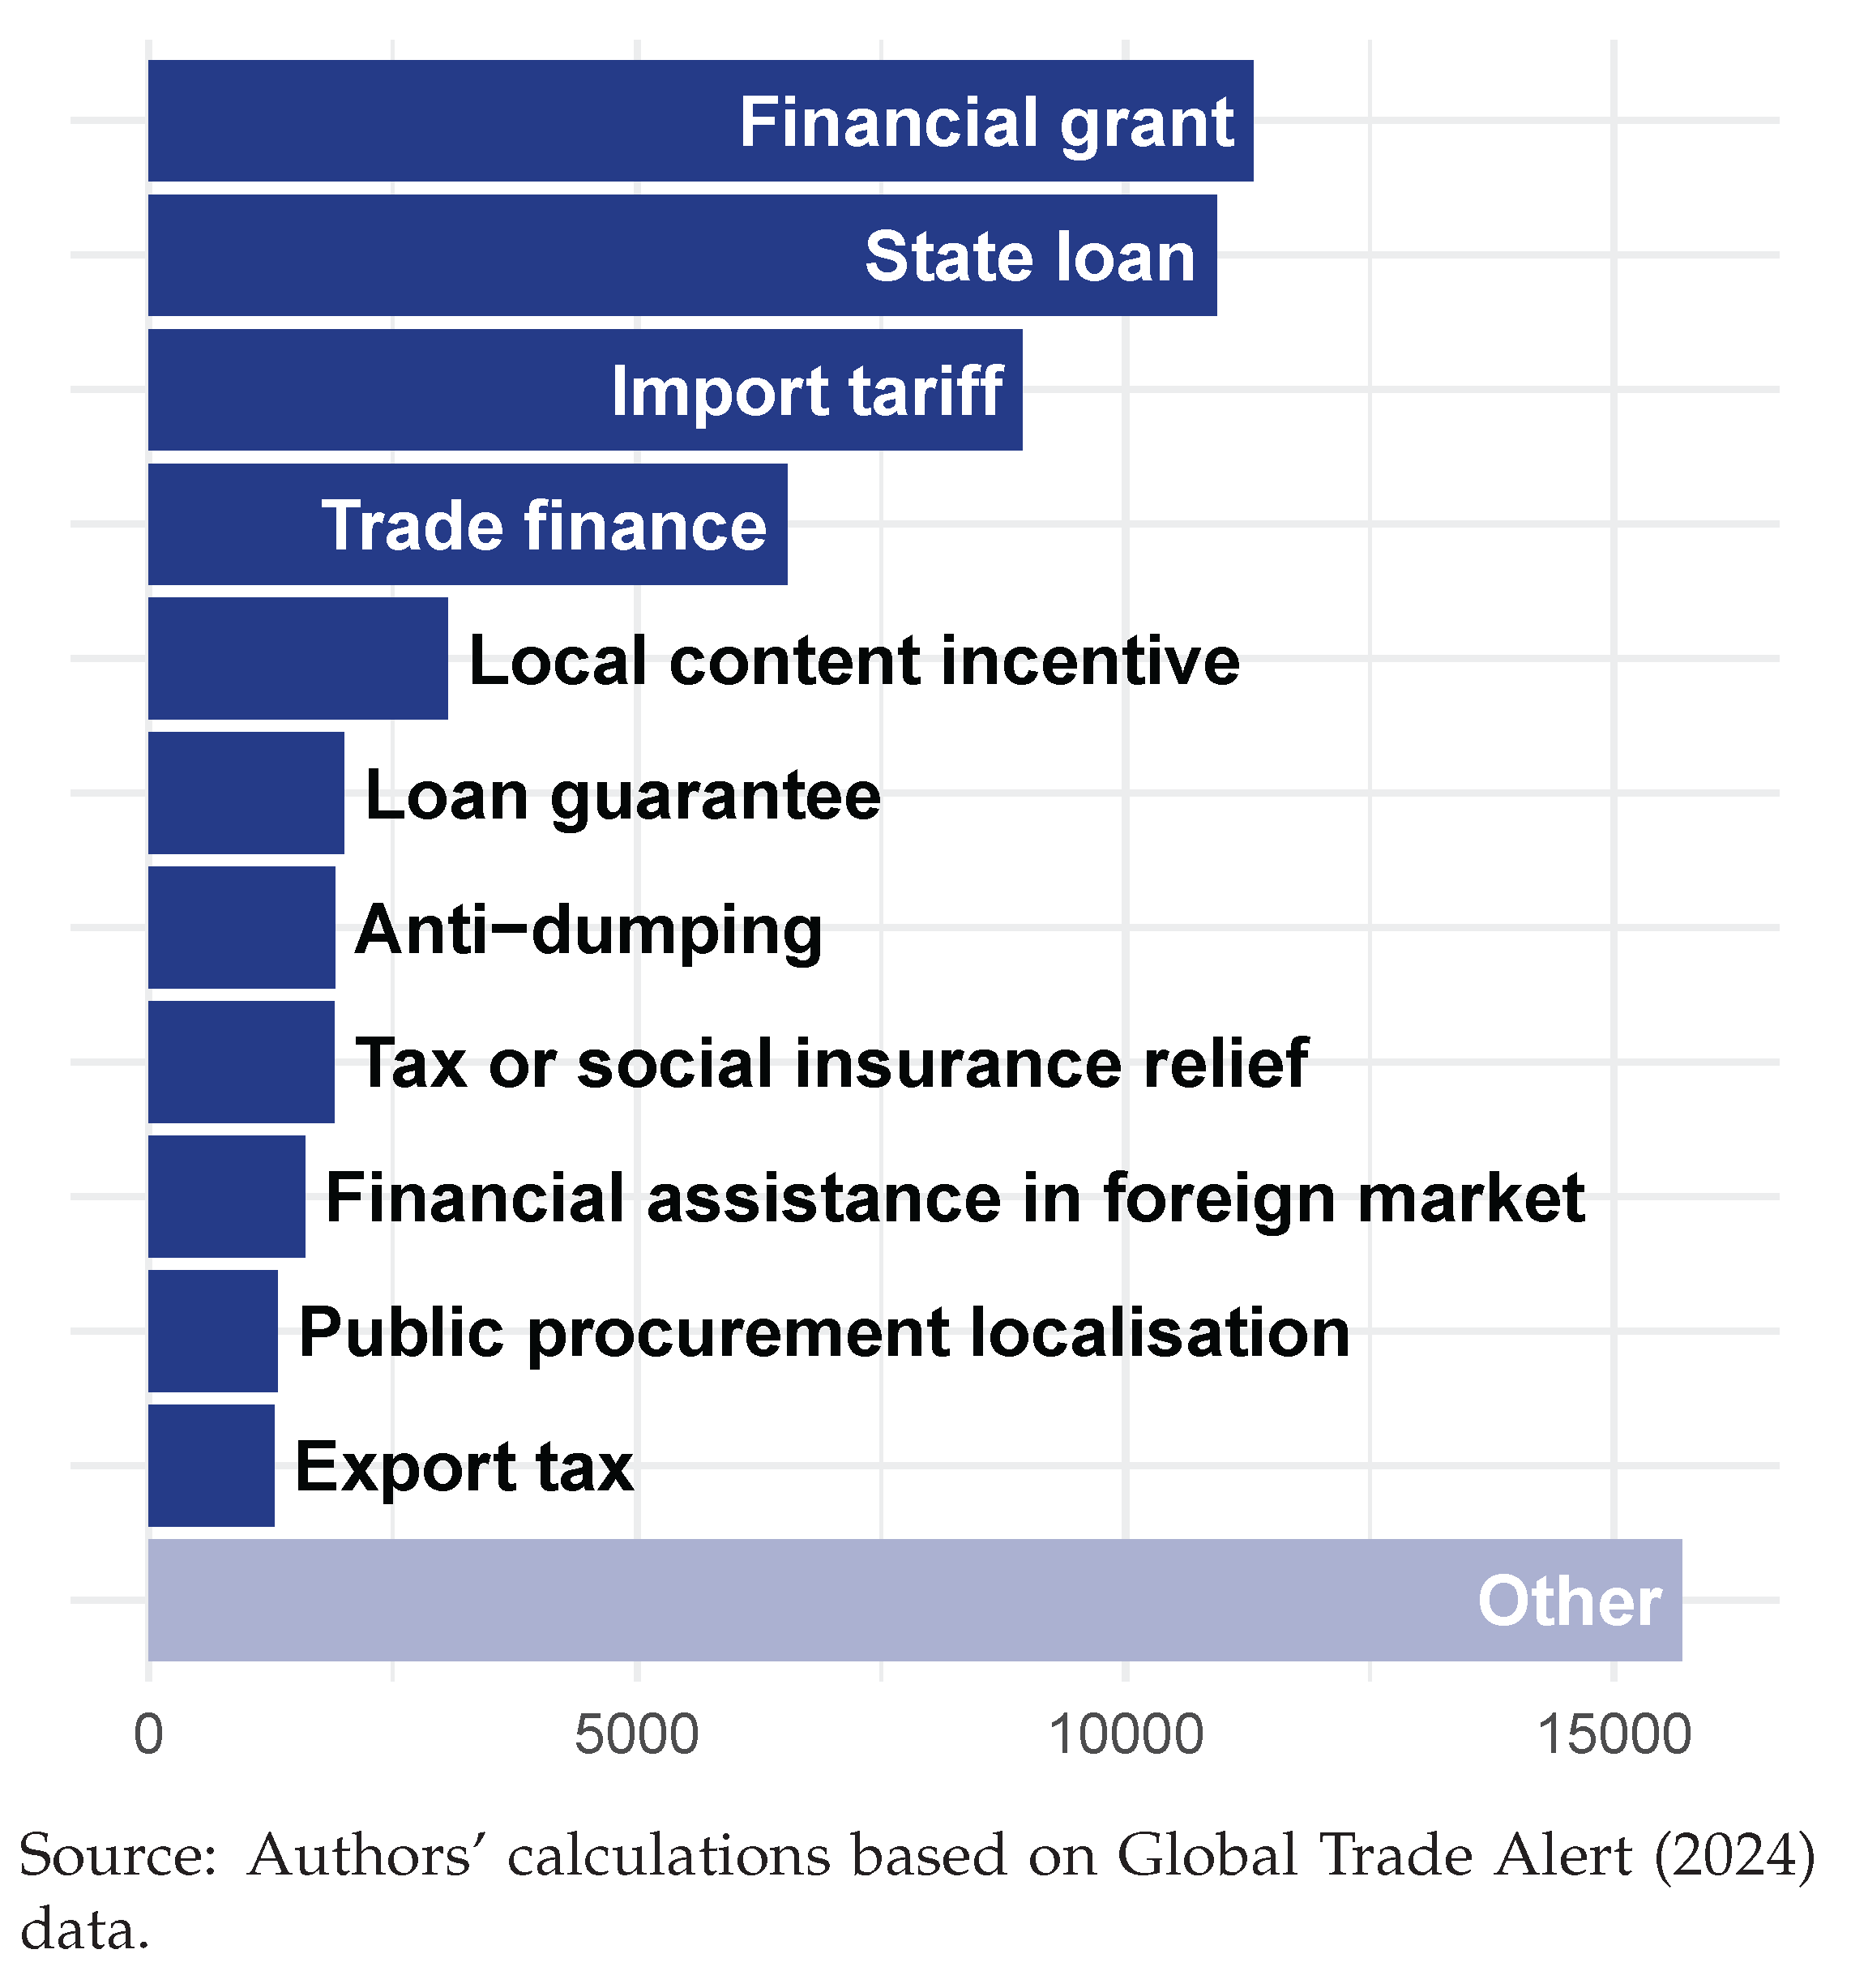
Figure 3.
Expected global welfare as input subsidies increase.
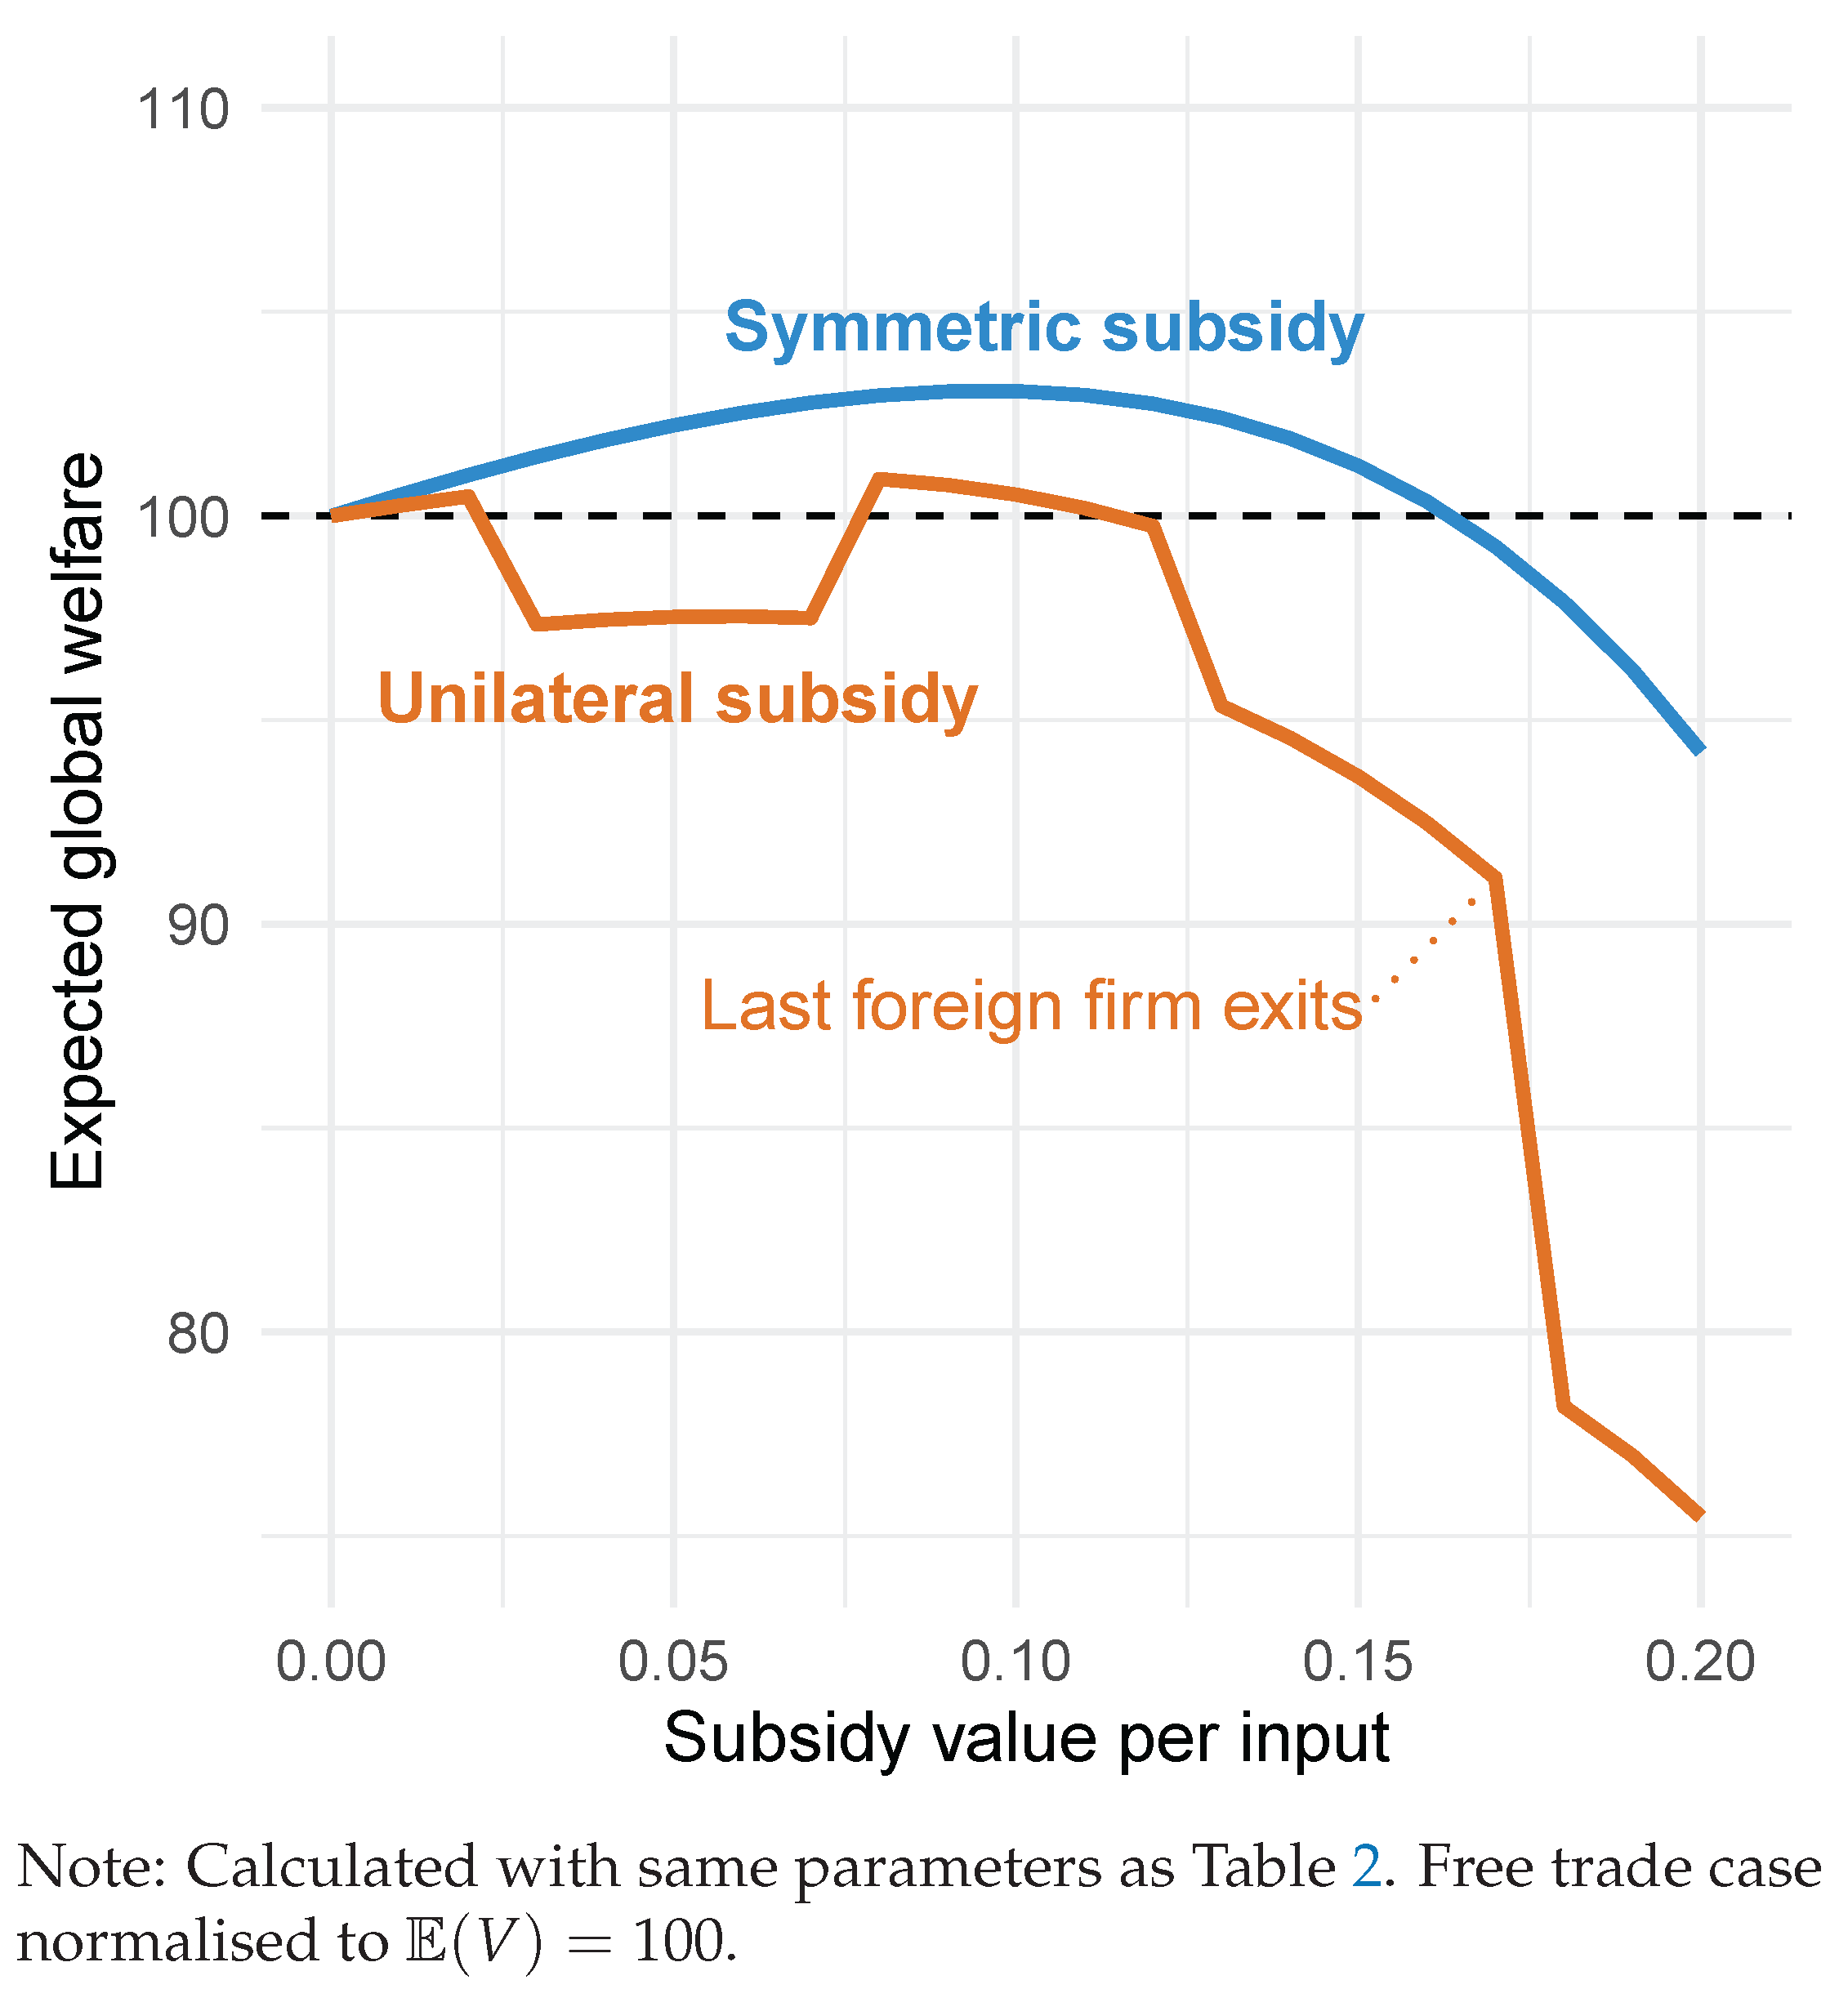
Table 1.
Entry subsidy example.
| Entry subsidy rates | |||||
|---|---|---|---|---|---|
| None | Unilateral | Symmetric | |||
| Country A | |||||
| Input producers | 2 | 3 | 4 | 3 | 4 |
| 20.05 | 18.18 | 16.31 | 18.18 | 16.31 | |
| 17.47% | 15.73% | 14.81% | 13.91% | 11.98% | |
| 2.00% | 1.59% | 1.06% | 0.26% | 0.05% | |
| Country B | |||||
| Input producers | 2 | 2 | 2 | 3 | 4 |
| 20.05 | 20.05 | 20.05 | 18.18 | 16.31 | |
| 17.45% | 15.96% | 15.17% | 13.91% | 11.98% | |
| 2.00% | 1.59% | 1.06% | 0.26% | 0.05% | |
| Country C | |||||
| 17.73 | 17.73 | 17.73 | 17.73 | 17.73 | |
| 17.46% | 15.83% | 14.98% | 13.90% | 11.98% | |
| 2.00% | 1.59% | 1.06% | 0.26% | 0.05% | |
| All countries | |||||
| Input producers | 4 | 5 | 6 | 6 | 8 |
| 57.82 | 55.96 | 54.09 | 54.09 | 50.35 | |
| 17.46% | 15.83% | 14.98% | 13.90% | 11.98% | |
| 2.00% | 1.59% | 1.06% | 0.26% | 0.05% | |
Note: Calculated with , , , and . Income for all countries is set to 10. Welfare and variation are based on 30 samples of 20,000 simulations each. Bootstrap standard errors all .
Table 2.
Specific input production subsidy example.
| Subsidy per unit of input | |||||
|---|---|---|---|---|---|
| None | Unilateral | Symmetric | |||
| Country A | |||||
| Input producers | 2 | 3 | 3 | 2 | 2 |
| 20.05 | 17.65 | 15.74 | 19.81 | 18.98 | |
| 19.66 | 25.63 | 33.01 | 21.61 | 23.98 | |
| 23.25 | 25.54 | 28.46 | 25.55 | 28.36 | |
| 15.80 | 16.70 | 17.93 | 17.36 | 19.26 | |
| 17.51% | 15.50% | 17.54% | 17.44% | 17.44% | |
| 1.99% | 0.85% | 0.39% | 1.14% | 0.36% | |
| Country B | |||||
| Input producers | 2 | 2 | 1 | 2 | 2 |
| 20.05 | 20.07 | 22.43 | 19.81 | 18.98 | |
| 19.66 | 16.00 | 12.25 | 21.61 | 23.98 | |
| 23.25 | 23.54 | 23.92 | 25.55 | 28.36 | |
| 15.80 | 16.57 | 17.66 | 17.36 | 19.26 | |
| 17.51% | 15.42% | 17.56% | 17.45% | 17.44% | |
| 1.99% | 0.85% | 0.39% | 1.17% | 0.36% | |
| Country C | |||||
| 17.73 | 18.67 | 19.96 | 19.49 | 21.62 | |
| 14.91 | 15.70 | 16.80 | 16.39 | 18.18 | |
| 17.50% | 15.46% | 17.54% | 17.44% | 17.43% | |
| 1.99% | 0.85% | 0.39% | 0.36% | 0.36% | |
| All countries | |||||
| Input producers | 4 | 5 | 4 | 4 | 4 |
| 57.82 | 56.39 | 58.13 | 59.11 | 59.59 | |
| 39.32 | 41.63 | 45.26 | 43.21 | 47.95 | |
| 46.50 | 48.97 | 52.39 | 51.10 | 56.71 | |
| 17.50% | 15.46% | 17.54% | 17.44% | 17.43% | |
| 1.99% | 0.85% | 0.39% | 0.36% | 0.36% | |
Note: Calculated with , , , and . Income for all countries is set to 10. Welfare and variation are based on 30 samples of 20,000 simulations each. Bootstrap standard errors all .
Disclaimer/Publisher’s Note: The statements, opinions and data contained in all publications are solely those of the individual author(s) and contributor(s) and not of MDPI and/or the editor(s). MDPI and/or the editor(s) disclaim responsibility for any injury to people or property resulting from any ideas, methods, instructions or products referred to in the content. |
© 2025 by the authors. Licensee MDPI, Basel, Switzerland. This article is an open access article distributed under the terms and conditions of the Creative Commons Attribution (CC BY) license (http://creativecommons.org/licenses/by/4.0/).
Copyright: This open access article is published under a Creative Commons CC BY 4.0 license, which permit the free download, distribution, and reuse, provided that the author and preprint are cited in any reuse.


