Submitted:
23 September 2025
Posted:
24 September 2025
You are already at the latest version
Abstract
Investigating the mechanisms maintaining different types of neural stem cells is essential for brain development. While factors maintaining distinct Drosophila neuroblasts (NBs) have been identified, additional factors remain unidentified. In this paper, we find knockdown of split ends (spen) enhances the activity of Notch signaling in type II NBs, and then leading to the intermediate neural progenitors (imINPs) dedifferentiate into type II NBs, thereby increasing type II NBs number specifically. Additionally, we find that knockdown of both spen and a co-repressor of the Notch signaling pathway-Hairless in type II NBs exacerbates the increase in type II NBs number, compared to spen knockdown alone. Furthermore, we observe that spen seems to play a more critical role than Hairless in type II NBs and their lineages. We reveal that SPEN may indeed function as a functional homolog of its mammalian homolog-SHARP, acting as a novel Notch signaling co-repressor in type II NBs specifically. This highlights the potential for multiple co-repressors to collaboratively regulate the same signaling pathway within the type II NBs lineage. The distinct regulatory mechanism of type I and II NBs offers new insights into the study of neural stem cell homeostasis.
Keywords:
type II NBs
; spen
; imINP dedifferentiation
; Notch pathway
; Hairless
1. Introduction
Different regulatory mechanisms are crucial for the maintenance of distinct NBs and are also important for the overall homeostasis of brain development. Neural stem cells are a type of cells generating neurons or glial cells, which compose the central nervous system (CNS) [1,2]. Excessive proliferation of neural stem cells may induce the onset of malignancies, whereas insufficient division of neural stem cells can lead to neurodevelopmental defects [3,4]. Mammalian neural stem cells exhibit various division modes, and the division modes of type I and type II neural stem cells (neuroblasts, NBs) [5] in Drosophila are analogous to two of these modes in mammals [1,6]. Therefore, Drosophila NBs serve as an excellent model for studying neural stem cells. The Drosophila central brain NBs are primarily categorized into two types: type I and type II NBs [7]. Drosophila NBs originate during embryogenesis, and by the third instar larval stage, there are eight type II NBs per hemisphere, a number that is significantly smaller than the approximately 90 type I NBs [8,9]. In addition, the progeny cells produced by the two types of NBs differ. Type II NBs generate another NB and an intermediate neural progenitor (INP), which undergoes a limited number of division cycles before differentiating into a ganglion mother cell (GMC), while type I NBs give rise to another NB and a ganglion mother cell (GMC), which subsequently produces neurons or glial cells [1,7]. Different types of neural stem cells produce varying numbers of progeny and contribute to distinct brain structures [10,11,12,13]. For example, type II NBs can generate numerous progeny cells that contribute to the formation of the central complex of the Drosophila central brain, or to the optic lobe by producing glial cells which differentiate into lobular giant glial cells [1,8,9,10,12]. In addition to the aforementioned differences, type I and type II NBs also express distinct molecular markers. Asense (Ase) is specifically expressed in type I NBs, but not in type II NBs, whereas Pntp1 (Pnt) is exclusively expressed in type II NBs [14,15]. Many studies have reported the different maintenance mechanisms of type I and type II NBs. For example, Six4 can specifically inhibit the premature differentiation of INPs [16]. However, it remains unclear whether there are other unknown specific regulatory factors that affect different types of NBs. The process by which type II NBs generate INPs is analogous to that of higher mammalian NSCs, making type II NBs an excellent model for studying the maintenance of neural stem cells [17,18]. Therefore, it is crucial to explore the mechanisms involved in maintaining Drosophila type II NBs specifically.
It has been reported that ectopic activation of Notch signaling leads to over-proliferation and an increase in ectopic NBs, which appears to be more pronounced in type II NBs [19,20,21,22]. The mechanism by which the Notch signaling pathway exerts its effects through cleavage is conserved. Upon binding of the Notch receptor to ligands secreted by adjacent cells, a series of cleavage events occurs, resulting in the generation of the active form, Notch NICD (Notch intracellular domain, NICD). Notch NICD subsequently translocates from the cytoplasm to the nucleus, where it activates the expression of downstream Notch target genes [23,24]. During the activation of the Notch signaling pathway, numerous factors regulate this process. For example, the mammalian SHARP functions as a co-repressor recruited by RBP-J. In the absence of Notch NICD, SHARP and RBP-J bind to DNA, thereby repressing the expression of downstream target genes [24,25,26]. This process is mediated by HAIRLESS (H) in Drosophila, however, no homologous protein has been identified in mammals [24,27]. Although many regulatory factors have been reported, it remains unclear whether there are other regulatory factors of Notch signaling pathway and whether multiple co-repressors exist to coordinately regulate the Notch signaling pathway in Drosophila type II NBs. Therefore, investigating new regulatory factors of the Notch signaling pathway is crucial for the maintenance of type II NBs.
Split ends (spen) (also called MINT in mice and SHARP in human [28,29]) plays an important role in regulating gene expression and tissue development. SHARP, as a transcriptional co-repressor, can combine to chromatin-remolding complexes or physically associate with the nuclear receptor components [30,31,32,33,34]. The biological functions of SPEN include promoting cilia formation, maintaining middle glial cell fate, and regulating various other processes [35,36,37]. In addition, spen is involved in multiple signaling pathways that collectively regulate tissue growth and development [38,39,40,41]. For example, during Drosophila eye development, the absence of spen results in ectopic activation of Notch signaling, and this aberrant activation subsequently diminishes the activity of the epidermal growth factor receptor (EGFR) signaling pathway, ultimately leading to the disruption of adult eye morphology [41]. However, the role of spen in Drosophila NBs is currently unclear, and the relationship between Notch signaling pathway in Drosophila type II NBs remains to be elucidated. Furthermore, it remains unclear whether multiple signaling pathways collaborate to exert their effects in Drosophila NBs, and whether SPEN plays a critical regulatory role in NBs.
In this study, we find that SPEN can prevent the generation of supernumerary type II NBs but does not affect the number of type I NBs. Moreover, we identify that the specific role of spen in type II NBs is mediated by the inhibition of the Notch signaling pathway, which prevents the dedifferentiation of imINPs. In addition, we also find that knockdown of both spen and Hairless can enhance the phenotype resulting from knockdown of spen alone in type II NBs. Furthermore, in imINPs, Hairless and spen appear to play distinct roles. The reduction of the EGFR signaling pathway can partially rescue the increase in type II NBs caused by spen. Therefore, our experiments highlight that spen functions as a novel regulatory factor of Notch signaling in Drosophila to prevent the generation of supernumerary type II NBs specifically. This regulatory role suggests that spen, like Hairless, may function as a homolog of mammalian sharp.
2. Materials and Methods
2.1. Drosophila Stocks and Genetics
Flies were raised at 25 ℃, and mated at 29 ℃. The GAL4 strains involved in this paper included: UAS-Dicer2; wor-GAL4, ase-GAL80, UAS-mCD8-GFP; + (II NB-GAL4), w; ase-GAL4; UAS-Dicer2, w; UAS-Dicer2; PntP1-GAL4, UAS-mCD8-GFP (pnt NB-GAL4),w;UAS-mCD8-GFP;UAS-Dicer2, 9D11-GAL4(9D11 mINP-GAL4), w; UAS-LacZ, 9D10-GAL4 (9D10 mINP-GAL4);sb/Tm6B, Repo-GAL4/Tm6B, Elav-GAL4.The other strains involved in this paper included: UAS-spen RNAi (Tsing Hua Fly Center THU0750), UAS-spen RNAi (Vienna Drosophila Resource Center (VDRC) 108801, P{KK100153}VIE-260B), UAS-spen RNAi (V49542,w1118; P{GD16317}v49542, gift from Li Hua Jin), UAS-spen RNAi (v48846, gift from Li Hua Jin), UAS-spen (Bloomington Drosophila Stock Center (BDSC) 20756,y1 w67c23; P{EPgy2}spenEY12567), UAS-luciferase (BDSC35788, P{UAS-LUC.VALIUM10}attP2), UAS-LacZ RNAi (V51446), UAS-Notch RNAi (THU0549), UAS-Notch RNAi (BDSC33611, P{TRiP.HMS00001}attP2), w; +; E(spl) mg-GFP (gift from Yan Song), UAS-Egfr RNAi (THU1863, THU1864), UAS-Egfr CA (BDSC9533, BDSC9534), UAS-hairless RNAi (THU3690), UAS-hairless RNAi (v24466), UAS-Arm RNAi (THU1631), UAS-Ctbp RNAi (THU1078), UAS-Ctbp RNAi (THU1919), UAS-Brat (B13860).
2.2. Immunohistochemistry
Third larval brains were dissected, and then they were incubated in 4%paraformaldehyde for 20 minutes. Samples were washed with 0.3%PBST for 4 times and subsequently blocked by 2% BSA for 1 hour. Samples were incubated at 4°C overnight with primary antibodies. The samples were washed with 0.3% PBST for 4 times, then the secondary antibody was incubated for 2 hours, and the secondary antibody was finally washed off. Finally, the tissues were observed with Zeiss LSM700 and Zeiss LSM900 confocal microscopes. The following primary antibodies were used in this paper: Chicken polyclonal anti-GFP (1:1000, Cat# A10262, Thermo Fisher Scientific), Rat monoclonal anti-Miranda (1:1000, Cat#ab197788, Abcam), Rat monoclonal anti-Dpn (1:1000, Cat# ab195173; Abcam), Rabbit polyclonal anti-PH3 (1:100, Cat# 9701, Cell Signaling Technology), Rat anti-Elav (1:50, Cat# 9F8A9, DSHB), Rabbit anti-Ase (Serum antibodies constructed by the laboratory), Mouse anti- PKC ζ (1:50, Cat#177781, Santa Cruz), anti-α tublin (1:100, cat#ab7291, Abcam), Mouse anti-NICD (1:50,cat#C17.9C6, DSHB). Mouse anti-NECD (1:50, cat#C458.2H, DSHB) Rabbit anti-mcherry (1:10, Cat#ab213511, Abcam)
2.3. Statistical Analysis
Fluorescence intensity analysis was performed on samples under consistent background conditions using ImageJ software. Fluorescence intensity and other statistical data were analyzed using GraphPad Prism 6 (GraphPad Software). The total number of animals, p-values, and significance levels were indicated in the figure legends.
3. Results
3.1. Knocking Spen Down Leads to an Increased Number of Type II NBs Specifically
In order to identify genes that specifically influence the development of type II NBs, we conducted knockdown experiments using a GAL4 driver that was specific to type II NBs (UAS-Dicer2; wor-GAL4, ase-GAL80; UASmCD8-GFP, referred to as II NB-GAL4 hereafter). Then, we quantified the number of type II NBs in each brain hemisphere (in wildtype, type II NBs can be labeled with Dpn and GFP, but not with Ase) at the third instar larval stage. We found that knocking spen down resulted in a greater number of type II NBs compared to control (Figure 1A-B). Increased numbers of type II NBs were also observed in additional spen RNAi lines (Figure1A-B). Among these strains, the THU0750 strain was selected for the subsequent experiments. Simultaneously, we employed a different type II NB-GAL4 (pnt-GAL4, UAS-mCD8-GFP; UAS-Dicer2, hereafter referred to as Pnt-GAL4) for spen knockdown and also found an increase in the number of type II NBs (Figure 1C). To rule out the possibility of off-target effects of RNAi, we performed a rescue experiment by overexpressing spen in a background where spen was knocked down. We found that knockdown of spen followed by overexpression of spen can reduce the increased number in type II NBs induced by spen knockdown (9.6 NBs compared to 11.6 NBs) (Figure1 D-E). These results demonstrate that the phenotype of type II NBs number increase is indeed caused by spen knockdown.
To investigate whether this phenotype was specific to type II NBs, we utilized additional GAL4 drivers to knock down spen in other tissues. There was no obvious alteration in type I NBs number when spen was knocked down by Ase-GAL4 (Figure 1F). Furthermore, knocking spen down in neurons by Elav-GAL4 or glial cells by Repo-GAL4 (Repo-GAL4; UAS mCD8-GFP, referred to as Repo-GAL4) did not cause any obvious phenotype (Figure 1G-H). These results suggest that knockdown of spen increases the number of type II NBs specifically.
Finally, we investigated the time period during which spen exerts its effects. By quantifying the number of type II NBs at 48 hours after larval hatching (ALH), we found that there was no difference in the number of type II NBs when spen knockdown at ALH48h compared to control (Figure 1I-J). It demonstrates that spen plays a role at the late larval stage and thereafter. These experimental results reveal that knockdown of spen specifically increases the number of type II NBs at the late stage of second instar larva and thereafter.
3.2. Spen Prevents Type II NBs Number Increase Excessively by Inhibiting the Dedifferentiation of ImINPs
To explore the causes of type II NBs number increase, we firstly detected the asymmetric divisions. Disruption of asymmetric division can impact the self-renewal capacity of type II NBs, thereby altering their overall numbers [42]. Proper orientation of cell fate determinants is essential during asymmetric division. The Par complex, which includes components such as aPKC, localizes to the apical cortex of NBs and is ultimately distributed to the larger daughter cell, forming a new NB. Conversely, factors like Miranda (Mira) localize to the basal cortex and are allocated to smaller progeny cells [1,43,44]. So, we detected the location of Mira and aPKC in the metaphase with spen knockdown. We observed that aPKC was retained apically within the NBs, while Mira was localized at the basal cortex of the NBs, adjacent to the newly generated INPs (FigureS1A-B). Consequently, these results suggest that spen knockdown does not result in asymmetric division defects.
The newly generated INPs are initially immature and must prevent dedifferentiation into NBs to undergo correct differentiation into mature INPs, thereby ensuring proper brain development [16,45]. Thus, dedifferentiation of imINPs may contribute to the overproduction of type II NBs. Both imINP and type II NBs express pntp1, while Dpn is only expressed in type II NBs [45,46]. We found an increase in Dpn+ pntp1+ type II NBs, while imINPs (Dpn-, pntp1+) number were reduced (Figure 2A-C) with spen knockdown. These results indicate that the knockdown of spen leads to a decrease in imINP and an increase in type II NBs. To further confirm that the spen knockdown leads to the dedifferentiation of imINP into NBs, we knocked down spen in imINP using the imINP-specific GAL4 (9D10) driver, and we observed that knockdown of spen in imINPs results in an increase in type II NBs (Dpn+Ase-) numbers (Figure 2D-E). Furthermore, to confirm the specific role of spen in imINPs, we knocked down spen using the 9D11-GAL4 (mature INPs, mINPs) driver, and found no difference in the number of type II NBs (Figure2F-G). We conclude that spen maintains the normal cell fate of imINPs, preventing their dedifferentiation into type II NBs.
3.3. SPEN Represses Notch Signaling Pathway to Prevent Overproduction of Type II NBs
Type II NBs are more sensitive to the Notch pathway [6], and activation of the Notch signaling pathway leads to an excessive number of type II NBs [19,20,21,22]. In addition, we found that the timing of the effects following the abnormal activation of Notch is nearly consistent with the timing of spen knockdown (Figure 1I-J). Therefore, we wanted to know whether the maintenance of type II NBs by spen was associated with Notch signaling. Firstly, we measured the expression level of downstream genes -Notch activity reporter E(spl)mγ-GFP [47] after spen knockdown. We found an increase in E(spl)mγ-GFP content in a single type II NB (Figure 3A-B). Next, we performed a double knockdown of spen and Notch in type II NBs. This resulted in a rescue of the type II NBs number compared to spen knockdown alone (Figure 3C-D). The above experimental results indicate that spen affects the development of type II NBs through repressing the Notch signaling pathway.
Previous studies have indicated that the knockdown of Pnt or the overexpression of related Notch suppressors such as brat can inhibit the reversion of immature INPs to NBs [22,45,48]. To further investigate the mechanism underlying spen-mediated notch signaling in dedifferentiation of imINPs, we first evaluated the levels of PNT by pnt-LacZ under spen knockdown. Following spen knockdown, the LacZ level detected in each type II NB showed no significant difference (Figure s1C-D), suggesting that spen deficiency did not alter pnt expression in individual type II NBs. Ectopic expression of erm, which is a downstream gene regulated by the Notch signaling pathway, can lead to the conversion of type II NBs into type I-like NBs and can also promote the termination of self-renewal in type II NBs [48]. So, we overexpressed erm to assess whether they could counteract the increased number of type II NBs following spen knockdown. We found that after overexpressing erm in the context of spen knockdown, the number of type II NBs remained approximately 13 (Figure s1E-F). Conversely, when we overexpressed brat with spen knockdown, the number of type II NBs decreased significantly (Figure S1G-H). Together, these results indicate that the dedifferentiation of imINP caused by the knockdown of spen can be inhibited by brat.
3.4. Spen Inhibits Notch Signaling by Suppressing the Nuclear Level of NICD
We aimed to investigate the mechanism by which spen represses the Notch signaling pathway, so we measured the level of Notch. Upon spen knockdown, we observed a marked increase in nuclear NICD level in type II NBs (Figure 4A-B). However, the level of Notch extracellular domain (NECD) remained unchanged in type II NBs after knocking spen down (Figure 4C-D). These results suggest that the content of total Notch level remains unchanged, while nuclear NICD level increases.
It had been reported that Brat could also suppress the nuclear translocation of NICD [49]. In addition, our previous experimental results indicated that the overexpression of brat can rescue the increase of type II NBs caused by the knockdown of spen (Figure S1G-H). To further confirm whether the elevated nuclear NICD levels are solely due to the spen or the result of the combined action of spen and Brat, we overexpressed brat in the context of spen knockdown and measured the nuclear NICD level in an individual type II NB. No significant difference in nuclear NICD level was observed (Figure 4E-F). The Notch inhibitor BRAT can enter into imINPs from type II NBs through asymmetric division, where it suppresses the expression of downstream genes of the Notch signaling pathway, thereby preventing the dedifferentiation of imINPs [45,50]. These results show that in the context of imINPs dedifferentiation regulated by spen, brat may also exert its effects by downregulating the expression of Notch-related genes, rather than inhibiting the increased level of nuclear NICD induced by spen.
3.5. Hairless Promotes the Phenotype Caused by Spen in Type II NBs
Hairless is a classic gene that functions as a transcriptional inhibitor within the Notch signaling pathway in Drosophila [51,52]. It interacts with the CSL protein-su(H) to inhibit the Notch signaling pathway, similar to the function of Sharp in mammals [26,27]. Yet, it has been reported that spen may not be a functional homolog of mammalian sharp [53]. However, our experimental results suggest that spen may serve a similar role as sharp in type II NBs to inhibit the Notch signaling pathway. Therefore, to further investigate the function of spen, we knocked the sharp functional homolog, Hairless down alone or together with spen. We observed a modest increase in the number of type II NBs upon knockdown of Hairless alone (Figure 5A-B). The effects of Hairless knockdown varied across different strains, which was consistent with the fact that Hairless functions in a dose-dependent manner [27]. However, a more pronounced emergence of ectopic type II NBs was noted when both spen and Hairless were simultaneously knocked down (Figure 5C-D). This indicates that both spen and Hairless can prevent the excessive type II NBs collectively. Furthermore, since more type II NBs were observed following the knockdown of spen compared to the knockdown of Hairless alone, it appears that spen plays a more critical role in this maintenance function than Hairless.
To further confirm that spen and Hairless exert similar functions in the collective maintenance of type II NBs, we knocked Ctbp down in type II NBs alone and conducted a double knockdown experiment of Ctbp and spen simultaneously. Ctbp had been reported as another global repressor of Notch signaling pathway and recruited by Hairless in Drosophila or by SHARP in mammal [24,27]. We found that knockdown of Ctbp alone did not affect the number of type II NBs, and the double knockdown of spen and Ctbp did not exacerbate the phenotype induced by the knockdown of spen alone (Figure S2A-D). It suggests that in the Drosophila type II NBs lineage, spen may play a similar role to Hairless not to Ctbp.
Currently, although several co-repressors are known, the relationships between different co-repressors remain unclear: is there a tissue-specific differential involvement in their function? Our experimental results suggest that spen may serve as an alternative co-repressor of the Notch signaling pathway in type II NBs. However, we seeked to further understand the differences between spen and Hairless as co-repressors, we knocked Hairless down of in imINP and found that knockdown of Hairless in imINP do not affect the number of type II NBs as spen did (Figure 5E-F, Figure 2D-E). Next, we utilized their respective Gal4 lines (Hairless-GAL4 and SPEN-GAL4) to investigate the expression patterns and cellular localization of spen and Hairless in different spatial contexts. We found that spen was expressed in both type II NBs and their progeny, although its expression in type II NBs appeared to be lower than in the progenitor cells (Figure 5G). While, the expression of Hairless appeared to be consistent in both type II NBs and their progenies (Figure 5H). Based on the above results, we concluded that spen may play roles both in type II NBs and imINPs, whereas Hairless only exert functions in type II NBs.
3.6. The EGFR Signaling Pathway Participates the Spen-Mediated Maintenance of Type II NBs
Previous research suggests that the Wnt signaling pathway (Wnt) and the EGFR signaling pathway may influence tissue development through the involvement of spen [37,54,55,56], so we wondered whether other pathways play roles in spen-mediated maintenance of type II NBs. We found that the knockdown of Arm, a core component of the Drosophila Wnt signaling pathway and homolog of β-catenin, failed to mitigate the effects in spen knockdown background (Figure S2E). Reducing the activity of the EGFR pathway could partially decreased the type II NBs number in spen knockdown background (Figure 6A-B). However, direct knockdown of Egfr in type II NBs or expression of a constitutive active form of Egfr does not affect the type II NBs (Figure 6C-D). The above results demonstrate that the EGFR signaling pathway is involved in the spen-mediated maintenance of type II NBs, rather than independently regulating type II NBs during the third larval stage.
4. Discussion
Different neural stem cells produce varying numbers of progeny cells to maintain normal brain development, making it crucial to investigate the factors that regulate the development of distinct neural stem cell populations. Given that the progeny production pattern of Drosophila type II NBs is similar to that of higher mammals, investigating new factors involved in maintaining Drosophila type II NBs could provide insights for future studies on the maintenance of neural stem cells in higher mammals. Although factors regulating different NBs in Drosophila have been reported, it remains unclear whether there are additional and important factors yet to be discovered. In this article, we found that spen knockdown leads to an increase in the number of type II NBs by inhibiting the NotchNICD level to prevent the dedifferentiation of imINP (Figure 7). This phenotype specifically occurs in type II NBs, and is not present in type I NBs, neurons, or glial cells. Although spen has been investigated in various Drosophila tissues, including the eyes, intestinal stem cells, and glial cells [14,30,32], its specific function in Drosophila NBs has remained unclear. Our study provides additional insights into the role of spen in the maintenance of type II NBs.
In Drosophila, Hairless is known as a co-repressor of the Notch signaling pathway, recruiting factors such as CtBP to collectively inhibit Notch signaling [27,57]. However, in mammals, there is no homolog of Hairless, and thus this process is carried out by the Drosophila spen homolog, sharp [24,53]. Some studies have suggested that Drosophila spen may not functionally correspond to mammalian sharp [53]. Our experimental results indicate that the concomitant knockdown of spen and Hairless results in a greater increase of type II NBs compared to the individual knockdown of either spen or Hairless. Furthermore, the phenotype resulting from the knockdown of spen is noticeably more pronounced than that from the knockdown of Hairless, suggesting that spen may play a more critical role than Hairless. Based on our findings regarding the mechanism by which spen inhibits Notch signaling, we propose that spen and Hairless may function together as co-repressors. While the binding of mammalian SHARP to RBP-J has been reported, the interaction of spen as a co-repressor with the Drosophila RBP-J homolog su(H) also requires investigation. This will be the focus of our future work, as we aim to provide more definitive evidence for the existence of two distinct co-repressors in Drosophila type II NBs. The presence of these two different co-repressors within the same lineage raises questions about their functional roles—possibly exerting different effects in distinct cell types? Our research indicates that the knockdown of spen in type II NBs or imINPs leads to a specific increase in type II NBs, while Hairless appears to function solely within type II NBs. This phenotype may be due to that spen and Hairless regulate distinct Notch downstream target genes, which is another avenue for our future exploration. In addition, it will be an intriguing area of future research to investigate when HAIRLESS begins to disappear in various species and how its function is gradually replaced by SHARP.
spen has been reported to influence diseases by modulating signaling pathways. For instance, spen can regulate nasopharyngeal carcinoma (NPC) by maintaining the levels of PI3K/AKT and c-JUN [40]. And in Drosophila tissues, different signaling pathways often work together to regulate development. Our study shows that during the third instar larval stage, not only is the Notch signaling pathway crucial for the development of type II NBs, but the Egfr signaling pathway also plays a role in maintaining the number of NBs. This effect is mediated exclusively by SPEN. Studying the regulation of type II NBs development by different signaling pathways is crucial for maintaining the number of type II NBs. However, the mechanisms by which these two signaling pathways collaboratively regulate each other remain unclear. In the future, we will pursue this as our research objective, aiming to target spen in order to specifically modulate the interactions between different signaling pathways, with the goal of addressing related diseases.
Supplementary Materials
The following supporting information can be downloaded at the website of this paper posted on Preprints.org.
Author Contributions
Conceptualization, Q.Z., F.Z., M.R and S.W.; methodology, Q.Z., F.Z., S.G., S.Z., W.G., M.R and S.W.; formal analysis, Q.Z., F.Z. and S.W.; writing—original draft preparation, Q.Z.; writing—review and editing, Q.Z.,M.R and S.W.; performing experiments: Q.Z. and F.Z.; funding acquisition, M.R and S.W. All authors have read and agreed to the published version of the manuscript.
Funding
The National Natural Science Foundation of China (52033002).
Institutional Review Board Statement
Not applicable.
Informed Consent Statement
Not applicable.
Data Availability Statement
Not applicable.
Acknowledgments
We would like to thank Tsing Hua Fly Center, Vienna Drosophila Resource Center (VDRC) Bloomington Drosophila Stock Center (BDSC), and Drs. Lihua Jin and Drs.Yan Song for the provision of essential Drosophila strains.
Conflicts of Interest
The authors declare no conflict of interest.
References
- Homem, C.C. and J.A. Knoblich, Drosophila neuroblasts: a model for stem cell biology. Development, 2012. 139(23): p. 4297-310 .[PubMed].
- El-Danaf, R.N., R. Rajesh and C. Desplan, Temporal regulation of neural diversity in Drosophila and vertebrates. Semin Cell Dev Biol, 2023. 142: p. 13-22.[PubMed].
- Ma, H., et al., MacroH2A1.2 deficiency leads to neural stem cell differentiation defects and autism-like behaviors. EMBO Rep, 2021. 22(7): p. e52150.[PubMed].
- Hakes, A.E. and A.H. Brand, Neural stem cell dynamics: the development of brain tumours. Curr Opin Cell Biol, 2019. 60: p. 131-138.[PubMed].
- Lacin, H. and J.W. Truman, Lineage mapping identifies molecular and architectural similarities between the larval and adult Drosophila central nervous system. Elife, 2016. 5: p. e13399.[PubMed].
- Homem, C.C., M. Repic and J.A. Knoblich, Proliferation control in neural stem and progenitor cells. Nat Rev Neurosci, 2015. 16(11): p. 647-59.[PubMed].
- Dubal, D., et al., Mitochondrial fusion regulates proliferation and differentiation in the type II neuroblast lineage in Drosophila. PLoS Genet, 2022. 18(2): p. e1010055.[PubMed].
- Walsh, K.T. and C.Q. Doe, Drosophila embryonic type II neuroblasts: origin, temporal patterning, and contribution to the adult central complex. Development, 2017. 144(24): p. 4552-4562.[PubMed].
- Alvarez, J.A. and F.J. Diaz-Benjumea, Origin and specification of type II neuroblasts in the Drosophila embryo. Development, 2018. 145(7).[PubMed].
- Kang, K.H. and H. Reichert, Control of neural stem cell self-renewal and differentiation in Drosophila. Cell and Tissue Research, 2015. 359(1): p. 33-45.[PubMed].
- Rethemeier, S., et al., Differences in size and number of embryonic type II neuroblast lineages correlate with divergent timing of central complex development between beetle and fly. eLife, 2025. 13: p. RP99717.[PubMed].
- Viktorin, G., et al., Multipotent neural stem cells generate glial cells of the central complex through transit amplifying intermediate progenitors in Drosophila brain development. Developmental Biology, 2011. 356(2): p. 553-565.[PubMed].
- Izergina, N., et al., Postembryonic development of transit amplifying neuroblast lineages in the Drosophila brain. Neural development, 2009. 4(1): p. 44-44.[PubMed].
- Zhu, S., et al., Ets transcription factor Pointed promotes the generation of intermediate neural progenitors inDrosophila larval brains. Proceedings of the National Academy of Sciences, 2011. 108(51): p. 20615-20620.[PubMed].
- Chen, R., X. Deng and S. Zhu, The Ets protein Pointed P1 represses Asense expression in type II neuroblasts by activating Tailless. PLoS Genet, 2022. 18(1): p. e1009928.[PubMed].
- Chen, R., et al., Homeodomain protein Six4 prevents the generation of supernumerary Drosophila type II neuroblasts and premature differentiation of intermediate neural progenitors. PLOS Genetics, 2021. 17(2): p. e1009371.[PubMed].
- Komori, H., et al., Multilayered gene control drives timely exit from the stem cell state in uncommitted progenitors during Drosophila asymmetric neural stem cell division. Genes Dev, 2018. 32(23-24): p. 1550-1561.[PubMed].
- Zhu, S., et al., The bHLH repressor Deadpan regulates the self-renewal and specification of Drosophila larval neural stem cells independently of Notch. PLoS One, 2012. 7(10): p. e46724.[PubMed].
- Wang, H., et al., Aurora-A acts as a tumor suppressor and regulates self-renewal of Drosophila neuroblasts. Genes Dev, 2006. 20(24): p. 3453-63.[PubMed].
- Zhang, H., et al., Golgi-to-ER retrograde transport prevents premature differentiation of Drosophila type II neuroblasts via Notch-signal-sending daughter cells. iScience, 2024. 27(1): p. 108545.[PubMed].
- San-Juan, B.P. and A. Baonza, The bHLH factor deadpan is a direct target of Notch signaling and regulates neuroblast self-renewal in Drosophila. Dev Biol, 2011. 352(1): p. 70-82.[PubMed].
- Bowman, S.K., et al., The tumor suppressors Brat and Numb regulate transit-amplifying neuroblast lineages in Drosophila. Dev Cell, 2008. 14(4): p. 535-46.[PubMed].
- Shen, W., J. Huang and Y. Wang, Biological Significance of NOTCH Signaling Strength. Front Cell Dev Biol, 2021. 9: p. 652273.[PubMed].
- Bray, S.J., Notch signalling: a simple pathway becomes complex. Nat Rev Mol Cell Biol, 2006. 7(9): p. 678-89.[PubMed].
- Oswald, F., et al., A phospho-dependent mechanism involving NCoR and KMT2D controls a permissive chromatin state at Notch target genes. Nucleic Acids Res, 2016. 44(10): p. 4703-20.[PubMed].
- Oswald, F., et al., SHARP is a novel component of the Notch/RBP-Jkappa signalling pathway. EMBO J, 2002. 21(20): p. 5417-26.[PubMed].
- Borggrefe, T. and F. Oswald, Setting the Stage for Notch: The Drosophila Su(H)-Hairless Repressor Complex. PLoS Biol, 2016. 14(7): p. e1002524.[PubMed].
- Shi, Y., et al., Sharp, an inducible cofactor that integrates nuclear receptor repression and activation. Genes Dev, 2001. 15(9): p. 1140-51.[PubMed].
- Newberry, E.P., T. Latifi and D.A. Towler, The RRM domain of MINT, a novel Msx2 binding protein, recognizes and regulates the rat osteocalcin promoter. Biochemistry, 1999. 38(33): p. 10678-90.[PubMed].
- Ariyoshi, M. and J.W. Schwabe, A conserved structural motif reveals the essential transcriptional repression function of Spen proteins and their role in developmental signaling. Genes Dev, 2003. 17(15): p. 1909-20.[PubMed].
- Sierra, O.L., et al., MINT, the Msx2 interacting nuclear matrix target, enhances Runx2-dependent activation of the osteocalcin fibroblast growth factor response element. J Biol Chem, 2004. 279(31): p. 32913-23.[PubMed].
- Andriatsilavo, M., et al., Spen limits intestinal stem cell self-renewal. PLoS Genet, 2018. 14(11): p. e1007773.[PubMed].
- Carter, A.C., et al., Spen links RNA-mediated endogenous retrovirus silencing and X chromosome inactivation. Elife, 2020. 9.[PubMed].
- McHugh, C.A., et al., The Xist lncRNA interacts directly with SHARP to silence transcription through HDAC3. Nature, 2015. 521(7551): p. 232-6.[PubMed].
- Querenet, M., et al., Spen is required for pigment cell survival during pupal development in Drosophila. Dev Biol, 2015. 402(2): p. 208-15.[PubMed].
- Legare, S., C. Chabot and M. Basik, SPEN, a new player in primary cilia formation and cell migration in breast cancer. Breast Cancer Res, 2017. 19(1): p. 104.[PubMed].
- Chen, F. and I. Rebay, split ends, a new component of the Drosophila EGF receptor pathway, regulates development of midline glial cells. Curr Biol, 2000. 10(15): p. 943-6.[PubMed].
- Hazegh, K.E., et al., An autonomous metabolic role for Spen. PLoS Genet, 2017. 13(6): p. e1006859.[PubMed].
- Jemc, J. and I. Rebay, Characterization of the split ends-like gene spenito reveals functional antagonism between SPOC family members during Drosophila eye development. Genetics, 2006. 173(1): p. 279-86.[PubMed].
- Li, Y., et al., SPEN induces miR-4652-3p to target HIPK2 in nasopharyngeal carcinoma. Cell Death Dis, 2020. 11(7): p. 509.[PubMed].
- Doroquez, D.B., T.L. Orr-Weaver and I. Rebay, Split ends antagonizes the Notch and potentiates the EGFR signaling pathways during Drosophila eye development. Mech Dev, 2007. 124(9-10): p. 792-806.[PubMed].
- Lee, C.Y., K.J. Robinson and C.Q. Doe, Lgl, Pins and aPKC regulate neuroblast self-renewal versus differentiation. Nature, 2006. 439(7076): p. 594-8.[PubMed].
- Atwood, S.X. and K.E. Prehoda, aPKC Phosphorylates Miranda to Polarize Fate Determinants during Neuroblast Asymmetric Cell Division. Current Biology, 2009. 19(9): p. 723-729.[PubMed].
- Li, S., H. Wang and C. Groth, Drosophila neuroblasts as a new model for the study of stem cell self-renewal and tumour formation. Biosci Rep, 2014. 34(4).[PubMed].
- Xie, Y., et al., The Ets protein Pointed prevents both premature differentiation and dedifferentiation of Drosophila intermediate neural progenitors. Development, 2016. 143(17): p. 3109-18.[PubMed].
- Zhang, Y., et al., The Integrator Complex Prevents Dedifferentiation of Intermediate Neural Progenitors back into Neural Stem Cells. Cell Rep, 2019. 27(4): p. 987-996.e3.[PubMed].
- Sood, C., et al., Notch signaling regulates neural stem cell quiescence entry and exit in Drosophila. Development, 2022. 149(4).[PubMed].
- Li, X., R. Chen and S. Zhu, bHLH-O proteins balance the self-renewal and differentiation of Drosophila neural stem cells by regulating Earmuff expression. Developmental Biology, 2017. 431(2): p. 239-251.[PubMed].
- Mukherjee, S., et al., Drosophila Brat and Human Ortholog TRIM3 Maintain Stem Cell Equilibrium and Suppress Brain Tumorigenesis by Attenuating Notch Nuclear Transport. Cancer Res, 2016. 76(8): p. 2443-52.[PubMed].
- Komori, H., et al., Multilayered gene control drives timely exit from the stem cell state in uncommitted progenitors duringDrosophila asymmetric neural stem cell division. Genes & Development, 2018. 32(23-24): p. 1550-1561.[PubMed].
- Artavanis-Tsakonas, S., M.D. Rand and R.J. Lake, Notch signaling: cell fate control and signal integration in development. Science, 1999. 284(5415): p. 770-6.[PubMed].
- Anderson, D.A., et al., RNA-Seq of the Caribbean reef-building coral Orbicella faveolata (Scleractinia-Merulinidae) under bleaching and disease stress expands models of coral innate immunity. PeerJ, 2016. 4: p. e1616.[PubMed].
- Oswald, F., et al., RBP-Jkappa/SHARP recruits CtIP/CtBP corepressors to silence Notch target genes. Mol Cell Biol, 2005. 25(23): p. 10379-90.[PubMed].
- Feng, Y., et al., Drosophila split ends homologue SHARP functions as a positive regulator of Wnt/beta-catenin/T-cell factor signaling in neoplastic transformation. Cancer Res, 2007. 67(2): p. 482-91.[PubMed].
- Kuang, B., et al., split ends encodes large nuclear proteins that regulate neuronal cell fate and axon extension in the Drosophila embryo. Development, 2000. 127(7): p. 1517-29.[PubMed].
- Lin, H.V., et al., Splits ends is a tissue/promoter specific regulator of Wingless signaling. Development, 2003. 130(14): p. 3125-35.[PubMed].
- Morel, V., et al., Transcriptional repression by suppressor of hairless involves the binding of a hairless-dCtBP complex in Drosophila. Curr Biol, 2001. 11(10): p. 789-92.[PubMed].
Figure 1.
spen knockdown leads to an increased number of type II NBs specifically. (A) Utilizing type II NB-GAL4 to knock down different spen RNAi lines consistently resulted in an increase in type II NBs. (A’) showed type II NB lineages which were labeled by GFP, Dpn, and Ase (white arrowhead) in (A). (B) Quantification of type II NBs number in per brain lobe about (A). Mean ± SEM ****P<0.0001. (C) Knocking down spen by Pnt-GAL4 also induced the increase number of type II NBs. (D-E) Overexpression spen in a background where spen was knocked down can partially rescue the number of ectopic type II NBs, and (E) showed quantification of type II NBs number in per brain lobe. Mean ± SEM, *P<0.05. (F-H) Knocking down spen in type I NBs by Ase-GAL4 (F) and in neurons by Elav-GAL4 (G) and in pan-glial cells by Repo-GAL4(H) resulted in no obvious effect on the whole brain size and NBs. (I-J) At ALH48h, the number of type II NBs had no obvious change in spen knockdown and Notch overexpressing flies. (J) Quantification of type II NBs number in per brain lobe from genotypes in (I), Mean ± SEM, ns, non-significant. Mira or Dpn represented NBs in all results. Elav showed neuronal cells in G, and GFP showed the structure of glial cells in H. All brains were obtained from third-instar larvae. Type II NB lineages are labeled by GFP, Dpn.
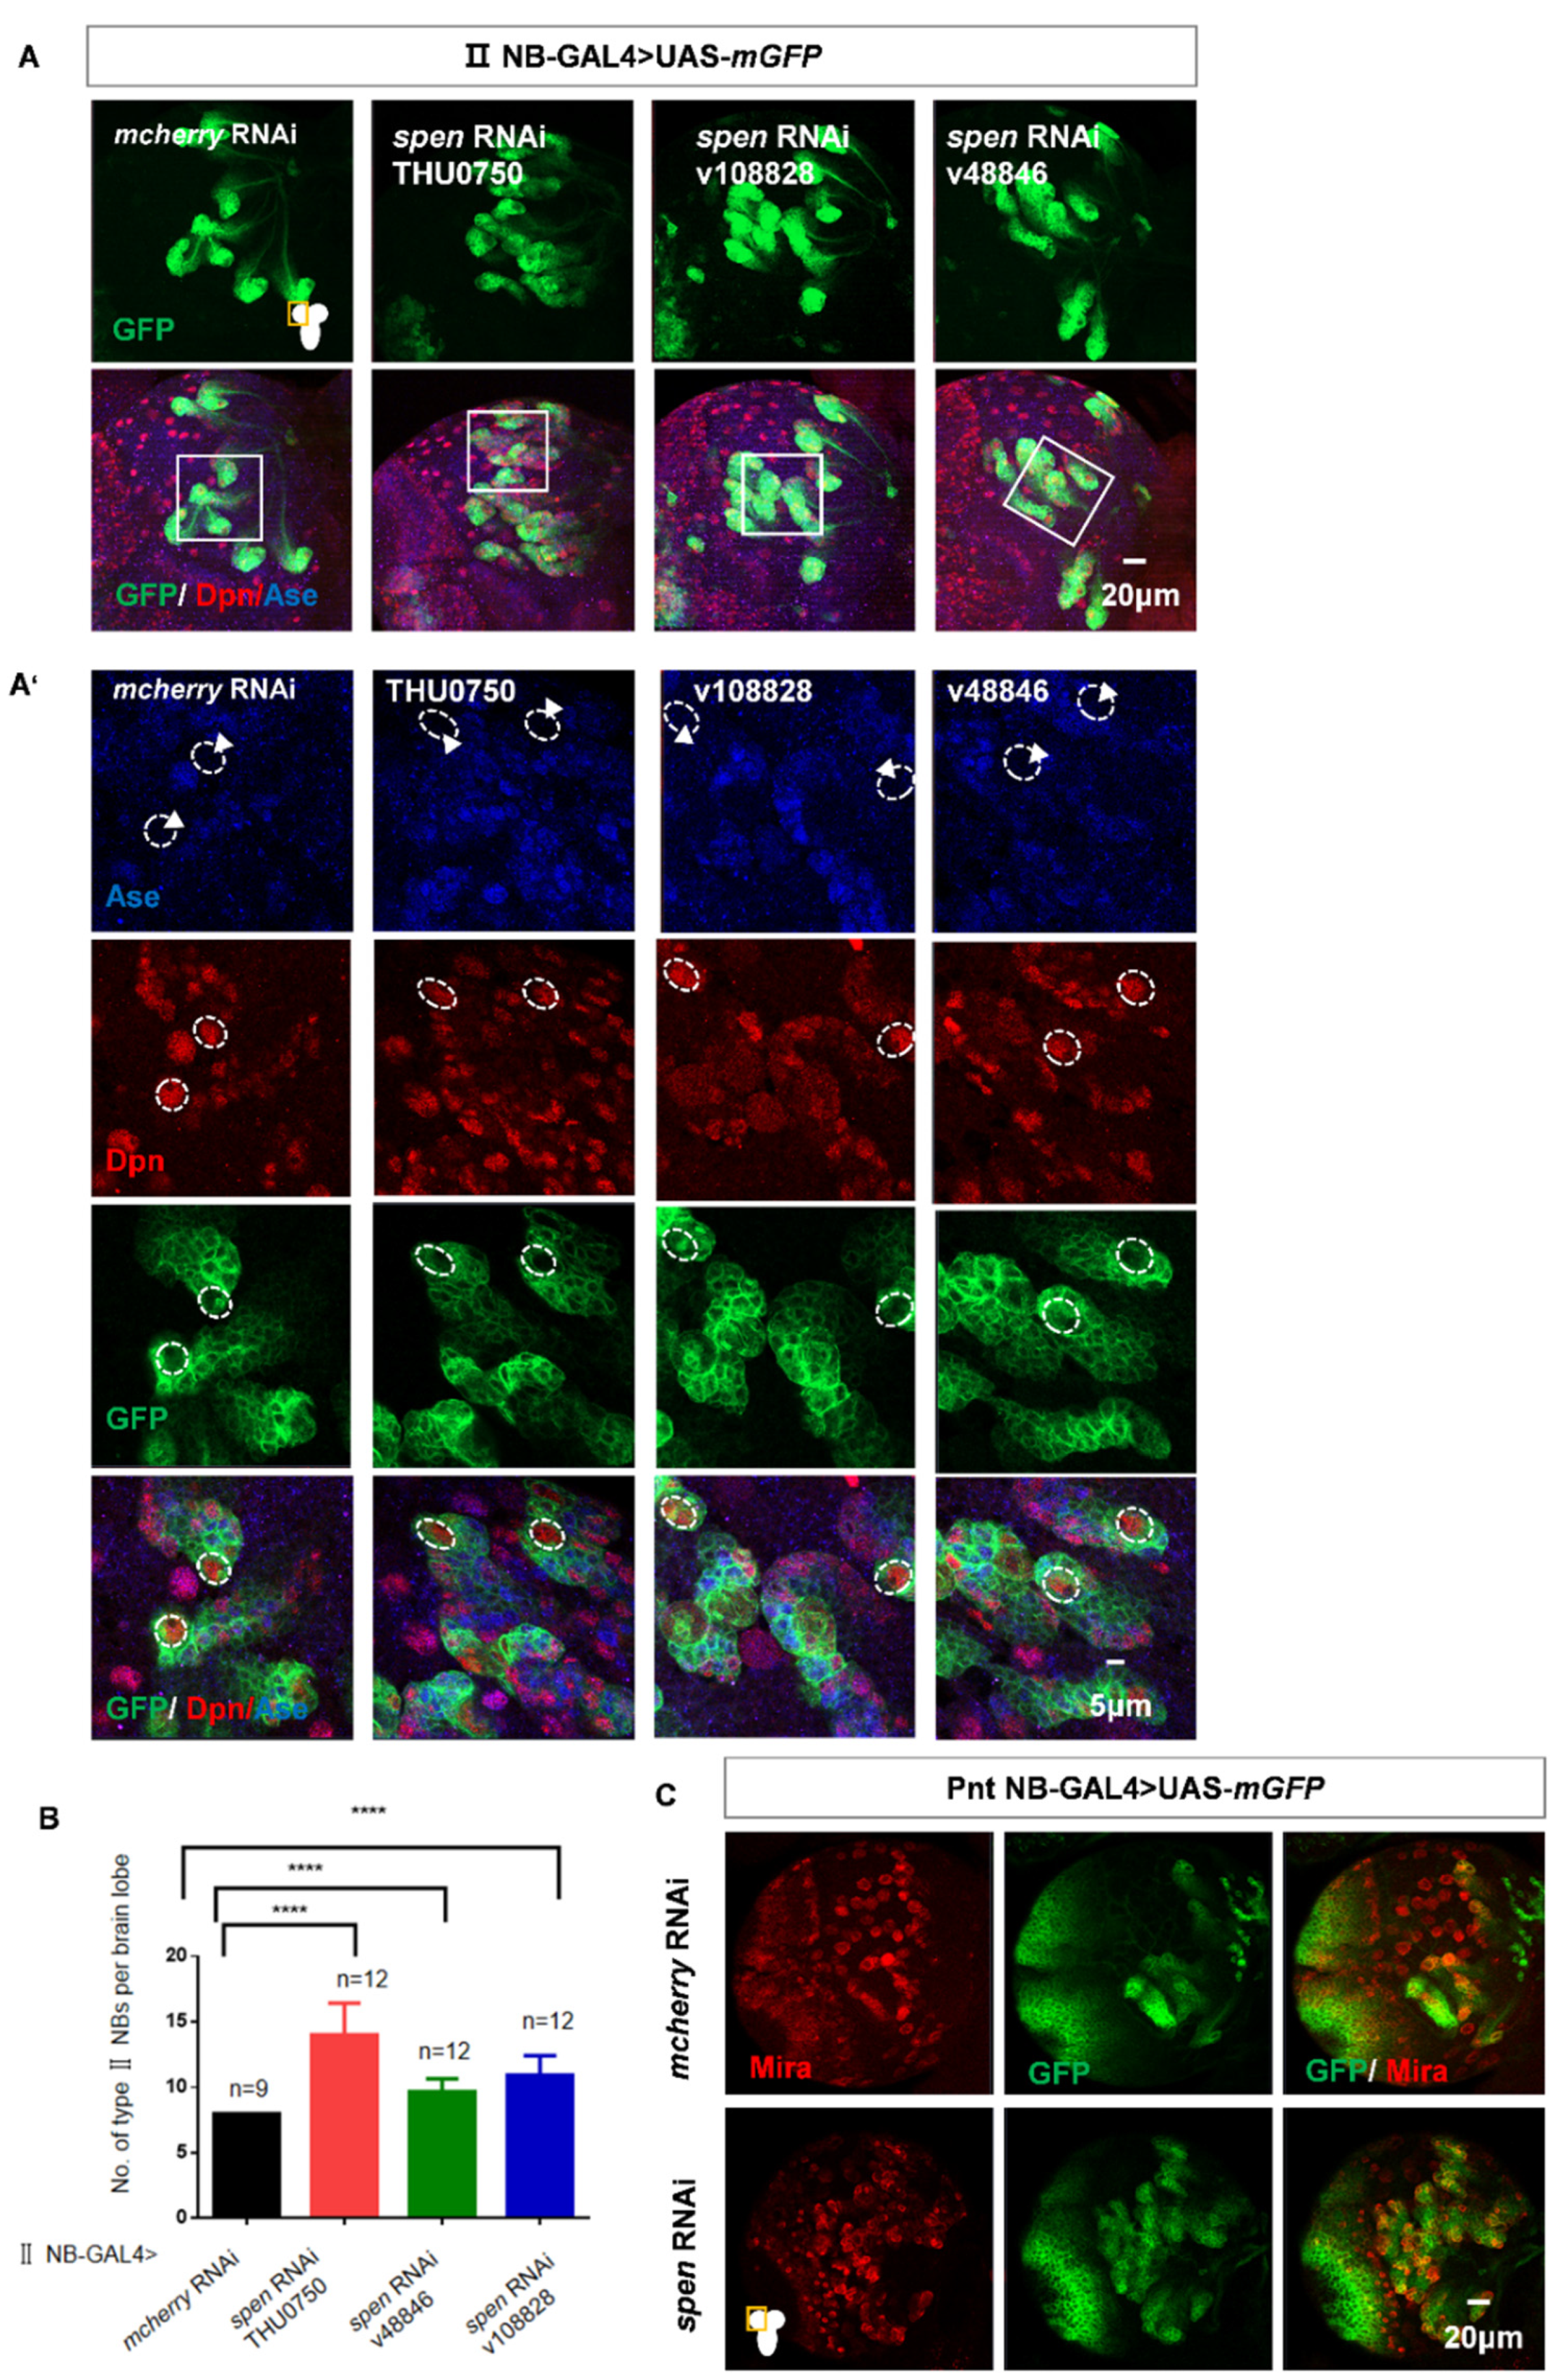
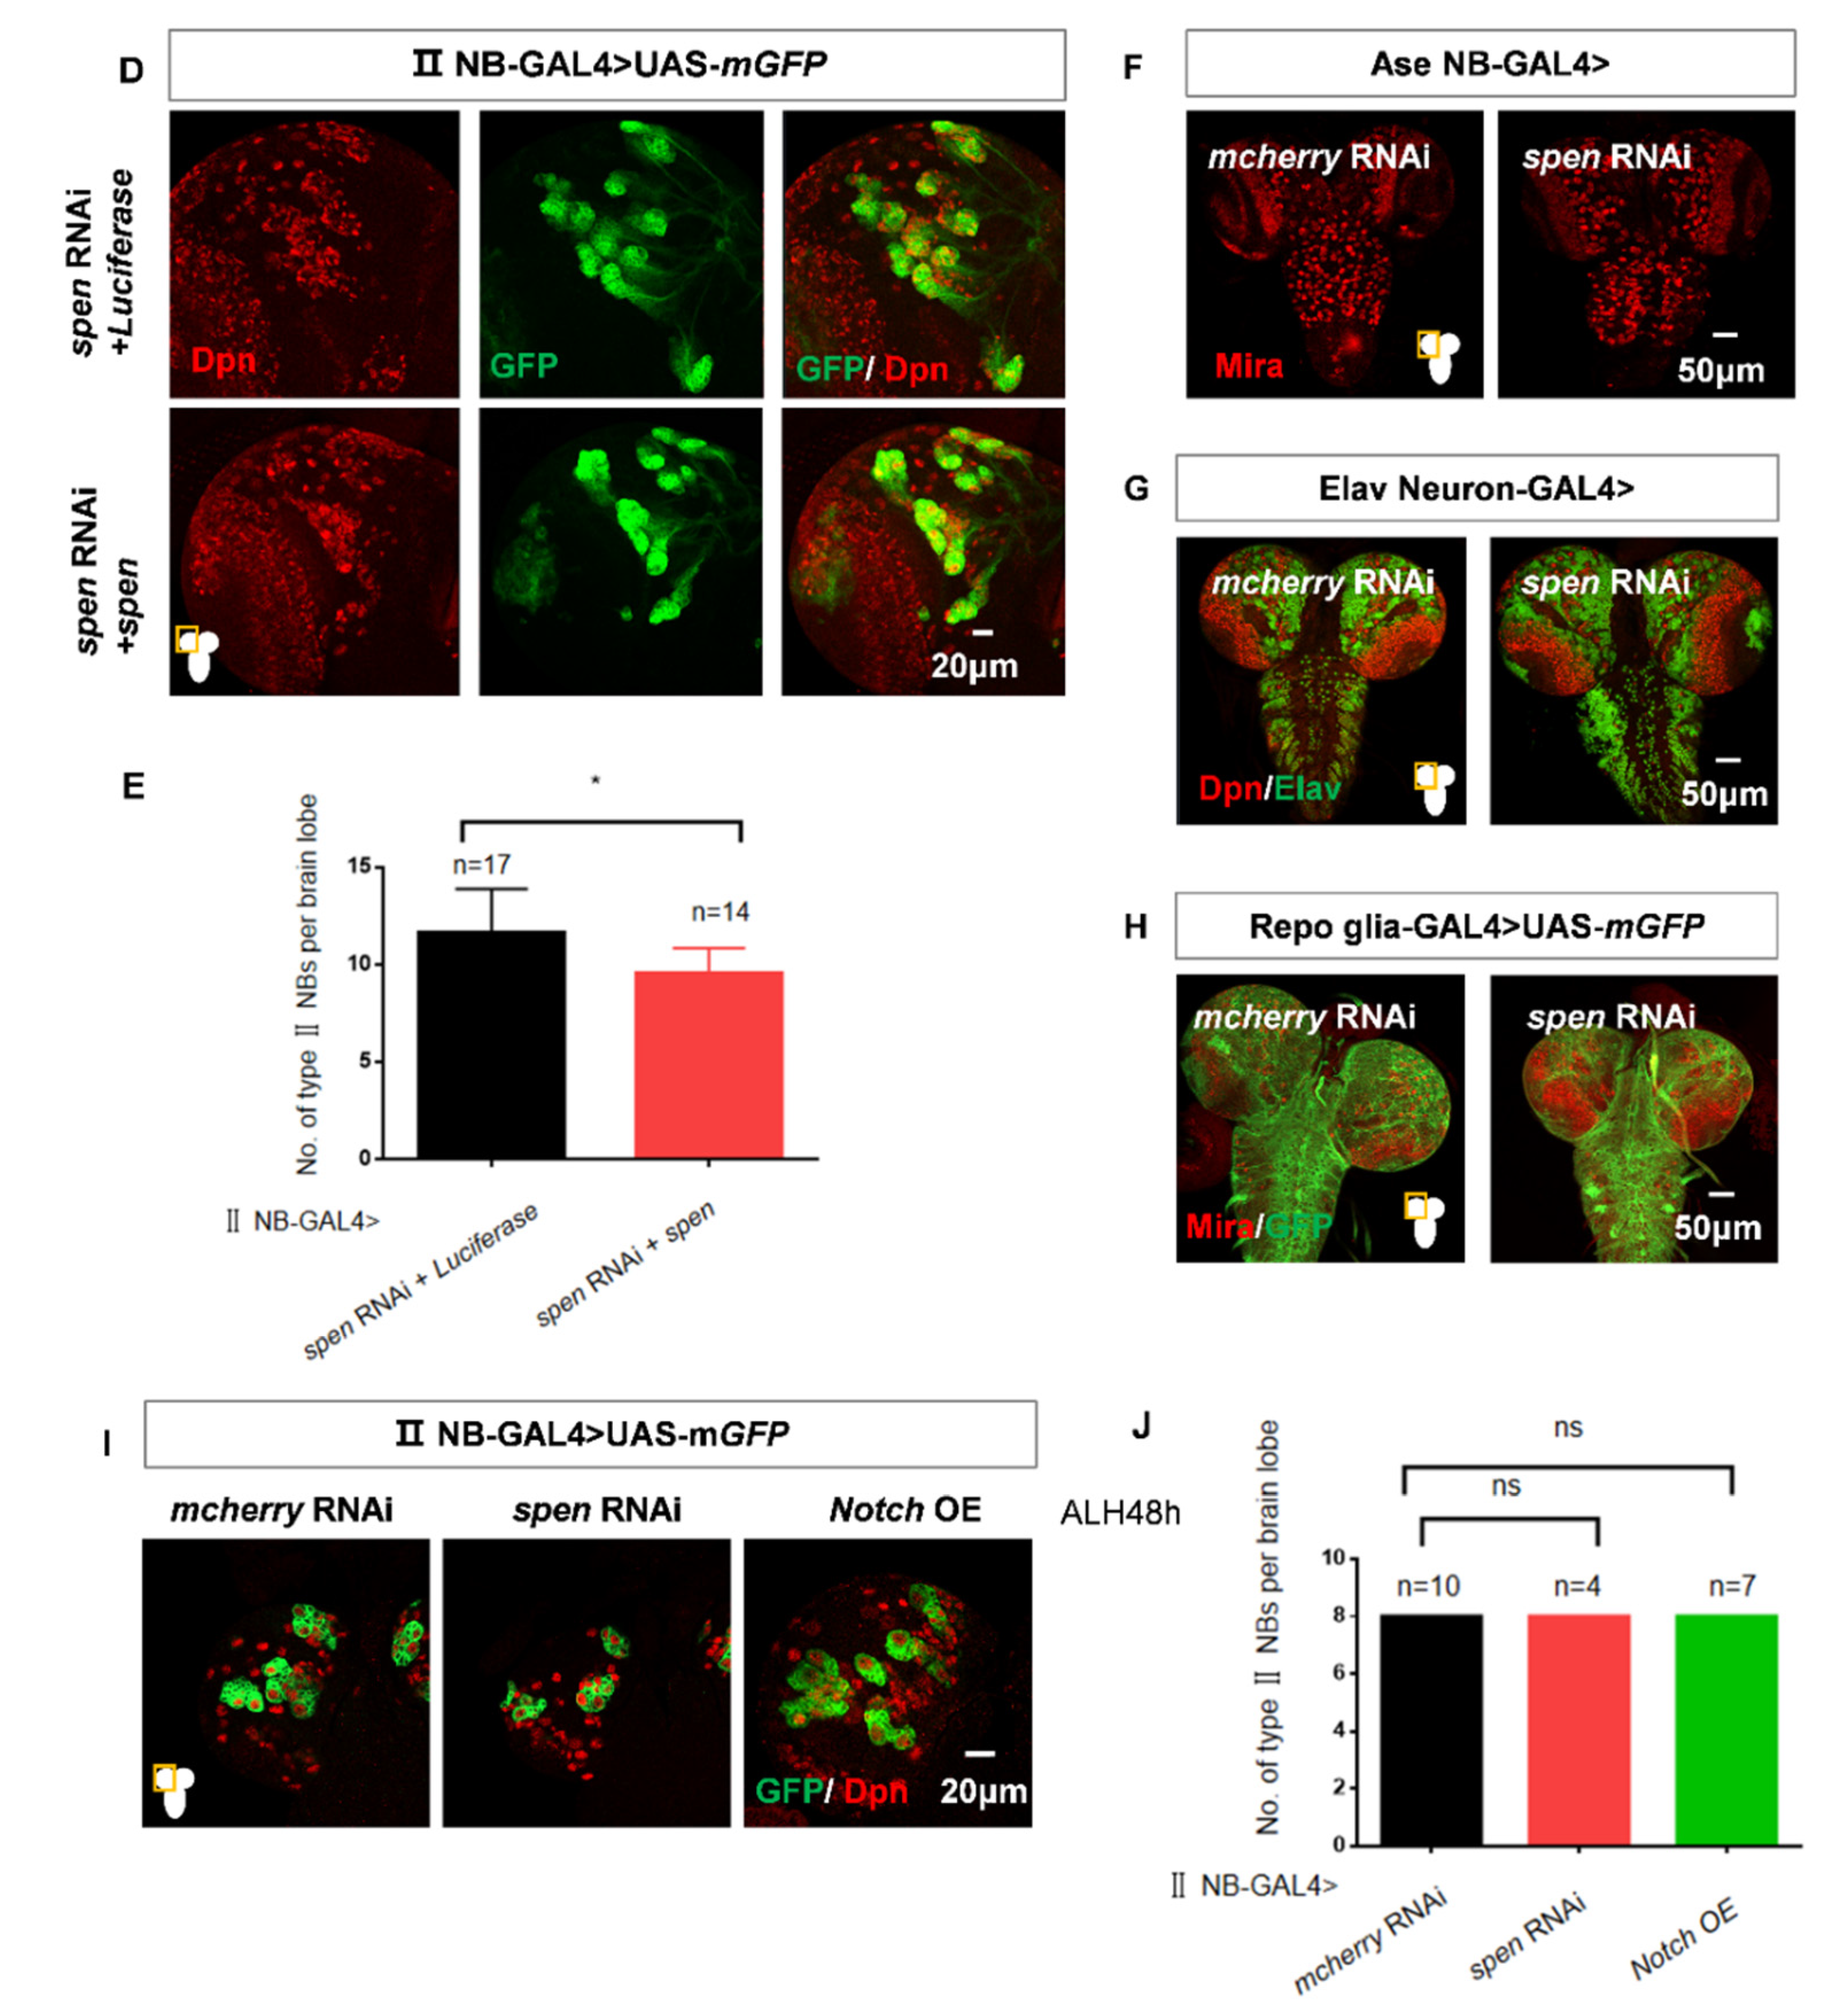
Figure 2.
spen knockdown induces imINP dedifferentiate into type II NBs. (A-C) spen knockdown induced the Dpn+ Pnt+ (NB) cells number increase (white arrowhead) and Dpn+ Pnt- (imINP) cells decrease. (B) Quantification of Dpn+ Pnt+ (NB) cells number per II NB lineage from genotypes in (A). Mean ± SEM, ****P<0.0001. (C) Quantification of Dpn+ Pnt- (imINP) cells number per II NB lineage from genotypes in (A). Mean ± SEM, ****P<0.0001. (D-E) Knocking spen down by 9D10 GAL4 induced the type II NBs number increase. (E) Quantification of type II NBs number (Ase-Dpn+ cells, white arrowhead) per brain lobe was shown in figure (D). Mean ± SEM , ***P<0.001. (F-G) spen defect in mINPs had no effect on the number of NBs. (G) Quantification of NBs number in per brain lobe from genotypes in (F), Mean ± SEM, ns, non-significant. GFP marked type II NBs and their lineages in A. LacZ marked imINPs and their lineages in D.
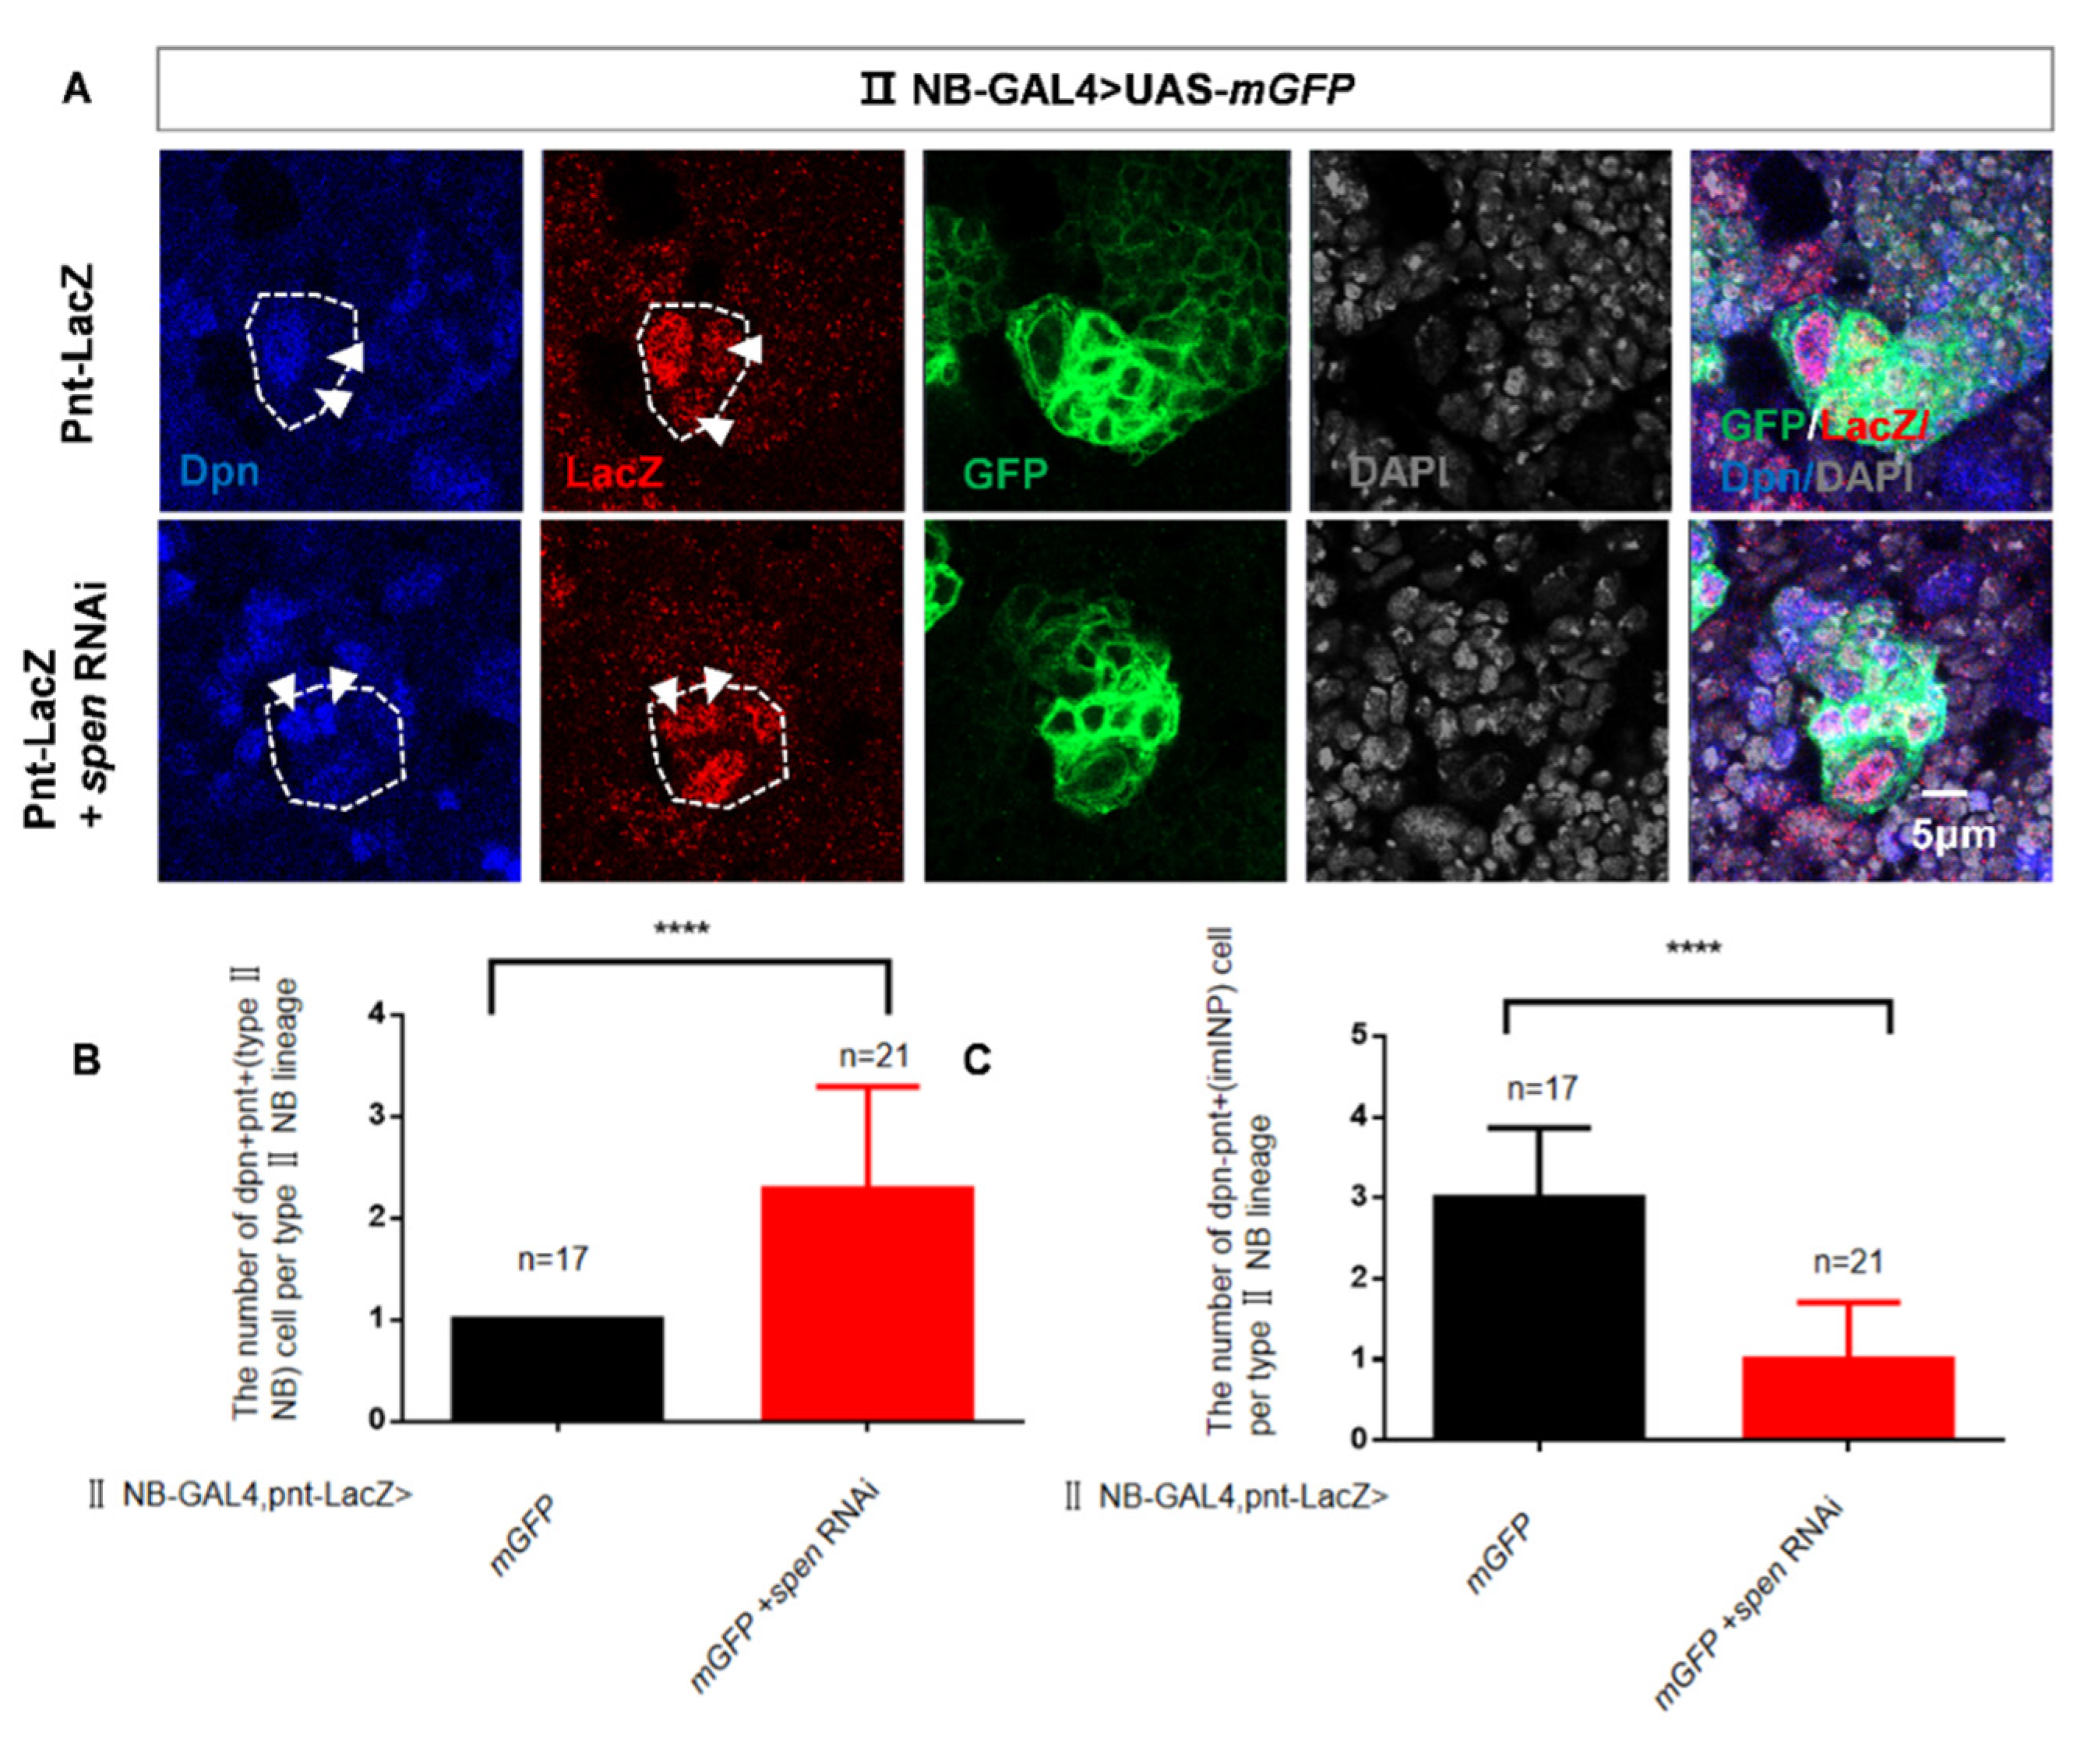
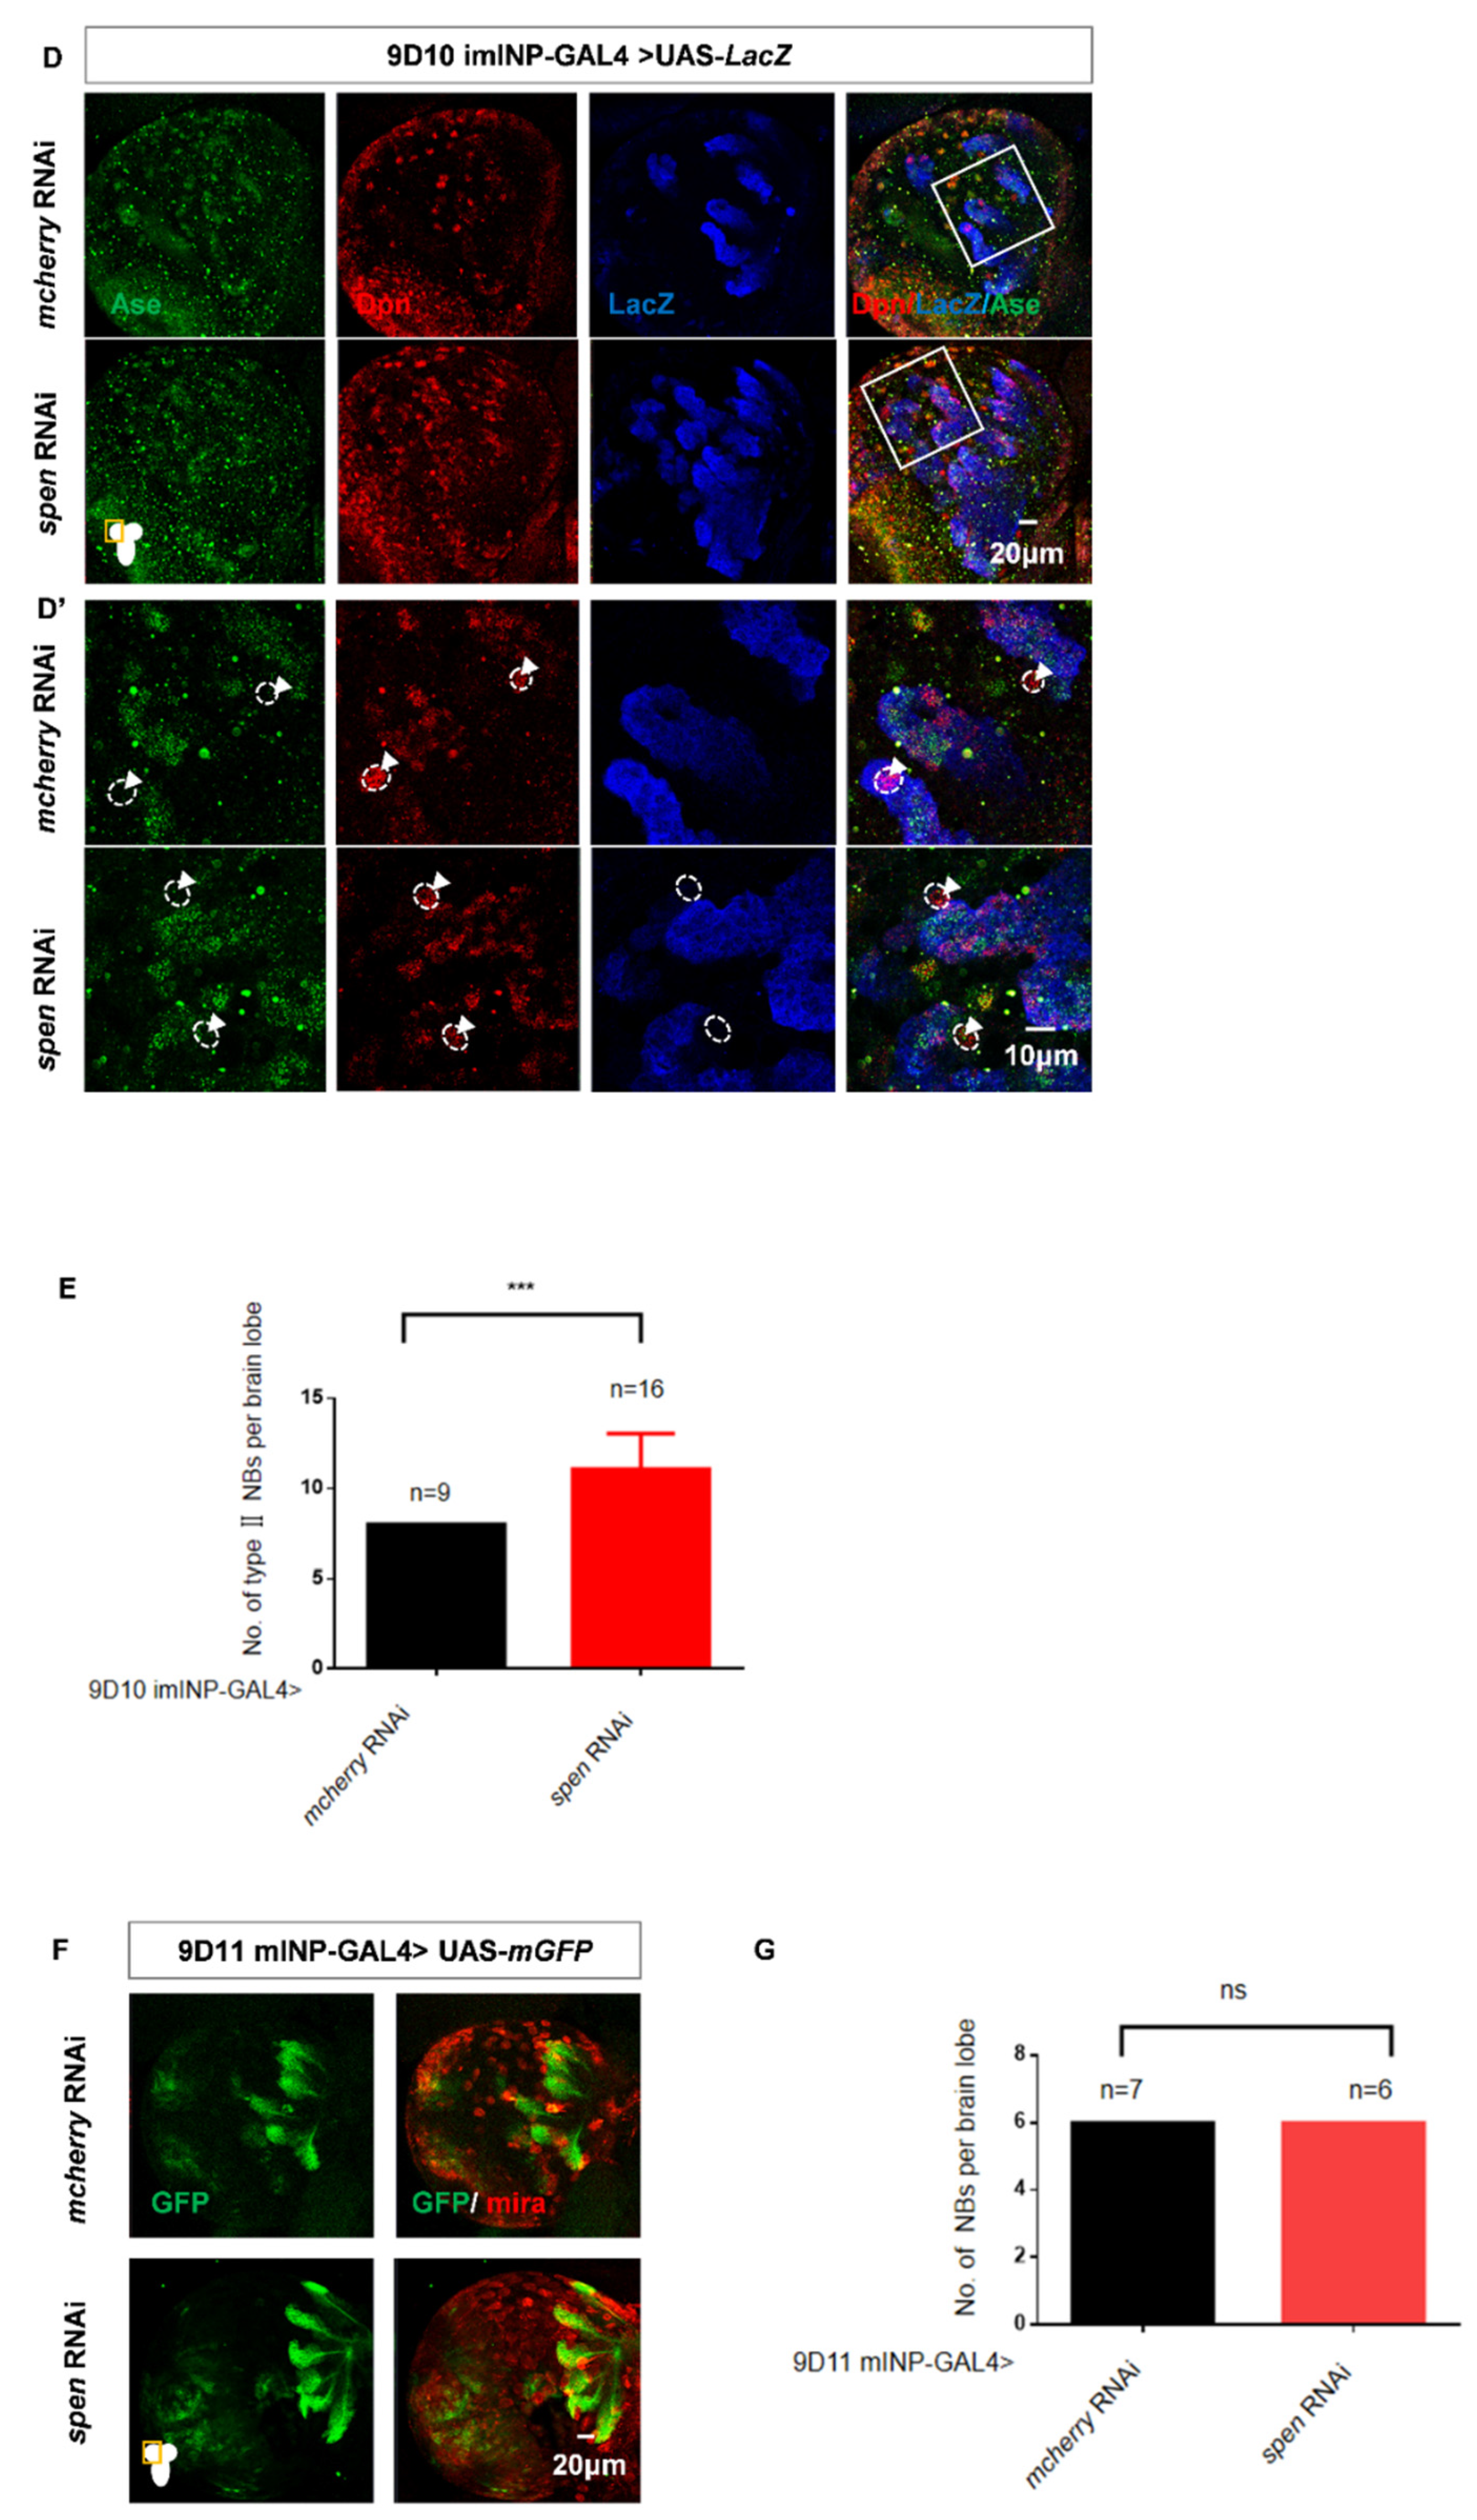
Figure 3.
spen knockdown can activate the Notch signaling pathway. (A-B) The content of E(spl)mα in spen defect brains increased (white arrowhead). (B) Quantification of fluorescence integrated density of E(spl)mα-GFP in a single type II NB from genotypes in (A). ****P<0.0001. (C-D) Double knockdown of spen and notch (B33611) rescued the increasing type II NBs number compared to knockdown of spen and lacZ. (D) Quantification of type II NBs number in per brain lobe from genotypes in (C). Mean ± SEM, ****P<0.0001. GFP marked type II NBs and their lineages in C; Mcherry marked type II NBs in A.
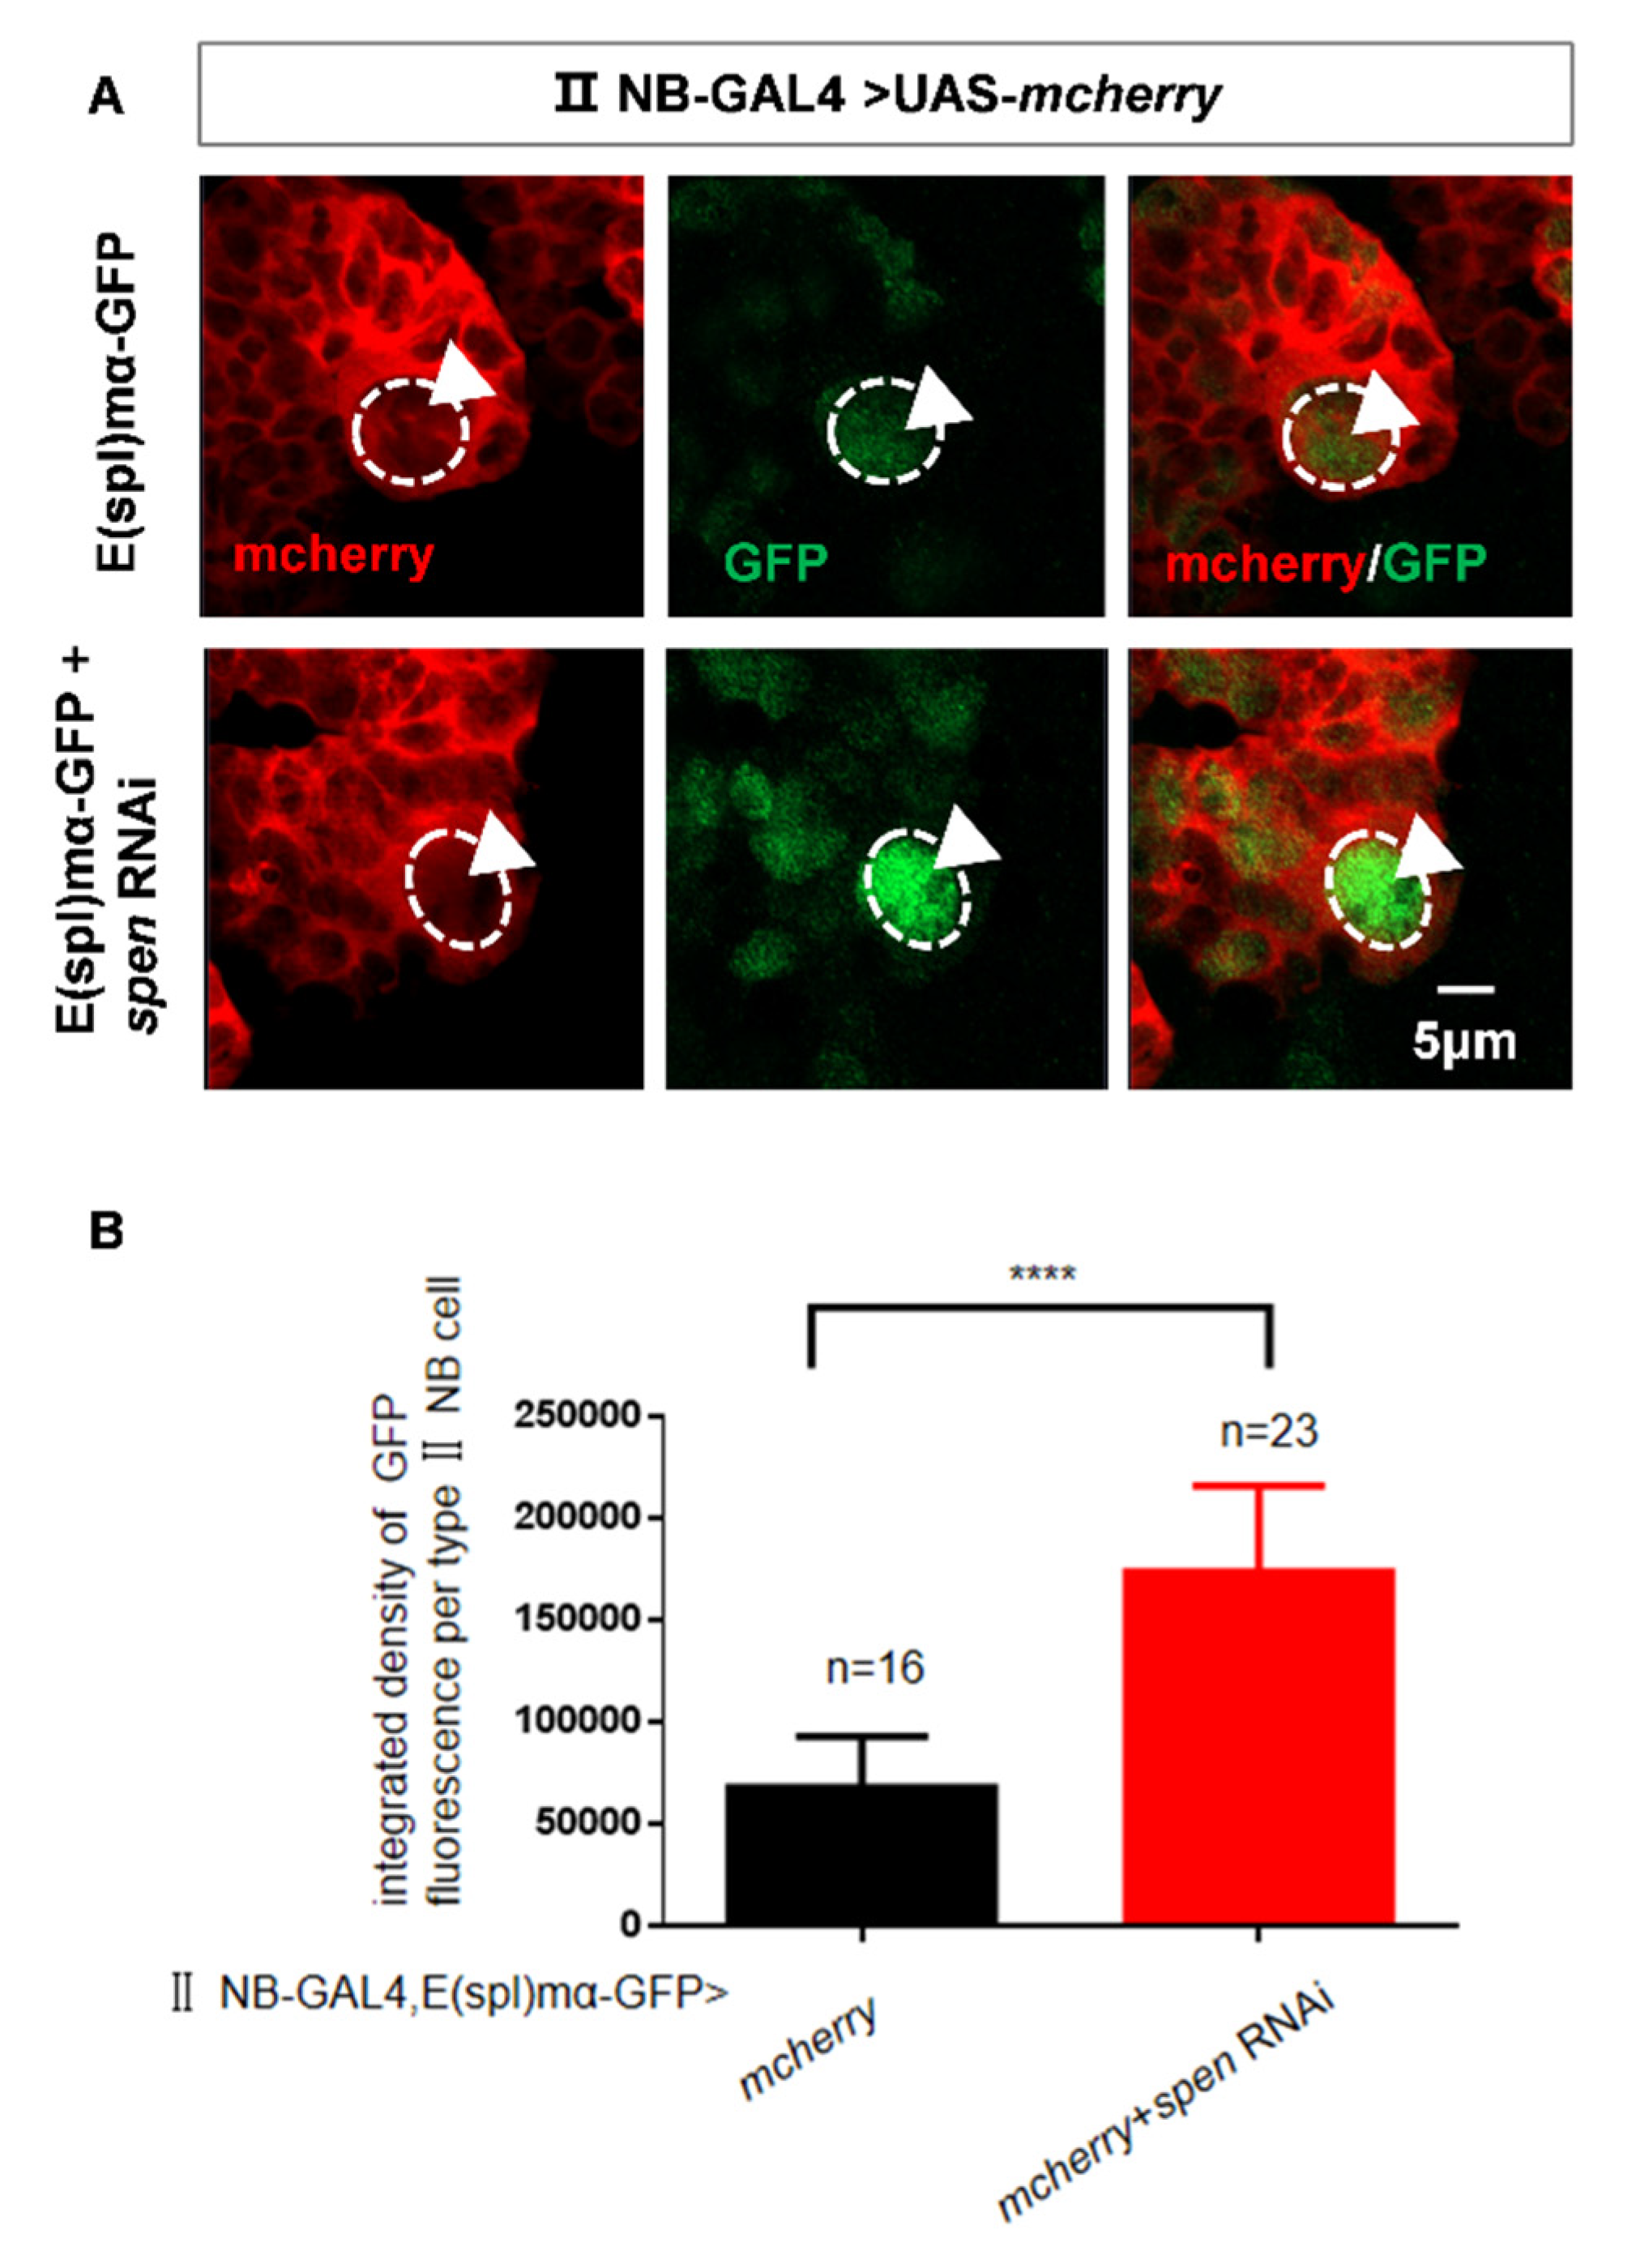
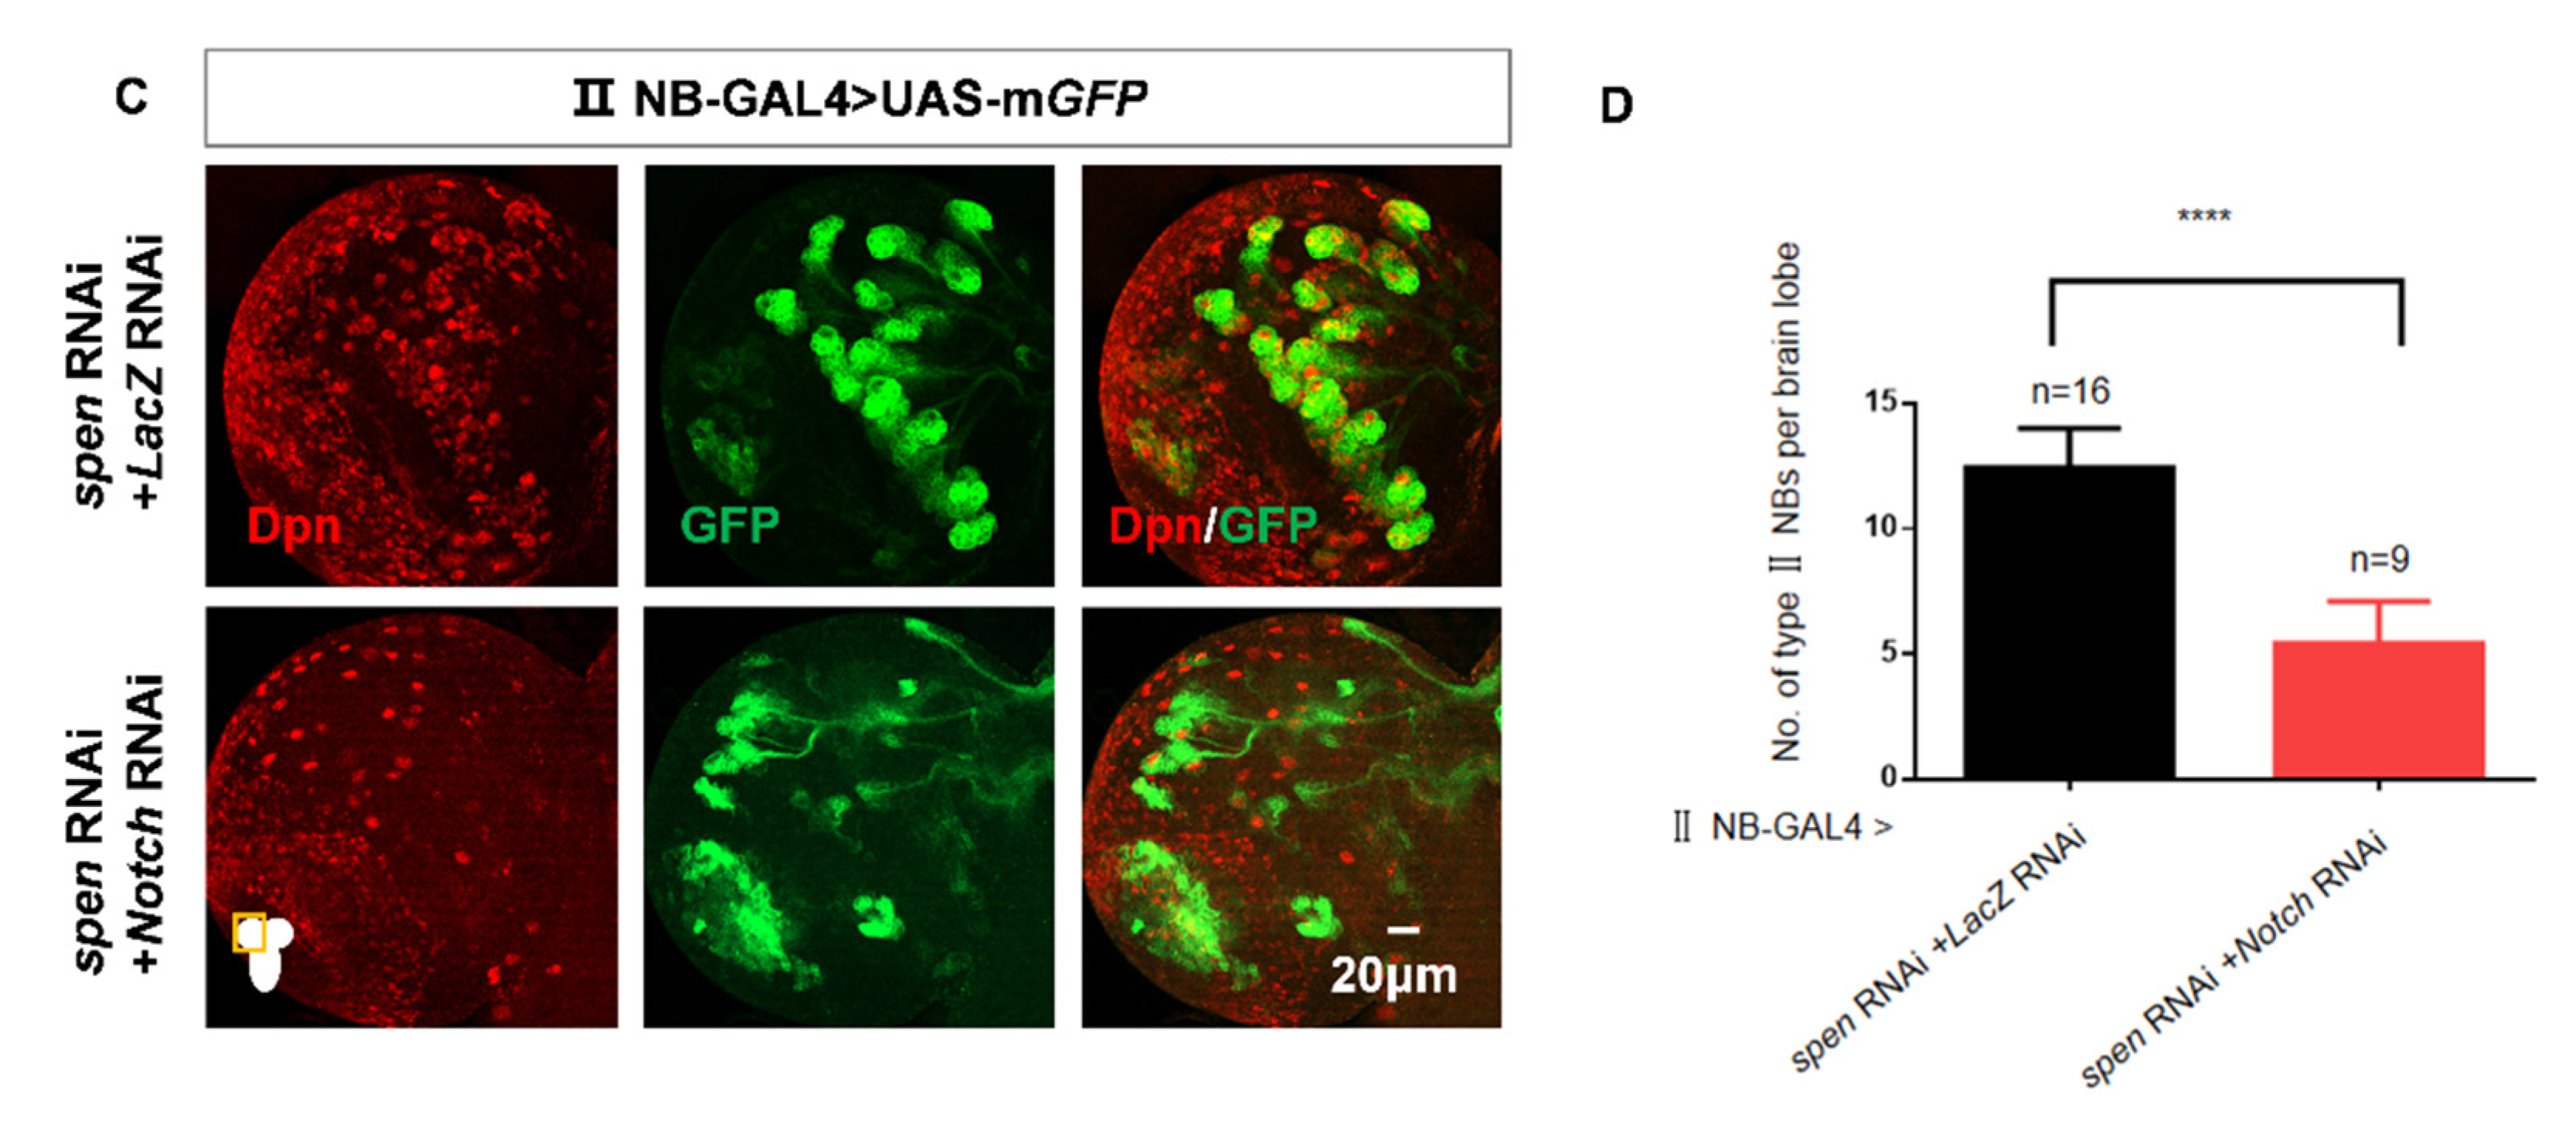
Figure 4.
spen knockdown promotes nuclear NICD level in Drosophila. (A) The fluorescence of NICD increased in spen knockdown brains. (B) Quantification of fluorescence integrated density of NICD in type II NBs in per brain lobe from genotypes in (A). ****P<0.0001. (C-D) The fluorescence of NECD had no difference in spen knockdown brains. (D) Quantification of fluorescence integrated density of NECD in type II NBs in per brain lobe from genotypes in (C), Mean ± SEM, ns, non-significant. (E-F) Brat overexpression in the background of spen knockdown could not downregulate the NICD level compared to control. (F) Quantification of NICD level in per type II NB from genotypes in (E), Mean ± SEM, ns, non-significant. GFP marked type II NBs and their lineages in A, C, and E..
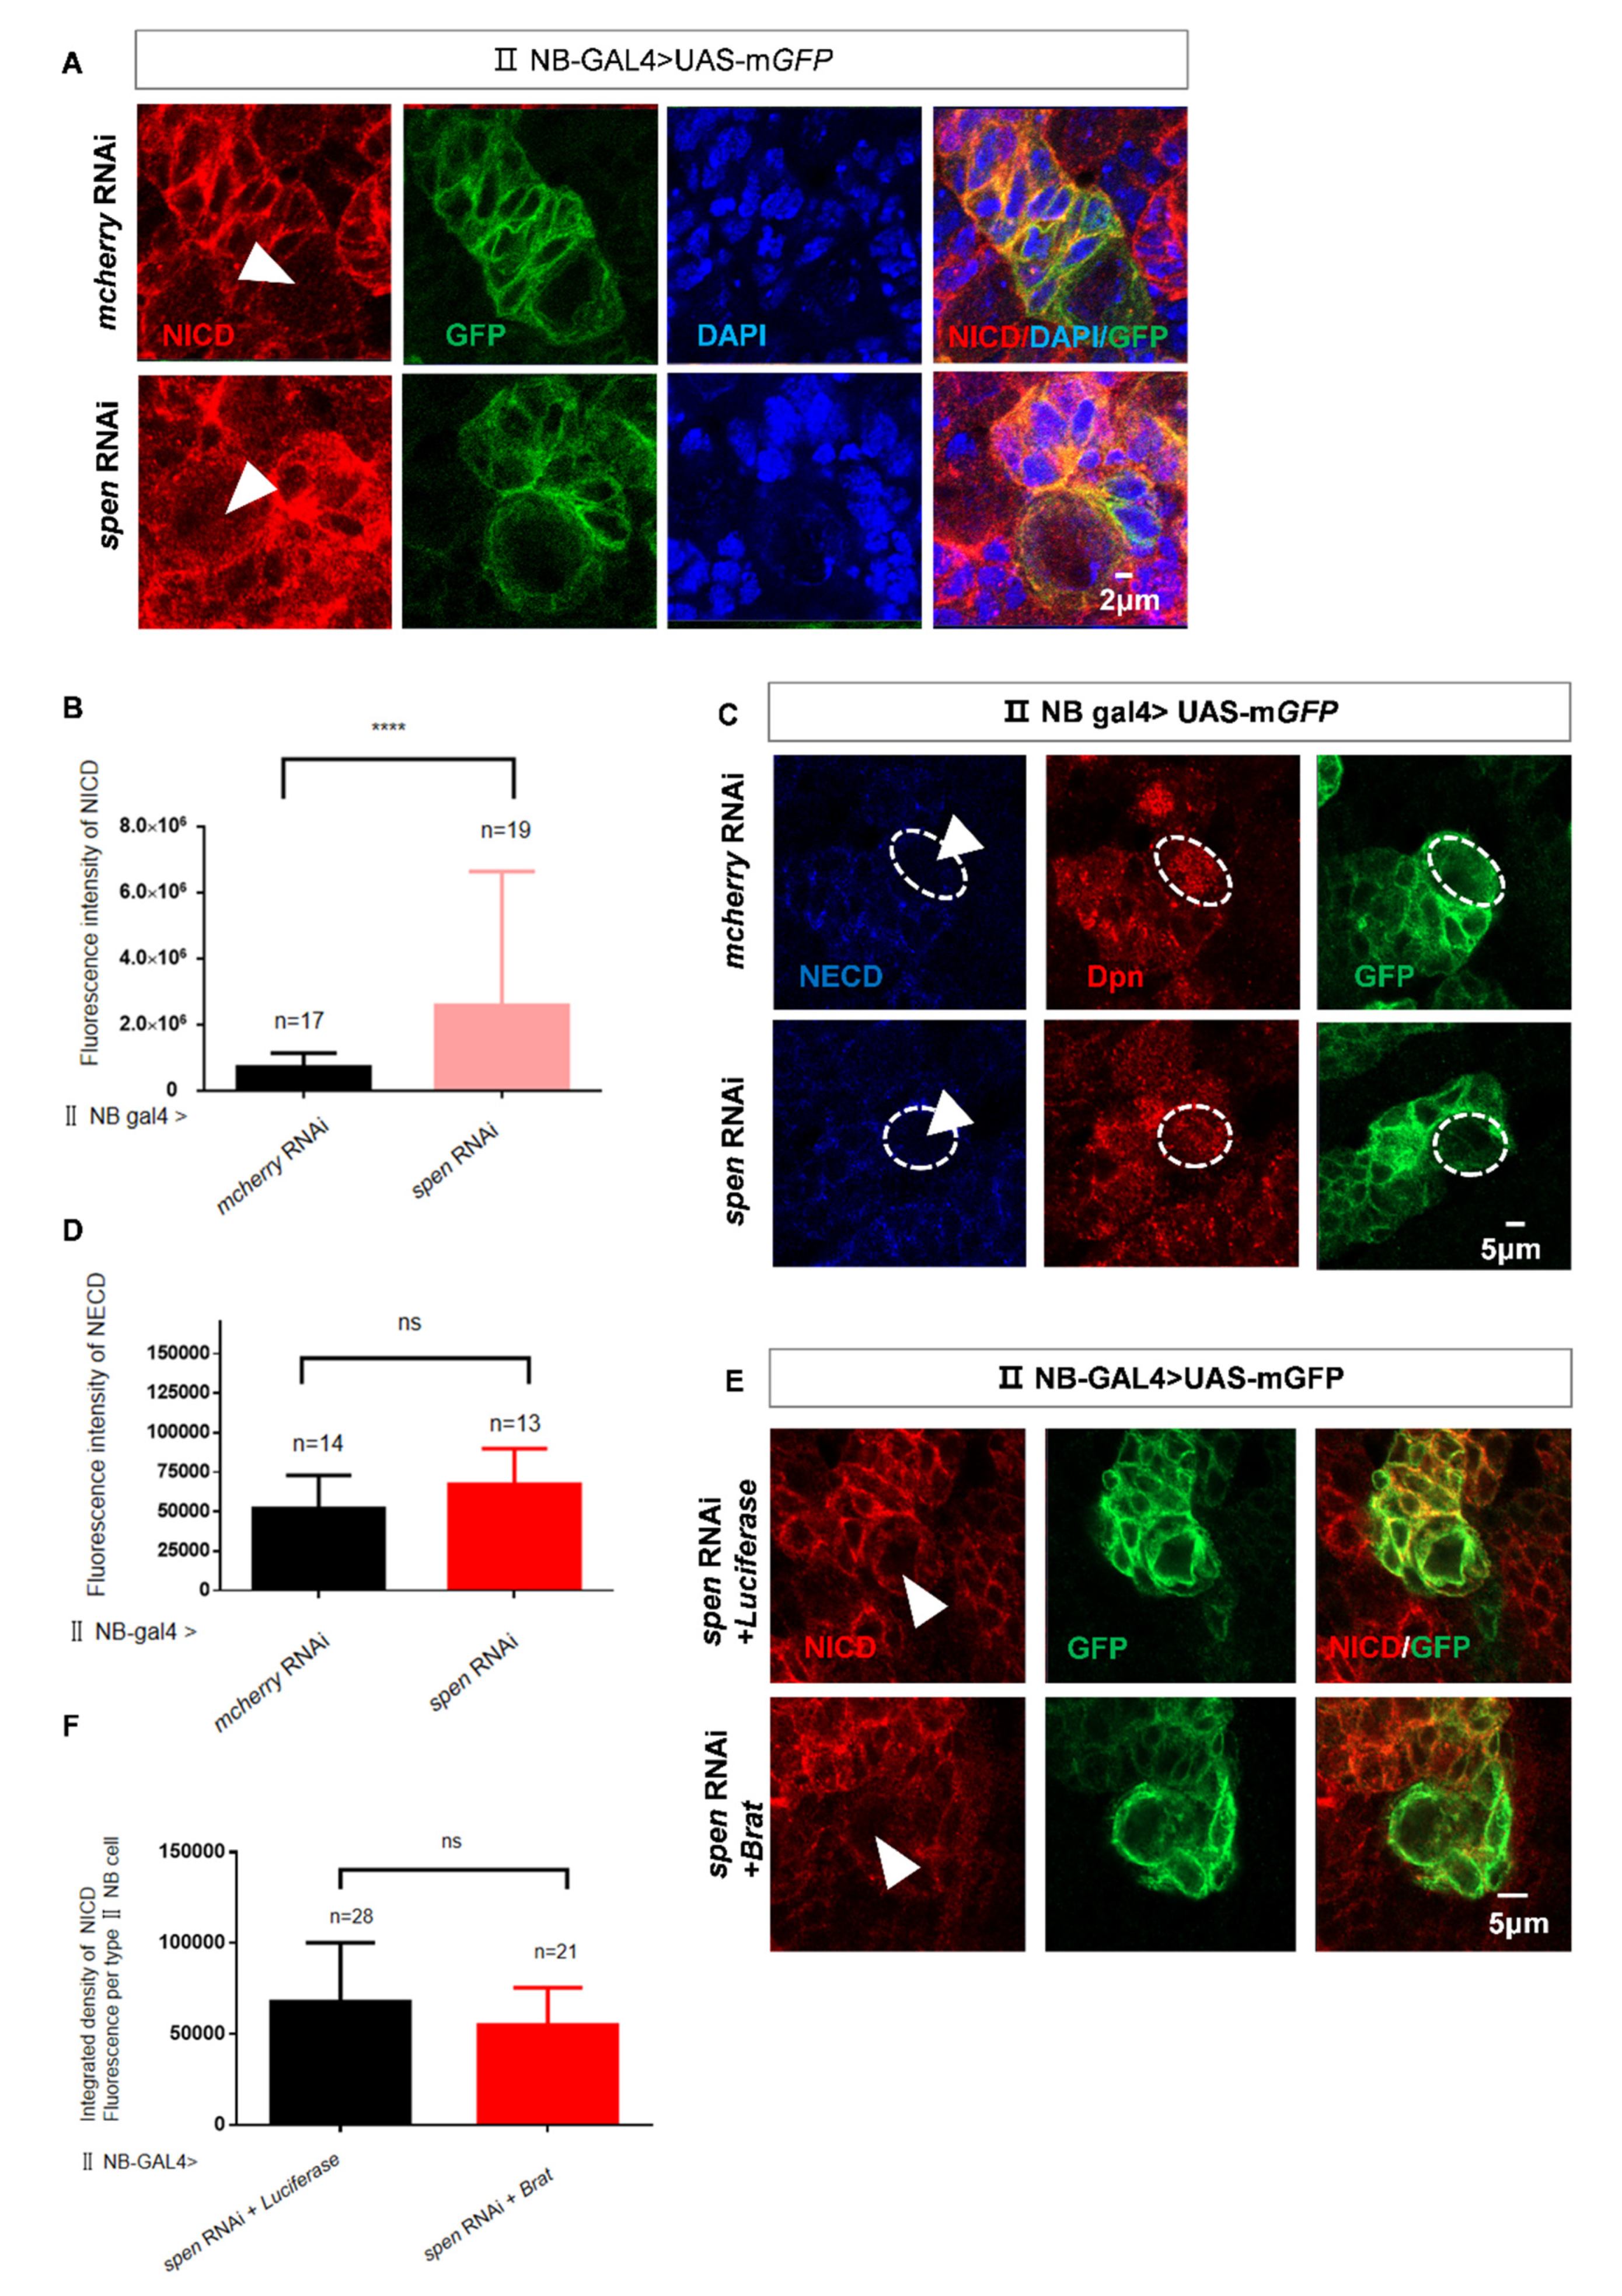
Figure 5.
The double knockdown of spen and Hairless leads to an excessive increase in the number of type II NBs. (A-B) The number of type II NBs had a modest effect in Hairless knockdown brains. (B) Quantification of type II NBs number in per brain lobe about (A) Mean ± SEM , *P<0.05, ns, non-significant. (C-D) Knocking spen and Hairless down led to more ectopic type II NBs compared to knockdown spen alone. (D) Quantification of type II NBs number in per brain lobe about (C).**,*** P<0.01. (E-F) Hairless knockdown in imINPs remained normal type II NBs number. (F) Quantification of type II NBs in per brain lobe from genotypes in (E), Mean ± SEM, ns, non-significant. (G) Spen-GAL4 derived mcherry-NLS expression. (H) Hairless-GAL4 derived mGFP expression. GFP marked type II NBs and their lineages in A and C. LacZ marked imINPs and their lineages in E.
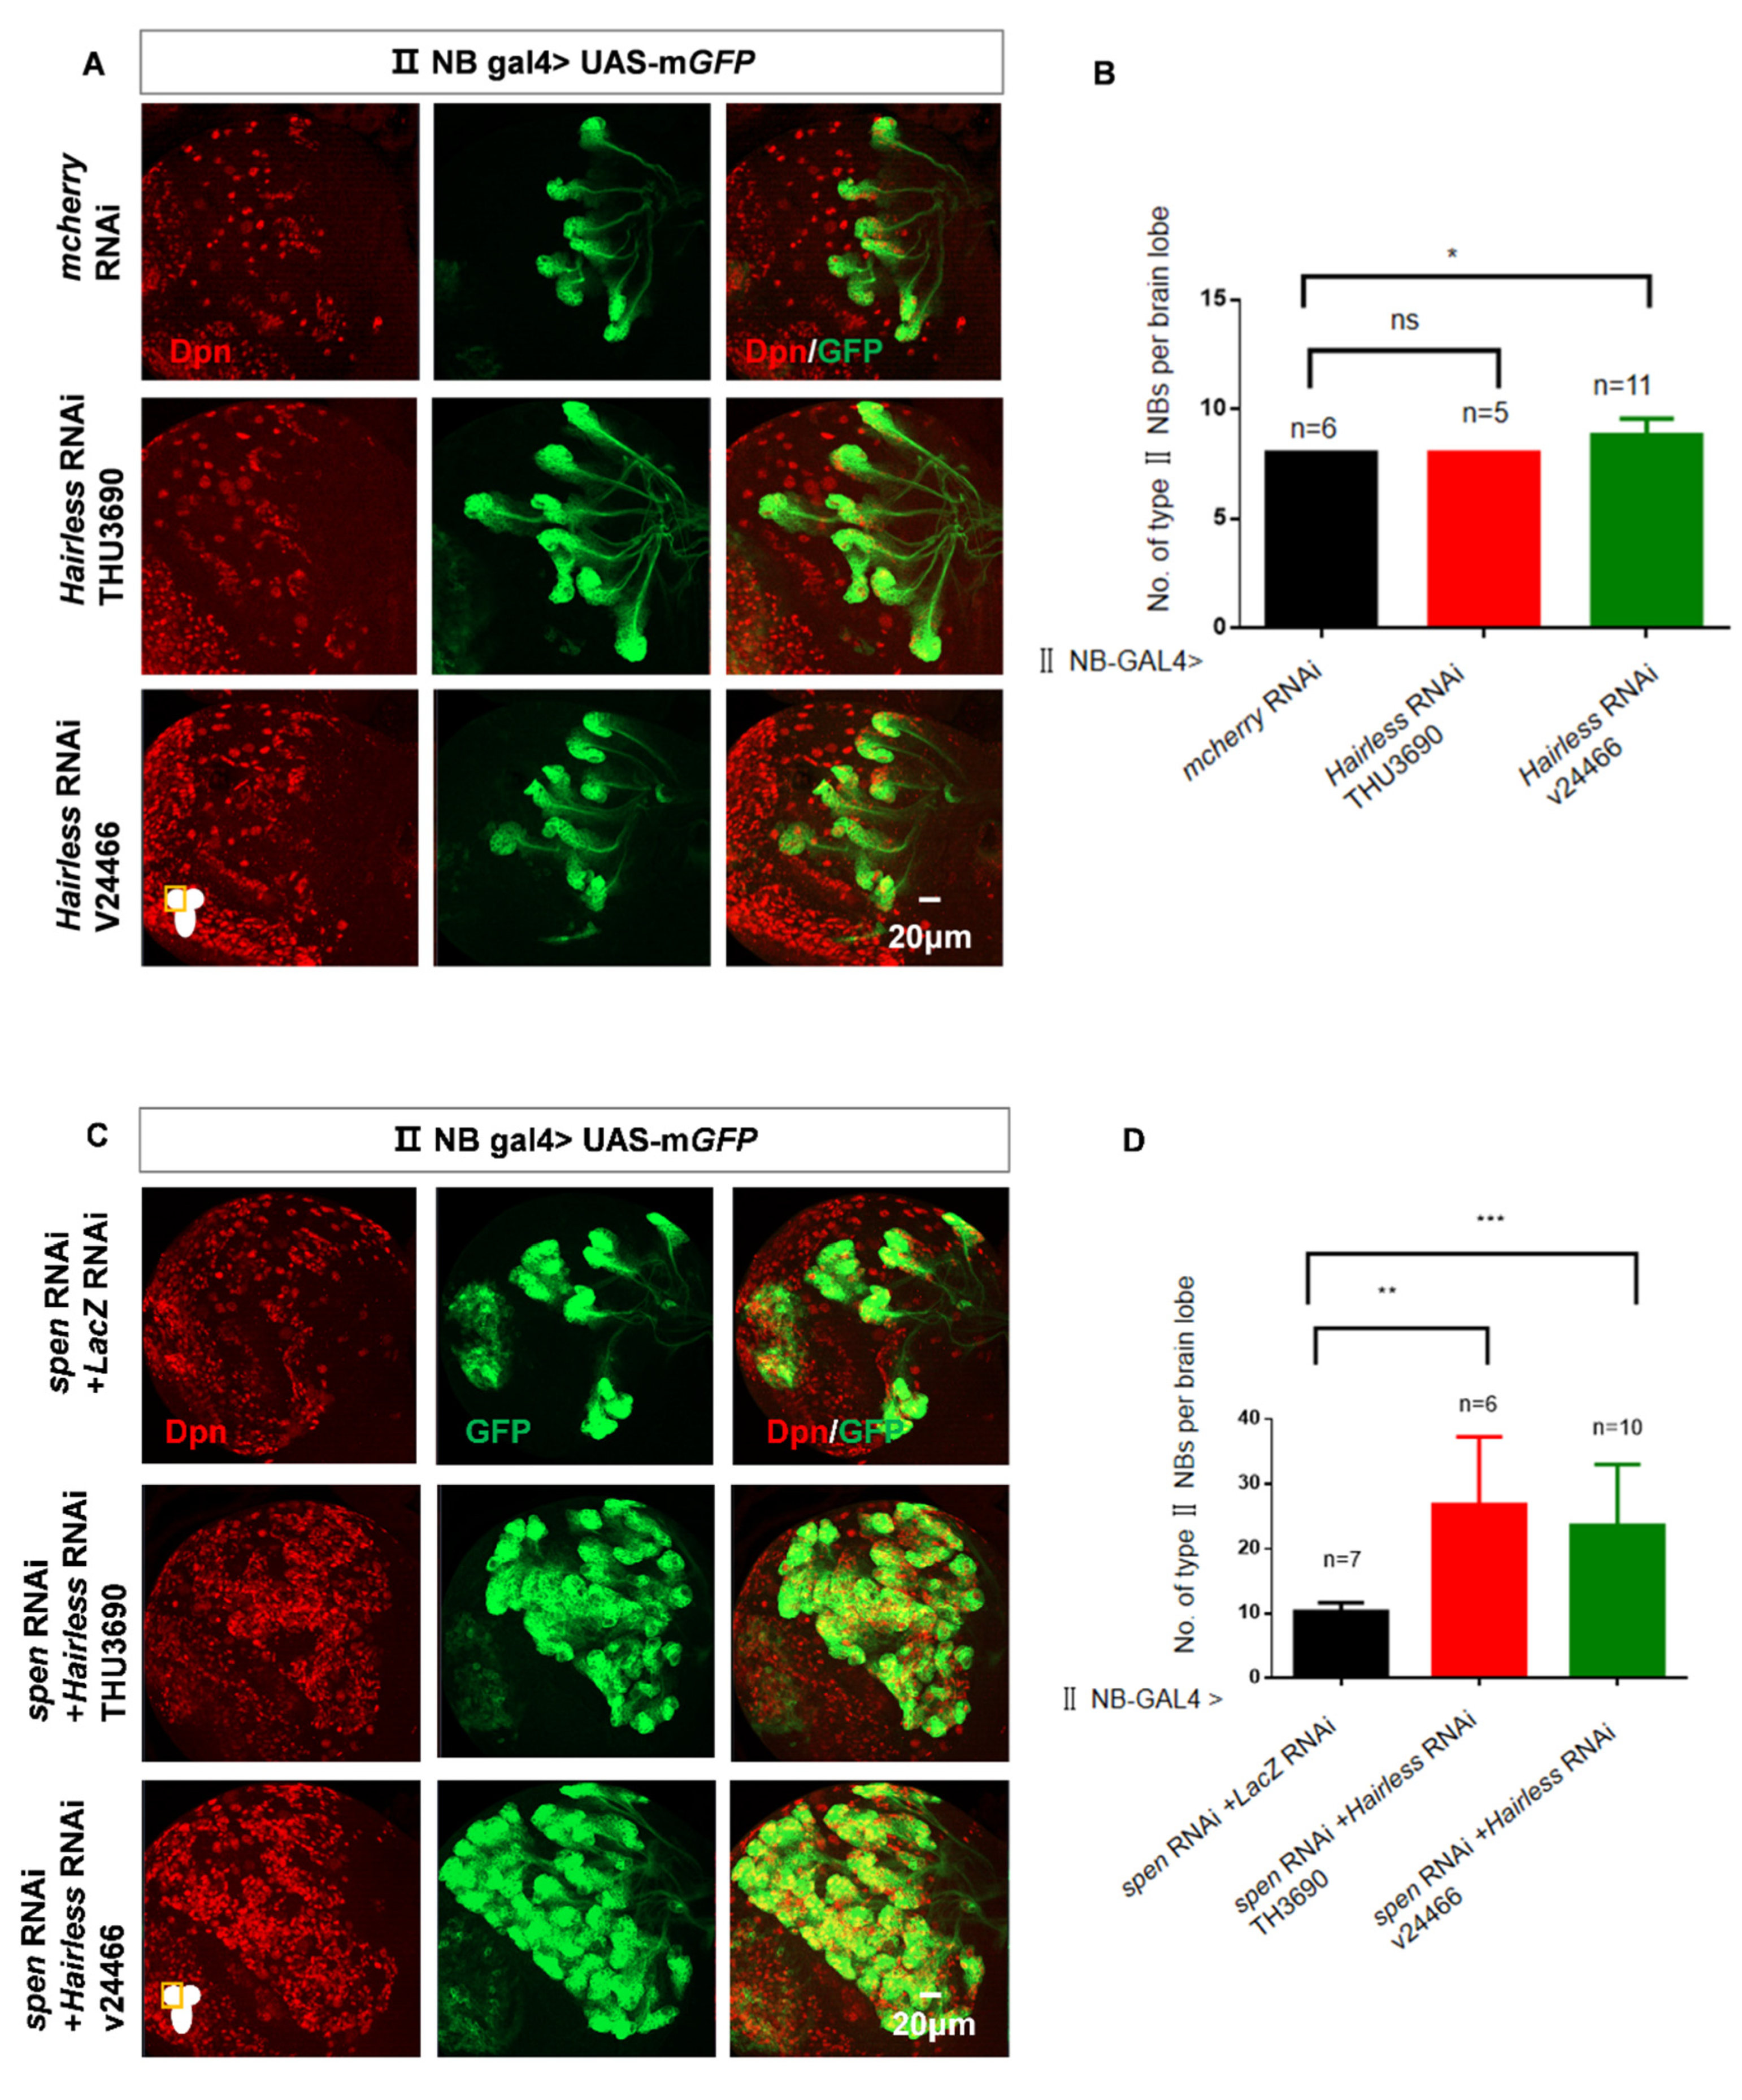
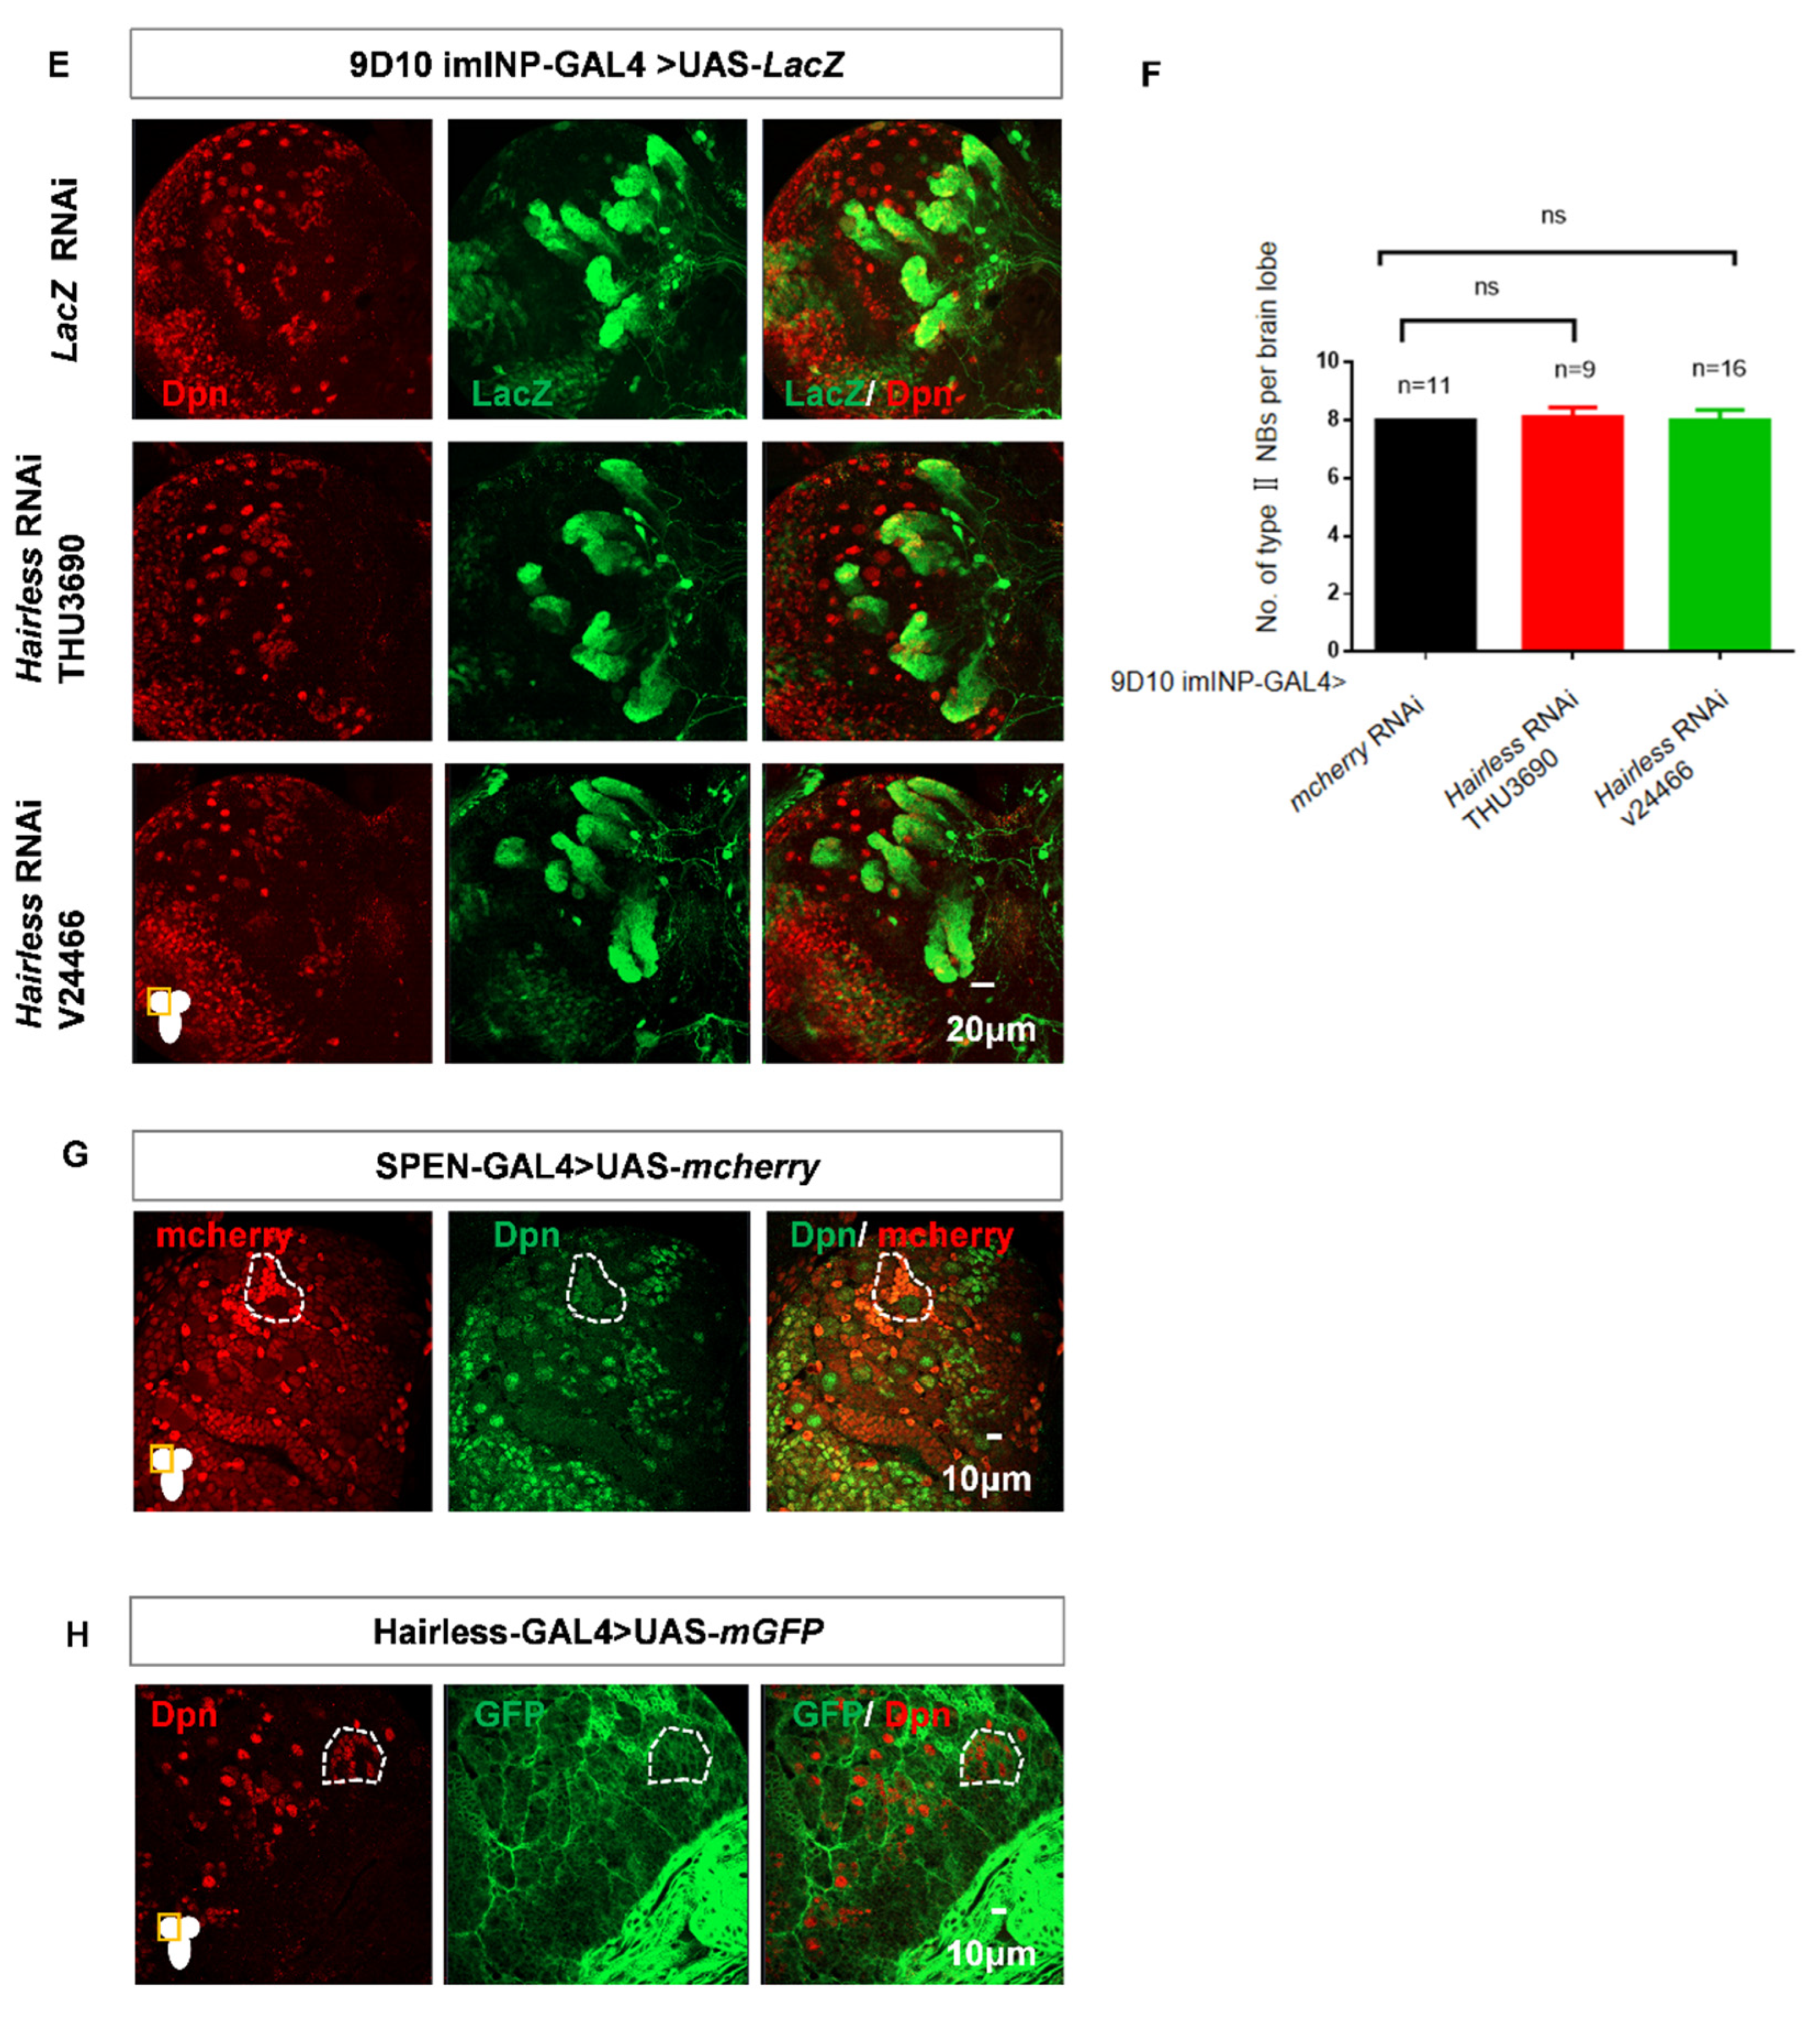
Figure 6.
The EGFR signaling pathway is involved in spen-mediated maintenance of type II NBs. (A) Double knockdown of spen and Egfr could partially rescue the increasing type II NBs number compared to knock spen and lacZ down. (B) Quantification of type II NBs number in per brain lobe from genotypes in (A). Mean ± SEM, *** P<0.01,, ****P<0.0001 . (C-D) Overexpression of a constitutively active form of Egfr or knockdown of Egfr does not affect the number of type II NBs. GFP marked type II NBs and their lineages.
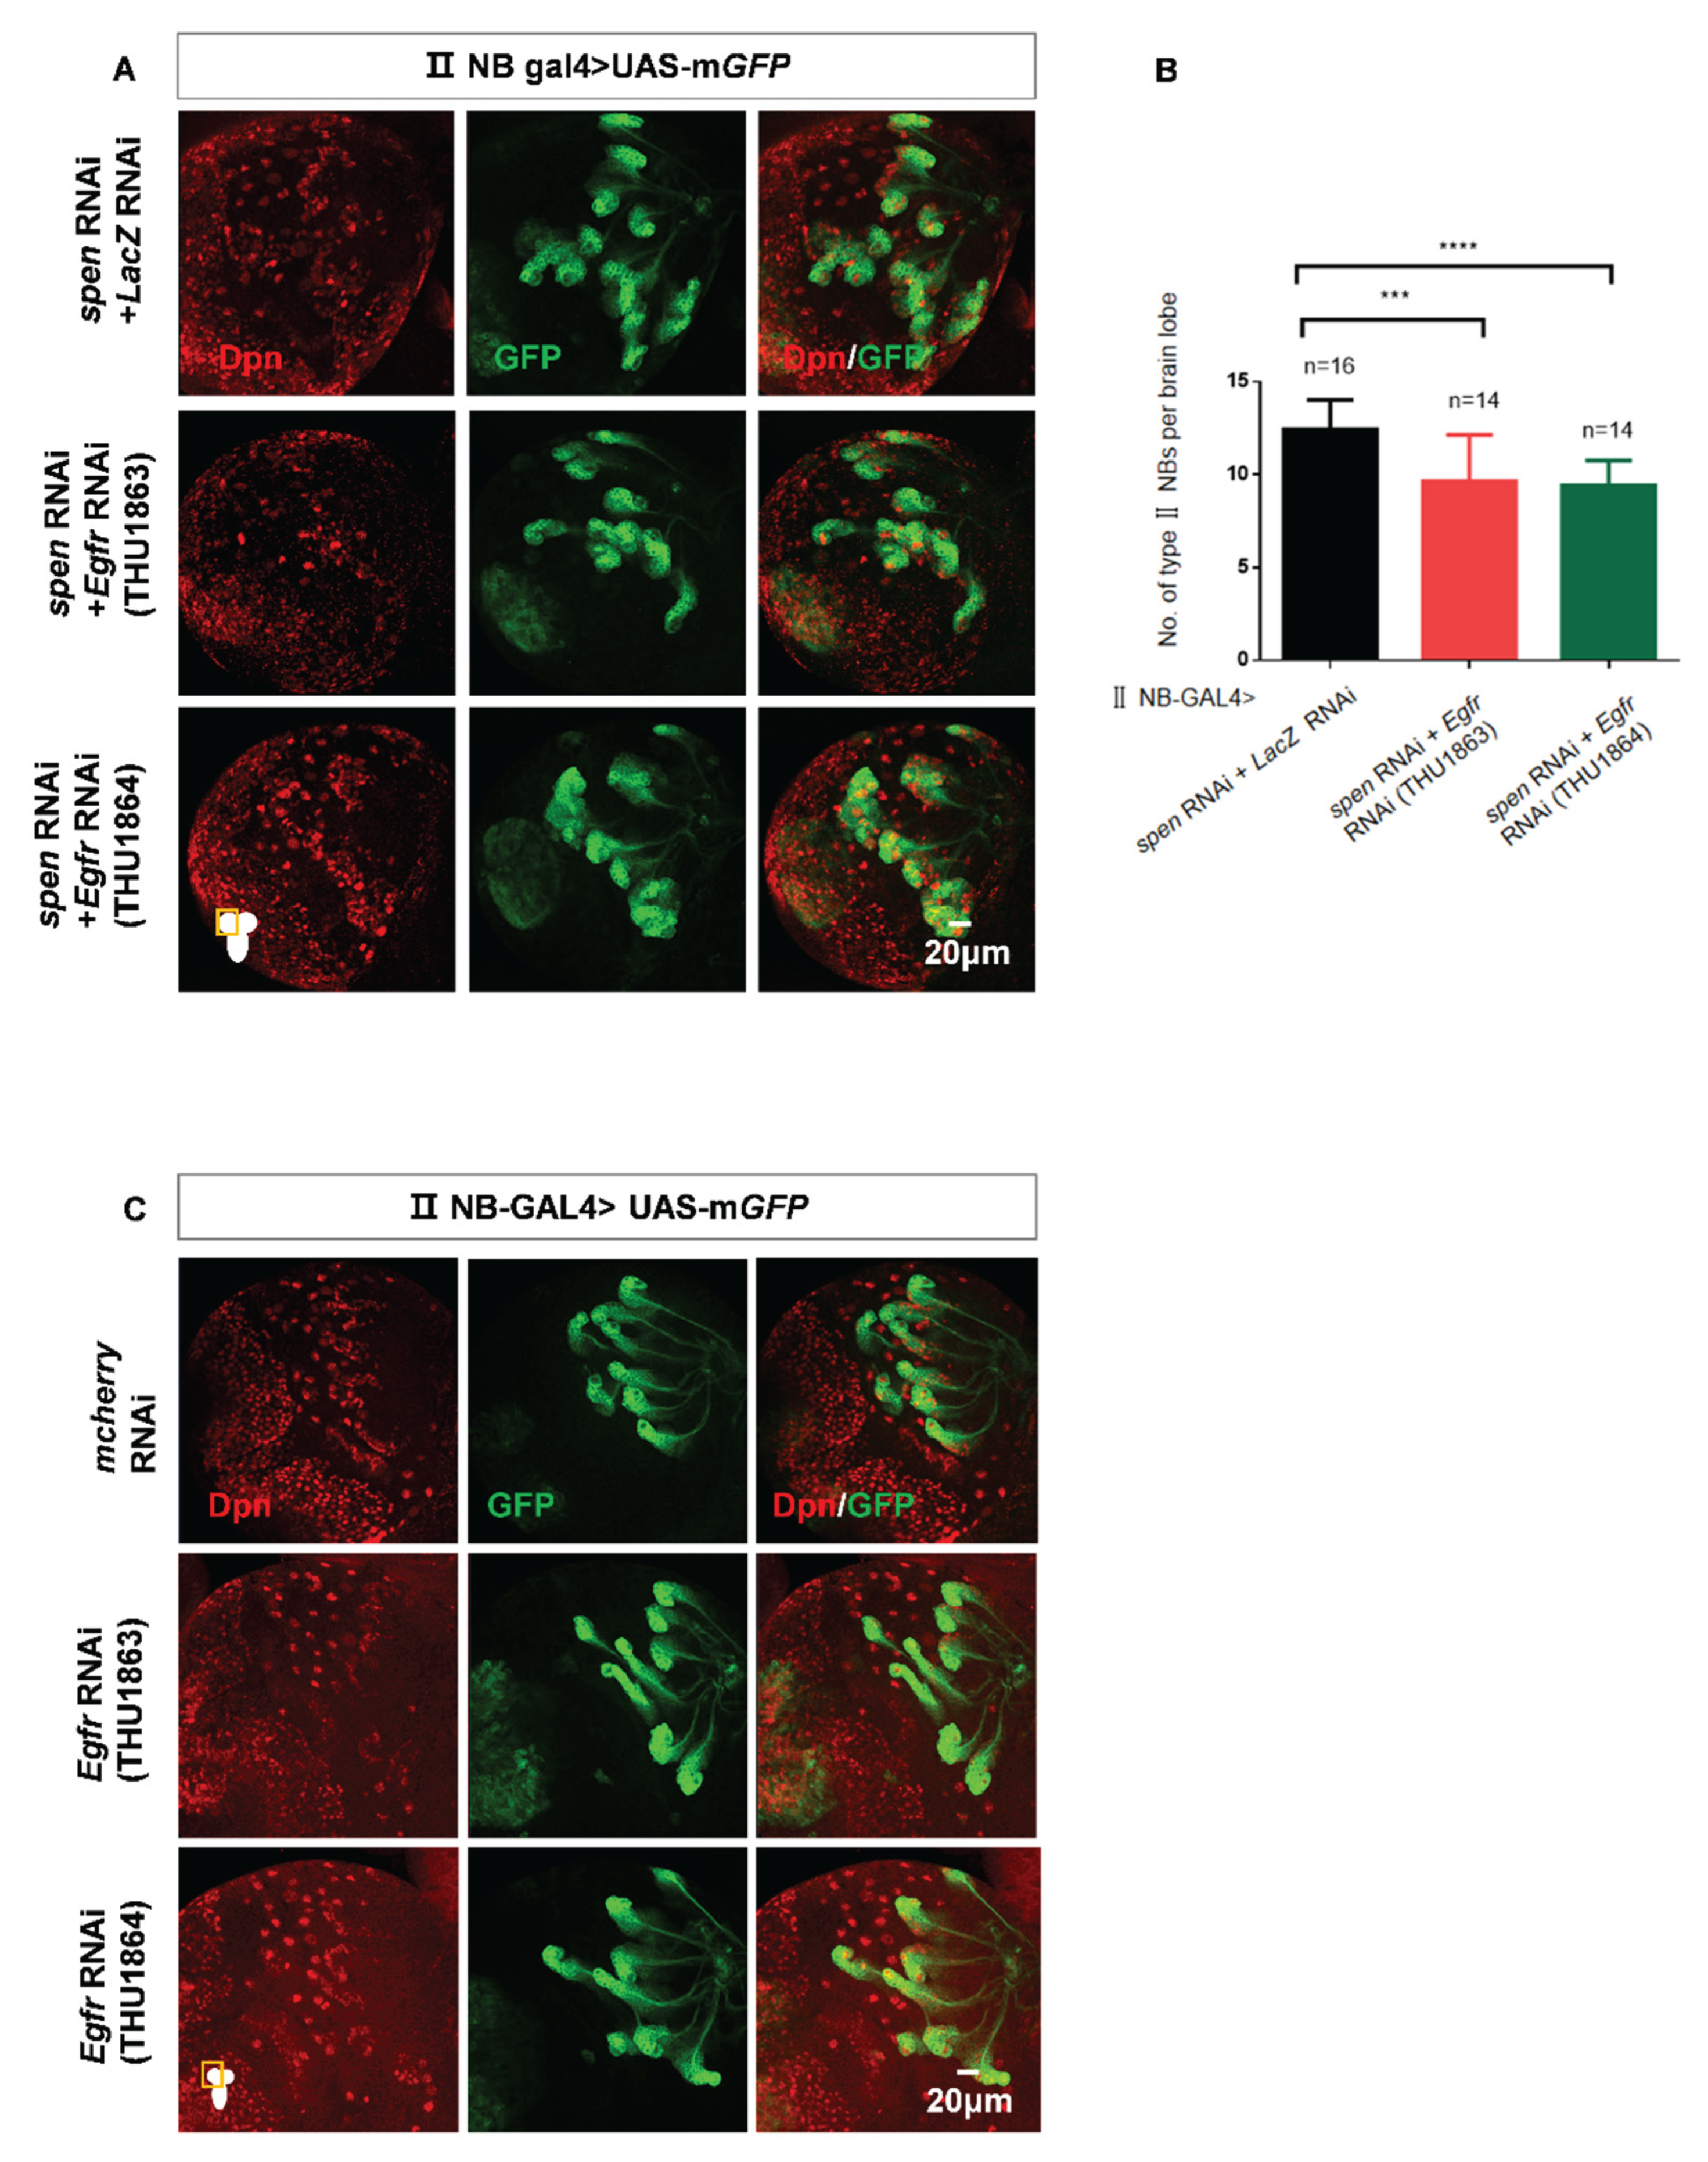
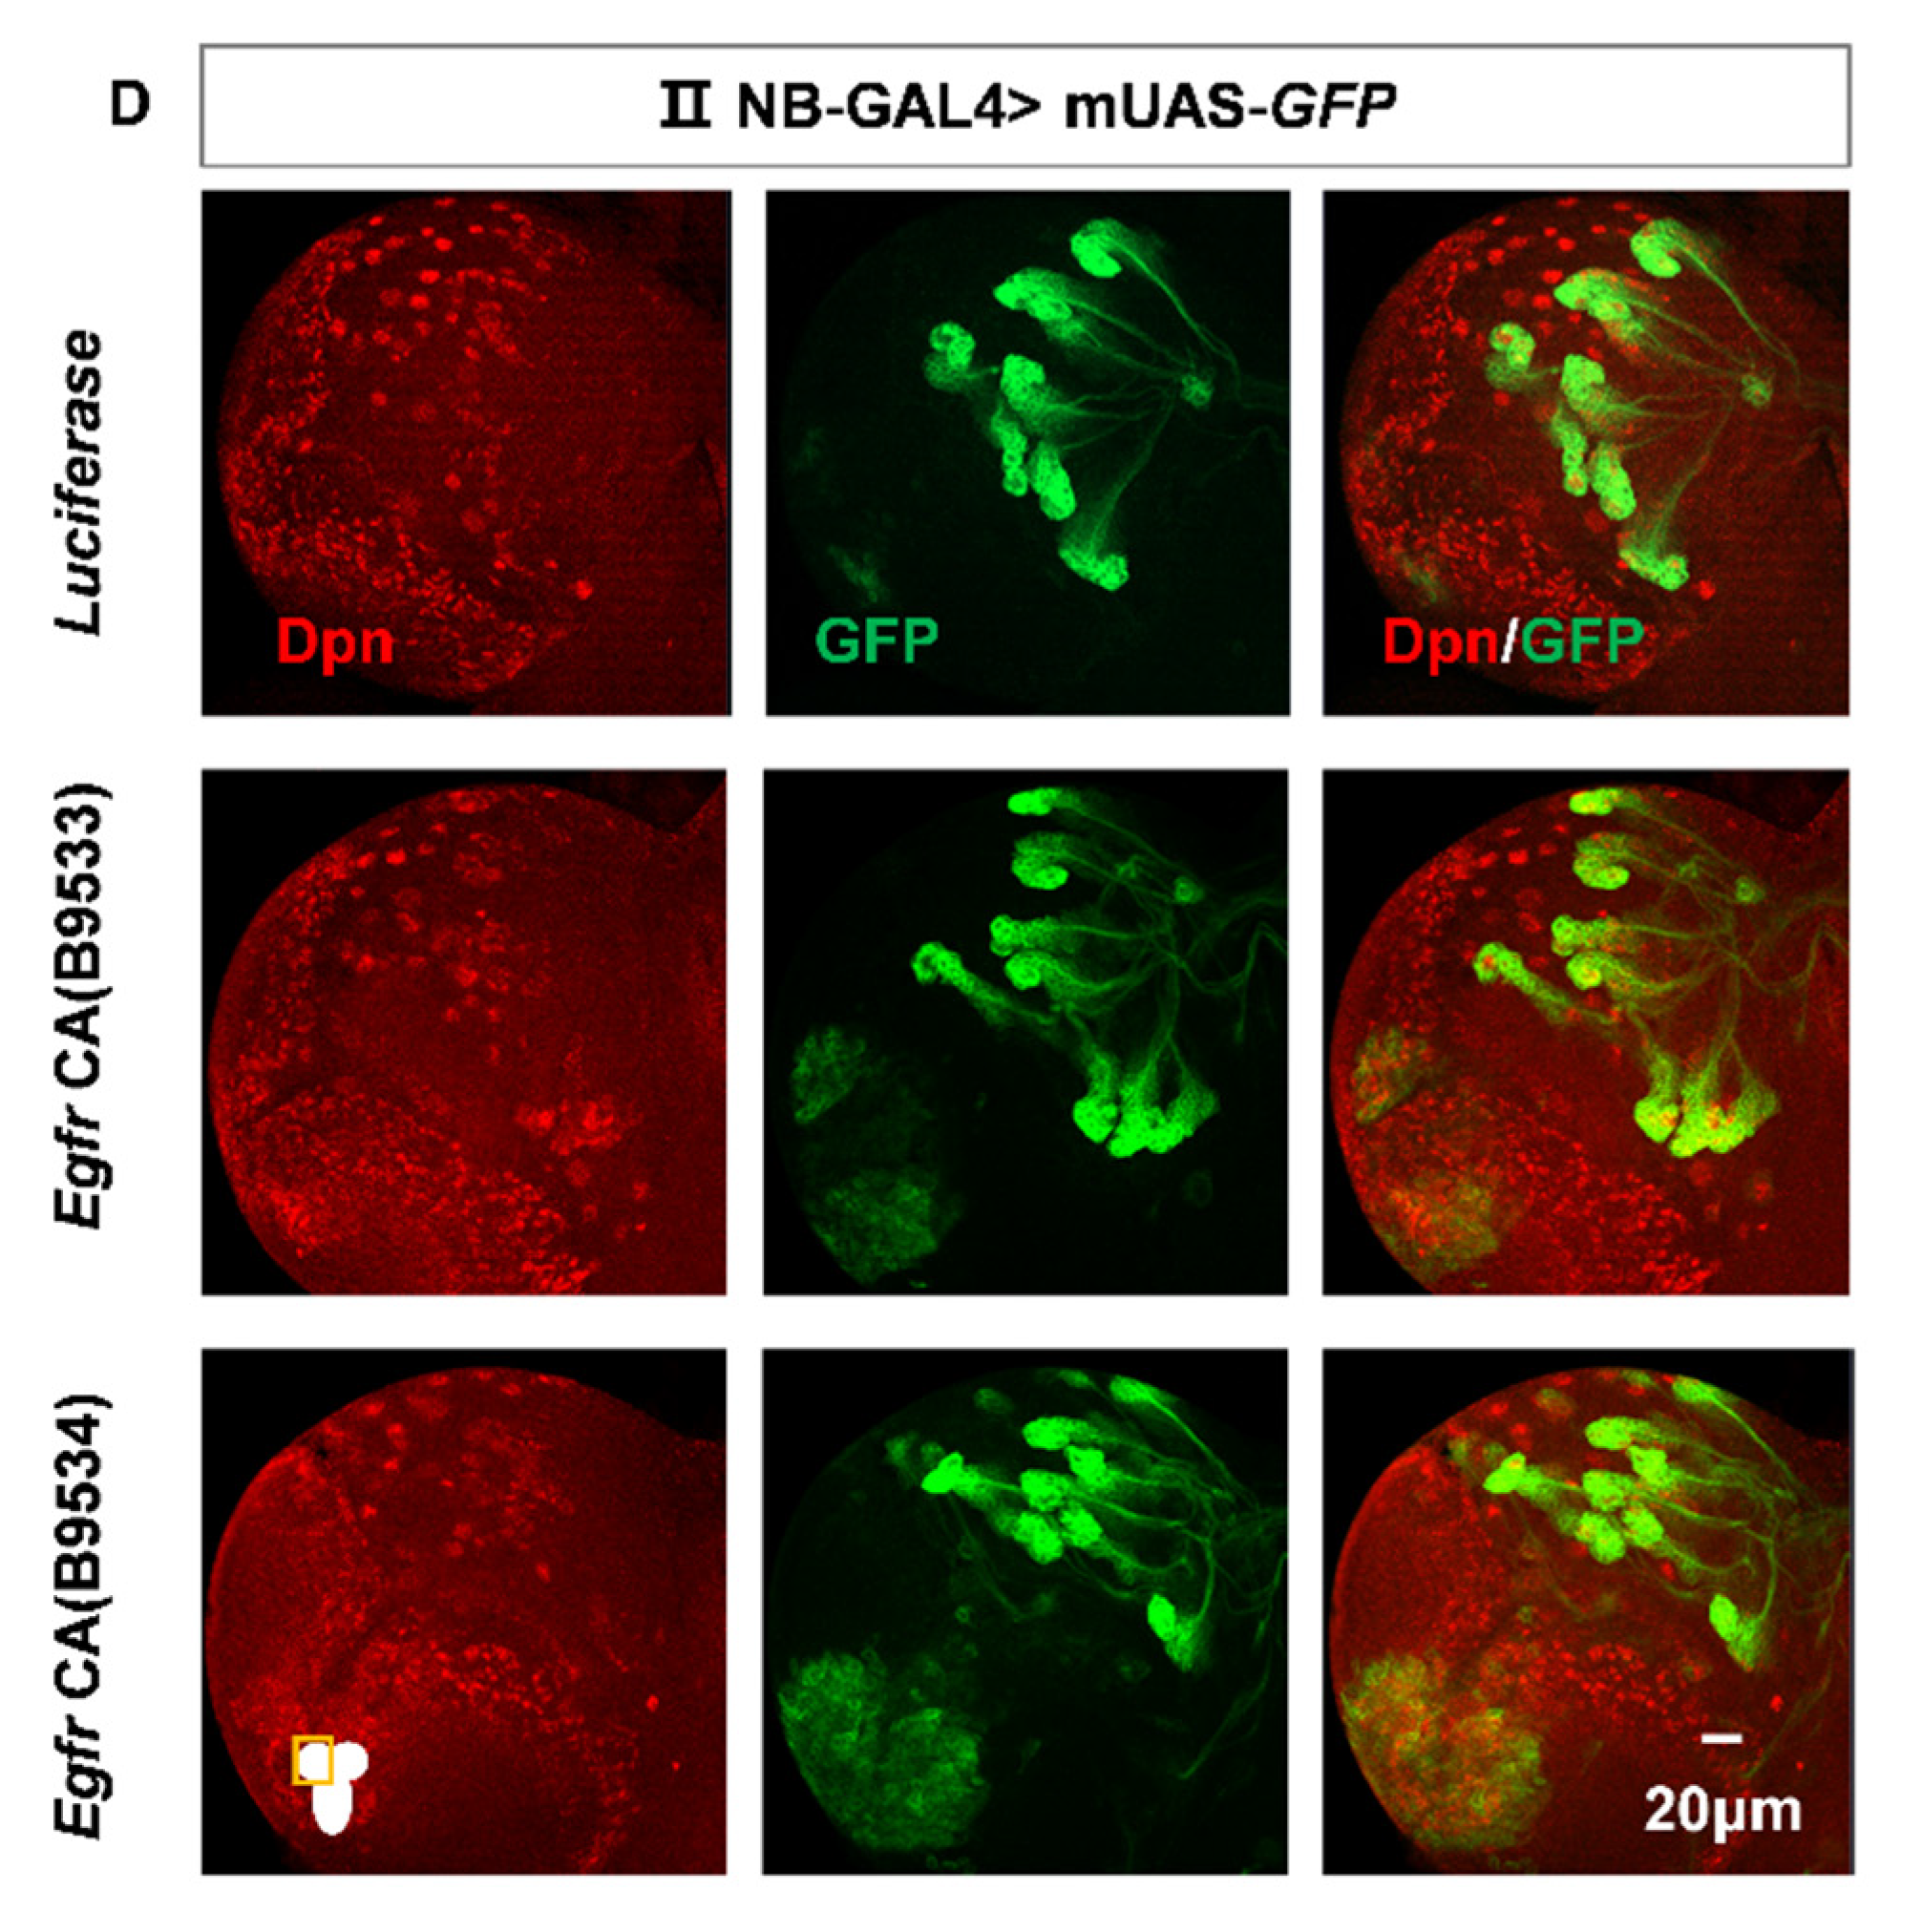
Figure 7.
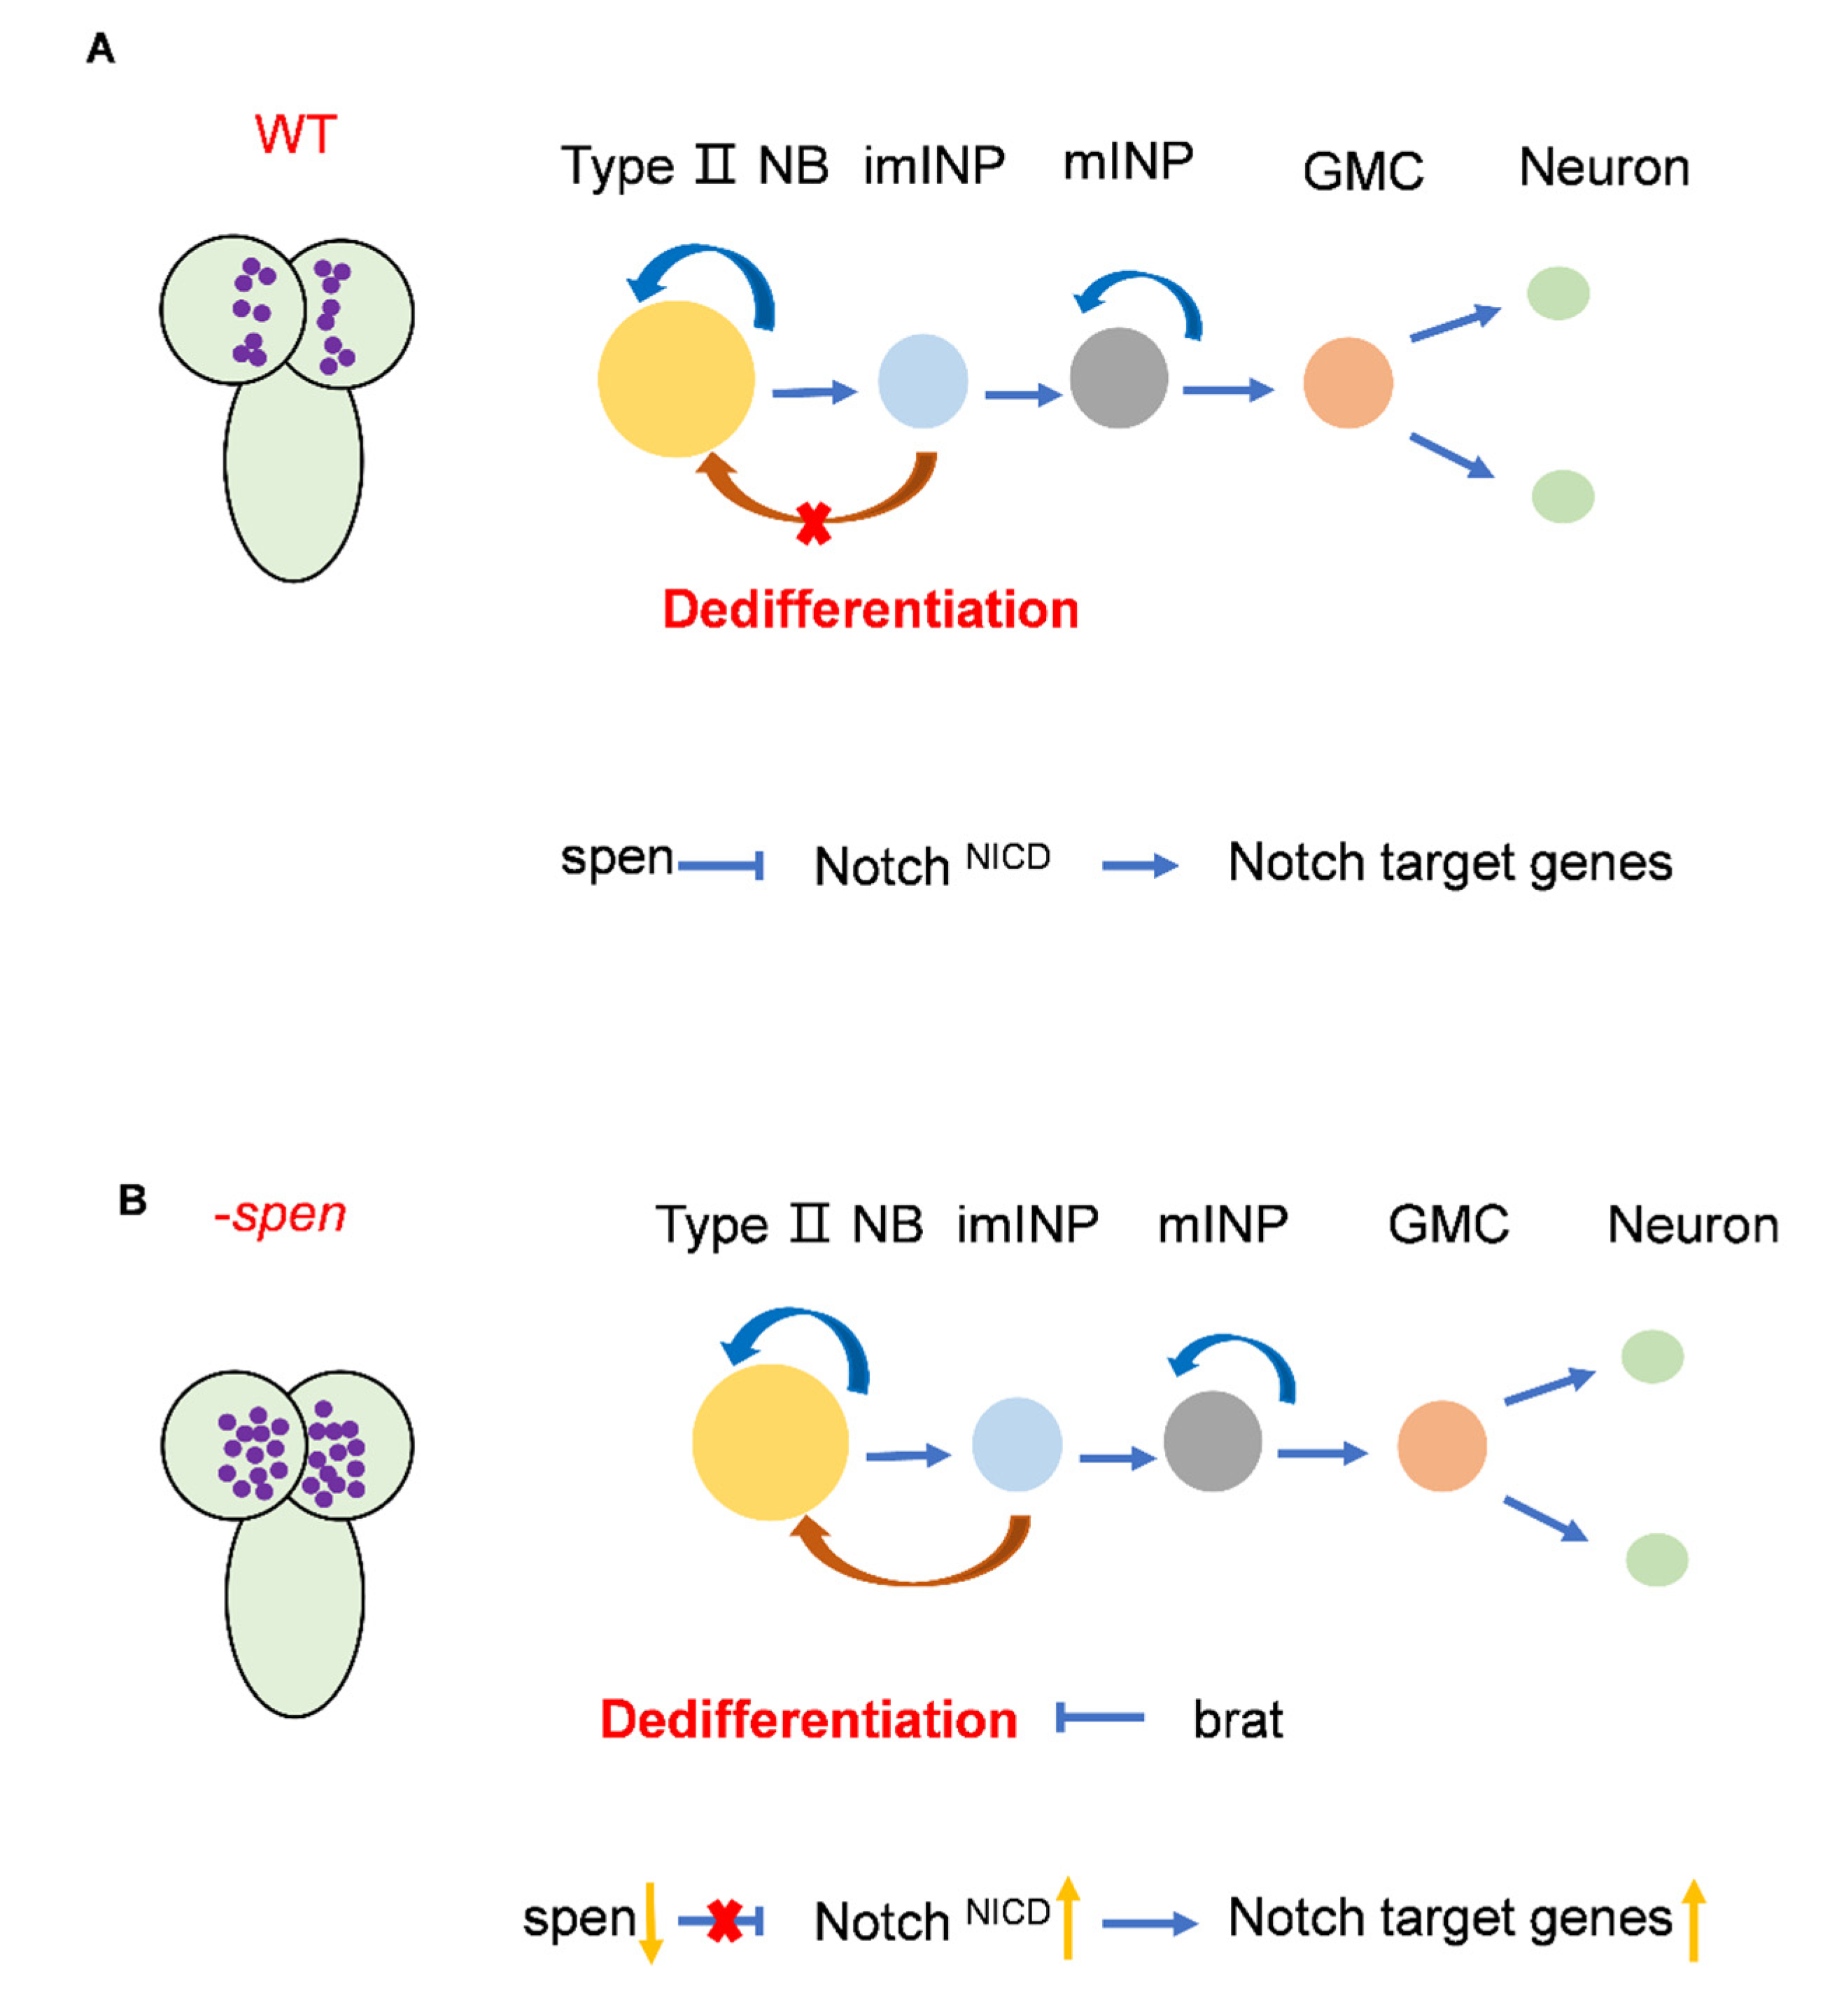
Figure 7. Pattern diagram of the role of spen in type II NBs. (A) In wildtype, spen may act as a co-repressor to regulate nuclear NICD levels, thereby repressing the expression of genes downstream of the Notch signaling pathway. So that the number of type II NBs can be maintained at normal levels. (B) In the absence of spen, the level of nuclear NICD are elevated, resulting in increased expression of Notch signaling pathway genes. Then imINPs dedifferentiate into type II NBs to increase the number of type II NBs. Brat can inhibit this dedifferentiation.
Figure 7.
Figure 7. Pattern diagram of the role of spen in type II NBs. (A) In wildtype, spen may act as a co-repressor to regulate nuclear NICD levels, thereby repressing the expression of genes downstream of the Notch signaling pathway. So that the number of type II NBs can be maintained at normal levels. (B) In the absence of spen, the level of nuclear NICD are elevated, resulting in increased expression of Notch signaling pathway genes. Then imINPs dedifferentiate into type II NBs to increase the number of type II NBs. Brat can inhibit this dedifferentiation.
Disclaimer/Publisher’s Note: The statements, opinions and data contained in all publications are solely those of the individual author(s) and contributor(s) and not of MDPI and/or the editor(s). MDPI and/or the editor(s) disclaim responsibility for any injury to people or property resulting from any ideas, methods, instructions or products referred to in the content. |
© 2025 by the authors. Licensee MDPI, Basel, Switzerland. This article is an open access article distributed under the terms and conditions of the Creative Commons Attribution (CC BY) license (http://creativecommons.org/licenses/by/4.0/).
Copyright: This open access article is published under a Creative Commons CC BY 4.0 license, which permit the free download, distribution, and reuse, provided that the author and preprint are cited in any reuse.


