
Submitted:
23 September 2025
Posted:
24 September 2025
You are already at the latest version
Abstract
Land economic density (LED) is vital for optimizing industrial structure and promoting intensive resource utilization. However, most existing studies have focused on city or county scales, with limited attention to the township level patterns. To address this research gap, we take 86 townships in Anyang City as research units and develop a four-dimensional evaluation system for LED. Using spatial autocorrelation, standard deviation ellipse, and geographically weighted regression (GWR) methods, we analyze the spatiotemporal evolution and driving mechanisms of LED from 2005 to 2023. Results indicate that: (1) high LED areas form a ring around the central city with dual cores in western Linzhou county and southeastern Huaxian county, while low LED areas are concentrated at the northwestern and northeastern margins; (2) global spatial autocorrelation is weak, with low–low clusters shrinking from contiguous patches to only three townships by 2023, while high–high clusters expand from isolated points to multi-centered diffusion; (3) the ellipse consistently shows a northwest–southeast orientation, with the rotation angle increasing from 128.24° to 130.35°, the flatness ratio rising from 0.432 to 0.445, and the centroid shifting northwest then southeast; (4) GWR results highlight economic foundation, industrial upgrading, and government support as the dominant drivers. Based on these findings, we propose a “One Core–Four Poles, Three Axes–Five Zones” spatial optimization framework to promote coordinated urban–rural development. This study provides a practical and multidimensional evaluation approach at the township level, offering methodological support for regional territorial spatial planning and sustainable development.
Keywords:
land economic density
; multi-dimensional index system
; driving factor
; spatial optimization
; anyang
1. Introduction
Land economic density (LED) refers to the economic return generated per unit of land area, which serves as a primary manifestation of how economic development exerts influence on land-use systems. It reflects not only the economic benefits and intensity of land use, but also plays a crucial role in addressing the tension between limited land supply and sustained economic growth [24]. The Rural Revitalization Plan (2024–2027) issued by the Chinese government explicitly emphasizes optimizing rural functional zoning and spatial layouts, refining land use classification standards, and formulating revitalization goals through differentiated development paths, thereby promoting comprehensive rural revitalization. These policy priorities highlight that innovating land development and utilization models, and enhancing land-use efficiency have become critical pathways for shifting socioeconomic development from rapid growth toward high-quality development [25]. However, existing research has predominantly focused on city and county scales, while systematic studies at the township level remain inadequate [26], posing challenges to provide comprehensive support for optimizing the “production–living–ecological” space and the overall territorial spatial layout.
In recent years, scholars have undertaken extensive research on LED, with particular emphasis on indicator systems and methodological approaches [4,5]. Regarding indicator systems, some studies measure LED using land or built-up area [27], while others rely on gross domestic product or non-agricultural value added to capture economic performance [7,8]. Methodologically, researchers have employed measures such as the coefficient of variation, Theil index, and relative growth rate to reveal disparities and development dynamics [9,10,11]. In addition, exploratory spatial data analysis and global or local Moran’s I statistics have been widely employed to identify spatial patterns and correlations [12,13]. Collectively, these approaches indicate a clear shift toward data-driven research, emphasizing the integration of spatial statistics and quantitative analysis in understanding land-use efficiency. However, due to long-standing data limitations at the township level, quantitative spatial econometric analyses remain relatively scarce [14,15]. More recently, the availability of resources such as the County Statistical Yearbook (Township Volume) in China has facilitated the use of models including geographically weighted regression (GWR), spatial lag model, and spatial error model, signaling a growing trend toward quantitative analysis. Overall, while existing research has enriched indicators and methods, systematic investigation at the township scale remains insufficient, underscoring the necessity of further exploration in this field.
Anyang city, located at the junction of Henan, Shanxi, and Hebei provinces, is a key regional center within the Central Plains Urban Agglomeration [28]. Owing to its strategic position as a hub linking North and Central China, the city is characterized by diverse resource endowments and pronounced urban–rural inequality. At the same time, it faces multiple challenges including industrial restructuring, rural revitalization, and resource–environmental constraints [17,18]. These features make Anyang city representative, making it an ideal case for investigating township-scale LED pattern. On this basis, this study focuses on township units in Anyang, treating LED as a key variable for evaluating land-use efficiency and structural optimization. By analyzing spatial variability and evolutionary patterns of LED, the study aims to precisely identify township-level land-use conditions, thereby offering a scientific basis for the formulation of township-scale land development strategies in Anyang, as well as providing practical references for new-urbanization spatial optimization.
2. Materials and Methods
2.1. Study Area
Anyang city is located in northern Henan Province, with the Taihang Mountains in the west and the North China Plain in the central and eastern parts (Figure 1). Geographically, it lies between 35°41′–36°21′ N and 113°38′–114°59′ E, covering four districts and five counties/county-level cities, with a total area of 7,413 km²[29]. The city is characterized by diverse resource endowments and pronounced socioeconomic differences across its territory [30]. As a national historic and cultural city, Anyang city encompasses typical agricultural counties such as Huaxian and Neihuang, while also possessing abundant natural and cultural tourism resources [21,22]. At the same time, as a representative old industrial city in central China, Anyang once thrived through industrial development but has recently faced mounting challenges of transformation. Therefore, this study selects the city as the research area to examine township-scale LED. The objective is to reveal the dynamics of industrial restructuring and land-use evolution, thereby providing new perspectives for promoting agricultural modernization, revitalizing old industrial bases, and promoting sustainable regional development.
2.2. Data Sources
Anyang City administers 23 townships, 66 towns, 46 sub-districts, and 2,979 administrative villages. This study adopts the township as the unit of analysis to examine the spatial differences and evolutionary patterns of LED across the city, thereby revealing regional economic dynamics from a micro-scale perspective. Given the institutional and industrial structural differences between urban sub-districts, sub-districts were excluded from the analysis following previous research practices. Consequently, 89 township-level units were identified as the objects of study. The data used in the LED evaluation indicator system and influencing factors were primarily obtained from the County Statistical Yearbook (Township Volume), the Anyang Statistical Yearbook, and local yearbooks such as the Linzhou Yearbook, supplemented by materials from the Local Chronicles Database and township government work reports. In particular, the indicator of township governance effectiveness was derived from the honors and commendations awarded to each township from 2005 to 2023, with scores assigned as 10 points for national-level, 8 for provincial-level, 6 for municipal-level, and 4 for county-level honors, based on information collected from official government bulletins.
2.3. Methods
2.3.1. Land Economic Density (LED) Assessment
Land economic density refers to the economic output generated per unit of land area. It serves as an important indicator for evaluating land-use efficiency and the level of economic development. In this study, it is defined as the ratio of gross domestic product within each research unit to its corresponding land area, based on data availability. This metric effectively reflects both the intensity and efficiency of regional land development and utilization, and helps to reveal the coordination between land expansion and economic growth. However, given that a single indicator cannot fully represent the comprehensive level of township economic and social development, this study further constructs an evaluation system incorporating multiple indicators across four dimensions: economic scale, industrial structure, agricultural modernization, and social security The entropy weighting method is applied to determine the weights of these indicators, thereby generating a composite measure of LED for each township, which forms the empirical basis for the subsequent analyses of spatial pattern evolution and influencing factors.

Table 1.
Evaluation index system for comprehensive township-level LED.
| Criterion Layer | Indicator Layer | Subjective Weight | Objective Weight | Comprehensive Weight |
| Scale Improvement | Fiscal Revenue | 0.389 | 0.099 | 0.273 |
| Gross Industrial Output | 0.129 | 0.160 | 0.142 | |
| Total Grain Output | 0.077 | 0.035 | 0.061 | |
| Structural Optimization | Ratio of Secondary and Tertiary Industry Output Value | 0.129 | 0.223 | 0.167 |
| Rural–Urban Integration Process | 0.043 | 0.084 | 0.059 | |
| Non-Agricultural Process | 0.025 | 0.015 | 0.021 | |
| Agricultural Modernization | Grain Yield per Unit Area | 0.078 | 0.066 | 0.073 |
| Total Power of Agricultural Machinery | 0.025 | 0.043 | 0.033 | |
| Per Capita Grain Output | 0.015 | 0.030 | 0.021 | |
| Social Security | Per Capita Net Income of Rural Residents | 0.055 | 0.003 | 0.034 |
| Primary School Enrollment per Capita | 0.018 | 0.047 | 0.029 | |
| Township Governance Effectiveness | 0.011 | 0.189 | 0.082 |
The Analytic Hierarchy Process (AHP) was implemented in SPSS to obtain the subjective weights w1 of each indicator [23,24]. The importance of each indicator was assessed by 20 experts in economic geography independently and the mean scores were used to construct the pairwise comparison matrix. The entropy method was then applied to capture information heterogeneity across indicators through data standardization and normalization, calculation of proportion, entropy, and divergence, yielding the objective weights w2 [31]. Township-level composite LED development scores were calculated as weighted sums of standardized indicators, with the combined weights determined through the integration of subjective and objective results. The formula is:
where wj represents the composite weight of each indicator, w1 represents the subjective weight, and w2 represents the objective weight. Given that entropy-based weights are easily influenced by large variations in indicator values, a relatively lower coefficient (0.4) was assigned to the objective weight to reduce their volatility and improve result stability, which is consistent with previous studies combining AHP and entropy methods [32].
2.3.2. Exploratory Spatial Data Analysis
Exploratory spatial data analysis is a statistical approach used to examine spatial correlations among variables and to reveal their spatial association characteristics [33]. In this study, both global and local spatial autocorrelation methods are employed to interpret spatial dependencies. Specifically, the Global Moran’s I statistic method is applied to detect the presence and overall trend of spatial clustering [34], while the Local Moran’s I scatter plot and the LISA (Local Indicators of Spatial Association) cluster map are used to identify the types of clustering and spatial association at specific locations [29,30]. The formula for Moran’s I is as follows:
where, yi and yj represent the values at locations i and j respectively; denotes the global mean; wij is the spatial weight matrix; and n is the number of observations.
The formula for Local Moran’s I is:
where, and , ; wij is the spatial weight matrix; and n is the number of observations. Local Moran’s I characterizes the correlation between each spatial unit and its neighboring units and reveals local spatial clustering patterns.
2.3.3. Spatial Regression Analysis Method
Spatial regression analysis is an important statistical method for exploring spatial associations among multiple variables. Traditional ordinary least squares (OLS) regression estimates global parameters based on the least squares principle [35]. While suitable for stationary data, OLS is limited in addressing variables with spatial dependence. In contrast, the geographically weighted regression (GWR) model introduces a non-parametric local weighted regression technique, which not only improves the overall goodness of fit but also effectively captures the spatial non-stationarity of parameters, thereby revealing how relationships among variables vary across geographic locations [32,33,34]. Accordingly, this study applies the GWR model to systematically analyze the influencing mechanisms of township-level LED in Anyang. The formula for OLS regression is:
where, yi denotes the observed value of the ith spatial unit, xki represents the kth explanatory variable of the ith spatial unit, and m is the number of influencing factors included in the model. β0 is the global intercept, βk is the global regression coefficient, and εi is the random error term.
The GWR model can be expressed as:
where, yi denotes the observed value at location i, xki represents the explanatory variable at location i, (ui, vi) are the spatial coordinates of regression point i, β0(ui, vi) is the intercept term, and βk(ui, vi) is the regression coefficient.
2.3.4. Standard Deviational Ellipse
To capture the overall spatial dispersion and directional characteristics of township LED, the standard deviational ellipse (SDE) method was applied. The SDE provides a statistical summary of the spatial distribution of geographic features by calculating their mean center, the dispersion of coordinates along the major and minor axes, and the azimuth of the major axis. It effectively condenses complex spatial distributions into a single geometric figure, where the major axis indicates the direction of maximum dispersion and the minor axis indicates the direction of minimum dispersion, while the flattening ratio reflects the degree of spatial concentration. The overall form of the SDE is expressed as:
where:
where, ) are the coordinates of the ellipse centroid, and are the standard deviations along the major and minor axes, and represents the rotation angle of the ellipse. Changes in centroid location, orientation, and flattening across years reveal the spatiotemporal evolution of the overall LED distribution.
3. Results
3.1. Spatial Pattern Evolution of LED
Based on the natural breakpoint classification method, the LED evaluation results at township scale were visualized and categorized into five levels: high, relatively high, medium, relatively low, and low (Figure 2). From the perspective of the overall pattern, high-level areas of LED exhibit two distinct clustering characteristics: a ring-shaped cluster centered on major urban built-up areas, and an industrial cluster concentrated in Huaxian County in the southeast. Medium-level areas are largely distributed around the high-level areas, demonstrating a clear spatial spillover effect. In contrast, low-level areas are mainly concentrated in the Taihang Mountains in the northwest and along the provincial border in the northeast, forming a continuous low-value belt.
From the perspective of spatiotemporal evolution, the township LED development in Anyang city can be divided into two stages: a spatial expansion stage (2005–2015) and a quality enhancement stage (2015–2023). During the spatial expansion stage, high-level areas expanded rapidly from isolated clusters around the urban periphery to contiguous agglomerations covering both the central urban districts of Anyang and the urban area of Linzhou county, while towns such as Chengguan and Laodian township in Huaxian county also achieved notable breakthroughs. Medium-level areas increased substantially in counties such as Neihuang and Huaxian counties, while low-level areas decreased significantly, leading to an overall improvement at the regional level. During the quality enhancement stage, the distribution of high-level areas became more stable, forming a multicentric pattern linking the Linzhou urban area, the central urban districts, and the Huaxian region. A high-value ring emerged around central Anyang urban area, while multiple breakthroughs occurred in Linzhou and Huaxian counties, with six townships including Wangu, Baidaokou, and Liugu, experiencing substantial upward shifts. At the same time, low-level areas further contracted to the mountainous regions in the northwest and southwest, as well as the eastern periphery. However, between 2020 and 2023, several townships in Neihuang County—such as Zhanglong, Mashang, and Beiguo—experienced relative declines, indicating a slower pace of development compared to the regional average level.
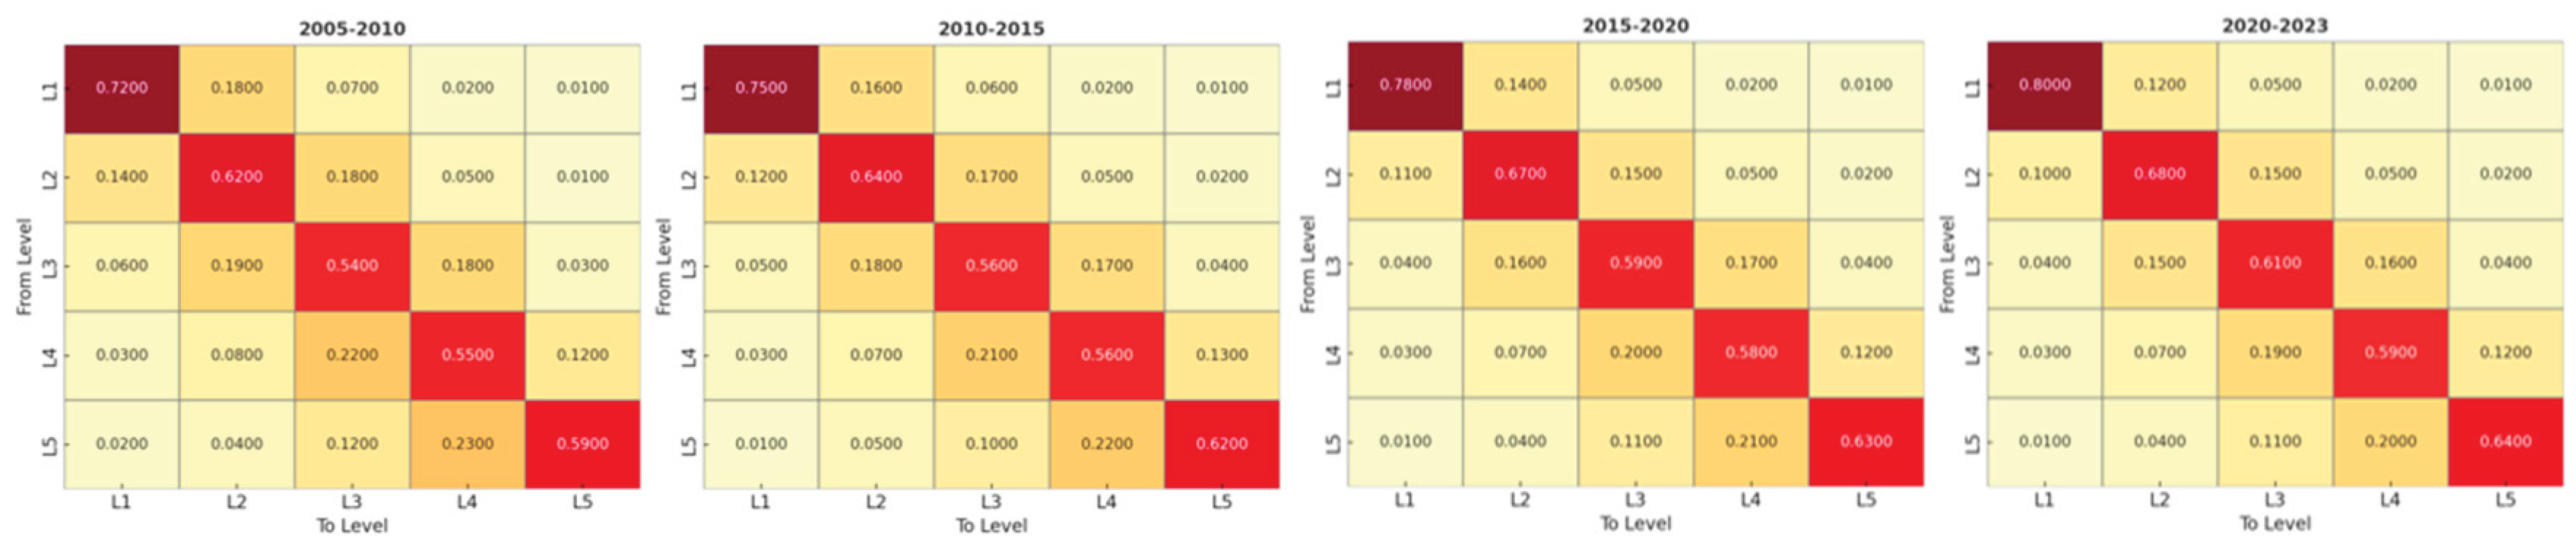
The Markov transition matrix demonstrates that LED in Anyang maintained a relatively high degree of stability between 2005 and 2023 (Table 2). Low-level areas exhibit the highest probability of persistence, indicating long-term stagnation and limited upward mobility. High-level areas also show strong stability, reflecting the consolidation of advantages in core urban districts and key development zones. In contrast, middle-level areas display greater mobility, particularly at the lower-middle level, which shows potential for both upward transition and downward regression. Relatively high-level areas exhibit bidirectional shifts, suggesting that their trajectories are more sensitive to industrial upgrading and locational conditions. Overall, the evolution of LED is characterized by consolidation at both extremes—high-level agglomeration and low-level persistence—while middle levels act as the most dynamic component, consistent with the spatial pattern evolution observed in Figure 2.
The Markov transition matrices illustrate the stability and dynamics of LED level changes across different periods. Between 2005 and 2010, the majority of townships remained in their original categories, particularly at the low and high ends of the spectrum, reflecting strong stability. From 2010 to 2015, transitions became more pronounced, especially from Level 2 to Level 3, indicating upward mobility in LED development during the expansion stage. The period 2015 to 2020 exhibits the most balanced structure, with significant probabilities of persistence but also notable transitions across adjacent levels, consistent with the quality enhancement phase. In the most recent period, 2020 to 2023, the transition matrix shows increased upward shifts from lower to higher levels, but also some reversals, particularly within intermediate categories, suggesting differentiation in development momentum across townships. Overall, the results highlight both the resilience of high-level areas and the mobility of middle-level areas, quantifying the spatial stability of LED evolution while revealing areas of potential vulnerability.
Figure 3.
Period-specific 5 × 5 Markov transition matrices of LED from 2005 to 2023.
Overall, from 2005 to 2023, the township-level LED in Anyang city exhibited a steady upward trend, with high-level areas increasingly concentrated in the central-western and southeastern regions. Economic growth, technological progress, and policy support jointly accelerated the development of the central urban districts and Huaxian county, exerting positive spillover effects on surrounding townships. In contrast, townships in the northwest and northeast, constrained by terrain and weak foundations, experienced limited improvement, leading to a gradual intensification of regional disparities.
3.2. Spatial Correlation of LED at Township Scale
Based on the exploratory spatial data analysis method, this study employed GeoDa software to conduct a global spatial autocorrelation analysis of township-level LED in Anyang (Figure 4). Furthermore, a local spatial autocorrelation analysis was performed to gain deeper insights into the spatial dynamics of regional economic development within Anyang (Figure 5).
From the perspective of spatial evolution, significant high–high clusters (HH areas) consistently appeared adjacent to urban districts, with small internal variability and strong spatial homogeneity, together forming regional economic highlands with surrounding townships. Their trajectory of change can be summarized as follows: emerging in Qugou Town in western Anyang in 2005, weakening in 2010 without a distinct HH cluster, expanding into a contiguous distribution south of the urban area in 2015, shrinking to Hanzhuang Town in Tangyin County in 2020, and reappearing south of the urban core in 2023, accompanied by newly emerging HH clusters in Huanghua Town, Heshun Town, and Xujia’gou Township of Linzhou.
Significant low–low clusters (LL areas) exhibited clear stage characteristics. Between 2005 and 2015, contiguous low-value zones formed in the southwest and east, reflecting lagging development, a lack of endogenous momentum, and inefficient land use. Since 2015, under the influence of coordinated development policies, the LL areas contracted markedly. By 2023, only three isolated points remained in Lücun Town, Xincun Town, and Dazhai Town, indicating a significant improvement in regional balance.
Significant high–low clusters (HL areas) and low–high clusters (LH areas) were scattered. HL areas were confined to Tongye Town between 2005 and 2010, expanded to include Dongzhuang Town in 2020, and shifted to Baizhuang Town in 2023. These zones were limited in scope and exhibited weak polarization effects, functioning as high-value enclaves with minimal spillover influence. LH areas, by contrast, appeared sporadically in the northwest and southeast, reflecting localized underperformance due to weak infrastructure and insufficient growth drivers, and were not significantly influenced by spillover effects from adjacent high-value areas.
Overall, from 2005 to 2023, township LED increased substantially, though spatial disparities persisted. Weak positive spatial correlation only appeared in 2015 and 2023, with limited clustering effects. Therefore, strengthening the radiative and spillover role of central urban districts and high-value areas is essential to improving land-use efficiency in surrounding townships and enhancing the city’s overall regional competitiveness.
3.3. Spatiotemporal Distribution Characteristics of LED
To illustrate the spatial evolution of LED in Anyang city, we apply the Standard Deviational Ellipse (SDE) method to quantitatively characterize its spatial distribution. By calculating key parameters such as the centroid coordinates, rotation angle, and the standard deviations of the major and minor axes (Table 3), the SDE method precisely identifies the spatiotemporal trajectory of the economic density centroid (Figure 6), thereby providing valuable insights into the spatial heterogeneity of regional development.
From the perspective of the overall ellipse pattern, the major axis of the standard deviational ellipse follows a northwest–southeast orientation, with the rotation angle θ increasing from 128.238° in 2005 to 130.349° in 2023. This indicates that between 2005 and 2023, township-level LED in Anyang consistently exhibited a northwest–southeast spatial configuration, which is consistent with the overall distribution of high-value areas described above. The flatness ratio increased from 0.432 to 0.445, suggesting an intensified polarization in spatial distribution, driven by the rapid rise in LED in the townships of Linzhou and Huaxian counties.
In terms of the ellipse centroid, the trajectory first shifted rapidly toward the northwest and then swung back toward the southeast, with the centroid located in Fudao and Chengguan towns in Tangyin County in the northern part of central Anyang. This reflects that from 2005 to 2015, the central and western regions of Anyang experienced faster growth in LED than the eastern regions, corroborating the rapid economic growth of Linzhou during this period. Since 2015, however, the northwestward shift slowed significantly, and after 2020 the centroid began to move southeastward. This reversal was mainly driven by the transformation and innovation of traditional industries in Huaxian county. On the one hand, it improved land productivity through agricultural modernization and industrialization, and on the other hand, it fostered emerging leading industries such as new energy materials and equipment manufacturing, thereby restructuring the regional industrial system.
3.4. Influencing Factors of Township LED Pattern
This study constructed an index system covering five dimensions—economic development foundation, industrial structure optimization, locational advantages, government support, and natural conditions—to quantitatively analyze the influencing factors of township LED. Data were mainly obtained from the China County Statistical Yearbook (Township Volume), the Anyang Statistical Yearbook, and township government work reports. To ensure the scientific rigor and reliability of the results, both ordinary least squares and geographically weighted regression models were employed for comparative analysis, in order to capture both overall effects and spatial heterogeneity of the influencing factors.
The OLS regression was used to examine the relationships between township LED and the selected explanatory variables. As shown in Table 4, all variables passed the significance test, confirming that these five dimensions exert significant impacts on township LED in Anyang. Furthermore, the variance inflation factor (VIF) values for all variables were below 7.5, indicating no severe multicollinearity, thus, all variables could be retained in the regression model.
The selected indicators were fitted using both the OLS and GWR models, and the results showed that the overall fit of the OLS model was inferior to that of the GWR model (Table 5). This indicated that the GWR model was more effective in capturing the spatial heterogeneity of the data and demonstrated superior fitting performance. Based on this comparison, the GWR model was subsequently applied to further explore the spatial heterogeneity of influencing factors, with the spatial distribution patterns and local variations of the regression coefficients (Figure 7)
Overall, the influencing factors of township LED in Anyang city exhibited pronounced spatial heterogeneity. The economic development foundation exerted a consistently positive effect across the region, serving as the core driving force for improving LED. Industrial structure optimization and locational advantages were more prominent in the western areas, reflecting the role of industrial upgrading and improved transportation in enhancing land-use efficiency. Government support showed a gradient increasing from northwest to southeast, highlighting the critical role of policy guidance in promoting efficient land resource utilization. Natural conditions displayed a “higher in the east, lower in the west” pattern, indicating that terrain remained an important constraint on LED levels.
3.5. Spatial Zoning Optimization Scheme Based on LED Pattern
Drawing on the LED evaluation results, the analysis of influencing factors, and the current situation, this study aligned with a multi-level “point–line–area” spatial framework to propose an optimized spatial organization pattern for Anyang City as “One Core–Four Poles, Three Axes–Five Zones”. The proposal comprehensively considered regional economic development, existing plans, transportation conditions, topography, and administrative divisions, with the aim of advancing high-quality township development.
Following the principle of development potential, a basic spatial configuration was established. Areas adjacent to the central city and those in the southeast were designated as high-potential zones, the northeast and west as medium-potential zones, and the eastern and western peripheries as low-potential zones, which were characterized by topographic constraints, economic foundations, and distance from the urban core.
In line with the principles of planning alignment, the functional zoning was optimized. The central urban districts of Anyang, together with the counties of Tangyin, Linzhou, and Neihuang, were designated as comprehensive-type townships due to their higher economic levels, faster industrial development, and political–cultural functions. Yaocun, Hejian, and Shuiye counties, where secondary industry was rapidly expanding, were classified as industrial-type townships. Resource-rich and suitable areas in the east were designated as tourism service–oriented townships.
Guided by transportation corridors and topographic differentiation, regional coordination was promoted. The Beijing–Guangzhou development axis and the Zhengzhou–Jinan high-speed rail economic belt were leveraged to form two major growth axes. The western hilly–mountainous belt, with favorable ecological conditions, was delineated as an environmental protection and ecotourism zone, while the eastern plain, with substantial farmland potential, was positioned as a specialized agricultural production zone.
Finally, with administrative boundaries defining implementation edges, five zones were formed: (1) an Environmental Protection and Eco-tourism Zone, (2) a High-end Equipment Manufacturing Industrial Cluster, (3) a Peri-urban Industry and Cultural–Historical Tourism Zone, (4) a Specialized Agriculture and Green Ceramics Production Zone, and (5) an Agro-product Deep Processing Zone (Figure 8).
Based on the above planning principles, the “One Core–Four Poles, Three Axes–Five Zones” scheme was described as follows. The “One Core–Four Poles” framework designated Baibi Town in the central urban area of Anyang as the core city, with the urban areas of Linzhou and the county seats of Tangyin, Huaxian, and Neihuang as the four poles. Together, they formed the dominant centers of regional development as well as functional hubs for different industrial zones. The “Three Axes–Five Zones” framework referred to a linkage system that relied on the Linzhou–Nanlecheng development axis, the Beijing–Guangzhou development axis, and the Zhengzhou–Jinan high-speed rail economic axis to connect the central city, county centers, and key townships. The five functional zones included the Western Mountainous Environmental Protection and Eco-tourism Zone, the Central–Western Hilly High-end Equipment Manufacturing Cluster, the Central–Eastern Alluvial Plain Peri-urban Industry and Cultural–Historical Tourism Zone, the Northeastern Alluvial Plain Specialized Agriculture and Green Ceramics Production Zone, and the Southeastern Alluvial Plain Agro-product Deep Processing Zone. Each functional zone was designed in accordance with local resource endowments and industrial strengths, emphasizing specialization and distinct development paths.
5. Discussion
This study adopts the township as the basic analytical unit to investigate the spatiotemporal evolution of land economic density in Anyang. Compared with the conventional city- or county-level approaches [34,35], the township scale enables a more detailed portrayal of spatial heterogeneity in the interaction between land use and economic development. Although data acquisition and processing at this fine scale require considerable effort due to difficulties in accessibility and accuracy, the township perspective provides unique insights into intra-regional disparities and localized development mechanisms. The results not only reveal the internal differentiation of land economic density within Anyang but also demonstrate the methodological feasibility and academic value of advancing research to the township level.
Regarding the connotation and assessment of LED, existing studies have mostly relied on a single indicator, such as GDP or the area of construction land, to reflect the output efficiency of land resources. Such approaches, however, fail to capture improvements in the quality of economic development and social well-being [36]. To address this limitation, this study incorporated four dimensions—economic scale, industrial structure, agricultural modernization, and social security—into its indicator system, aligning with the requirements of high-quality development in the new era. This multidimensional approach not only breaks through the traditional limitation of prioritizing quantity over quality but also reveals the comprehensive performance of LED in achieving multiple objectives, including economic efficiency, industrial upgrading, and social welfare. As a key indicator of regional economic development and land-use efficiency, LED is shaped by both regional economic strength and land development intensity. Exploring its underlying influencing factors and mechanisms therefore holds great theoretical and practical significance, and can provide evidence to support the optimization of territorial spatial development patterns.
From a research perspective, future work should strengthen multi-scale and cross-regional comparative analyses to uncover the spatial differentiation and scale effects of LED. Expanding investigations across multiple spatial levels, such as villages, townships, counties, municipalities, and broader regions, would provide clearer insights. This approach can help reveal how the determinants and spatial patterns of LED vary across different scales [37]. Comparative studies across different types of cities, both within the national context and in specific urban agglomerations such as the Central Plains, could further test the transferability of township-scale findings and contribute to building a more generalizable theoretical framework.
From an application perspective, future studies should move beyond descriptive evaluation and introduce practical classification systems, such as distinguishing “high-value, low-value, upgrading, and lagging areas,” to support more targeted policy formulation. Linking such classification with national spatial planning and rural revitalization strategies would enhance the precision and operability of territorial spatial governance. Moreover, integrating dynamic monitoring systems and policy simulation models could provide decision-makers with forward-looking tools to allocate land resources more rationally, balance urban–rural development, and promote long-term sustainability.
6. Conclusions
This study, grounded in the concept of LED, established a multidimensional evaluation index system at township scale, using 86 townships in Anyang as research units. Drawing on five phases of data from 2005 to 2023, and combining spatial analysis methods with GIS visualization techniques, the study systematically assessed the spatiotemporal evolution and driving mechanisms of LED, and proposed a differentiated spatial optimization strategy. The main conclusions are as follows:
(1) LED in Anyang shows significant spatial differentiation and a continuous upward trend. High-value areas cluster around the peri-urban ring and the two cores of Linzhou and Huaxian, driven by construction industries and modern agriculture, while low-value areas persist in the northwestern and northeastern peripheries, constrained by topography and weak economic foundations. From 2005 to 2023, overall density improved markedly, but regional imbalances remained: high-value areas expanded and strengthened, low-value areas contracted yet stayed structurally stable, and some townships achieved upward transitions, reflecting the joint effects of path dependence and policy guidance.
(2) Spatial autocorrelation analysis indicates weak overall correlation but distinct local clustering. HH clusters expanded from isolated points into multi-centered patterns, reflecting the radiative role of the central city. LL clusters contracted into isolated points, underscoring the effectiveness of coordinated development policies. In contrast, HL clusters emerged as high-value enclaves with limited spatial spillover effects, whereas LH clusters reflected localized stagnation driven by weak infrastructure and insufficient growth momentum.
(3) Standard deviational ellipse analysis shows a persistent northwest–southeast orientation of LED, with the centroid following a “northwest shift-southeast return”. The initial northwestward movement was driven by the rapid growth of secondary industries in Linzhou, while the subsequent southeastward return was spurred by agricultural industrialization and emerging industrial clusters in Huaxian, underscoring the pivotal role of industrial policies in reshaping spatial patterns.
(4) Regression results demonstrate that economic foundation, industrial structure optimization, and government support are the primary driving forces, whereas natural conditions and local advantages play a limited role, highlighting the predominance of human-driven factors. Accordingly, a “One Core–Four Poles, Three Axes–Five Zones” optimization framework is proposed: strengthening the leading role of the central city, fostering four secondary growth poles, constructing three major development axes along transportation corridors, and delineating five functional zones. This framework aims to achieve differentiated development, enhance regional coordination, and improve overall land-use efficiency and competitiveness.
Author Contributions
Methodology, Jiayuan Mao; Formal analysis, Zechen Wang and Jiayuan Mao; Investigation, Xin Shen; Data curation, Xin Shen; Writing – original draft, Xin Shen; Writing – review & editing, Zechen Wang and Shiliang Liu; Visualization, Zhangyanyang Yao; Project administration, Shiliang Liu; Funding acquisition, Shiliang Liu.
Funding
research was funded by National Natural Sciences Fund Project, grant number 4227109; National Key Research and Development Project, grant number 2022YFF1303204.
Conflicts of Interest
The authors declare no conflict of interest.
References
- Li: Z.; Jiao, L.; Zhang, B.; Xu, G.; Liu, J. Understanding the Pattern and Mechanism of Spatial Concentration of Urban Land Use, Population and Economic Activities: A Case Study in Wuhan, China. Geo-Spat. Inf. Sci. 2021, 24, 678–694. [CrossRef]
- Shang, Y.; Zheng, X.; Han, R.; Liu, W.; Xiao, F. Long-Term Evaluation on Urban Intensive Land Use in Five Fast-Growing Cities of Northern China with GEE Support. Sci. Rep. 2021, 11, 20734. [CrossRef]
- Zhu, C.; Sun, Y.; Xu, H. Cropland Non-Agriculturization and Agricultural Green Development: Evidence from the Yangtze River Economic Belt, China. Heliyon 2025, 11, e26138.
- Muthuswamy, V.V.; Esakki, S. Driving Forces of Economic Prosperity: Agriculture and Non-Agriculture Dynamics in Food Production Value. Future Food J. Food Agric. Soc. 2024, 12, 1–12. [CrossRef]
- Chen, L.; Shen, W. Spatiotemporal Differentiation of Urban–Rural Income Disparity and Its Driving Force in the Yangtze River Economic Belt during 2000-2017. PLoS ONE 2021, 16, e0245961. [CrossRef]
- Zhao, Z.; Cai, Y. Research on the Spatial Differences and Network Structure of Economic Development in the Yangtze River Belt, China. Sustainability 2024, 16, 5023. [CrossRef]
- Mahtta, R.; Fragkias, M.; Güneralp, B.; Mahendra, A.; Reba, M.; Wentz, E.A.; Seto, K.C. Urban Land Expansion: The Role of Population and Economic Growth for 300+ Cities. npj Urban Sustain. 2022, 2, 5. [CrossRef]
- Zhang, C.; Lv, W.; Liu, G.; Wang, Y. Multidimensional Spatiotemporal Autocorrelation Analysis Theory Based on Multi-Observation Spatiotemporal Moran’s I and Its Application in Resource Allocation. Earth Sci. Inform., 2025, 18, 36. [CrossRef]
- Du, Z.; Ji, X.; Liu, J.; Zhao, W.; He, Z.; Jiang, J.; Yang, Q.; Zhao, L.; Gao, J. Ecological Health Assessment of Tibetan Alpine Grasslands in Gannan Using Remote Sensed Ecological Indicators. Geo-Spatial Information Science 2025, 28(1), 246–264. [CrossRef]
- Lai S, Li X, Jiang W, et al. Evaluating the Sustainability of Ecological Quality in Inner Mongolia Autonomous Region: Bridging the Millennium Development Goals and Sustainable Development Goals[J]. Land Degradation & Development, 2025. [CrossRef]
- Xu, J.; Jiao, C.; Zheng, D.; Li, L. Agricultural Land Suitability Assessment at the County Scale in Taiyuan, China. Agriculture 2024, 14, 16. [CrossRef]
- Han, C. Study on the Transformation of Agricultural Economy in Anyang City under the Background of the Rural Revitalization Strategy. Modern Economic Management Forum. 2025, 2 (5). http://dx.doi.org/10.70711/memf.v2i5.6096.
- Guo, S.; Huang, J.; Zhang, X.; Zhu, G.; Wen, Y. LUCC-Based Analysis of Ecosystem Service Value Drivers in the South–North Water Transfer Central Line Recharge Area. Environ. Earth Sci. 2023, 82, 289. [CrossRef]
- Li, C.; Yu, K. Digital Communication and Preservation of Cultural Heritage in the Context of New Media: A Case Study of Anyang. Int’l J. Soc. Sci. Stud. 2024, 12, 16. [CrossRef]
- Li, Y. Research on Performance Evaluation System of Ecological Protection and Restoration Project of Mountains, Rivers, Forests, Fields, Lakes and Grass in Anyang City, Henan Province. Sichuan Environ. 2023, 42, 207–213.
- Robygd, J.; Harrie, L.; Martin, T. Spatial Multi-Criteria Analysis of Ground Conditions in Early Stages Railway Planning Using Analytical Hierarchy Process Applied to Viaduct-Type Rail in Southern Sweden. Eng. Geol. 2025, 348, 107962. [CrossRef]
- Saranya, A.; Sivakumar, V.; Satheeshkumar, S.; Logeshkumaran, A. Assessment of Flood Risk in the High Rainfall Coastal Area of Cuddalore Taluk, Southeast India, Using GIS-Based Analytic Hierarchy Process Techniques. J. Indian Soc. Remote Sens. 2024, 53, 67–80. [CrossRef]
- Zhou, R.; Chen, J.; Cui, S.; Li, L.; Qian, J.; Zhao, H.; Huang, G. A Data-Driven Framework to Identify Influencing Factors for Soil Heavy Metal Contaminations Using Random Forest and Bivariate Local Moran’s I: A Case Study. J. Environ. Manage. 2025, 375, 124172. [CrossRef]
- Song, X.; Sun, Y.; Wang, H.; Huang, X.; Han, Z.; Shu, Y.; Wu, J.; Zhang, Z.; Zhong, Q.; Li, R.; Fan, Z. Q. Uncovering Soil Heavy Metal Pollution Hotspots and Influencing Mechanisms through Machine Learning and Spatial Analysis. Environ. Pollut. 2025, 370, 125901. [CrossRef]
- Liao, Z.; Zhang, L. Accessibility and Influencing Factors of Leisure Agriculture Demonstration Sites in Guangdong Province Based on GWR Model. Sci. Rep. 2025, 15, 23422. [CrossRef]
- Dang, H.; Deng, Y.; Hai, Y.; Chen, H.; Wang, W. Characterization of Spatio-Temporal Evolution of Grain Production and Identification of Its Heterogeneity Drivers in Sichuan Province Based on Geodetector and GWR Models. Front. Sustain. Food Syst. 2025, 9, 1561910. [CrossRef]
- Liang, L.; Yang, N.; Qu, Z.; Wang, S.; Shi, Y.; Chen, X.; Sun, Y. Multi-Scale Spatial Pattern of Urban Land Economic Density and Its Influencing Factors in the Yellow River Basin. Sci. Geogr. Sin. 2021, 41(8), 1336–1344. [CrossRef]
- Zhao, H.; Zheng, H. Spatial Pattern Evolution and Influencing Factors of Land Economic Density in Yunnan Province. Hubei Agric. Sci. 2023, 62(4), 56–62. [CrossRef]
- Yang, Z.; Hong, Y.; Zhai, G.; Wang, S.; Zhao, M.; Liu, C.; Yu, X. Spatial Coupling of Population and Economic Densities and the Effect of Topography in Anhui Province, China, at a Grid Scale. Land 2023, 12, 2128. [CrossRef]
- Wang, Z.; Fu, H.; Liu, H.; Liao, C. Urban Development Sustainability, Industrial Structure Adjustment, and Land Use Efficiency in China. Sustain. Cities Soc. 2023, 89, 104338. [CrossRef]
- Shi, Y.; Zheng, Y.; Chen, D.; Yang, J.; Cao, Y.; Cui, A. Research on the Correlation between the Dynamic Distribution Patterns of Urban Population Density and Land Use Morphology Based on Human–Land Big Data: A Case Study of the Shanghai Central Urban Area. Land 2024, 13, 1547. [CrossRef]
- Msuya, I.; Moshi, I.; Levira, F. Land Pattern of Highly Urbanizing Cities: Change in Built-Up Area, Population Density and Spatial Development of the Sprawling Dar es Salaam City. Environ. Urban. Asia 2021, 12, S165–S182. [CrossRef]
- Ma, X.; Jiao, S. Comprehensive Analysis of Water Resources from the Perspective of Water Footprint and Water Ecological Footprint: A Case Study from Anyang City, China. Environ. Sci. Pollut. Res. 2023, 30, 2086–2102. [CrossRef]
- Tian, D.; Han, X.; Wu, R.; Guo, W.; Zhang, R.; Du, C. Seasonal Variations of Organic Pollutants in PM₂.₅ Within a Typical Industrial City in Central China. In Environmental Crisis: Pollution and Governance; Han, D., Khare, M., Li, S., Eds.; Environmental Science and Engineering; Springer: Cham, 2025; pp. 465–470. [CrossRef]
- Zhang, Z.; Wang, Y.; Wu, Z. Field Study of Thermal Comfort of the Elderly in Tree-Shaded Areas of Urban Parks in the Cold Area of China. Sci. Rep. 2025, 15, 23276. [CrossRef]
- Bezdan, A.; Bezdan, J.; Marković, M.; Mirčetić, D.; Baumgertel, A.; Salvai, A.; Blagojević, B. An Objective Methodology for Waterlogging Risk Assessment Based on the Entropy Weighting Method and Machine Learning. Catena 2025, 249, 108618. [CrossRef]
- Gong, S.; Pan, J.; Cao, F.; Xiao, K. The Spatio-Temporal Characteristics, Structural Evolution and Improvement Path of Health Sustainability in China. Acta Geographica Sinica 2025, 80(3), 620–642. [CrossRef]
- Xiang, S.; Huang, X.; Lin, N.; Yi, Z. Synergistic Reduction of Air Pollutants and Carbon Emissions in Chengdu–Chongqing Urban Agglomeration, China: Spatial-Temporal Characteristics, Regional Differences, and Dynamic Evolution. J. Clean. Prod. 2025, 493, 144929. [CrossRef]
- Pregi, L.; Novotný, L. Spatial Autocorrelation Methods in Identifying Migration Patterns: Case Study of Slovakia. Appl. Spat. Anal. Policy 2025, 18, 12. [CrossRef]
- Zhu, Y.; Ding, Y.; Qin, S. Investigating the Relationship between Social Deprivation and Health Outcomes in China: Using Spatial Regression Analysis Approach. BMC Public Health 2025, 25, 951. [CrossRef]
- Song, C.; Chen, Y.; Zhao, L.; Yin, G. Spatial–Temporal Evolution and Influencing Factors of Land Economic Density in Jinan Metropolitan Area. J. Nat. Sci. Hunan Norm. Univ. 2021, 44(4), 7–15. [CrossRef]
- He, B.; Bian, Y.; Yuan, Y.; Zhou, B. The Evolution and Driving Factors of Multi-Scale Spatial Pattern of Urban Land Economic Density in the Yangtze River Delta Region. J. Anhui Agric. Sci. 2025, 53(7), 198–204, 257. [CrossRef]
Figure 1.
Location map and township boundaries of Anyang city. (a) Location of Anyang City within Henan Province; (b) Administrative districts of townships.
Figure 1.
Location map and township boundaries of Anyang city. (a) Location of Anyang City within Henan Province; (b) Administrative districts of townships.

Figure 2.
Spatiotemporal evolution of township LED patterns in Anyang.
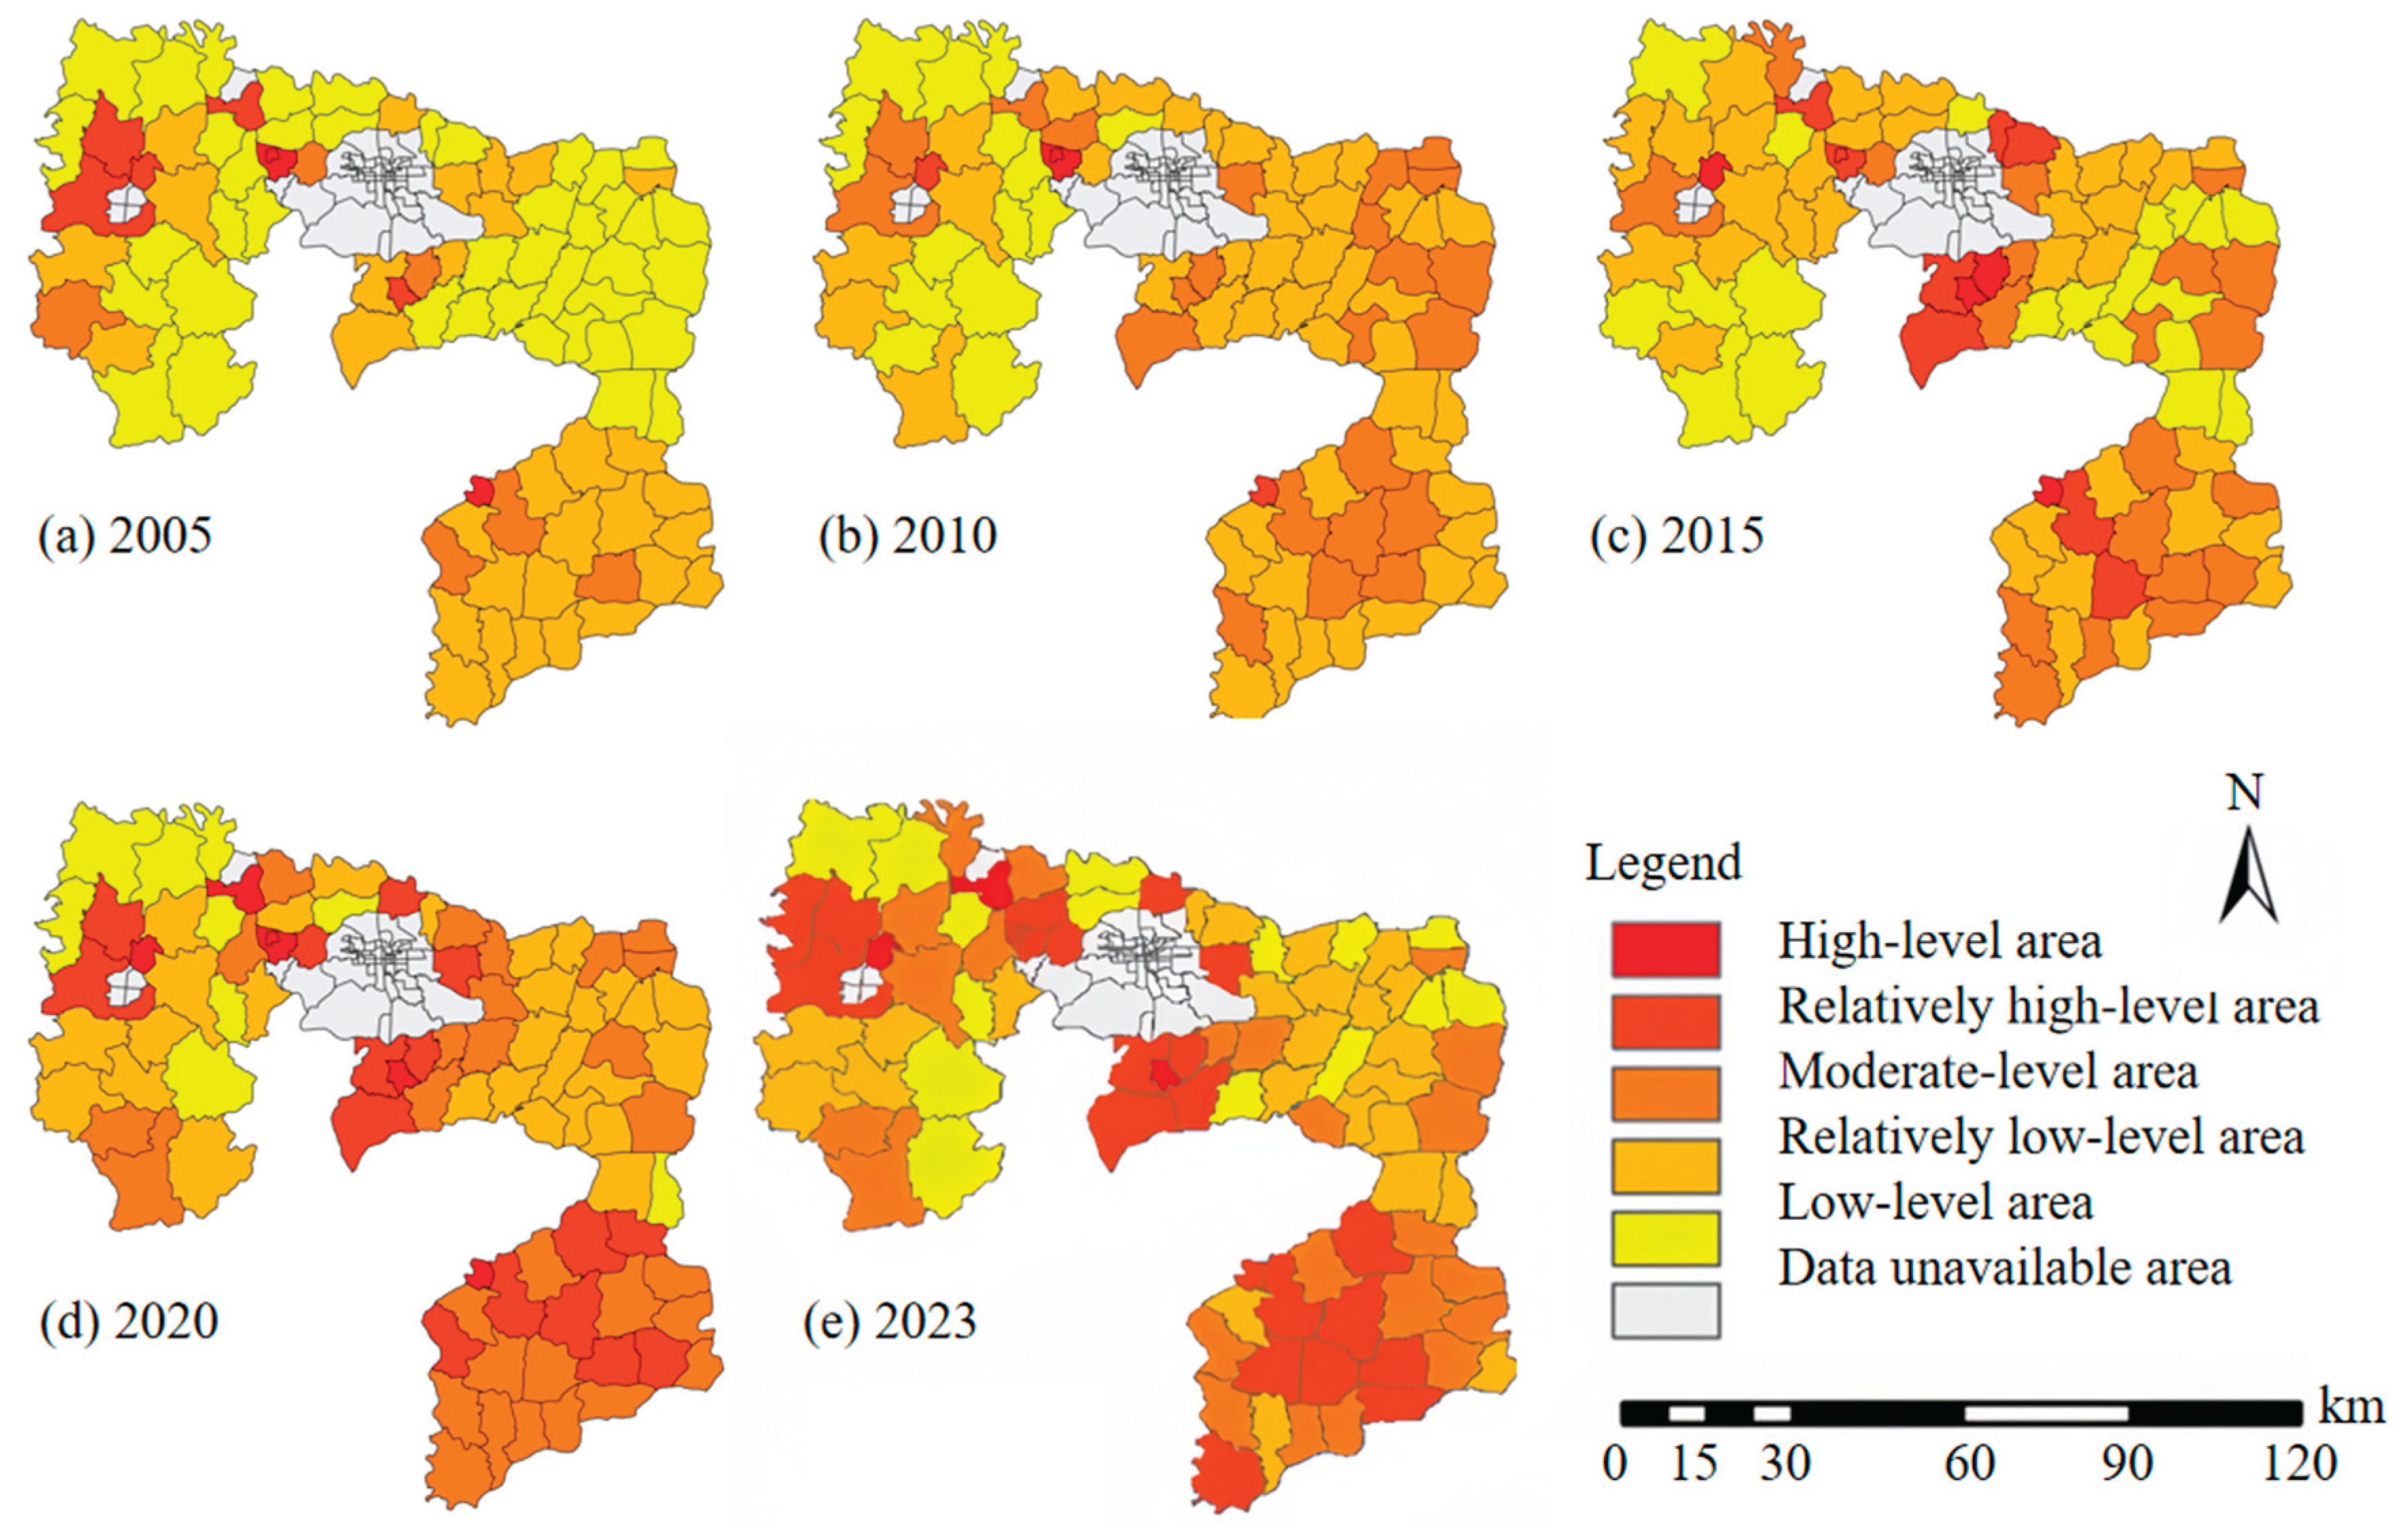
Figure 4.
Global spatial autocorrelation results of township-level LED in Anyang city.
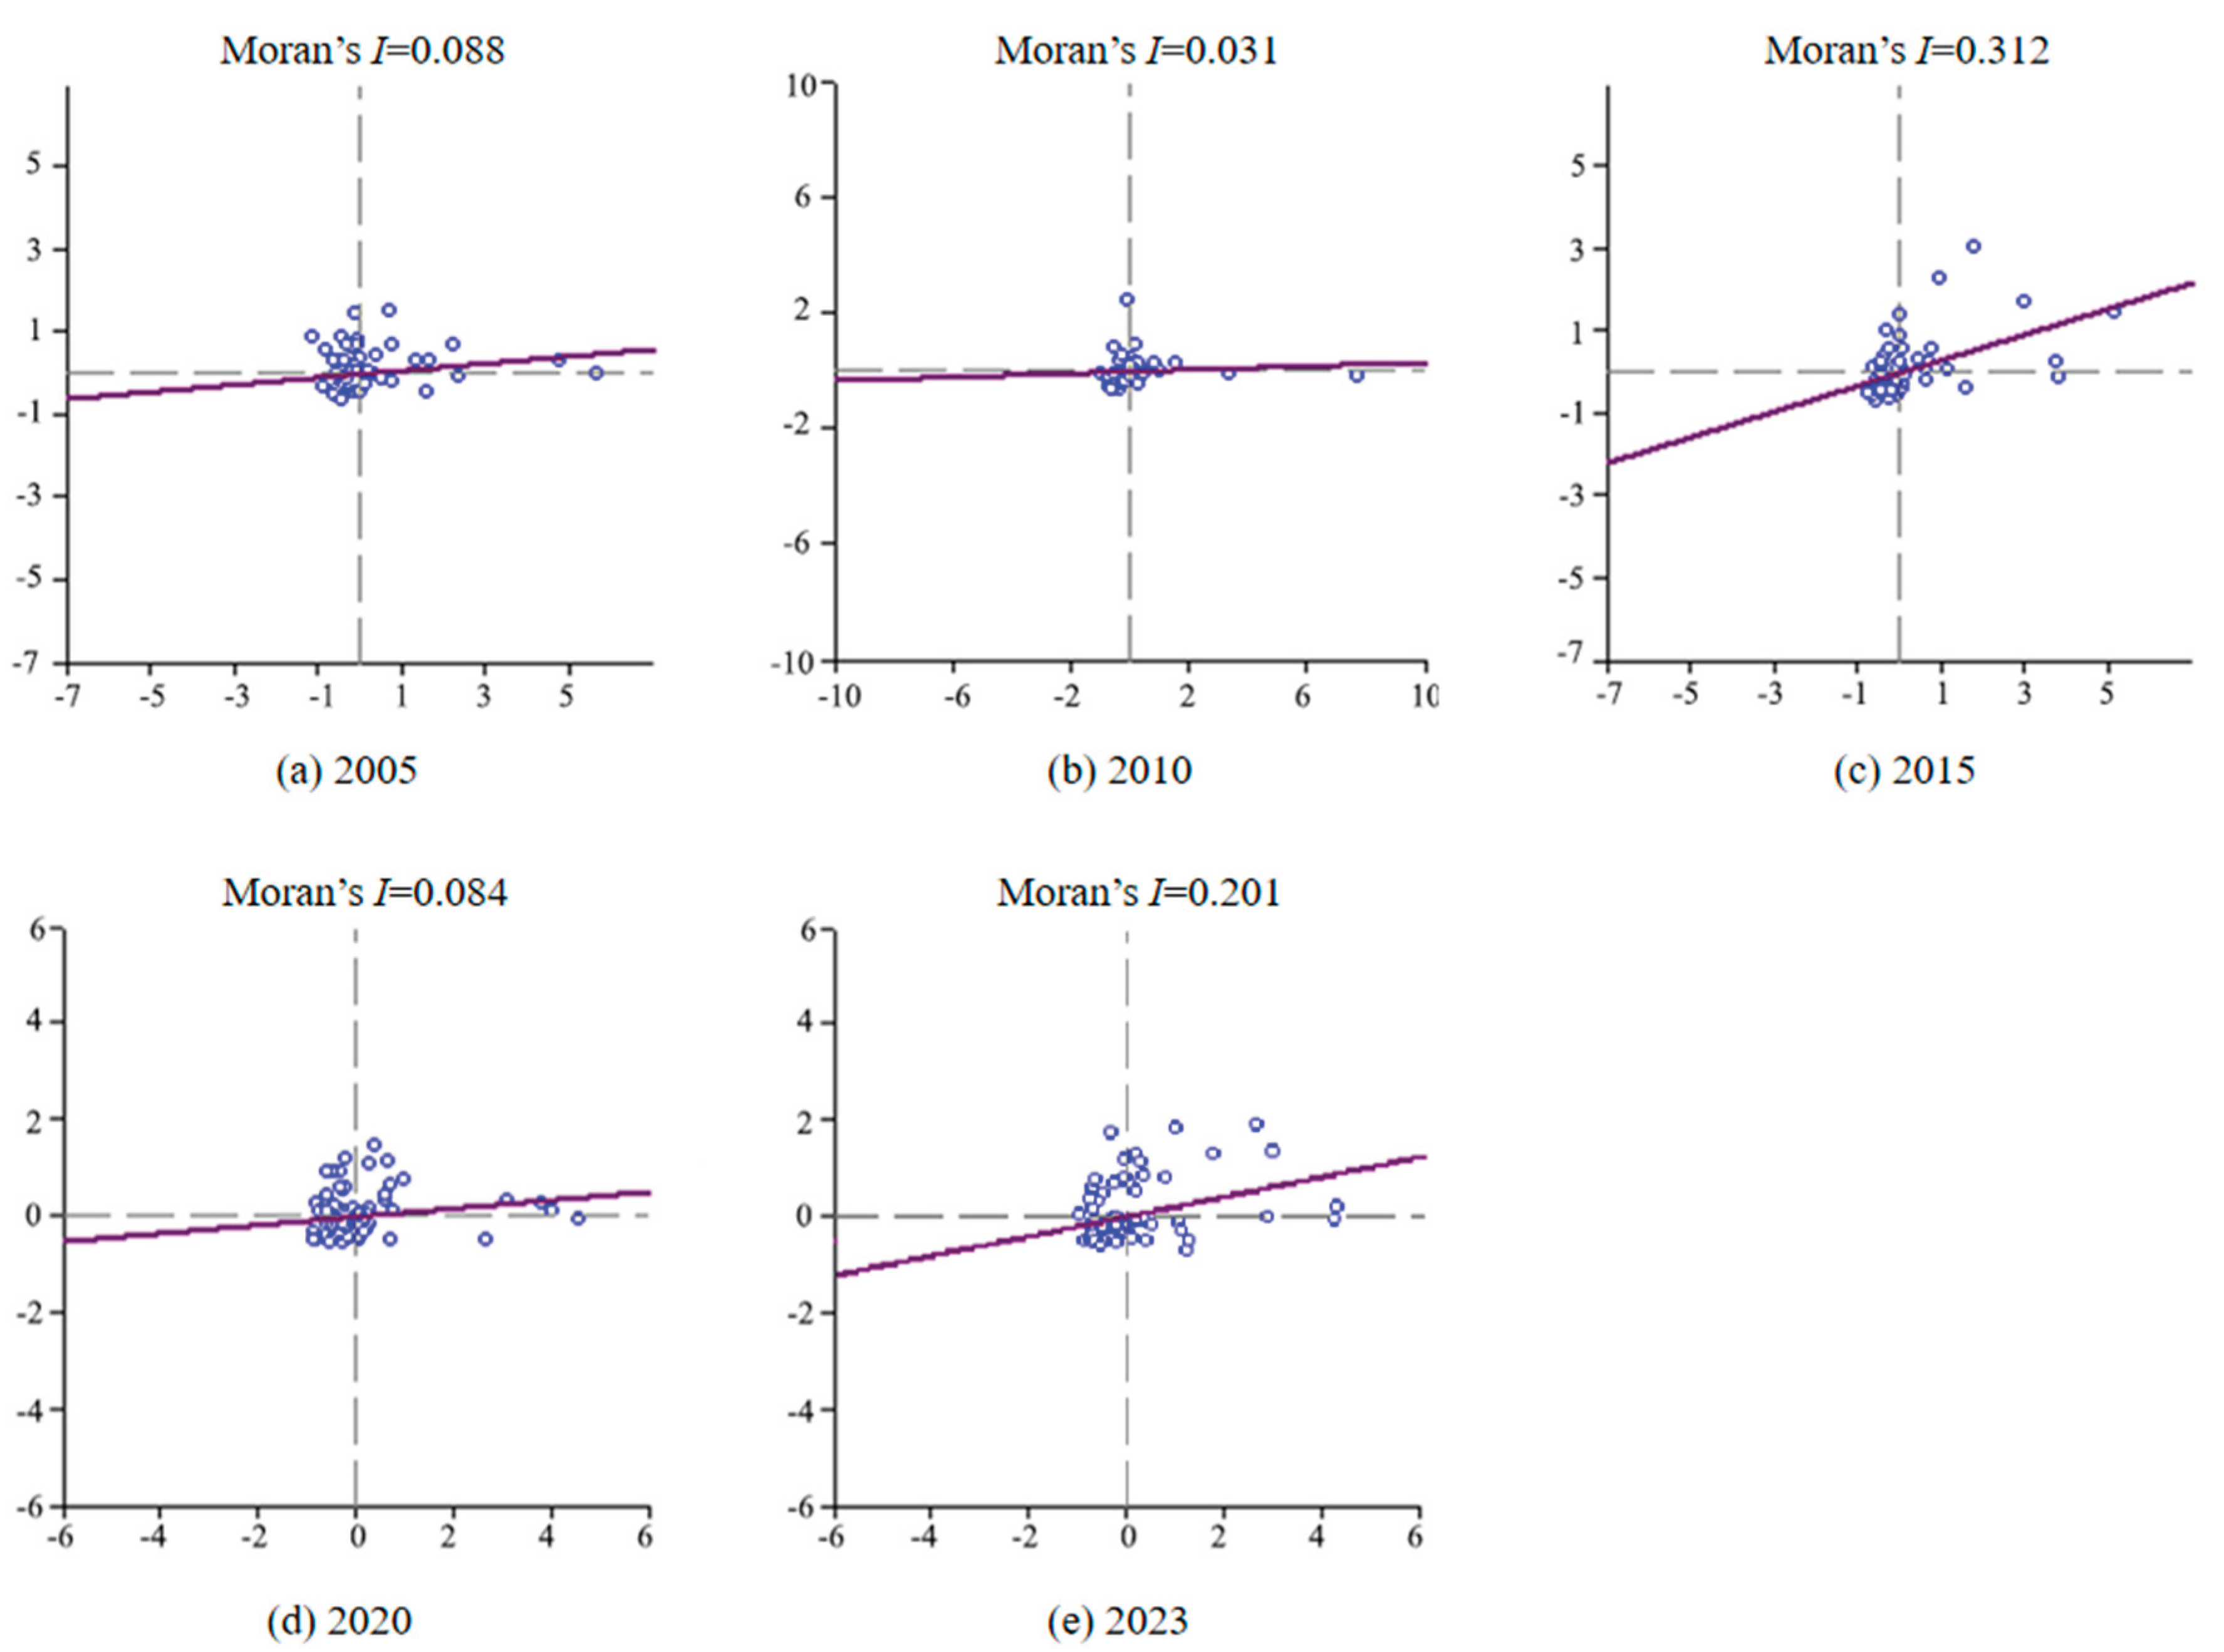
Figure 5.
Local spatial autocorrelation results of township-level LED in Anyang city.
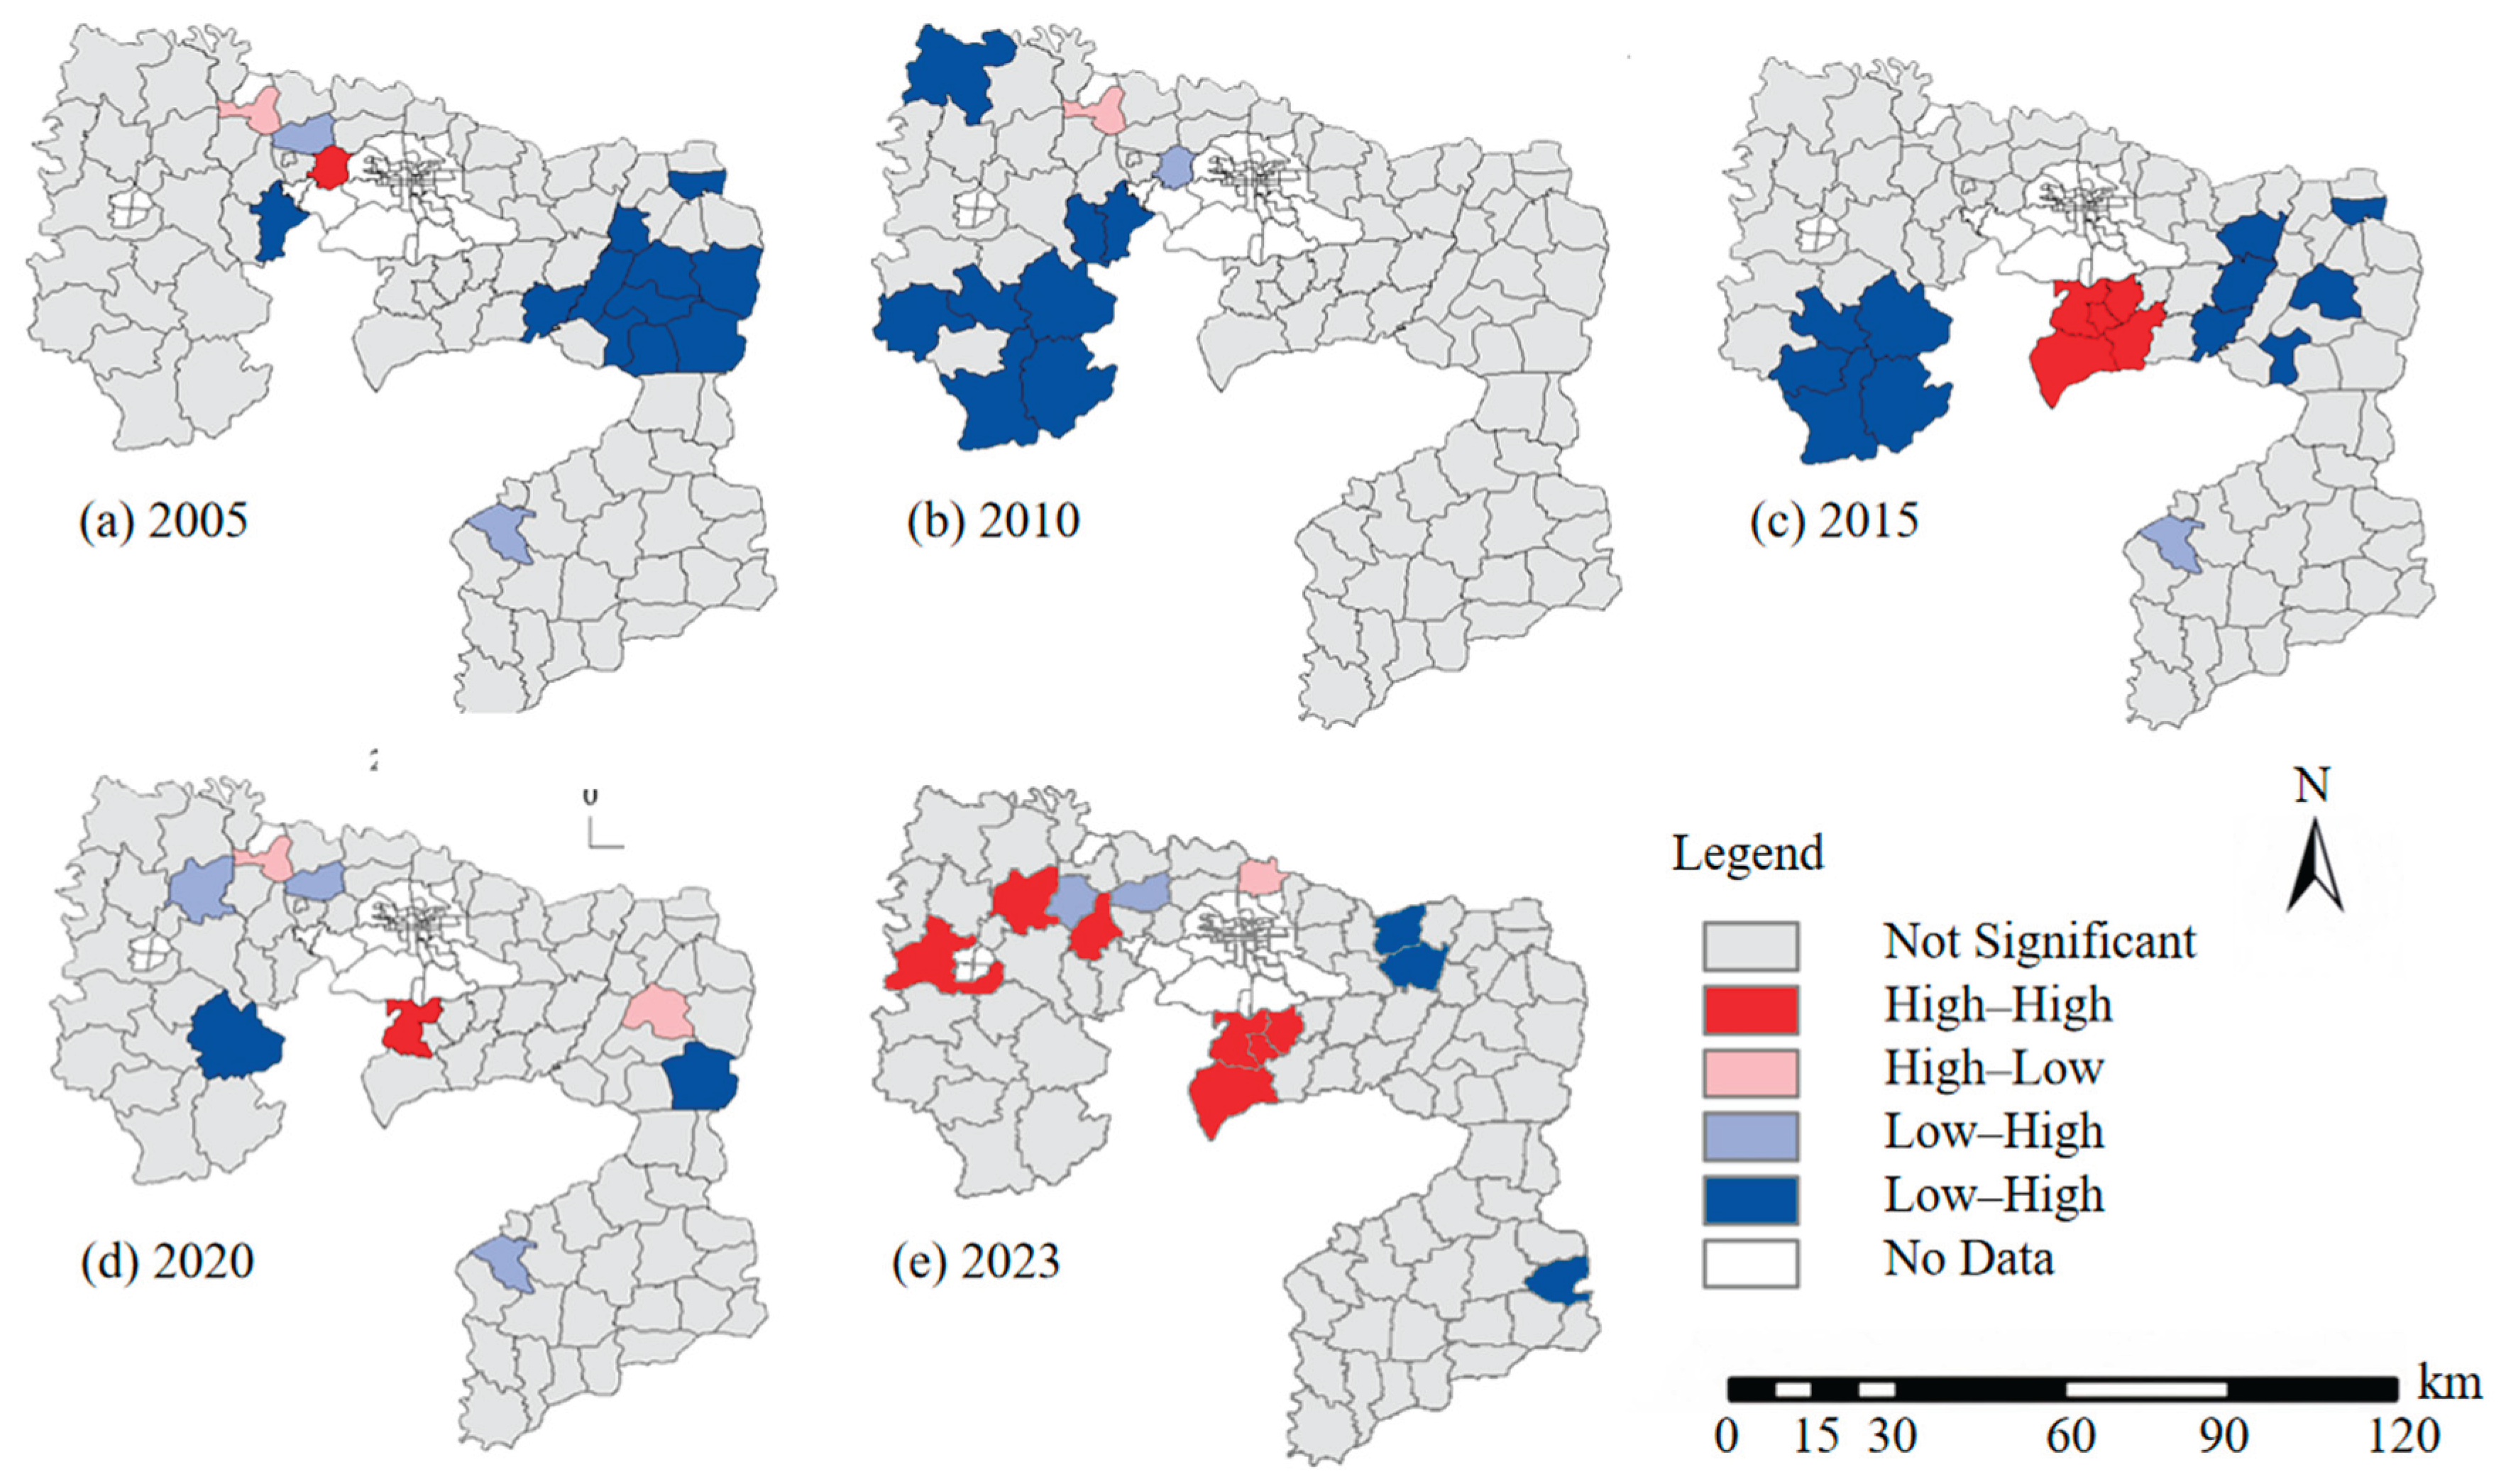
Figure 6.
Spatial evolution of the standard deviational ellipse of township-level LED in Anyang.
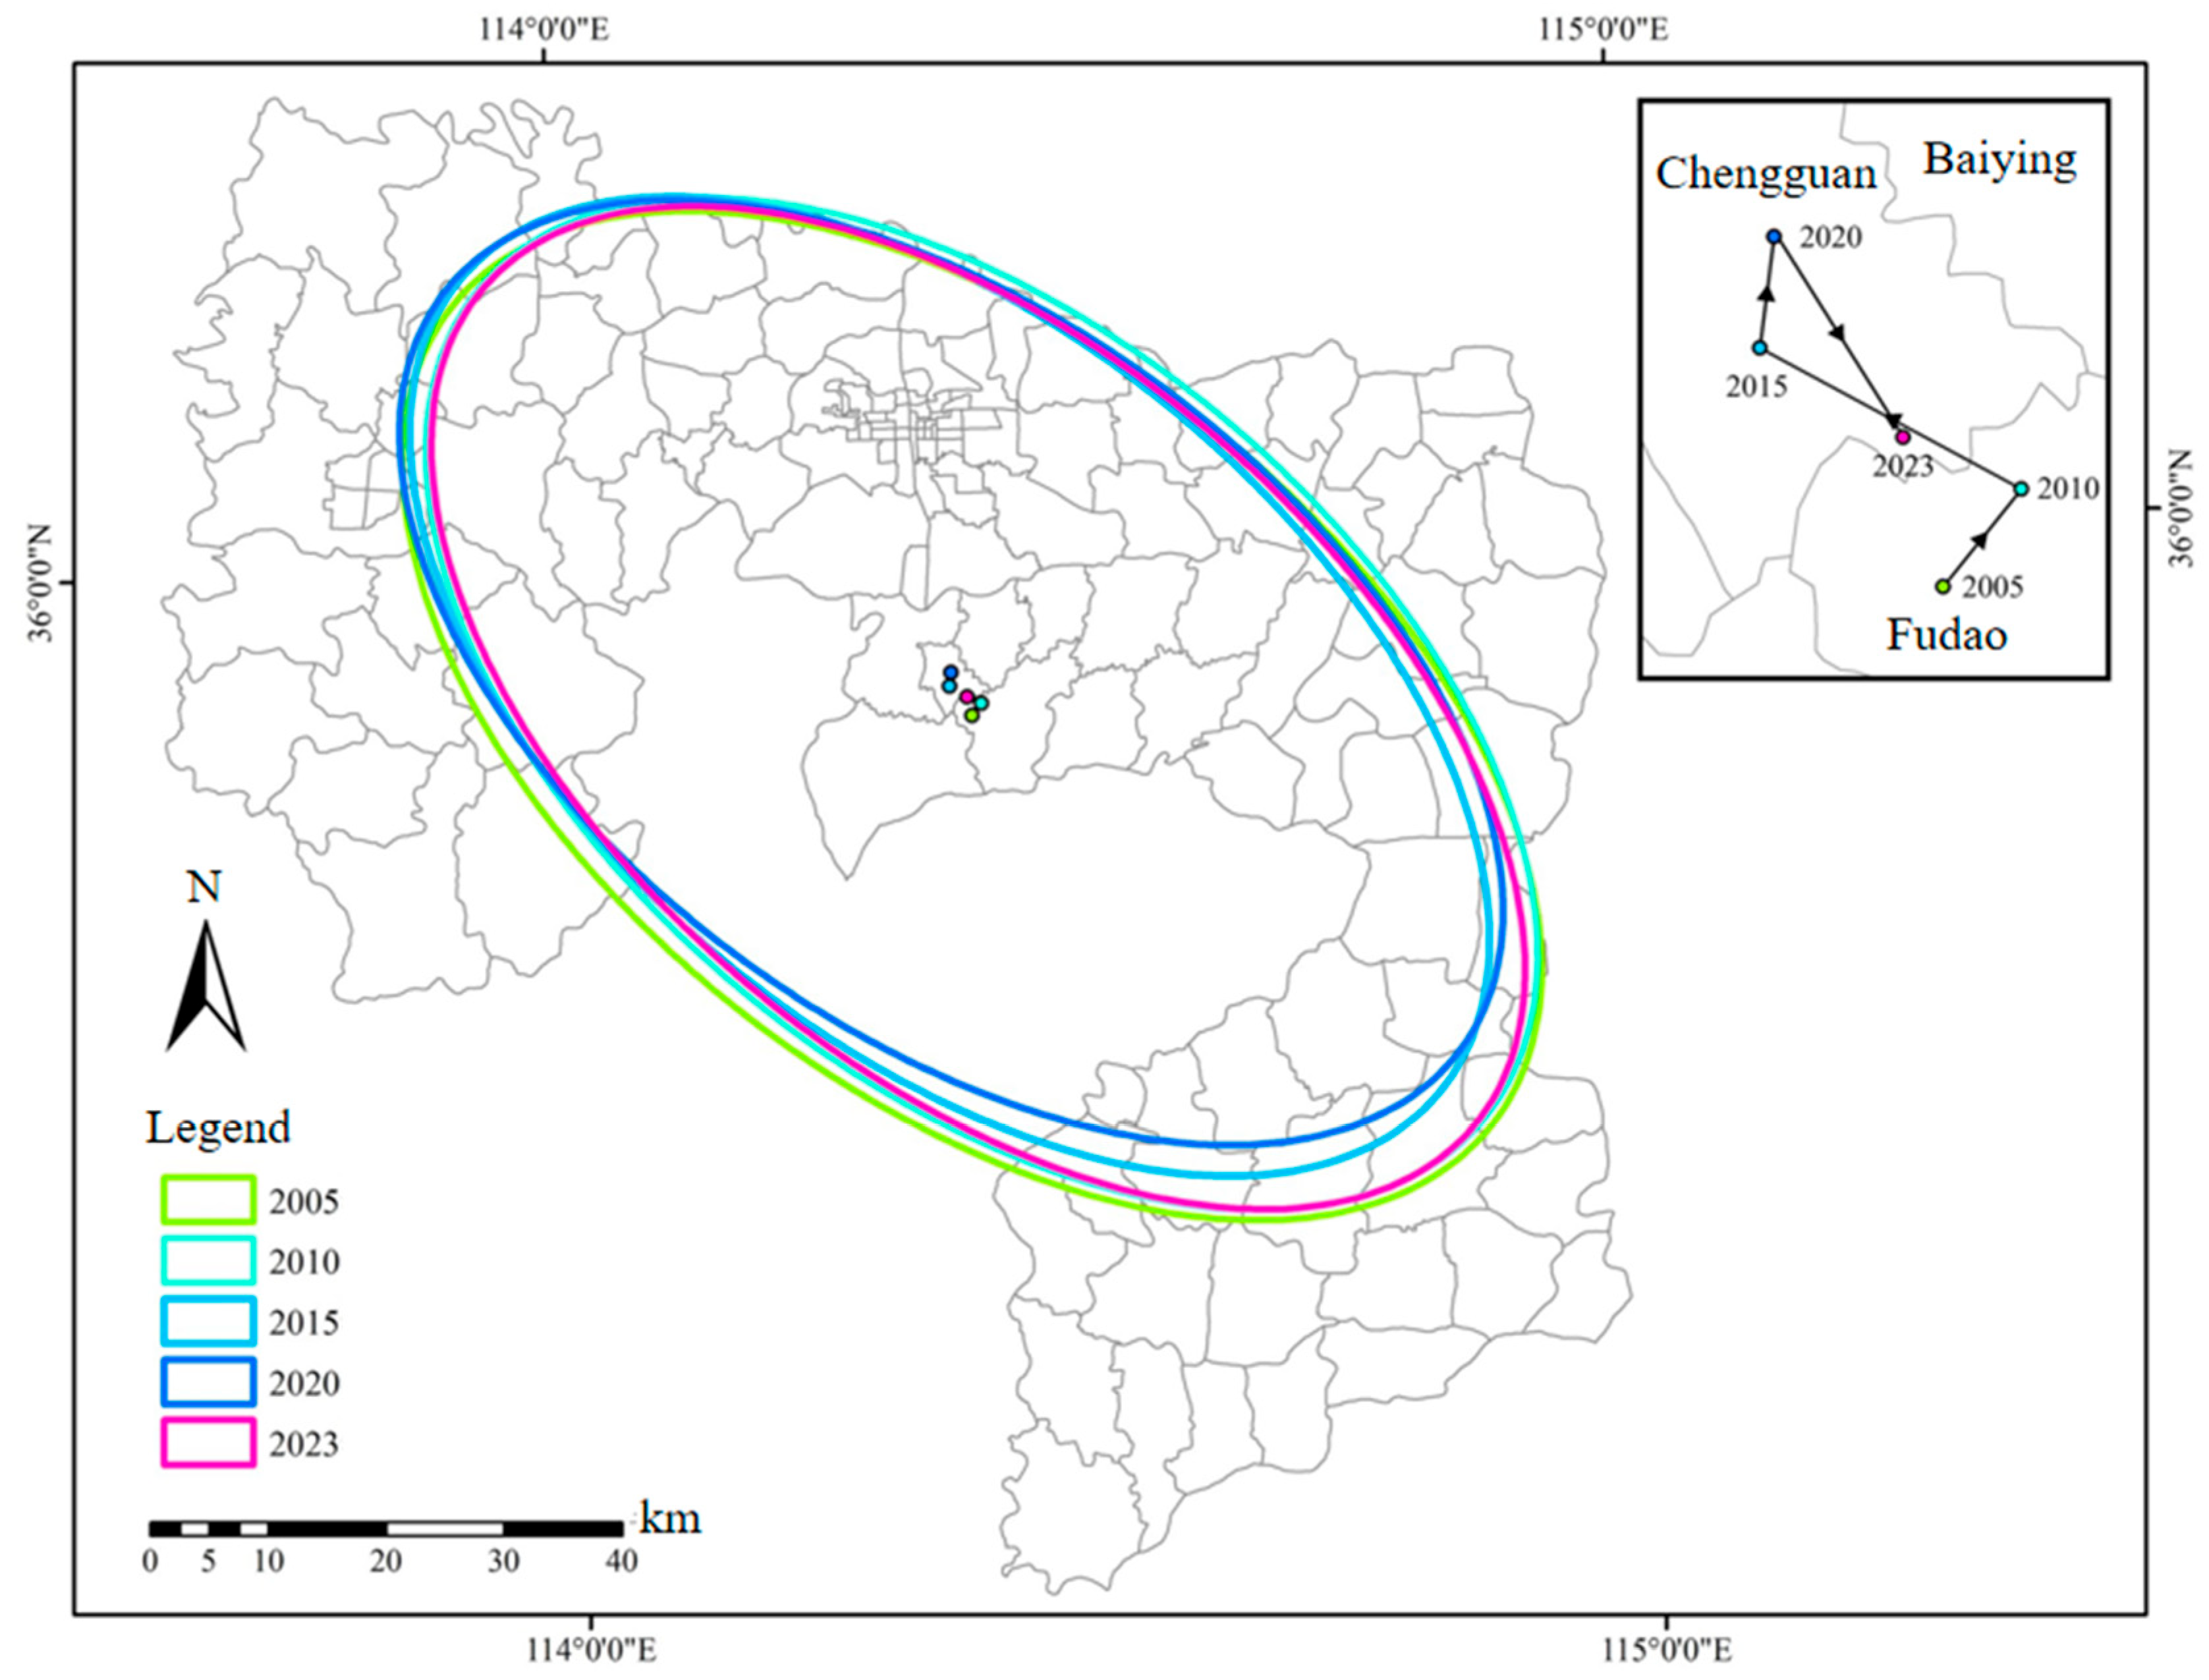
Figure 7.
Spatial distribution of regression coefficients for influencing factors of township-level LED in Anyang: (a) Economic development status; (b) Industrial structure optimization; (c) Locational advantage; (d) Government support intensity; (e) Natural conditions.
Figure 7.
Spatial distribution of regression coefficients for influencing factors of township-level LED in Anyang: (a) Economic development status; (b) Industrial structure optimization; (c) Locational advantage; (d) Government support intensity; (e) Natural conditions.
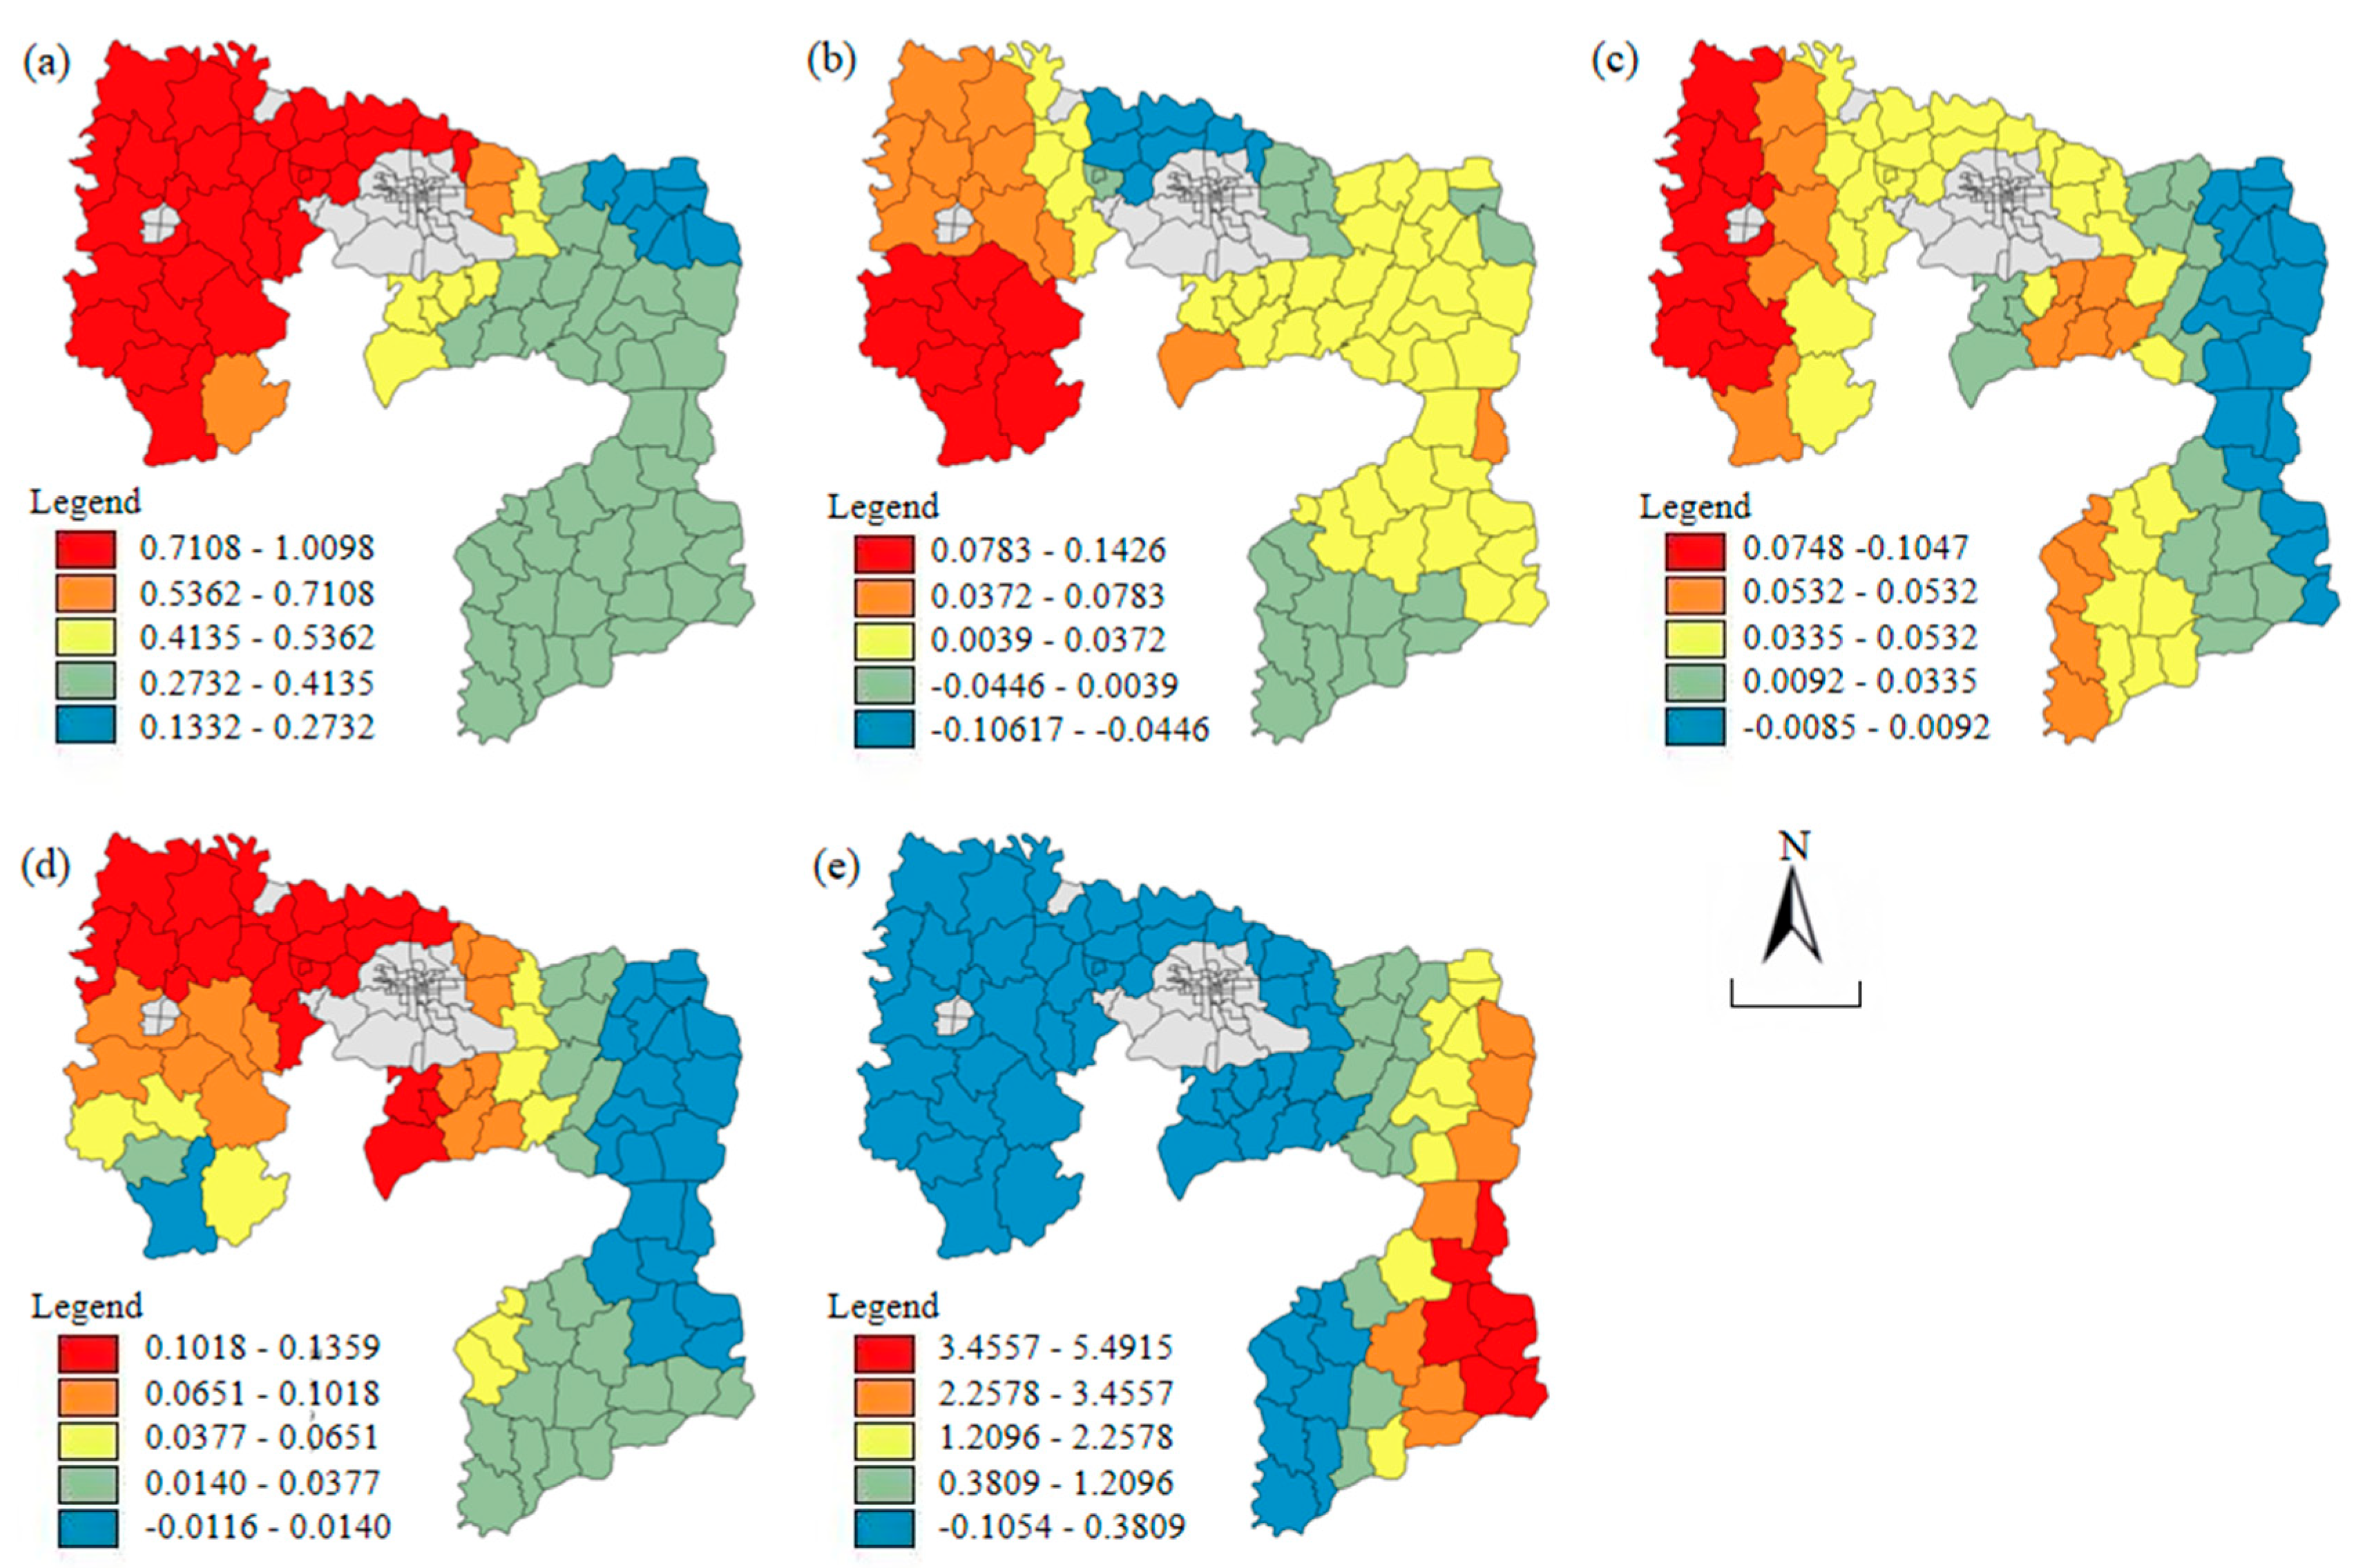
Figure 8.
Spatial optimization strategy for land use in Anyang.
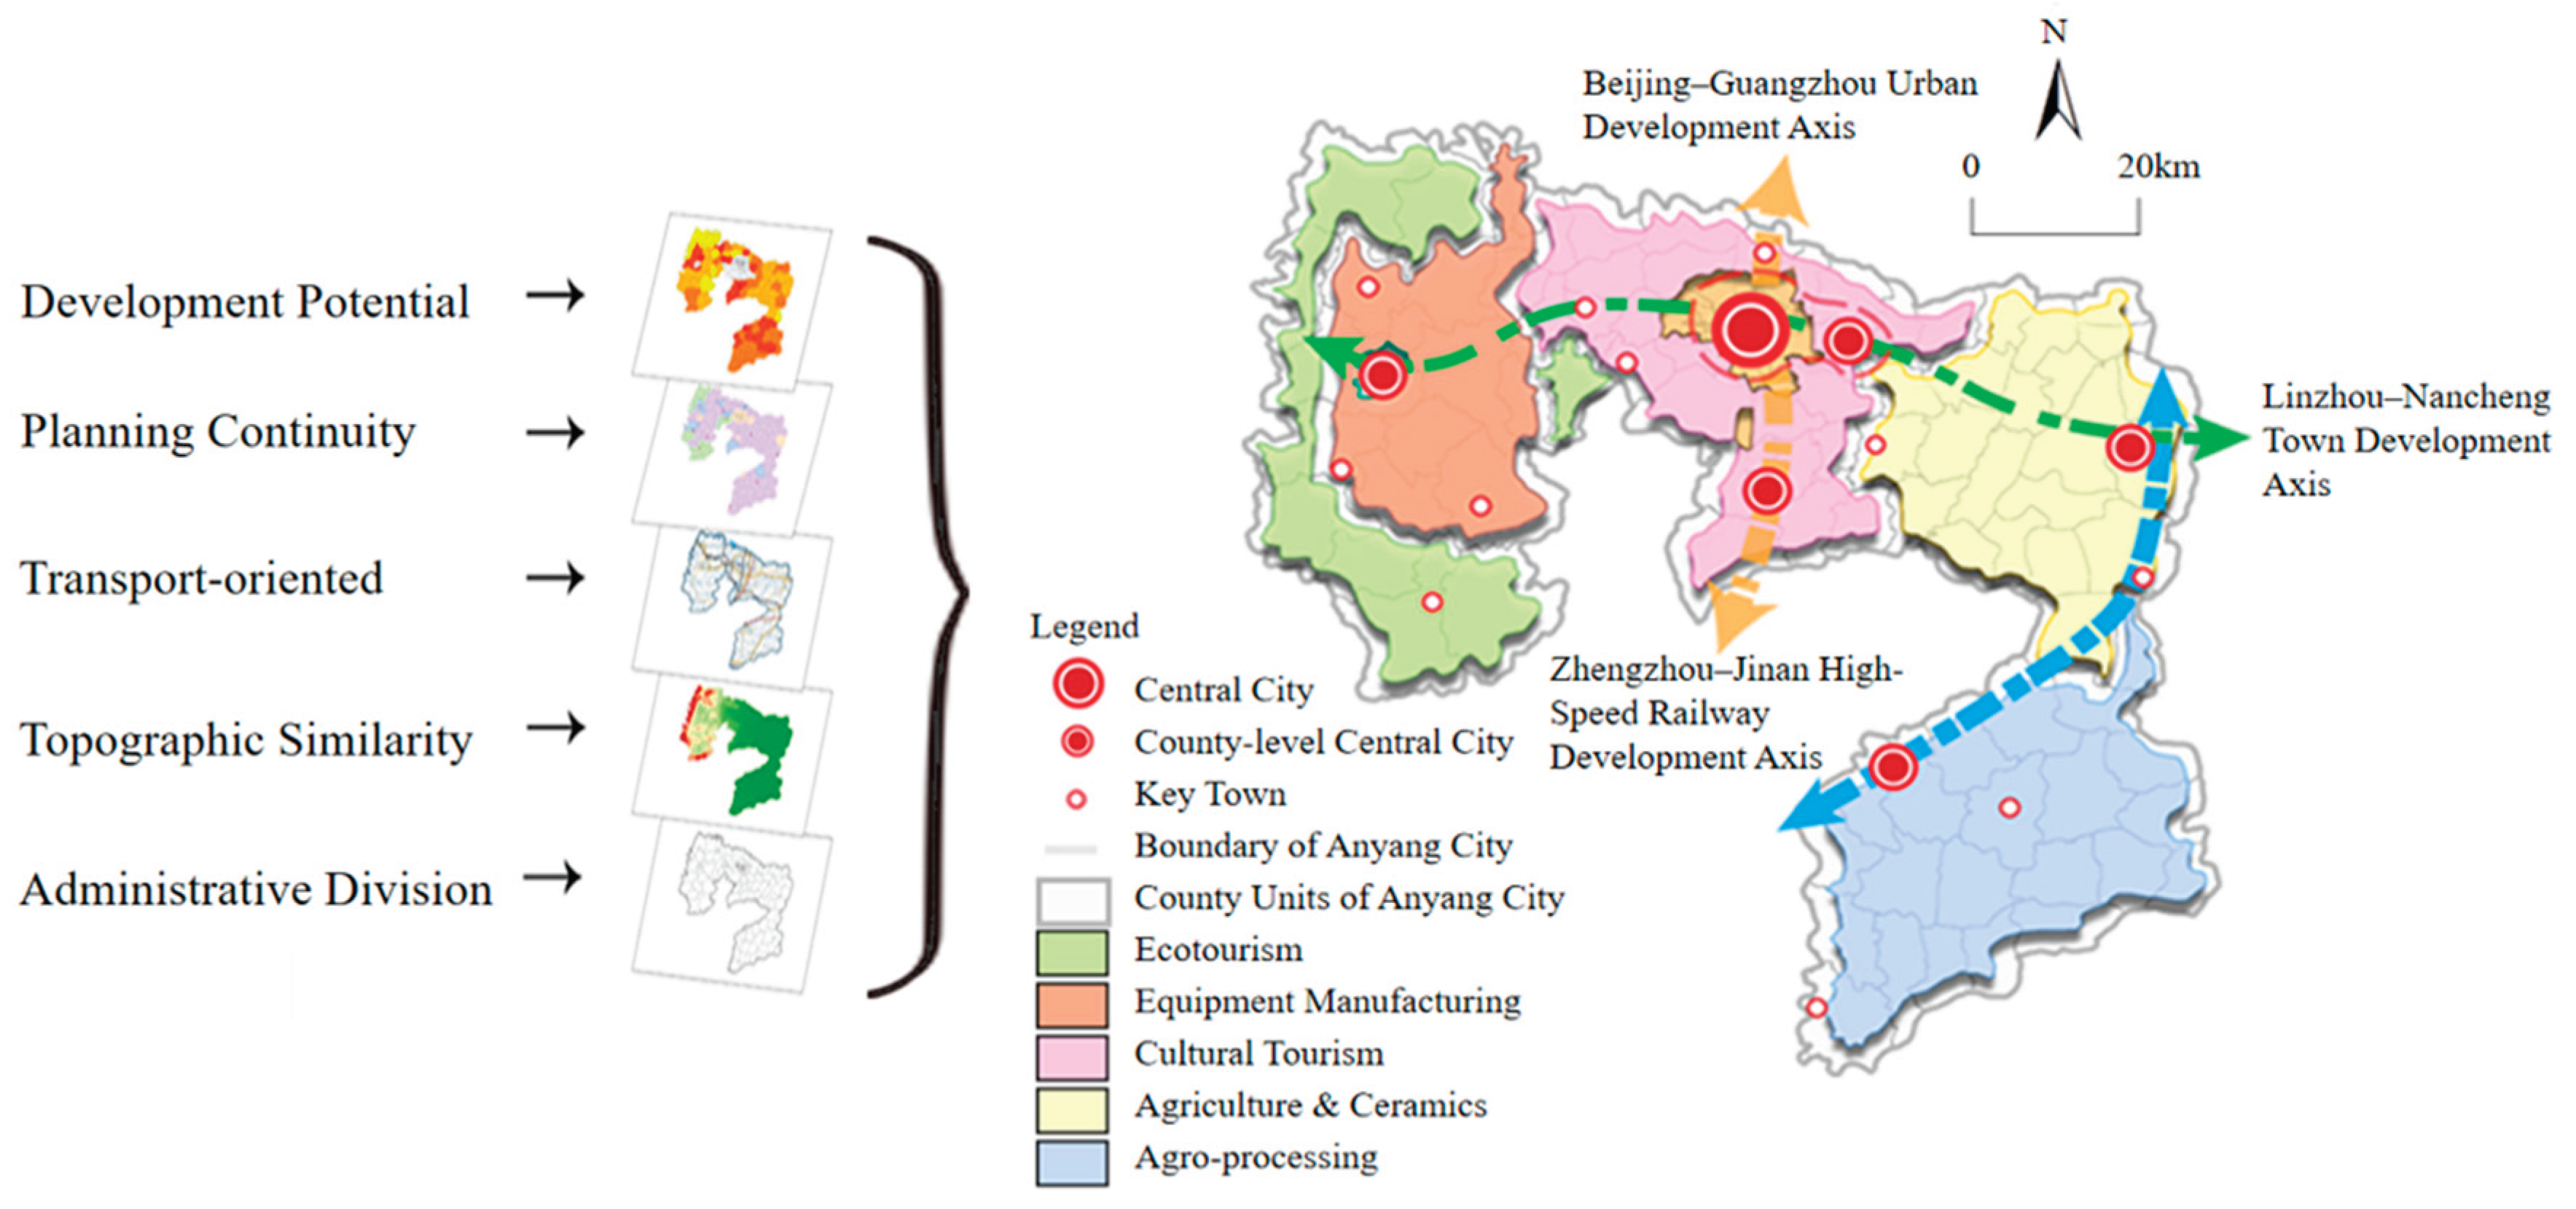
Table 2.
Markov transition probability matrix of LED levels in Anyang (2005–2023).
| Level 1 | Level 2 | Level 3 | Level 4 | Level 5 | |
| Level 1 | 0.8538 | 0.1383 | 0.004 | 0.004 | 0 |
| Level 2 | 0.5 | 0.3824 | 0.0882 | 0.0147 | 0.0147 |
| Level 3 | 0 | 0.5833 | 0.25 | 0 | 0.1667 |
| Level 4 | 0 | 0.4286 | 0.1429 | 0.4286 | 0 |
| Level 5 | 0 | 0 | 0.25 | 0.25 | 0.5 |
Table 3.
Parameters of the Standard Deviational Ellipse.
| Parameters | Township LED level | ||||
| 2005 | 2010 | 2015 | 2020 | 2023 | |
| Rotation angle θ | 128.238° | 129.701° | 129.717° | 126.496° | 130.349° |
| Length of semi-major axis (km) | 56.156 | 55.313 | 54.011 | 53.782 | 55.053 |
| Length of semi-minor axis (km) | 31.894 | 31.766 | 30.160 | 30.142 | 30.569 |
| Flatness ratio | 0.432 | 0.426 | 0.442 | 0.440 | 0.445 |
Table 4.
Results of OLS Analysis.
| Explanatory variables | Standardized coefficients | t | VIF |
| Economic development status | 0.489 | 9.831 | 1.172 |
| Industrial structure optimization | 0.098 | 3.011 | 1.215 |
| Locational advantage | 0.004 | 0.174 | 1.085 |
| Government support intensity | 0.046 | 1.773 | 1.515 |
| Natural conditions | 0.023 | 0.608 | 1.161 |
Table 5.
Comparison between OLS and GWR.
| Model | R2 | Adjusted R2 | AICc |
| OLS | 0.663 | 0.642 | -258.069 |
| GWR | 0.880 | 0.829 | -301.789 |
Disclaimer/Publisher’s Note: The statements, opinions and data contained in all publications are solely those of the individual author(s) and contributor(s) and not of MDPI and/or the editor(s). MDPI and/or the editor(s) disclaim responsibility for any injury to people or property resulting from any ideas, methods, instructions or products referred to in the content. |
© 2025 by the authors. Licensee MDPI, Basel, Switzerland. This article is an open access article distributed under the terms and conditions of the Creative Commons Attribution (CC BY) license (http://creativecommons.org/licenses/by/4.0/).
Copyright: This open access article is published under a Creative Commons CC BY 4.0 license, which permit the free download, distribution, and reuse, provided that the author and preprint are cited in any reuse.


