Submitted:
23 September 2025
Posted:
24 September 2025
You are already at the latest version
Abstract
The issue of water disasters in the mining floor is extremely severe. Despite significant progress in the on-site monitoring and identification of water inrush channels, research on the spatial development characteristics of cracks and the temporal evolution patterns remains insufficient, resulting in the incomplete development of microseismic (MS)-based water disaster early warning theory and practice. Based on this, the present study first derives the expressions for the diameter and length of water inrush channels according to the damage characteristics of MS events and the glazed porcelain shape features of the channels. A theoretical model for the correlation between MS-water inrush volume is established, and the relationship between MS and water level is revealed. Analysis of field monitoring data further indicates that when high-energy MS features (such as single high-energy events and higher daily cumulative energy) are detected, the aquifer water level begins to decline, followed by high water inrush events. Therefore, a decrease in water level accompanied by high-energy MS features can serve as an important early warning marker for water disasters. Finally, advanced machine learning methods are applied, in which the optimal index combination for floor water inrush prediction is obtained through the genetic algorithm (GA), and the weights of each index are determined by integrating the analytic hierarchy process (AHP) with the random forest (RF) model. The results show that the consistency ratio (CR), mean absolute error (MAE), and root mean square error (RMSE) are 0.024, 0.027, and 0.046, respectively. Field engineering verification demonstrates that the integrated early warning system performs significantly better than any single monitoring indicator, and all high water inrush events are successfully predicted within four days. Theoretical model; Crack monitoring; Water level response; Machine learning; Floor water disaster early warning
Keywords:
theoretical model
; crack monitoring
; water level response
; machine learning
; floor water disaster early warning
1. Introduction
China is a typical country characterized by "abundant coal, scarce oil, and limited gas," and coal has long been used as its primary energy source [1]. However, numerous geological safety hazards are encountered during mining, among which floor water disasters are consistently regarded as a critical challenge for the transformation and upgrading of the coal industry. Unlike shallow aquifers, the Cambrian limestone aquifer in deeper strata is associated with larger water inrush volumes and higher risks, and it has gradually been identified as a major focus and difficulty in current research [2,3]. Therefore, systematic theoretical research and risk level identification of floor water inrush disasters are urgently required, so that the safe, efficient, and sustainable utilization of mineral resources can be effectively ensured [4,5].
In terms of the mechanisms of water inrush disasters, extensive research has been carried out on rock mass stability and fracture development. This includes studies in which the relationship between MS activity and damage-induced fracturing is investigated using three-dimensional finite element methods, through which real-time monitoring of fracturing events is achieved, providing an important means for assessing the risk of rock mass failure [6-8]. Other studies have shown that energy parameters obtained from MS monitoring can effectively characterize the degree of rock mass failure and the state of crack propagation [9]. Therefore, the development of comprehensive sensitivity precursors based on MS energy is considered highly significant for reducing the risk of floor water disasters in coal mines. Meanwhile, some researchers combine MS characteristics with numerical simulation results, and information features and distribution patterns of internal fractures in surrounding rocks are determined through mutual validation [10,11]. In addition, MS parameters combined with intelligent methods are used to estimate the geometry of fractures and their interactions, thereby allowing the distribution of water pressure within fractures and the dominant seepage channels to be obtained [12-14]. Other studies indicate that MS mechanisms, when integrated with stress variation, can be employed to identify explicit and implicit geological structures in mines in advance, thus providing safety assurance for underground excavation and mining [15,16]. Moreover, MS monitoring results show that under the reinforcement of single-stage or multi-stage grouting, floor fractures can be effectively filled and the degree of floor damage in coal seams is mitigated [17,18].
On the other hand, studies on water disaster early warning include the analysis of spatial indicators from MS monitoring data, through which the depth of floor damage during coal seam mining above confined water is determined, allowing a preliminary assessment of water inrush risk in the coal seam floor [19]. A floor water inrush evaluation method is established by calculating weights using mathematical formulas, based on water inrush volume, water content, and pre-mining MS parameters, and the working face is thereby divided into zones with different levels of water inrush risk [20,21]. Based on the dominant frequency components of MS water inrush signals, the variational mode decomposition (VMD) method is applied to effectively extract their high-frequency components, from which the water inrush risk characteristics of the study area are obtained [22,23]. By integrating fracture signals, physical analysis, and simulation modeling, significant variations in the hydraulic characteristics within water inrush channels are revealed, thereby enabling the early warning of coal mine water inrush disasters [24-26]. In addition, advanced intelligent methods such as SIOA, ResNet, and ISMOTE are introduced to accurately identify fundamental parameters of water inrush sources, and their effectiveness is demonstrated [27-29].
Existing studies have achieved certain progress in the risk assessment of floor water disasters [30-32], but research on the spatial morphological characteristics of fractures and their temporal evolution prior to water inrush remains insufficient, and the accuracy of related early warning methods still needs improvement. To address this, sensitive precursors of water inrush are revealed through theoretical model construction and field monitoring data analysis. An innovative GA-AHP-RF integrated method is then proposed, in which global optimization of features and importance weight allocation are employed to achieve a quantitative characterization of indicator correlations. Field application results demonstrate that this integrated early warning method achieves high accuracy and stability in water disaster prediction, providing effective guidance for ensuring safe operations at the working face.
2. Engineering Conditions and Integrated Monitoring System
2.1. Geological Overview
The Pingdingshan No. 10 Coal Mine is located about 5 km from the center of Pingdingshan City, Henan Province, China. The basic structure of its mining area is composed of the No. 10 Coal Mine syncline and the Guozhuang anticline, and its geographical location is shown in Figure 1. The mining area borders the Pingdingshan No. 1 Coal Mine to the east and the Pingdingshan No. 8 Coal Mine to the west. The strike length of the field extends about 4 km from east to west, with a dip width of approximately 5.1 km from north to south. The main coal seams exploited in the Pingdingshan No. 10 Coal Mine are those of Group E and Group F, among which the F.15 seam lies above the F.17 seam and was mined out in 2021. During the extraction of the overlying seam, floor failure fractures and water inrush channels had already formed, resulting in a large number of inrush points at that time. Therefore, field investigations and theoretical analyses were carried out before the mining of the F.17 seam. Although the calculated floor water inrush coefficient is lower than the critical value of 0.06 MPa/m, the resistance to water pressure is reduced in areas with special geological structures or weak aquicludes, and the possibility of water inrush during mining still exists.
2.2. Working Face Overview and Monitoring System Layout
The ground elevation ranges from 140 m to 240 m, while the coal seam elevation ranges from -888 m to -963 m, indicating that the mine is operated at a depth of approximately one kilometer. The thickness of the F.17–33200 working face ranges from 1.2 m to 2.9 m, with an average thickness of 2.4 m. The working face is mined under pressure-bearing conditions, where the primary water source for floor inrush is Cambrian limestone karst water, with a confined water pressure of approximately 2.93 MPa. Mining is conducted using a single-entry retreating longwall method, with fully mechanized coal mining and immediate roof caving for roof management. Under the coupled effects of high in-situ stress at great depth and strong confined water pressure, the risk of water inrush at the working face is significant. Therefore, investigating the floor failure mechanism and the associated water inrush hazard is of great importance.
At Pingdingshan No. 10 Coal Mine, water level monitoring boreholes (Borehole 1 and Borehole 2) are installed in each of the ventilation roadway floor and the conveyor roadway floor of the F.17-33190 working face. The Borehole 3 is installed in the central main roadway, enabling real-time dynamic observation of water level changes in the floor aquifer. Simultaneously, a MS monitoring system is introduced at the working face, which consists of surface and underground equipment. Ten geophones are installed in the conveyor roadway and nine geophones are installed in the ventilation roadway of the underground working face. Signals collected by the geophones are received by two acquisition substations and transmitted to a surface computer terminal for data processing and analysis. The layout of the monitoring system is shown in Figure 2.
2.3. MS Monitoring Analysis of Coal Seam Floor
To monitor and analyze floor rock mass fracturing and potential water inrush hazards in the F.17-33200 working face, a three-dimensional spatial distribution of MS events is plotted, through which the approximate location of floor failure depth is determined. Taking September and October as examples, the spatial distribution characteristics of floor MS events are shown in Figure 3. The size and color of the spheres represent the magnitude of MS events. The formula for calculating the Richter magnitude is presented as follows [33].
where M represents the Richter magnitude, E represents energy, a and b are constants, with a set to -0.15 and b set to 2.61 based on field experience.
It is observed from the figure that MS events with magnitudes less than 1.30 predominate, with a few events of higher magnitude also occurring. Mining activities at the working face cause stress concentration in the coal seam floor, and rock fractures occur when the rock strength is exceeded. The frequency of MS events is higher when closer to the coal seam floor, with the number of fractures decreasing vertically as depth increases. The overall cross-sectional profile exhibits an inverted trapezoid distribution, characterized by a wider upper part and a narrower lower part. The spatial distribution of MS events indicates that floor fracture locations are primarily concentrated within the 0-40 m depth range of the floor rock layer, with the deepest reaching 84.78 m below the floor. This indicates that significant floor rock activity occurs throughout the mining process in this area. As the depth of floor rock fractures in the coal seam increases, confined water in the limestone may potentially migrate upward along water-conducting channels, leading to floor water inrush.
3. Correlation Theoretical Model of MS-water Inrush Volume
One of the necessary conditions for the occurrence of mine water inrush disasters is the formation of an inrush channel, that is, the damage-induced fracturing of the floor has already penetrated. As the working face advances, the coupling of mining-induced stress and confined water pressure causes floor fractures to exhibit typical nonlinear evolution and multi-scale expansion characteristics. Once the fractures gradually develop into a connected network, the aquifer water level begins to decline, followed by high water inflow events. According to the monograph Mechanism and Prediction of Floor Water Inrush, the predicted formula for aquifer water inrush volume is given as follows [34]:
where d represents the diameter of the water inrush channel, L represents the length of the water inrush channel, ρ represents the density of water, μ represents the viscosity of water, H1 represents the water head height before inrush, and H2 represents the water head height after inrush.
During the formation of the above-mentioned water inrush channel, numerous fracture events continuously occur. As a novel physical monitoring technology, MS can effectively capture the initiation and evolution of floor fractures in coal seams. Signals generated by rock mass fracturing are received by more than four geophones, converted into data signals through underground equipment, and subsequently processed by surface instruments to perform source inversion, yielding the spatial coordinates (x, y, z). The MS system deployed at the F.17-33200 working face has been applied in multiple mines and is characterized by relatively high positioning accuracy. The spatial location of a MS event is taken as the center of a sphere, with the crack radius serving as the sphere’s radius. The diameter of the apparent volume of a MS event (the extent of the damage zone enveloped by the spherical failure region) and the spatial distance between two seismic sources are given by the following formulas [35].
where Mi represents the seismic moment of the MS event, σA represents the apparent stress, and x, y, z represent the spatial coordinates of the MS event.
Under the initial mining disturbance at the working face, stress concentration in the coal seam floor rock mass is relatively weak, and a small number of MS events begin to occur. Taking two MS events as an example, it is assumed that these two rock fracture events connect to form a crack. Consequently, the diameter of the fracture sphere can be approximated as the diameter between the crack’s endpoints, and the spatial distance between the two seismic sources can be regarded as the crack’s length, as shown in Figure 4.
As the working face is continuously mined, the degree of floor failure progressively increases. The number and energy of MS events increase, their spatial extent expands, and a significant clustering pattern is observed. As shown in Figure 5, under the influence of mining-induced stress, MS events form a large damage zone (S1) in the upper part of the intact aquiclude. Because the disturbance becomes stronger closer to the working face, the extent of damage also enlarges, ultimately presenting a distribution connectivity characterized by a wide upper part and a narrow middle section. Meanwhile, under the confined water pressure, MS events also form a large damage zone (S2) in the lower part of the aquiclude. Because the water pressure increases closer to the aquifer, the extent of damage is greater, ultimately displaying a distribution connectivity characterized by a narrow middle section and a wide lower part.
The combination of S1 and S2 produces a morphology that is wide at both ends and narrow in the middle, resembling a high-footed glazed porcelain vessel from the Shang Dynasty of China. Under the combined action of mining-induced stress and confined water pressure, once the load-bearing capacity of the intact aquiclude is exceeded, the working face floor is penetrated by fracturing, resulting in the formation of a "glazed porcelain shape" water inrush channel. In contrast, if the load-bearing capacity of the aquiclude is not exceeded, only an "glazed porcelain shape" upper feature may form at the floor.
When the damage zones S1 and S2 in Figure 5 are each considered as a single entity, their connectivity mechanism is identical to that of the two MS events in Figure 4. Consequently, the diameter of the damage zone can be approximated as the diameter of the water inrush channel, and the spatial distance between the two damage zones S1 and S2 can be regarded as the length of the water inrush channel. By introducing correction coefficients u and v, the diameter and length are expressed as d = ud1 and L = vL1, respectively. Substituting these into the above equation yields a preliminary relationship between MS activity and the aquifer water inrush volume:
In summary, under constant hydrogeological conditions such as water density and viscosity, a certain relationship is observed between coal seam floor water inrush and MS activity. Moreover, the magnitude of aquifer water level fluctuations directly affects the volume of water inrush; therefore, a correlation also exists between MS activity and aquifer water levels.
4. Synergistic Effects of Precursory Indicators for Floor Water Inrush
4.1. Statistical Analysis of Floor MS Data
Based on the response characteristics of MS activity in Pingdingshan No. 10 Coal Mine, fracture events with energy greater than 1×10⁵ J are classified as high-energy MS events. As shown in Figure 6, the daily cumulative energy and frequency of floor MS events from August 1, 2022, to October 15, 2022, are analyzed, revealing that during this period, both high-energy events with lower frequency and low-energy events with higher frequency are observed. This indicates that no definitive correlation exists between daily cumulative energy and frequency. However, compared to frequency, energy better characterizes the degree of rock fractures and the magnitude of risk; thus, this study focuses on analyzing the response characteristics between MS energy and aquifer water level.
4.2. Correlation Analysis of Single High-Energy Events and Water Level
Analysis of daily data reveals that single high-energy events in August result in elevated daily cumulative energy; thus, the correlation between single high-energy events and monitoring borehole water level changes at Pingdingshan No. 10 Coal Mine during this period is analyzed. Since monitoring Borehole 1 is used for water drainage protection during this period, the relationship between MS energy and water level changes in the other two monitoring boreholes is investigated based on field monitoring data from August 4 to August 11, as shown in Figure 7.
As shown in Figure 7, two single high-energy events occur on August 5, with energy magnitudes of 1.15×10⁶ J and 3.12×10⁶ J, respectively. The water level in Borehole 2, initially at -762.1 m, begins to decline slowly after the first high-energy event. After the second high-energy event on the same day, the water level decreases significantly to -765.3 m, resulting in a total decline of 3.2 m. The water level in Borehole 3, initially at -686.7 m, continues to decline slowly after the first high-energy event, reaching -689.4 m, with a total decline of 2.7 m. On August 8, a single high-energy MS event with an energy of 3.50×10⁶ J is observed in the floor of the working face. Subsequently, the water level in Borehole 2 begins to decline, dropping from -764.7 m to -766.2 m, with a total decline of 1.5 m. The water level in Borehole 3, still unstable due to the influence of the two high-energy events on August 5, begins to decline significantly after the third high-energy event. It drops from -689.3 m to -692.8 m, with a total decline of 3.5 m. Based on field monitoring data, a high water inflow event of 229 m3/h is recorded underground on August 12.
4.3. Correlation Analysis of High Daily Cumulative Energy and Water Level
Analysis of September monitoring data reveals that floor MS events during this period exhibit relatively uniform energy magnitudes, with no single exceptionally high-energy event observed. Consequently, the relationship between high daily cumulative energy and water level changes is analyzed [36]. Based on monitoring data from September 11 to September 18, graphs are plotted over time, as shown in Figure 8.
As shown in Figure 8, a high daily cumulative energy event occurs on September 12, with an energy magnitude of 9.23×10⁵ J. Following this high daily cumulative energy event, the water level in Borehole 1 drops from -688.3 m to -689.3 m, with a total decline of 1.0 m; the water level in Borehole 2 drops from -695.0 m to -696.3 m, with a total decline of 1.3 m; and the water level in Borehole 3 drops from -677.9 m to -678.7 m, with a total decline of 0.8 m. Analysis reveals that, despite the different spatial distributions of Boreholes 1, 2, and 3, the timing and magnitude of their water level declines are consistent, with all exhibiting a slight decline on the same day. Furthermore, high daily cumulative energy events occur on September 15 and September 16, with energy magnitudes of 7.00×10⁵ J and 5.47×10⁵ J, respectively. The water level in Borehole 2 responds with greater sensitivity, beginning to decline one day later, dropping from -695.5 m to -697.7 m, with a total decline of 2.2 m. Based on field monitoring data, a high water inflow event of 213 m3/h is recorded underground on September 18.
In summary, the monitoring data from Pingdingshan No. 10 Coal Mine further reveal the sensitivity characteristics prior to floor water inrush: significant correlations are identified between single high-energy events and high daily cumulative energy of MS activity, and water level decline. Therefore, a combined MS energy-water level approach is applied for the early warning of floor water inrush in Pingdingshan No. 10 Coal Mine. When water level decline is accompanied by high-energy MS characteristics, protective measures and water drainage exploration are required to be strengthened at the working face.
5. Construction and Field Verification of the Integrated Early Warning Model
5.1. Indicator Optimization Based on GA
Based on the aforementioned precursor correlation characteristics of floor water inrush, this section focuses on the construction of an integrated early warning system for floor water hazards. Using daily accumulation as the time window, the core MS indicators are selected as energy and frequency, while the water level indicators correspond to the level decline measured at three underground monitoring boreholes (Borehole 1, Borehole 2, and Borehole 3). Due to multiple factors, including the complex geological structure and mining disturbances, the sensitivity of each basic indicator to water inrush precursors varies. Therefore, advanced machine learning and optimization methods are introduced in this study. The response characteristics of MS and each monitoring borehole are systematically quantified using a GA, and the optimal indicator combination for early warning is ultimately selected, as shown in Figure 9.
(1) A multi-source indicator dataset {x1, x2, …, xn, risk level} for floor water hazards is first constructed, and the dataset is separated into MS-water level features x1-xn and the risk label, risk level. The risk level is determined based on on-site hazard investigations and comprehensive water inflow assessment. The indicator population parameters are then standardized using 'StandardScaler', and the monitoring data are divided into 80% training set and 20% testing set.
(2) In terms of feature selection, the GA iteratively optimizes the MS-water level feature combinations by simulating the processes of natural selection and genetic variation, so that the most predictive subset is selected from the candidate indicators. The model’s goodness of fit, F, is typically evaluated using the following fitness function [37]:
where yi denotes the true label of the i-th sample, represents the predicted floor water risk, is the mean of the true labels, and n is the number of samples from Pingdingshan No. 10 Coal Mine.
In this study, a GA framework is constructed based on the DEAP library. By iteratively optimizing feature combinations, the feature space dimensionality is effectively reduced while the model prediction accuracy is improved. The algorithm hyperparameters are set as follows: population size of 50, number of iterations of 50, crossover probability of 0.7, mutation rate of 0.05, and feature number of 5. The top ten indicator combinations from the training results are presented in Table 1. The results indicate that the MS energy-water level combination outperforms the frequency-water level combination, indirectly confirming the relative advantage of MS energy in floor water hazard applications. Among them, the combination of MS energy, Borehole 1, Borehole 2, and Borehole 3 achieves a high goodness-of-fit, F, of 0.6860 in the floor water inrush application at Pingdingshan No. 10 Coal Mine, indicating that this feature combination possesses strong predictive reliability.
5.2. Importance Weight Allocation Based on AHP and RF
5.2.1. Construction of the Hierarchical Model
In this study, the structured judgment advantages of AHP are innovatively integrated with the nonlinear modeling capability of RF to achieve a scientific and rational allocation of weights for water hazard prediction indicators. First, a hierarchical model is constructed based on the optimal results of the GA, as shown in Figure 10. The water inrush comprehensive early warning index A is defined as the target layer of the model; the criterion layer consists of the MS index B1 and the water level index B2; the indicator layer includes daily cumulative energy of floor C1, daily water level decline in Borehole 1 C2, daily water level decline in Borehole 2 C3, and daily water level decline in Borehole 3 C4; the influencing factors include coal seam mining disturbance, floor aquifer pressure, and other factors.
Within the same level, the relative importance among elements is determined through expert judgment or questionnaire surveys [38], and a pairwise comparison matrix is then constructed accordingly. Each element of the matrix represents the relative importance or comparative preference between two criteria or alternatives. To ensure the scientific validity and rationality of expert judgments, a consistency test is required. First, the consistency index (CI) is calculated, and the random consistency index (RI) is introduced for comparison. When the CR is less than 0.10, the judgment matrix is considered acceptable, and its normalized eigenvector can be adopted as the weight vector; otherwise, a re-evaluation is required.
5.2.2. RF Model Construction
Similarly, based on the optimal MS-water level indicator combination from GA, RF constructs and integrates multiple decision trees, with the average of each tree’s prediction results as the final output. This method has strong capabilities in handling high-dimensional data and nonlinear relationships, and the model architecture is shown in Figure 11.
The RF model is trained to extract the "importance scores" of each feature, reflecting the contribution of each feature to the model's floor water hazard prediction results, and these scores are used to assign weights in the optimal indicator combination. The importance scores are calculated by evaluating the contribution of each feature to reducing the MSE at the split nodes, as shown in Equation 7 [39]:
where T represents the number of trees in the forest, set to 100, nodes(t) refers to all split nodes in the t-th tree, △MSE(Xi,n) represents the reduction in MSE due to feature Xi at node n, and wt,n is the weight of node n.
This weight allocation method based on AHP and RF combines the advantages of both subjective and objective approaches. The former incorporates expert knowledge to ensure logical consistency, while the latter relies on data-driven approaches to reveal the importance of nonlinear features. This combined method significantly enhances the interpretability of the indicator combination and helps identify the key factors contributing to water hazard risk. The feature evaluation results are shown in Figure 12.
The consistency test result in AHP is CR = CI/RI = 0.024 < 0.10, indicating that the judgment matrix has good consistency. At the same time, the water hazard indicator combination performs excellently in the RF model, with MAE and RMSE values of 0.027 and 0.046, respectively. Given that the product method has advantages in consistency amplification and non-compensatory aspects, this study employs this method to integrate the weight results of AHP and RF, highlighting the important features jointly determined by both methods and suppressing the bias introduced by each individual method, as shown in Equations 8 and 9. The weights for MS energy and water level Boreholes 1, 2, and 3 in Pingdingshan No. 10 Coal Mine are calculated to be 22%, 52%, 9%, and 17%, respectively, thereby achieving a quantitative representation of the correlation of floor water inrush precursor indicators.
where andrepresent the AHP and RF weights for the i-th floor water hazard feature, respectively, is the final normalized weight for the MS-water level.
5.3. Field Engineering Validation
(1) Classification of water inrush risk levels
The optimal indicator combination for floor water inrush prediction based on GA, along with the weights of each indicator determined through AHP and RF, have been obtained. On this basis, the MS-water level monitoring data is standardized, and a linear weighting method is used to calculate the daily comprehensive water inrush risk value. The higher the comprehensive early warning index of the working face, the greater the water inrush risk on that day. The structural stability and water inflow measured in previous field tests are used as evaluation standards, categorizing the water inrush risk of the working face into weak risk level I (0 ≤ R ≤ 0.3), moderate risk level II (0.3 < R ≤ 0.6), and high risk level III (0.6 < R ≤ 1). Risk level I corresponds to the overall stability of the floor aquiclude, with no impact on mining operations, allowing the working face to proceed as planned. Risk level II indicates potential water inrush hazards, with uncertainty in the risk, requiring enhanced water drainage and protection measures. Risk level III indicates a significant water inrush risk, triggering an alarm at the working face, halting operations, and initiating emergency measures.
(2) Engineering application effect analysis
To verify the effectiveness of the basic and comprehensive indices in floor water inrush early warning in coal seams, a subsequent continuous period during the production of the 17-33200 working face at Pingdingshan No. 10 Coal Mine is selected for validation. The collected data includes MS monitoring results, water level changes in monitoring boreholes, and actual water inrush volume. The calculation results of the MS-water level univariate index and the comprehensive index are shown in Figure 13 and Figure 14.
As shown in Figure 13, the univariate index exhibits a certain predictive capability for water inrush at the working face, but its early warning performance has two main shortcomings: ① High values of the daily cumulative index do not necessarily correspond to high water inrush events at the working face. For example, although the MS index showed high values on September 21 and September 25, and the water level index showed high values on September 23, October 11, and October 21, no significant water inrush events occurred afterward.② Different univariate indices may provide inconsistent predictions, thereby reducing the overall accuracy of early warning. For instance, prior to the high inrush event of 204.8 m3/h on October 9, the MS index presented discrete warning results between October 6-9; similarly, before the high inrush event of 195 m3/h on October 3, the water level index also produced discrete warning results on September 29 and October 3. From the above analysis, it can be concluded that the univariate index only reflects partial precursor information and is prone to false alarms in prediction and early warning.
Based on the water inrush risk classification results, the comprehensive index values for this period are partitioned. When the value exceeds R0 = 0.60, corresponding to the high-risk level Ⅲ region, an alarm is triggered at the working face. As shown in Figure 14, the comprehensive index values are calculated to have exceeded the alarm threshold R0 on September 29 and October 7, with magnitudes of 0.94 and 0.74, respectively. The water inrush early warning results indicate that the MS-water level comprehensive index successfully provides warnings for high water inrush events within four days. In cases where a single index shows high values but no significant water inrush events occur afterward, the comprehensive index does not exhibit high values on the corresponding dates. Engineering practice demonstrates that this method effectively integrates multiple types of sensitive precursor information, eliminates index discrepancies through heterogeneous fusion, and achieves accurate prediction and early warning of water inrush from coal seam floors.
6. Conclusions
(1) In the floor MS events of the F.17-33200 working face, the majority have magnitudes less than 1.30, while a small number exhibit larger magnitudes. The frequency of MS events decreases vertically with increasing depth, with fracture events mainly concentrated within 0-40 m of the floor, and the deepest occurrence reaching 84.78 m. Overall, an inverted trapezoidal distribution pattern with a wide top and narrow bottom is presented.
(2) Two events are used as examples to characterize the intrinsic relationship between MS activity and fractures. By integrating the "glazed porcelain shape" feature of floor rock failure that forms water inrush channels, a theoretical expression of aquifer water inrush volume based on MS activity is derived. It is also shown that a certain correlation exists between MS activity and water level variations.
(3) Analysis of field monitoring data shows that significant sensitivity response characteristics exist prior to floor water inrush: single high-energy events and high daily cumulative energy of MS activity are found to be strongly correlated with water level decline. Based on this, a method that combines MS energy with water level dynamics is proposed, by which effective early warning of floor water inrush disasters can be achieved.
(4) The GA-AHP-RF machine learning model enables quantitative characterization of the correlations among sensitive indices, with the weights of floor MS energy and water level Boreholes 1, 2, and 3 determined as 22%, 52%, 9%, and 17%, respectively. Field application results demonstrate that the comprehensive index is able to achieve accurate early warning within four days prior to high water inrush events, thereby providing a solid foundation for intelligent early warning and dynamic prevention of mine water hazards.
Author Contributions
Hang Li: Writing-original draft, Writing-review & editing, Methodology, Validation. Yijia Li: Writing-review & editing, Conceptualization, Investigation. Wantong Lin: Visualization, Project administration, Software. Huaixiang Yang: Formal analysis, Methodology, Funding acquisition. Kefeng Liu: Writing-original draft, Data curation. All authors have read and agreed to the published version of the manuscript.
Funding
This work was supported by “the Fundamental Research Funds for the Central Universities (Ph.D. Top Innovative Talents Fund of CUMTB)” (No. BBJ2025008).
Data Availability Statement
Data will be made available on request.
Conflicts of Interest: The authors declare no conflict of interest.
References
- Zhang, Q.; Guo, J.; Lu, X.; Ding, K.; Yuan, R.; Wang, D. Simulation and On-Site Detection of the Failure Characteristics of Overlying Strata under the Mining Disturbance of Coal Seams with Thin Bedrock and Thick Alluvium. Sensors. 2024, 24(6), 1748. [Google Scholar] [CrossRef]
- Ilić, M. Č.; Popović, M. P.; Bajić, D.; Matović, V.; Abramović, F.; Alimpić, F. Monitoring the Impact of Artificial Structure on Hydrogeological Environment: A Case Study of Hydraulic Tunnel at Pirot Hydropower Plant. Sensors. 2024, 24(20), 6578. [Google Scholar] [CrossRef]
- Aghababaei, S.; Saeedi, G.; Jalalifar, H. Risk analysis and prediction of floor failure mechanisms at longwall face in Parvadeh-I coal mine using rock engineering system (RES). Rock Mech. Rock Eng. 2015, 49(5), 1889–1901. [Google Scholar] [CrossRef]
- Wang, K.K.; Ma, K.; Tang, C.A.; et al. Study on deep mining-induced strata behavior based on the evolutional laws of multiple indices from microseismic monitoring. Rock Mech. Rock Eng. 2023. [CrossRef]
- Cao, W.Z.; Durucan, S.; Cai, W.; et al. The role of mining intensity and pre-existing fracture attributes on spatial, temporal and magnitude characteristics of microseismicity in longwall coal mining. Rock Mech. Rock Eng. 2020, 53(9), 4139–4162. [Google Scholar] [CrossRef]
- Liu, X.Z.; Tang, C.A.; Li, L.C.; et al. Microseismic monitoring and 3D finite element analysis of the right bank slope, Dagangshan hydropower station, during reservoir impounding. Rock Mech. Rock Eng. 2017, 50(7), 1901–1917. [Google Scholar] [CrossRef]
- Hu, Y.; Wang, Y.; Wang, Q.; Zhao, J.; Zhu, J.; Li, X.; Yang, Y. The propagation laws of hydraulic fractures under the influence of natural fracture zones. Phys. Fluids 2025, 37(1). [CrossRef]
- Li, J.; Chen, D.; Wang, E.; Yang, H.; Zhao, S.; Jia, H.; Sun, W.; Song, Y.; Fan, X. Enhanced convolutional neural network-based prediction and source mechanism interpretation of high-energy microseismic events in coal mines. Phys. Fluids 2025, 37(4). [CrossRef]
- Zhang, J.C. Investigations of water inrushes from aquifers under coal seams. Int. J. Rock Mech. Min. Sci. 2005, 42(3), 350–360. [Google Scholar] [CrossRef]
- Tang, S.; Tang, C. Numerical studies on tunnel floor heave in swelling ground under humid conditions. Int. J. Rock Mech. Min. Sci. 2012, 55, 139–150. [Google Scholar] [CrossRef]
- Li, J.; Tang, S.; Li, T.; Zhang, S.; Tang, L.; Sun, K. Study on rockburst control of deep-buried tunnel by combining advanced stress release borehole and hydraulic fracturing. Tunn. Undergr. Space Technol. 2025, 160, 106517. [Google Scholar] [CrossRef]
- Zhang, X.; Li, W.; Li, A.; Gao, F.; Zhang, N.; Li, X.; Chen, Y.; Liu, C.; Shi, C.; Han, F.; Wang, B. Study on mine earthquake prediction based on numerical simulation of rock fracture evolution. Energy Sci. Eng. 2025. [CrossRef]
- Zhou, J.R.; Wei, J.; Yang, T.H.; et al. Seepage channel development in the crown pillar: Insights from induced microseismicity. Int. J. Rock Mech. Min. Sci. 2021, 145. [Google Scholar] [CrossRef]
- Gabry, M.A.; Gharieb, A.; Soliman, M.Y.; Eltaleb, I.; Farouq-Ali, S.; Cipolla, C. Advanced deep learning for microseismic events prediction for hydraulic fracture treatment via continuous wavelet transform. Geoenergy Sci. Eng. 2024, 239, 212983. [Google Scholar] [CrossRef]
- Cheng, J.Y.; Wang, P.; Nan, S.H.; et al. Rapidly locating a water-inrush collapse column in a seam floor: A case study. Mine Water Environ. 2021, 40(2), 389–397. [Google Scholar] [CrossRef]
- Cheng, X.; Qiao, W.; Dou, L.; He, H.; Ju, W.; Zhang, J.; Song, S.; Cui, H.; Fang, H. In-situ stress field inversion and its impact on mining-induced seismicity. Geomatics Nat. Hazards Risk 2022, 14(1), 176–195. [Google Scholar] [CrossRef]
- Mu, W.Q.; Li, L.C.; Zhang, Y.S.; et al. Failure mechanism of grouted floor with confined aquifer based on mining-induced data. Rock Mech. Rock Eng. 2023. [CrossRef]
- Zuo, J.P.; Wu, G.S.; Du, J.; et al. Rock strata failure behavior of deep Ordovician limestone aquifer and multi-level control technology of water inrush based on microseismic monitoring and numerical methods. Rock Mech. Rock Eng. 2022, 55(8), 4591–4614. [Google Scholar] [CrossRef]
- Cheng, A.P.; Gao, Y.T.; Liu, C.; Chai, J.F. Microseismic monitoring and numerical simulation research of floor failure depth in extra-thick coal seam. Adv. Mater. Res. 2014, 881–883, 1799–1804. [CrossRef]
- Huang, L.; Xu, Y.; Liu, S.; et al. Research on the development law of pre-mining microseisms and risk assessment of floor water inrush: A case study of the Wutongzhuang coal mine in China. Sustainability 2022, 14(15). [CrossRef]
- Zhuang, D.; Ma, K.; Tang, C.; Cui, X.; Yang, G. Study on crack formation and propagation in the galleries of the Dagangshan high arch dam in Southwest China based on microseismic monitoring and numerical simulation. Int. J. Rock Mech. Min. Sci. 2018, 115, 157–172. [Google Scholar] [CrossRef]
- Cheng, S.; Li, S.; Li, L.; Shi, S.; Zhou, Z.; Wang, J. Study on energy band characteristic of microseismic signals in water inrush channel. J. Geophys. Eng. 2018, 15(5), 1826–1834. [Google Scholar] [CrossRef]
- Li, L.; Jin, H.; Chen, Y.; Cheng, S.; Hu, H.; Wang, S. Noise reduction method of microseismic signal of water inrush in tunnel based on variational mode method. Bull. Eng. Geol. Environ. 2021, 80(8), 6497–6512. [Google Scholar] [CrossRef]
- Cheng, A.P.; Gao, Y.T.; Liu, C.; Chai, J.F. Microseismic monitoring and numerical simulation research of floor failure depth in extra-thick coal seam. Adv. Mater. Res. 2014, 881–883, 1799–1804. [CrossRef]
- Cheng, J.; Wang, P.; Nan, S.; Qin, S. Rapidly locating a water–inrush collapse column in a seam floor: A case study. Mine Water Environ. 2021, 40(2), 389–397. [Google Scholar] [CrossRef]
- Xiong, W. Application of micro-seismic monitoring technology in fracturing and water injection development of horizontal wells with low permeability and thin layer. IOP Conf. Ser. Earth Environ. Sci. 2019, 252(5), 052018. [Google Scholar] [CrossRef]
- Xu, S.; Peng, Z.; Zheng, Q. Research on data-driven prediction of inrush probability in coal mines under the mechanism of feature reconstruction in information interconnectivity. Water 2025, 17(6), 843. [Google Scholar] [CrossRef]
- Cui, M.; Hou, E.; Feng, D.; Che, X.; Xie, X.; Hou, P. Identification of the water inrush source based on the deep learning model for mines in Shaanxi, China. Mine Water Environ. 2025. [CrossRef]
- Ye, Z.; Tang, S.; Ke, S.; Tang, X. An evaluation of the mine water inrush based on the deep learning of ISMOTE. Nat. Hazards 2023, 117(2), 1475–1491. [Google Scholar] [CrossRef]
- Konicek, P.; Waclawik, P. Stress changes and seismicity monitoring of hard coal longwall mining in high rockburst risk areas. Tunn. Undergr. Space Technol. 2018, 81, 237–251. [Google Scholar] [CrossRef]
- Duan, H.F.; Zhao, L.J. New evaluation and prediction method to determine the risk of water inrush from mining coal seam floor. Environ. Earth Sci. 2021, 80(1). [CrossRef]
- Gao, R.; Yan, H.; Ju, F.; Mei, X.; Wang, X. Influential factors and control of water inrush in a coal seam as the main aquifer. Int. J. Min. Sci. Technol. 2018, 28(2), 187–193. [Google Scholar] [CrossRef]
- Dohmen, T.; Zhang, J.; Barker, L.; Blangy, J.P. Microseismic magnitudes and b-values for delineating hydraulic fracturing and depletion. SPE J. 2017, 22(5), 1624–1634. [Google Scholar] [CrossRef]
- Wang, Y.; Shi, L.; Cong, P. The predication of No. 16 coal seam water inflow of Hegang coal mine. Shandong Coal Sci. Technol. 2016, (3), 140–142. [Google Scholar]
- Li, Y.; Wang, J.; Wang, Z.; Sui, Q.; Xiong, Z. Microseismic P-wave travel time computation and 3D localization based on a 3D high-order fast marching method. Sensors 2021, 21(17), 5815. [Google Scholar] [CrossRef]
- Hao, X.; Li, H.; Zhao, Y.; et al. An early warning method and application of water inrush from coal mining floor based on the correlation effect between daily cumulative micro-seismic indicators and water level. Chin. J. Rock Mech. Eng. 2024, 43(9), 2125–2139. [Google Scholar] [CrossRef]
- Rodríguez-Abreo, O.; Aragón, J.L.; Quiroz-Juárez, M.A. Reconstruction of dynamic systems using genetic algorithms with dynamic search limits. Eng. Comput. 2025. [CrossRef]
- Mathew, M.; Chakrabortty, R.K.; Ryan, M.J. A novel approach integrating AHP and TOPSIS under spherical fuzzy sets for advanced manufacturing system selection. Eng. Appl. Artif. Intell. 2020, 96, 103988. [Google Scholar] [CrossRef]
- Ma, H.; Peng, T.; Zhang, C.; Ji, C.; Li, Y.; Nazir, M.S. Developing an evolutionary deep learning framework with random forest feature selection and improved flow direction algorithm for NOx concentration prediction. Eng. Appl. Artif. Intell. 2023, 123, 106367. [Google Scholar] [CrossRef]
Figure 1.
Geographical location map of Pingdingshan No. 10 Coal Mine.
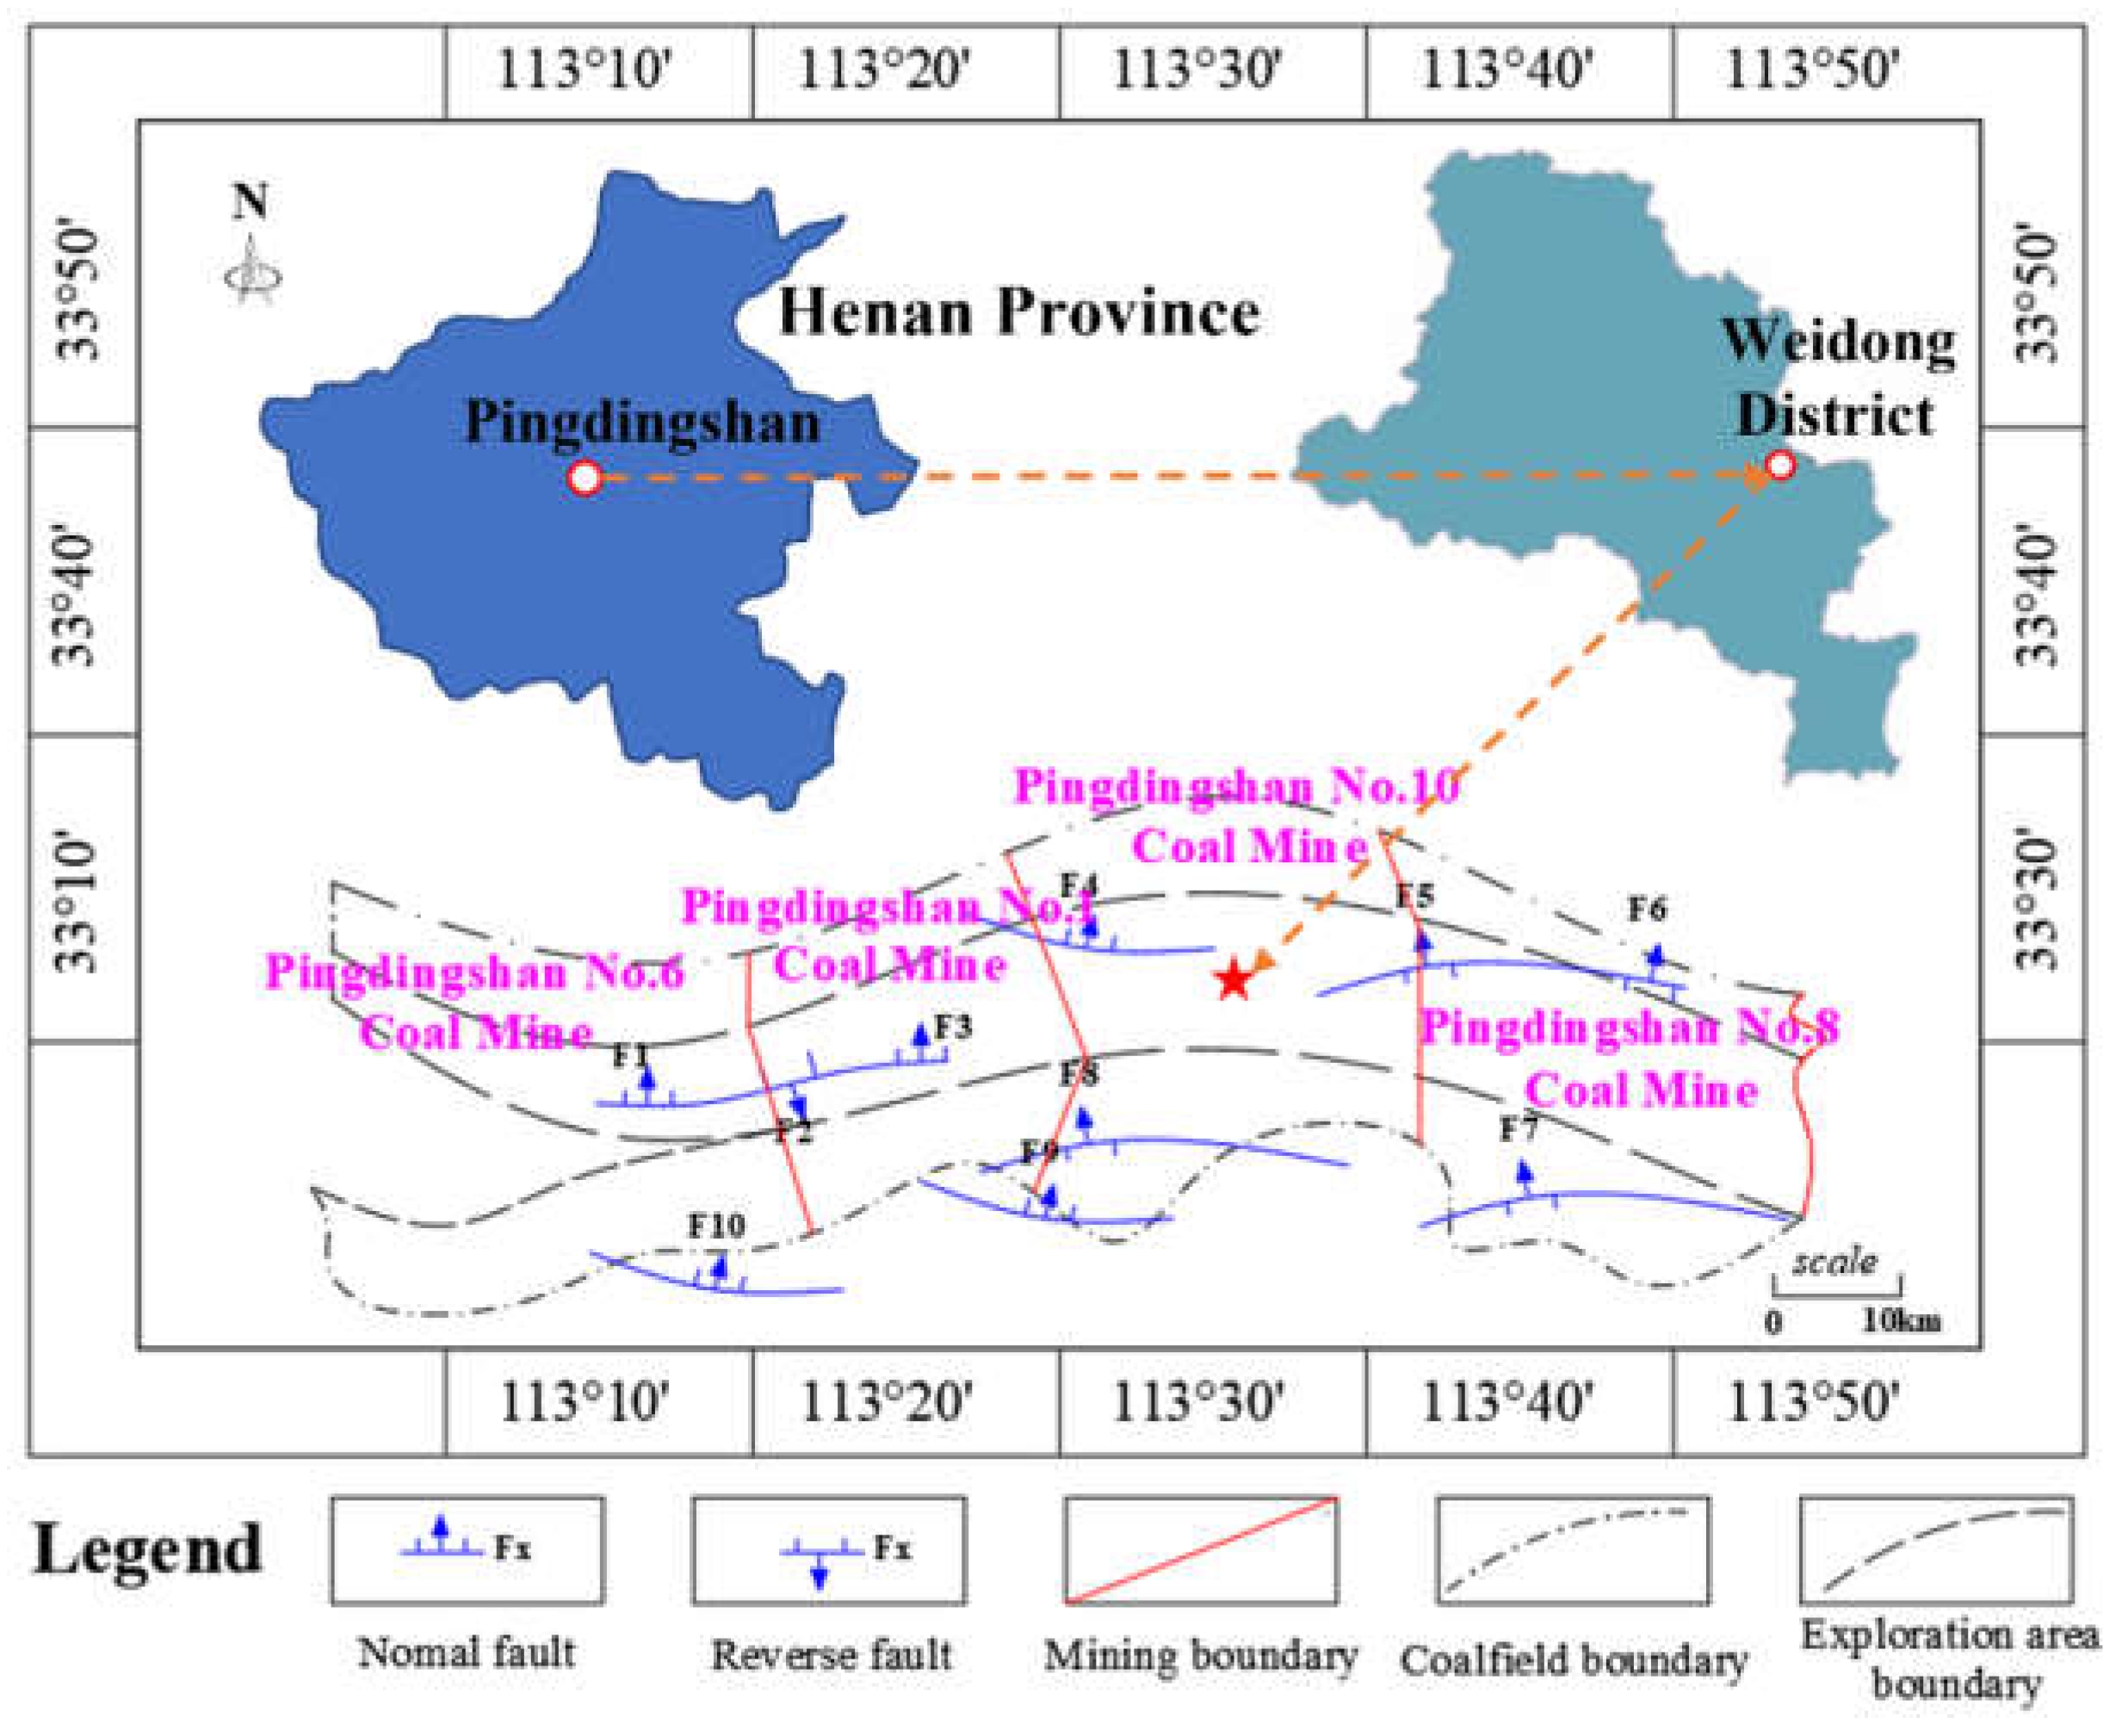
Figure 2.
Layout of the MS and water level monitoring system.
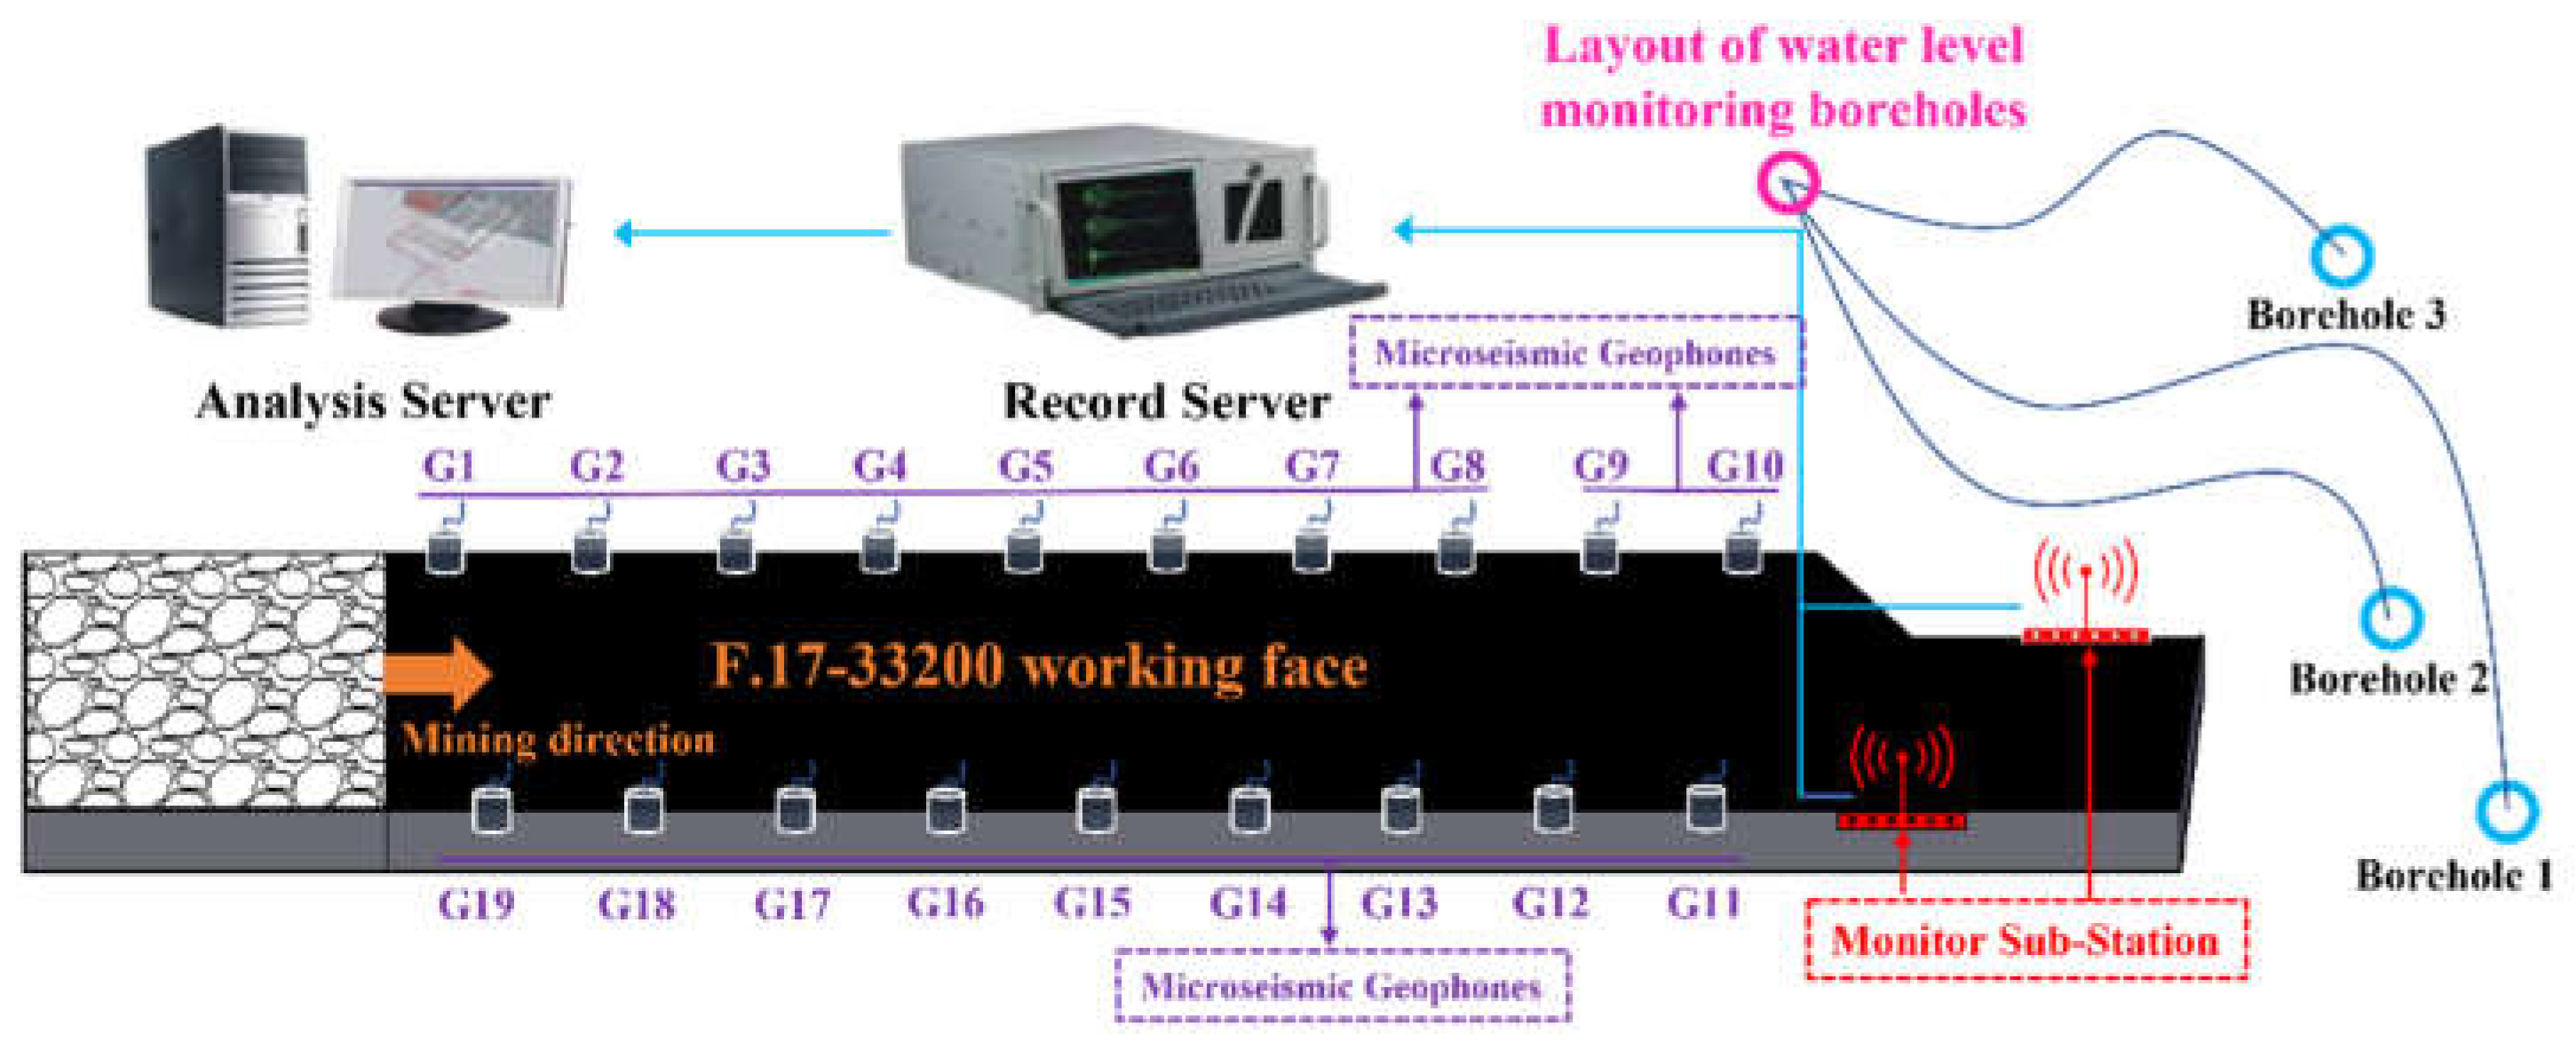
Figure 3.
Spatial morphology of floor fracturing in the F.17-33200 working face. (a) Distribution of MS events from September 1 to September 15; (b) Distribution of MS events from September 16 to September 30; (c) Distribution of MS events from October 1 to October 15; (d) Distribution of MS events from October 16 to October 31.
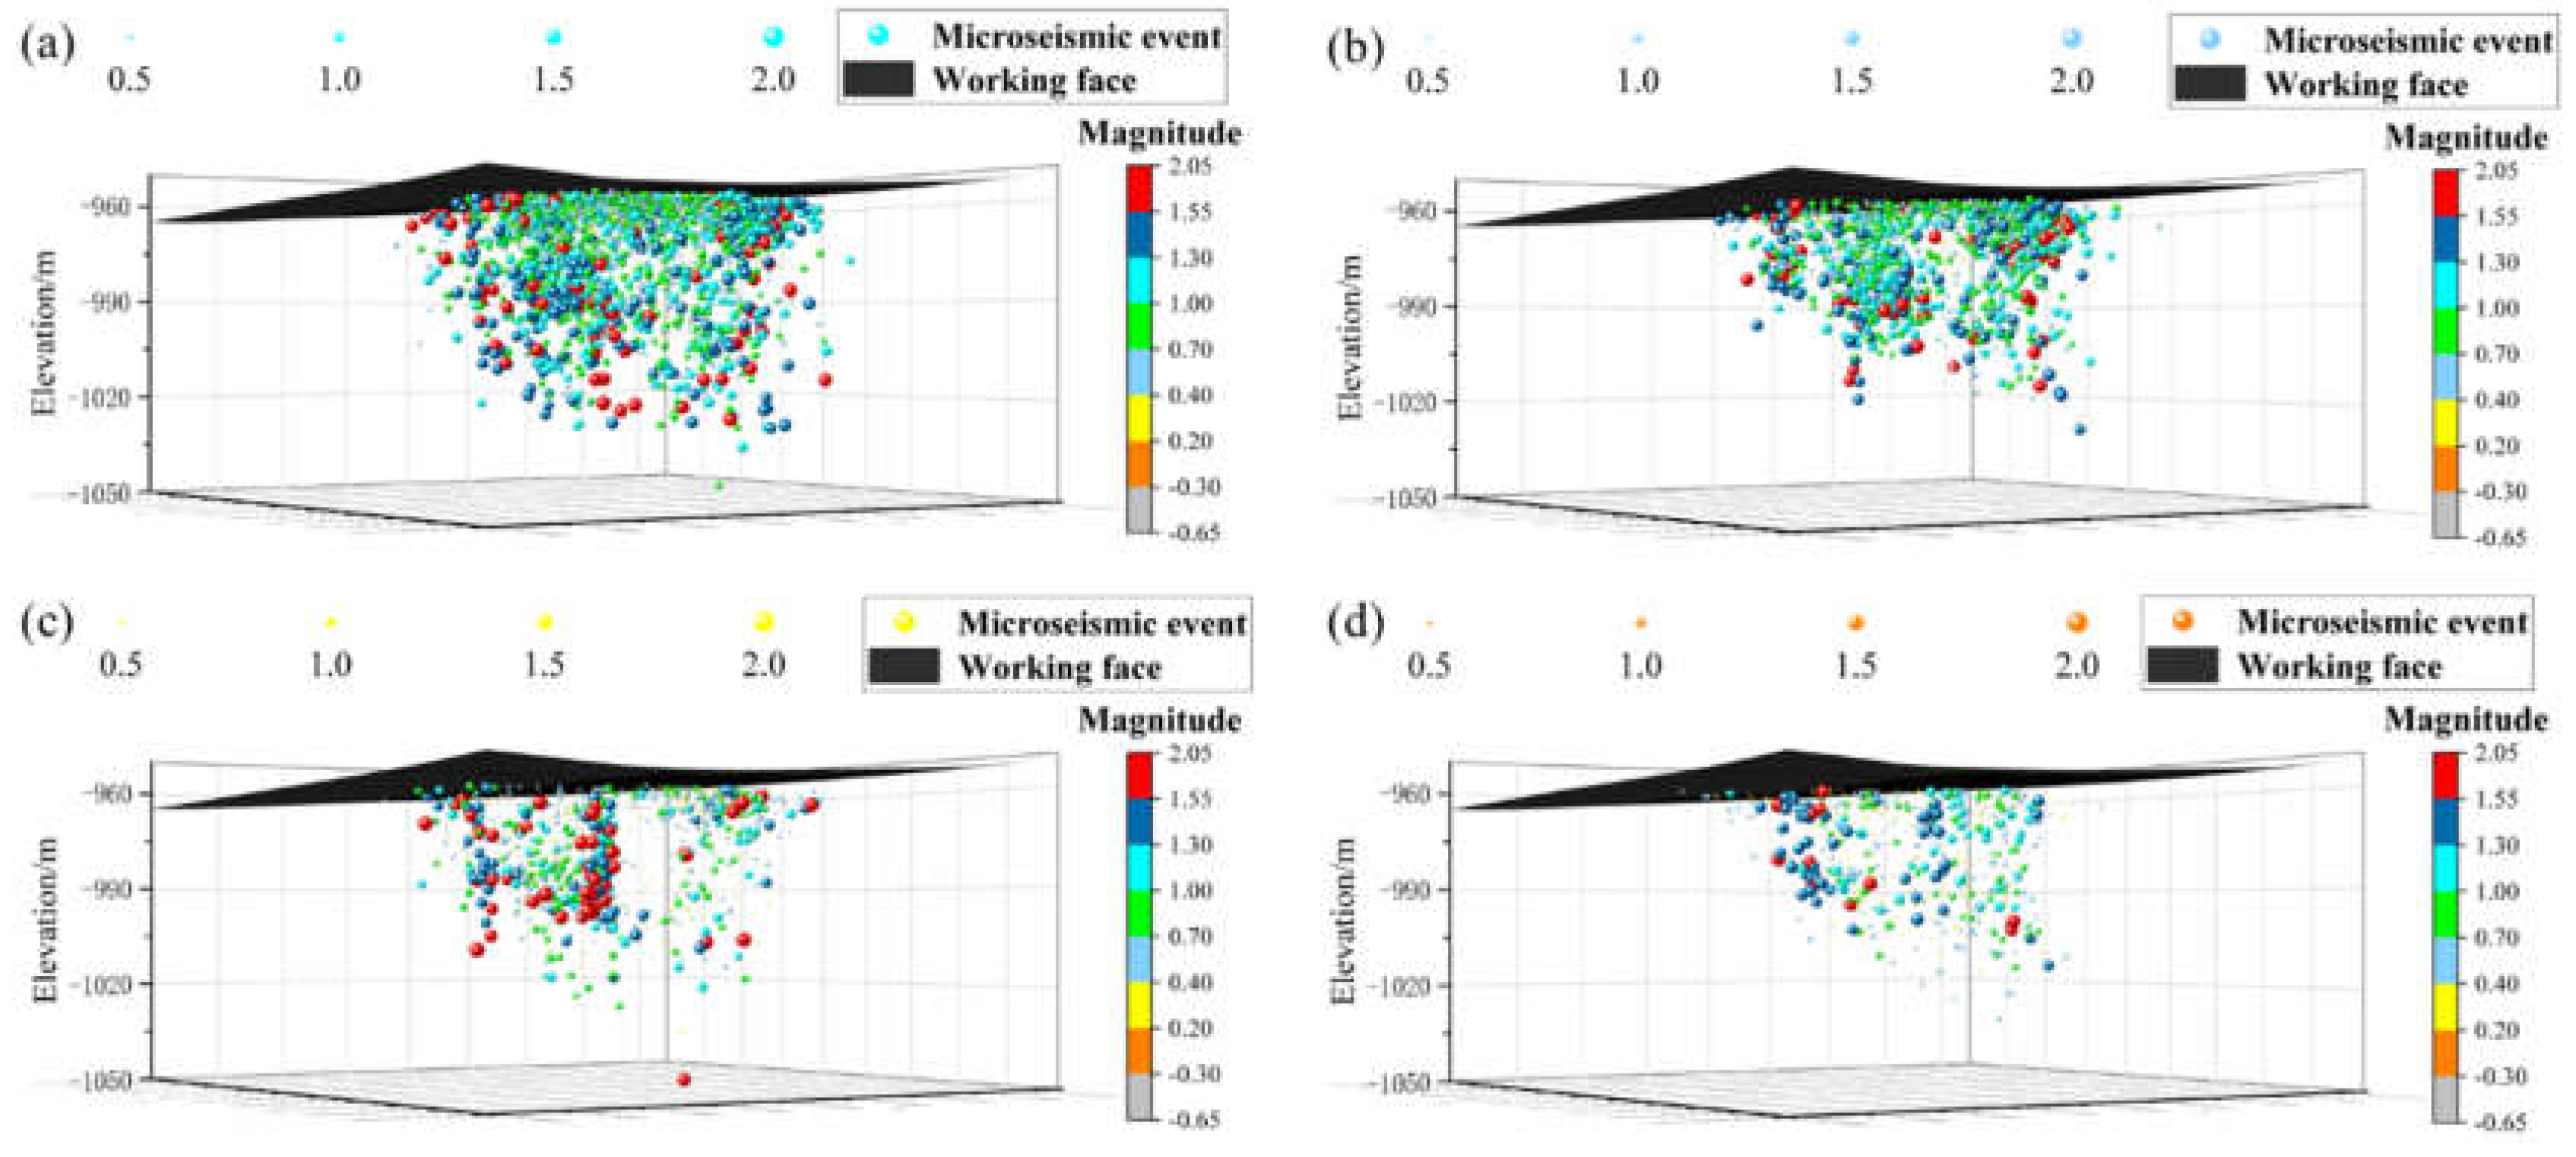
Figure 4.
Model of rock crack connectivity (taking two seismic sources as an example).
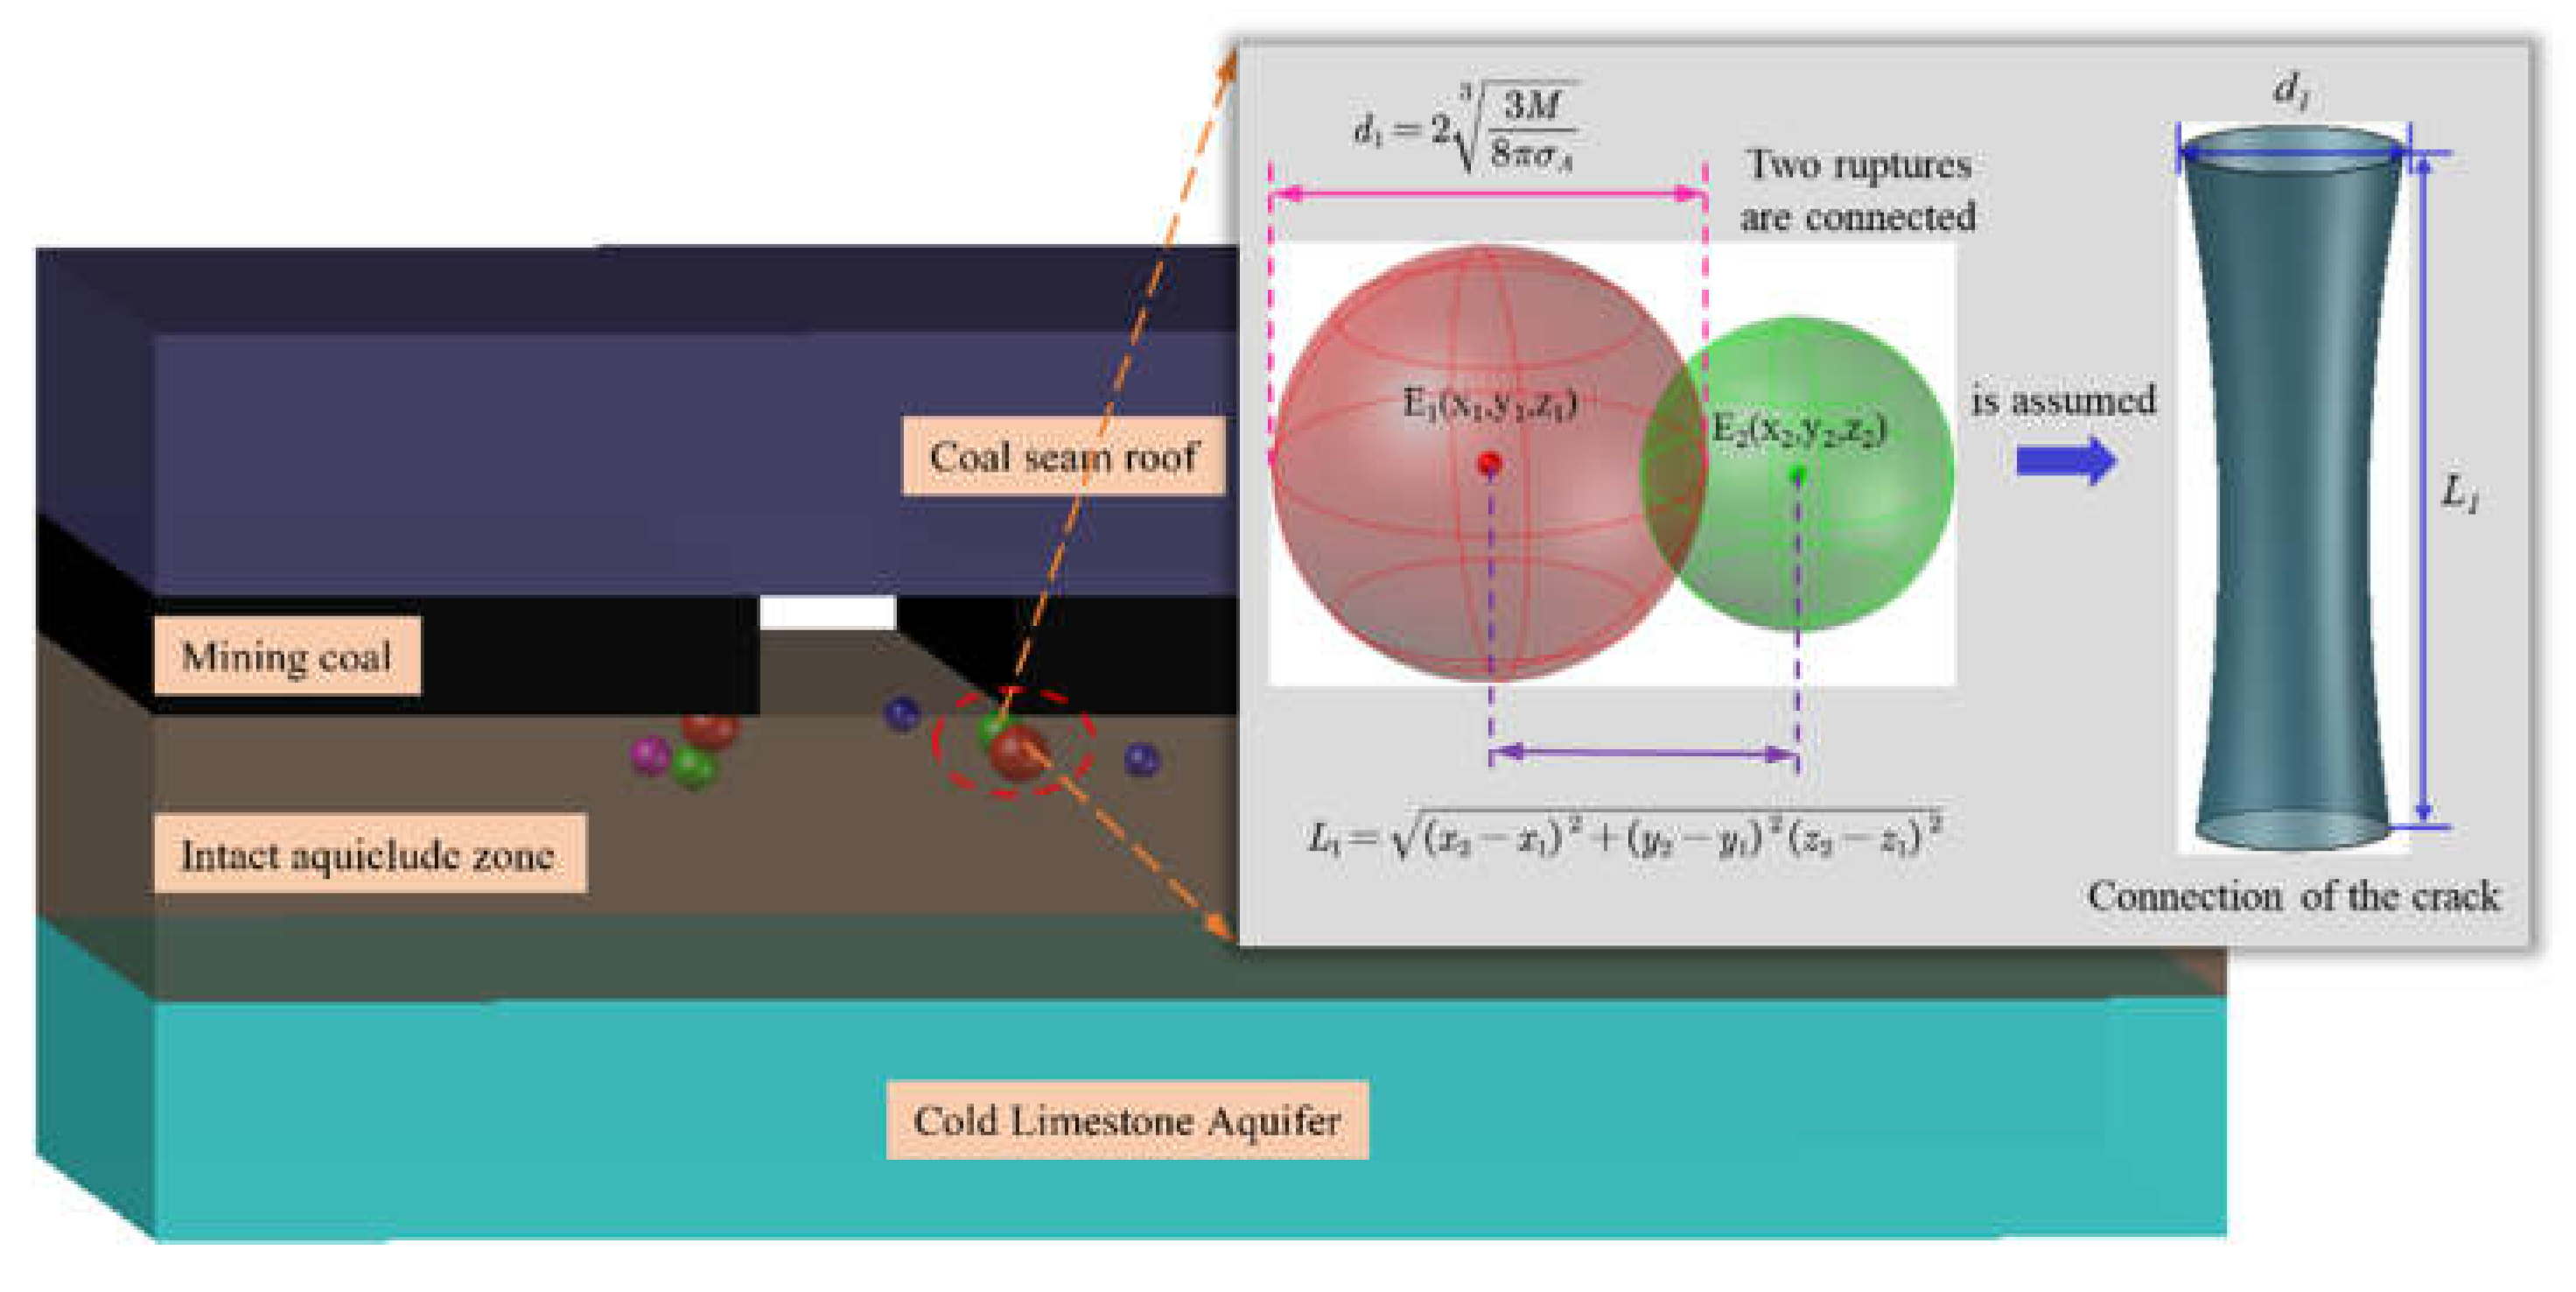
Figure 5.
"Glazed porcelain shape" feature of the floor water inrush channel.
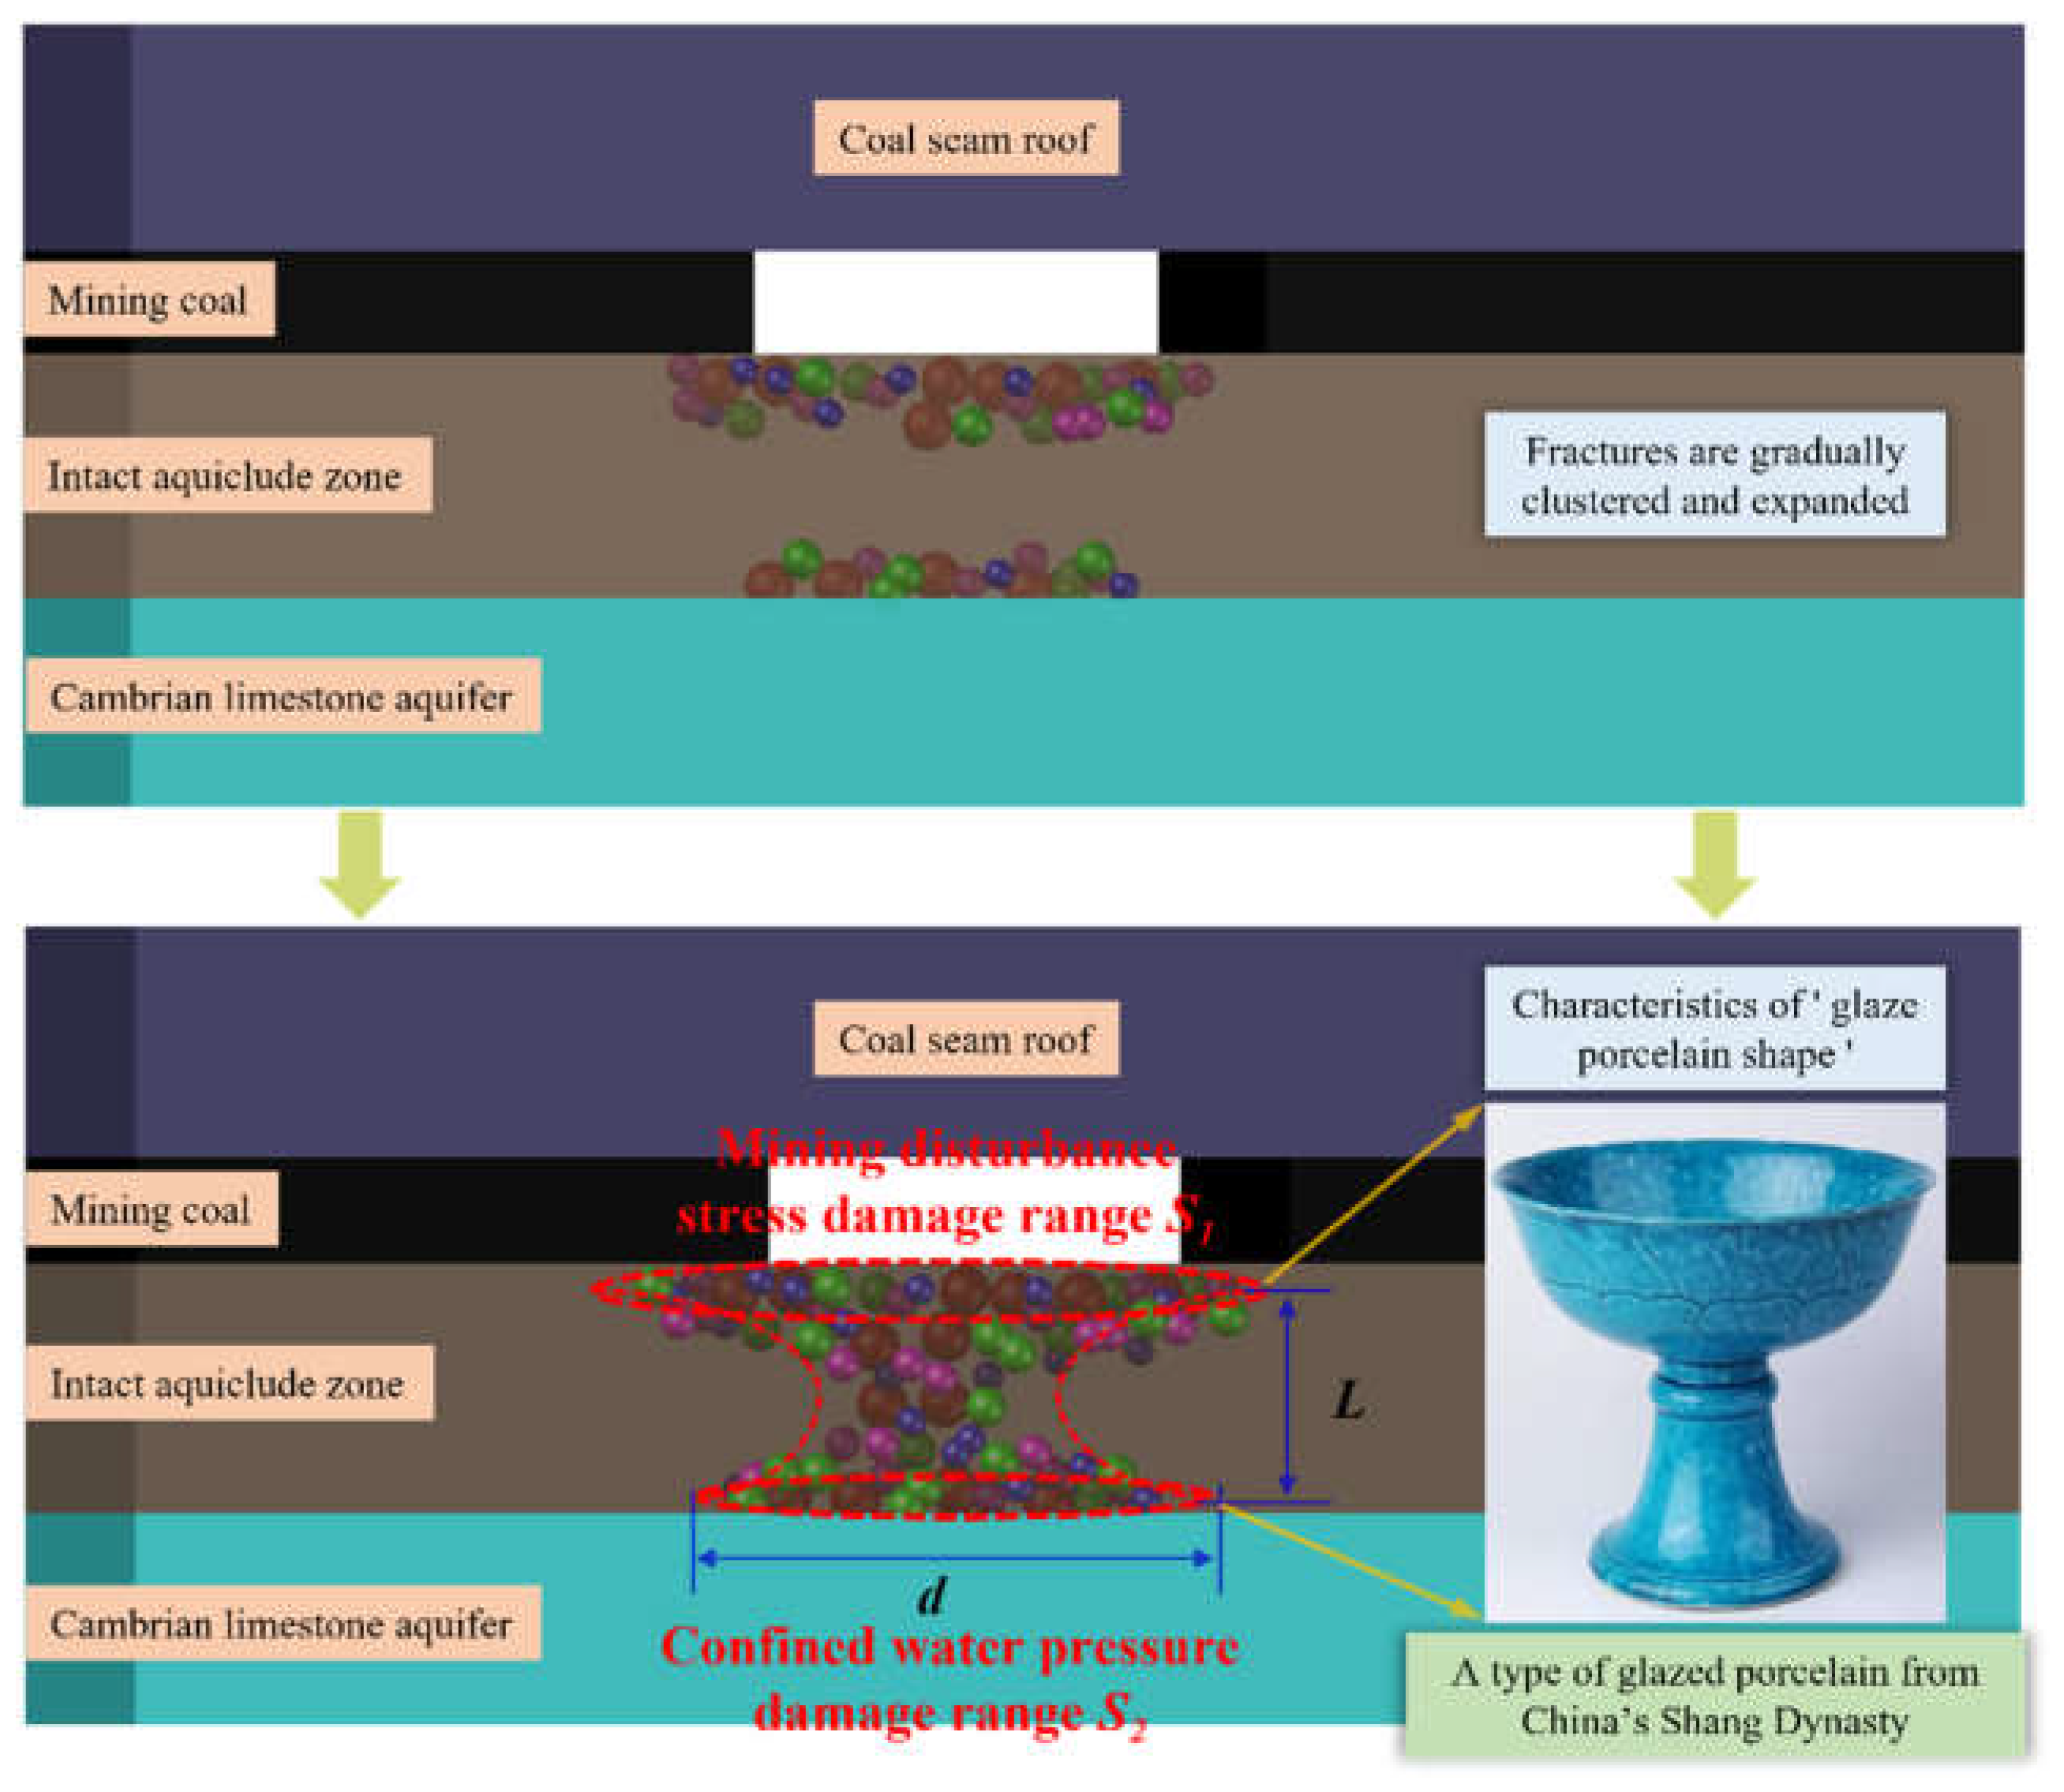
Figure 6.
Analysis of MS energy and frequency in the floor of Pingdingshan No. 10 Coal Mine.
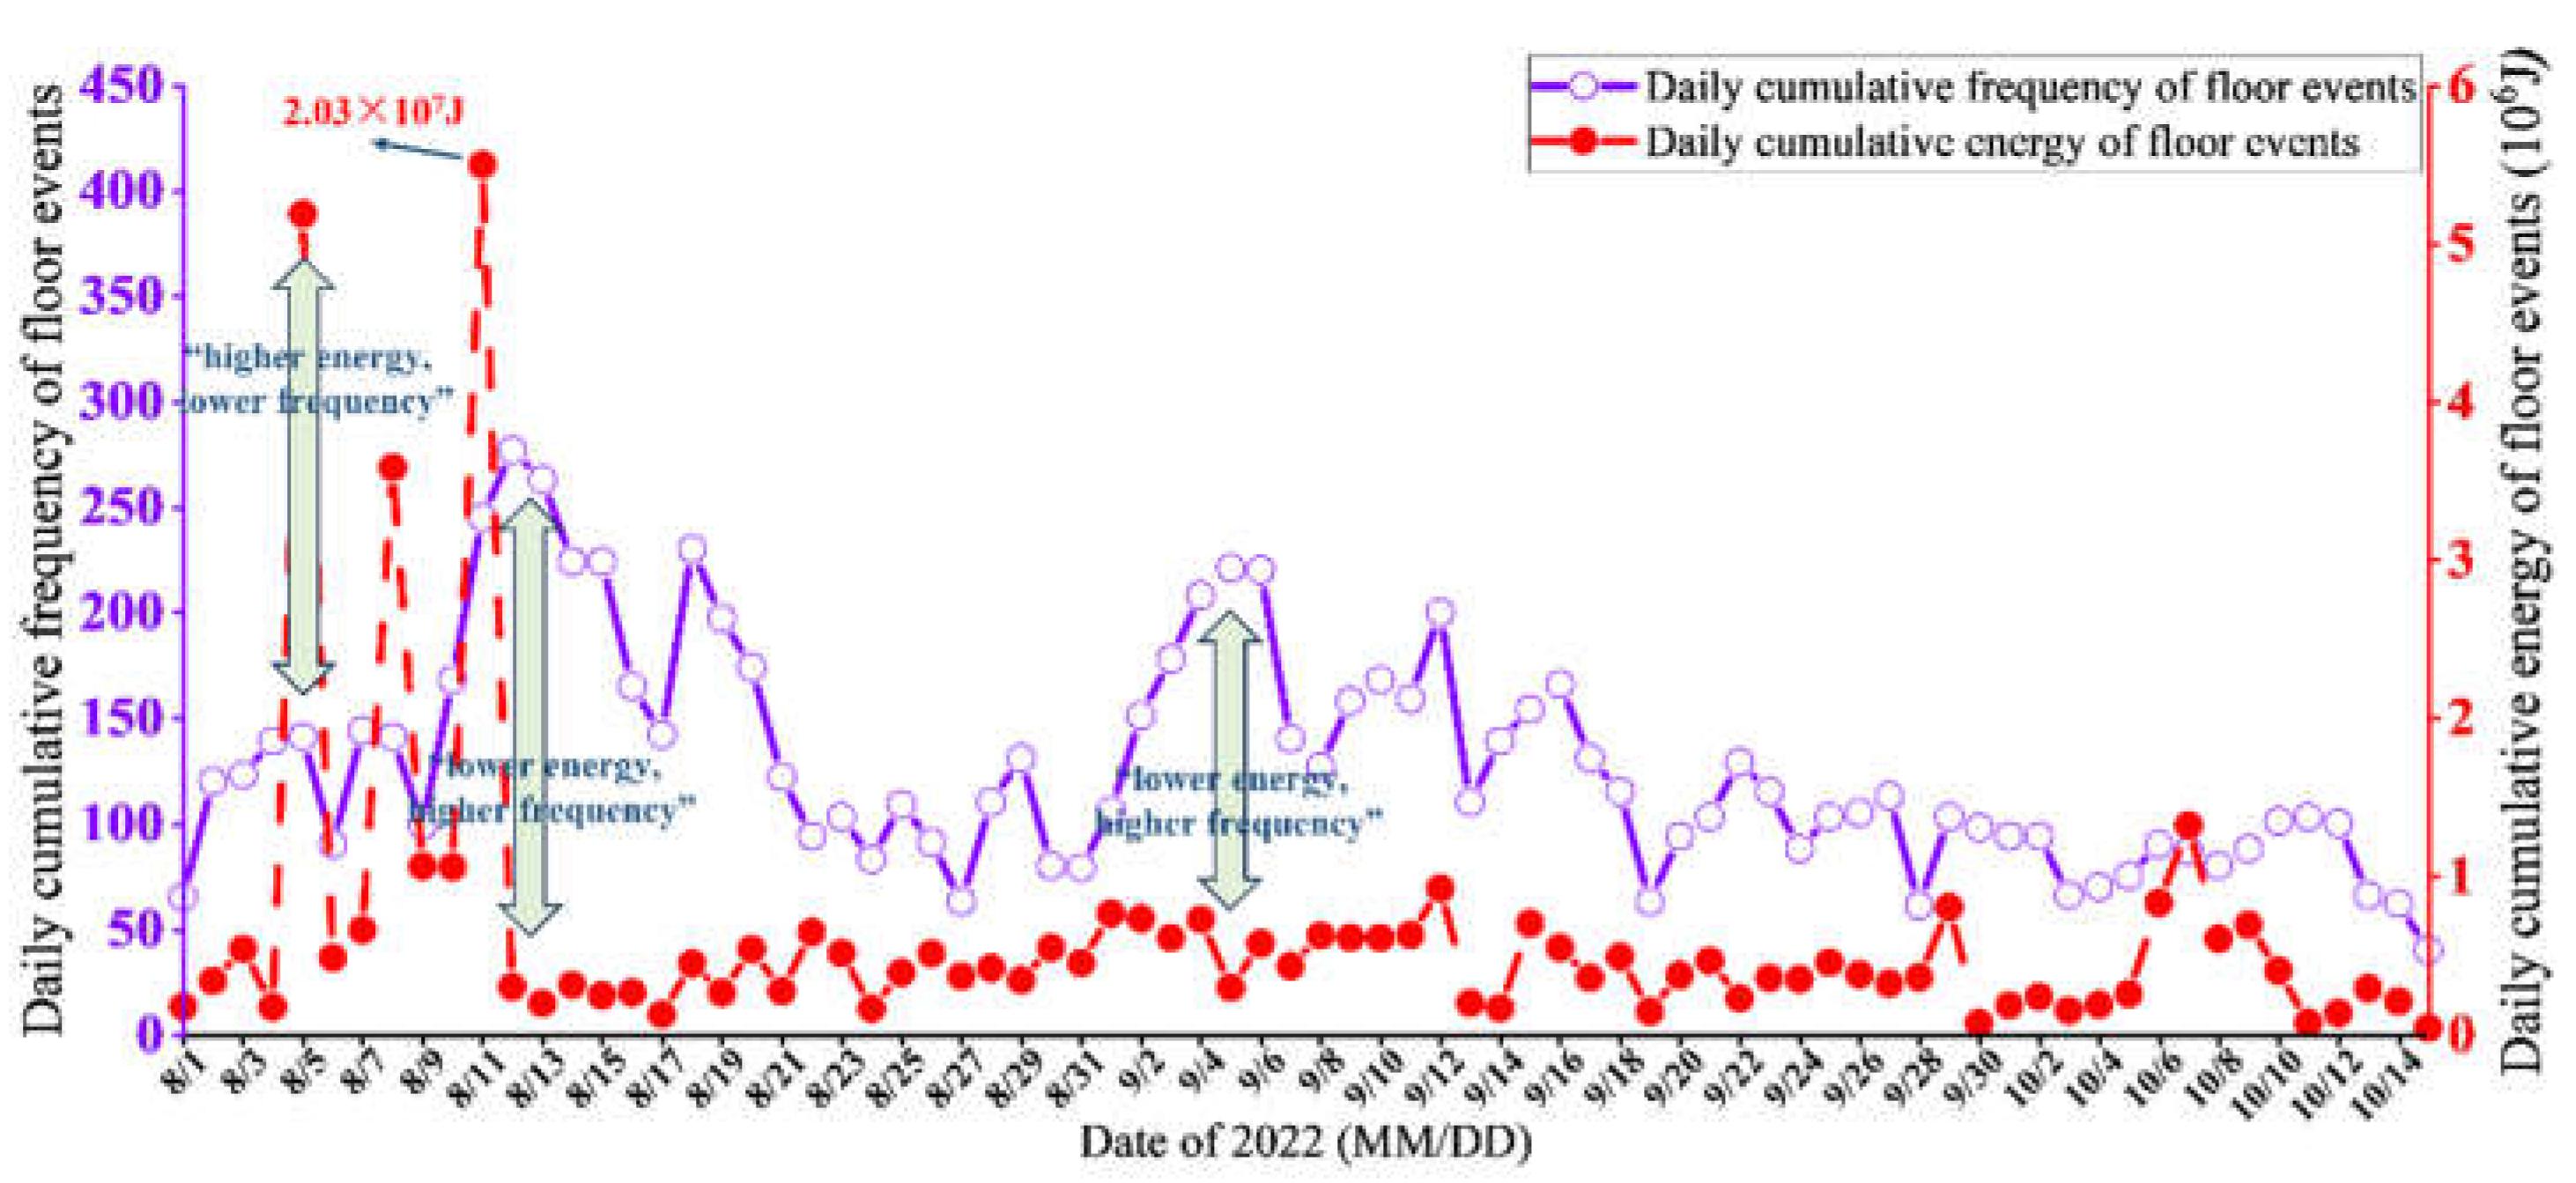
Figure 7.
Correlation between single high-energy events and water level in Pingdingshan No. 10 Coal Mine.
Figure 7.
Correlation between single high-energy events and water level in Pingdingshan No. 10 Coal Mine.
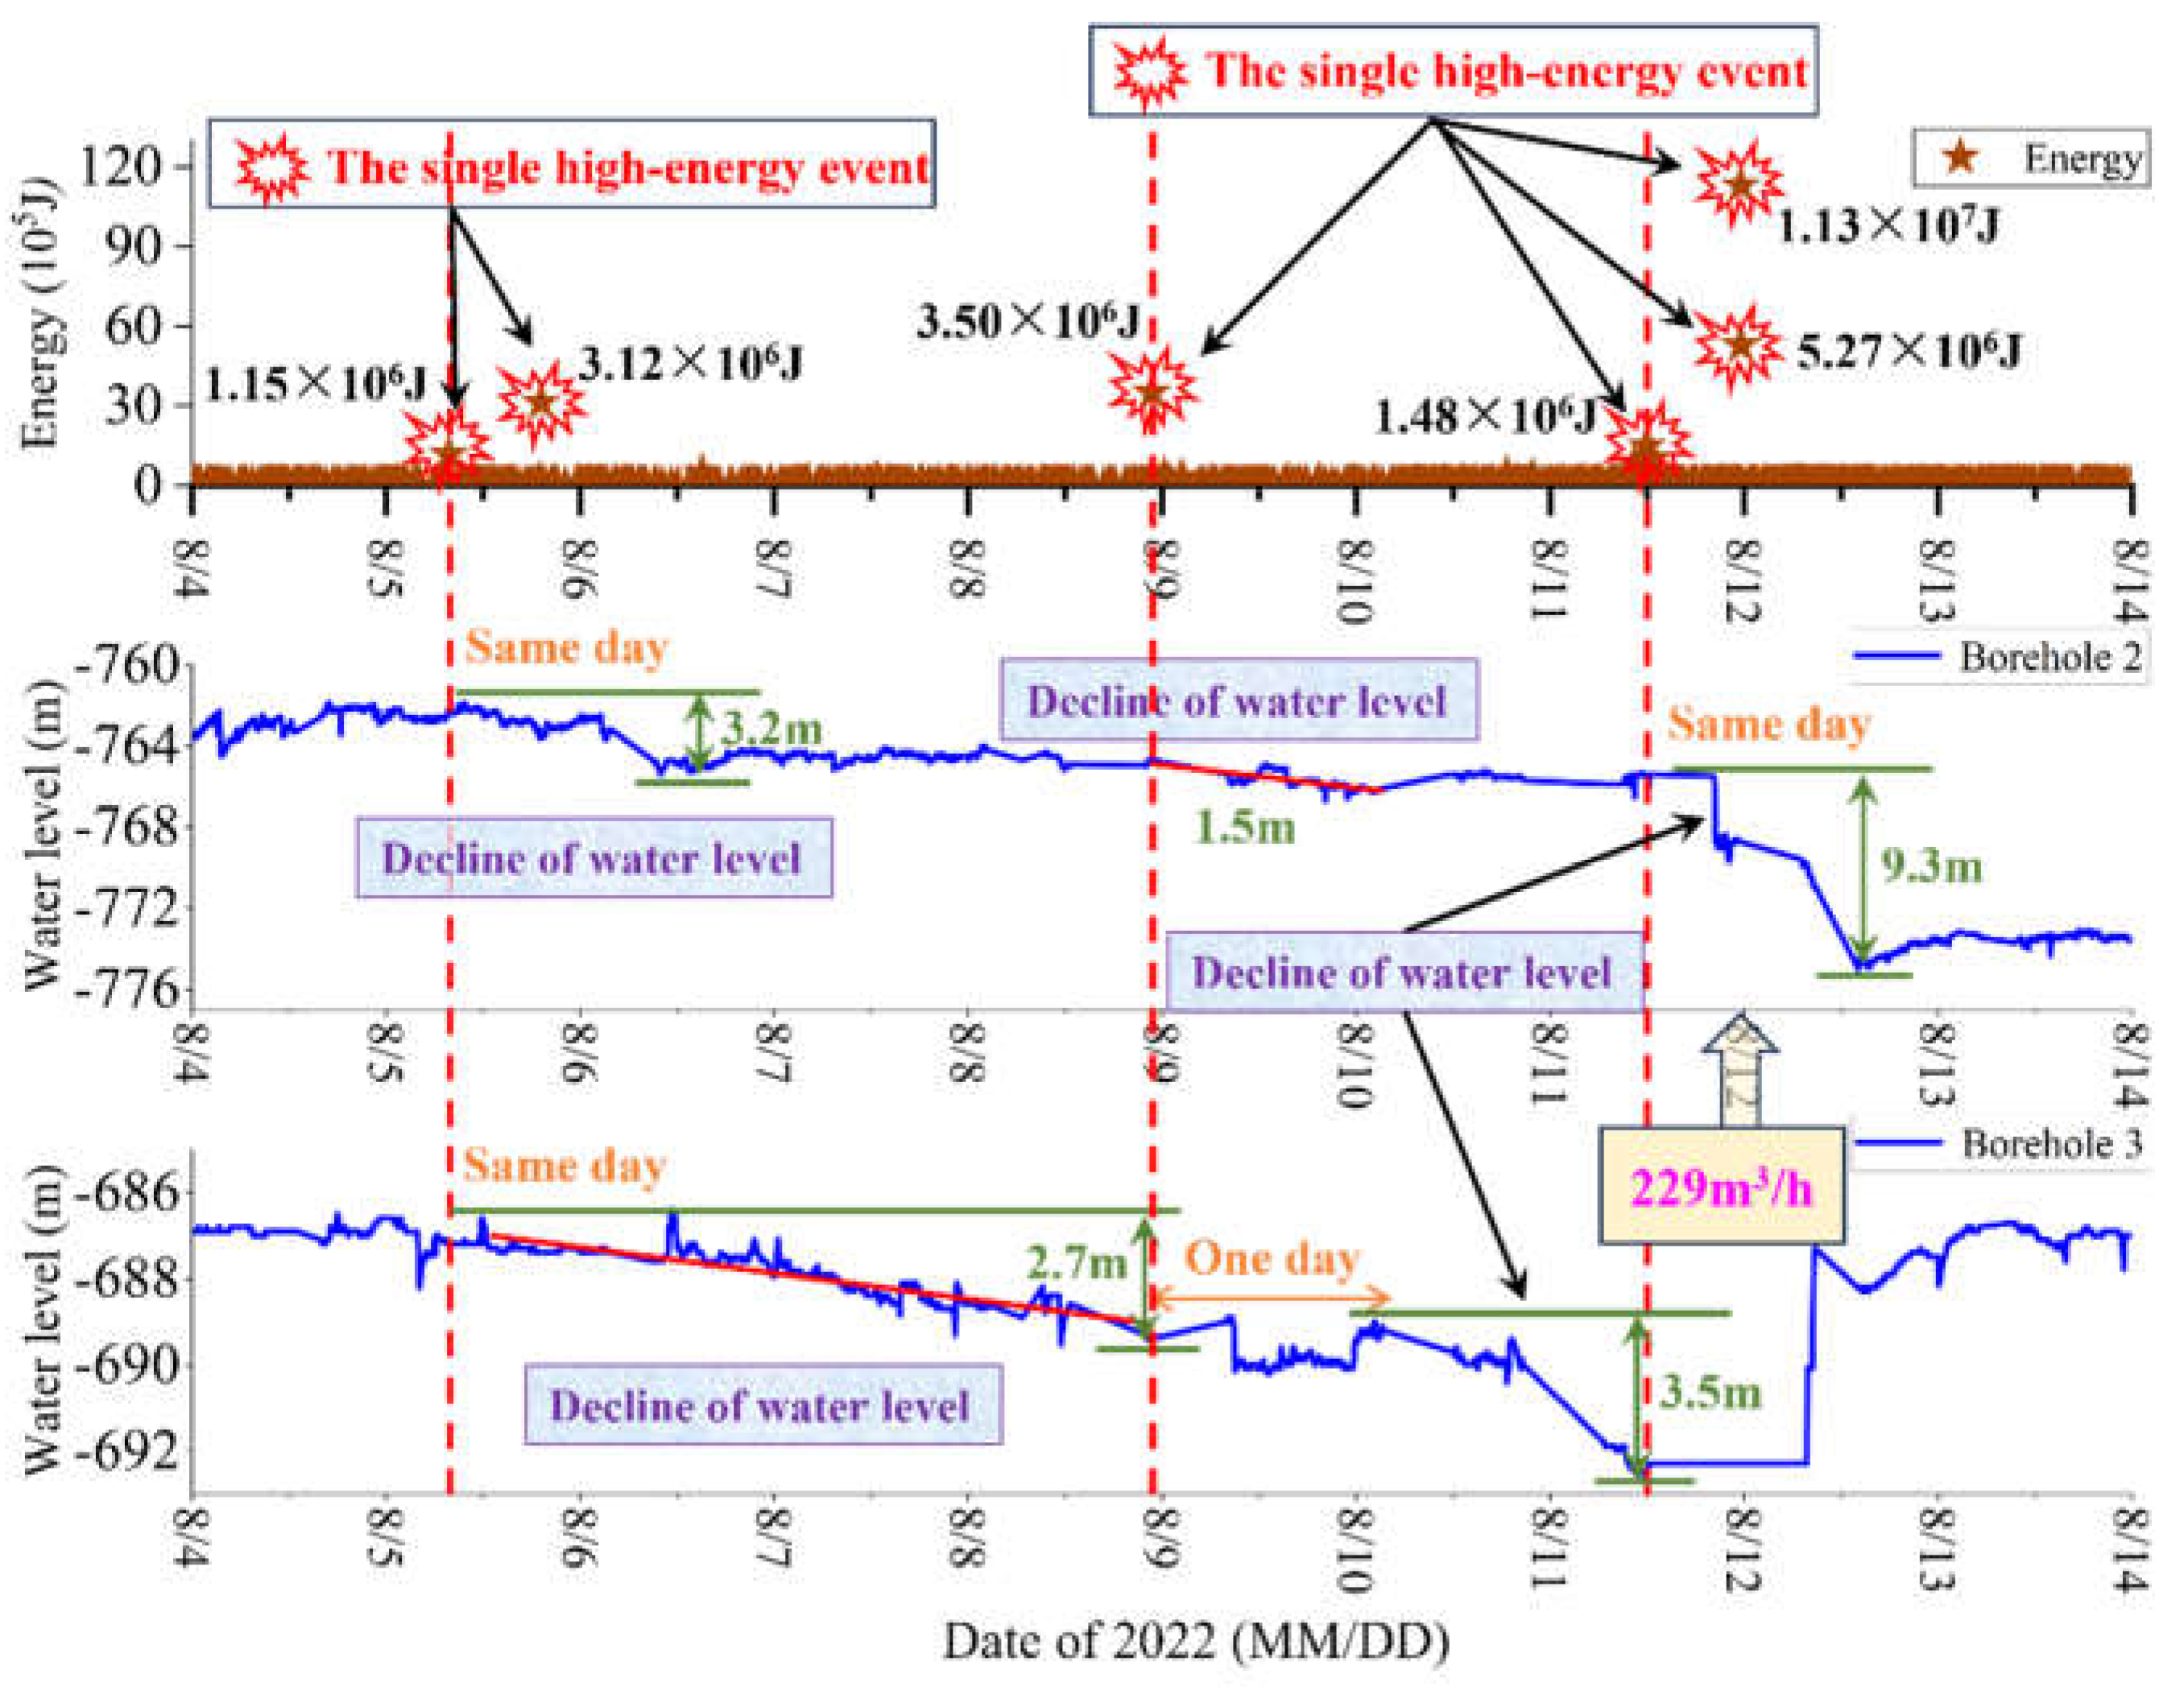
Figure 8.
Correlation between high daily cumulative energy and water level in Pingdingshan No. 10 Coal Mine.
Figure 8.
Correlation between high daily cumulative energy and water level in Pingdingshan No. 10 Coal Mine.
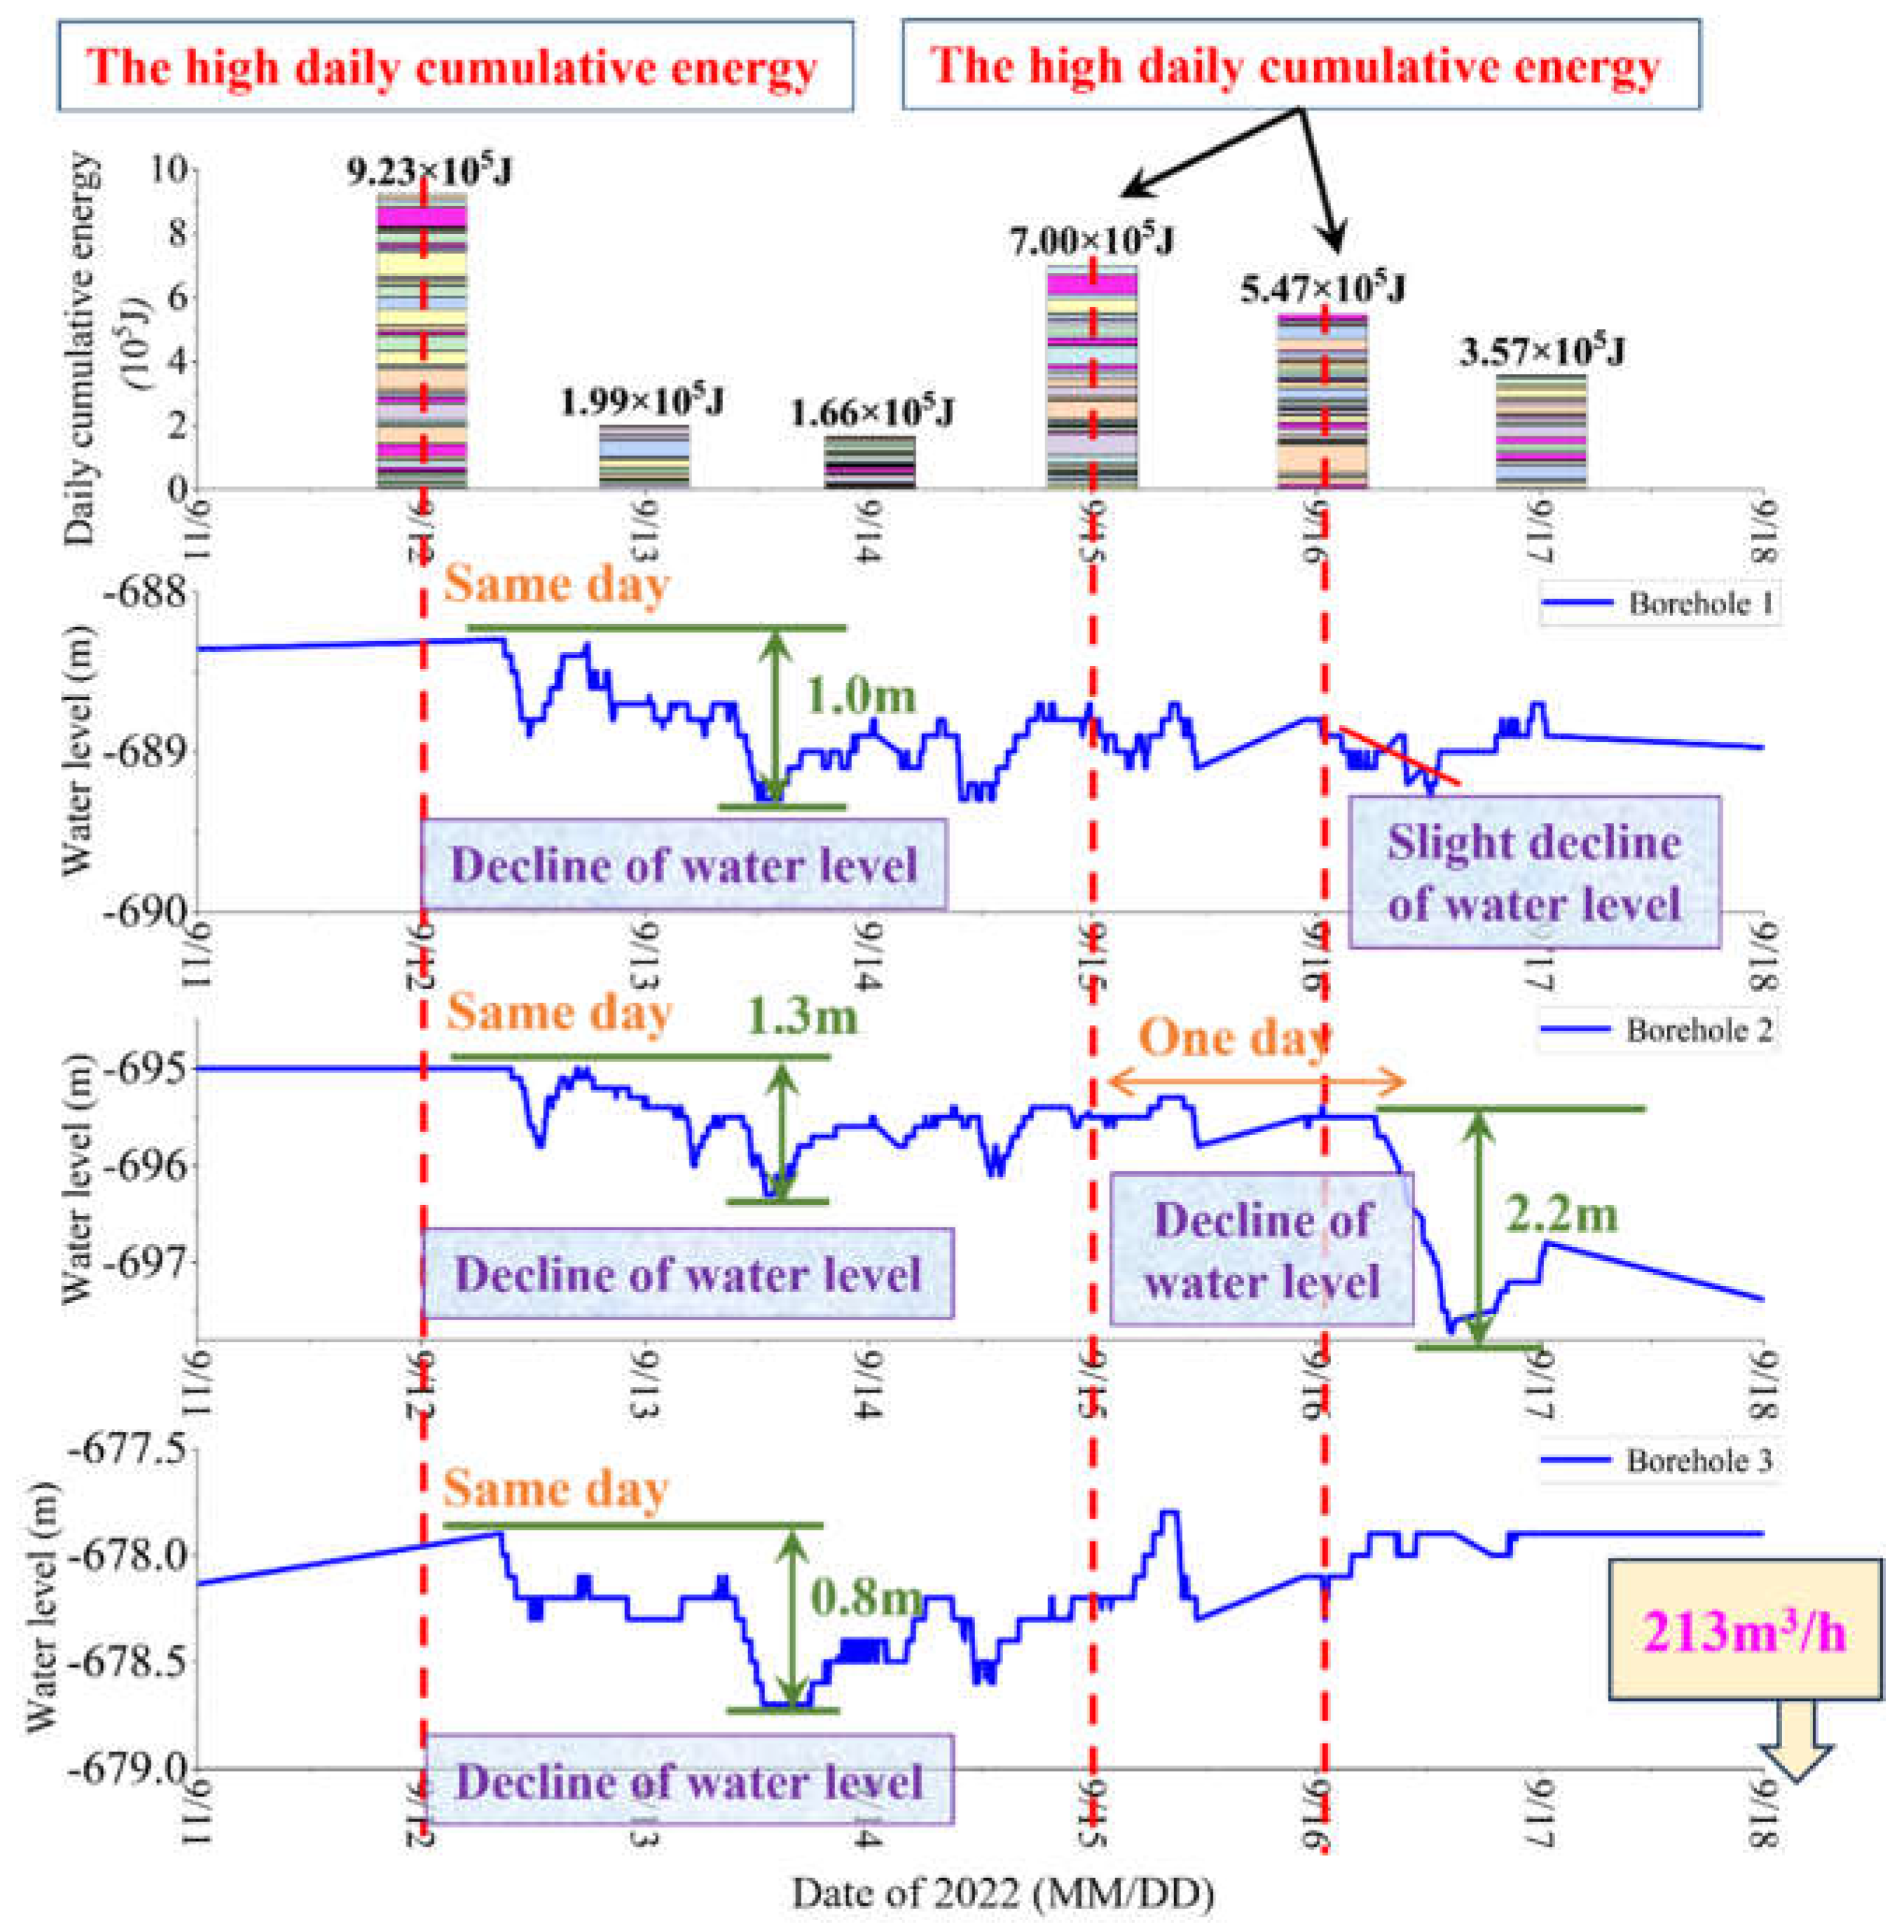
Figure 9.
Flowchart of the GA training process.
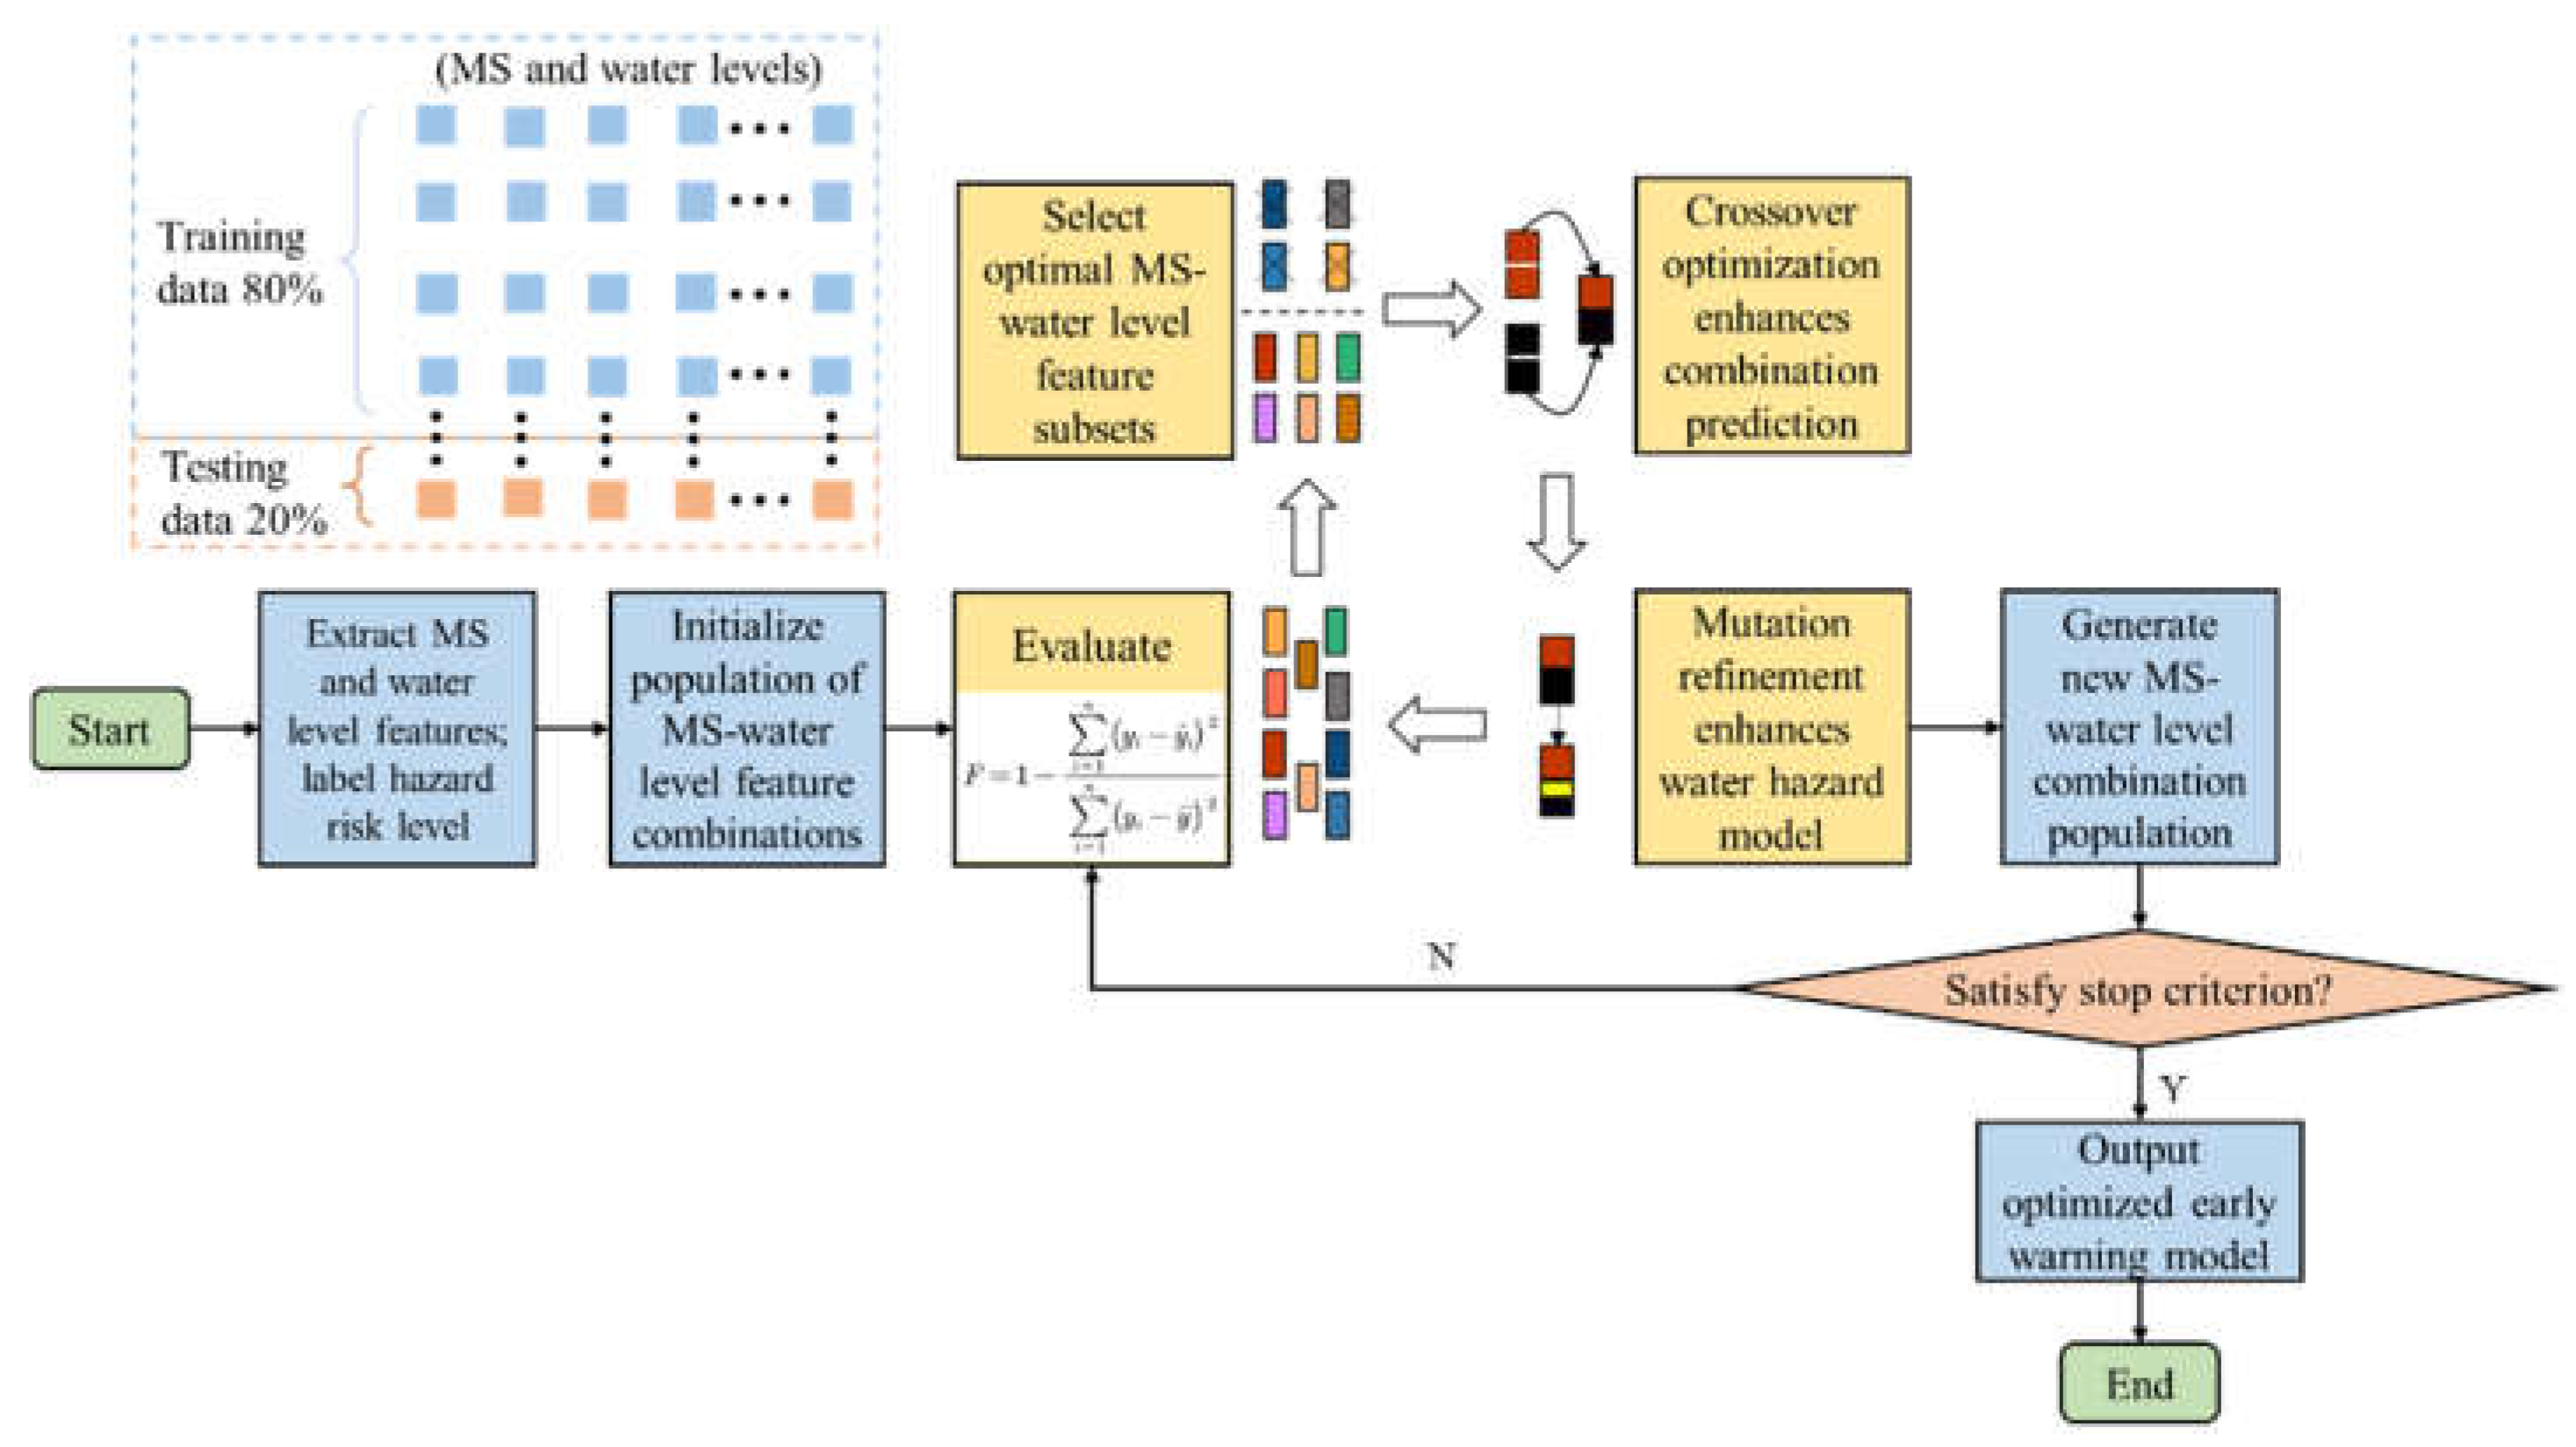
Figure 10.
Hierarchical analytic structure model.
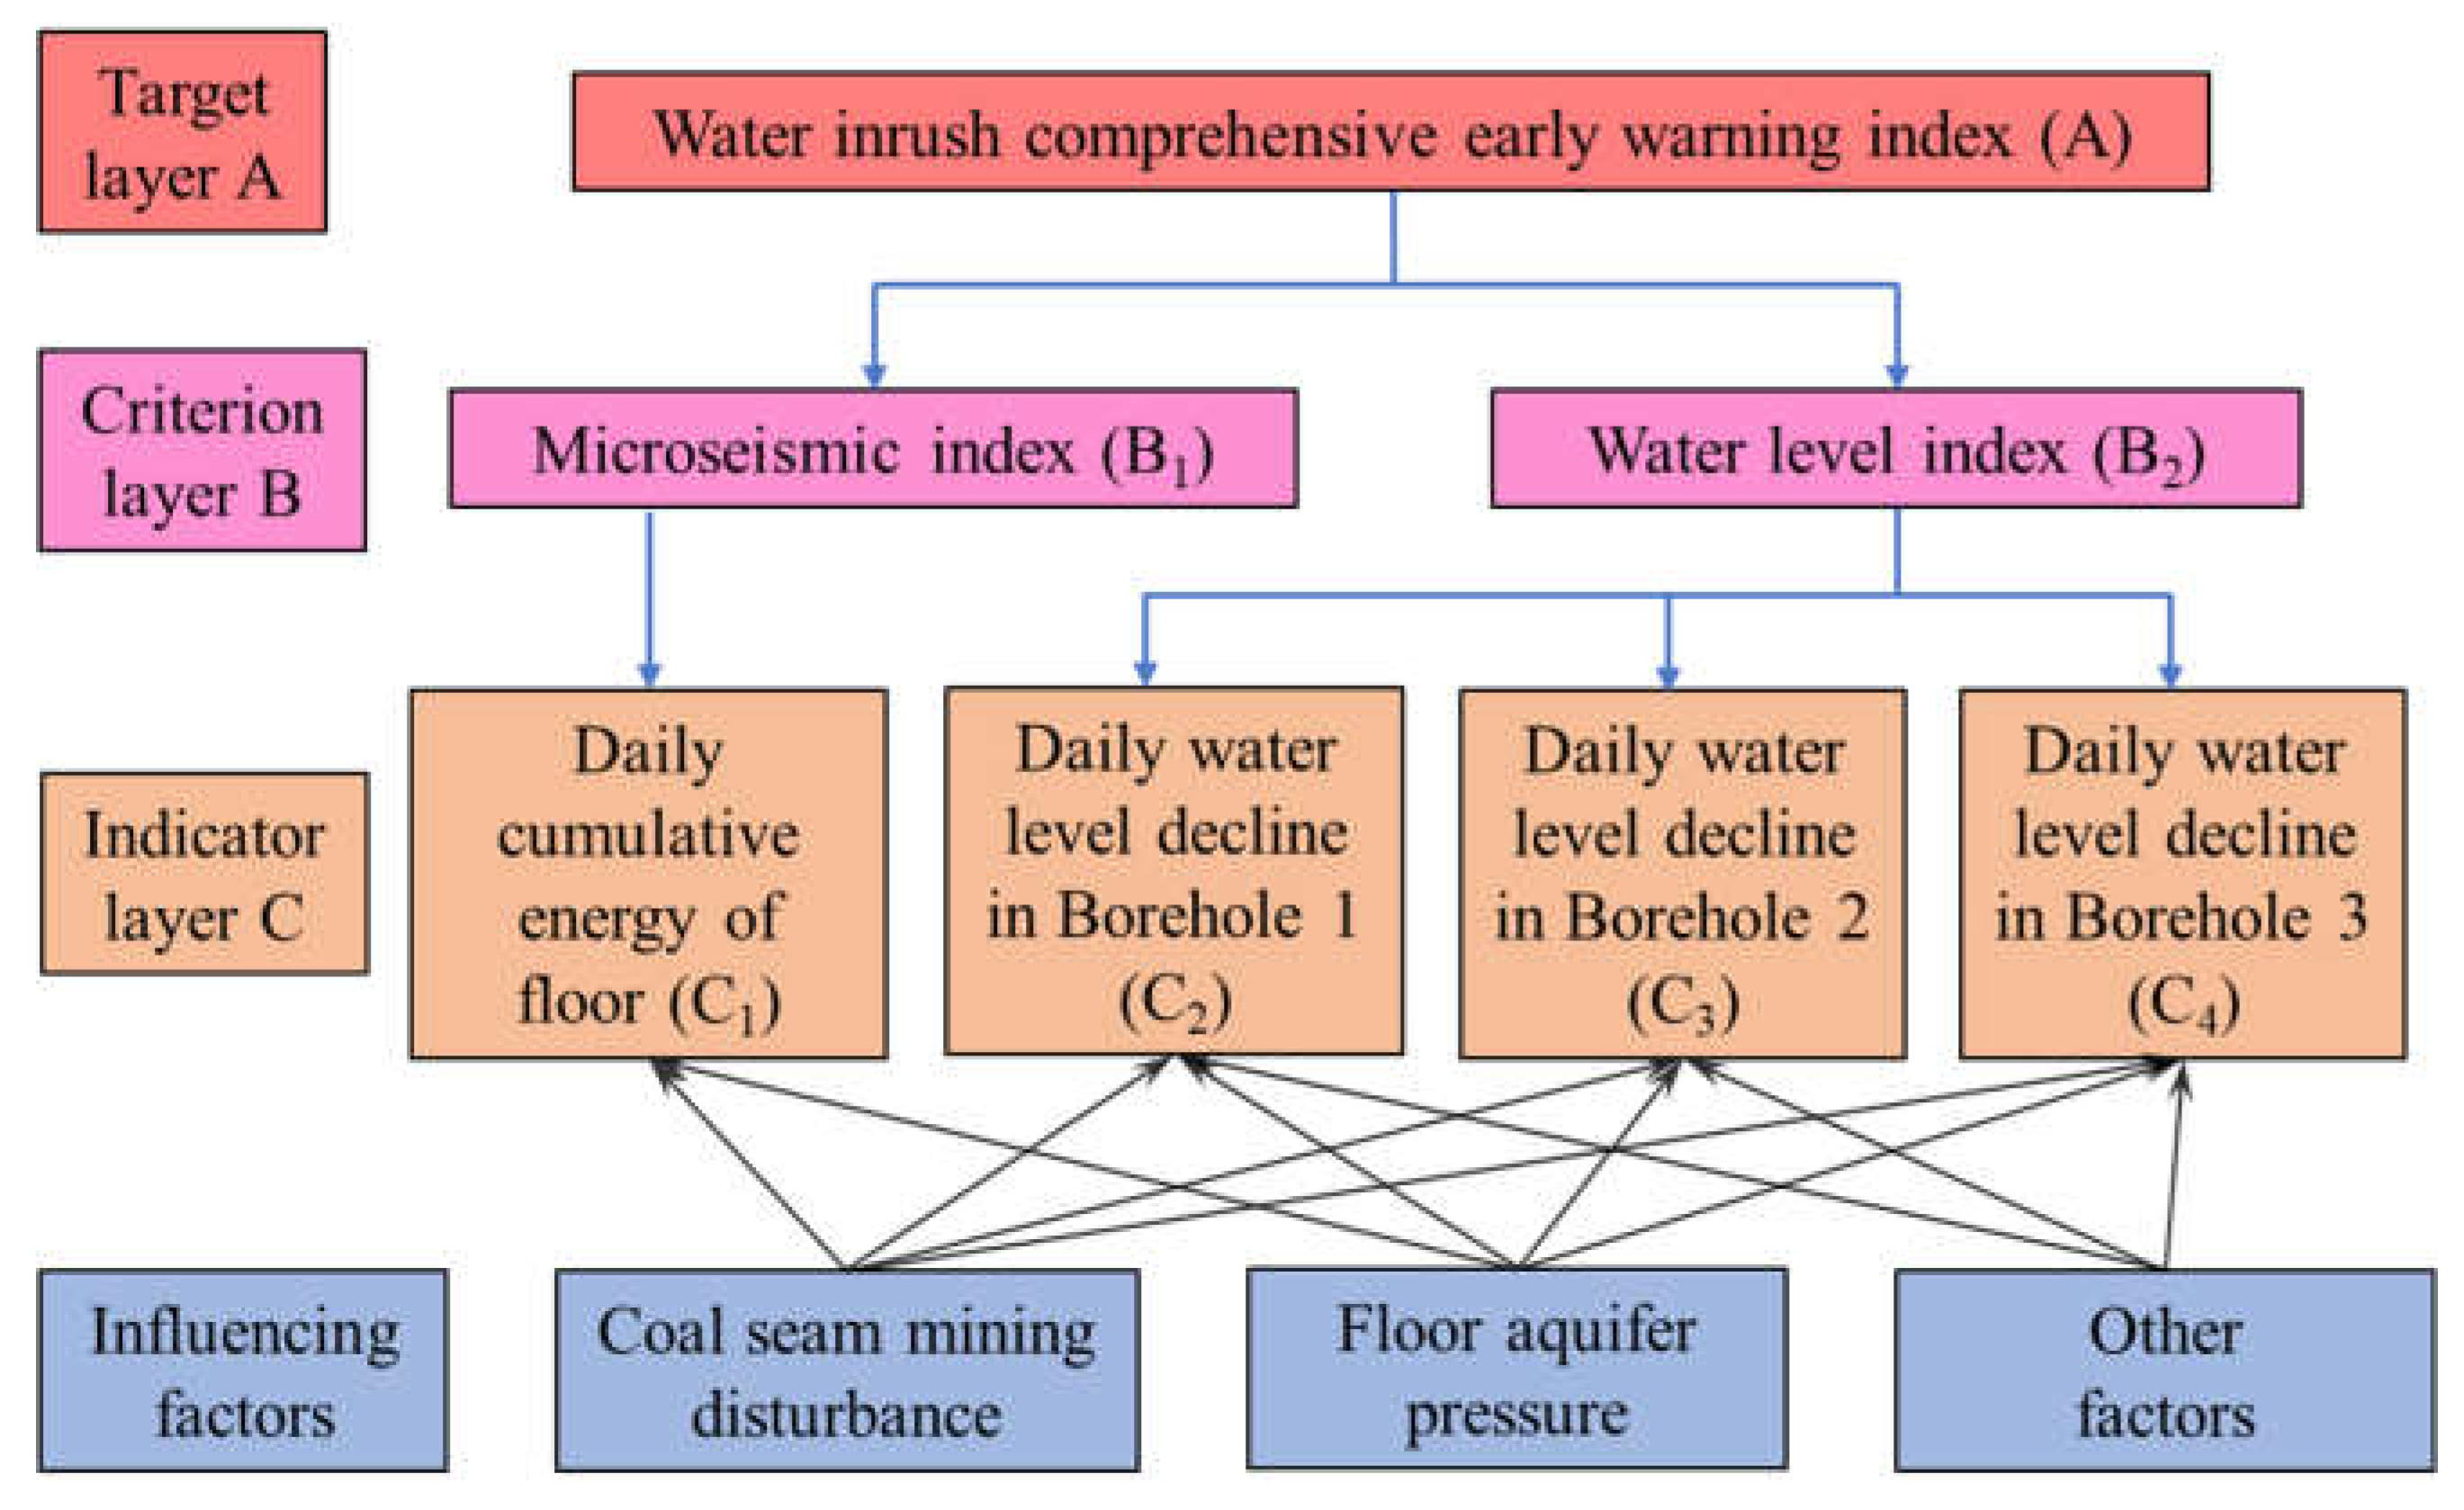
Figure 11.
RF model architecture.
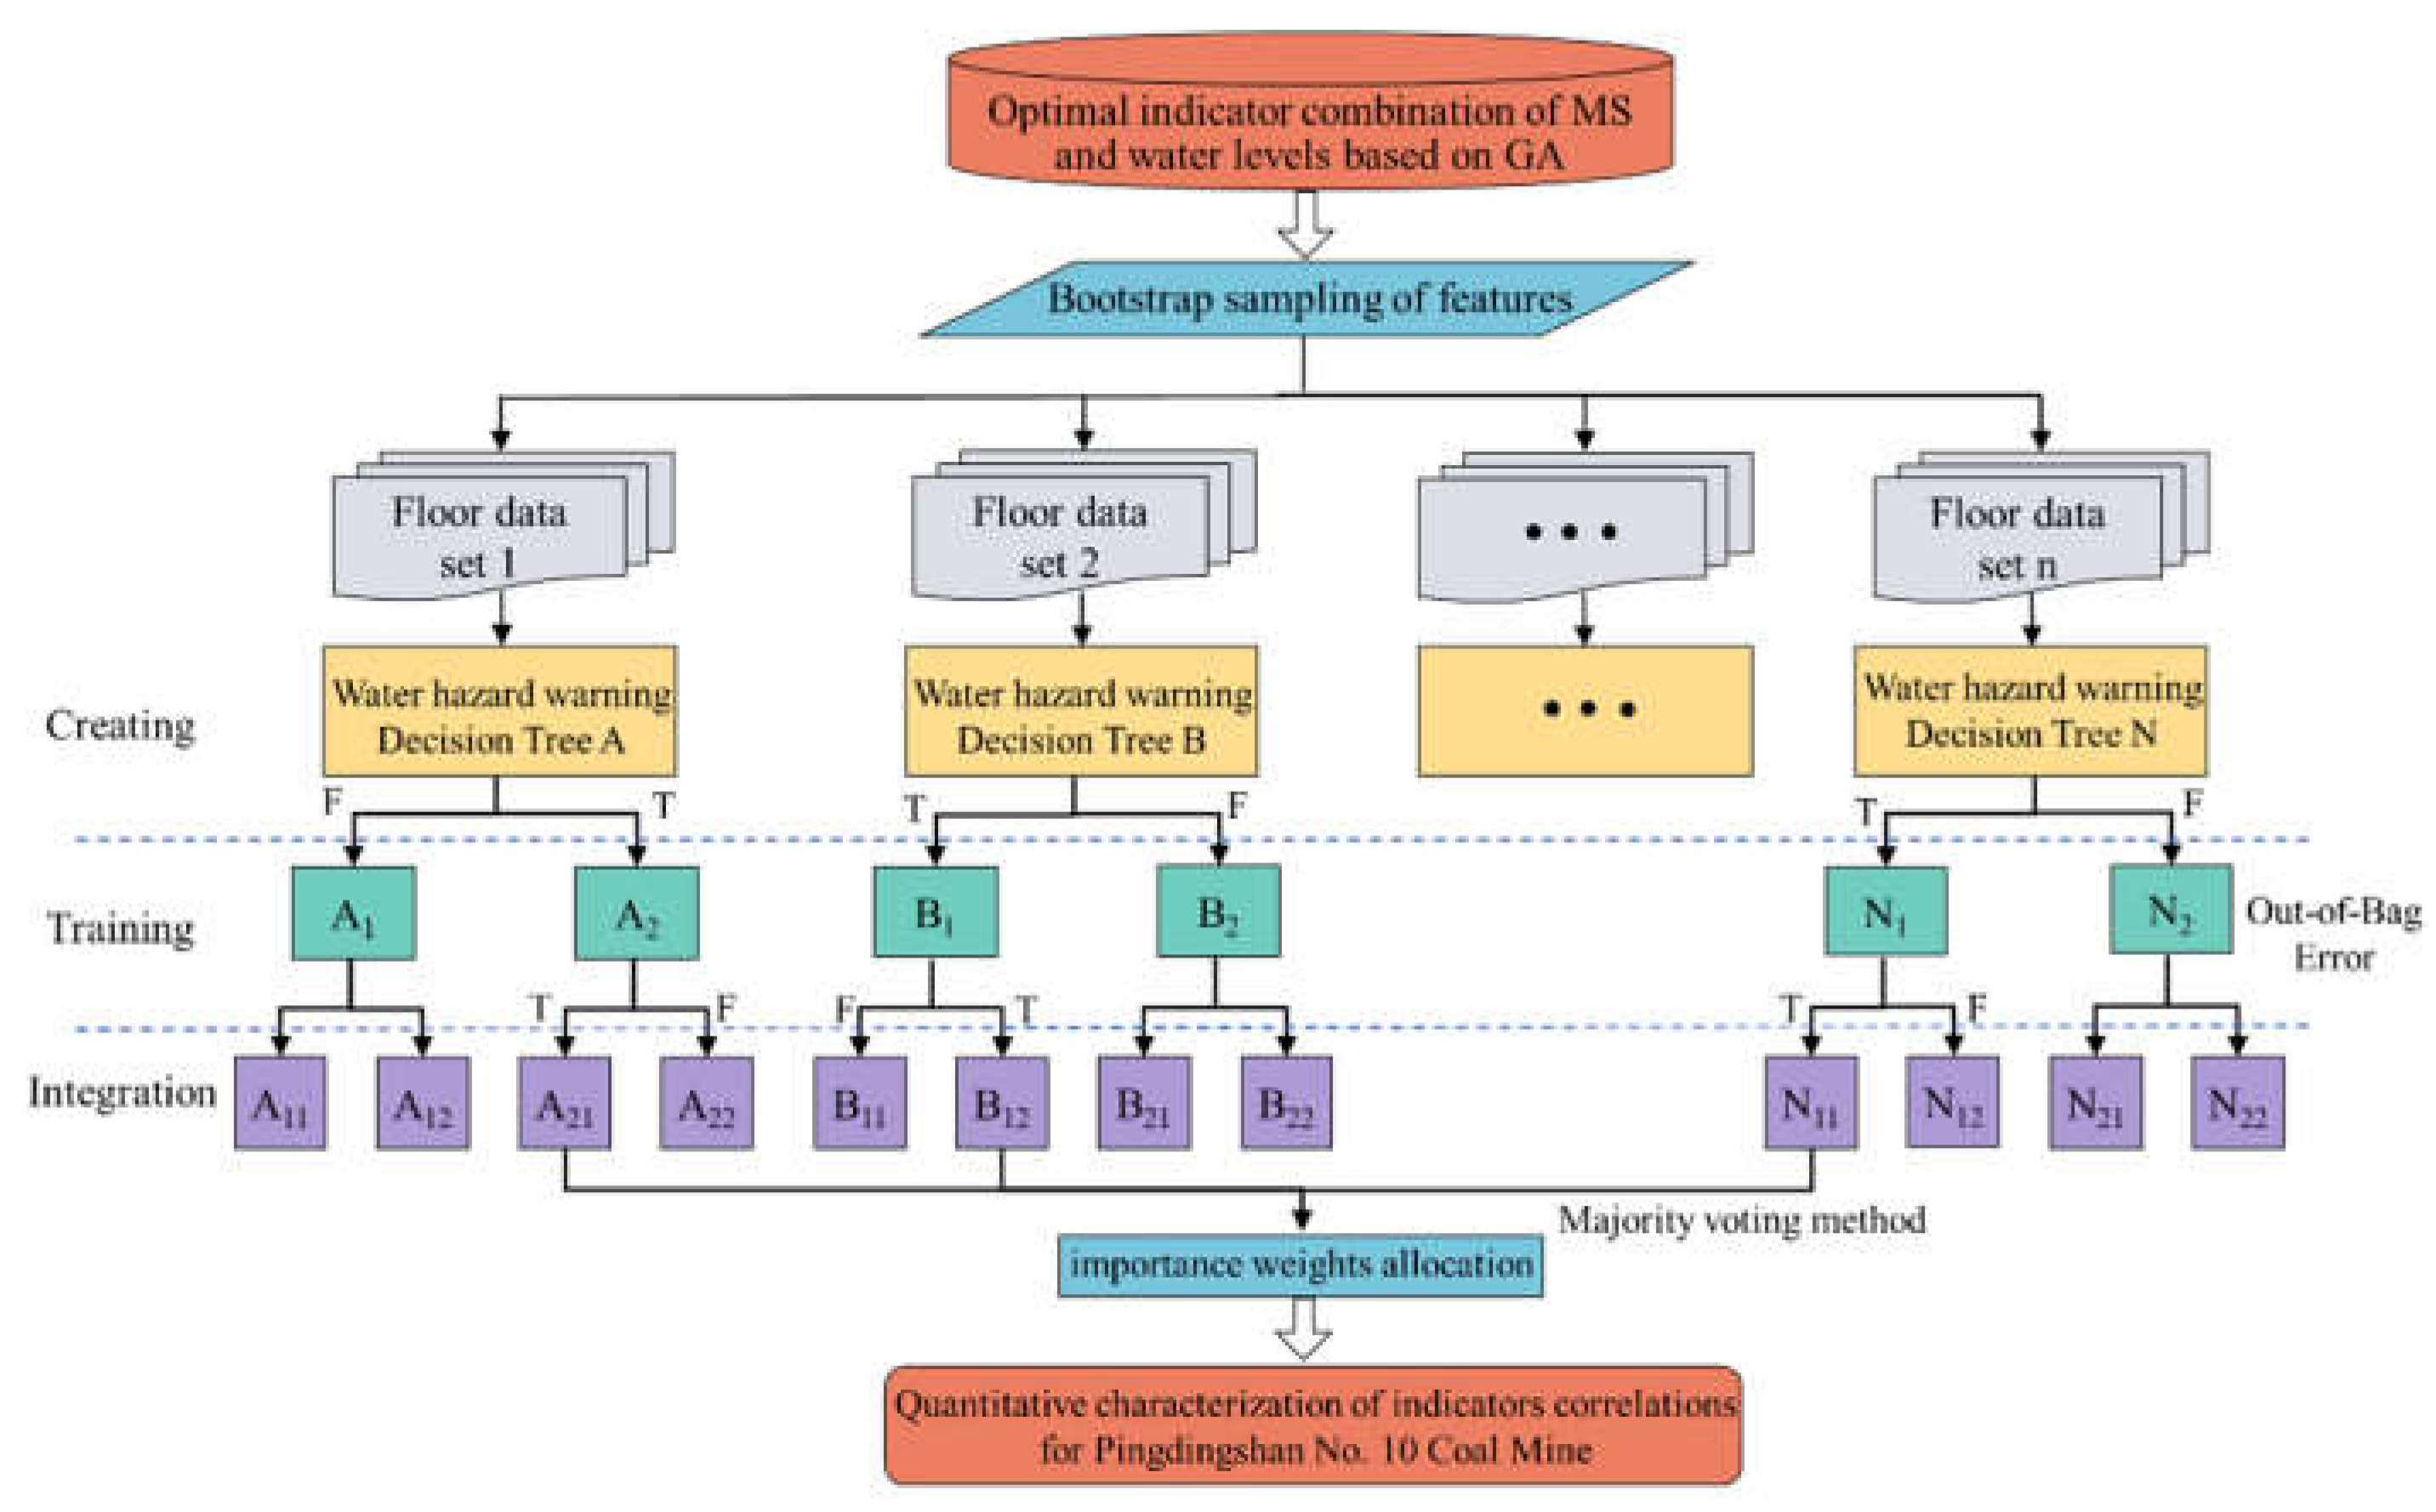
Figure 12.
Indicator weight allocation results. (a) AHP importance assessment; (b) RF importance assessment.
Figure 12.
Indicator weight allocation results. (a) AHP importance assessment; (b) RF importance assessment.
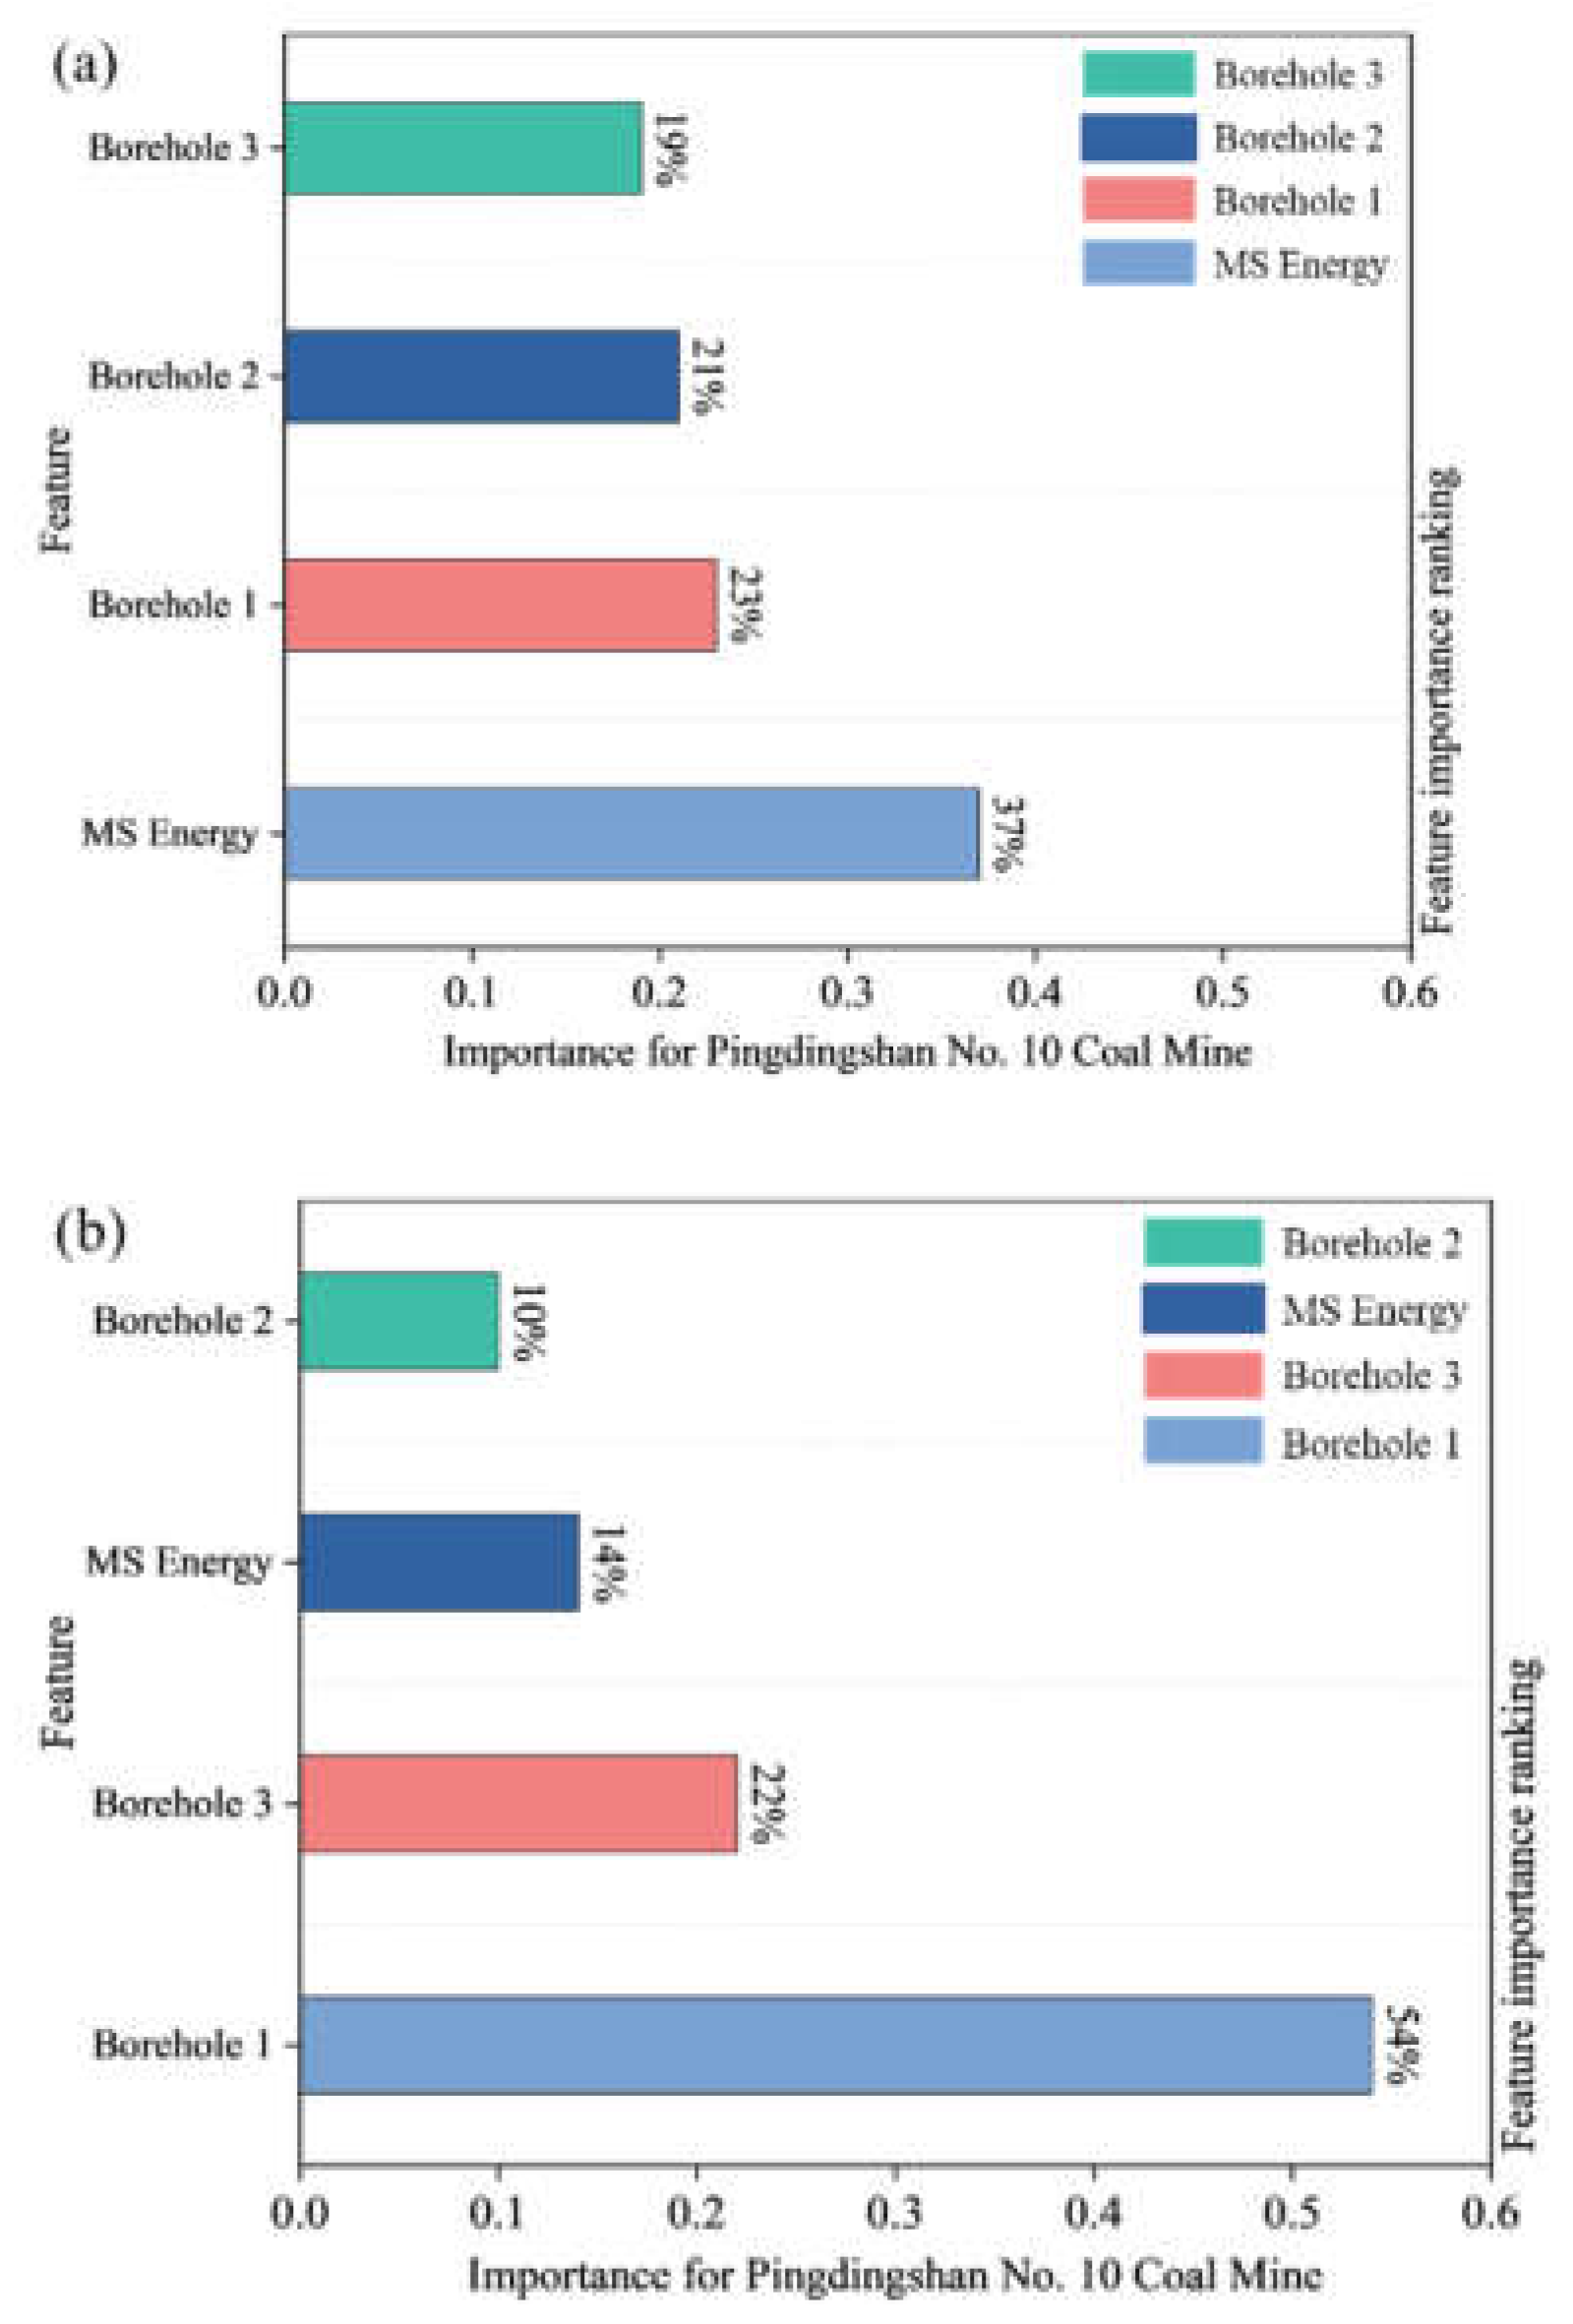
Figure 13.
Application analysis of univariate index at Pingdingshan No. 10 Coal Mine: a) MS index early warning effect; b) Water level index early warning effect.
Figure 13.
Application analysis of univariate index at Pingdingshan No. 10 Coal Mine: a) MS index early warning effect; b) Water level index early warning effect.
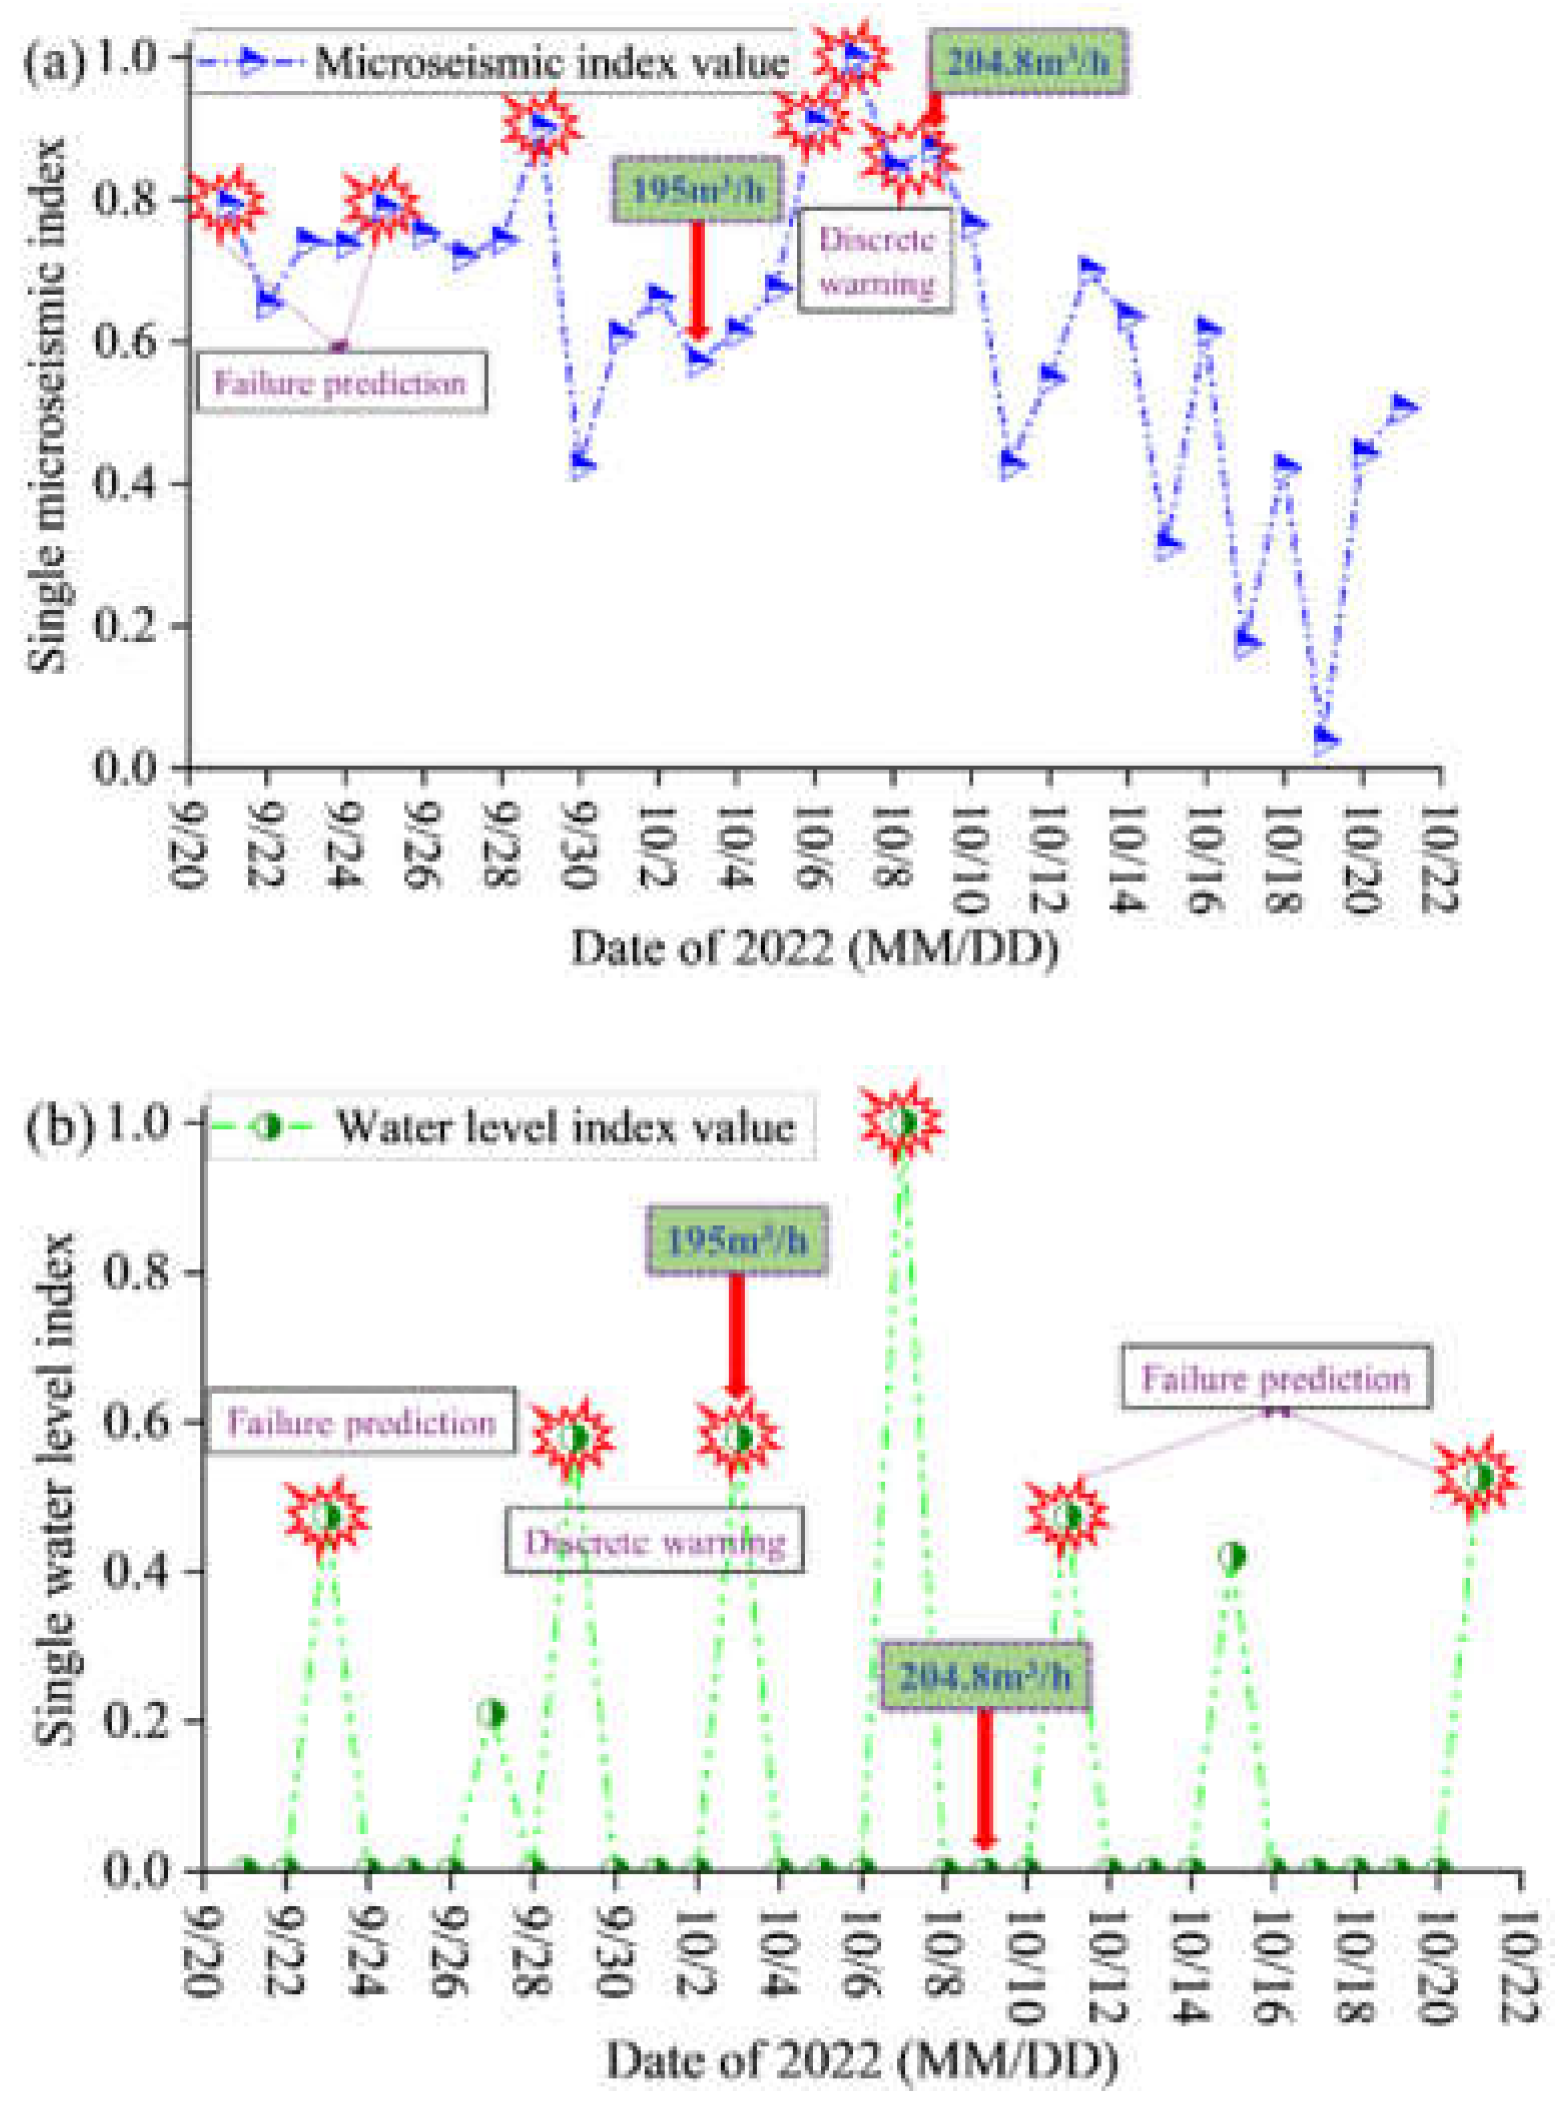
Figure 14.
Application effect analysis of comprehensive index at Pingdingshan No. 10 Coal Mine.
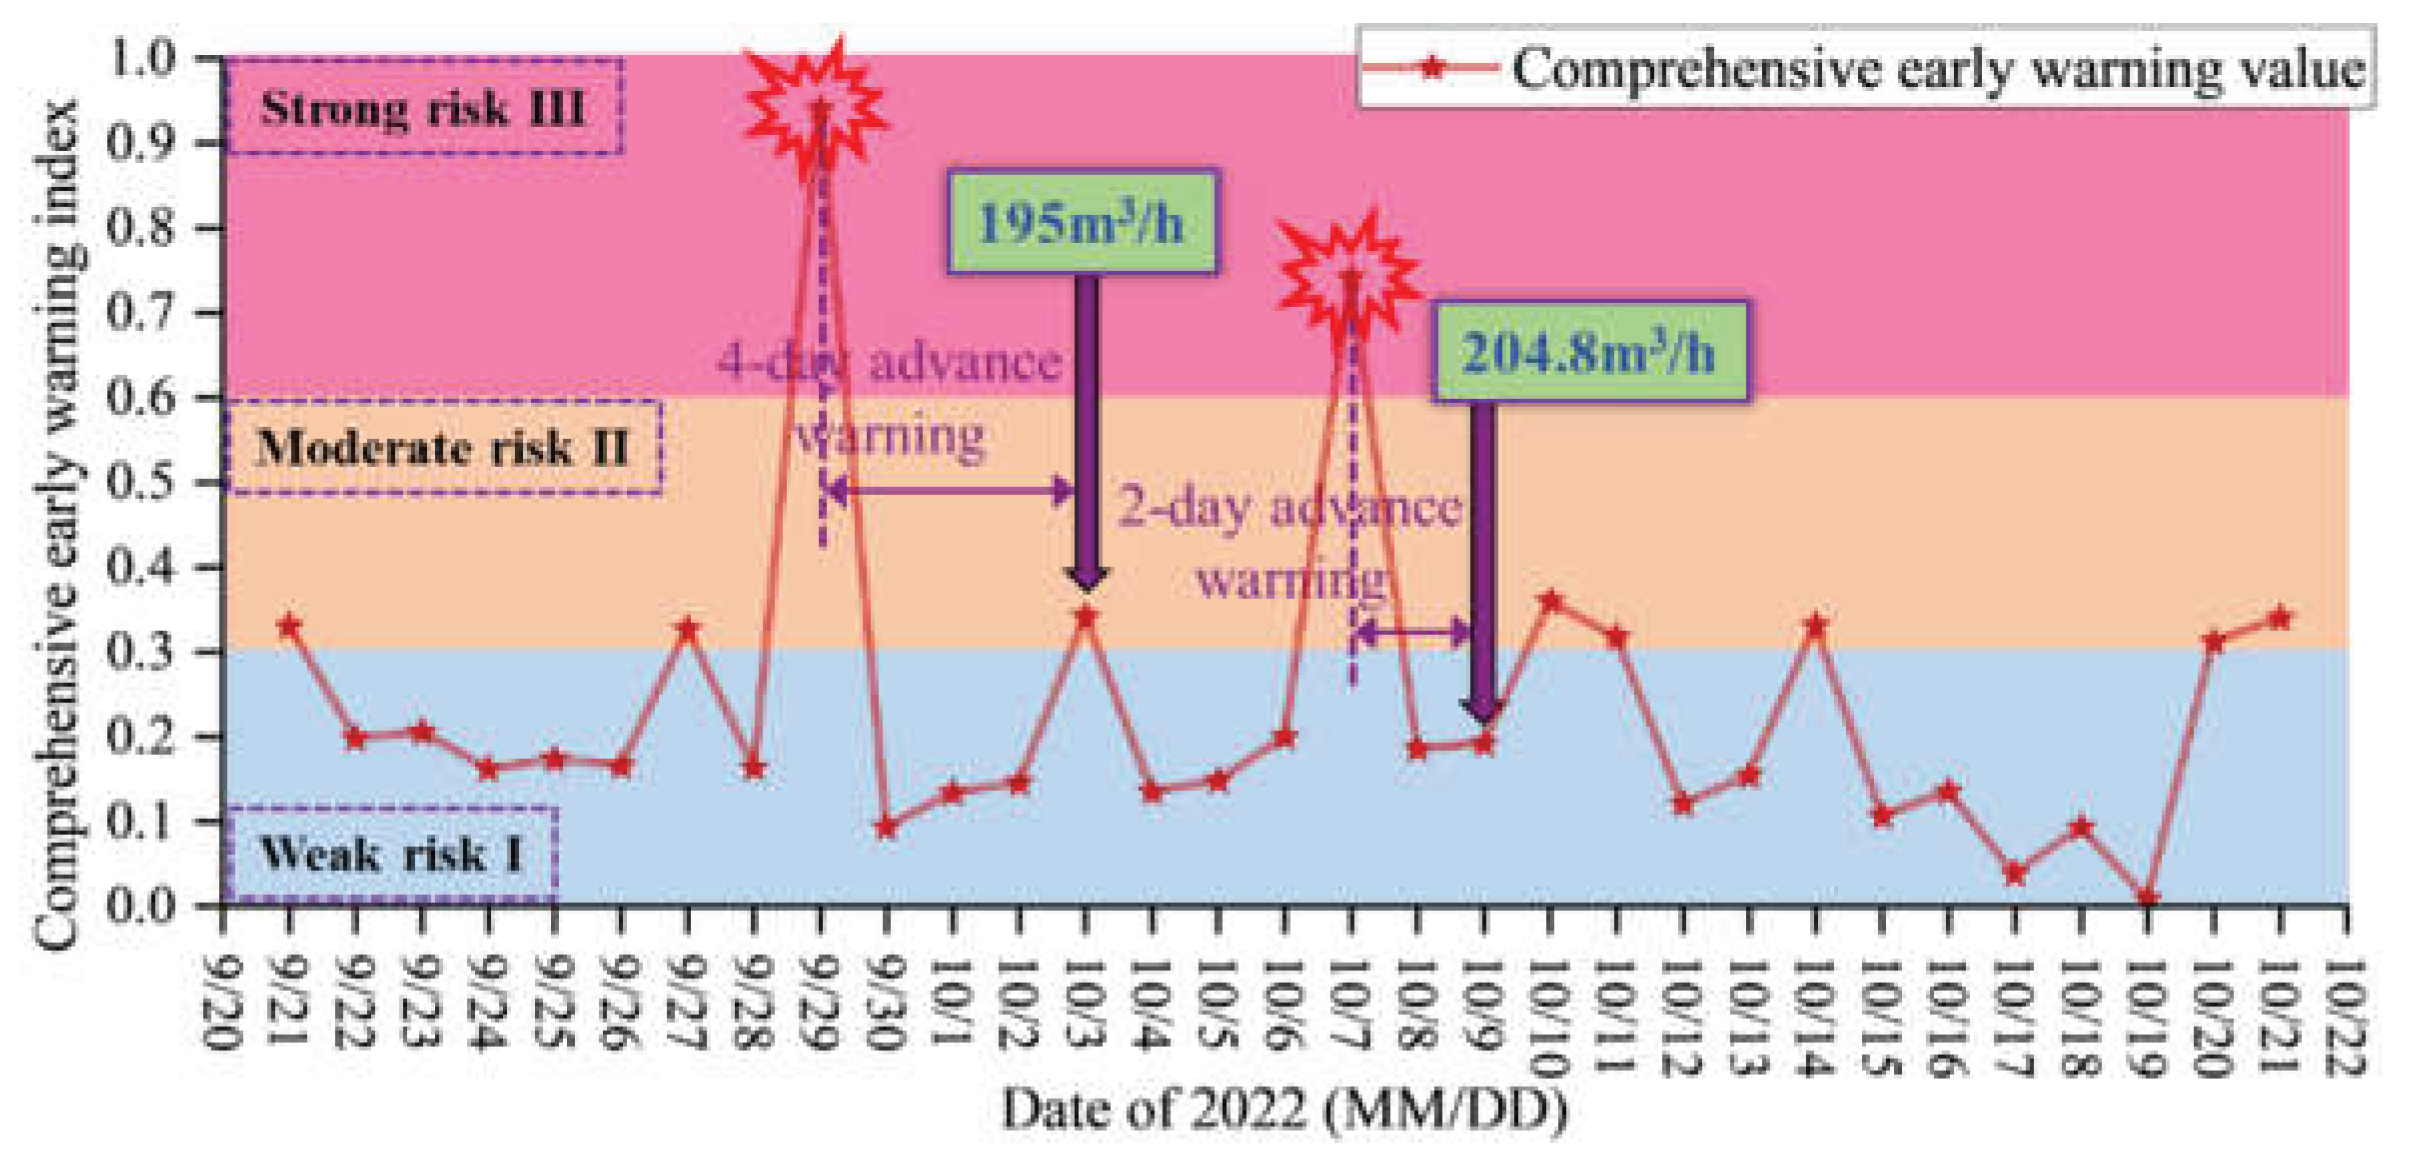

Table 1.
Optimal combinations of indicators for water inrush prediction.
| Indicator combination | F-value | Indicator combination | F-value |
| MS energy, Borehole 1, Borehole 2, Borehole 3 | 0.6860 | MS energy, MS frequency, Borehole 3 | 0.5109 |
| MS energy, Borehole 1, Borehole 3 | 0.6763 | MS energy, Borehole 3 | 0.4636 |
| MS energy, MS frequency, Borehole 1, Borehole 3 |
0.6757 | Borehole 1, Borehole 3 | 0.4551 |
| MS energy, MS frequency, Borehole 1, Borehole 2, Borehole 3 | 0.6399 | MS frequency, Borehole 1, Borehole 2, Borehole 3 | 0.4541 |
| MS energy, Borehole 1, Borehole 2 | 0.5134 | MS frequency, Borehole 1, Borehole 3 | 0.4322 |
Disclaimer/Publisher’s Note: The statements, opinions and data contained in all publications are solely those of the individual author(s) and contributor(s) and not of MDPI and/or the editor(s). MDPI and/or the editor(s) disclaim responsibility for any injury to people or property resulting from any ideas, methods, instructions or products referred to in the content. |
© 2025 by the authors. Licensee MDPI, Basel, Switzerland. This article is an open access article distributed under the terms and conditions of the Creative Commons Attribution (CC BY) license (http://creativecommons.org/licenses/by/4.0/).
Copyright: This open access article is published under a Creative Commons CC BY 4.0 license, which permit the free download, distribution, and reuse, provided that the author and preprint are cited in any reuse.


