Submitted:
22 September 2025
Posted:
23 September 2025
You are already at the latest version
Abstract
PRDM family transcription factors have been implicated in hematopoietic regulation, yet their expression in classical Philadelphia-negative myeloproliferative neoplasms (MPNs) remains unexplored. We investigated PRDM14 and PRDM16 expression in bone marrow samples from MPN patients and controls to assess associations with proliferative activity. Bone marrow trephine biopsies were obtained from 11 cases (5 with normal histology; 6 with pathological histology). Clinical, morphological, and molecular data (JAK2 mutation status) were collected. Paraffin-embedded sections were analyzed via immunofluorescence using monoclonal antibodies against PRDM14, PRDM16, and Ki67. Imaging was performed on a Zeiss Axio Imager.Z2 and quantified with ImageJ. Statistical analyses included Welch’s t-test, cluster-robust OLS regres-sion, and correlation analyses, with patient-level clustering considered in all analyses. PRDM16⁺ cell density and PRDM16⁺Ki67⁺ double-positive subsets showed a consistent trend toward higher values in patients compared with controls, approaching statistical significance when accounting for patient-level clustering (mean ± 95% CI 499.8 [360.4–639.2] vs. 309.4 [176.4–442.5] cells/mm² , p=0.060 and 96.5 [68.3-124.7] vs. 191.3 [89.3-293.3] cells/mm², p=0.08, respectively). In contrast, PRDM14⁺ and PRDM14⁺Ki67⁺ populations were similarly low in both groups. Inter-patient variability among MPN cases was not significantly altered. Both PRDM16 and PRDM14 expression correlated positively with proliferative activity measured by Ki67 expression, with robust associ-ations even in small subgroups (PRDM16⁺Ki67⁺ vs. Ki67⁺: r=0.809, p=0.003 and PRDM14⁺Ki67⁺ vs. Ki67⁺: r=0.744, p=0.009 for n=11). PRDM16 and PRDM14 expression themselves were not directly correlated (r = 0.518, p > 0.1). Our data provide the first evidence of differential PRDM14 and PRDM16 expression in human MPNs. These findings highlight mechanistically PRDM16 as a potential marker of malignant prolif-eration in MPNs and establish a foundation for further studies.
Keywords:
PRDM14
; PRDM16
; bone marrow
; myeloproliferative neoplasm
1. Introduction
Philadelphia-negative myeloproliferative neoplasms (MPN) comprise clonal hematopoietic stem cell diseases that, during their chronic phase, are characterized by increased proliferation of one or more myeloid cell lineages. The three canonical BCR-ABL1–negative myeloproliferative neoplasms (MPN) are essential thrombocythemia (ET), polycythemia vera (PV), and primary myelofibrosis (PMF), as codified by the 2022 International Consensus Classification (ICC) and WHO 5th edition[ , ].
ET is a chronic myeloproliferative neoplasm characterized by the clonal proliferation of hematopoietic stem cells, resulting in sustained thrombocytosis, typically with platelet counts. PV is a clonal erythrocytosis with frequent leukocytosis and/or thrombocytosis, microvascular symptoms, splenomegaly, and a high thrombotic risk. In addition to these manifestations, PV may transform into PMF or progress to acute myeloid leukemia in approximately 16% and 4–5.5% of cases, respectively. PV is defined by clonal erythrocytosis driven almost invariably by a JAK2 mutation (V617F in the vast majority and, less commonly, other exon 12 mutations, together accounting for >95% of molecular findings).[ , ]
Thrombocytosis is a sustained feature of ET, an MPN with a relatively indolent course. PMF, the most aggressive canonical MPN, exhibits marrow fibrosis, constitutional symptoms, anemia, splenomegaly, and the highest propensity for leukemic transformation among MPN. In addition to JAK2, whose mutations are less common in ET and PMF, these entities carry driver mutations in two other genes, namely in CALR (about 25–35%; type 1 - deletions and type - 2 insertions in exon 9) and, less frequently, in MPL (5–10%), with disease-specific distributions (e.g., CALR enrichment in ET/PMF).[ ] Mutations in the three genes - JAK2, MPL, and CALR (the latter through mechanisms not yet fully understood) - constitute driver mutations that lead to constitutive activation of the JAK-STAT signaling pathway and upregulation of cell proliferation. Up to 20% of patients do not harbor mutations in JAK2, CALR, or MPL; such MPN are, by analogy with breast cancer, referred to as “triple-negative” (TN).
In triple-negative MPN, particularly TN-ET, extended molecular profiling usually reveals alternative evidence of clonality, namely somatic variants in epigenetic regulators, splicing factors, and signaling pathway genes, as well as clonal cytogenetic abnormalities. With few exceptions [ , ] in recently published cohorts somatic mutations supporting clonality were identified in 50% to as high as 87.5% of TN-ET patients. The most frequent non-driver somatic mutations affect genes involved in epigenetic regulation, mRNA splicing, transcriptional regulation, and signal transduction, including TET2, DNMT3A, ASXL1, SRSF2, U2AF1, and KIT, as consistently demonstrated in sequencing studies.[ , , ]
Mutations in the mentioned genes, along with additional ones (ASXL1, EZH2, IDH1/2, TP53, NRAS, RUNX1, CEBPA, SH2B3), often accompanied by adverse karyotypes, [5] drive progression in MPN through stepwise clonal evolution. Finally, a high total mutation burden (≥4 hits) portends dismal outcomes.[ , , , , ]
So, despite disease-specific distinctions, they exhibit common clinical, pathological, and molecular hallmarks. Across large datasets, ET and PV are both more common than PMF (incidence, prevalence). A systematic review and meta-analysis estimated pooled annual incidences per 100,000 of 1.03 for ET, 0.84 for PV, and 0.47 for PMF. U.S. and Nordic registry studies corroborate these findings, with ET and PV in the ~1–2/100,000 range and PMF being markedly rarer.[ , , ]
Malignant evolution rates to MDS/AML are inverse to population frequency: ET has the lowest, PV intermediate, and PMF the highest. In PV, a large international cohort showed an AML risk of 2.3% at 10 years and 5.5% at 15 years, while ranges reported in literature reviews were broader, reflecting treatment era effects. For fibrotic progression, meta-estimates indicate a risk of post-PV MF of ~5–6% at 10 years and 6–14% at 15 years, and of post-ET MF of ~1–5% at 10 years and 4–11% at 15 years. In PMF, the risk of leukemic transformation is the highest among MPN, estimated at 10–20% at 10 years in several series and population-based registries.[ , , , ]
Therefore, although ET and PV are more prevalent than PMF, MPN as a group constitute a substantial and clinically important source of secondary AML (post-MPN AML)—a recognized subtype characterized by distinctive genetics (enrichment for TP53, RUNX1, ASXL1/SRSF2, IDH1/2) and poor outcomes compared with de novo AML. Overall, secondary AML accounts for approximately 15–30% of all AML in population-based series, with post-MPN AML representing a smaller but particularly high-risk fraction.[17,18]
The PRDM gene/protein family, consisting of about twenty transcriptional regulators with a PR/SET domain and zinc-finger motifs, plays essential roles in epigenetic regulation and hematopoietic differentiation. Among them, PRDM16 has received particular attention because of accumulating evidence implicating it in leukemogenesis. In contemporary classifications, the International Consensus Classification (ICC 2022) recognizes t(1;3)(p36.3;q21.3)/PRDM16::RPN1 among ‘other rare recurring translocations’ (with a blast threshold of ≥10%), whereas WHO 2022 assigns such cases to acute myeloid leukemia AML defined by differentiation (AML-Diff).[ , ] PRDM16, initially identified in leukemic cells with chromosome 3 involvement and originally termed MEL1 for its structural similarity to MDS1/EVI1 (MECOM, or PRDM3), plays a pivotal role in hematopoietic stem cell maintenance.[ , ] Its dysregulation has been implicated in myelodysplastic syndromes (MDS), AML, and T cell acute lymphoblastic leukemia (T-ALL).[ ] The gene, mapped to chromosome 3 and subject to alternative splicing, encodes two isoforms with partly divergent functions: full-length PRDM16, required for stem cell preservation and regulation of inflammatory responses, and a shorter variant lacking the PR domain, overexpressed in t(1;3)(p36;q21)-positive leukemia and associated with impaired myeloid differentiation.[15] Functional and clinical studies further indicate that PRDM16-related rearrangements, such as the t(1;3)(p36;q21) fusion or promoter juxtaposition events leading to PRDM16 overexpression, are linked to dysplastic phenotypes, high PRDM16 expression, adverse prognostic features, and poor response to chemotherapy. [ ]
PRDM14, another member of the PR-SET domain-containing protein family, is normally restricted to preimplantation embryos, primordial germ cells, and embryonic stem cells, where it maintains pluripotency gene networks.[ , ] Mechanistically, PRDM14 represses transcription of DNMT3A, DNMT3B, and DNMT3L proteins by binding to their upstream regulatory regions and by promoting their proteasomal degradation and lysine methylation-dependent polyubiquitination via interaction with G9 a histone methyltransferase.[ , , ] In non-malignant tissues, its expression is absent; however, aberrant activation in cancer cells induces stem cell-like phenotypes through promoter hypomethylation of oncogenes and concurrent hypermethylation of tumor suppressor genes.[ ] In hematopoietic cells, aberrant PRDM14 expression drives T-cell acute lymphoblastic leukemia (T-ALL) in murine models, associated with CD8+ immature T-cell expansion and lymphoid progenitor accumulation.[ ] It can also facilitate driver mutations, such as Notch1, by hijacking DNA recombination machinery in lymphoid T cells through epigenetic mechanisms.[ ] These findings position PRDM14 as a potentially significant contributor to malignant stemness, epigenetic remodeling, and resistance to apoptosis in hematologic malignancies, though its final role remains to be determined.
In this context, it is striking that a targeted PubMed search for “PRDM” in association with myeloproliferative neoplasms (MPN) yielded no directly relevant studies (September 2025; queries included: “PRDM* AND (MPN OR myeloproliferative OR essential thrombocythemia OR ET OR polycythemia OR PV OR myelofibrosis OR PMF)”, “PRDM16 AND MPN”, “PRDM14 AND MPN”, “PRDM16 AND (MDS OR myelodysplastic)”, “PRDM14 AND (MDS OR myelodysplastic)”). To our knowledge, no reports systematically interrogate PRDM family genes in MPN - i.e., no work in which this pre-leukemic condition is examined in relation to PRDM expression, mutational status, or function. We found references to PRDM16 in conditions biologically close to MPN, including myelodysplastic syndromes (MDS) and chronic myeloid leukemia (CML), the latter representing a Ph-positive variant of MPN. However, we did not identify any study addressing PRDM16 in canonical Ph-negative MPN or its distinct subtypes.
Here, we provide pilot data on PRDM14 and PRDM16 expression in MPN as compared to normal bone marrow.
2. Methods
2.1. Patients’ Characteristics
Patient paraffin sections of bone marrow trephine biopsies were banked specimens obtained from the Laboratory of General and Clinical Pathology, University Multi-profile Hospital for Active Treatment “St. Marina” – Varna, Bulgaria. The Research Ethical Committee approval no. 12/27.03.2025. We collected archival formalin-fixed paraffin-embedded (FFPE) from 5 individuals with normal bone marrow appearance (1 male aged 74 years, and 4 females aged 46-68 years) and 6 individuals diagnosed with MPN (2 males 57-74 years old and 4 females aged 43-79 years).
Trephine biopsies were followed by standard pathological analysis which showed mildly hypercellular (70% cellularity) bone marrow for age and panmyelosis, complete and progressive maturation of all 3 hematopoietic lineages. Estimated M:E ratio was normal = 3:1. Abnormal megakaryocyte morphology (large atypical forms) and architecture with variabily hyperlobulated (staghorn nuclear appearance) common in loose clusters frequently close to bone trabeculae, no highly bizarre/dysplastic forms. None or mild increase in reticulin fibrosis (0 or 1/3).
Five patients demonstrated mutation in JAK2 (V617F). Follow up analysis 4-18 months after sampling used in the current study showed that 5 out of 6 patients are alive, and are on the treatment according to the form and severity of MPN (clopidogrel, hydrea, aspirin, phlebotomy). One patient with JAK2-positive essential thrombocytosis transformed to myelofibrosis had died due to the myelofibrosis.
2.2. Immunofluorescent Microscopy
FFPE blocks have been cut at 4-µm-thick sections and mounted on glass slides. Paraffin removal and tissue rehydration were performed using the following slide wash/incubation sequence – Xylene (3x5min), 100% ethanol (2x5min), 90% ethanol (5min), 70% ethanol (5min), ddH20 (5min). Antigen retrieval was performed for 20 minutes 97°C in Citrate buffer, pH 6. After the procedure, the slides were left at RT in the antigen retrieval solution to cool down. Blocking was performed with 5% BSA/PBS Triton for 1 hour at RT. The primary antibodies used for immunofluorescence in this study include: rabbit anti-PRDM14 (Abcam, ab187881, 1:500), rabbit-anti-PRDM16 (Thermo Fisher scientific, PA5-20872, 1:500), Monoclonal Mouse Anti-Human, Ready-to-use antibody Ki-67 (Dako, IR626). The antibodies were diluted in 5% BSA/PBS Triton. The tissue sections were incubated in a humidified light-protected chamber overnight at 4°C. On the following day, the slides were washed 3x10min in PBS and incubated with secondary antibodies: goat anti-rabbit IgG 546 (Alexa Fluor™, A11035, 1:500), goat anti-mouse IgG 488 (Alexa Fluor™, A11001, 1:500) for 2 hours at RT. After the incubation, the slides were washed 3x10min in PBS. The sections were then treated with DAPI for 5 min in a humidified light-protected chamber. Finally, the sections were treated with Sudan for 5 minutes, washed with 50% ethanol and coverslipped in ProLong antifade reagent.
Immunofluorescent imaging was captured using a Zeiss Axio Imager.Z2 , objective EC-Plan-neofluar 20x/0.5 Cell counting was performed via ImageJ. From every slide it was chosen between 3 and 4 ROIs (Region of interests), and the different cell categories were counted manually.
2.3. Statistical Methods
All statistical analyses were performed in the Python 3.x environment (Jupyter Notebook) using pandas, statsmodels, scipy, matplotlib, and seaborn. The patient was the primary analytical unit, with histological sections treated as repeated measures clustered within each patient. Group comparisons were performed both by Welch’s t-test on patient-level means and by cluster-robust OLS regression on all observations with Huber–White standard errors, providing estimates of mean differences with 95% CI. Dispersion was assessed per patient (SD, CV, IQR, MAD) and compared between groups using the F-test, Levene’s test, and Mann–Whitney U where appropriate. Differences from zero (e.g., patient–control contrasts) were evaluated with one-sample tests and summarised in forest plots. Exploratory analyses included pairwise correlations and simple linear regression models. Additional calculations were cross-checked in Microsoft Excel and with an online calculator (StatsKingdom). Figures were generated in matplotlib and seaborn, with explicit representation of patient-level clustering; additional plots and summary tables are provided in the Supplementary Materials.
3. Results
To establish a baseline for proliferative activity in bone marrow tissue, we first quantified the number of proliferating Ki67+ cells in iliac crest trephine biopsies from patients MPN and from morphologically normal controls. At the case (patients or controls) level the mean number (±95% CI) of Ki67-positive nuclei was 230.6 [144.0; 317.2] in controls (n = 5) and 573.7 [276.4; 870.9] in patients (n = 6). The difference in means estimated by cluster-robust ordinary least squares (OLS) regression (cluster = patient) was +339.3 cells/mm2 (95% CI: 113.1 to 565.4), p = 0.003, indicating a statistically significant increase in proliferating cells in MPN (Figure 1E). This finding was consistent with Welch’s t-test on patient-level means (p = 0.030). Variability metrics (standard deviation [SD] and coefficient of variation [CV]) were higher in patients (SD 235.8 vs 127.6; CV 41.1% vs 34.6%), but the differences were not statistically significant (p values > 0.2, Mann–Whitney U test). This overall pattern is consistent with the well-established role of Ki67 as a proliferation marker in malignant hematopoiesis and validates the cohort as suitable for subsequent comparative analyses of PRDM family members.
We next evaluated PRDM16 expression in the same set of biopsies.
A total of 42 evaluable histological sections were analyzed, yielding 24 from patients and 18 sections from controls.
The MPN group showed higher PRDM16-positive cell counts compared to controls (mean ± 95% CI: 499.8 [360.4–639.2] vs 309.4 [176.4–442.5] cells/mm2) (Figure 1A). The difference in means, estimated using cluster-robust OLS regression, was 172.2 cells/mm2 (95% CI: –7.2 to 351.6 cells/mm2; p = 0.060), which approached (but did not cross) the conventional 0.05 significance threshold. Welch’s t-test at the patient level gave a consistent result (p = 0.08).
Measures of dispersion were calculated for each case: SD, CV, interquartile range (IQR), and median absolute deviation (MAD). All four metrics were consistently higher in the MPN group (for example, median CV 28.4% vs 17.9% in controls; median IQR 164.5 vs 89.0 cells/mm2), but none of these differences reached statistical significance (see Tab 1S, in Supplementary materials). Although this increased variability did not achieve formal significance, the directionality was uniform across all measures. This trend toward higher PRDM16 expression aligns with prior studies demonstrating PRDM16’s activation in specific types of AML[ , ]. Not any of our distribution analyses describe spatial heterogeneity of PRDM16 expression in MPN vs. normal bone marrow.
To determine whether the increase in PRDM16-positive cells in MPN marrow preferentially involved proliferating cells, we performed double immunostaining for PRDM16 and Ki67. Control biopsies contained on average 96.5 double-positive cells/mm2 (95% CI: 68.3 to 124.7), whereas MPN samples showed a markedly higher mean of 191.3 cells/mm2 (95% CI: 89.3 to 293.3) (Figure 1B). The patient–control difference, assessed with cluster-robust OLS regression (clustered by patient), was +91.3 cells/mm2 (95% CI: −10.9 to 193.1; p = 0.080). Welch’s t-test on patient-level means yielded a similar p-value of 0.132. Across all variability measures (SD, CV, IQR, MAD), values tended to be greater in the MPN group, although none reached statistical significance in Mann–Whitney testing (all p > 0.3). Notably, many patient values lay above the control range with still pronounced overlap between the two distributions. These data point to a fairly clear probability enrichment of PRDM16 expression within the actively proliferating compartment of MPN bone marrow.
We then analyzed PRDM14 expression in the same cohort (Figure 1C). The mean (±95% CI) number of PRDM14-positive cells per mm2 was 346.5 [193.5; 499.5] in patients compare to 376.8 [315.1; 438.6] in controls. The difference in means estimated by cluster-robust OLS regression was small and not statistically significant (–20.3; 95% CI: –177.2 to 136.6; p = 0.80). Welch’s t-test on patient-level means yielded a consistent p value of 0.73. Measures of variability, including SD (191.6 vs 134.7) and CV (55.3% vs 35.7%), showed no significant differences between groups (p > 0.5, Mann–Whitney U test).
Cell density of the double-positive PRDM14+Ki67+ cells also did not differ significantly between patients and controls (Figure 1D). Mean (per patient) values were 109.8 cells/mm2 in patients and 89.6 cells/mm2 in controls. The estimated mean difference (patients − controls) from cluster-robust OLS (clusters = patient) was +30.3 cells/mm2 (95% CI −38.0 to 98.5; p = 0.385). Welch’s t-test on patient means was likewise non-significant (p = 0.585). Measures of variability computed per patient (SD and coefficient of variation) showed no group differences (Mann–Whitney U: p = 0.329 and 0.537, respectively), indicating comparable within-patient dispersion. Therefore, unlike PRDM16, PRDM14 did not display a tendency toward increased expression or greater heterogeneity in MPN samples (Table 1S; Supplemental materials). This absence of difference is consistent with the limited evidence for a role of PRDM14 in adult hematopoietic malignancies and underscores the specificity of the PRDM16 trend observed in this dataset.
In our cohort (n=11 cases), expression of both PRDM16 (Figure 3, panels A–C) and PRDM14 (Figure 3, panels D–F) showed positive correlations with proliferative activity, as characterized by Ki67 expression. For PRDM16+ cells, the correlations with Ki67+ (r=0.561, p=0.073), with PRDM16+Ki67+ (r=0.858, p=0.001), and with Ki67+ vs PRDM16+Ki67+ (r=0.809, p=0.003) were observed. For PRDM14+, significant associations were also detected with Ki67+ (r=0.649, p=0.031), PRDM14+Ki67+ (r=0.840, p=0.001), and Ki67+ vs PRDM14+Ki67+ (r=0.744, p=0.009). These findings indicate that both molecules are linked to proliferative activity, and the trend is evident despite the limited sample size.
Remarkably, these strong positive correlations persisted even in very small subgroups (n = 5–6), when the parameters were analyzed separately in patients and controls. In MPN, for example, robust associations were detected between Ki67+ and PRDM14+Ki67+ (r = 0.813, p = 0.049) and between Ki67 and PRDM16+Ki67+ (r = 0.905, p = 0.035). A comparable tendency was also observed in normal bone marrow, where Ki67 and PRDM16+Ki67+ showed a substantial correlation (r = 0.738, p = 0.094). In several other instances, the correlations reached statistical significance despite the very limited sample size, underscoring the stability and potential biological relevance of these relationships (see Table 2S, Supplementary Materials). Interestingly, the only comparison lacking statistical significance was between PRDM16 and PRDM14 expression themselves (=0.518, p=0.103) as shown in panel G of the Figure 3. This finding is in line with the data presented above and indicates that, while both molecules’ rates of the appearance are individually associated with proliferative activity, their expression do not appear to associate directly with each other in this cohort.
Finally, differences from controls are summarized in Figure 4 (forest plot of patient–control contrasts), using cluster-robust regression with the patient as the unit of analysis. Ki67+ cell density was clearly increased in patients, serving as a reference of proliferative activity. PRDM16+ cells, as well as the double-positive PRDM16+Ki67+ subset, showed a consistent tendency toward higher values in patients compared with controls. In contrast, PRDM14+ and PRDM14+Ki67+ cells exhibited no appreciable deviations from controls. Measures of inter-patient variability (SD, CV) were comparable across markers, indicating that the observed differences primarily reflected shifts in central tendency rather than dispersion.
4. Discussion
To the best of our knowledge, here we present the first data to analyze the in situ expression of individual members of the PRDM family in myeloproliferative neoplasms (MPN), in humans. As mentioned above, in the literature available to us (PubMed, September 2025) we did not encounter studies devoted to PRDM in classical Ph-negative MPN (ET, PV, PMF). Thus, our results concerning not animal model but real life human MPN may be considered the first observations laying the groundwork for future research in this area. Overall, our data demonstrated pronounced heterogeneity of PRDM14 and PRDM16 expression in MPN compared with the control group of normal bone marrow. What stands out is the wide dispersion of values, including both markedly elevated levels (exceeding those of the control group) and, in some cases, values below control. It should be emphasized that such heterogeneity was observed for both proteins studied. At the same time, statistical evaluation of the parameters at the case level across four measures (standard deviations, confidence intervals, coefficients of variation, and interquartile range) did not reveal significance, which we attribute to the limited sample size (p values typically 0.3–0.7). Such dispersion, if confirmed, could indicate a complex and possibly heterogeneous pattern of hematopoietic regulation in MPN.
For PRDM16 two translation products are known: full-length fPRDM16 and sPRDM16 lacking the PR domain. Not all functional aspects of the two PRDM16 forms are known, but hyperexpression of sPRDM16 may act as one of the causative mechanisms of a dysplastic phenotype and the development of myeloid leukemia, as found mainly in t(1;3)(p36;q21) AML. [35]
An increase in PRDM16 expression in a subset of MPN patients proved to be the most consistent trend in our study. This was clearly observed in analyses using single and double labeling, where PRDM16 expression was assessed in proliferating Ki-67–positive cells (Figures 1A, 1B, and 4). In both settings, PRDM16 levels were higher than in the control group. This observation is consistent with the literature, where PRDM16 is described as an important regulator of cell fate determination and differentiation in normal tissues, as well as a factor implicated in the pathogenesis of myelodysplastic syndromes, certain acute myeloid leukemias, T-ALL, and other malignancies [30,34]. In this context, through epigenetic regulation and chromatin modification, PRDM16 may act as a transcriptional activator within a clone already harboring a JAK2 (found in all but 1 of presented patients) or other driver mutation. Thus, markedly increased expression in MPN may not only amplify proliferative signaling but also serve as a predictor of transformation to secondary AML. It should be noted that in a number of cases PRDM16 displayed opposite expression patterns, including decreases relative to controls. One possible explanation is the existence of distinct isoforms and splice variants of the gene, which have been reported to exert divergent functional activities, ranging from oncogenic to tumor-suppressive. In light of these considerations, the heterogeneity we observed in MPN may reflect differing ratios of PRDM16 isoforms across patients.
In contrast to PRDM16, the basal expression of PRDM14 in normal bone marrow, is extremely low or practically absent. In our case, its expression was relatively low, but not equal to zero (Figure 2B). In both groups — in patients with MPN and in controls — PRDM14 expression was almost indistinguishable, which clearly contrasts with the pattern observed for PRDM16 (Figures 1C, 1D, and 4). It was also of interest that, despite the low basal level, PRDM14 expression showed a strong correlation with proliferative activity as assessed by Ki-67, reflecting a link primarily with actively dividing cells.
According to recent studies in mouse models[ ], PRDM14 may acquire oncogenic properties when aberrantly expressed in hematopoietic progenitors. Under such conditions, it interacts with proto-oncogenes including Myb, Cbfa2t3, and AP-1, which represent its target genes. In parallel, PRDM14 binds to the histone methyltransferase G9a, which promotes chromatin modifications and suppression of key epigenetic regulators. Additionally, through “promiscuous” DNA binding, it is capable of activating oncogenic pathways and skewing differentiation towards a self-renewing pre-leukemic B-1–like lymphocytic or CD8 immature single-positive T-cell phenotype with a reasonably well-defined mechanism of action.[43] Whether a similar mechanism is responsible for aberrant PRDM14 expression and pathological proliferation in MPN/MDS/AML remains unknown. On the other hand, unlike PRDM16, no PR-less isoforms or tumor-suppressive isoforms of PRDM14 have been described to date[ ]. Therefore, the role of aberrant full-length PRDM14 expression in malignant myeloid proliferation remains unclear.
In conclusion, our study identified distinct features of PRDM16 and PRDM14 expression in patients with MPN, which, to our knowledge, have not been previously reported in the literature. Elucidating their potential role as factors of pathogenesis, prognosis, and as possible targets for therapy in larger patient cohorts remains an open task.
Supplementary Materials
The following supporting information can be downloaded at the website of this paper posted on Preprints.org.
Funding
Research was funded by the Bulgarian National Science Fund, grant #KP-06-H73/1 from 05.12.2023.
Institutional Review Board Statement
The Research Ethical Committee Name: The Research Ethics Committee at the Medical University “Prof. Dr. Paraskev Stoyanov” (approval code: 12, approval date: 27.03.2025).
Acknowledgments
Research was funded by the Bulgarian National Science Fund, grant #KP-06-H73/1 from 05.12.2023.
Conflicts of Interest
The authors declare no conflicts of interest.
References
- Khoury JD, Solary E, Abla O, et al. The 5th edition of the World Health Organization Classification of Haematolymphoid Tumours: Myeloid and Histiocytic/Dendritic Neoplasms. Leukemia. 2022;36(7):1703-1719. [CrossRef]
- Arber DA, Orazi A, Hasserjian RP, et al. International Consensus Classification of Myeloid Neoplasms and Acute Leukemias: integrating morphologic, clinical, and genomic data. Blood. 2022;140(11):1200-1228. [CrossRef]
- Scott LM, Tong W, Levine RL, et al. JAK2 exon 12 mutations in polycythemia vera and idiopathic erythrocytosis. N Engl J Med. 2007;356(5):459-468. [CrossRef]
- Tefferi A, Barbui T. Polycythemia vera: 2024 update on diagnosis, risk-stratification, and management. Am J Hematol. 2023;98(9):1465-1487. [CrossRef]
- Tefferi A, Vannucchi AM, Barbui T. Essential thrombocythemia: 2024 update on diagnosis, risk stratification, and management. Am J Hematol. 2024;99(4):697-718. [CrossRef]
- Angona A, Fernández-Rodríguez C, Alvarez-Larrán A, et al. Molecular characterisation of triple negative essential thrombocythaemia patients by platelet analysis and targeted sequencing. Blood Cancer J. 2016;6(8):e463. Published 2016 Aug 26. [CrossRef]
- Michail O, McCallion P, McGimpsey J, et al. Mutational profiling in suspected triple-negative essential thrombocythaemia using targeted next-generation sequencing in a real-world cohort. J Clin Pathol. 2021;74(12):808-811. [CrossRef]
- Cattaneo D, Croci GA, Bucelli C, et al. Triple-Negative Essential Thrombocythemia: Clinical-Pathological and Molecular Features. A Single-Center Cohort Study. Front Oncol. 2021;11:637116. Published 2021 Mar 12. [CrossRef]
- Maddali M, Venkatraman A, Kulkarni UP, et al. Molecular characterization of triple-negative myeloproliferative neoplasms by next-generation sequencing. Ann Hematol. 2022;101(9):1987-2000. [CrossRef]
- Al-Ghamdi YA, Lake J, Bagg A, et al. Triple-Negative Primary Myelofibrosis: A Bone Marrow Pathology Group Study. Mod Pathol. 2023;36(3):100016. [CrossRef]
- Cabagnols X, Favale F, Pasquier F, et al. Presence of atypical thrombopoietin receptor (MPL) mutations in triple-negative essential thrombocythemia patients. Blood. 2016;127(3):333-342. [CrossRef]
- Tefferi A. Primary myelofibrosis: 2023 update on diagnosis, risk-stratification, and management. Am J Hematol. 2023;98(5):801-821. [CrossRef]
- Tefferi A, Vannucchi AM, Barbui T. Essential thrombocythemia: 2024 update on diagnosis, risk stratification, and management. Am J Hematol. 2024;99(4):697-718. [CrossRef]
- Mascarenhas, J., Gleitz, H.F.E., Chifotides, H.T. et al. Biological drivers of clinical phenotype in myelofibrosis. Leukemia 37, 255–264 (2023). [CrossRef]
- McNamara CJ, Panzarella T, Kennedy JA, et al. The mutational landscape of accelerated- and blast-phase myeloproliferative neoplasms impacts patient outcomes. Blood Adv. 2018;2(20):2658-2671. [CrossRef]
- Lundberg P, Karow A, Nienhold R, et al. Clonal evolution and clinical correlates of somatic mutations in myeloproliferative neoplasms. Blood. 2014;123(14):2220-2228. [CrossRef]
- Dunbar AJ, Rampal RK, Levine R. Leukemia secondary to myeloproliferative neoplasms. Blood. 2020;136(1):61-70. [CrossRef]
- McKinnell Z, Karel D, Tuerff D, Sh Abrahim M, Nassereddine S. Acute Myeloid Leukemia Following Myeloproliferative Neoplasms: A Review of What We Know, What We Do Not Know, and Emerging Treatment Strategies. J Hematol. 2022;11(6):197-209. [CrossRef]
- Ushijima Y, Naruse S, Ishikawa Y, et al. Initiating-clone analysis in patients with acute myeloid leukemia secondary to essential thrombocythemia. Sci Rep. 2024;14(1):15906. Published 2024 Jul 10. [CrossRef]
- Titmarsh GJ, Duncombe AS, McMullin MF, et al. How common are myeloproliferative neoplasms? A systematic review and meta-analysis. Am J Hematol. 2014;89(6):581-587. [CrossRef]
- Mehta J, Wang H, Iqbal SU, Mesa R. Epidemiology of myeloproliferative neoplasms in the United States. Leuk Lymphoma. 2014;55(3):595-600. [CrossRef]
- Shallis RM, Wang R, Davidoff A, Ma X, Podoltsev NA, Zeidan AM. Epidemiology of the classical myeloproliferative neoplasms: The four corners of an expansive and complex map. Blood Rev. 2020;42:100706. [CrossRef]
- Tefferi A, Rumi E, Finazzi G, et al. Survival and prognosis among 1545 patients with contemporary polycythemia vera: an international study. Leukemia. 2013;27(9):1874-1881. [CrossRef]
- Cerquozzi S, Tefferi A. Blast transformation and fibrotic progression in polycythemia vera and essential thrombocythemia: a literature review of incidence and risk factors. Blood Cancer J. 2015;5(11):e366. Published 2015 Nov 13. [CrossRef]
- Song IC, Yeon SH, Lee MW, et al. Myelofibrotic and leukemic transformation in 2016 WHO-defined Philadelphia-negative myeloproliferative neoplasm. Blood Res. 2022;57(1):59-68. [CrossRef]
- Tefferi A, Alkhateeb H, Gangat N. Blast phase myeloproliferative neoplasm: contemporary review and 2024 treatment algorithm. Blood Cancer J. 2023;13(1):108. Published 2023 Jul 18. [CrossRef]
- Strzalka P, Czemerska M, Krawiec M, et al. Characterization and prognostic factors of secondary to MDS/MPN and therapy-related AML: a single-center study. Acta Haematol Pol 2023;54(3):176-186. [CrossRef]
- Park HS. What is new in acute myeloid leukemia classification? Blood Res. 2024;59(1):15. [CrossRef]
- Jung J, Bains A, Smith J, et al. Perspectives on acute myeloid leukemia diagnosis: a comparative analysis of the latest World Health Organization and the International Consensus Classifications. Leukemia. 2023;37(10):2125-2128. [CrossRef] [PubMed]
- Aguilo F, Avagyan S, Labar A, et al. Prdm16 is a physiologic regulator of hematopoietic stem cells. Blood.2011;117(19):5057-5066. [PubMed]
- Harms MJ, Lim HW, Ho Y, et al. PRDM16 is required for the maintenance of hematopoietic stem cells. Nat Genet. 2015;47(7):720-729. [CrossRef] [PubMed]
- Duhoux FP, Ameye G, Montano-Almendras CP, et al. PRDM16 (1p36) translocations define a distinct entity of myeloid malignancies with poor prognosis but may also occur in lymphoid malignancies. Br J Haematol. 2012;156(1):76-88. [CrossRef]
- Shing DC, Trubia M, Marchesi F, et al. Overexpression of sPRDM16 coupled with loss of p53 induces myeloid leukemias in mice. J Clin Invest. 2007;117(12):3696-3707. [CrossRef]
- Corrigan DJ, Luchsinger LL, Justino de Almeida M, Williams LJ, Strikoudis A, Snoeck HW. PRDM16 isoforms differentially regulate normal and leukemic hematopoiesis and inflammatory gene signature. J Clin Invest. 2018;128(8):3250-3264. [CrossRef]
- Casamassimi, A., et al., Multifaceted Role of PRDM Proteins in Human Cancer. Int J Mol Sci, 2020. 21(7).
- Seki, Y., PRDM14 Is a Unique Epigenetic Regulator Stabilizing Transcriptional Networks for Pluripotency. Front Cell Dev Biol, 2018. 6: p. 12.
- Yamaji, M., et al., PRDM14 ensures naive pluripotency through dual regulation of signaling and epigenetic pathways in mouse embryonic stem cells. Cell Stem Cell, 2013. 12(3): p. 368-82.
- Leitch, H.G., et al., Naive pluripotency is associated with global DNA hypomethylation. Nat Struct Mol Biol, 2013. 20(3): p. 311-6.
- Okashita, N., et al., PRDM14 promotes active DNA demethylation through the ten-eleven translocation (TET)-mediated base excision repair pathway in embryonic stem cells. Development, 2014. 141(2): p. 269-80.
- Sim, Y.J., et al., 2i Maintains a Naive Ground State in ESCs through Two Distinct Epigenetic Mechanisms. Stem Cell Reports, 2017. 8(5): p. 1312-1328.
- Taniguchi, H., et al., Silencing PRDM14 expression by an innovative RNAi therapy inhibits stemness, tumorigenicity, and metastasis of breast cancer. Oncotarget, 2017. 8(29): p. 46856-46874.
- Carofino, B.L., B. Ayanga, and M.J. Justice, A mouse model for inducible overexpression of Prdm14 results in rapid-onset and highly penetrant T-cell acute lymphoblastic leukemia (T-ALL). Dis Model Mech, 2013. 6(6): p. 1494-506.
- Carofino, B.L., et al., PRDM14 promotes RAG-dependent Notch1 driver mutations in mouse T-ALL. Biol Open, 2016. 5(5): p. 645-53.
- Matsuo, H., Kajihara, M., Tomizawa, D., Watanabe, T., Saito, A.M., Fujimoto, J., Horibe, K., Kodama, K., Tokumasu, M., Itoh, H., Nakayama, H., Kinoshita, A., Taga, T., Tawa, A., Taki, T., Shiba, N., Ohki, K., Hayashi, Y., Yamashita, Y., Shimada, A., … Adachi, S. (2014). EVI1 overexpression is a poor prognostic factor in pediatric patients with mixed lineage leukemia-AF9 rearranged acute myeloid leukemia. Haematologica, 99(11), e225–e227. [CrossRef]
- Hidemasa Matsuo, Susumu Goyama, Yasuhiko Kamikubo and Souichi Adachi (2015) “The subtype-specific features of EVI1 and PRDM16 in acute myeloid leukemia”, Haematologica. Pavia, Italy, 100(3), pp. e116-e117. [CrossRef]
- Nishikata, I., et al., A novel EVI1 gene family, MEL1, lacking a PR domain (MEL1S) is expressed mainly in t(1;3)(p36;q21)-positive AML and blocks G-CSF-induced myeloid differentiation. Blood, 2003. 102(9): p. 3323-32.
- Tracey LJ, El-Maklizi M, Sokolowski DJ, et al. Functional and molecular single-cell analyses implicate PRDM14 in the initiation of B cell leukemia in mice. Sci Rep. 2025;15(1):8827. Published 2025 Mar 14. [CrossRef]
- Nandy SB, Orozco A, Lopez-Valdez R, Roberts R, Subramani R, Arumugam A, Dwivedi AK, Stewart V, Prabhakar G, Jones S et al. (2017) Glucose insult elicits hyperactivation of cancer stem cells through miR-424-cdc42-prdm14 signalling axis. Br J Cancer 117, 1665–1675.
- Di Tullio F, Schwarz M, Zorgati H, Mzoughi S, Guccione E. The duality of PRDM proteins: epigenetic and structural perspectives. FEBS J. 2022;289(5):1256-1275. [CrossRef]
Figure 1.
Expression of PRDM 14 and PRDM16 in the bone marrow of patient with MPN. (A) PRDM16+, (B) PRDM16+Ki67+, (C) PRDM14+, (D) PRDM14+Ki67+, and (E) Ki67+ cell densities in patients (P) and controls (C). Each cross represents an individual measurement (section); crosses are grouped by patient (different colors, see SINGLE CASES: legend). Boxes indicate the patient-level mean ±95% CI; a thin black line marks the group mean (by patients). The unit of analysis is the patient, with repeated sections treated as within-patient replicates.
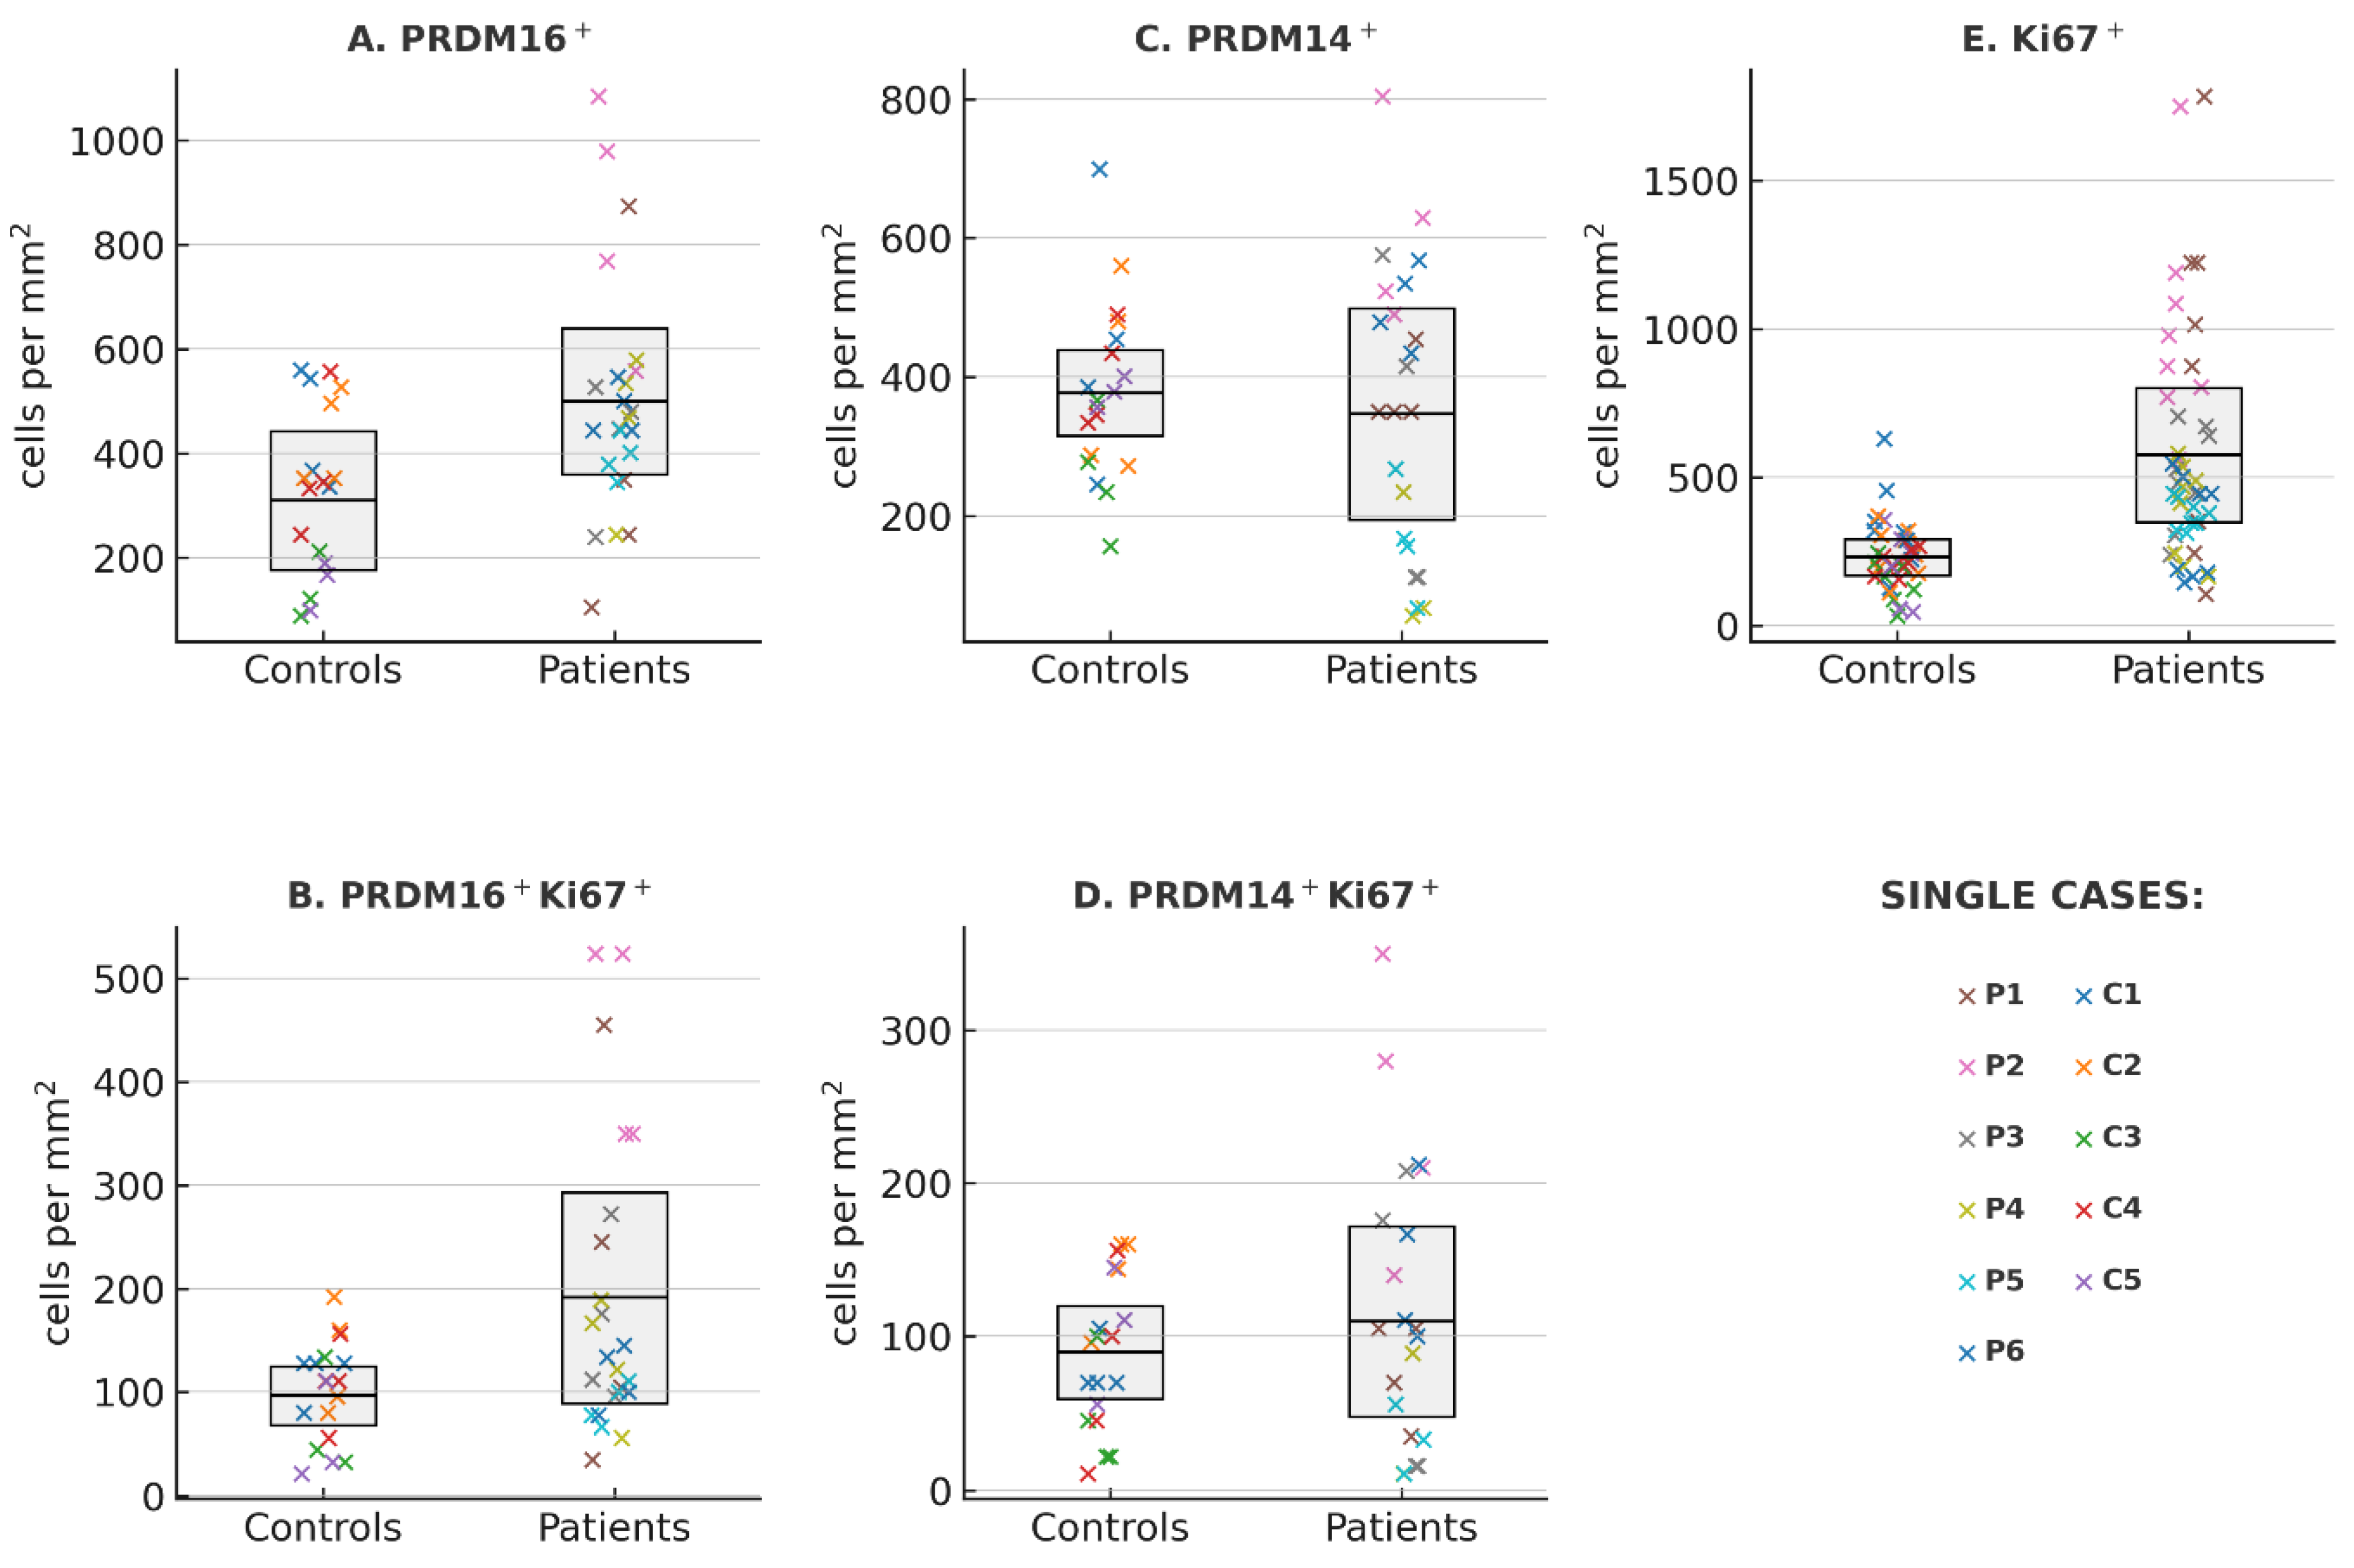
Figure 3.
Associations between PRDM14 and PRDM16 expression and bone marrow proliferation (by Ki67 expression).
Figure 3.
Associations between PRDM14 and PRDM16 expression and bone marrow proliferation (by Ki67 expression).
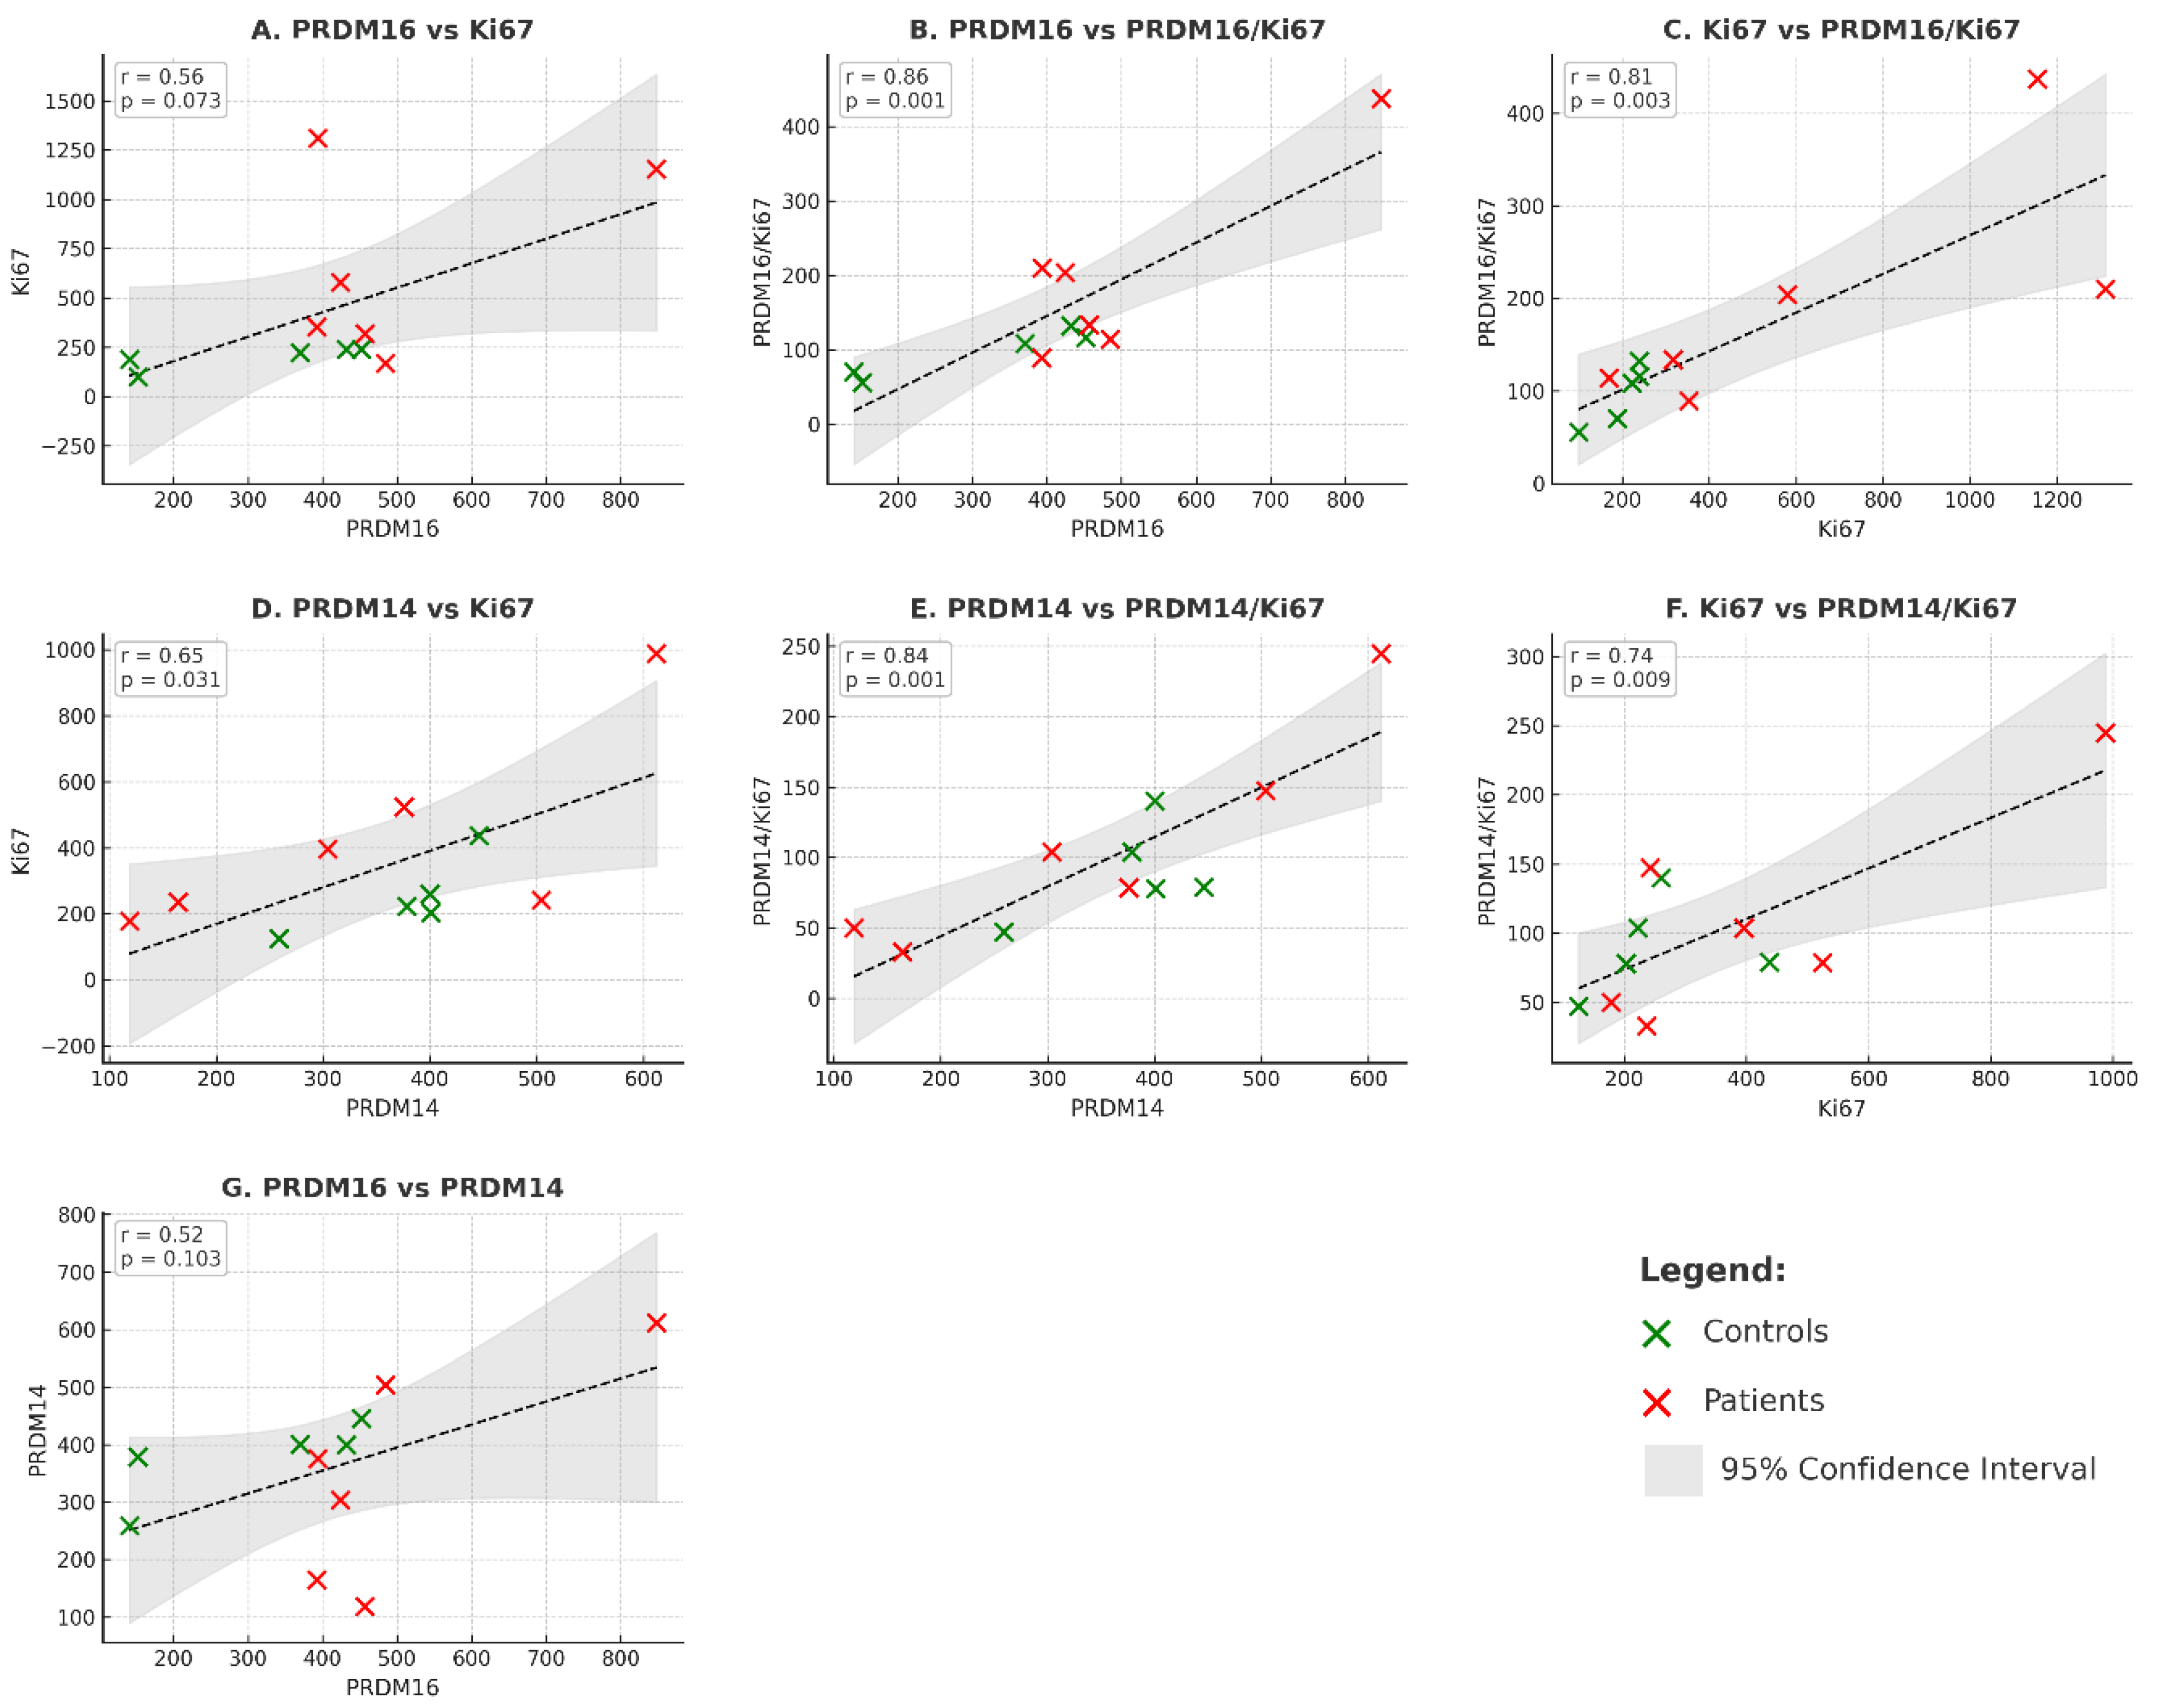
Figure 4.
Forest plot of patient–control differences in cell densities across analyzed markers. Forest plot summarizing differences in cell densities (patients − controls) for Ki67+, PRDM14+, PRDM16+, and their double-positive subsets. Each dot represents the estimated mean difference based on cluster-robust regression (patient as the unit of analysis), with horizontal lines denoting 95% confidence intervals. A dotted line is used for Ki67+ as a control proliferation marker. The right-hand column shows corresponding p-values from cluster-robust OLS models.
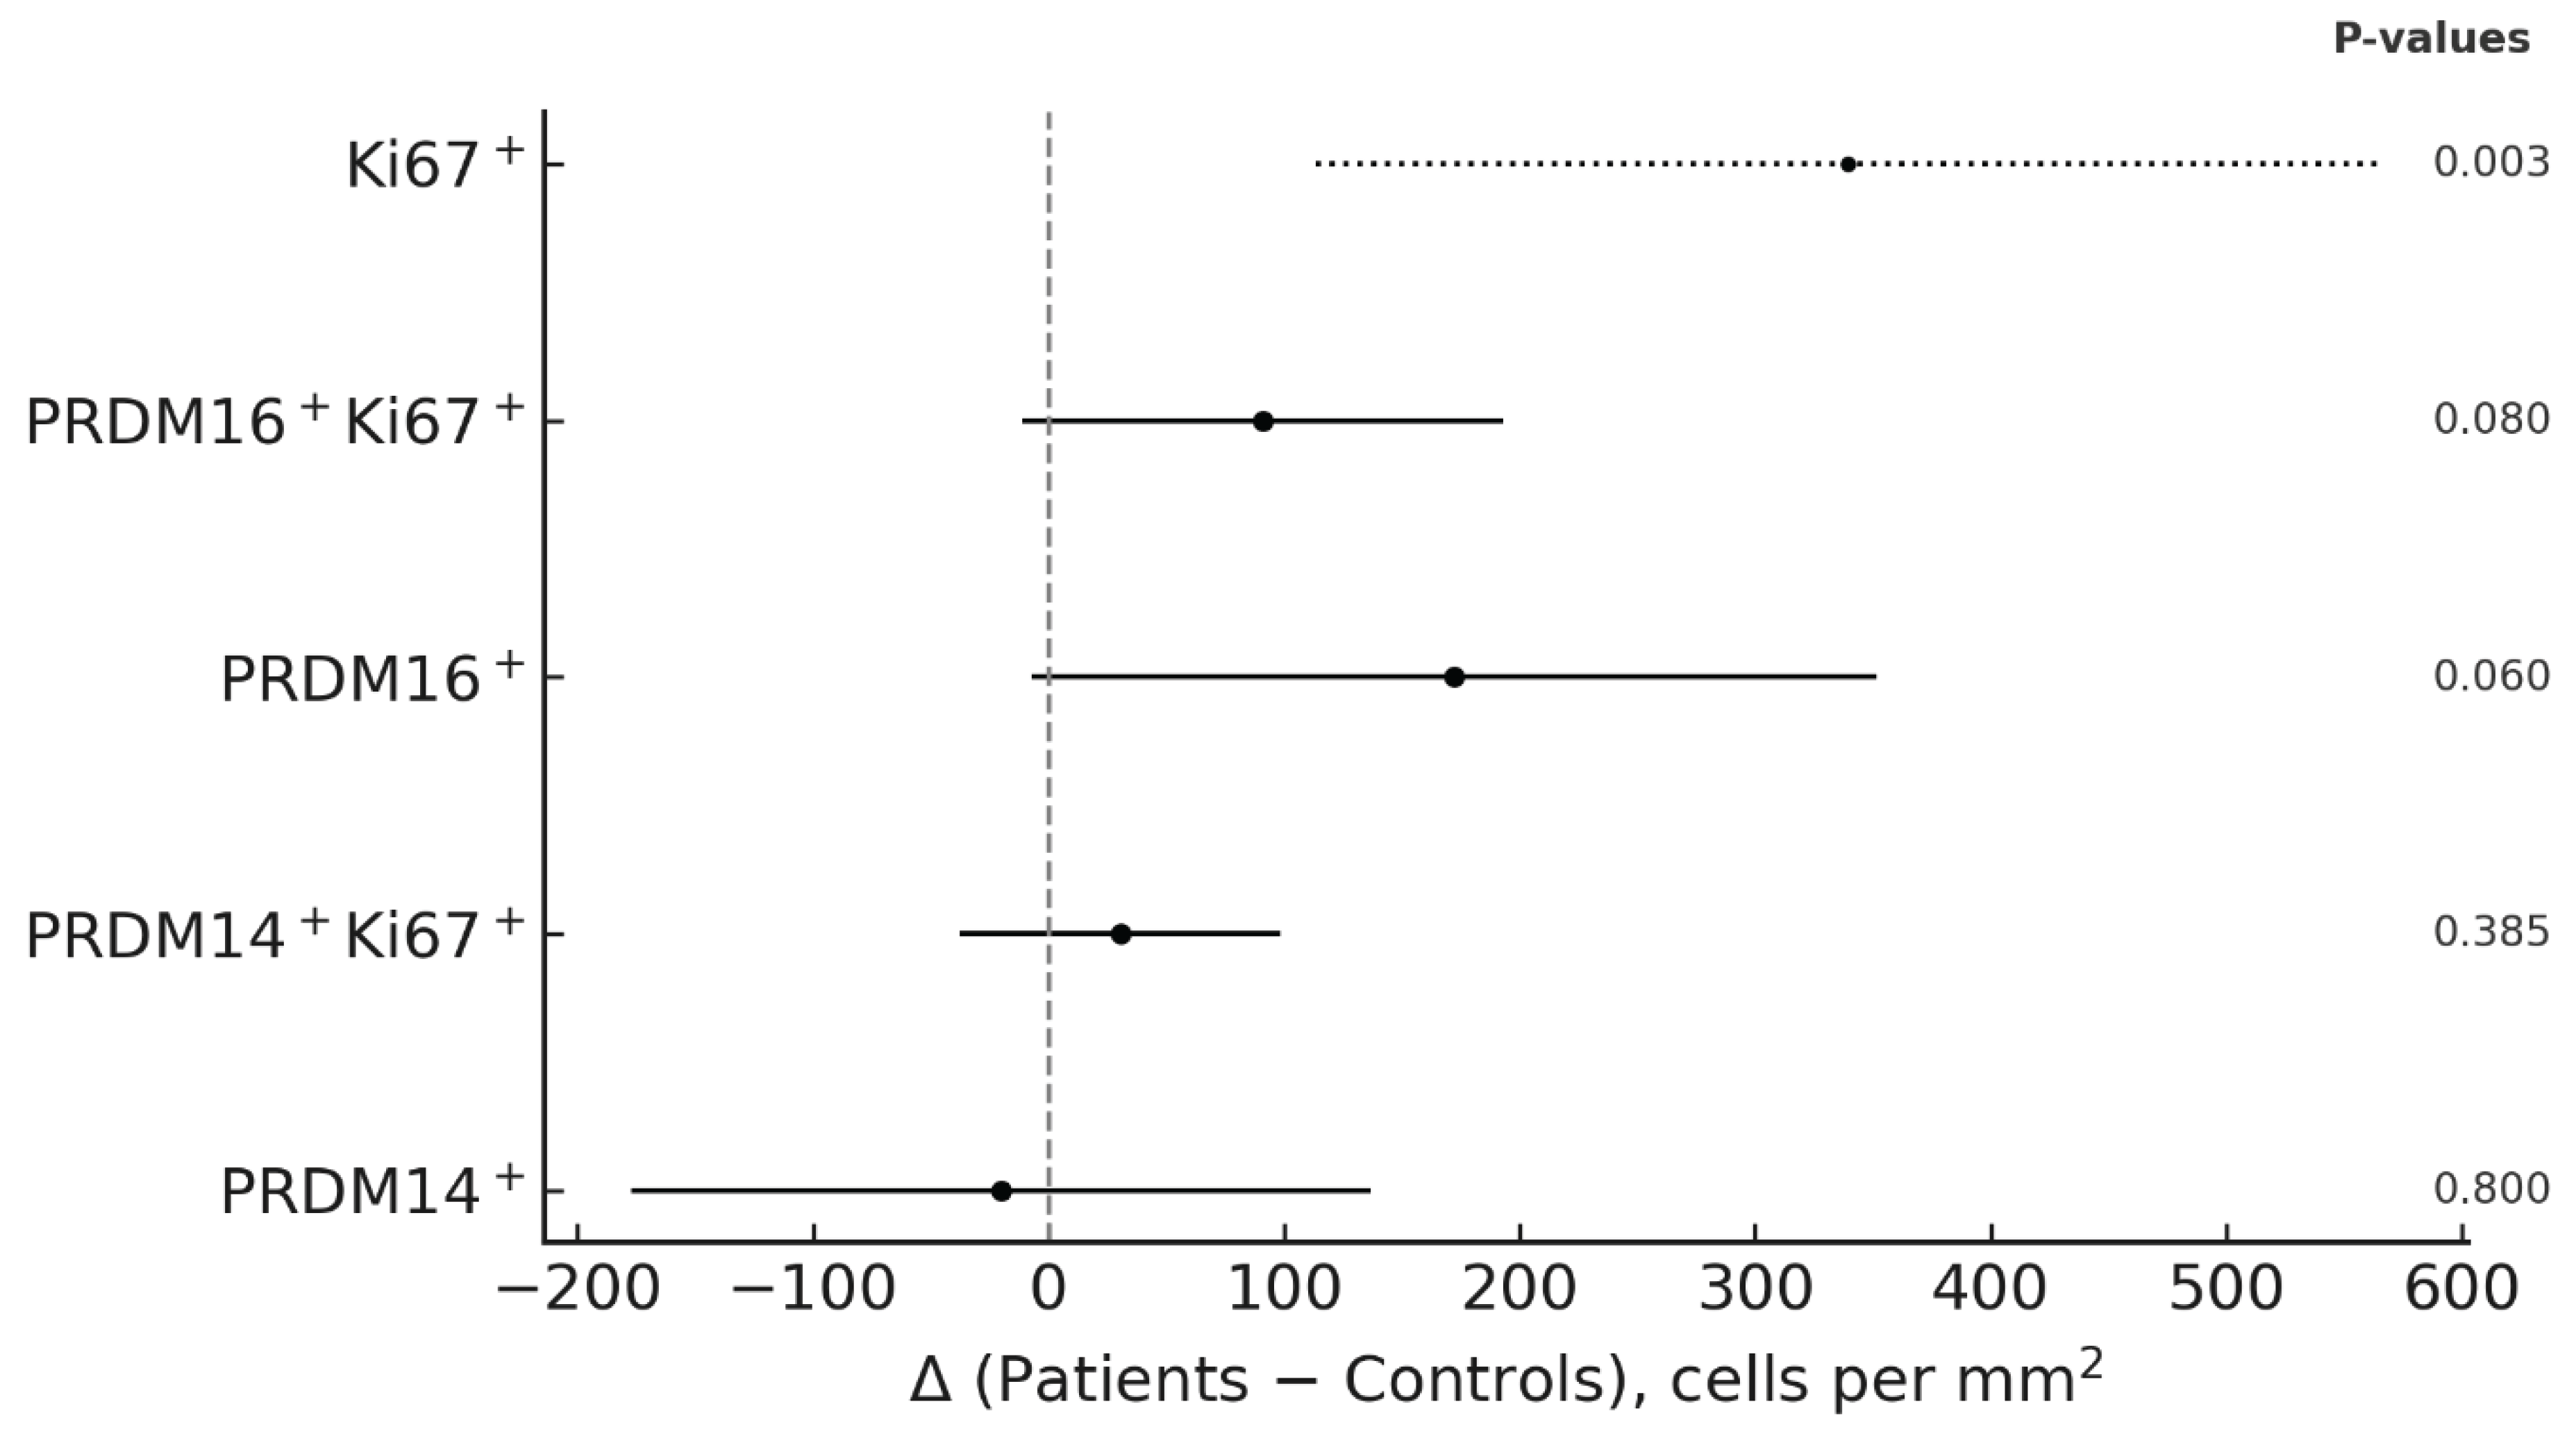
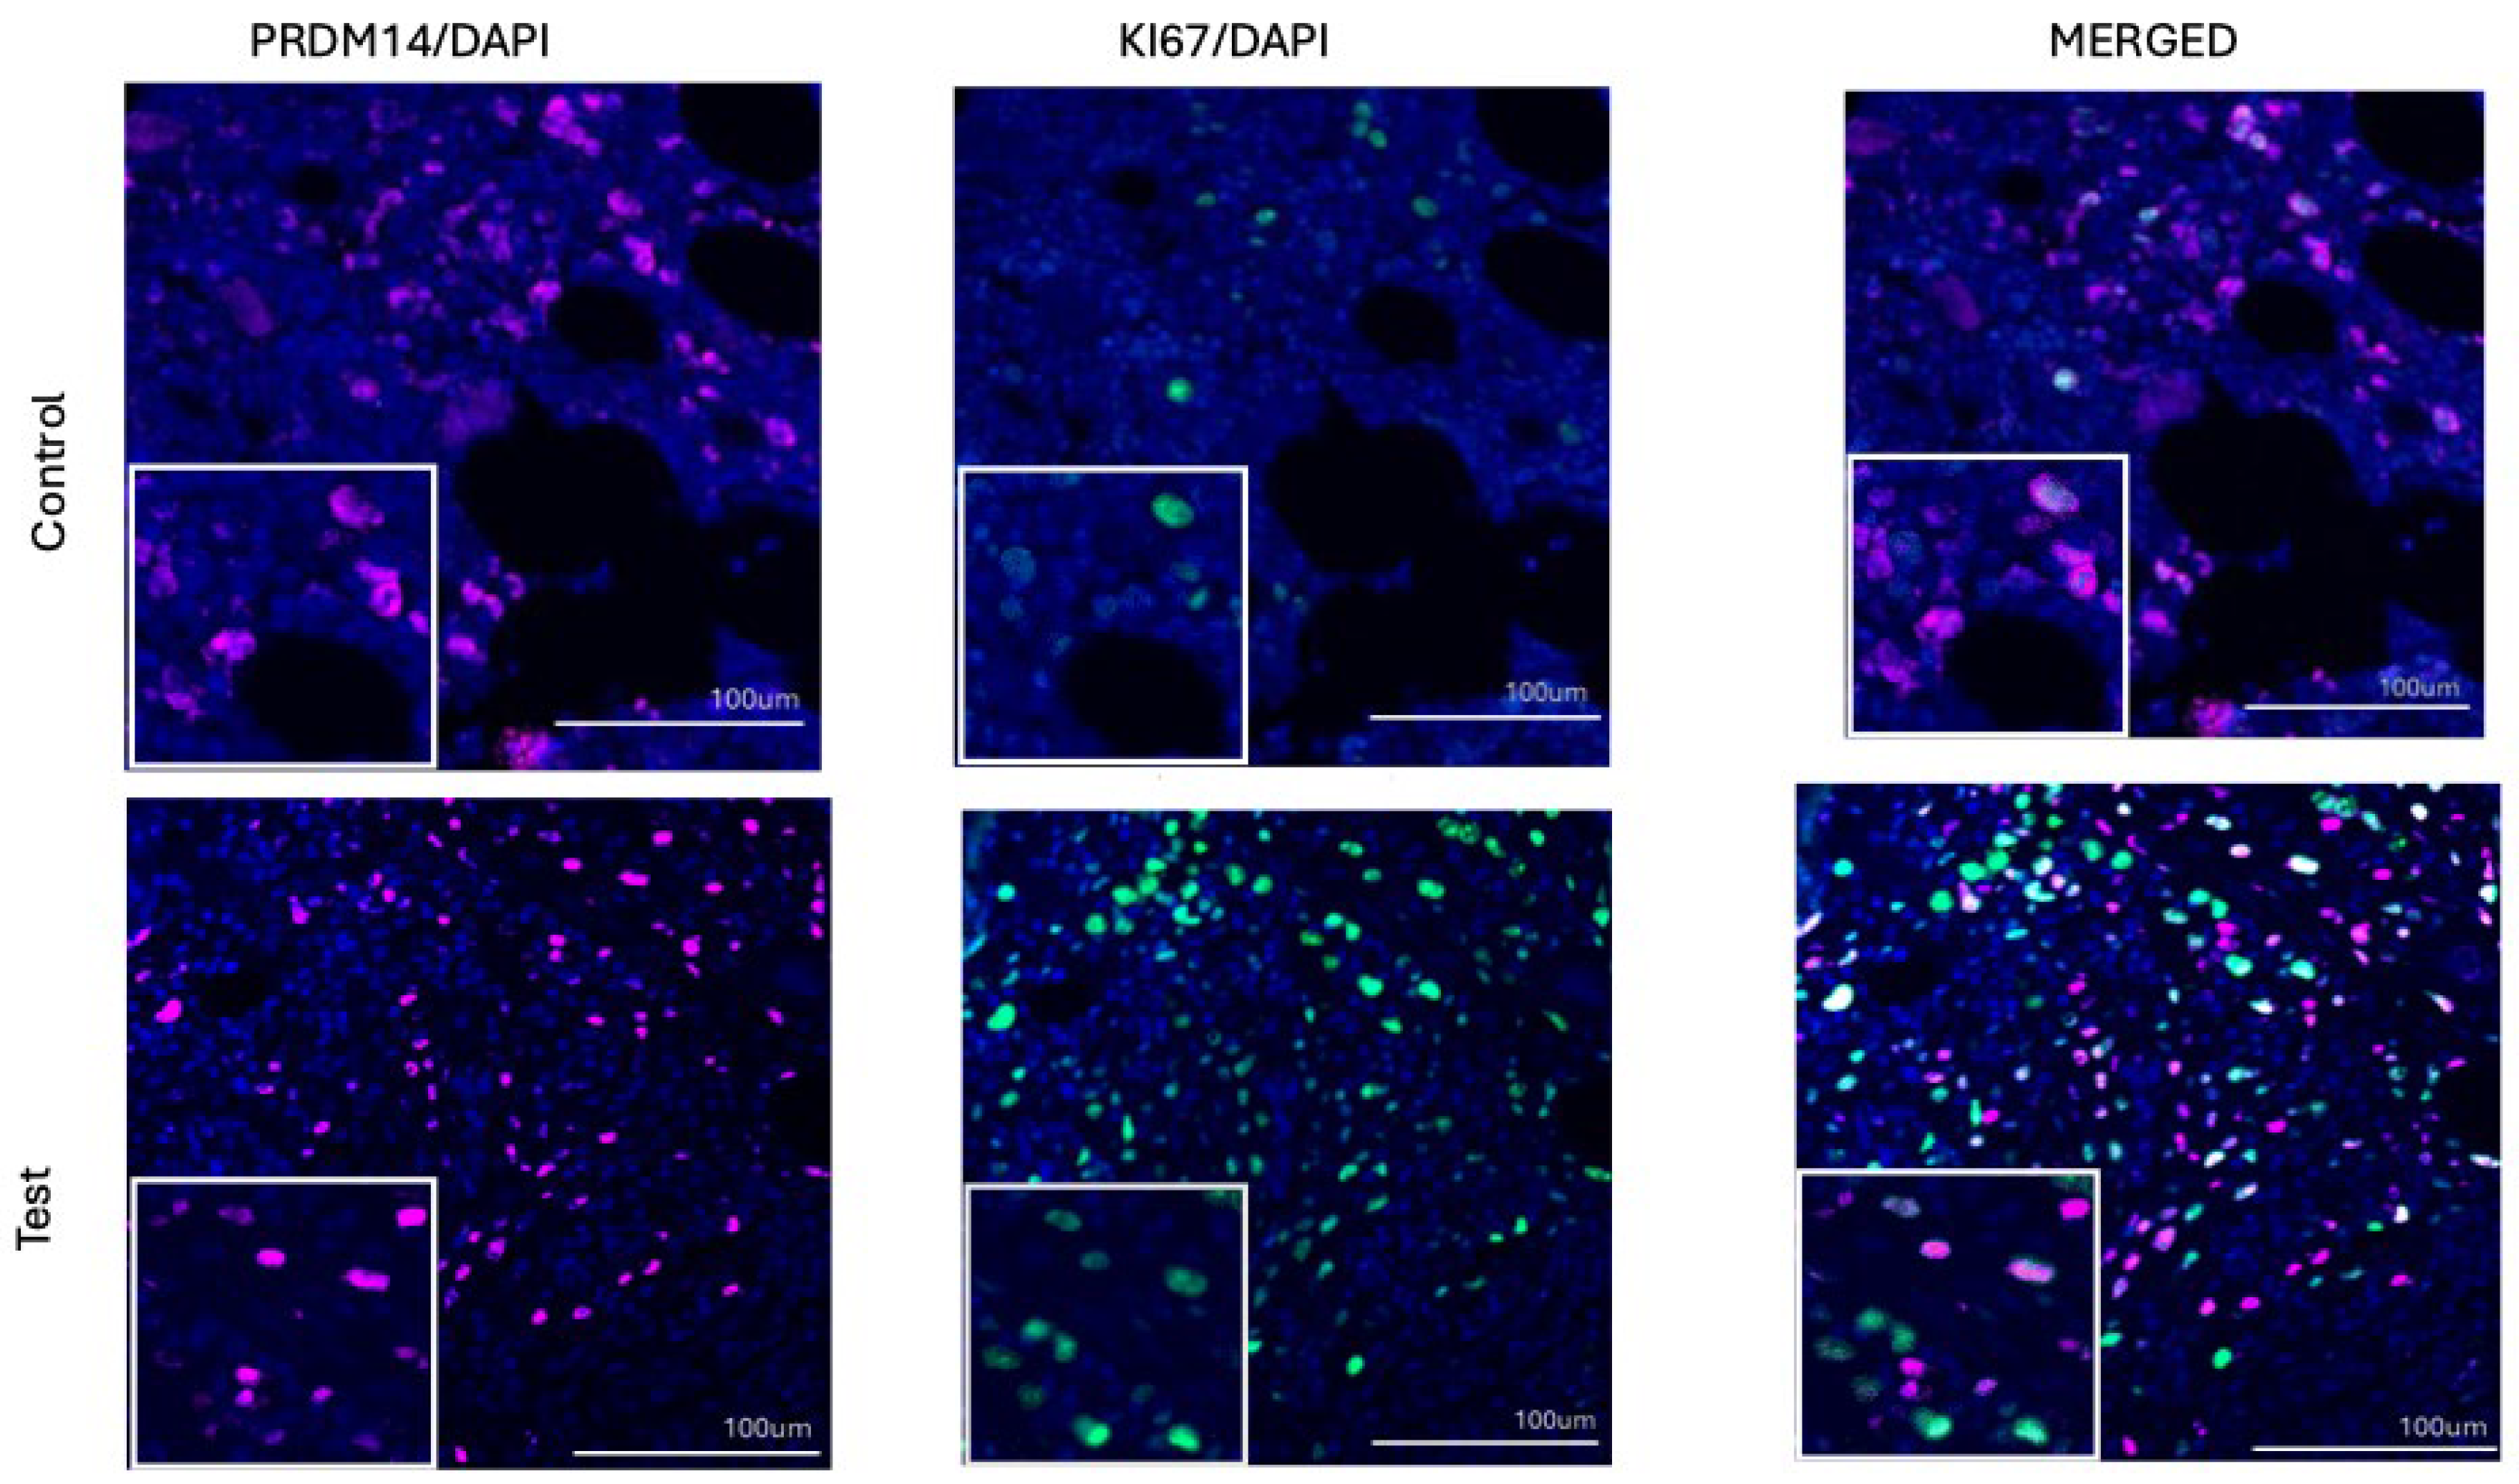
Figure 2.
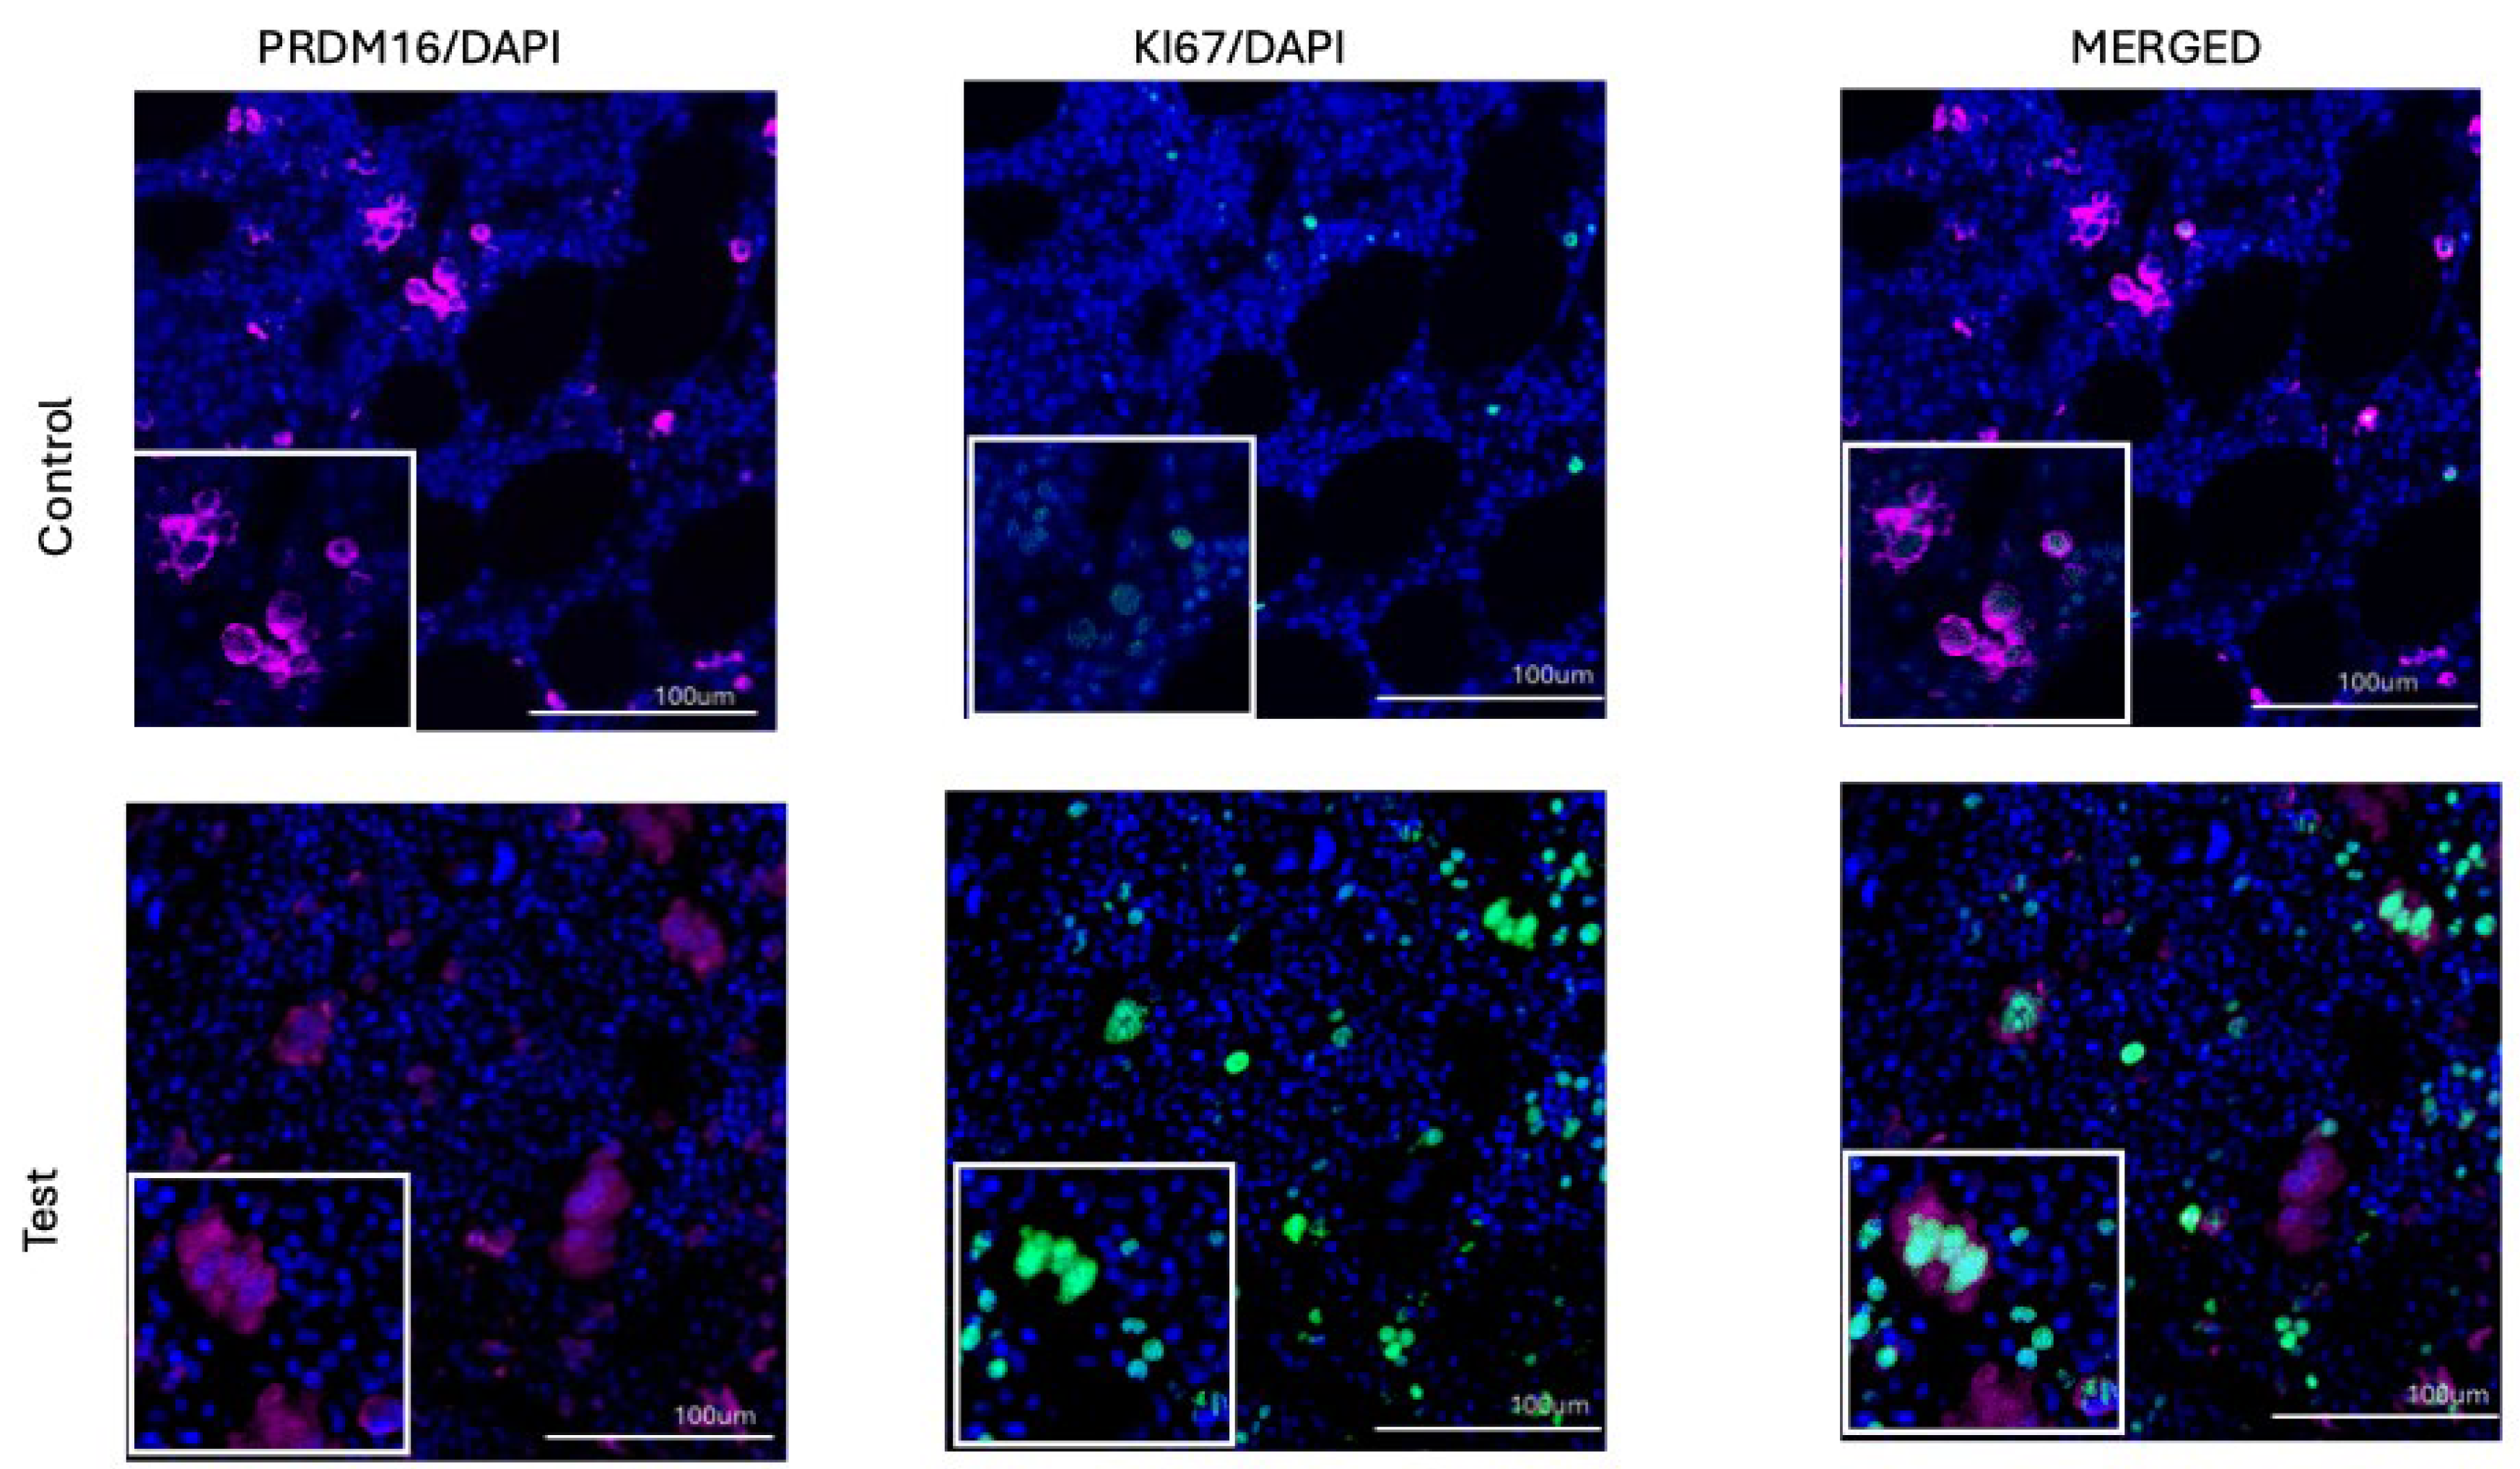
A representative example of immunofluorescence analysis of human bone marrow trephine biopsies. The control represents morphologically normal tissue, while the test sample corresponds to MPN (hematoxylin and eosin staining; not shown). Sections were stained with antibodies against PRDM16 (panel A; magenta) or PRDM14 (panel B; magenta) and the proliferative marker Ki-67 (green). Cell nuclei were counterstained with DAPI (blue). PRDM16 demonstrated predominantly cytoplasmic localization, whereas PRDM14 was mainly nuclear. The test group exhibited a higher number of PRDM16-positive, but not PRDM14-positive, Ki-67-positive cells, as well as an increased proportion of PRDM16 double-positive cells.
Figure 2.
A representative example of immunofluorescence analysis of human bone marrow trephine biopsies. The control represents morphologically normal tissue, while the test sample corresponds to MPN (hematoxylin and eosin staining; not shown). Sections were stained with antibodies against PRDM16 (panel A; magenta) or PRDM14 (panel B; magenta) and the proliferative marker Ki-67 (green). Cell nuclei were counterstained with DAPI (blue). PRDM16 demonstrated predominantly cytoplasmic localization, whereas PRDM14 was mainly nuclear. The test group exhibited a higher number of PRDM16-positive, but not PRDM14-positive, Ki-67-positive cells, as well as an increased proportion of PRDM16 double-positive cells.
Disclaimer/Publisher’s Note: The statements, opinions and data contained in all publications are solely those of the individual author(s) and contributor(s) and not of MDPI and/or the editor(s). MDPI and/or the editor(s) disclaim responsibility for any injury to people or property resulting from any ideas, methods, instructions or products referred to in the content. |
© 2025 by the authors. Licensee MDPI, Basel, Switzerland. This article is an open access article distributed under the terms and conditions of the Creative Commons Attribution (CC BY) license (http://creativecommons.org/licenses/by/4.0/).
Copyright: This open access article is published under a Creative Commons CC BY 4.0 license, which permit the free download, distribution, and reuse, provided that the author and preprint are cited in any reuse.


