
Submitted:
22 September 2025
Posted:
24 September 2025
You are already at the latest version
Abstract
The cancer care journey involves critical steps for diagnosis, treatment, and monitoring. Studies show that delays in treatment initiation are associated with reduced overall survival. To address this, patient navigation has emerged as a strategy to identify bottlenecks and mitigate delays. In this context, process mining offers a promising approach to discover, model, and optimize workflows using real data from hospital information systems. This paper presents a case study on the application of process mining to analyze care pathways in an oncology clinic. The focus was on identifying critical pathways, bottlenecks, and delays in the treatment journey to support the patient navigation program. Based on the insights gained, targeted improvement actions were proposed to enhance the patient journey. Using the PM² methodology, event data were extracted and processed from the clinic’s information systems to model and analyze two key processes: (i) departmental workflows related to ambulatory care, and (ii) longitudinal treatment pathways from initial evaluation to discharge. The results confirm the value of process mining for improving oncology patient journey and highlight its potential as a decision-support tool for healthcare administrators and clinical leaders.
Keywords:
process mining
; process discovery
; cancer care unit
; care pathways
; patient care management
1. Introduction
The journey of a cancer patient involves a series of essential steps for diagnosis, treatment, and monitoring. Studies show that delays in cancer treatment are a global problem in health systems and are associated with worse patient outcomes, including increased mortality, reduced progression-free survival, and diminished well-being among survivors [1,2,3,4]. For example, one study demonstrated that initiating breast cancer treatment more than 90 days after diagnosis has a detrimental effect on disease-free survival and overall well-being among survivors [3]. Similarly, delaying treatment initiation beyond 60 days was associated with decreased overall survival and an increased risk of recurrence in head and neck squamous cell carcinoma [4].
In response to these challenges, health system managers have sought to implement policies aimed at minimizing system-level delays in cancer treatment initiation, with the potential to improve survival outcomes at the population level. An example is Brazil’s “Sixty-Day Law”, which came into force in 2012 and guarantees cancer patients the right to begin treatment—whether chemotherapy, radiotherapy, or surgery—within sixty days of receiving a confirmed diagnosis [5]. However, some studies report a high rate of non-adherence to this mandated timeframe. Pulido et al. [6] showed that nearly one-third of colorectal cancer patients did not receive their first treatment within the period established by the law, while Marcelino et al. [7] demonstrated that the law did not reduce the interval between diagnosis and treatment initiation for patients with melanoma, concluding that the “Sixty-Day Law” was not effective.
Considering this reality, the concept of patient navigation emerges as a viable strategy to identify bottlenecks and mitigate delays at the initiation or during treatment. Patient navigation is a healthcare management approach designed to guide and support patients through complex healthcare systems, facilitating timely access to diagnosis, treatment, and supportive services, particularly in the presence of barriers. Chen et al. [8] concluded that incorporating patient navigation into standard oncology practice can reduce disparities and improve the overall quality of cancer care.
The necessity of patient navigation programs, coupled with the increasing digitalization of clinical and operational workflows in hospitals, has accelerated the adoption of advanced technologies designed to enhance both operational efficiency and the quality of patient care. In the oncology sector, the complexity of the patient journey, which spans multiple stages from diagnosis to treatment and follow-up, presents significant challenges for the efficient management of resources.
Traditional management approaches, grounded in personal judgment to assess operational workflows, frequently fall short in capturing the true complexity of process dynamics, even within computerized healthcare institutions. In this context, the adoption of innovative technologies such as process mining has emerged as a promising approach for discovering, modeling, and optimizing processes based on real data extracted from hospital information systems [9]. Process mining enables the extraction, modeling, and analysis of actual processes using event logs generated by information systems, revealing nonconformities and bottlenecks in operational workflows. Studies show that its application in hospitals can significantly improve patient flow management and resource allocation, resulting in greater efficiency and better quality of care [10].
In oncology care, the compliance and efficiency of clinical pathways become especially critical, as delays at the beginning or during treatment may negatively impact clinical outcomes [11]. Therefore, the analysis and continuous monitoring of clinical pathways throughout the patient journey are essential for enhancing both the quality of care and treatment outcomes. In this context, process mining serves as a powerful tool to support such analysis, enabling managers and clinical teams to identify nonconformities, uncover bottlenecks, and improve care processes.
Thus, this paper presents a case study on the application of process mining to analyze care pathways in an oncology clinic. The analysis focused on identifying critical pathways and process variants, as well as detecting bottlenecks and delays in the treatment journey, with the aim of supporting the patient navigation program. Based on the insights gained, targeted improvement actions were proposed to enhance the patient journey.
The study was conducted at a Brazilian oncology clinic that provides treatment for all types of cancer and offers chemotherapy, radiation therapy, clinical oncology, and supportive services, including psychotherapy, physical therapy, speech therapy, and nutritional counseling. The clinic receives approximately 150 new cases per month and attends an average of 65 patients per day.
2. Related Works
Process mining has been used to address specific challenges in the oncology treatment journey, aiming to promote improvements in operational efficiency, compliance, and personalized care — especially by discovering care pathways during the patient journey and identifying bottlenecks within these pathways.
Currently, process mining applications in healthcare are a widely studied field, as evidenced by numerous literature reviews — both those covering a general domain [12,13,14] and those focused on specific areas, such as oncology [15].
Regarding the type of process mining application in healthcare, and based on the classification proposed by Santos Garcia et al. [16] — which includes process discovery, conformance checking, process enhancement, and supporting areas — the review by Aversano et al. [12] shows that most studies focus on process discovery (53%), followed by process enhancement (19%), support activities (17%), and, finally, conformance checking (11%).
Although Guzzo et al. [14] adopted a slightly different classification for process mining types, their review presents results quite like Aversano’s, showing that the major process mining applications in healthcare focus on process discovery, followed by process analysis (process enhancement) and conformance analysis (conformance checking).
None of the reviews provided a straight justification for the higher frequency of process discovery applications, compared to conformance checking or process enhancement.
One possible hypothesis for this phenomenon is that process discovery is inherently the first step in any process mining approach. To improve a process or check its conformance, it is first necessary to discover and understand it.
This rationale reflects the objective of our case study, which focuses on discovering the processes (and their variations) followed in daily practice and assessing their performance, with the aim of improving and optimizing the efficiency of the patient’s journey.
We are not necessarily interested in the official processes designed by departmental management, as these may not be followed as intended. It is important to note that, even to evaluate adherence to institutional processes, it is essential to first identify the processes that are actually being executed.
A second plausible hypothesis is the natural variability of clinical processes, which makes adherence to institutional protocols very difficult. Accounting for all the clinical variables that can affect a patient’s journey in a standardized process presents a significant challenge.
We can infer that Guzzo et al. indirectly acknowledge this hypothesis by stating that “guidelines are difficult to accomplish given that, for example, patients suffering from the same disease may require different treatments depending on how their body reacts to certain drugs and medications. For this reason, processes carried out within the same medical context may differ from each other in terms of control-flow, organizational, and temporal perspective.”
Oncology was one of the first healthcare fields to apply process mining. In 2008, Mans et al. [17] used process mining to analyze patient flows in gynecological oncology. The overall goal of their study aligns with ours: to gain meaningful insights into care pathways by discovering typical patients’ flows in oncological treatment.
However, their work differs from ours in two main aspects. The first is the scope of the data. While our study includes all tumor types, theirs focuses exclusively on gynecological tumors. Additionally, their raw data came from treatment records collected for financial purposes, whereas our data was obtained from clinical information in electronic medical records. This distinction may lead to the discovery of more detailed workflows in our study, as financial records often show group care activities for billing purposes.
The second difference lies in the perspective of process mining application. Mans et al. examined the healthcare process from three perspectives: control flow, organizational, and performance. In contrast, our focus is primarily on the treatment flow beyond the organizational structure of an outpatient clinic. By analyzing treatment flows, we can explore the differences across various cancer types and generate insights to improve care pathways based on these differences.
Another related work on the use of process mining to discover oncology care pathways was conducted by Pijnenborg et al. [18]. In their study, the authors investigated the application of process mining techniques to identify and analyze palliative care pathways for stomach and esophageal cancer. The aim was to develop an evidence-based understanding of which palliative treatments are commonly administered in clinical practice and how these treatments relate to patients’ survival times.
Regarding data origin, the dataset used in Pijnenborg et al.’s research was obtained from the Netherlands Cancer Registry (NCR), a national oncology registry that includes data on all cancer patients across the country. This data source is particularly suitable for their goal of identifying variations in care pathways across multiple hospitals for a specific cancer type.
In contrast, our case study focuses on a single healthcare provider—an outpatient clinic—with the objective of discovering different operational workflows across various cancer types.
Although the focus of Savino et al.’s work [19] differs from ours, they also applied process mining to analyze cancer treatment pathways. Specifically, they investigated the adherence of rectal cancer patients treated at an Italian university hospital to the clinical guidelines established by the European Society for Medical Oncology.
Before analyzing the adherence to guidelines, their first step was process discovery—to provide an overview of the real treatment processes and generate an intuitive representation to analyze deviations from the guidelines.
The approach adopted by Savino et al. reinforces the strategic vision of our project: to first discover and analyze the actual processes within the outpatient clinic, as presented in this work, and subsequently, identify deviations and bottlenecks in these workflows. This will support efforts to improve the patient’s journey and enhance care efficiency.
In the Brazilian context, there are also initiatives applying process mining to oncology. The study by Iachecen et al. [20] is the most closely aligned with ours. Their work aims to uncover the care journey of lung cancer patients within a Brazilian health insurance provider, identifying the main diagnostic tests and treatment modalities used.
While the objectives of both studies are similar, there are key differences. First, the practical focus diverges: Iachecen et al. emphasize identifying the primary diagnostic tests and treatment modalities, whereas our study focuses on identifying critical pathways and variations that highlight inefficiencies in the patient’s journey.
Another distinction lies in scope. Iachecen et al. limit their analysis to lung cancer, while our study addresses multiple cancer types. Additionally, the data source differs significantly. The event log used by Iachecen et al. is derived from a sample of beneficiaries of a health insurance provider and primarily consists of data used for billing and reimbursement. A positive aspect of this dataset is that it covers multiple healthcare providers and diverse patient demographics—unlike ours, which is limited to a single cancer center. However, such administrative data may not capture all events necessary for constructing a detailed view of the patient flow, which is critical for our study’ purposes. For instance, chemotherapy involves a series of preliminary steps (such as triage, preparing, and dispensing the medication, etc.) that are likely not included in the records submitted to the insurer.
Related work indicates that, despite numerous initiatives applying process mining in the field of oncology, there remains a lack of studies specifically focused on outpatient oncology treatment clinics—underscoring the relevance and justification of the present study.
3. Methodology
Considering that the case study reported in this paper involves the application of process mining, we followed the PM2 methodology, a widely used approach for developing process mining projects, proposed by van Eck at al. [21]. This methodology comprises six steps: planning, extraction, data processing, mining and analysis, evaluation, and process improvement (Figure 1).
A process mining project always has one or more goals, which can be either very concrete - for example, achieving a 10% reduction in the execution time of a given process - or more abstract, such as gaining valuable insights into the conformance or performance of processes.
The essence of the PM2 methodology is to transform project goals into research questions that can be answered, generating findings that provide a foundation for improving the selected process.
In the first stage (Planning), the research questions are defined based on the goals of the process mining project. The second stage (Extraction) involves retrieving event data from the relevant information systems. In the third stage (Data Processing), the extracted data are structured and stored in a standardized event log format suitable for analysis.
The fourth stage (Mining and Analysis) applies process mining techniques to the event logs to address the research questions. This stage yields findings related to process performance and compliance or, in the case of more abstract research questions, offers a broader understanding of the process under investigation.
In the fifth stage (Evaluation), the results obtained from the mining and analysis phase are evaluated to derive potential process improvement ideas or to formulate new research questions.
Finally, in the sixth stage (Process Improvement), the proposed improvements are implemented through modifications to the existing processes.
The case study presented in this article has two practical goals: (i) to minimize delays in the initiation of each stage of a patient’s treatment and (ii) to reduce the patient’s length of patient stay in the clinic during outpatient care services (chemotherapy or radiotherapy sessions, follow-up appointments, etc.).
To achieve these objectives, two process analyses are necessary: process discovery and process enhancement (or performance checking).
Through process discovery, the goal is to identify both the pathways taken by patients during outpatient care (Department Workflow) and those followed throughout treatment journey (Treatment Workflow). The aim of this step is to map critical paths and key process variants. Critical paths require greater attention because they are more prone to delays and bottlenecks. Therefore, identifying and analyzing these critical paths can provide support for the adoption of monitoring policies and tools, as well as for improving the clinic’s operational processes, making them more agile.
In the context of this case study, a critical path is defined as one that concentrates a high volume of patients. The clinic’s management established that a path is considered critical if it involves a percentage of patients exceeding 50% above the uniform distribution across all possible paths. For example, if there are five paths, any path that accounts for more than 30% of the patients would be classified as critical.
Process discovery analysis was performed by the Fluxicon Disco® process mining tool.
The performance checking analysis focused on identifying bottlenecks in the clinic’s institutional operational workflow (Figure 2). In this case study, bottlenecks were determined using two metrics: the average activity execution time and the average waiting time for patients to access the activity. The clinic’s quality management team established target times and limits for each metric. For instance, for the Consultation/Evaluation activity, the target times were 30 minutes for execution and 20 minutes for waiting, while the limits were set at 45 minutes and 30 minutes, respectively. Any activity whose average execution or waiting time exceeded these limits was flagged as a bottleneck.
The same logic was applied to the treatment workflow (Figure 3), with the only difference being that times were defined in days rather than hours.
The performance checking analysis was conducted using the ONCOPATHWAYS® tool, a software application designed to monitor the oncology patient journey in real time.
The following sections describe the methods applied in each PM2 process activity of the case study.
3.1. Planning
The inputs to this phase are the organization’s business processes, and the outputs consist of the research questions and the identification of the information systems from which event data can be extracted.
This case study considered two distinct business processes, both of which are relevant to the oncology patient’s journey. The first concerns the patient’s flow within the clinic during chemotherapy or radiotherapy sessions, which we will refer to as the Department Workflow (Figure 2). Efforts to improve this process focus primarily on its performance, aiming to reduce the patient’s length of stay during these sessions. The research questions formulated for this process sought to investigate the critical paths; that is, those with the highest concentration of patients and, consequently, can lead to bottlenecks and delays.
The second business process analyzed concerns the patient’s treatment journey, which spans from the initial multidisciplinary evaluation consultation to discharge. This process will be referred to as the Treatment Workflow (Figure 3). Some of the research questions formulated for this process aimed to investigate variations in patient flow within the clinic based on different types of cancer. Understanding these process variants can support more efficient planning of the resources involved in the care tasks associated with each treatment pathway. Other research questions related to this process focused on identifying patients who experienced significant delays or became waiting at certain stages of the process.
3.2. Extraction
All events related to the business processes are stored in the clinic’s management system, which encompasses everything from the electronic health record (EHR) to the billing module. This is a proprietary system developed by the clinic’s own IT team, and its database is managed using Firebird.
The event data were extracted using SQL scripts validated and executed by the clinic’s IT team. No personal data from patients or healthcare professionals were extracted from the system. Only the data necessary for constructing the event log were retrieved: event identifier, executed activity (which may be a clinical or administrative procedure), execution start and end timestamps, scheduled date and time, patient arrival timestamp, executor identifier and resources used to execute the task.
The extraction period for events related to the treatment workflow was from January 2000 to May 2025, and for the department workflow, May 2025. No inclusion or exclusion criteria were applied other than the period of analysis.
The extracted event data were stored in a PostgreSQL database.
3.3. Data Processing
From the extracted event data, two event logs were created: one containing the events related to the department workflow and the other to the treatment workflow.
To enable more detailed analyses of the clinic’s processes, additional columns were included in the event logs. The added data includes: the ICD-10 code, to identify the type of tumor; the first-line therapeutic approach (surgery, chemotherapy, radiotherapy, etc.); the patient’s age group; and gender.
These event logs were stored in a PostgreSQL database and also exported to CSV format, which is one of the formats supported by one of the analysis tools used in the Mining and Analysis stage (Fluxicon Disco).
3.4. Mining and Analysis
For each research question defined during the planning stage, a process mining model was generated using one of the tools to address the corresponding question.
In process discovery analysis, multiple variants can be identified for a given process. To avoid an excessive number of variants, a coverage threshold of 70% of cases was established to limit the individual analysis. For example, if a process has 100 variants but the top three account for 70% of the patients, only those three will be analyzed. This approach was adopted due to the high number of variants, which stems from the complexity of cancer treatment and the flexibility in the sequence of care activities performed for each patient. Consider, for instance, a patient who, on the same day, undergoes an oncologist consultation, a nutritionist consultation, and a catheter cleaning procedure. In this case, the order of activities does not affect the clinical outcome, but the tool may still identify six distinct variants (3!) based on all possible sequences of these three activities.
The process discovery analysis was also applied across different data segments, including time periods, cancer types, age groups, and patient gender, to assess stability and consistency across these samples. For the analysis of variants by cancer type, the investigation was limited to three groups—breast, prostate, and digestive organ cancers—which together account for nearly 70% of the cases treated at the clinic.
Performance-checking metrics are obtained directly from the ONCOPATHWAYS monitoring tool. For activities in which bottlenecks were identified, the data were exported to an Excel spreadsheet, enabling individual analysis of cases that exceeded the defined time limits. Table 1 presents the target times defined for the activities in the Department Workflow, while Table 2 shows the target times for the stages of the Treatment Workflow. As shown in Table 2, the analysis of the treatment workflow’s performance is limited to waiting times.
3.5. Evaluation
The evaluation of the models and indicators generated by process mining tools was conducted manually by three professionals from the oncology clinic: the administrative manager, the quality manager, and the nursing manager.
The evaluation procedure comprised three main activities: (i) verifying the accuracy of the results obtained; (ii) analyzing the root causes of deviations, bottlenecks, and delays; and (iii) consolidating these causes into a structured table.
With respect to process discovery analysis, the assessment consisted of examining whether the identified critical paths corresponded to the clinic’s routine practice and whether the observed variations actually occurred. Variations identified as deviations from the institutional process were subsequently selected, and their causes investigated, occasionally requiring internal auditing procedures.
Regarding performance analysis, the evaluation entailed verifying whether the bottleneck flags had been triggered appropriately. For each workflow activity flagged as bottleneck, all instances exceeding the predefined timeout thresholds were examined to determine the reasons for the delays. The identified causes were then systematically recorded in an Excel spreadsheet.
3.6. Process Improvement
Based on the spreadsheet consolidating issues related to deviations, bottlenecks, and delays, the clinic’s management team, comprising managers from the involved departments, identified a set of improvement actions. The complete set of improvement proposals was subsequently submitted to the company’s board of directors for approval and implementation.
4. Results and Discussion
The results are presented and discussed according to the stages of the PM2 methodology, considering the scope of our case study.
4.1. Planning
The research questions were developed in collaboration with the clinic’s clinical and operational management teams.
For the Department Workflow, the following questions were defined:
- -
- What is the most common patient flow in the clinic’s daily operations?
- -
- What is the percentage of significant deviations from the institutional workflow? (Significant deviations are considered those that should not occur; for example, a patient undergoing a procedure without prior registration at the front desk.)
- -
- What is the average process execution time?
- -
- Which activities have average patient waiting times exceeding the defined thresholds?
For the Treatment Workflow, the following questions were formulated:
- -
- What is the most common treatment pathway in the clinic?
- -
- Are there significant differences among the treatment pathways for breast, prostate, and digestive organ cancers?
- -
- Considering these three types of cancer, which treatment stages have starting times that exceed the defined thresholds?
4.2. Extraction and Data Processing
Two SQL scripts were developed to extract event data from the clinic’s management system: one for events related to the Department Workflow and another for events related to the Treatment Workflow. The first script resulted in a table with 13,400 rows, while the second extracted 67,469 rows.
These tables were exported as CSV files. The table related to Department Workflow events generated six CSV files: one containing the entire period and five with records separated by month, from January to May 2025. The table related to Treatment Workflow events produced seven CSV files: one containing the full period from 2020 to 2025, and six with records separated by year.
The creation of multiple log files aimed to facilitate comparative analysis over time, as the analysis tool supports reading and processing multiple datasets simultaneously.
The CSV files were utilized for analyses conducted with Fluxicon Disco, whereas ONCOPATHWAYS performed its analyses by directly processing data stored in the PostgreSQL database.
4.3. Mining and Analysis
Based on the analysis of the Department Workflow, a process model was generated covering the entire period from January to May 2025 (Figure 4). This model addresses the research question: “What is the most common patient flow in the clinic’s daily operations?”
The most frequent activity flow observed in the clinic corresponds to radiotherapy treatment, in which the patient checks in at the front desk (“Atendimento Recepção”) and then proceeds to the radiotherapy session (“Sessão Radioterapia”), accounting 2,754 occurrences.
The second most frequent path is the evaluation consultations, where the patient registers at the reception and then proceeds to a medical consultation (“Consulta”), with 2,535 occurrences.
Chemotherapy infusion represents the third most common flow at the clinic, with 874 occurrences. This flow includes patient check-in at the reception, followed by medication dispensing by the pharmacy (“Dispensação Medicamento”) and subsequent drug administration to the patient (“Administração Quimioterapia”).
A more detailed analysis of the process model shown in Figure 4 reveals the existence of several flow variants. For example, when examining the standard chemotherapy administration flow (check-in at reception → medication dispensing → chemotherapy administration), it is observed that 610 occurrences followed the direct path from reception to medication dispensing. However, a total of 874 medication dispensing events were recorded. This discrepancy indicates the presence of a process variant: in some cases, patients check in at reception, then undergo a medical consultation before, and afterward proceed to medication dispensing and, subsequently, chemotherapy administration.
The process model presented in Figure 4 also allows us to address the research question: “What is the percentage of significant deviations from the institutional workflow?”. A closer analysis of the model reveals some discrepancies that correspond to deviations from the institutional process. For example, it is observed that the process starts with 5,372 occurrences; however, there are 5,429 check-in records at reception. This indicates that some cases (57) checked in more than once, which represents a deviation from the expected workflow. In this case, the deviation rate is only 1%.
Another deviation can be seen in the medication dispensing activity. While there are 874 occurrences of dispensing, the model shows 887 outgoing transitions from this activity leading to drug administration. This also represents a small deviation, with a similar rate of approximately 1%.
Another way to identify process deviations is by expanding the visualization of process variants. When displaying the process model with 50% of all variants (Figure 5), it is possible to detect a deviation from the institutional workflow: patients who bypassed reception and proceeded directly to medication dispensing (24 cases) or to a medical consultation (36 cases).
To address the research question “What is the average execution time of the process?”, we used the “Global Statistics” feature of the Disco tool (Figure 6). The observed average execution time was 92.8 minutes. The chart shows that most cases have an execution time of less than 1 hour and 43 minutes, which aligns with the clinic’s most frequent workflow: radiotherapy and medical consultations. Both activities are typically quick, usually completed in under an hour.
The longest workflow in an oncology outpatient setting is chemotherapy administration, which ranges from 3 to 6 hours. However, these cases represent only 16% of the total occurrences.
Figure 6 also shows that the Department Workflow process contains 148 variants. Additionally, different sample segments were analyzed, including period, cancer type, age group, and patient gender. The process findings remained consistent across all segments, indicating that these variables do not significantly impact the clinic’s operational workflow.
From the analysis of the Treatment Workflow, a process model was generated covering the period from 2020 to 2025 (Figure 7). This model addresses the research question: “What is the most common treatment pathway in the clinic?” The results revealed that the most frequent treatment was radiotherapy, undertaken by 1,355 patients, followed by chemotherapy, administered to 490 patients.
The prevalence of radiotherapy as the most frequent treatment in the model is explained by the clinic’s role as a regional reference center for this service, receiving many patients who undergo oncological treatment at other institutions but attend this clinic specifically for radiotherapy.
The second research question regarding treatment workflow to be addressed is: “Are there significant differences among the treatment pathways for breast, prostate, and digestive organ cancers?” The results of the process model analysis for each of these cancer types indicate that there are. When comparing the treatment process model for prostate cancer (Figure 8) with that for digestive organ cancers (Figure 9), it becomes evident that the former presents a more clearly defined flow, with radiotherapy as the predominant treatment approach. In contrast, chemotherapy is more prevalent in the treatment of digestive organ cancers. Another noteworthy aspect is the higher incidence of supportive therapy in cases of digestive organ tumors compared to prostate cancer cases.
Different sample segments were analyzed, including period, age group, and patient gender; however, the treatment process findings remain consistent across these segments.
The ONCOPATHWAYS tool was used to address questions related to performance checking. Figure 10 presents the ambulatory journey monitoring screen, which provides an answer to the question: “Which activities have average patient waiting times exceeding the defined thresholds?”.
Bottlenecks were identified in three activities: Consultation/Evaluation, Medication Handling, and Support Therapy. In the case of Medication Handling, the bottleneck was flagged due to the task execution time exceeding the defined limit, whereas in the other two activities the delays were attributed to patient waiting times. Task execution time is represented by the number inside each box, while patient waiting time corresponds to the number above the arrows connecting the boxes. For the Consultation/Evaluation activity, this indicates that the average waiting time for patients to be called for a medical evaluation was 37 minutes. The number below each box represents the qty of patients who underwent that activity; for Consultation/Evaluation, this amounted to 697 patients.
The treatment journey monitoring screen (Figure 11) addresses the question: “For these three types of cancer, which treatment stages have start times that exceed the defined thresholds?”. Considering the analyzed period (Jan – May/2025) and selecting the three most frequent cancer types (breast, prostate, and digestive organ), no bottlenecks were flagged, and treatment initiation times were generally favorable, with an average of 28 days for chemotherapy and 27 days for radiotherapy. However, the longest waiting times—shown above the boxes—indicate that at least one patient waited 62 days to begin chemotherapy, while another waited 127 days to begin radiotherapy.
The chemotherapy details screen (Figure 12) shows that 6 of the 17 patients who underwent chemotherapy began treatment after the target threshold of 30 days. In the case of radiotherapy, one patient started after 127 days; this was the same patient who had previously been flagged for a 118-day delay in the Additional Tests activity, which directly contributed to the postponement of radiotherapy.
4.4. Evaluation and Process Improvement
The validation of the process mining models confirmed the system’s accuracy across all measured results. In some cases where the process mining tool reported undue delays, it was not errors in the algorithm but rather inaccuracies in data inputting into the EHR.
Three process deviations identified through process discovery analysis were examined in detail by the quality team. The first is related to a higher number of outgoing transitions from the medication dispensing (887) compared to drug administration (874). Investigation showed that this difference resulted from medications being dispensed in separate batches—an accepted practice when two different batches of the same drug are used. This deviation, therefore, was not considered an issue.
The second deviation concerned cases in which patients went through reception registration more than once (1% of occurrences). This situation occurred when care activities took place in different physical locations within the clinic, for example, a medical consultation followed by a physical therapy session—requiring patients to register at both reception desks. This deviation also was not considered a big problem, although an improvement suggestion was addressed to this situation.
The third deviation concerned cases where patients received a care service, such as consultation or medication dispensing, without a check-in at reception desk. Analysis conducted by quality team revealed that 90% of these cases were linked to delivery service offer by the Clinic (e.g., oral medications sent directly to patients’ homes). However, some instances were also due to patients being called in for an appointment by a physician before registering at reception. For this second situation, a process improvement was suggested.
The review of bottleneck and delay indicators from the ambulatory journey monitoring screen revealed that the start and end times of activities recorded in the EHR are often inaccurate, as the system does not require this information to be entered at the exact moment the events occur. For example, a physician may call a patient into the office without immediately entering the start time in the system or may call the next patient without first recording the end time of the previous consultation. This limitation makes it impossible to accurately analyze delays in these activities. Nonetheless, process improvement suggestions were submitted to the EHR development team.
Regarding the bottleneck identified in the medication dispensing activity, the issue was not inaccurate EHR data, which had been correctly entered, but rather an inadequacy in the definition of the task’s time limit (10 minutes). More complex formulas may legitimately require additional preparation time, leading to longer dispensing durations; a reality that had not been considered when the time limit was set. The quality team submitted a suggestion to address this issue.
Although the treatment journey monitoring screen did not flag bottlenecks (based on average times), the tool did identify individual cases of delay (Figure 12). Consequently, the root cause of each delay was investigated. Cases in which the delay resulted from a personal decision of the patient were excluded from the analysis. In most of the remaining cases, the reason for delays was related to delays or denials of care procedures authorization by the healthcare insurance company, which required patients to pursue alternative actions and ultimately postponed the start of treatment. Based on this insight, the quality team proposed important suggestions to help mitigate delays in treatment initiation.
The problems investigated, their causes, and the corresponding suggestions for process improvement are presented in Table 3.
5. Conclusions
This study demonstrates the applicability and value of process mining techniques in uncovering and understanding the operational workflows of an outpatient oncology clinic, as well as identifying bottlenecks and delays. By applying the PM2 methodology, we successfully mapped real-world treatment and departmental workflows, revealing the most frequent care pathways and identifying significant process variants and deviations.
Our findings show that radiotherapy and medical consultations are the most common daily activities in the oncology clinic analyzed in this case study, with chemotherapy following closely behind. Furthermore, the analysis of treatment pathways for breast, prostate, and digestive organ cancers revealed distinct patterns in care delivery, emphasizing the need for tailored operational strategies based on tumor type.
The application of process mining for performance analysis revealed issues related to data entry in the EHR system, as well as in the healthcare insurance approval process. These issues were examined, and improvement actions were proposed to optimize the patient’s journey and increase efficiency, particularly regarding delays in the initiation of treatment.
Although the current study focused primarily on process discovery and performance checking, it lays the foundation for future conformance checking. These next steps may include identifying inefficiencies, refining workflows, and evaluating adherence to clinical guidelines—ultimately contributing to improved patient outcomes and more efficient resource allocation.
The results not only confirm the utility of process mining techniques to enhance the patient journey in an oncology clinic but also highlight its potential as a decision-support tool for healthcare administrators and clinical leaders.
Author Contributions
Conceptualization, R.S.; methodology, R.S.; software, R.S.; validation, J.B., M.C. and A.R.; formal analysis, J.PO.; investigation, R.S.; resources, R.S.; data curation, R.S.; writing—original draft preparation, R.S.; writing—review and editing, R.S and J.PO.; visualization, R.S.; supervision, J.PO.; project administration, R.S and A.R.; funding acquisition, R.S. All authors have read and agreed to the published version of the manuscript.
Funding
This research received no external funding.
Institutional Review Board Statement
This study was approved by the National Research Ethics Committee (CEP/CONEP) under number: CAAE:75225723.7.0000.5497.
Informed Consent Statement
Patient consent was waived because only secondary, anonymized data was used. The study does not involve clinical aspects but is limited to examining the operational flow of the treatment plan. Therefore, only information pertaining to the execution of activities was collected, including the type of activity, date of execution, start and end times, resources utilized, and the roles of those involved.
Data Availability Statement
Not applicable.
Acknowledgments
The authors would like to thank the staff at the Mogi das Cruzes Oncology Center who are evaluating the process mining solution.
Conflicts of Interest
The authors declare no conflict of interest.
References
- T. P. Hanna et al., “Mortality due to cancer treatment delay: systematic review and meta-analysis,” BMJ, p. m4087, Nov. 2020. [CrossRef]
- Z. Ungvari et al., “Quantifying the impact of treatment delays on breast cancer survival outcomes: a comprehensive meta-analysis,” GeroScience, June 2025. [CrossRef]
- F. Williams, “Assessment of Breast Cancer Treatment Delay Impact on Prognosis and Survival: a Look at the Evidence from Systematic Analysis of the Literature,” 2021.
- D. Z. Liao et al., “Association of Delayed Time to Treatment Initiation With Overall Survival and Recurrence Among Patients With Head and Neck Squamous Cell Carcinoma in an Underserved Urban Population,” JAMA Otolaryngol Head Neck Surg, vol. 145, no. 11, p. 1001, Nov. 2019. [CrossRef]
- M. S. Lombardo and R. C. Popim, “Access of the patient to the cancer network under the ‘Sixty-Day Law’: Integrative Review,” Rev. Bras. Enferm., vol. 73, no. 5, p. e20190406, 2020. [CrossRef]
- Zago Pulido, L. Carrupt Machado Sogame, and S. B. Aleixo, “The 60-Days Law: Reality of Timely Treatment in the Analysis of a Series of Colorectal Cancer Cases,” Rev. Bras. Cancerol., vol. 69, no. 4, Dec. 2023. [CrossRef]
- B. A. Marcelino, F. H. Soares, M. L. D. C. Curi, A. J. Alves Wainstein, and A. P. Drummond-Lage, “Is a law enough to provide a better prognosis for Brazilian melanoma patients or education is still a gap?,” Health Planning & Management, vol. 37, no. 4, pp. 2479–2484, July 2022. [CrossRef]
- M. Chen, V. S. Wu, D. Falk, C. Cheatham, J. Cullen, and R. Hoehn, “Patient Navigation in Cancer Treatment: A Systematic Review,” Curr Oncol Rep, vol. 26, no. 5, pp. 504–537, May 2024. [CrossRef]
- W. van der Aalst, Process Mining: Data Science in Action, 2. 2nd ed. 2016. Berlin, Heidelberg: Springer Berlin Heidelberg, 2016. [CrossRef]
- A. Wicky et al., “Interactive process mining of cancer treatment sequences with melanoma real-world data,” Front. Oncol., vol. 13, p. 1043683, Mar. 2023. [CrossRef]
- B. B. Lauritzen, J. S. Jensen, C. Grønhøj, I. Wessel, and C. Von Buchwald, “Impact of delay in diagnosis and treatment-initiation on disease stage and survival in oral cavity cancer: a systematic review,” Acta Oncologica, vol. 60, no. 9, pp. 1083–1090, Sept. 2021. [CrossRef]
- L. Aversano, M. Iammarino, A. Madau, G. Pirlo, and G. Semeraro, “Process mining applications in healthcare: a systematic literature review,” PeerJ Computer Science, vol. 11, p. e2613, Jan. 2025. [CrossRef]
- H. Al-Badarneh and A. Arif, “A Systematic Review of Process Mining in Healthcare,” in 2025 International Conference on New Trends in Computing Sciences (ICTCS), Amman, Jordan: IEEE, Apr. 2025, pp. 485–492. [CrossRef]
- A. Guzzo, A. Rullo, and E. Vocaturo, “Process mining applications in the healthcare domain: A comprehensive review,” WIREs Data Min & Knowl, vol. 12, no. 2, p. e1442, Mar. 2022. [CrossRef]
- A. P. Kurniati, O. Johnson, D. Hogg, and G. Hall, “Process mining in oncology: A literature review,” in 2016 6th International Conference on Information Communication and Management (ICICM), Hatfield, United Kingdom: IEEE, Oct. 2016, pp. 291–297. [CrossRef]
- C. D. S. Garcia et al., “Process mining techniques and applications – A systematic mapping study,” Expert Systems with Applications, vol. 133, pp. 260–295, Nov. 2019. [CrossRef]
- R. S. Mans, M. H. Schonenberg, M. Song, W. M. P. Van Der Aalst, and P. J. M. Bakker, “Application of Process Mining in Healthcare – A Case Study in a Dutch Hospital,” in Biomedical Engineering Systems and Technologies, vol. 25, A. Fred, J. Filipe, and H. Gamboa, Eds., in Communications in Computer and Information Science, vol. 25., Berlin, Heidelberg: Springer Berlin Heidelberg, 2008, pp. 425–438. [CrossRef]
- P. Pijnenborg, R. Verhoeven, M. Firat, H. V. Laarhoven, and L. Genga, “Towards Evidence-Based Analysis of Palliative Treatments for Stomach and Esophageal Cancer Patients: a Process Mining Approach,” in 2021 3rd International Conference on Process Mining (ICPM), Eindhoven, Netherlands: IEEE, Oct. 2021, pp. 136–143. [CrossRef]
- M. Savino et al., “A process mining approach for clinical guidelines compliance: real-world application in rectal cancer,” Front. Oncol., vol. 13, p. 1090076, May 2023. [CrossRef]
- F. Iachecen et al., “Process mining applied to the patient journey: A case study in lung cancer,” RBSS - Rev. Bras. Saúde Suplementar, vol. 1, no. 1, 2023.
- M. L. Van Eck, X. Lu, S. J. J. Leemans, and W. M. P. Van Der Aalst, “PM2: A Process Mining Project Methodology,” in Advanced Information Systems Engineering, vol. 9097, J. Zdravkovic, M. Kirikova, and P. Johannesson, Eds., in Lecture Notes in Computer Science, vol. 9097., Cham: Springer International Publishing, 2015, pp. 297–313. [CrossRef]
Figure 1.
PM2 methodology overview. (Adapted from van Eck at al. [21]).
Figure 1.
PM2 methodology overview. (Adapted from van Eck at al. [21]).
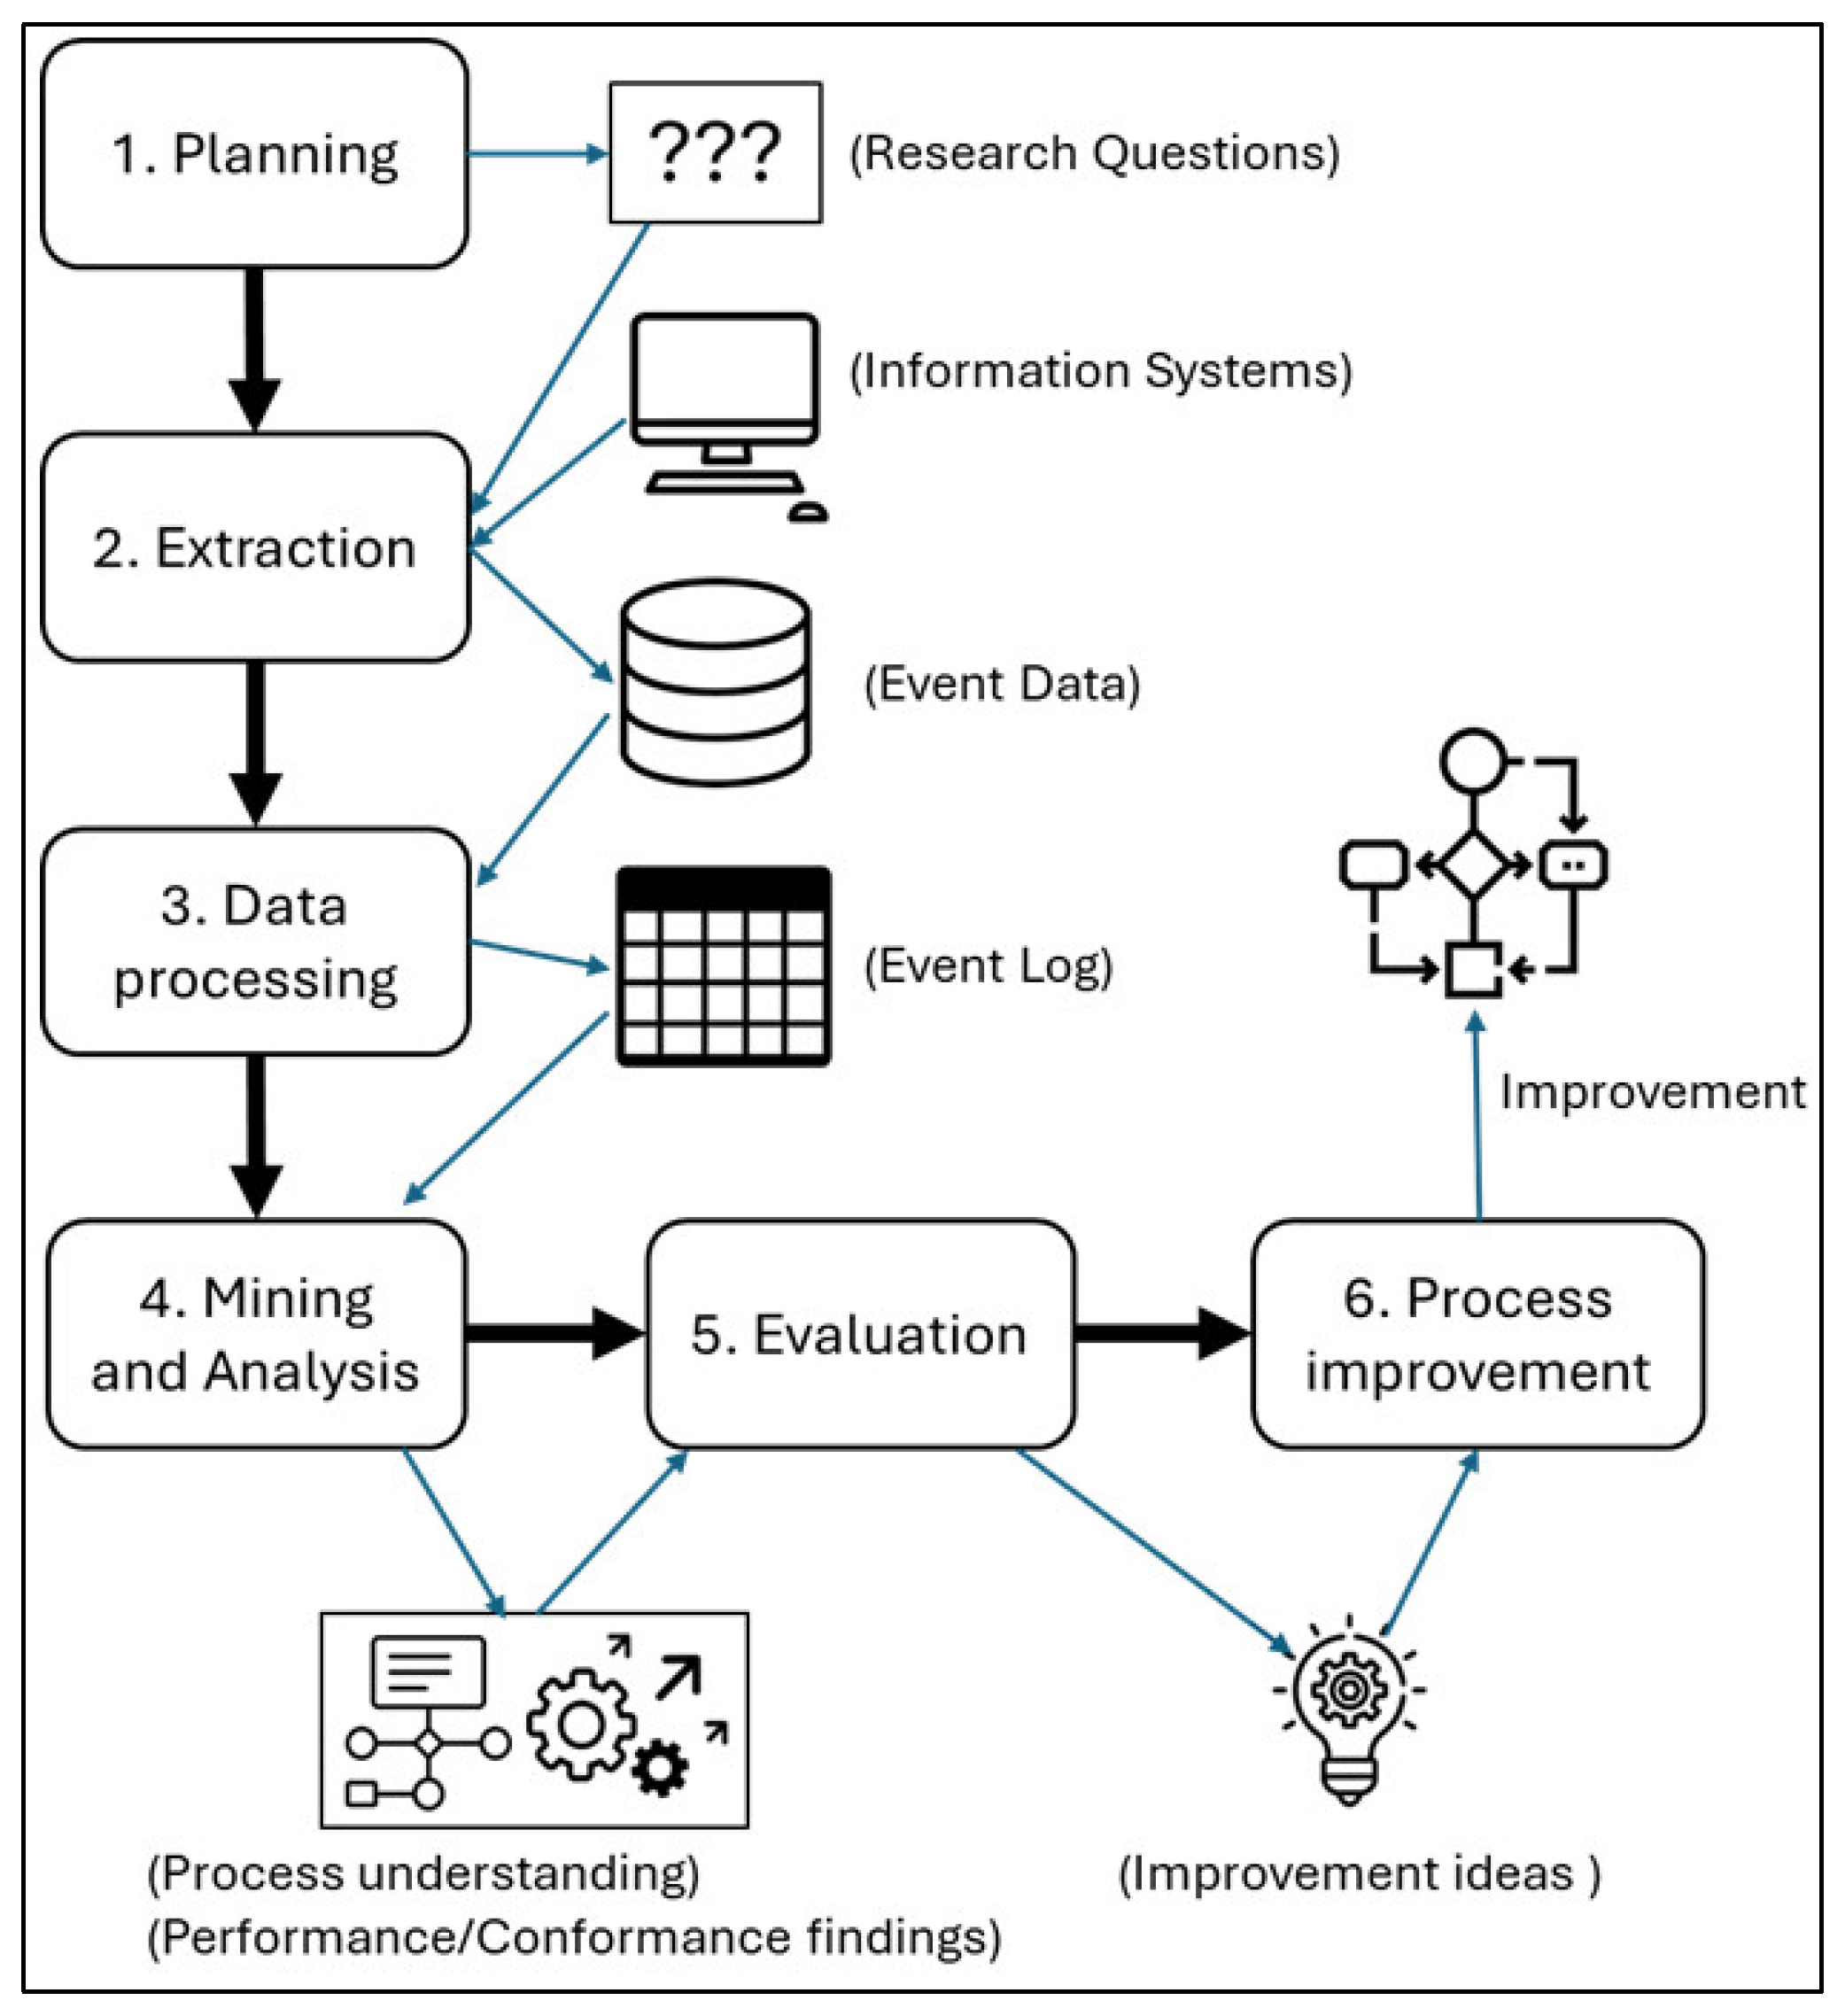
Figure 2.
Institutional operational workflow (Department Workflow).
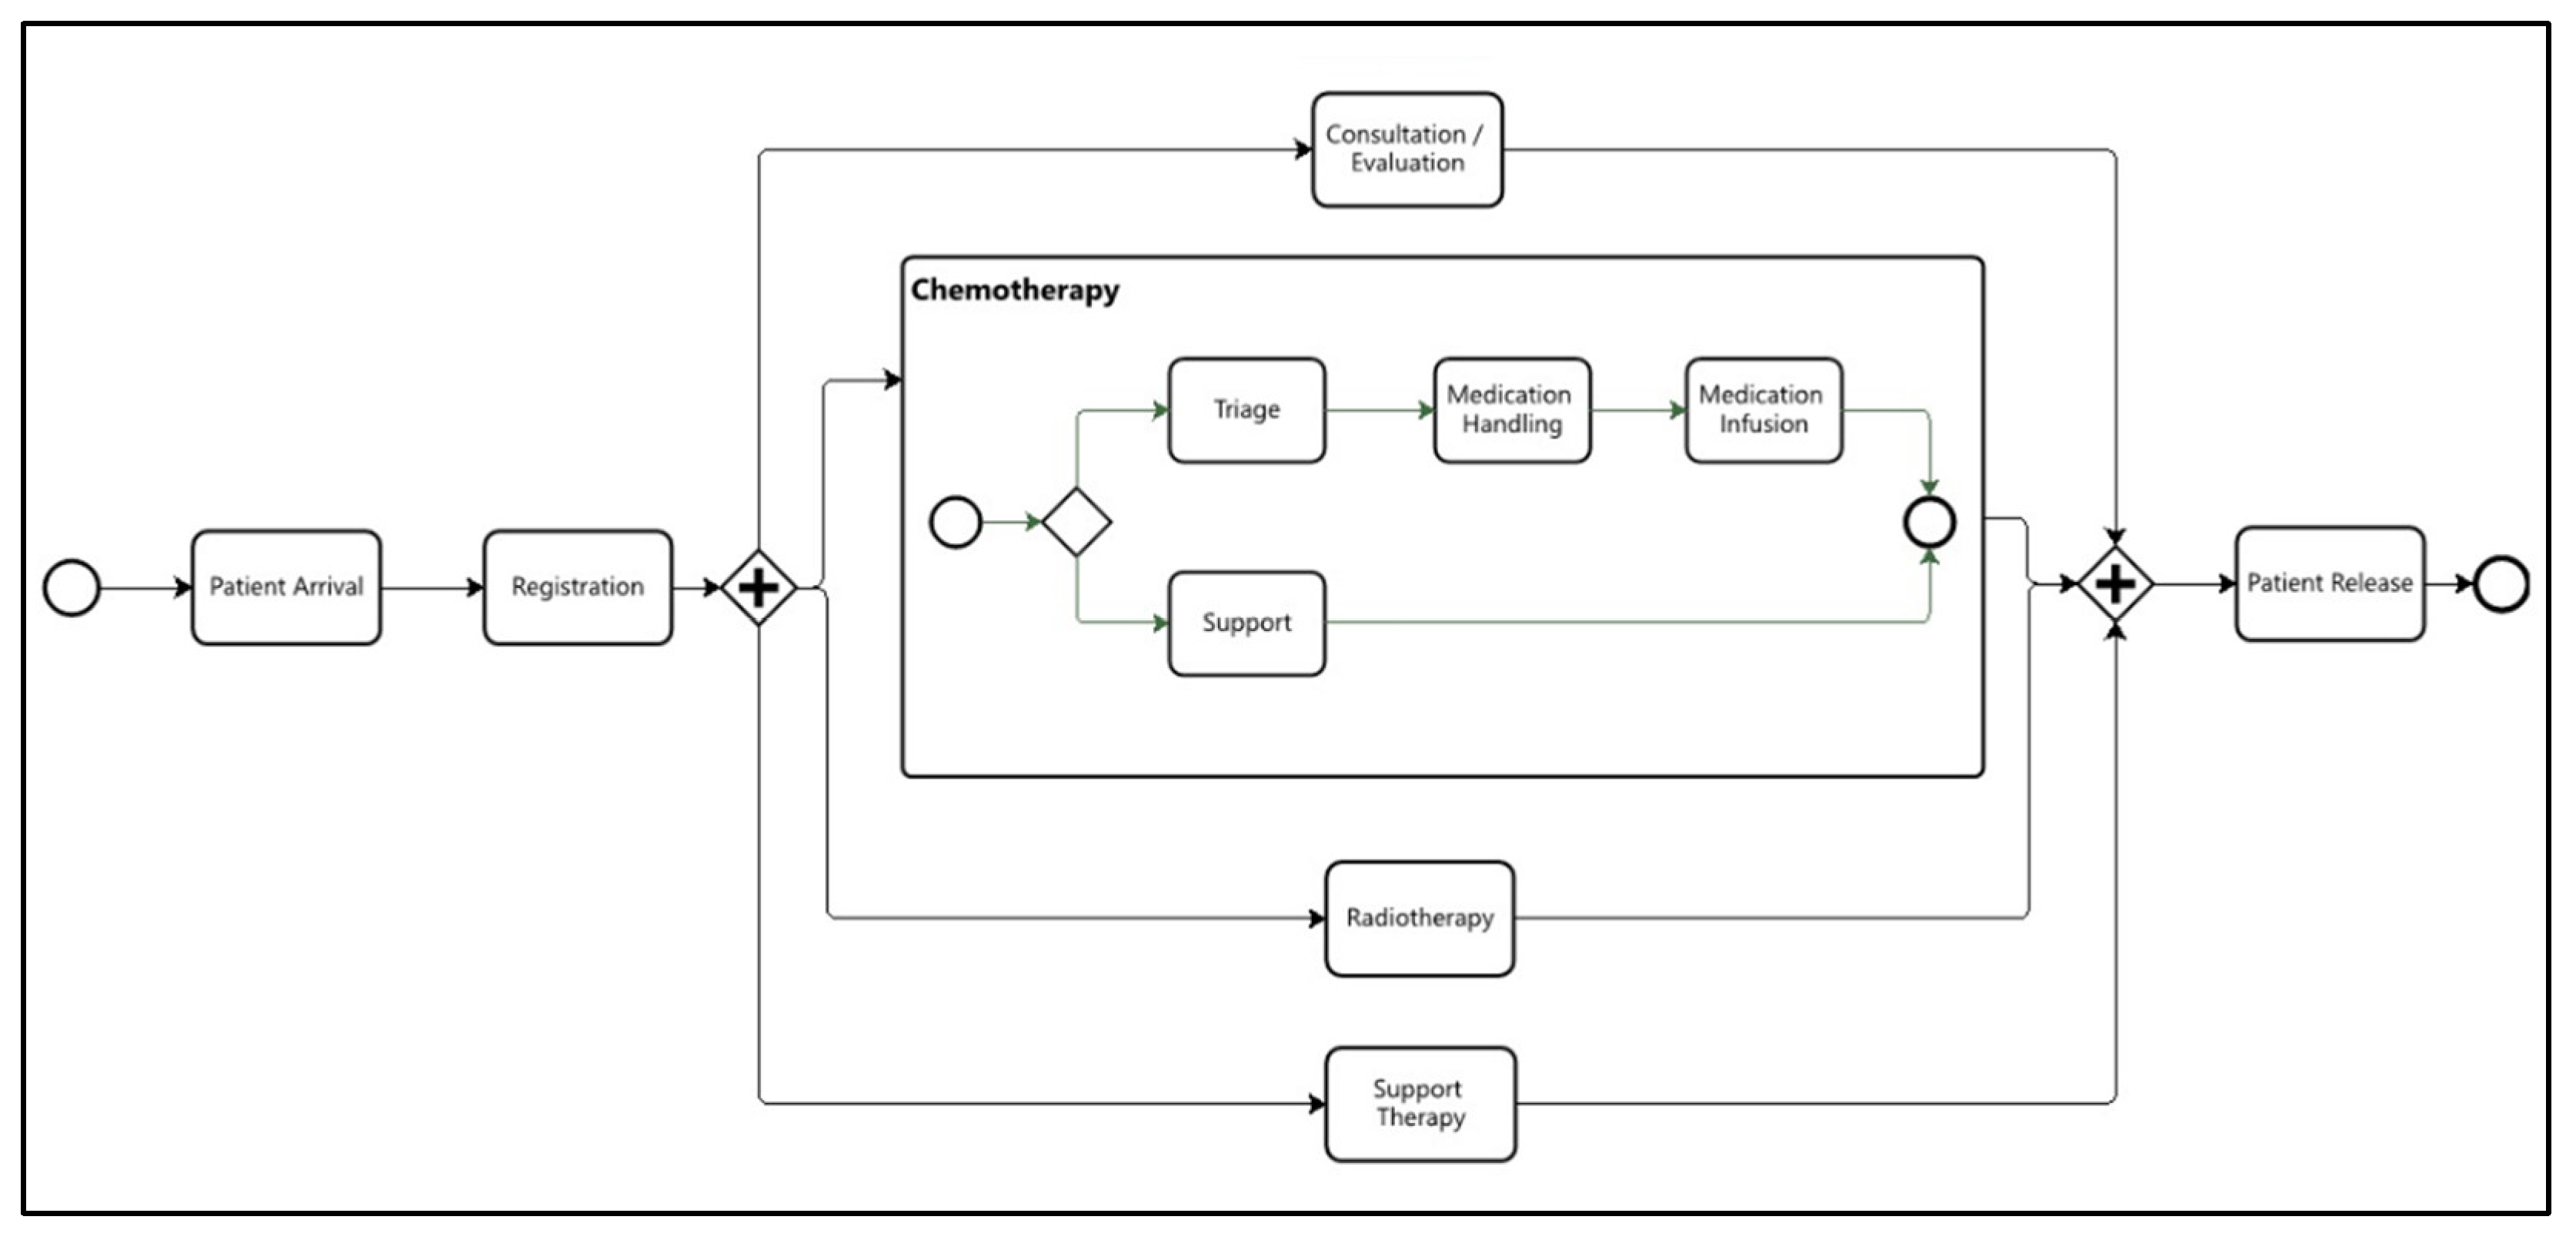
Figure 3.
Treatment workflow.
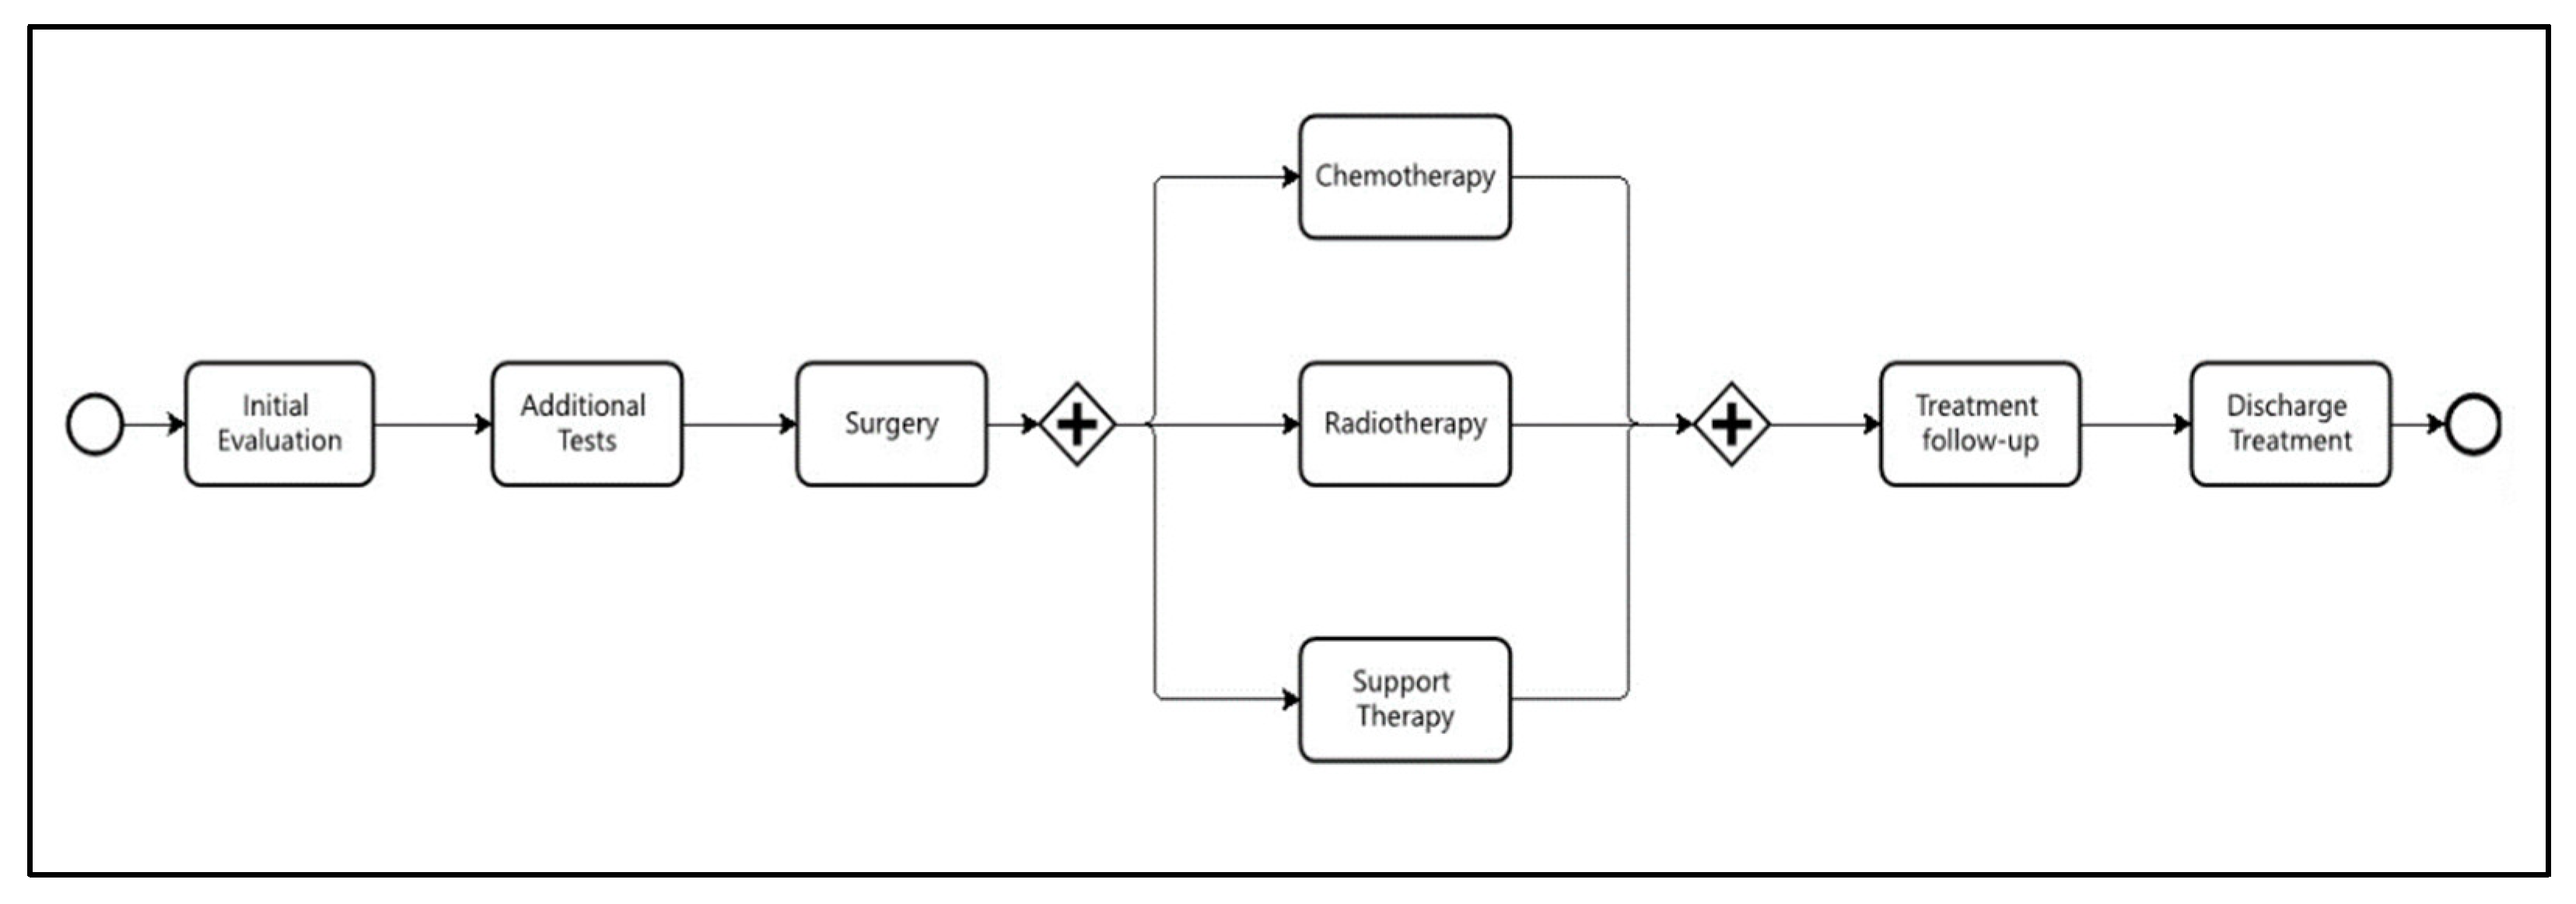
Figure 4.
Department process model – Jan 2025 to May 2025.
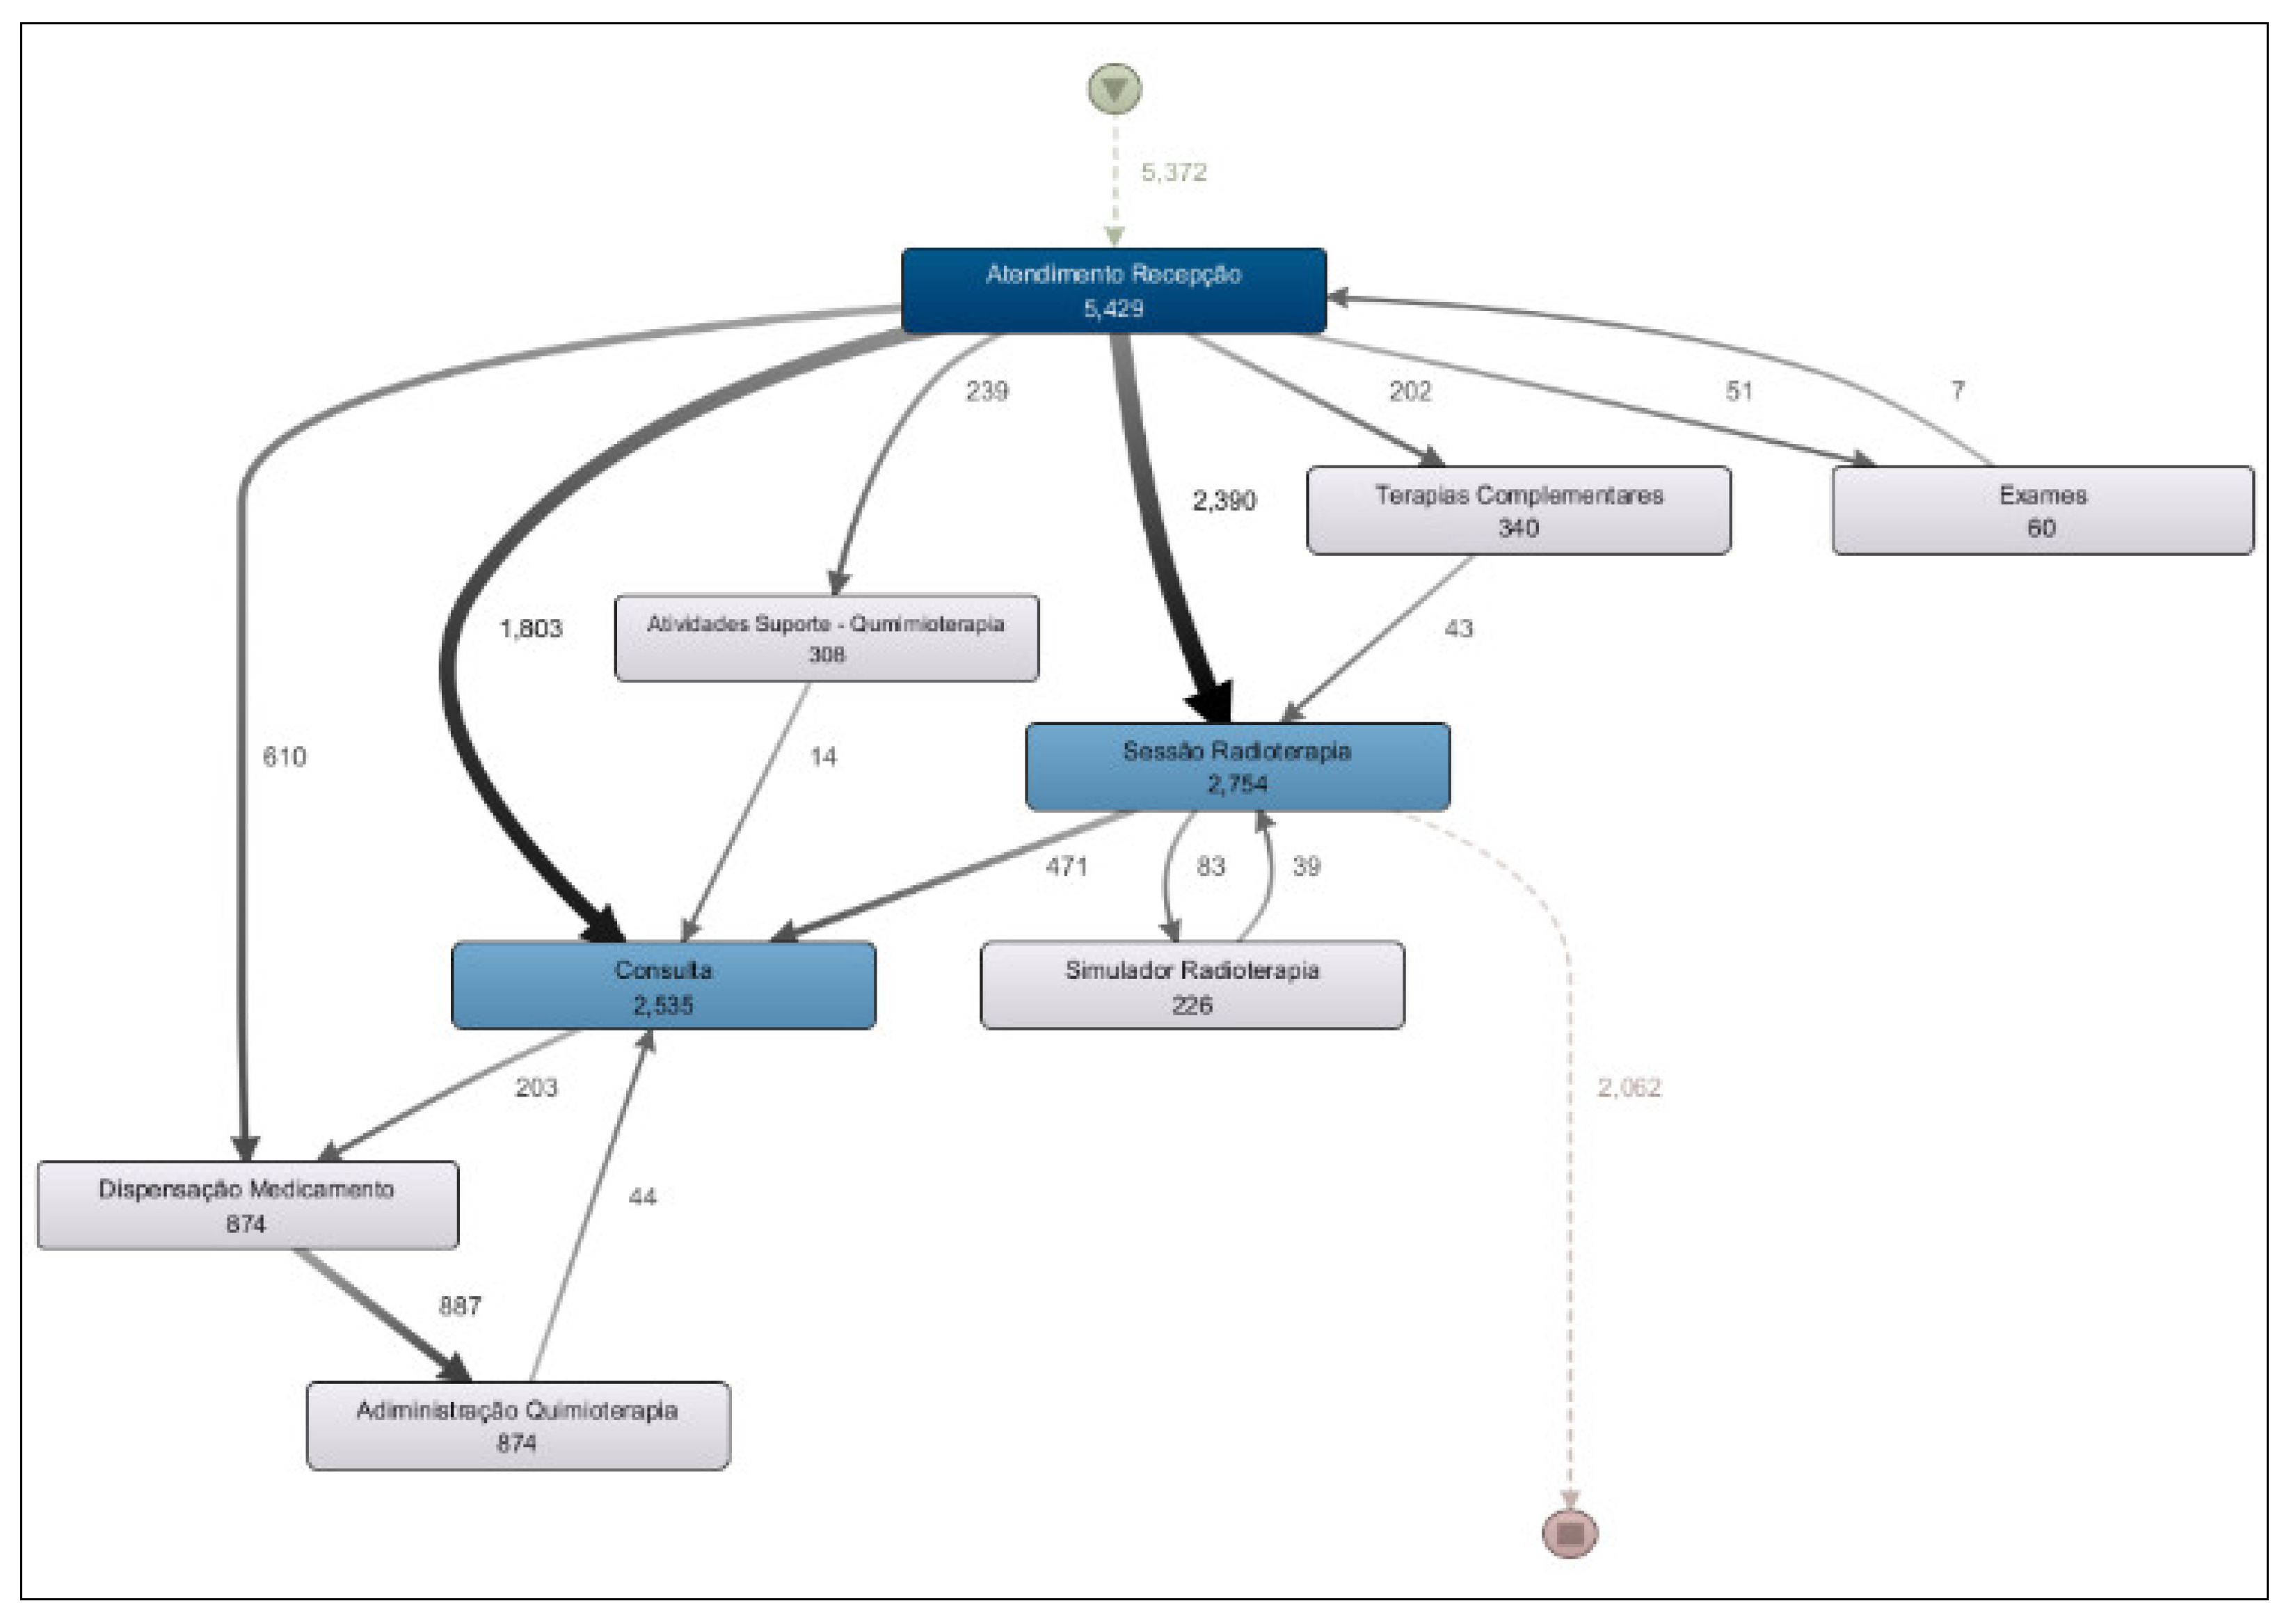
Figure 5.
Department process model showing the top 50% of variants.
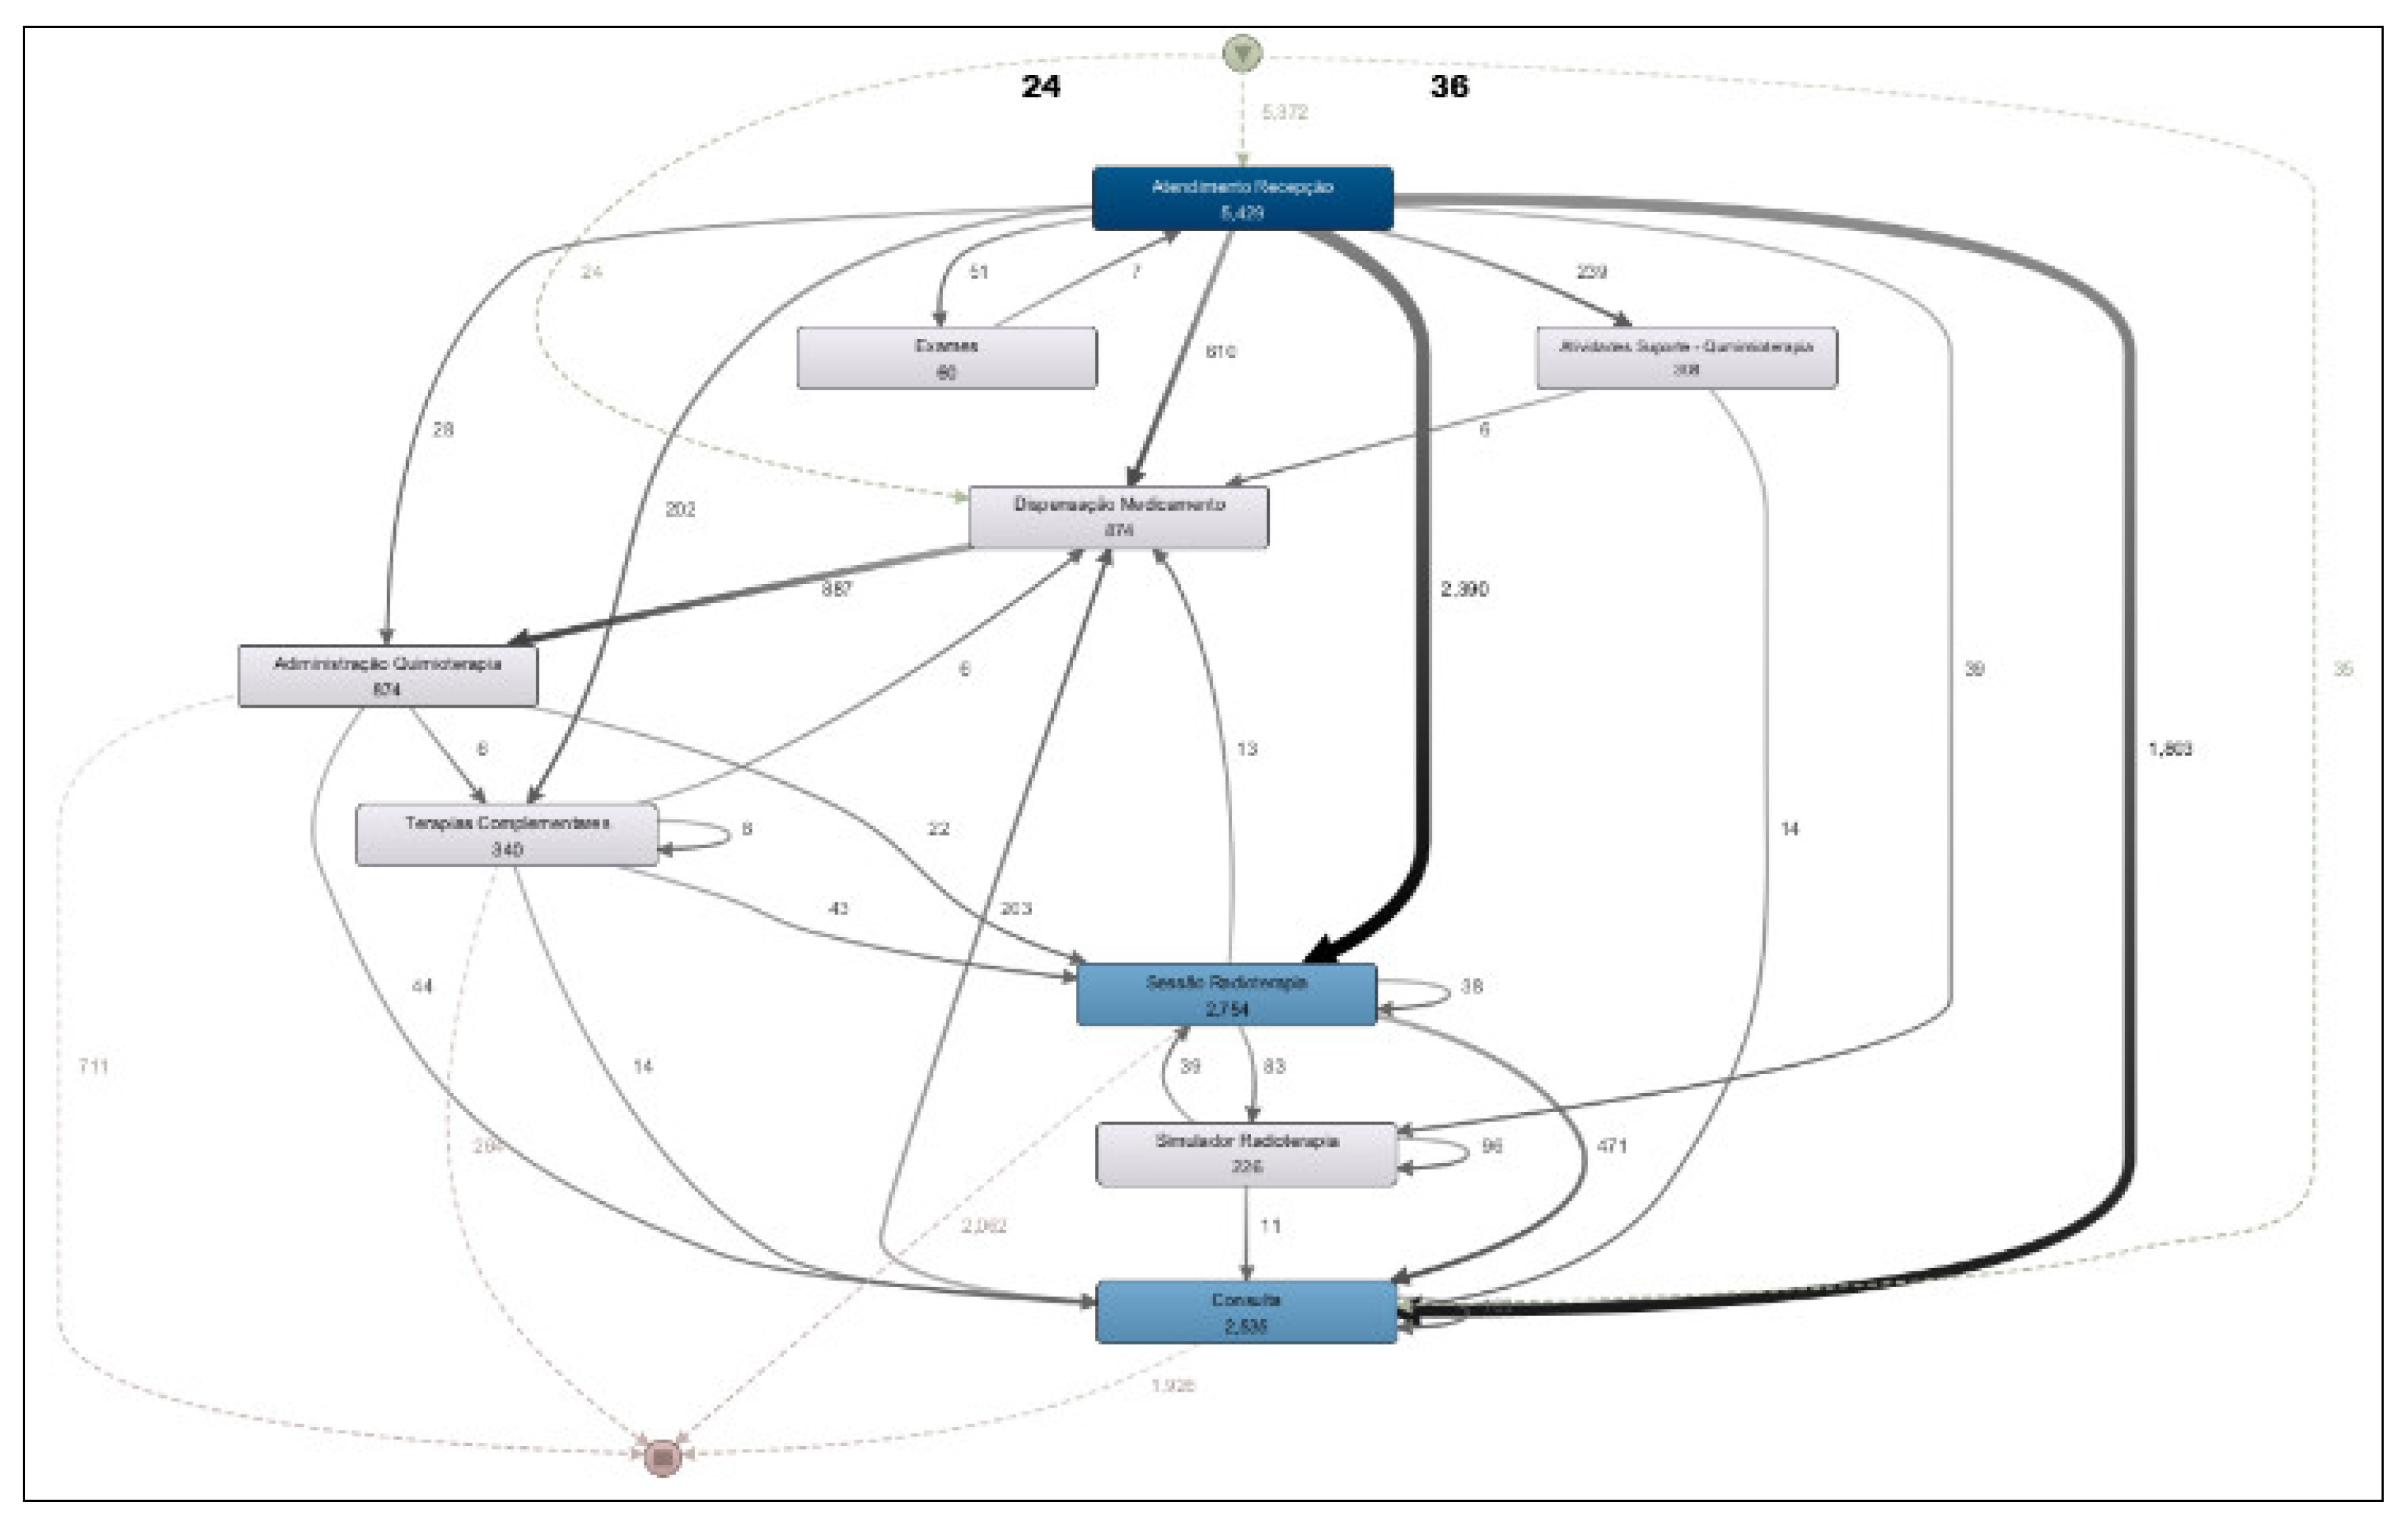
Figure 6.
Global statistics of the department process.
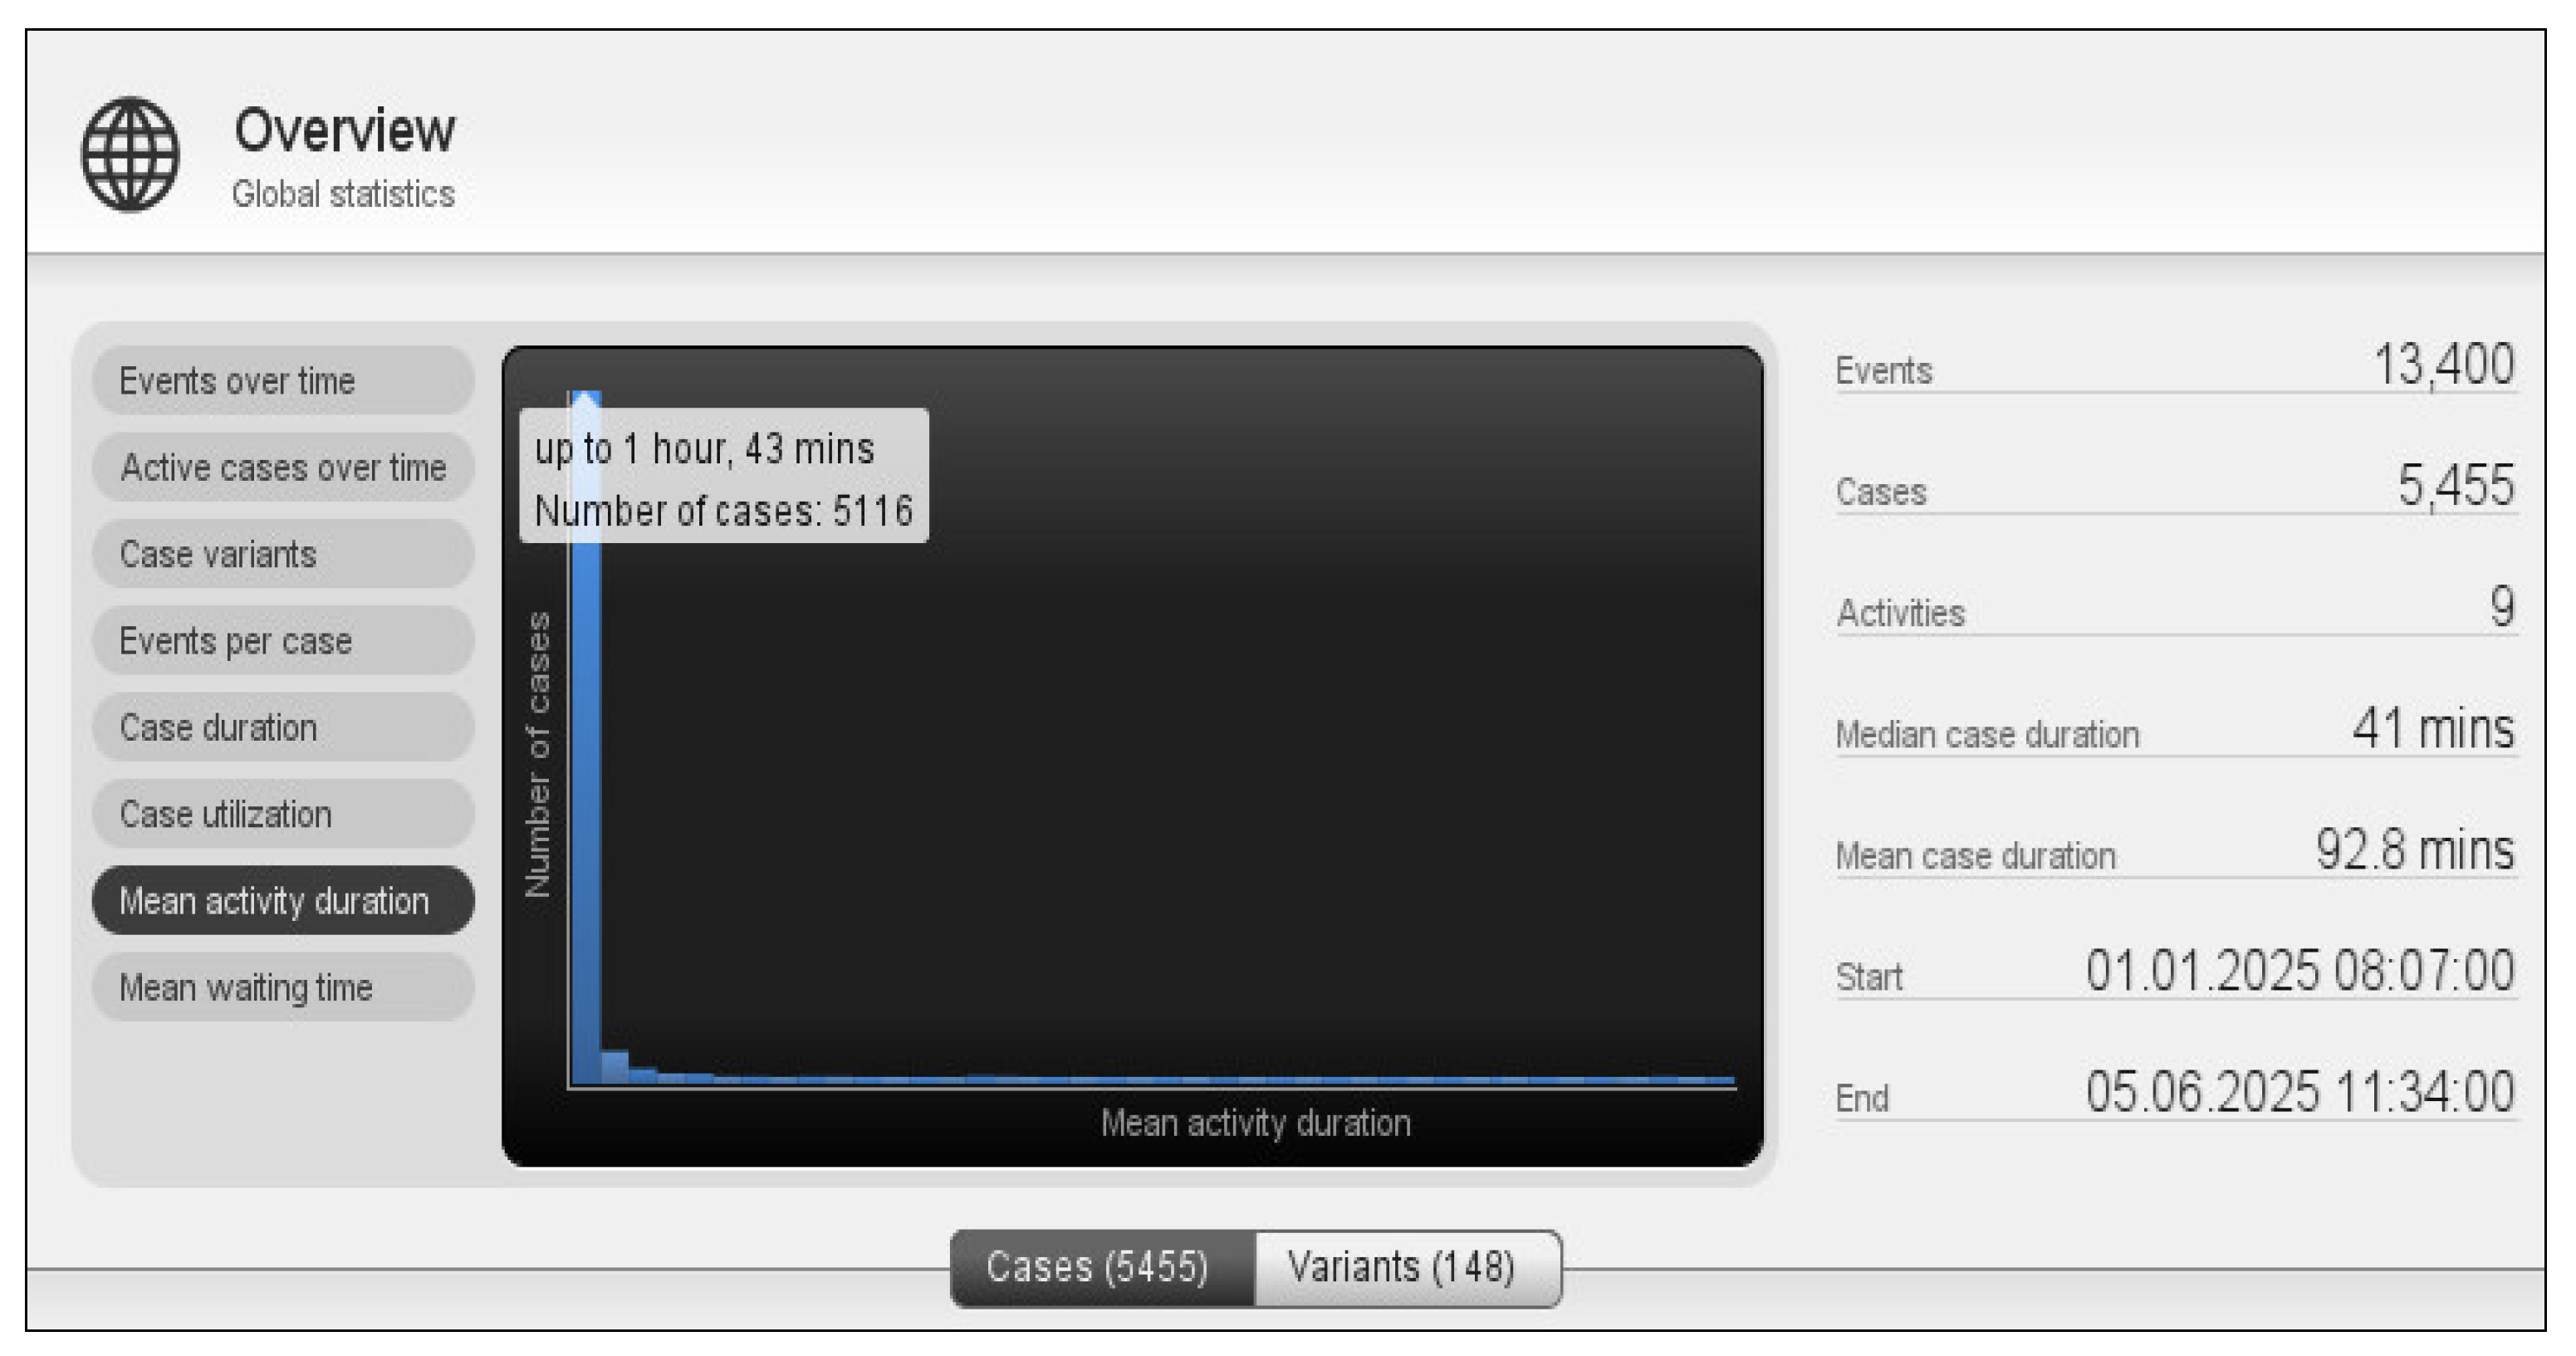
Figure 7.
Treatment process model – 2020 to 2025.
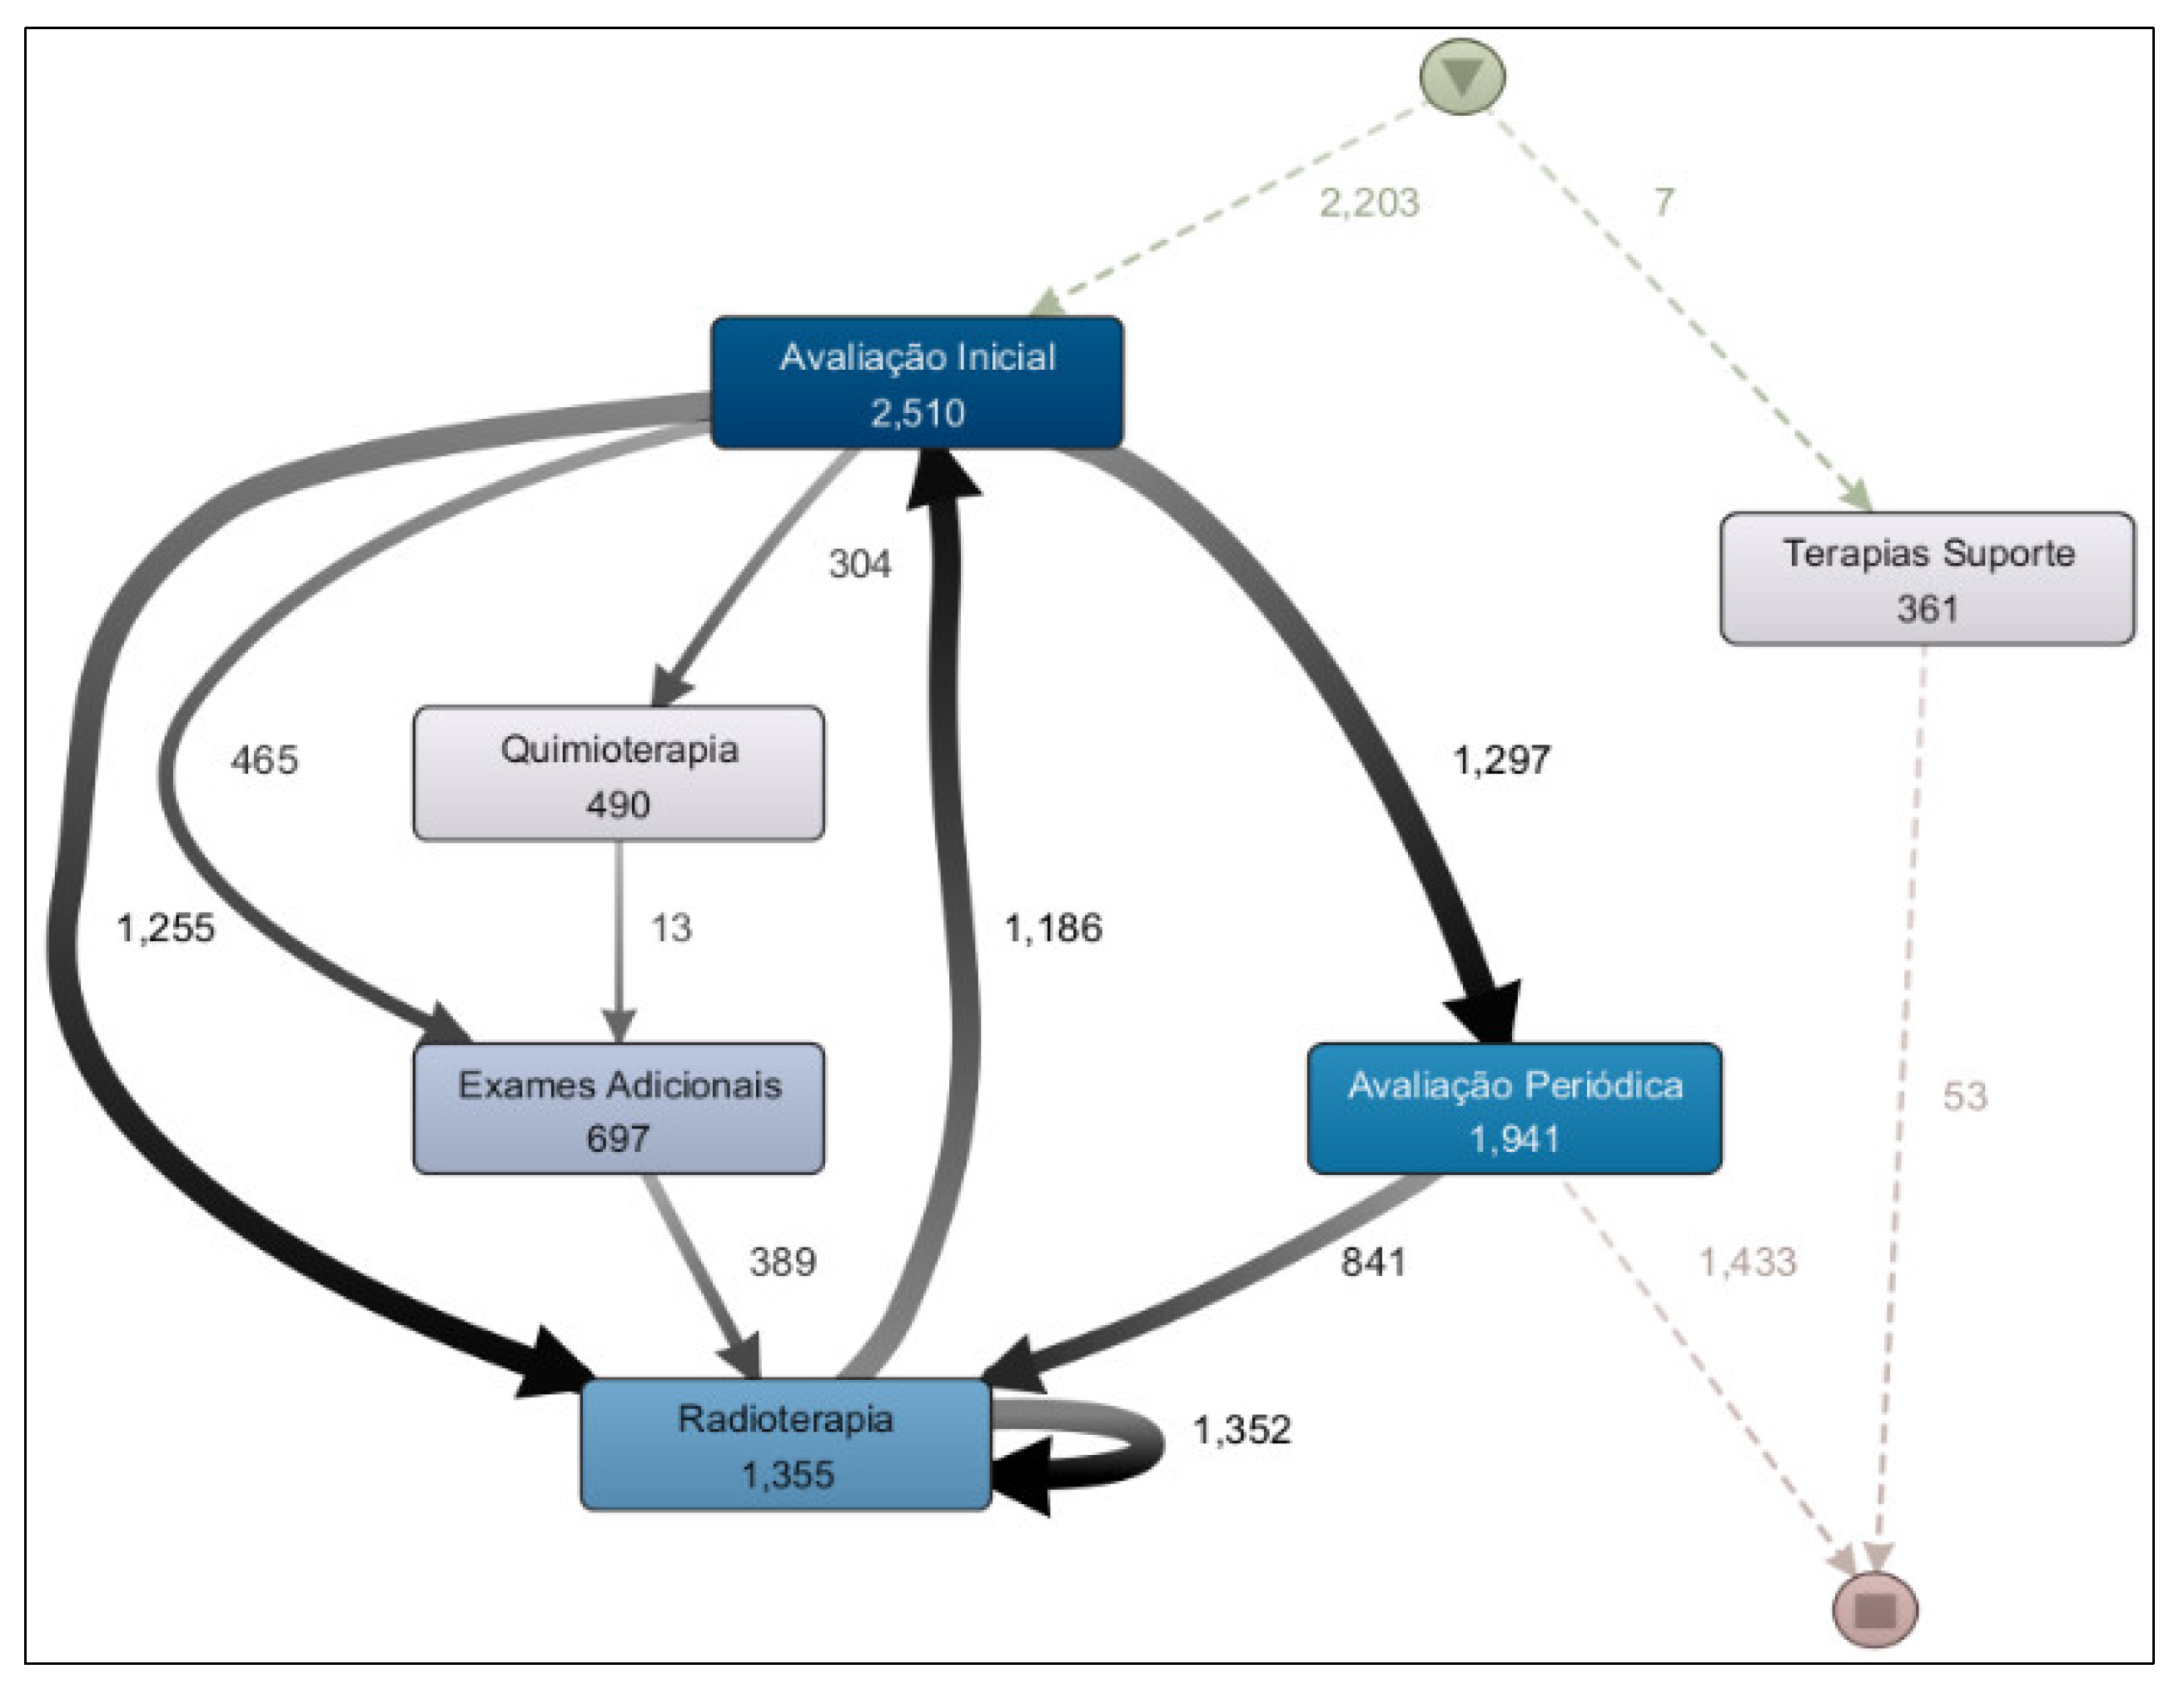
Figure 8.
Treatment process model – prostate cancer.
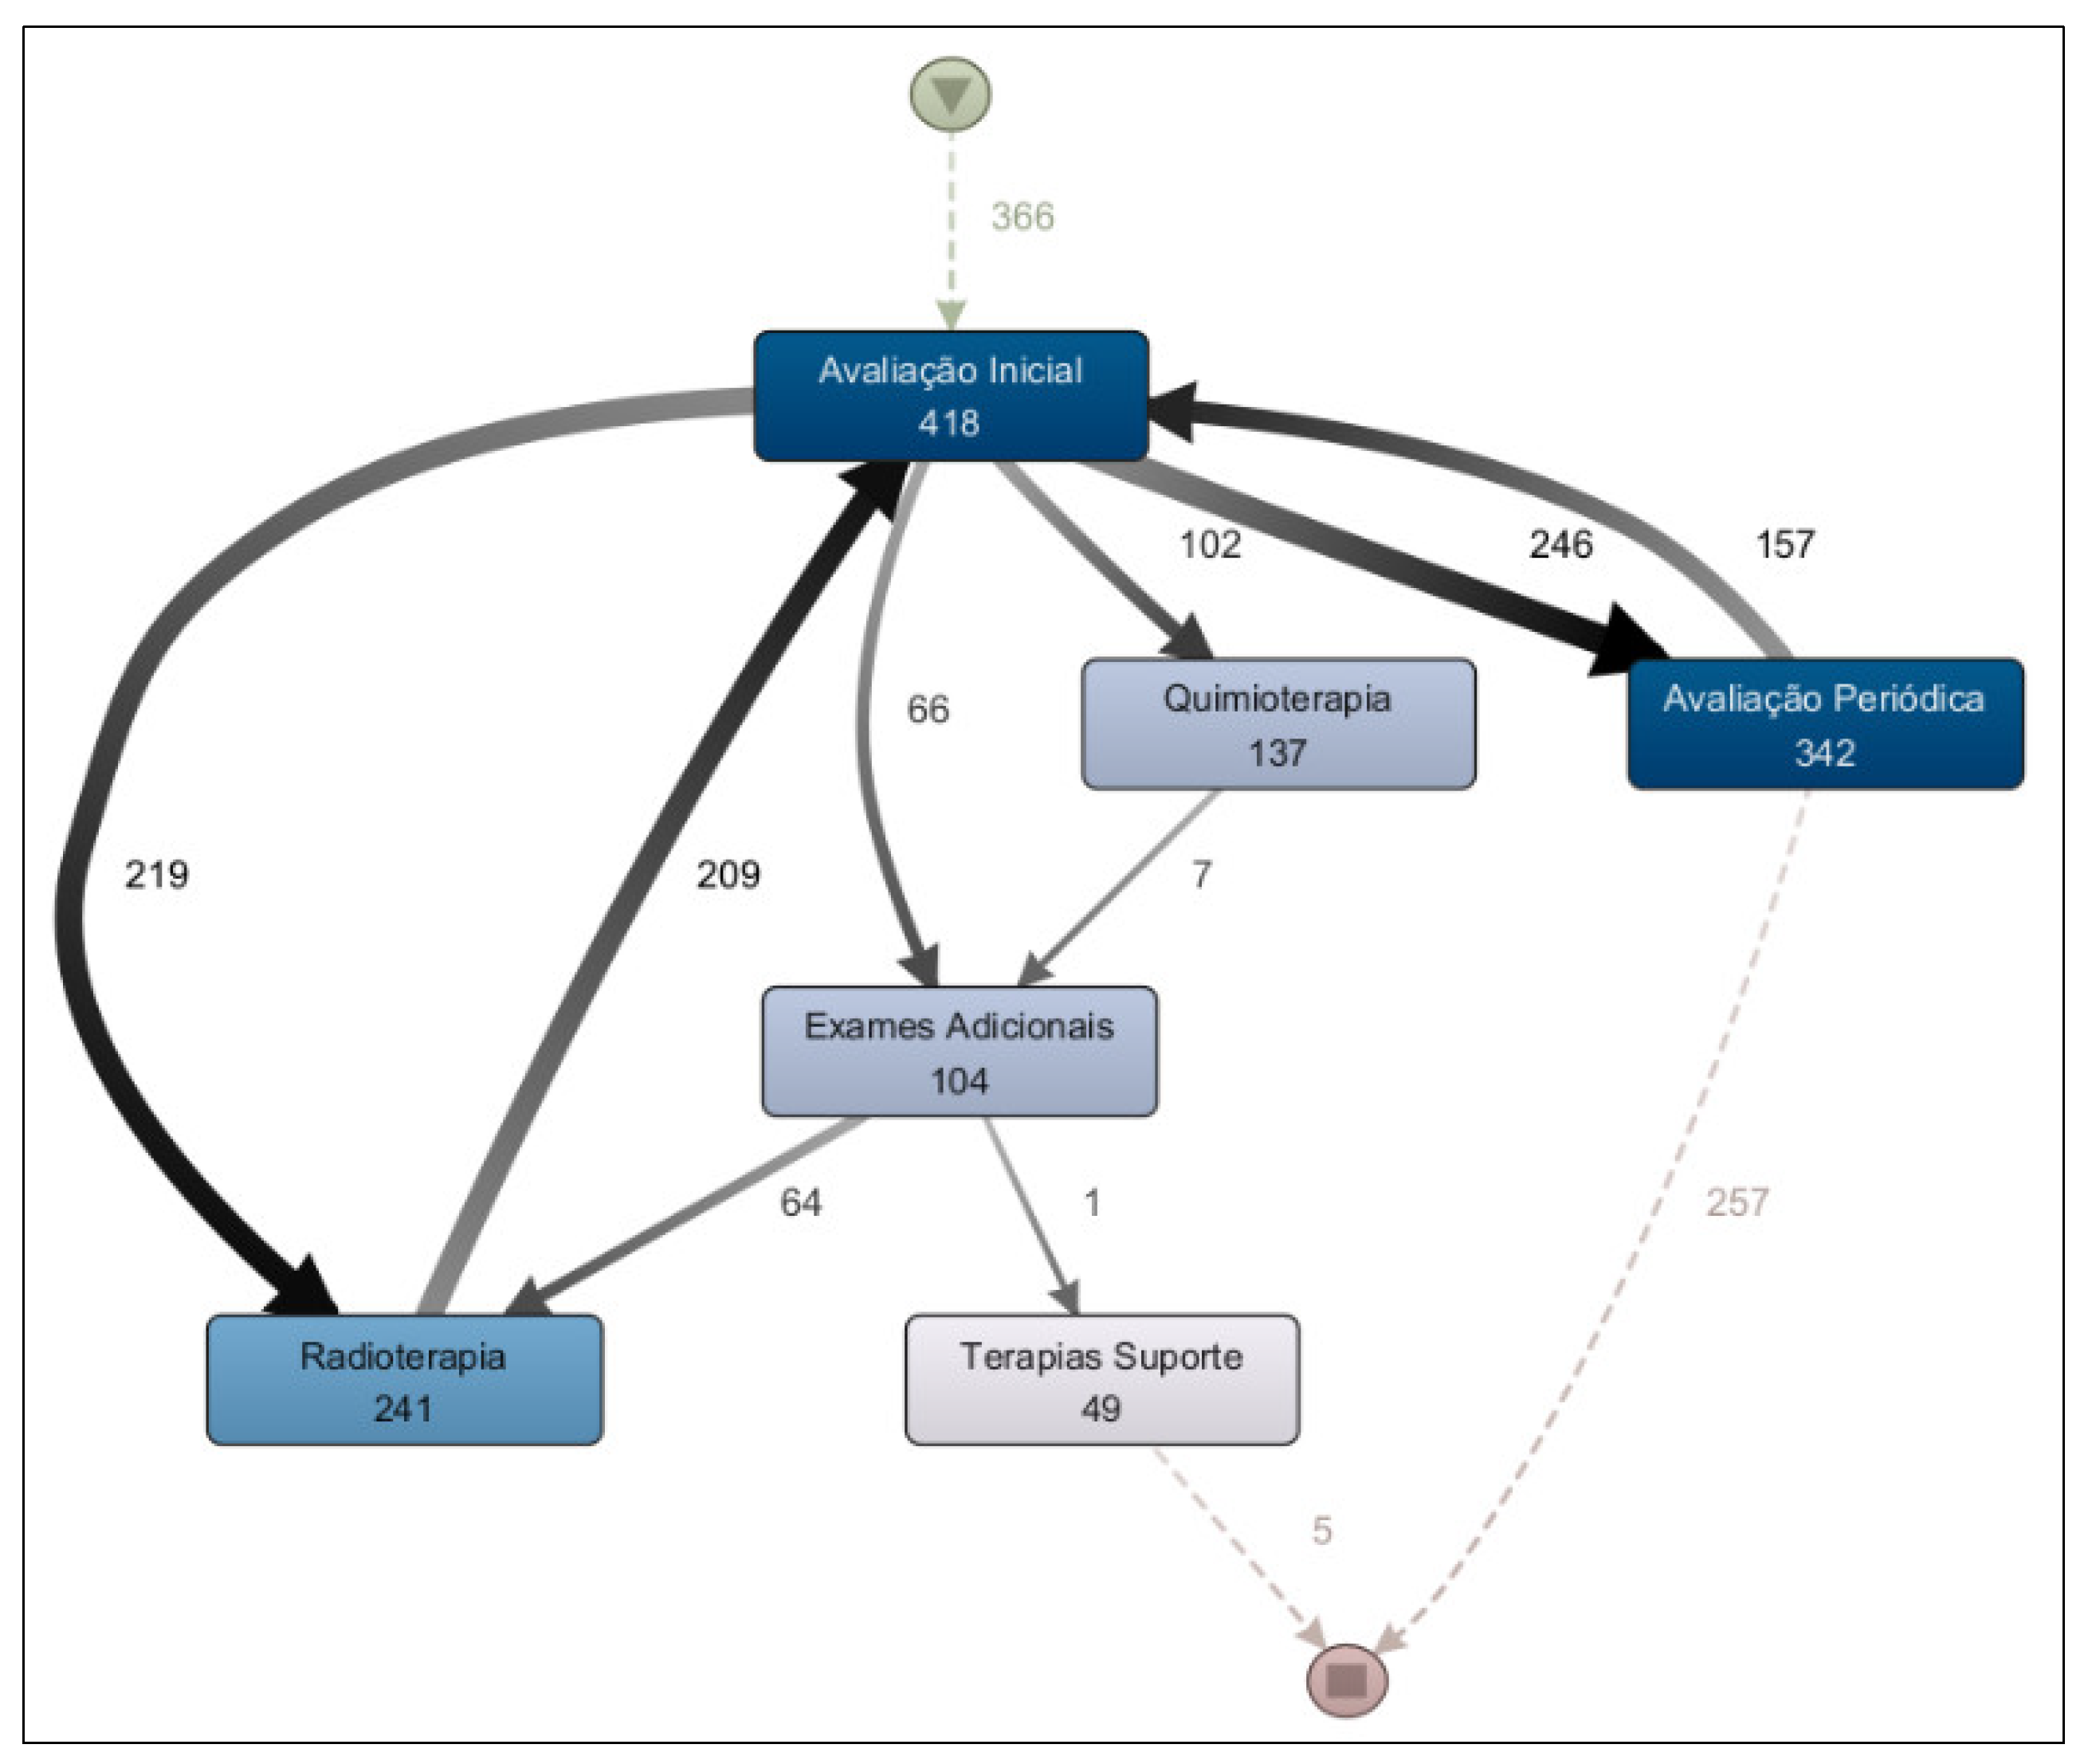
Figure 9.
Treatment process model – digestive organ cancer.
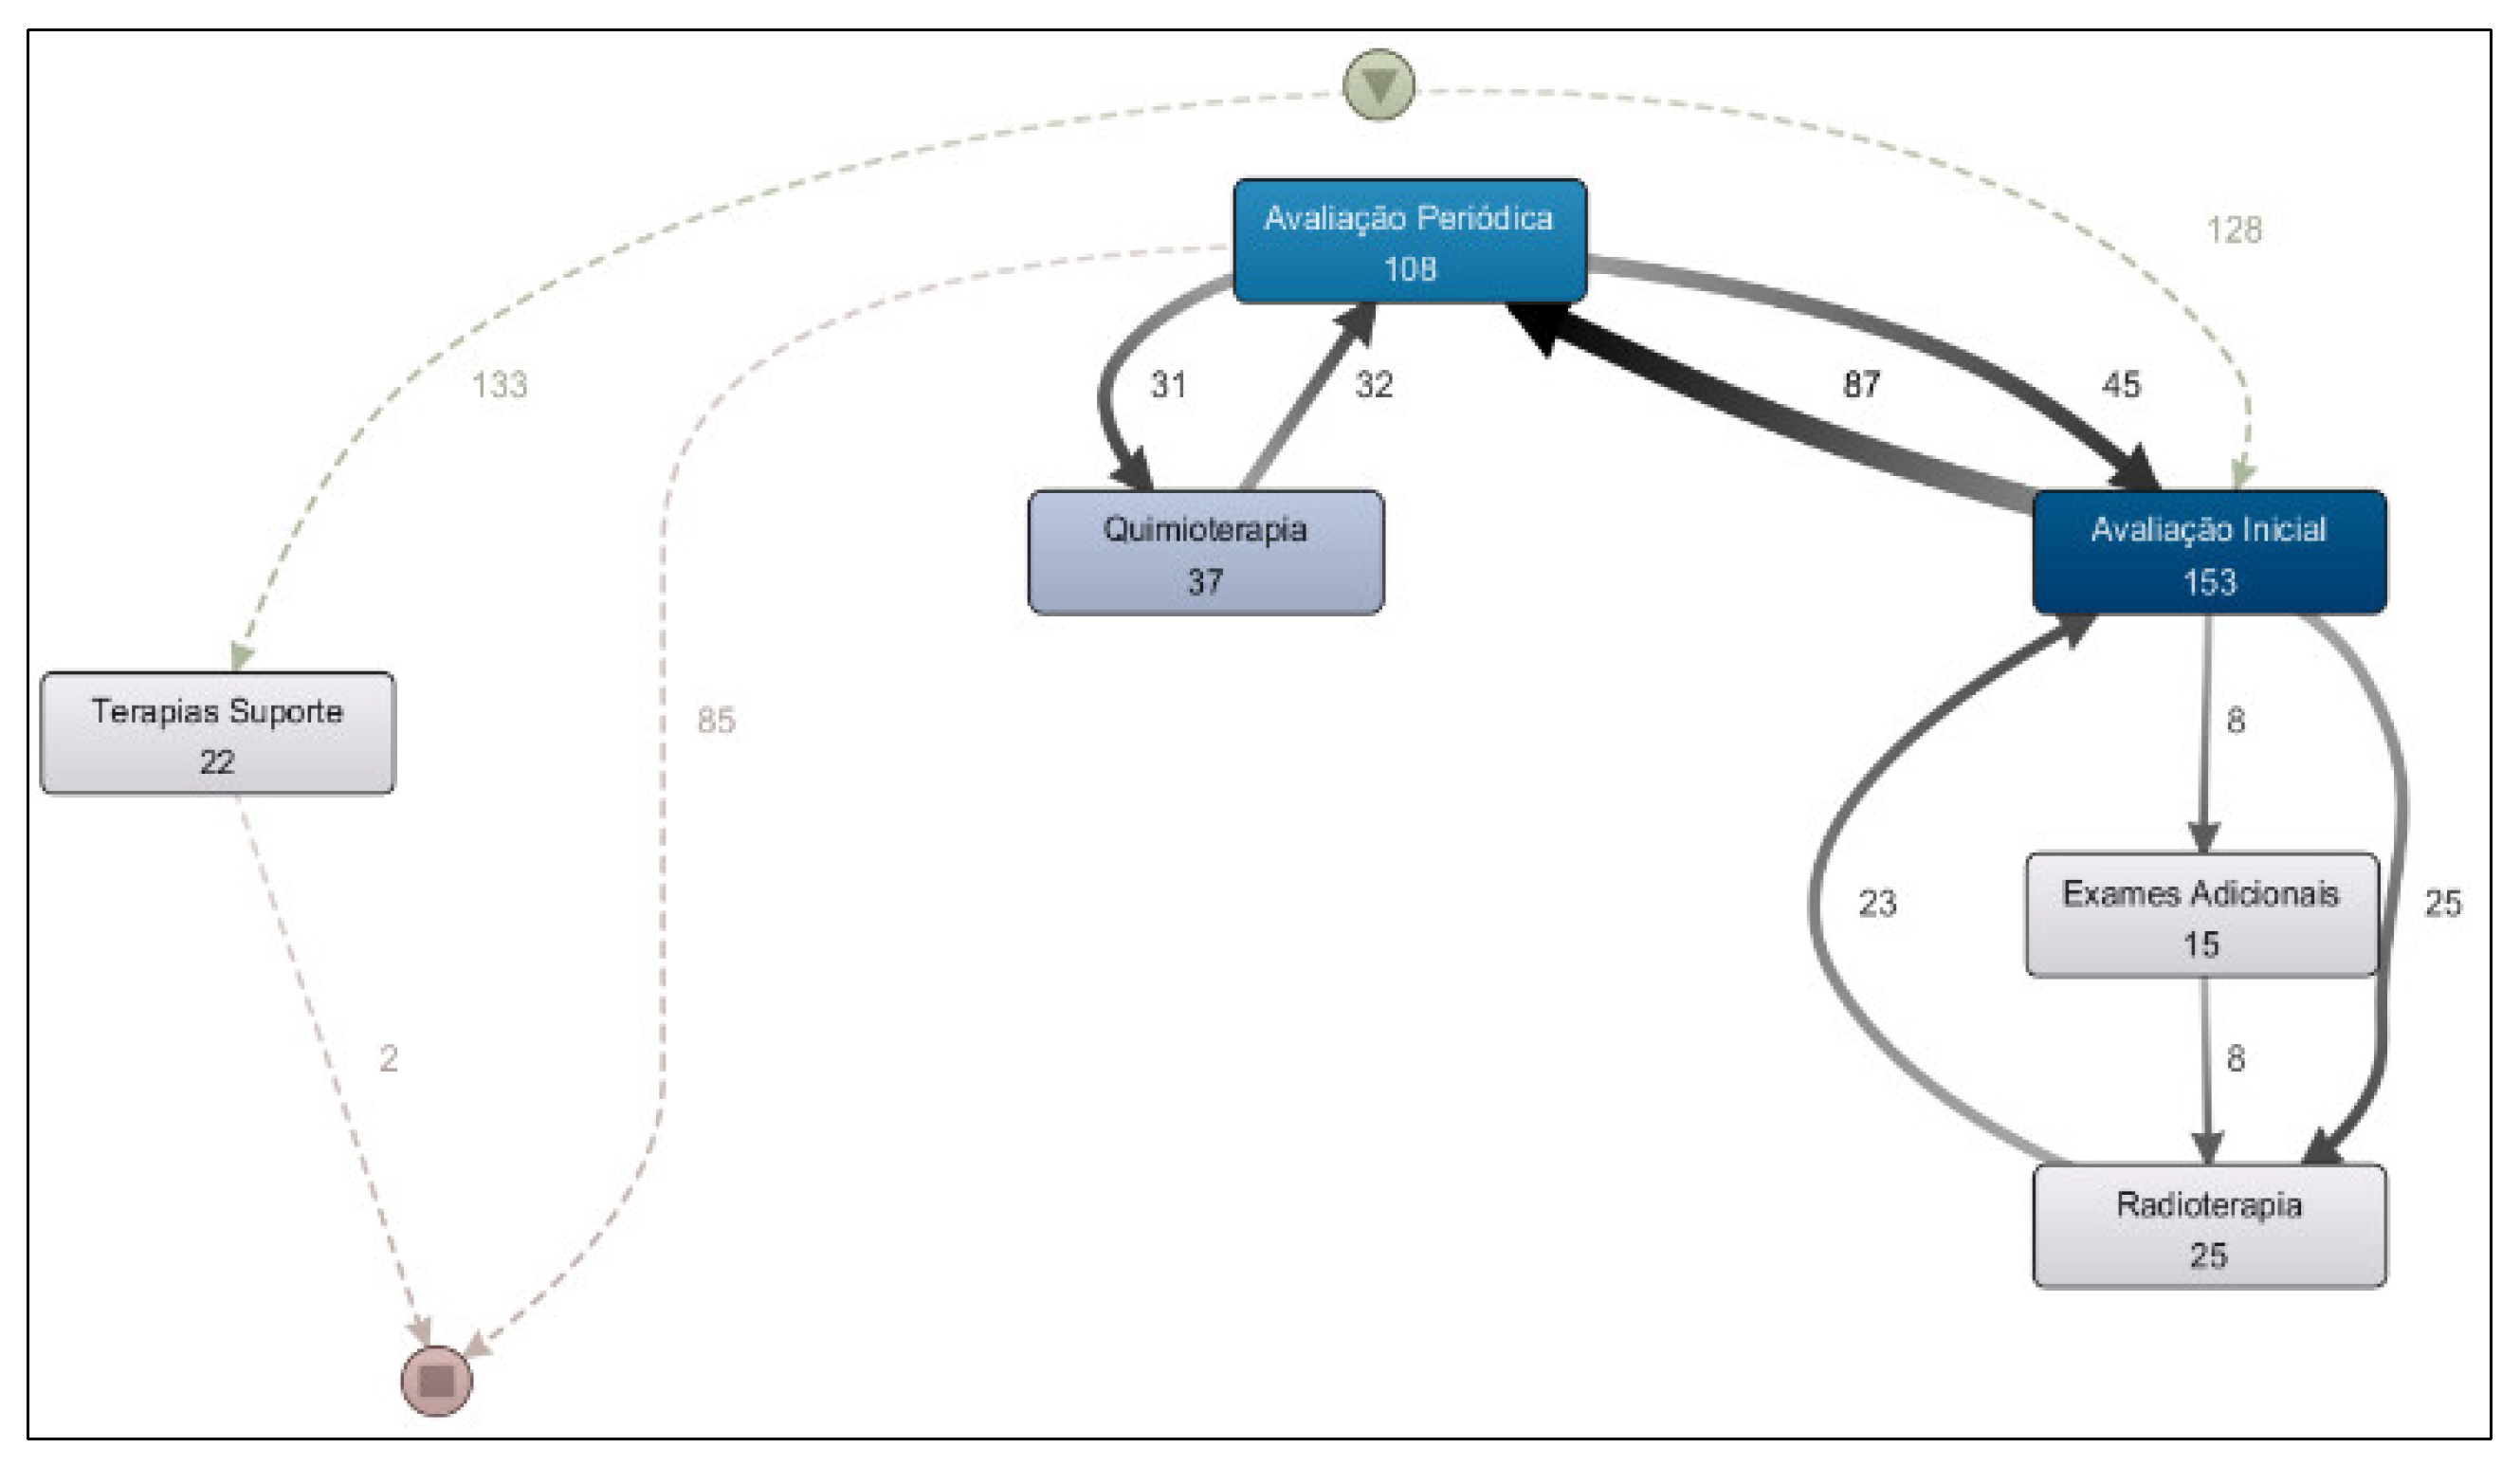
Figure 10.
Department workflow monitoring.
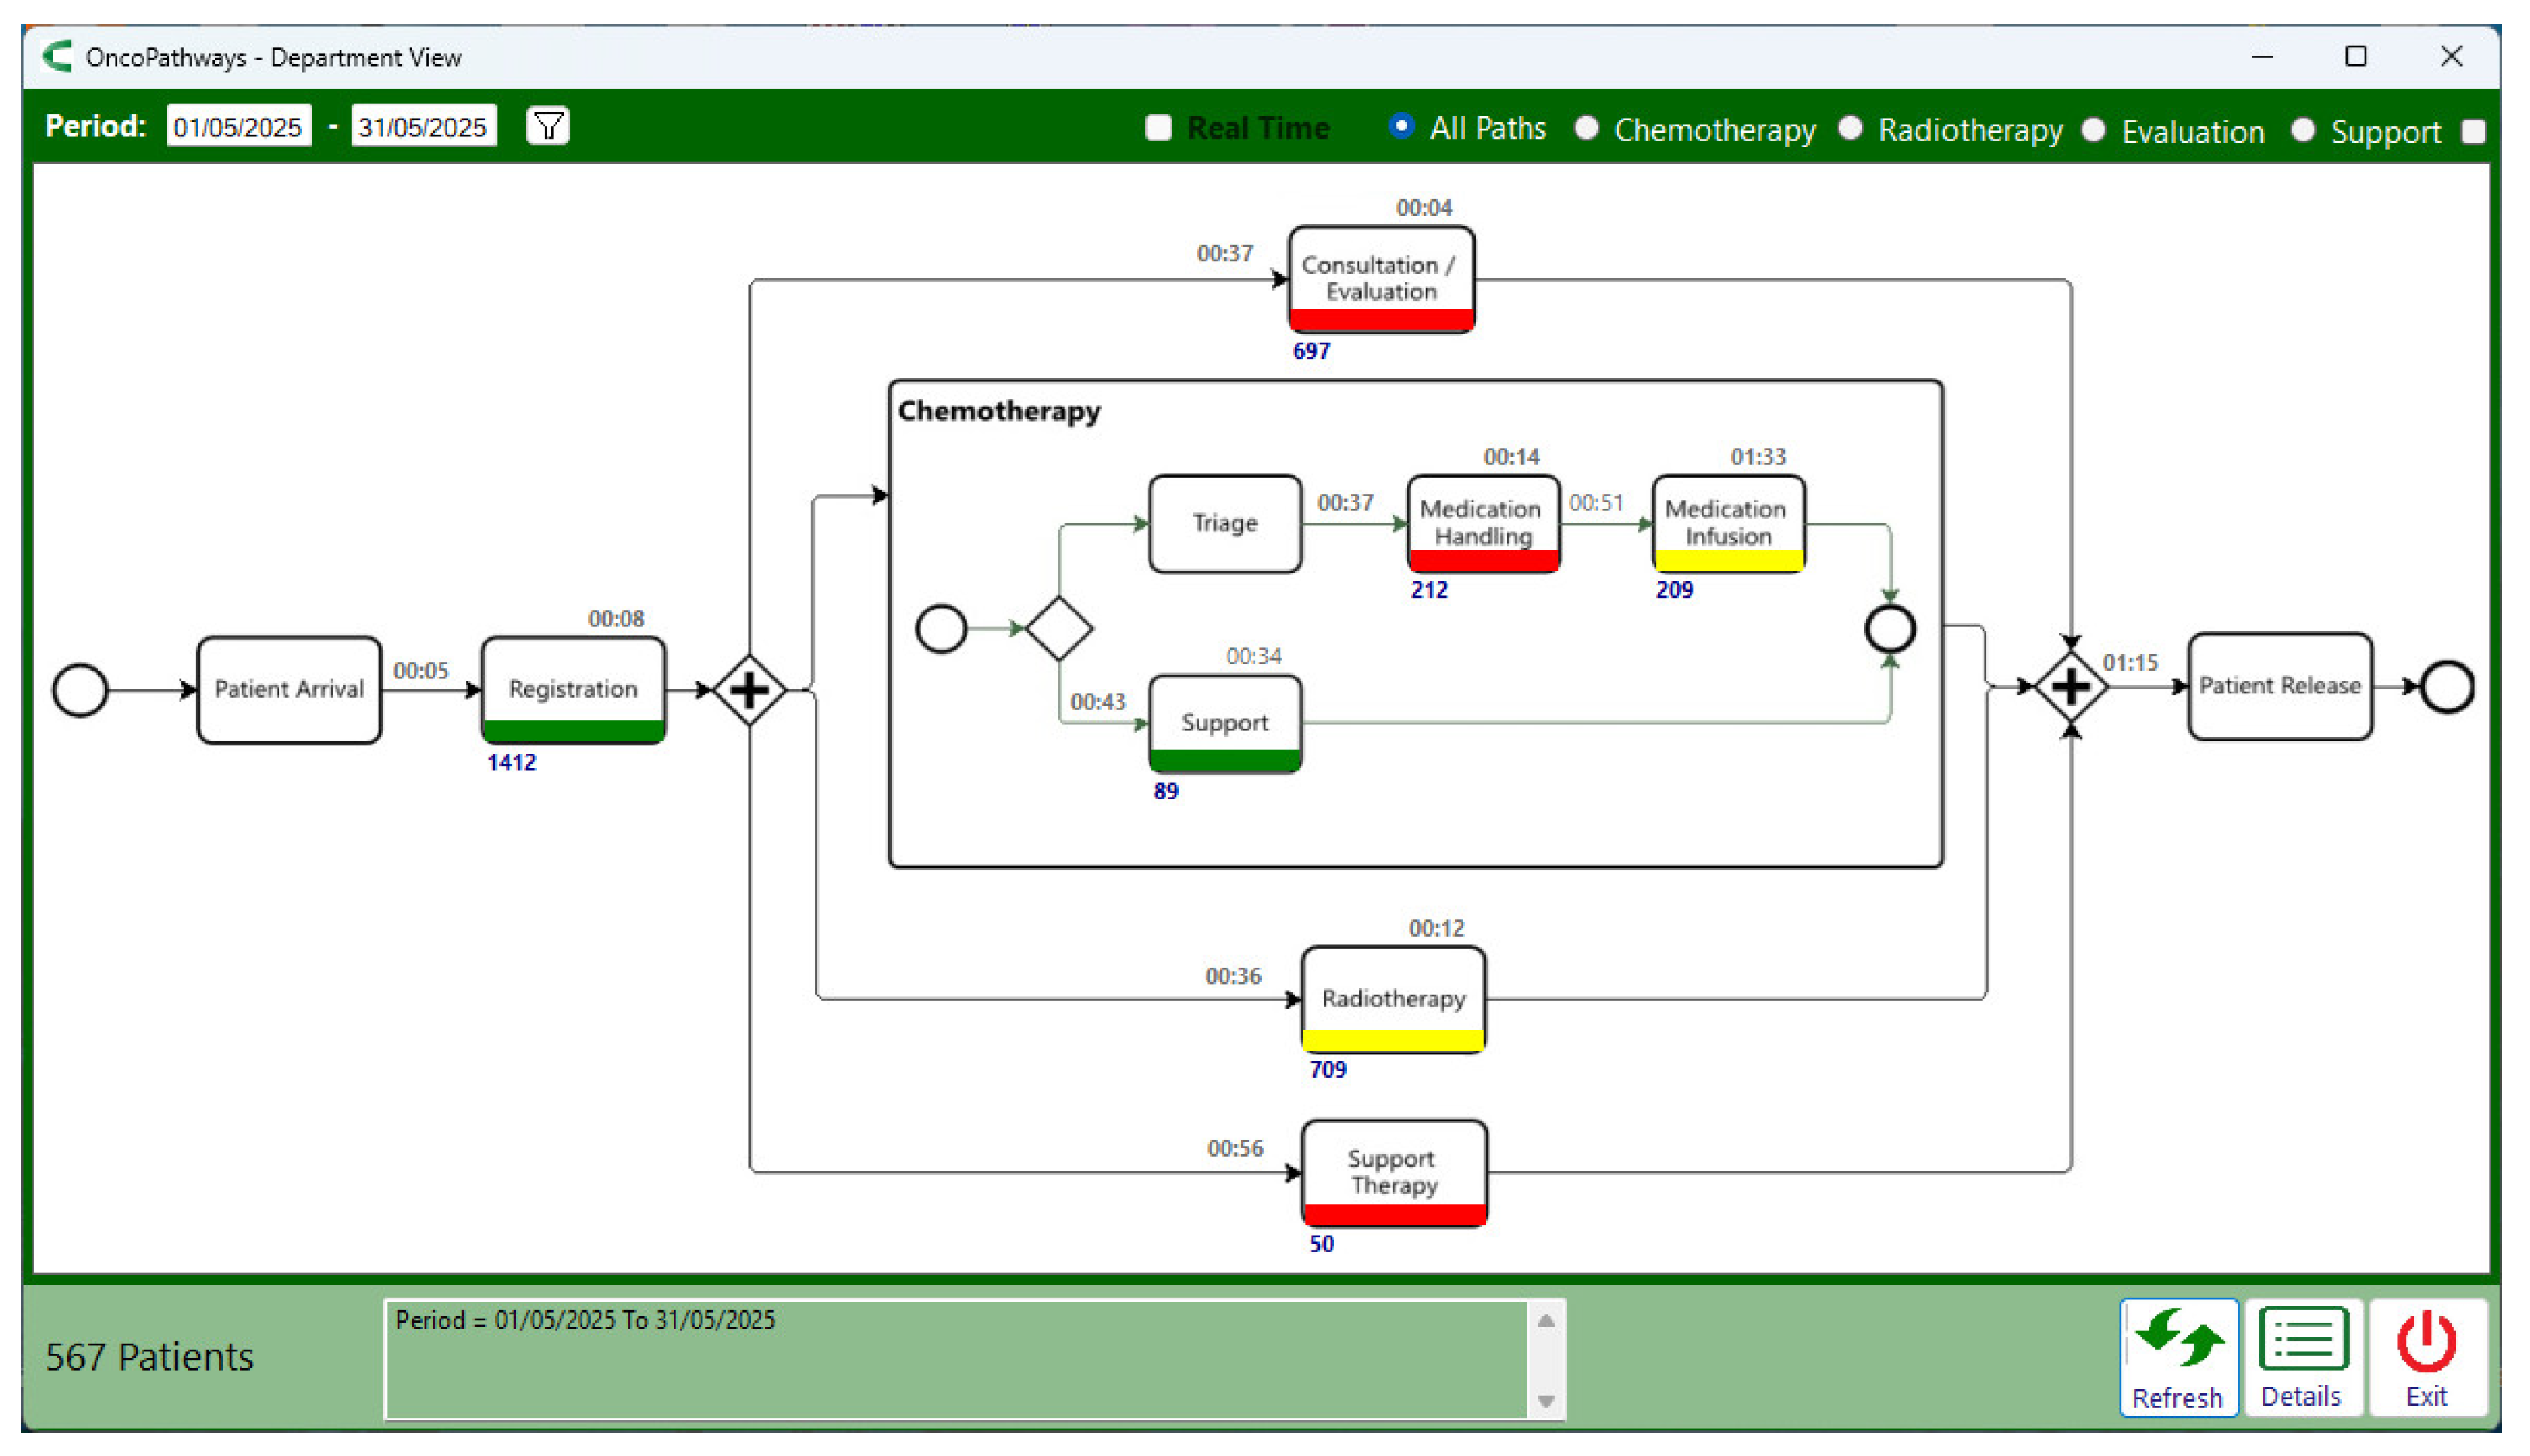
Figure 11.
Treatment workflow monitoring.
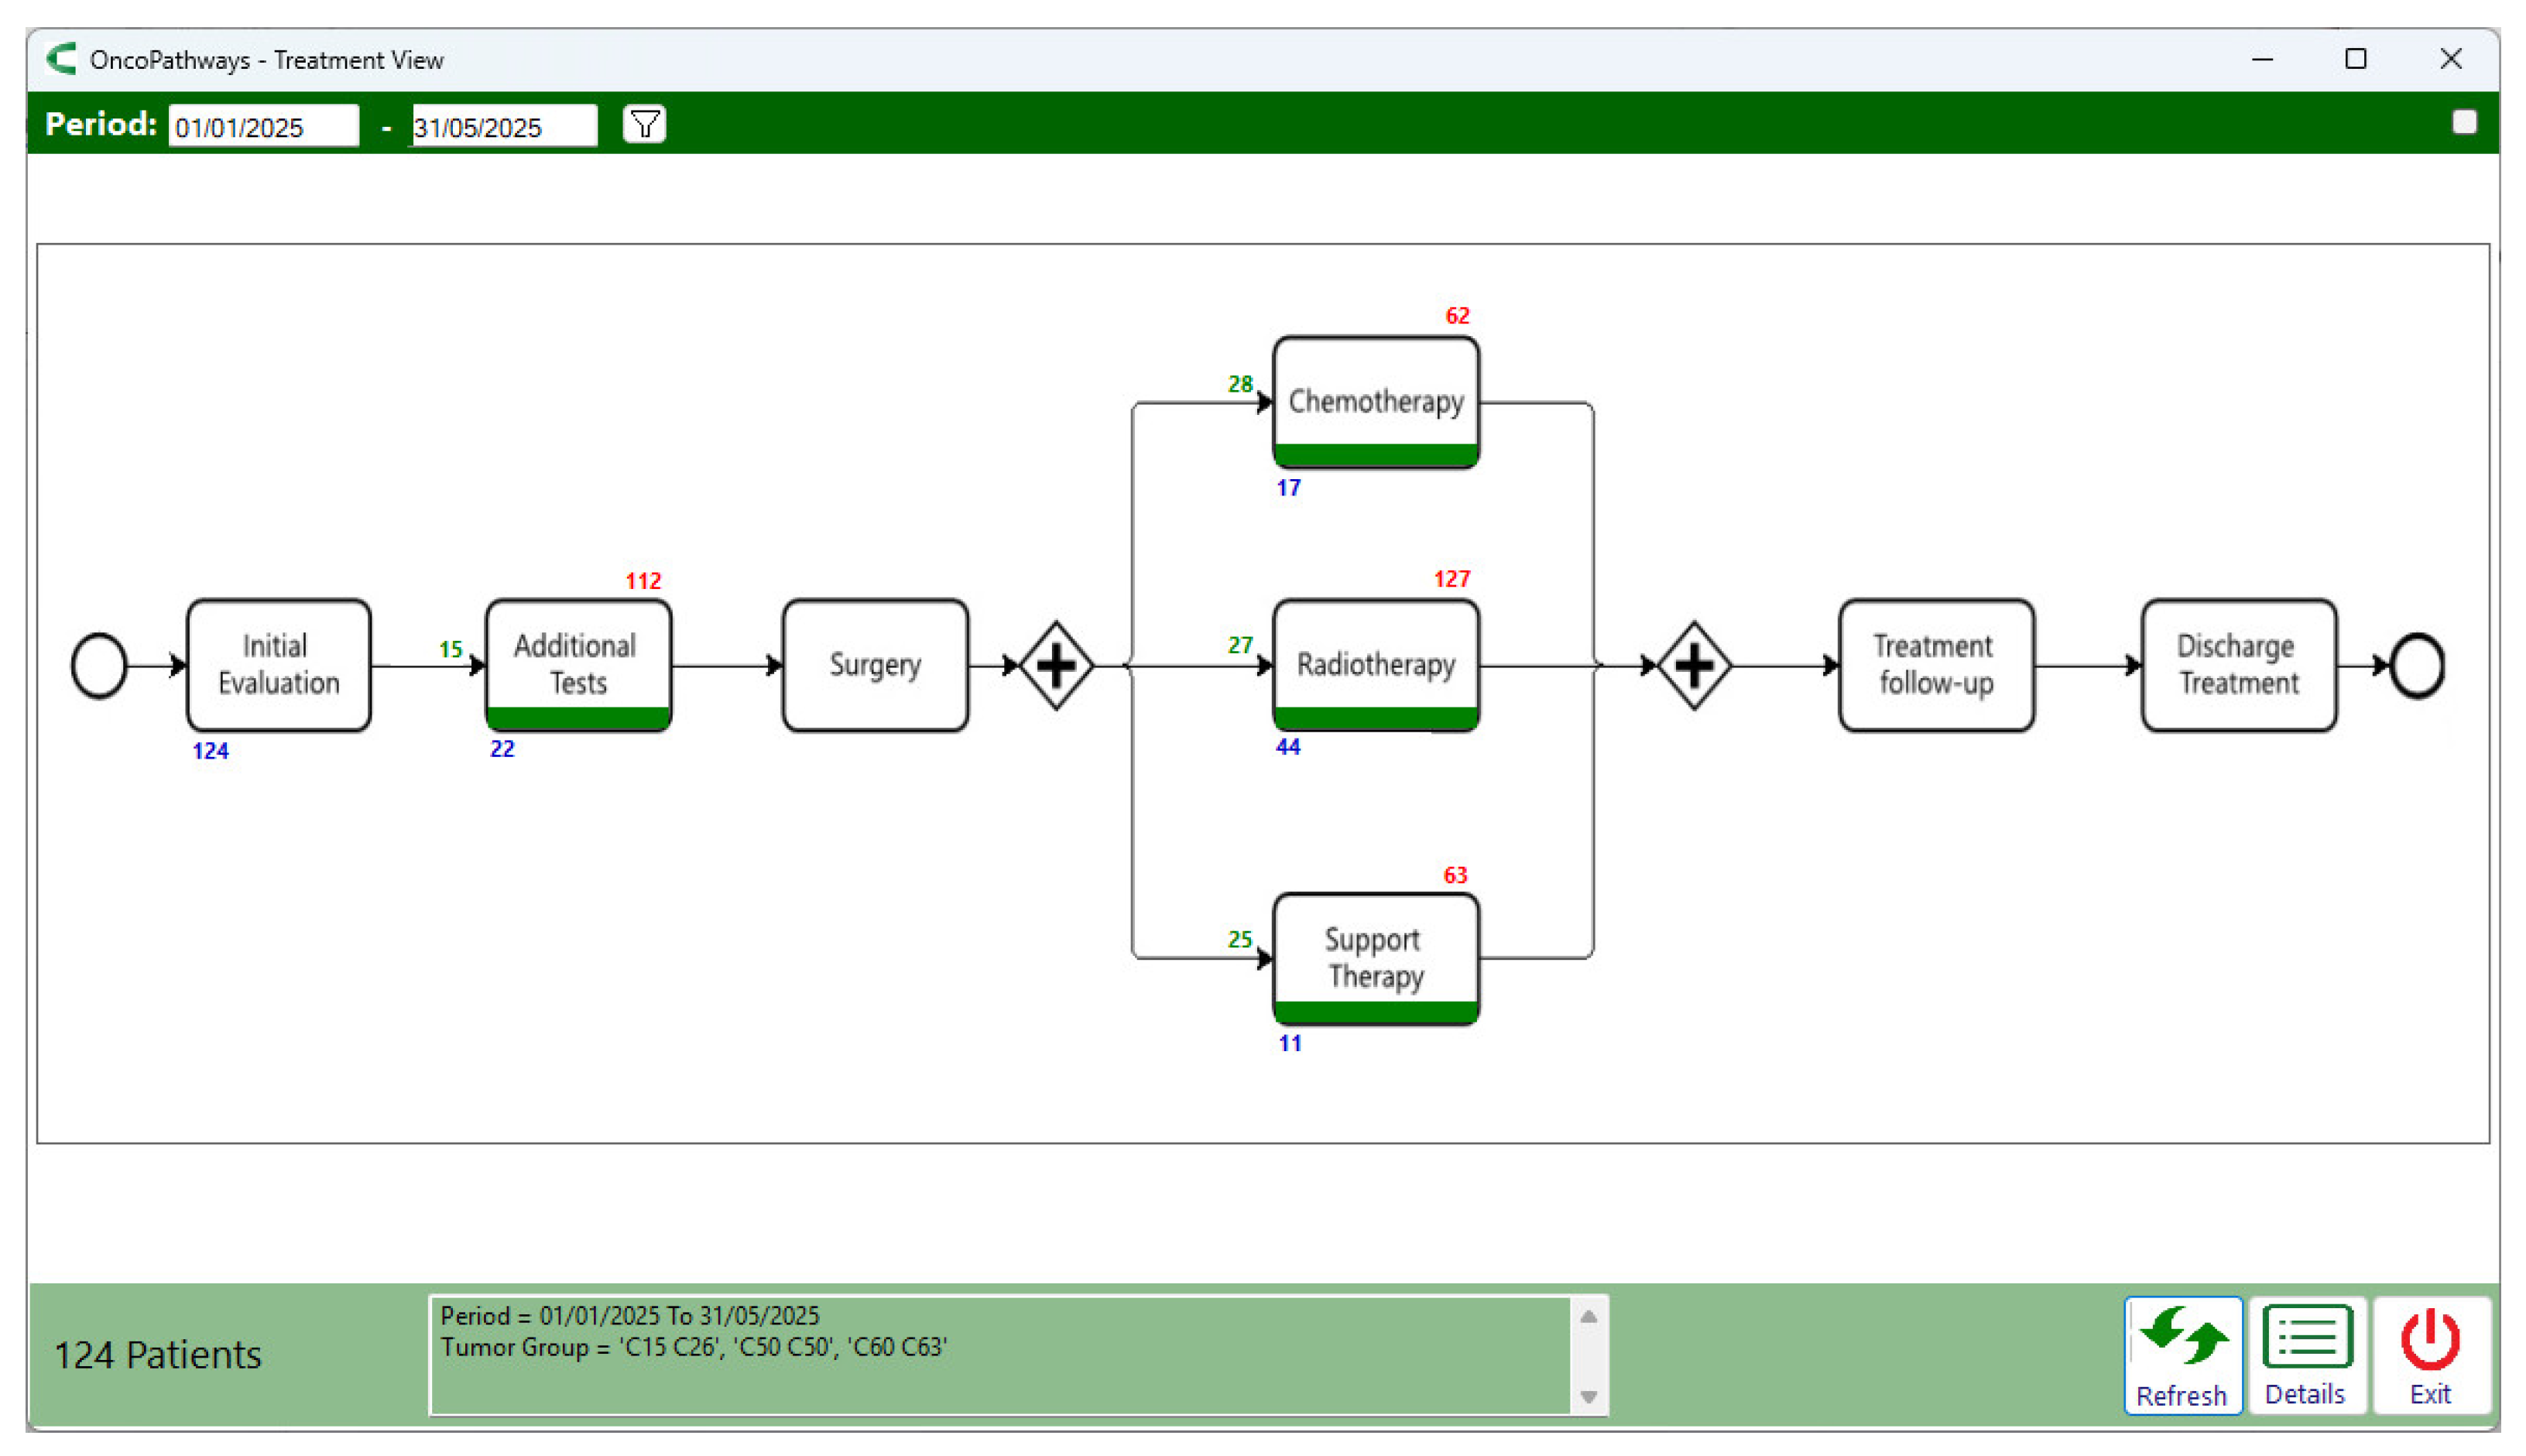
Figure 12.
Treatment workflow monitoring - Details.
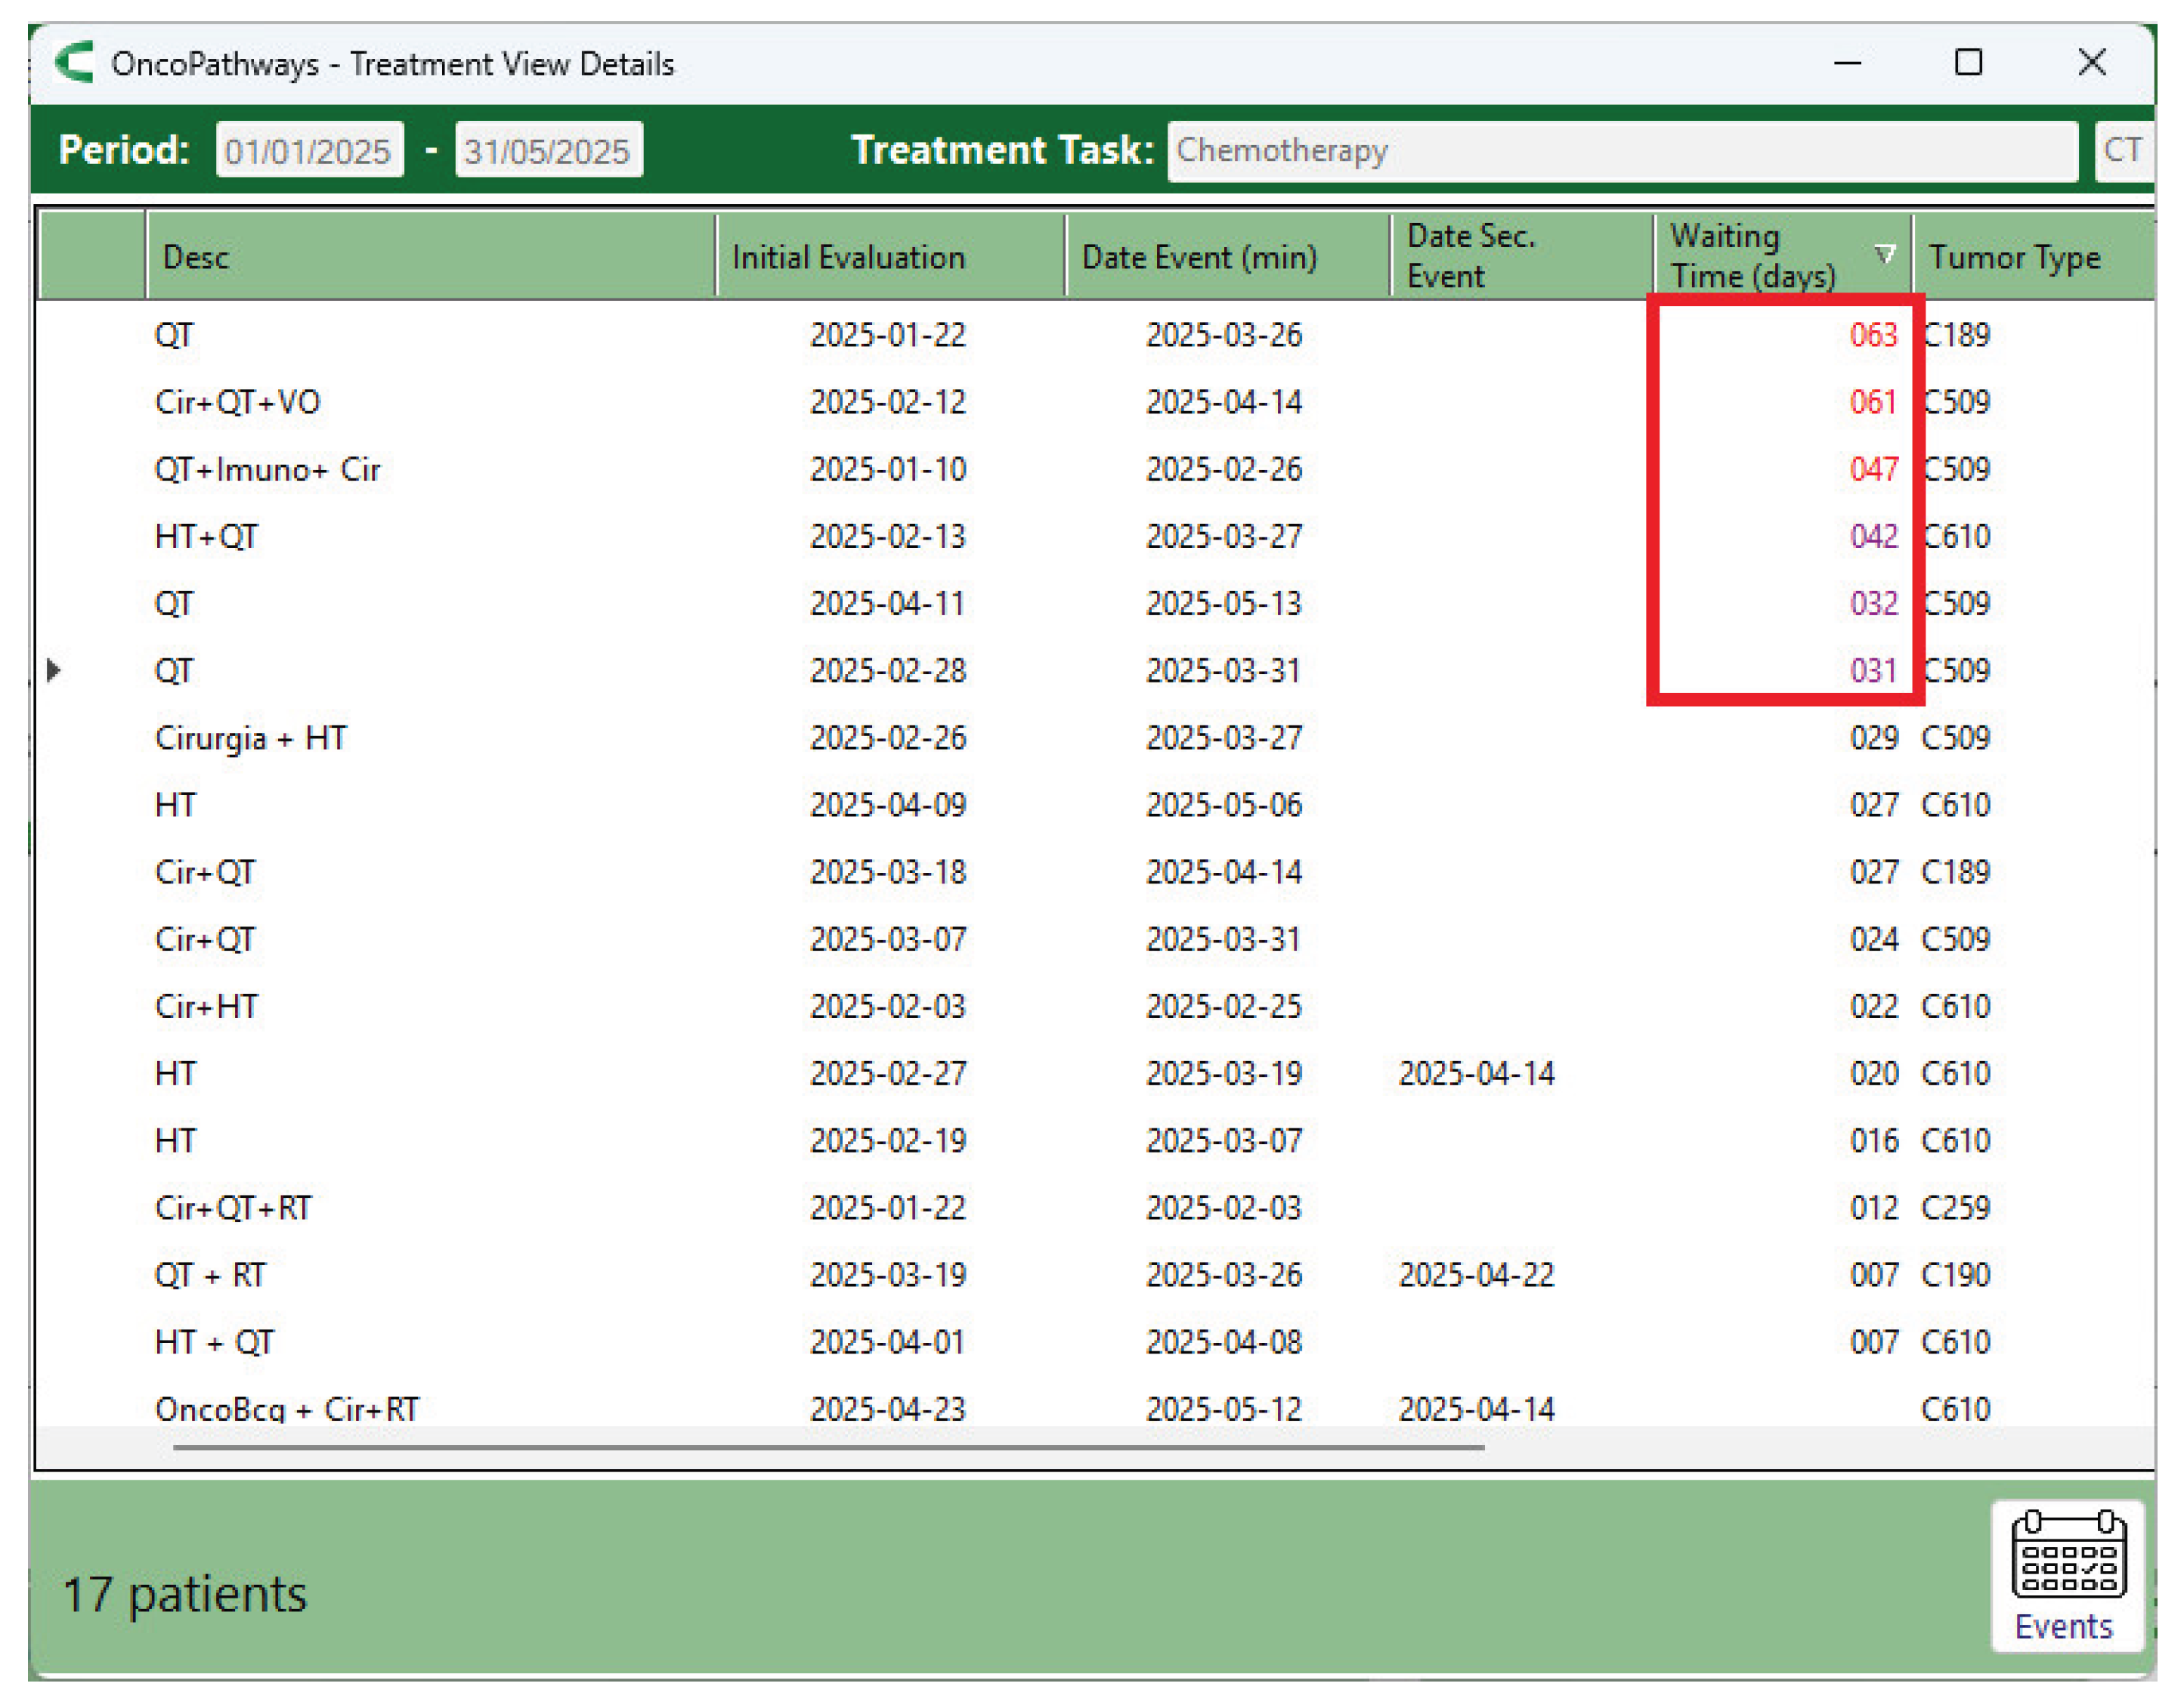

Table 1.
Target time for department workflow.
| Department task | Task time (min) | Waiting time (min) | ||
|---|---|---|---|---|
| Target | Limit | Target | Limit | |
| Registration | 10 | 15 | 10 | 15 |
| Consultation/Evaluation | 30 | 45 | 20 | 30 |
| Medication Handling | 9 | 10 | 45 | 30 |
| Medication Infusion | 330 | 360 | 45 | 60 |
| Chemo - Support | 45 | 60 | 45 | 60 |
| Radiotherapy | 30 | 60 | 30 | 60 |
| Support Therapy | 30 | 60 | 30 | 60 |
Table 2.
Target time for treatment workflow.
| Treatment stage | Task time (days) | |
|---|---|---|
| Target | Limit | |
| Initial Evaluation | 30 | 45 |
| Additional Tests | 30 | 45 |
| Chemotherapy | 30 | 45 |
| Radiotherapy | 30 | 45 |
| Support Therapy | 30 | 45 |
| Treatment Follow-up | -- | -- |
Table 3.
Problems and suggestions for process improvement.
| Problem | Cause | Improvement |
|---|---|---|
| More than once check-in at reception desk | Care activities take place in different physical locations | Improve the EHR scheduling algorithm to optimize the patient flow within the clinic |
| No check-in at reception desk | Patients called for an appointment before registering at the reception desk | Include a constraint in the EHR to forbid the start of a care task without registration at the reception desk or without entering the end time of the previous appointment |
| Inaccuracy in the record of start and end times | EHR system does not require this information to be entered at the exact moment the events occur | Require this information as mandatory, entering it automatically using the system timestamp with a single click by the care professional |
| Inadequacy in the definition of the task’s time limit | Complex formulas require additional preparation time | Allow multiple time limits to be set for each activity according to its different classes |
| Delays in starting treatment | Delays or denials of procedures authorization by the healthcare insurance | Send advance alerts to patient navigators to inform them of pending approval cases Develop a predictive model to estimate the likelihood of delays and/or denials for procedures authorization |
Disclaimer/Publisher’s Note: The statements, opinions and data contained in all publications are solely those of the individual author(s) and contributor(s) and not of MDPI and/or the editor(s). MDPI and/or the editor(s) disclaim responsibility for any injury to people or property resulting from any ideas, methods, instructions or products referred to in the content. |
© 2025 by the authors. Licensee MDPI, Basel, Switzerland. This article is an open access article distributed under the terms and conditions of the Creative Commons Attribution (CC BY) license (http://creativecommons.org/licenses/by/4.0/).
Copyright: This open access article is published under a Creative Commons CC BY 4.0 license, which permit the free download, distribution, and reuse, provided that the author and preprint are cited in any reuse.


