
Submitted:
22 September 2025
Posted:
24 September 2025
You are already at the latest version
Abstract
Autism spectrum disorder (ASD) and Alzheimer's disease (AD) are neurodevelop-mental and neurodegenerative disorders respectively. While exome sequencing is rou-tinely employed during the early stages of ASD diagnosis, it rarely influences thera-peutic strategies. To address this gap we have reconstructed and analyzed the gene networks linking autism spectrum disorders, Alzheimer's disease, and mTOR signal-ing. In addition, we performed a phylostratigraphic analysis that reveals similarities and differences in the evolution of both ASD and Alzheimer's disease predisposition genes. We have shown that almost half of the genes predisposing to autism and two-fifths of the genes predisposing to Alzheimer's disease are directly related to the mTOR signaling pathway. Analysis of Phylostratigraphic Age Index (PAI) values dis-tributions revealed a significant enrichment of evolutionarily ancient genes in both ASD- and AD-related gene sets. When studying the distribution of ASD predisposition genes by Divergence Index (DI) values, a significant enrichment with genes having ex-tremely low DI = 0 was found. Such low DI values indicate that most likely these genes are under stabilizing selection. Using ANDVisio tool, both pharmacological and natu-ral mTOR regulators with potential for ASD treatment were selected such as propofol, dexamethasone, celecoxib, statins, berberine, resveratrol, quercetin, myricetin, mio-inositol and several amino acids.
Keywords:
genetics
; bioinformatics
; autism spectrum disorder (ASD)
; Alzheimer's disease (AD)
; mTOR signaling pathway
; Phylostratigraphic Age Index (PAI)
; Divergence Index (DI)
; drug repurposing
1. Introduction
Autism spectrum disorder (ASD) and Alzheimer's disease (AD) are neurological disorders affecting young and elderly people, respectively. ASD is mainly found in children aged 18 months to 3 years [1]. The diagnostic criteria of the disorder: 1. Impaired communication, including verbal communication, and socialization, 2. Stereotypical interests, speech and behavior, often accompanied by hypersensitivity. Alzheimer's disease (AD) is characterized by cognitive impairment and memory loss in the elderly. An estimated 5.8 million U.S. citizens aged 65 and older are struggling with the disease [2,3]. Both ASD and AD are often accompanied by reduced cognitive functions, language impairment, depression, irritability, and aggression [4].
Immune system abnormalities and autoimmunity have been regularly reported in both ASD and AD patients. The hypothesis that a certain part of the autistic spectrum may be an autoimmune disorder has been discussed repeatedly [5,6,7]. Recently, this idea has been reinforced by the discovery of pronounced perivascular lymphocytic infiltrates and related astrocytic blebs within Virchow–Robin spaces and subarachnoid cerebrospinal fluid (CSF) in ~65% of ASD patients. The revealed pathology indicates that dysregulated cellular immunity damages astrocytes in foci along the CSF–brain barrier in ASD [6,8].
At the same time, Alzheimer's disease may also be considered as an autoimmune disease of innate immunity [9]. In response to various initiating stimuli (for example, infection, trauma, ischemia), Aß is released as an early response immunopeptide, triggering a cascade of innate immunity in which Aß exhibits both immunomodulatory and antimicrobial properties (regardless of whether bacteria are present or not), which leads to an attack of its own neurons. The similar electronegative topology of the membrane surfaces of neurons and bacteria makes them equally susceptible to membrane penetration by antimicrobial peptides such as Aß. After the attack, the products of neuronal necrotic decay diffuse into neighboring neurons, causing further release of Aß, which leads to a chronic self-reproducing autoimmune cycle [10].
Neuroinflammation, immune and mitochondrial dysfunction, and the deregulated mTOR signaling pathway are often targets for mechanism-based therapy of ASD [11]. In fact, gene mutations and/or dysregulation of the mTOR signaling pathway may be responsible for both immune disorders and mitochondrial dysfunction. It has been shown [12,13] that activation of the mTOR signaling pathway is a positive regulator of CD4+ effector T cell differentiation and a negative regulator of Treg regulatory T cell differentiation, and that mTOR hyperactivation is associated with the pathogenesis of a number of autoimmune diseases.
At the same time, mitochondrial dysfunction is increasingly being considered as one of the causes of the neurodevelopmental disorders, including in ASD [14]. In model animals with tuberous sclerosis (Tsc2+/-), one of the variants of syndromic autism, it has been shown that the regulation of the mitochondrial life cycle through autophagy, or mitophagy, is critically impaired both in the axon and throughout the body. Treatment of Tsc2-deficient neurons and model animals with the mTOR inhibitor rapamycin restored the mitochondrial phenotype, including mass, transport, and mitophagy [15]. Thus, reducing the activity of the mTOR pathway has become the main pharmacological way to activate autophagy [16].
The discovery that powerful mTOR inhibitor rapamycin increases the lifespan of mice and restores/slows down aging phenotypes has led to the assumption that rapamycin has "rejuvenating" properties. The main question is whether manipulation with anti-aging rapamycin’s properties can affect the onset and/or progression of Alzheimer's disease [17].
Since rapamycin is known to induce autophagy, and autophagy is the main pathway used by cells to destroy protein aggregates, the role of autophagy in reducing the number of plaques and tangles in the brains of AD model mice was investigated. It was shown that the induction of autophagy by rapamycin plays an important role in reducing the accumulation of plaques and tangles in the brains of AD model mice and possibly in improving memory [17,18].
To assess the genetic and pathogenic similarity between ASD and AD we have reconstructed and analyzed the gene networks linking autism spectrum disorders, Alzheimer's disease, autoimmunity, and the mTOR signaling pathway. Additionally, we performed a phylostratigraphic analysis that allows the time of gene origin to be determined by analyzing phylogenetic trees of organisms with orthologous genes. Such an analysis may reveal similarities and differences in the evolution of both ASD and Alzheimer's disease predisposition genes, as well as the genes of the mTOR signaling pathway. Besides investigating the time of gene origin, the level of genetic variability and the type of genetic selection for the gene sets of interest were studied. Based on the analysis, we have tried to explore approaches for applying the therapeutic solutions that have been obtained in a significant large number for AD to ASD.
2. Results
2.1. SFARI Gene Database and AD Genes Comparative Gene-Set and Pathway Analysis
Our analysis (Figure 1) showed that the sets of genes predisposing to ASD (from the SFARI database) and to Alzheimer's disease have 148 common genes, of which 75 are directly related to mTOR signaling pathway. In total, 49.4% (541 out of 1095) of the genes from the SFARI database and 39.0% (491 out of 1259) of the AD genes are associated with mTOR, which allows us to assume these diseases as mTORopathies. Specifically, we showed that both ASD (from the SFARI database) and AD predisposing genes could be attributed to one of three groups: 1. mTOR signaling pathway genes, 2. mTOR-modulated genes, 3. FMRP target genes.
The FMRP, a negative regulator of translation initiation, is one of the key components of the local translation system. Since FMRP is the target of the S6K1 kinase [19], which is an element of the mTOR pathway, the translation regulated by FMRP is also always dependent on mTOR. The complete lists of all analyzed gene sets are given in Supplementary Table S1.
2.2. Analysis of Evolutionary Characteristics of Gene Sets
2.2.1. Phylostratigraphic Age of Genes (PAI-Based Analysis)
We have analyzed the distribution of PAI values for all human protein-coding genes (the allCDS_19478 set) as a control group compared to genes implicated in autism susceptibility from SFARI database and Alzheimer's disease predisposition genes (Figure 2a, b). In addition, we have compared neurodevelopmental disorders predisposition genes as a control group to autism predisposition genes of the largest cohort of autistic patients [20] (Figure 2c).
We have found that the PAI values are unevenly distributed (Figure 2a,b). 28.6 % of all control allCDS_19478 gene set had a PAI equal to 3 (Metazoa, multicellular, eukaryotic organisms in the biological kingdom Animalia), and the proportions of genes that had PAI values equal to 1 (cellular organisms), 7 (the stage of euteleostomi divergence), and 9 (the stage of eutheria, also called Pan-Placentalia, divergence) were 14.3 %, 6.3 %, and 3.0 % respectively. When we examined the distribution of PAI values for a set of autism predisposition genes from SFARI Gene database, we found that 40.6 % of SFARI genes had a PAI equal to 3 (Metazoa), 7.9 % equal to 1 (cellular organisms), 2.6 % equal to 7 (euteleostomi), and 0.7 % equal to 9 (eutherian). All these numbers are significantly different (p < 0.001) from the expected numbers, calculated based on the distribution obtained for the allCDS_19478 gene set (Figure 2a). In contrast, PAI values distribution for Alzheimer's disease predisposition genes was greatly different from control allCDS_19478 gene set only for a PAI equal to 3 (Metazoa) for p-value < 0.001. Thus, 37.9 % of Alzheimer's disease predisposition genes from the ADVP database had a PAI equal to 3 (Figure 2b).
Next, we compared the distribution of PAI values for 185 autism predisposition genes and 664 neurodevelopmental disorders predisposition genes (NDD) from the largest cohort of autistic patients [20]. Surprisingly, we found no significant differences between these sets of genes in the distributions of PAI values (see Figure 2c).
2.2.2. Evolutionary Variability of Genes (DI-Based Analysis)
The analysis of gene distribution from SFARI Gene database according to DI values (Figure 3a) showed that 54.5 % of genes had DI < 0.2, most genes (~98.6 %) had DI < 1, and only 13 out of 1095 genes had DI > 1, indicating that most of the genes are under stabilizing selection.
A comparison of gene distribution from SFARI Gene database by DI values with the distribution obtained for all genes encoding human proteins (allCDS_19478 set) showed that SFARI Gene database genes are characterized by an increased content of genes with extremely low DI values (Figure 3a). 54.5 % from SFARI Gene database had DI < 0.2 that significantly (p < 0.001) higher than the expected number (36.7 %) calculated using the distribution obtained for all human protein-coding genes (Figure 3a). This trend is even more significant for sets of autism and neurodevelopmental disorders predisposition genes obtained from the largest datasets [20]. 66.9 % ASD and 70.2 % NDD predisposition genes had DI < 0.2 and no one gene from these sets had DI > 1. By contrast, the distribution by DI values of Alzheimer's disease predisposition genes from the ADVP database [21] was only slightly different from all genes encoding human proteins allCDS_19478 set (Figure 3b).
We also compared average values of PAI and DI indices for the most meaningful sets of genes listed in the Materials and Methods section (Table 1). The data have shown significant differences in the average values of PAI and DI indices for all genes associated with ASD and NDD compared to all protein-coding human genes. These differences were more pronounced than those observed for Alzheimer's disease predisposition genes. The complete lists of evolutionary characteristics (both PAI and DI indices) for all analyzed gene sets are given in Supplementary Table S2.
2.3. Comparative Network Analysis of Genes Predisposing to Autism and Alzheimer's Disease with Genes of Autoimmune Diseases
We reconstructed a gene network based on sets of genes predisposing to Alzheimer's disease (gene sets 4 and 5) and genes associated with autoimmune diseases (gene set 9). An initial set of 4993 genes (808 genes of predisposition to AD, 3734 genes of autoimmune diseases and 451 genes belonging to both sets) was analyzed using stringApp for Cytoscape. In Cytoscape, all edges of the network were removed, except for those indicating experimentally established interactions with a confidence level of more than 0.9. As a result, a gene network consisting of 230 genes and 229 connections between them was obtained (Figure 4). The genes were assigned different colors according to the initial set in which they were included.
The products of this network’s most connected genes include ribosomal proteins (RPL6, RPL17) [25], transcription factors and coregulatory proteins (EED, TP53, ESR1, CREBBP, RBBP4, HDAC1) [26,27,28], ubiquitinating proteins (UBE2L3, UBE2I), signaling pathway proteins (TRAF2, CTNNB1, PIK3R1), as well as insulin-destroying enzyme (IDE), insulin-like growth factor (IGF1), epidermal growth factor receptor (EGFR), and a protein involved in DNA replication and repair (PCNA).
We also reconstructed a gene network for sets of genes predisposing to autism and developmental delay (NDD) (gene set 3) and genes associated with autoimmune disorders (gene set 9). An initial set of 4684 genes (499 genes for predisposition to ASD/DD, 4020 autoimmune disease genes and 165 genes belonging to both sets) was analyzed using stringApp for Cytoscape. In Cytoscape, all edges of the network were removed, except for those indicating experimentally established interactions with a confidence level of more than 0.9. As a result, a gene network consisting of 215 genes and 233 connections between them was obtained (Figure 5). The genes were assigned different colors according to the original set in which they were included.
The products of the most connected genes of this network include coregulatory proteins (CREBBP, RBBP4, HDAC1, HDAC2, EP300) [28,29,30], signaling pathway proteins (TRAF2, CTNNB1, PIK3R1), proteins involved in ubiquitination (FBXW7, CBL), phosphatases (PPP2CA, PTPN11), ribosomal protein (RPL10A), translation initiation factor (EIF3G), as well as directly the mTOR protein (MTOR). Of all the most connected genes in this gene network, only the HDAC1 gene does not belong to the set of genes predisposing to NDD.
The two gene networks we have reconstructed have a comparable size and number of nodes with a relatively high degree of connectivity (5 and higher). Among the most connected products of the genes of these networks, 6 are common (PIK3R1, RBBP4, CREBBP, TRAF2, CTNNB1 and HDAC1), 15 are mTOR-sensitive, 9 relate directly to the mTOR signaling pathway. Only 1 gene product from Figure 4 network (EGFR) and 3 gene products from Figure 5 network (EP300, EIF3B, CBL) do not belong to either of the two groups, which indicates the key role of the mTOR signaling pathway in the pathogenesis of autoimmune diseases, AD and neurodevelopmental disorders, including ASD (Figure 6).
2.4. The Associative Network Analysis of the Main Elements of the mTOR Pathway and Substances Regulating Their Activity Using for ASD and AD Treatment
Based on a large percentage and high degree of connectivity of mTOR-related ASD and AD genes (Figure 1 and Figure 6), we searched for mTOR inhibitors used in AD therapy and with potential for ASD therapy by means of ANDVisio tool. To do this, ANDVisio built networks based on three fragments of the mTOR pathway: PI3K/Akt (Figure 7), Ras (Figure 8) and p38 MAPK (Figure 9). Drug-type objects associated with ASD and AD were added to each graph, and those that had an association with AD but no association with ASD were identified.
What is notably, Drug-type objects associated with Alzheimer's disease significantly outnumbered Drug-type objects associated with ASD in all the associative networks we have reconstructed.
3. Discussion
Initially, pharmacological mTOR signaling inhibitors have been used after transplantation and cancer treatment. However, research in recent years has shown that aberrant protein aggregation, such as deposition of beta-amyloid (Aß) and tau filaments, as well as cognitive impairment, are chased away by inhibition of mTOR reviewed [31]. Far earlier, in 2008, it was first shown that adult Tsc2+/− mice, one of the most common syndromic autism model animals, practically overcame both behavioral deficits and learning problems after a short course of rapamycin against the background of normalization of synaptic plasticity [32].
Keyword search for “Alzheimer's disease” + “treatment” in the PubMed database (https://pubmed.ncbi.nlm.nih.gov ) brought 86,391 results, while the same search for “autism” + “treatment” only brought 26,778 results. Moreover, since autism is exclusively diagnosed according to behavioral criteria that overlook clinical and genomic heterogeneity, some publications contain information concerning failed clinical trials [33].
The analysis carried out in the article allows us to propose dysregulation of the mTOR signaling pathway as one of the promising criteria for subtyping ASD in order to propose the optimal treatment option. Thus, we have shown that more than half of the genes common to autism and Alzheimer's disease are associated with the mTOR signaling, and that almost half of the genes predisposing to autism and two-fifths of the genes predisposing to Alzheimer's disease are directly related to the same signaling pathway (Figure 1).
The gene networks linking Alzheimer's disease and autism with autoimmune disorders allowed us to identify the most connected genes from these sets, more than half of them are mTOR-sensitive, a third belong to the mTOR signaling pathway itself and only 4 genes are not directly related to the signaling pathway. Altogether, it confirms the pivotal role of the mTOR signaling pathway in the pathogenesis of not only autoimmune pathologies, but also AD and ASD (Figure 6).
Examination of the distributions of AD and ASD predisposition genes by PAI values revealed that: 1) both Alzheimer's disease (from the ADVP database) and autism (from SFARI Gene database) genes had a significantly increased content of genes with the same phylostratigraphic age (PAI = 3, Metazoa, multicellular, eukaryotic organisms in the biological kingdom Animalia) than all protein coding genes; 2) ASD predisposition genes (from SFARI Gene database) were much more different from control allCDS_19478 gene set than Alzheimer's disease (from the ADVP database) in the distribution of PAI values; 3) ASD predisposition genes (from SFARI Gene database) had a significantly enriched content of evolutionarily ancient genes; 4) average values of PAI for Alzheimer's disease genes (from the ADVP database), ASD genes (from SFARI Gene database) and mTOR signaling pathway were 3.18, 2.86, and 2.29 respectively (Table 1). Such low PAI values are typical for specific types of cancers, as for neurodegenerative diseases, they are close to the value for Parkinson's disease [34]. The fact that mTOR signaling pathway had even more enriched content of evolutionarily ancient genes with average values of PAI 2.29 indirectly supports the hypothesis of the link between mTOR and autism, and to a lesser extent Alzheimer's disease.
When examining the distribution of ASD predisposition genes from gene sets 1 and 2 by DI values, a significant enrichment of this group with genes subjected to stabilizing selection was revealed. An extremely low DI value (= 0) was found for 66 genes or 6 % of SFARI Gene database (gene set 1) and 14 genes (ACVR2A, AP2S1, CAMK2A, CTCF, CUL3, HNRNPD, MARK2, NACC1, OBSCN, SATB2, SLC6A1, SPAST, TBR1, TLE3) or 8% of gene set 2. Moreover, not a single gene among the ASD predisposition genes from gene set 2 had a DI > 1 (Supplementary Table S2), indicating that these gene sets were subject to stabilizing selection. At the same time, fifteen ASD predisposition genes from SFARI gene database (gene set 1) had high DI values (DI > 1): DYDC2, CX3CR1, OR1C1, CHM, DDX53, LAS1L, RAD21L1, SPP2, CYLC2, SLC25A39, DYDC1, MACROD2, KCNK7, GSTM1, and CD99L2. Only one gene (DYDC2) among the genes had a DI as high as 3, indicating that this gene was probably subjected to strong driving selection. DYDC2 and DYDC1 (DI > 1) encode proteins that contain a DPY30 domain which is necessary for the methylation of histone H3 [35]. The proteins are involved in spermatogenesis and acrosome formation, Northern blot analysis detected DYDC1 and DYDC2 expression in testis and brain only, yet, the function of the genes in the brain is unknown [36].
We also found that the distribution of genes from the ADVP database (gene set 5) by DI values was very slightly different from the control allCDS_19478 gene set (Figure 3). An extremely low DI value (= 0) was found for 26 genes or 3 % of Alzheimer's disease genes. Notably, the most connected genes in the gene network representing genes predisposing to Alzheimer's disease and genes associated with autoimmune disorders contained significantly increased number of genes with low DI values. Nine out of the seventeen most connected genes (RPL6, RPL17, EED, RBBP4, HDAC1, UBE2L3, UBE2I, CTNNB1, PCNA) had the lowest DI values (DI < 0.05) (Figure 4 and Supplementary Table S2).
We also examined the distribution of the most connected genes from two gene networks (Figure 4 and Figure 5, generalized Figure 6) by DI values and found that sixteen out of the twenty eight genes had an extremely low DI value (<0.05). The data we had obtained suggest that perhaps the most connected genes in any gene network tend to have a very low DI value and therefore undergo stabilizing selection. The pressure of stabilizing selection are usually associated with highly conservative traits, such as biochemical metabolic pathways, which are similar to most taxa. One of these pathways is definitely mTOR. The significant prevalence of genes with an extremely low DI=0 among ASD associated genes once again suggests a metabolic basis for the disorder.
The characteristic features of ASD and Alzheimer's disease predisposition genes distribution according to the PAI and DI indices revealed in this study provide a starting point for further analyses of the evolutionary characteristics of the entire gene networks associated with both neurodevelopmental and neurodegenerative diseases.
The ANDVisio is a bioinformatic tool designed to reconstruct, visualize, and analyze associative gene networks in the previously developed Associative Network Discovery System (ANDSystem) software [37,38]. The ANDSystem incorporates utilities for mining knowledge from PubMed published scientific texts and it was chosen to search of mTOR signaling pharmacological modulators. Using ANDVisio tool we built three networks based on three fragments of the mTOR pathway: PI3K/Akt (Figure 5), Ras (Figure 6) and p38 MAPK (Figure 7) along with related drug-type objects. Then drug-type objects associated with AD but not with ASD were identified.
By means of ANDVisio tool, both pharmacological and natural mTOR regulators with potential for ASD treatment were selected such as propofol, dexamethasone, celecoxib, statins, berberine, resveratrol, quercetin, myricetin, myo-inositol and several amino acids.
In many cases, the mechanism of action of pharmacological mTOR inhibitors is well investigated. Propofol reduces the activity of the mTOR signaling pathway by inhibiting mTOR/eIF4E [39]. Dexamethasone regulates the Ras, PI3K/Akt, and mTOR pathways by activating AKT [40] and inhibiting ERK [41]. Celecoxib regulates the PI3K/Akt, mTOR pathways by activating AKT and inhibiting mTOR [42]. Celecoxib has also shown efficacy for ASD treatment when taken with risperidone in a randomized controlled trial [43]. Statins, such as simvastatin and atorvastatin, inhibit PI3K/Akt and mTOR [44].
It has recently been shown that many biologically active additives are natural mTOR regulators. Berberine regulates the p38 MAPK, Ras, and mTOR pathways by activating p38 and ERK [45]. Resveratrol regulates the PI3K/Akt and mTOR pathways by inhibiting AKT [46]. Quercetin regulates the PI3K/Akt and mTOR pathways by inhibiting PI3K [47,48]. Moreover, resveratrol and quercetin have already been tested for ASD treatment [49,50]. Myricetin regulates the MAPK, PI3K/Akt, and mTOR pathways [51]. Myo-inositol inhibits PI3K and enhances the stability of active mTOR [52,53]. Among the amino acids, leucine, isoleucine and valine activate mTOR, while histidine, lysine and threonine inhibit it [54].
Thus, the ANDVisio tool of the ANDSystem has proven to be an effective tool for directly identifying substances that modulate a known signaling pathway such as mTOR. In addition, these findings show that an in-depth bioinformatic analysis of diagnostic full-exome sequencing data from ASD patients and the search for signaling pathways linking genes predisposed to autism may lead to the discovery of new targets for mechanism-based therapies.
4. Materials and Methods
4.1. Extracting Genes from Diverse Data Sources and Gene-Set Analysis
The The following sets of genes were selected for analysis:
- Genes implicated in autism susceptibility (from SFARI Gene database released 20.10.2022[22]) – 1095 genes;
- Autism predisposition genes (41588_2022_1104_MOESM3_ESM.xlsx [20]) – 185 genes;
- Neurodevelopmental disorders predisposition genes (NDD) (41588_2022_1104_MOESM3_ESM.xlsx [20]) – 664 genes;
- Genes predisposing to Alzheimer's disease (13195_2017_252_MOESM2_ESM.doc [55]) – 430 genes;
- Alzheimer's disease predisposition genes (from the ADVP database [21]) – 956 genes;
- mTOR-sensitive genes (mTOR-sensitive 5UTR.xlsx [59]) – 6543 genes;
- Genes associated with autoimmune diseases (from the GAAD database [60]) – 4186 genes.
- All protein-coding genes of the human genome for which PAI and DI values were calculated [24] – 19478 genes.
The sets of genes 1, 6, 7, and 8 are exhaustively described in [61]. The gene sets 2 and 3 were obtained as an analysis of full-exome sequencing of the genomes of more than 150,000 individuals diagnosed with neurodevelopmental disorders [20]. The sets of genes 4 and 5, associated with Alzheimer's disease, were taken from original article [55] and from Alzheimer's Disease Variant Portal (ADVP) [21]. The gene set 9 was taken from A Gene and Autoimmiune Disease Association Database (GAAD) [60]. The complete lists of all analyzed gene sets are given in Supplementary Table S1.
An online service (https://bioinformatics.psb.ugent.be/webtools/Venn/) was used to find intersections of genes from different sets and build Venn diagrams.
4.2. Phylostratigraphic Analysis and Divergence Analysis
Phylostratigraphy is a method used to determine the evolutionary origin of genes by identifying moments in genome evolution marked by a sharp increase in the number of new genes and by detecting genes that are unique to certain taxa [62,63]. This method relies on calculating the oldest taxon in which an ortholog of the studied gene can be identified, thereby indicating the gene’s evolutionary origin.
In our analysis, we began by retrieving orthologous genes from the KEGG Orthology database [64]. The taxon reflecting the gene’s age was determined by identifying the most distantly related lineage in which orthologs are present. For each gene, the Phylostratigraphy Age Index (PAI) [34] was calculated according to the distance of this taxon from the root of the phylogenetic tree (Table 2). A larger PAI value indicates that the gene diverged more recently (i.e., younger genes), whereas a smaller PAI value corresponds to a more ancient origin.
Evolutionary variability of each gene was further characterized using the Divergence Index (DI), derived from the ratio of nonsynonymous to synonymous substitutions (dN/dS). For each gene and its orthologs from the Hominidae family, specifically orthologs found in the western lowland gorilla Gorilla gorilla gorilla, Sumatran orangutan Pongo abelii, and common chimpanzee Pan troglodytes. The dN/dS ratio for each ortholog pair was subsequently normalized to derive the DI, which reflects the type of selection on gene sequence within said taxon. A DI value ranging from 0 to 1 indicates that a gene is undergoing stabilizing selection, a value near 1 indicates neutral evolution, and a value mush greater than 1 indicates positive selection.
All analyses of evolutionary indices were conducted within the Orthoweb software package [65]. The calculation of PAI used the method based on KEGG orthology groups. Resulting data were exported and processed using custom Python scripts for downstream statistical analysis and visualization.
4.3. Network Construction
The construction of gene networks was performed using the STRING database (v11.5), as well as the ANDVisio tool of the ANDSystem.
The STRING database systematically collects and combines data on protein-protein interactions: both physical and functional. The data comes from a number of sources: automated analysis of scientific literature, calculated predictions of interaction based on coexpression, conservative genomic context, databases of interaction experiments and known complexes/pathways from carefully selected sources. All these interactions were evaluated and subsequently automatically transferred to less studied organisms using hierarchical orthological information [66]. The data was accessed through the website https://string-db.org/
ANDVisio is a software tool that allows searching, visualizing, editing, and saving associative gene networks in various formats that describe the relationships between molecular genetic objects such as proteins, genes, and metabolites, biological processes, and diseases. ANDVisio supports filtering by object types, relationships between objects and information sources, and provides tools for graph layout, shortest path search, and cycle detection in graphs https://www-bionet.sscc.ru/andvisio/#!/app/about [37,38].
Supplementary Materials
The following supporting information can be downloaded at the website of this paper posted on Preprints.org. Table S1: All analyzed gene sets; Table S2: PAI and DI indices for all analyzed gene sets.
Author Contributions
Conceptualization, E.A.T. and S.A.L.; methodology, S.A.L. and A.V.K.; software, A.A.P. and R.A.I.; formal analysis, E.A.T.; investigation, E.A.T., S.A.L. and R.A.I.;; data curation, E.A.T., A.A.P. and R.A.I.; writing—original draft preparation, E.A.T. and R.A.I.; writing—review and editing, E.A.T., R.A.I., S.A.L. and A.V.K.; project administration, A.V.K. and S.A.L.; funding acquisition, A.V.K. and S.A.L. All authors have read and agreed to the published version of the manuscript.
Institutional Review Board Statement
Not applicable.
Informed Consent Statement
Not applicable.
Conflicts of Interest
The authors declare no conflict of interest. The funders had no role in the design of the study; in the collection, analyses, or interpretation of data; in the writing of the manuscript,or in the decision to publish the results.
Abbreviations
The following abbreviations are used in this manuscript:
| ASD | autism spectrum disorder |
| AD | Alzheimer's disease |
| SFARI | Simon’s Foundation Autism Research Initiative |
| mTOR | mechanistic target of rapamycin |
| FMRP | fragile X mental retardation protein |
| PAI | Phylostratigraphic Age Index |
| DI | Divergence Index |
| NDD | neurodevelopmental disorders |
References
- Hyman, S.L.; Levy, S.E.; Myers, S.M.; COUNCIL ON CHILDREN WITH DISABILITIES, SECTION ON DEVELOPMENTAL AND BEHAVIORAL PEDIATRICS. Identification, Evaluation, and Management of Children With Autism Spectrum Disorder. Pediatrics 2020, 145, e20193447. doi: 10.1542/peds.2019-3447. [CrossRef]
- Soysal, P.; Tan, S.G. The prevalence and co-incidence of geriatric syndromes in older patients with early-stage Alzheimer’s disease and dementia with Lewy bodies. Aging Clin. Exp. Res. 2021, 33, 2599–2603.
- Rajan, K.B.; Weuve, J.; Barnes, L.L.; McAninch, E.A.; Wilson, R.S.; Evans, D.A. Population estimate of people with clinical Alzheimer’s disease and mild cognitive impairment in the United States (2020-2060). Alzheimers. Dement. 2021, 17, 1966–1975. doi: 10.1002/alz.12362. [CrossRef]
- Mencer, S.; Kartawy, M.; Lendenfeld, F.; Soluh, H.; Tripathi, M.K.; Khaliulin, I.; Amal, H. Proteomics of autism and Alzheimer's mouse models reveal common alterations in mTOR signaling pathway. Transl Psychiatry 2021, 11, 480. doi: 10.1038/s41398-021-01578-2. [CrossRef]
- Hughes, H.K.; Mills Ko, E.; Rose, D.; Ashwood, P. Immune Dysfunction and Autoimmunity as Pathological Mechanisms in Autism Spectrum Disorders. Front. Cell. Neurosci. 2018, 12, 405. doi: 10.3389/fncel.2018.00405. [CrossRef]
- Ashwood, P.; van deWater, J. Is autism an autoimmune disease? Autoimmun. Rev. 2004, 3, 557–562.
- Edmiston, E.; Ashwood, P.; van de Water, J. Autoimmunity, Autoantibodies, and Autism Spectrum Disorder. Biol. Psychiatry 2017, 81, 383–390.
- DiStasio, M.M.; Nagakura, I.; Nadler, M.J.; Anderson, M.P. T lymphocytes and cytotoxic astrocyte blebs correlate across autism brains. Ann. Neurol. 2019, 86, 885–898.
- Chen, X.; Holtzman, D.M. Emerging roles of innate and adaptive immunity in Alzheimer's disease. Immunity. 2022, 55, 2236-2254. doi: 10.1016/j.immuni.2022.10.016. [CrossRef]
- Meier-Stephenson, F.S.; Meier-Stephenson, V.C.; Carter, M.D. et al. Alzheimer’s disease as an autoimmune disorder of innate immunity endogenously modulated by tryptophan metabolites. Alzheimer’s Dement. Transl. Res. Clin. Interv. 2022, 8, e12283. doi: 10.1002/trc2.12283. [CrossRef]
- Shuid, A.N.; Jayusman, P.A.; Shuid, N.; Ismail, J.; Kamal, Nor N.; Naina Mohamed, I. Update on Atypicalities of Central Nervous System in Autism Spectrum Disorder. Brain Sci. 2020, 10, 309. doi: 10.3390/brainsci10050309. [CrossRef]
- Delgoffe, G.M.; Pollizzi, K.N.; Waickman, A.T.; Heikamp, E.; Meyers, D.J.; Horton, M.R.; Xiao, B.; Worley, P.F.; Powell, J.D. The kinase mTOR regulates the differentiation of helper T cells through the selective activation of signaling by mTORC1 and mTORC2. Nat. Immunol. 2011, 12, 295-303. doi: 10.1038/ni.2005. [CrossRef]
- Liu, Y.; Zhang, D.T.; Liu, X.G. mTOR signaling in T cell immunity and autoimmunity. Int. Rev. Immunol. 2015, 34, 50-66. doi: 10.3109/08830185.2014.933957. [CrossRef]
- Ortiz-González, X.R. Mitochondrial Dysfunction: A Common Denominator in Neurodevelopmental Disorders? Dev. Neurosci. 2021, 43, 222-229. doi: 10.1159/000517870. [CrossRef]
- Lenzi, P.; Ferese, R.; Biagioni, F.; Fulceri, F.; Busceti, C.L.; Falleni, A.; Gambardella, S.; Frati, A.; Fornai, F. Rapamycin Ameliorates Defects in Mitochondrial Fission and Mitophagy in Glioblastoma Cells. Int. J. Mol. Sci. 2021, 22, 5379. doi: 10.3390/ijms22105379. [CrossRef]
- Thellung, S.; Corsaro, A.; Nizzari, M.; Barbieri, F.; Florio, T. Autophagy Activator Drugs: A New Opportunity in Neuroprotection from Misfolded Protein Toxicity. Int. J. Mol. Sci. 2019, 20, 901. doi: 10.3390/ijms20040901. [CrossRef]
- Richardson, A.; Galvan, V.; Lin, A.L.; Oddo, S. How longevity research can lead to therapies for Alzheimer's disease: The rapamycin story. Exp. Gerontol. 2015, 68, 51-58. doi: 10.1016/j.exger.2014.12.002. [CrossRef]
- Caccamo, A.; Majumder, S.; Richardson, A.; Strong, R.; Oddo, S. Molecular interplay between mammalian target of rapamycin (mTOR), amyloid-beta, and Tau: effects on cognitive impairments. J. Biol. Chem. 2010, 285, 13107-20. doi: 10.1074/jbc.M110.100420. [CrossRef]
- Narayanan, U.; Nalavadi, V.; Nakamoto, M.; Thomas, G.; Ceman, S.; Bassell, G.J.; Warren, S.T. S6K1 phosphorylates and regulates fragile X mental retardation protein (FMRP) with the neuronal protein synthesis-dependent mammalian target of rapamycin (mTOR) signaling cascade. J. Biol. Chem. 2008, 283, 18478-82. doi: 10.1074/jbc.C800055200. [CrossRef]
- Fu, J.M.; Satterstrom, F.K.; Peng, M. et al. Rare coding variation provides insight into the genetic architecture and phenotypic context of autism. Nat. Genet. 2022, 54, 1320-1331. doi: 10.1038/s41588-022-01104-0. [CrossRef]
- Kuksa, P.P.; Liu, C.L.; Fu, W. et al. Alzheimer's Disease Variant Portal: A Catalog of Genetic Findings for Alzheimer's Disease. J Alzheimers Dis. 2022, 86, 461-477. doi: 10.3233/JAD-215055. [CrossRef]
- Abrahams, B.S.; Arking, D.E.; Campbell, D.B.; Meord, H.C.; Morrow, E.M.; Weiss, L.A.; Menashe, I.; Wadkins, T.; Banerjee-Basu, S.; Packer, A. SFARI Gene 2.0: a community-driven knowledgebase for the autism spectrum disorders (ASDs). Mol. Autism 2013, 4, 36. doi: 10.1186/2040-2392-4-36. [CrossRef]
- Caron, E.; Ghosh, S.; Matsuoka, Y.; Ashton-Beaucage, D.; Therrien, M.; Lemieux, S.; Perreault, C.; Roux, P.P.; Kitano, H. A comprehensive map of the mTOR signaling network. Mol. Syst. Biol. 2010, 6, 453.
- Piovesan, A.; Antonaros, F.; Vitale, L.; Strippoli, P.; Pelleri, M.C.; Caracausi, M. Human protein-coding genes and gene feature statistics in 2019. BMC Res. Notes 2019, 12, 315. doi: 10.1186/s13104-019-4343-8. [CrossRef]
- Feng, L.; Wang, G.; Song, Q.; Feng, X.; Su, J.; Ji, G.; Li, M. Proteomics revealed an association between ribosome-associated proteins and amyloid beta deposition in Alzheimer's disease. Metab. Brain Dis. 2024, 39, 263-282. doi: 10.1007/s11011-023-01330-3. [CrossRef]
- Liu, P.P.; Han, X.; Li, X.; Dai, S.K.; Xu, Y.J.; Jiao, L.F.; Du, H.Z.; Zhao, L.H.; Li, R.F.; Teng, Z.Q.; Yang, Y.G.; Liu, C.M. An EED/PRC2-H19 Loop Regulates Cerebellar Development. Adv Sci (Weinh) 2025, 12, e2403591. doi: 10.1002/advs.202403591. [CrossRef]
- Liu, J.; Yuan, S.; Niu, X.; Kelleher, R.; Sheridan, H. ESR1 dysfunction triggers neuroinflammation as a critical upstream causative factor of the Alzheimer's disease process. Aging (Albany NY) 2022, 14, 8595-8614. doi: 10.18632/aging.204359. [CrossRef]
- Barral, S.; Reitz, C.; Small, S.A.; Mayeux, R. Genetic variants in a 'cAMP element binding protein' (CREB)-dependent histone acetylation pathway influence memory performance in cognitively healthy elderly individuals. Neurobiol. Aging 2014, 35, 2881.e7-2881.e10. doi: 10.1016/j.neurobiolaging.2014.06.024. [CrossRef]
- Zhu, Y.; Huang, Y.; Tang, T.; Xie, Y. HDAC1 and HDAC2 orchestrate Wnt signaling to regulate neural progenitor transition during brain development. iScience 2024, 27, 110600. doi: 10.1016/j.isci.2024.110600. [CrossRef]
- Lewerissa, E.I.; Nadif Kasri, N.; Linda, K. Epigenetic regulation of autophagy-related genes: Implications for neurodevelopmental disorders. Autophagy 2024, 20, 15-28. doi: 10.1080/15548627.2023.2250217. [CrossRef]
- Xie, P-L.; Zheng, M-Y.; Han, R.; Chen, W-X.; Mao, J-H. Pharmacological mTOR inhibitors in ameliorating Alzheimer’s disease: current review and perspectives. Front. Pharmacol. 2024, 15, 1366061. doi: 10.3389/fphar.2024.1366061. [CrossRef]
- Ehninger, D.; Han, S.; Shilyansky, C.; Zhou, Y.; Li, W.; Kwiatkowski, D.J.; Ramesh, V.; Silva, A.J. Reversalof learning deficits in a Tsc2+/‒ mouse model of tuberoussclerosis. Nat. Med. 2008, 14, 843–848. doi:10.1038/nm1788. [CrossRef]
- Pérez-Cano, L.; Azidane Chenlo, S.; Sabido-Vera, R.; Sirci, F.; Durham, L.; Guney, E. Translating precision medicine for autism spectrum disorder: A pressing need. Drug Discov. Today 2023, 28, 103486. doi: 10.1016/j.drudis.2023.103486. [CrossRef]
- Mustafin, Z.S.; Lashin, S.A.; Matushkin, Yu.G. Phylostratigraphic analysis of gene networks of human diseases. Vavilovskii Zhurnal Genet. Selektsii 2021, 25, 46-56. doi: 10.18699/VJ21.006. [CrossRef]
- Nagy, P.L.; Griesenbeck, J.; Kornberg, R.D.; Cleary, M.L. A trithorax-group complex purified from Saccharomyces cerevisiae is required for methylation of histone H3. Proc. Natl. Acad. Sci. U S A 2002, 99, 90-4. doi: 10.1073/pnas.221596698. [CrossRef]
- Li, S., Qiao, Y., Di, Q., Le, X., Zhang, L., Zhang, X., Zhang, C., Cheng, J., Zong, S., Koide, S. S., Miao, S., Wang, L. Interaction of SH3P13 and DYDC1 protein: a germ cell component that regulates acrosome biogenesis during spermiogenesis. Europ. J. Cell Biol. 2009, 88, 509-520.
- Demenkov, P.S.; Ivanisenko, T.V.; Kolchanov, N.A.; Ivanisenko, V.A. ANDVisio: a new tool for graphic visualization and analysis of literature mined associative gene networks in the ANDSystem. In Silico Biol. 2011, 11, 149-161. doi: 10.3233/ISB-2012-0449. [CrossRef]
- Ivanisenko, V.A.; Saik, O.V.; Ivanisenko, N.V.; Tiys, E.S.; Ivanisenko, T.V.; Demenkov, P.S.; Kolchanov, N.A. ANDSystem: an Associative Network Discovery System for automated literature mining in the field of biology. BMC Syst. Biol. 2015, 9 Suppl 2(Suppl 2), S2. doi: 10.1186/1752-0509-9-S2-S2. [CrossRef]
- Wang, Z.; Cao, B.; Ji, P.; Yao, F. Propofol inhibits tumor angiogenesis through targeting VEGF/VEGFR and mTOR/eIF4E signaling. Biochem Biophys. Res. Commun. 2021, 555, 13-18. doi: 10.1016/j.bbrc.2021.03.094. [CrossRef]
- Bossmann, M.; Ackermann, B.W.; Thome, U.H.; Laube, M. Signaling Cascade Involved in Rapid Stimulation of Cystic Fibrosis Transmembrane Conductance Regulator (CFTR) by Dexamethasone. Int. J. Mol. Sci. 2017, 18, 1807. doi: 10.3390/ijms18081807. [CrossRef]
- Morita, M.; Suyama, H.; Igishi, T.; Shigeoka, Y.; Kodani, M.; Hashimoto, K.; Takeda, K.; Sumikawa, T.; Shimizu, E. Dexamethasone inhibits paclitaxel-induced cytotoxic activity through retinoblastoma protein dephosphorylation in non-small cell lung cancer cells. Int. J. Oncol. 2007, 30, 187-192.
- Zhang, P.; He, D.; Song, E.; Jiang, M.; Song, Y. Celecoxib enhances the sensitivity of non-small-cell lung cancer cells to radiation-induced apoptosis through downregulation of the Akt/mTOR signaling pathway and COX-2 expression. PLoS One. 2019, 14, e0223760. doi: 10.1371/journal.pone.0223760. [CrossRef]
- Asadabadi, M.; Mohammadi, M.R.; Ghanizadeh, A.; Modabbernia, A.; Ashrafi, M.; Hassanzadeh, E.; Forghani, S.; Akhondzadeh, S.; Celecoxib as adjunctive treatment to risperidone in children with autistic disorder: a randomized, double-blind, placebo-controlled trial. Psychopharmacology (Berl). 2013, 225, 51-59. doi: 10.1007/s00213-012-2796-8. [CrossRef]
- Lashgari, N.A.; Roudsari, N.M.; Zadeh, S.S.T.; Momtaz, S.; Abbasifard, M.; Reiner, Ž.; Abdolghaffari, A.H.; Sahebkar, A. Statins block mammalian target of rapamycin pathway: a possible novel therapeutic strategy for inflammatory, malignant and neurodegenerative diseases. Inflammopharmacology 2023, 31, 57-75. doi: 10.1007/s10787-022-01077-w. [CrossRef]
- Okubo, S.; Uto, T,; Goto, A.; Tanaka, H.; Nishioku, T.; Yamada, K.; Shoyama, Y. Berberine Induces Apoptotic Cell Death via Activation of Caspase-3 and -8 in HL-60 Human Leukemia Cells: Nuclear Localization and Structure-Activity Relationships. Am. J. Chin. Med. 2017, 45, 1497-1511. doi: 10.1142/S0192415X17500811. [CrossRef]
- Sun, X.; Zhang, Y.; Wang, J.; Wei, L.; Li, H.; Hanley, G.; Zhao, M.; Li, Y.; Yin, D. Beta-arrestin 2 modulates resveratrol-induced apoptosis and regulation of Akt/GSK3ß pathways. Biochim. Biophys. Acta 2010, 1800, 912-918. doi: 10.1016/j.bbagen.2010.04.015. [CrossRef]
- Russo, M.; Milito, A.; Spagnuolo, C.; Carbone, V.; Rosén, A.; Minasi, P.; Lauria, F.; Russo, G.L. CK2 and PI3K are direct molecular targets of quercetin in chronic lymphocytic leukaemia. Oncotarget. 2017, 8, 42571-42587. doi: 10.18632/oncotarget.17246. [CrossRef]
- Lim, J.Y.; Lee, J.Y.; Byun, B.J.; Kim, S.H. Fisetin targets phosphatidylinositol-3-kinase and induces apoptosis of human B lymphoma Raji cells. Toxicol. Rep. 2015, 2, 984-989. doi: 10.1016/j.toxrep.2015.07.004. [CrossRef]
- Marchezan, J.; Deckmann, I.; da Fonseca, G.C.; Margis, R.; Riesgo, R.; Gottfried, C. Resveratrol Treatment of Autism Spectrum Disorder-A Pilot Study. Clin. Neuropharmacol. 2022, 45, 122-127. doi: 10.1097/WNF.0000000000000516. [CrossRef]
- Alvarez-Arellano, L.; Salazar-García, M.; Corona, J.C. Neuroprotective Effects of Quercetin in Pediatric Neurological Diseases. Molecules 2020, 25, 5597. doi: 10.3390/molecules25235597. [CrossRef]
- Song, X.; Tan, L.; Wang, M.; Ren, C.; Guo, C.; Yang, B.; Ren, Y.; Cao, Z.; Li, Y.; Pei, J. Myricetin: A review of the most recent research. Biomed Pharmacother. 2021, 134, 111017. doi: 10.1016/j.biopha.2020.111017. [CrossRef]
- Xiong, D.; Pan, J.; Zhang, Q.; Szabo, E.; Miller, M.S.; Lubet, R.A.; You, M.; Wang, Y. Bronchial airway gene expression signatures in mouse lung squamous cell carcinoma and their modulation by cancer chemopreventive agents. Oncotarget 2017, 8, 18885-18900. doi: 10.18632/oncotarget.13806. [CrossRef]
- Rameh, L.E; York, J.D.; Blind, R.D. Inositol phosphates dynamically enhance stability, solubility, and catalytic activity of mTOR. J. Biol. Chem. 2025, 301, 108095. doi: 10.1016/j.jbc.2024.108095. [CrossRef]
- van Sadelhoff, J.H.J.; Perez Pardo, P.; Wu, J.; Garssen, J.; van Bergenhenegouwen, J.; Hogenkamp, A.; Hartog, A.; Kraneveld, A.D. The Gut-Immune-Brain Axis in Autism Spectrum Disorders; A Focus on Amino Acids. Front. Endocrinol. (Lausanne) 2019, 10, 247. doi: 10.3389/fendo.2019.00247. [CrossRef]
- Hu, Y.S.; Xin, J.; Hu, Y.; Zhang, L.; Wang, J. Analyzing the genes related to Alzheimer's disease via a network and pathway-based approach. Alzheimers Res. Ther. 2017, 9, 29. doi: 10.1186/s13195-017-0252-z. [CrossRef]
- Darnell, J.C.; Van Driesche, S.J.; Zhang, C.; Hung, K.Y.; Mele, A.; Fraser, C.E.; Stone, E.F.; Chen, C.; Fak, J.J.; Chi, S.W.; Licatalosi, D.D.; Richter, J.D.; Darnell, R.B. FMRP stalls ribosomal translocation on mRNAs linked to synaptic function and autism. Cell 2011, 146, 247-261. doi: 10.1016/j.cell.2011.06.013. [CrossRef]
- Jansen, A.; Dieleman, G.C.; Smit, A.B.; Verhage, M.; Verhulst, F.C.; Polderman, T.J.C.; Posthuma, D. Gene-set analysis shows association between FMRP targets and autism spectrum disorder. Eur. J. Hum. Genet. 2017, 25, 863-868. doi: 10.1038/ejhg.2017.55. [CrossRef]
- Kanehisa, M.; Goto, S. KEGG: kyoto encyclopedia of genes and genomes. Nucleic Acids Res. 2000, 28, 27-30. doi: 10.1093/nar/28.1.27. [CrossRef]
- Gandin, V.; Masvidal, L.; Hulea, L.; Gravel, S.P.; Cargnello, M.; McLaughlan, S.; Cai, Y.; Balanathan, P.; Morita, M.; Rajakumar, A.; Furic, L.; Pollak, M.; Porco, J.A Jr.; St-Pierre, J.; Pelletier, J.; Larsson, O.; Topisirovic, I. nanoCAGE reveals 5' UTR features that define specific modes of translation of functionally related MTOR-sensitive mRNAs. Genome Res. 2016, 26, 636-48. doi: 10.1101/gr.197566.115. [CrossRef]
- Lu, G.; Hao, X.; Chen, W.H.; Mu, S. GAAD: A Gene and Autoimmiune Disease Association Database. Genomics Proteomics Bioinformatics 2018, 16, 252-261. doi: 10.1016/j.gpb.2018.05.001. [CrossRef]
- Trifonova, E.A.; Klimenko, A.I.; Mustafin, Z.S.; Lashin, S.A.; Kochetov A.V. The mTOR Signaling Pathway Activity and Vitamin D Availability Control the Expression of Most Autism Predisposition Genes. Int. J. Mol. Sci. 2019, 20, 6332. doi: 10.3390/ijms20246332. [CrossRef]
- Domazet-Loso, T.; Brajković, J.; Tautz, D. A phylostratigraphy approach to uncover the genomic history of major adaptations in metazoan lineages. Trends Genet. 2007, 23, 533-9. doi: 10.1016/j.tig.2007.08.014. [CrossRef]
- Domazet-Lošo, M.; Široki, T.; Šimičević, K.; Domazet-Lošo, T. Macroevolutionary dynamics of gene family gain and loss along multicellular eukaryotic lineages. Nat. Commun. 2024, 15, 2663. doi: 10.1038/s41467-024-47017-w. [CrossRef]
- Kanehisa, M.; Furumichi, M.; Tanabe, M.; Sato, Y.; Morishima, K. KEGG: new perspectives on genomes, pathways, diseases and drugs. Nucleic Acids Res. 2017, 45, D353-D361. doi: 10.1093/nar/gkw1092. [CrossRef]
- Ivanov, R.A.; Mukhin, A.M.; Kazantsev, F.V.; Mustafin, Z.S.; Afonnikov, D.A.; Matushkin, Y.G.; Lashin, S.A. Orthoweb: A Software Package for Evolutionary Analysis of Gene Networks. Vavilovskii Zhurnal Genet. Selektsii 2025, 28, 874–881, doi: 10.18699/vjgb-24-95. [CrossRef]
- Szklarczyk, D.; Gable, A.L.; Lyon, D.; Junge, A.; Wyder, S.; Huerta-Cepas, J.; Simonovic, M.; Doncheva, N.T.; Morris, J.H.; Bork, P.; Jensen, L.J.; Mering, C.V. STRING v11: protein-protein association networks with increased coverage, supporting functional discovery in genome-wide experimental datasets. Nucleic Acids Res. 2019, 47, D607-D613. doi: 10.1093/nar/gky1131. [CrossRef]
Figure 1.
A Venn diagram representing the intersections of 5 sets of genes: genes from the SFARI Gene database, a combined set of Alzheimer's disease genes, genes of the mTOR signaling pathway, mTOR-sensitive genes and FMRP target genes.
Figure 1.
A Venn diagram representing the intersections of 5 sets of genes: genes from the SFARI Gene database, a combined set of Alzheimer's disease genes, genes of the mTOR signaling pathway, mTOR-sensitive genes and FMRP target genes.
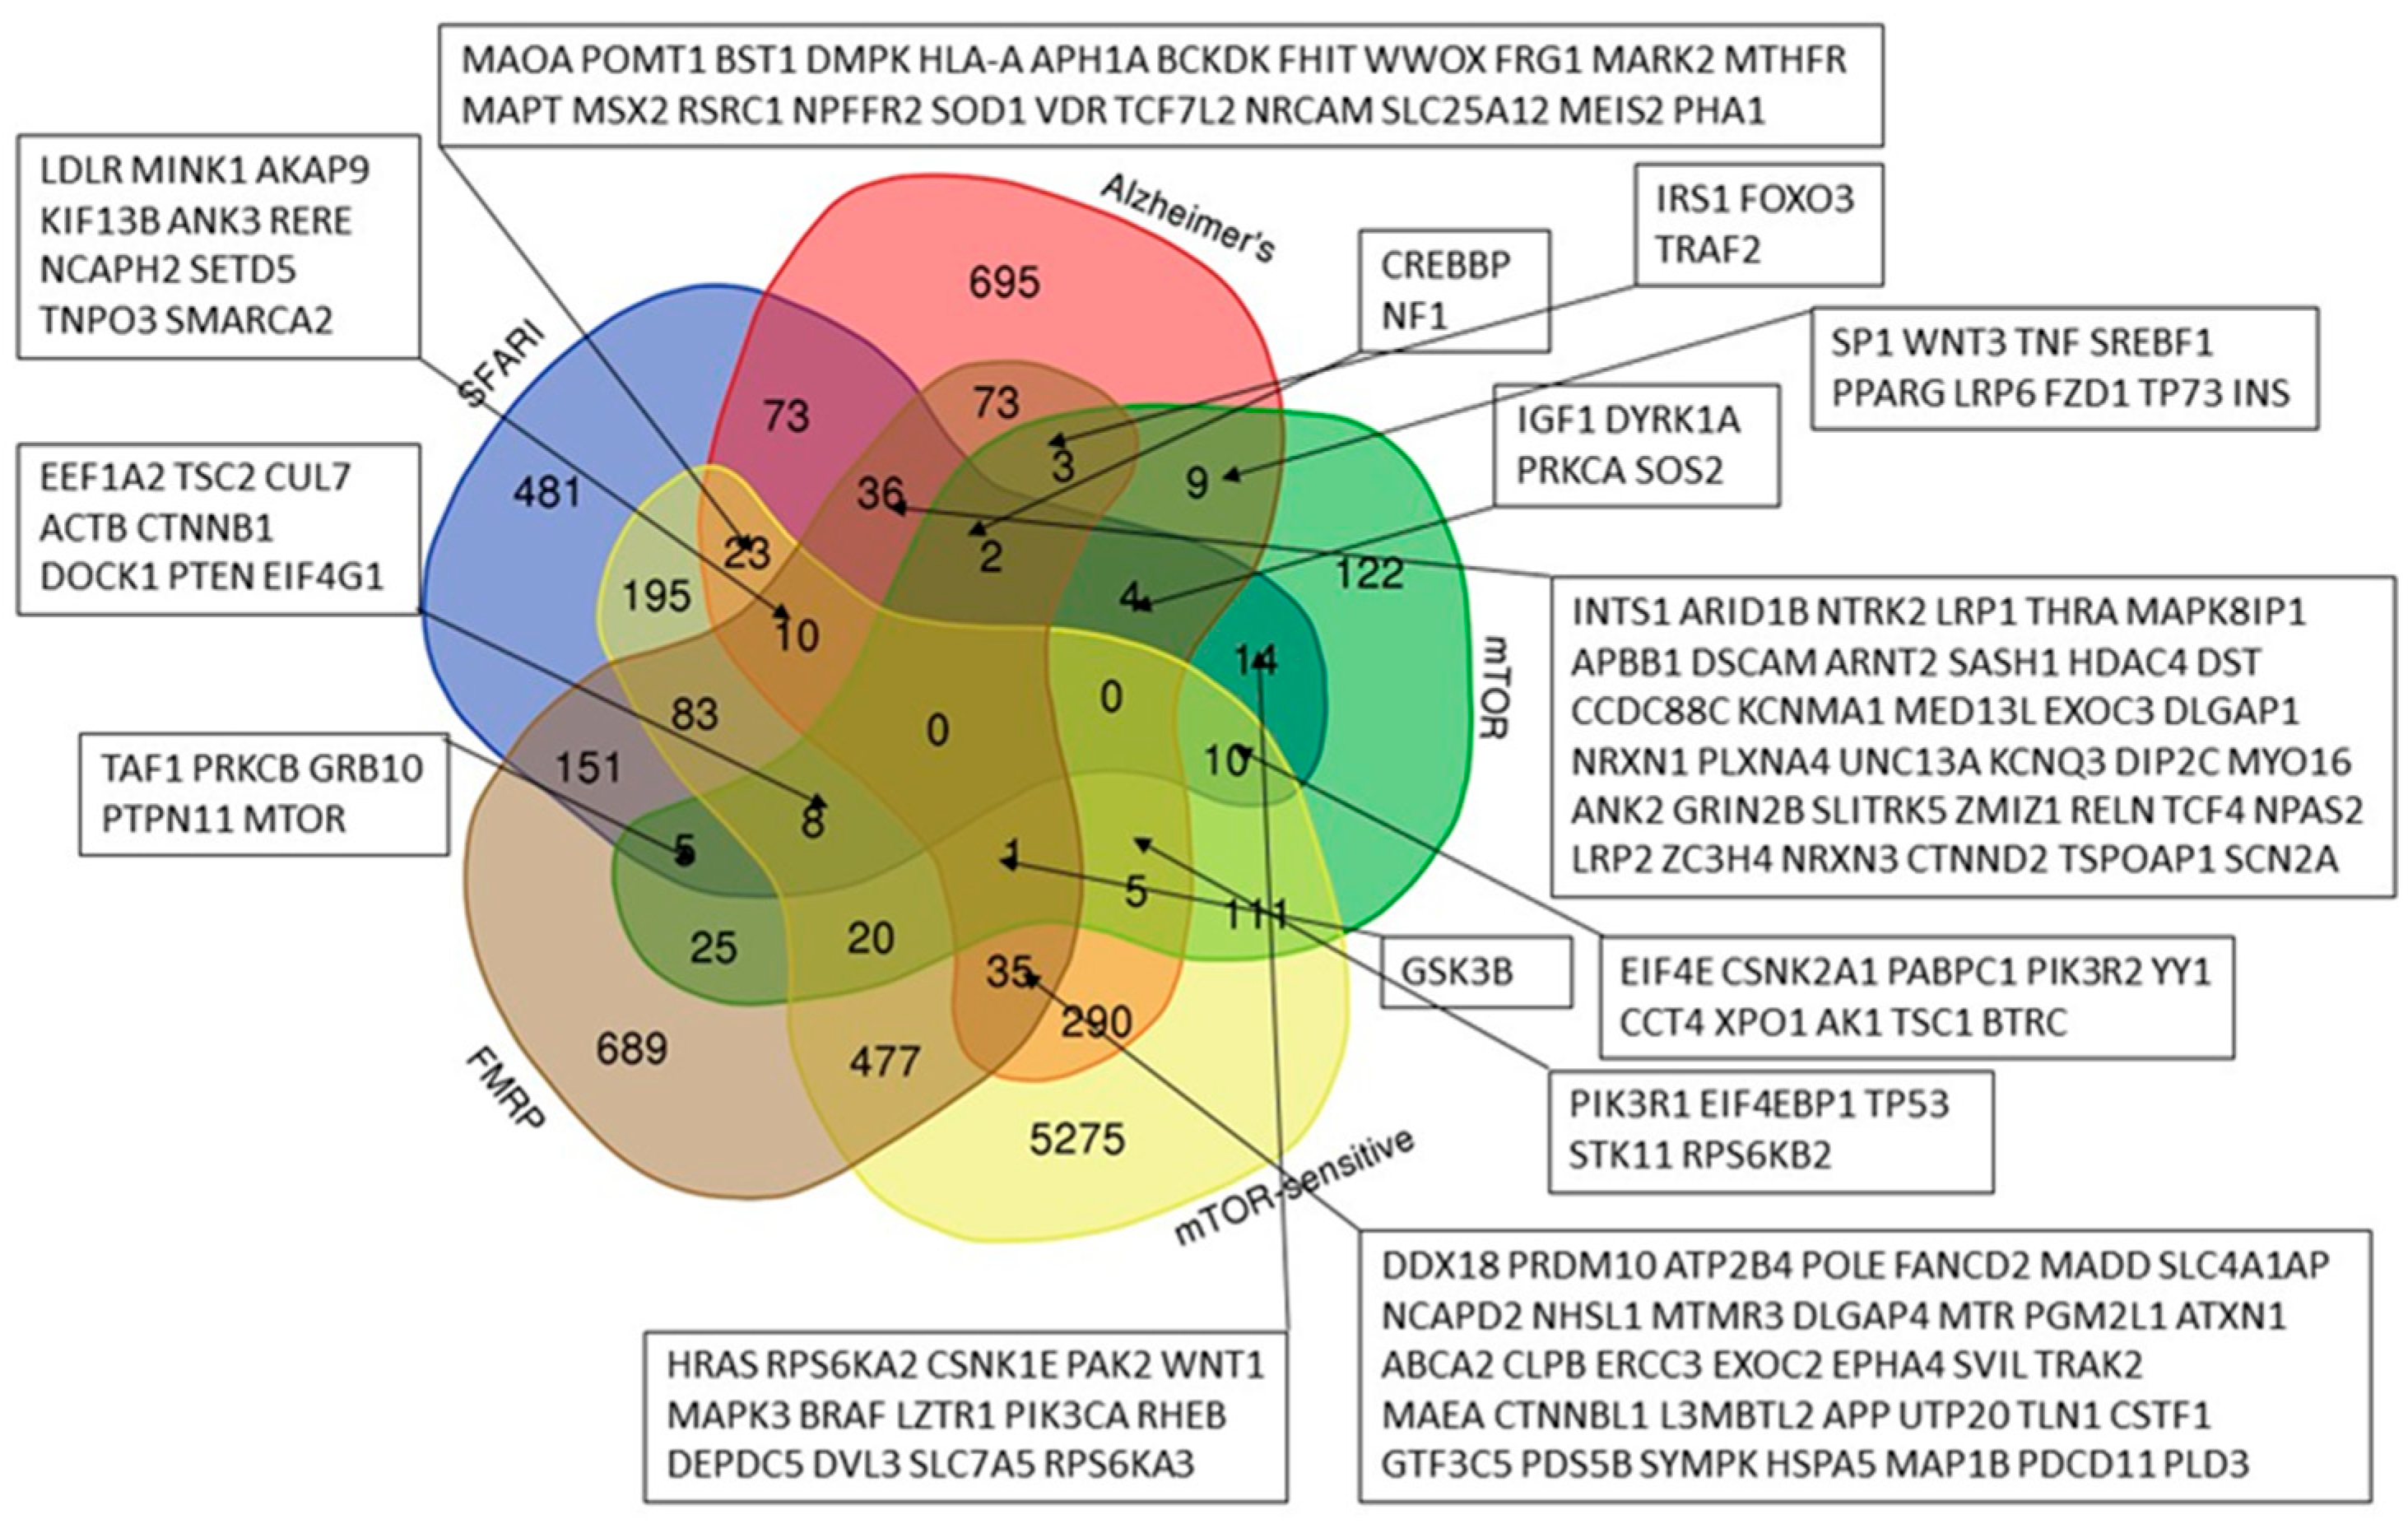
Figure 2.
Distributions by PAI values obtained for the sets of human genes implicated to autism susceptibility and Alzheimer's disease predisposition. a: All human protein-coding genes as a control group compared to genes implicated to autism susceptibility from SFARI database; b: All human protein-coding genes as a control group compared to Alzheimer's disease predisposition genes; c: neurodevelopmental disorders predisposition genes as a control group compared to autism predisposition genes (Fu et al., 2022). Columns marked with asterisks indicate statistically significant differences between gene samples: *p-value < 0.05, ***p-value < 0.001*. Statistical testing was performed using the chi-square test.
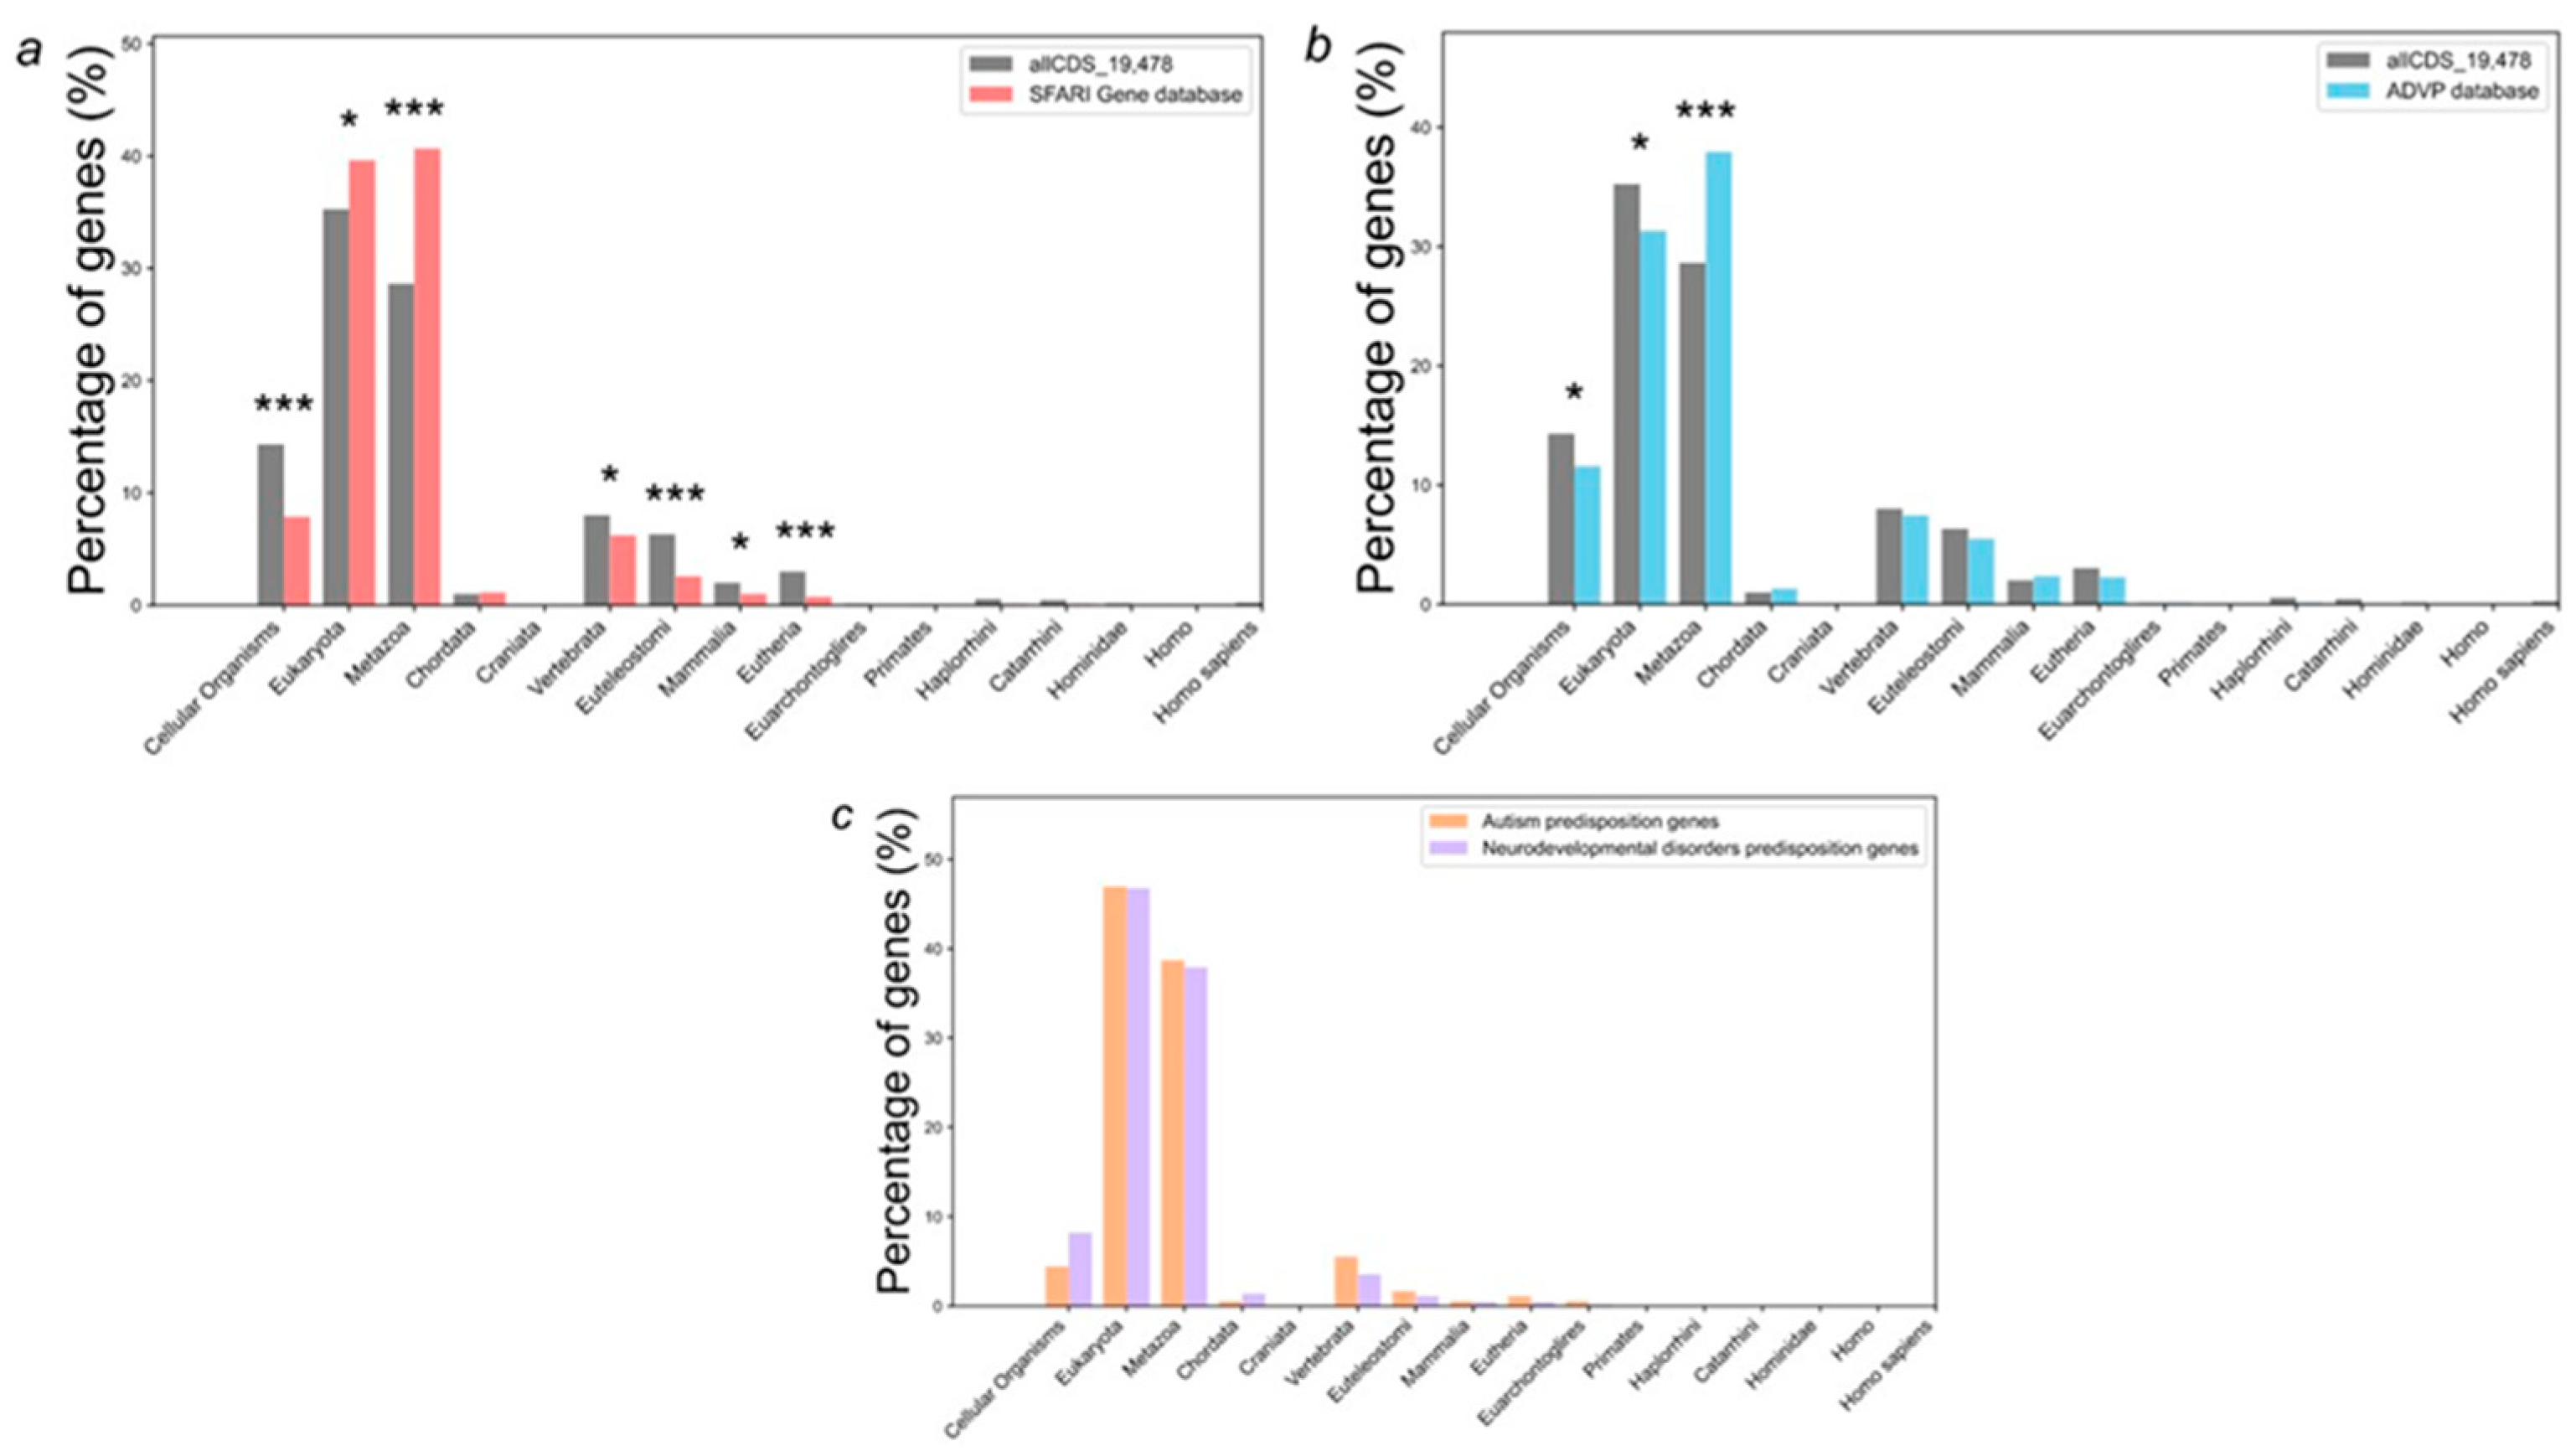
Figure 3.
Distributions of genes from the sets of human genes implicated to autism susceptibility and Alzheimer's disease predisposition according to the DI index. a: All human protein-coding genes as a control group compared to genes implicated to autism susceptibility from SFARI database; b: All human protein-coding genes as a control group compared to Alzheimer's disease predisposition genes; c: neurodevelopmental disorders predisposition genes as a control group compared to autism predisposition genes (Fu et al., 2022). Columns marked with asterisks indicate statistically significant differences between gene samples: *p-value < 0.05, ***p-value < 0.001*. Statistical testing was performed using the chi-square test.
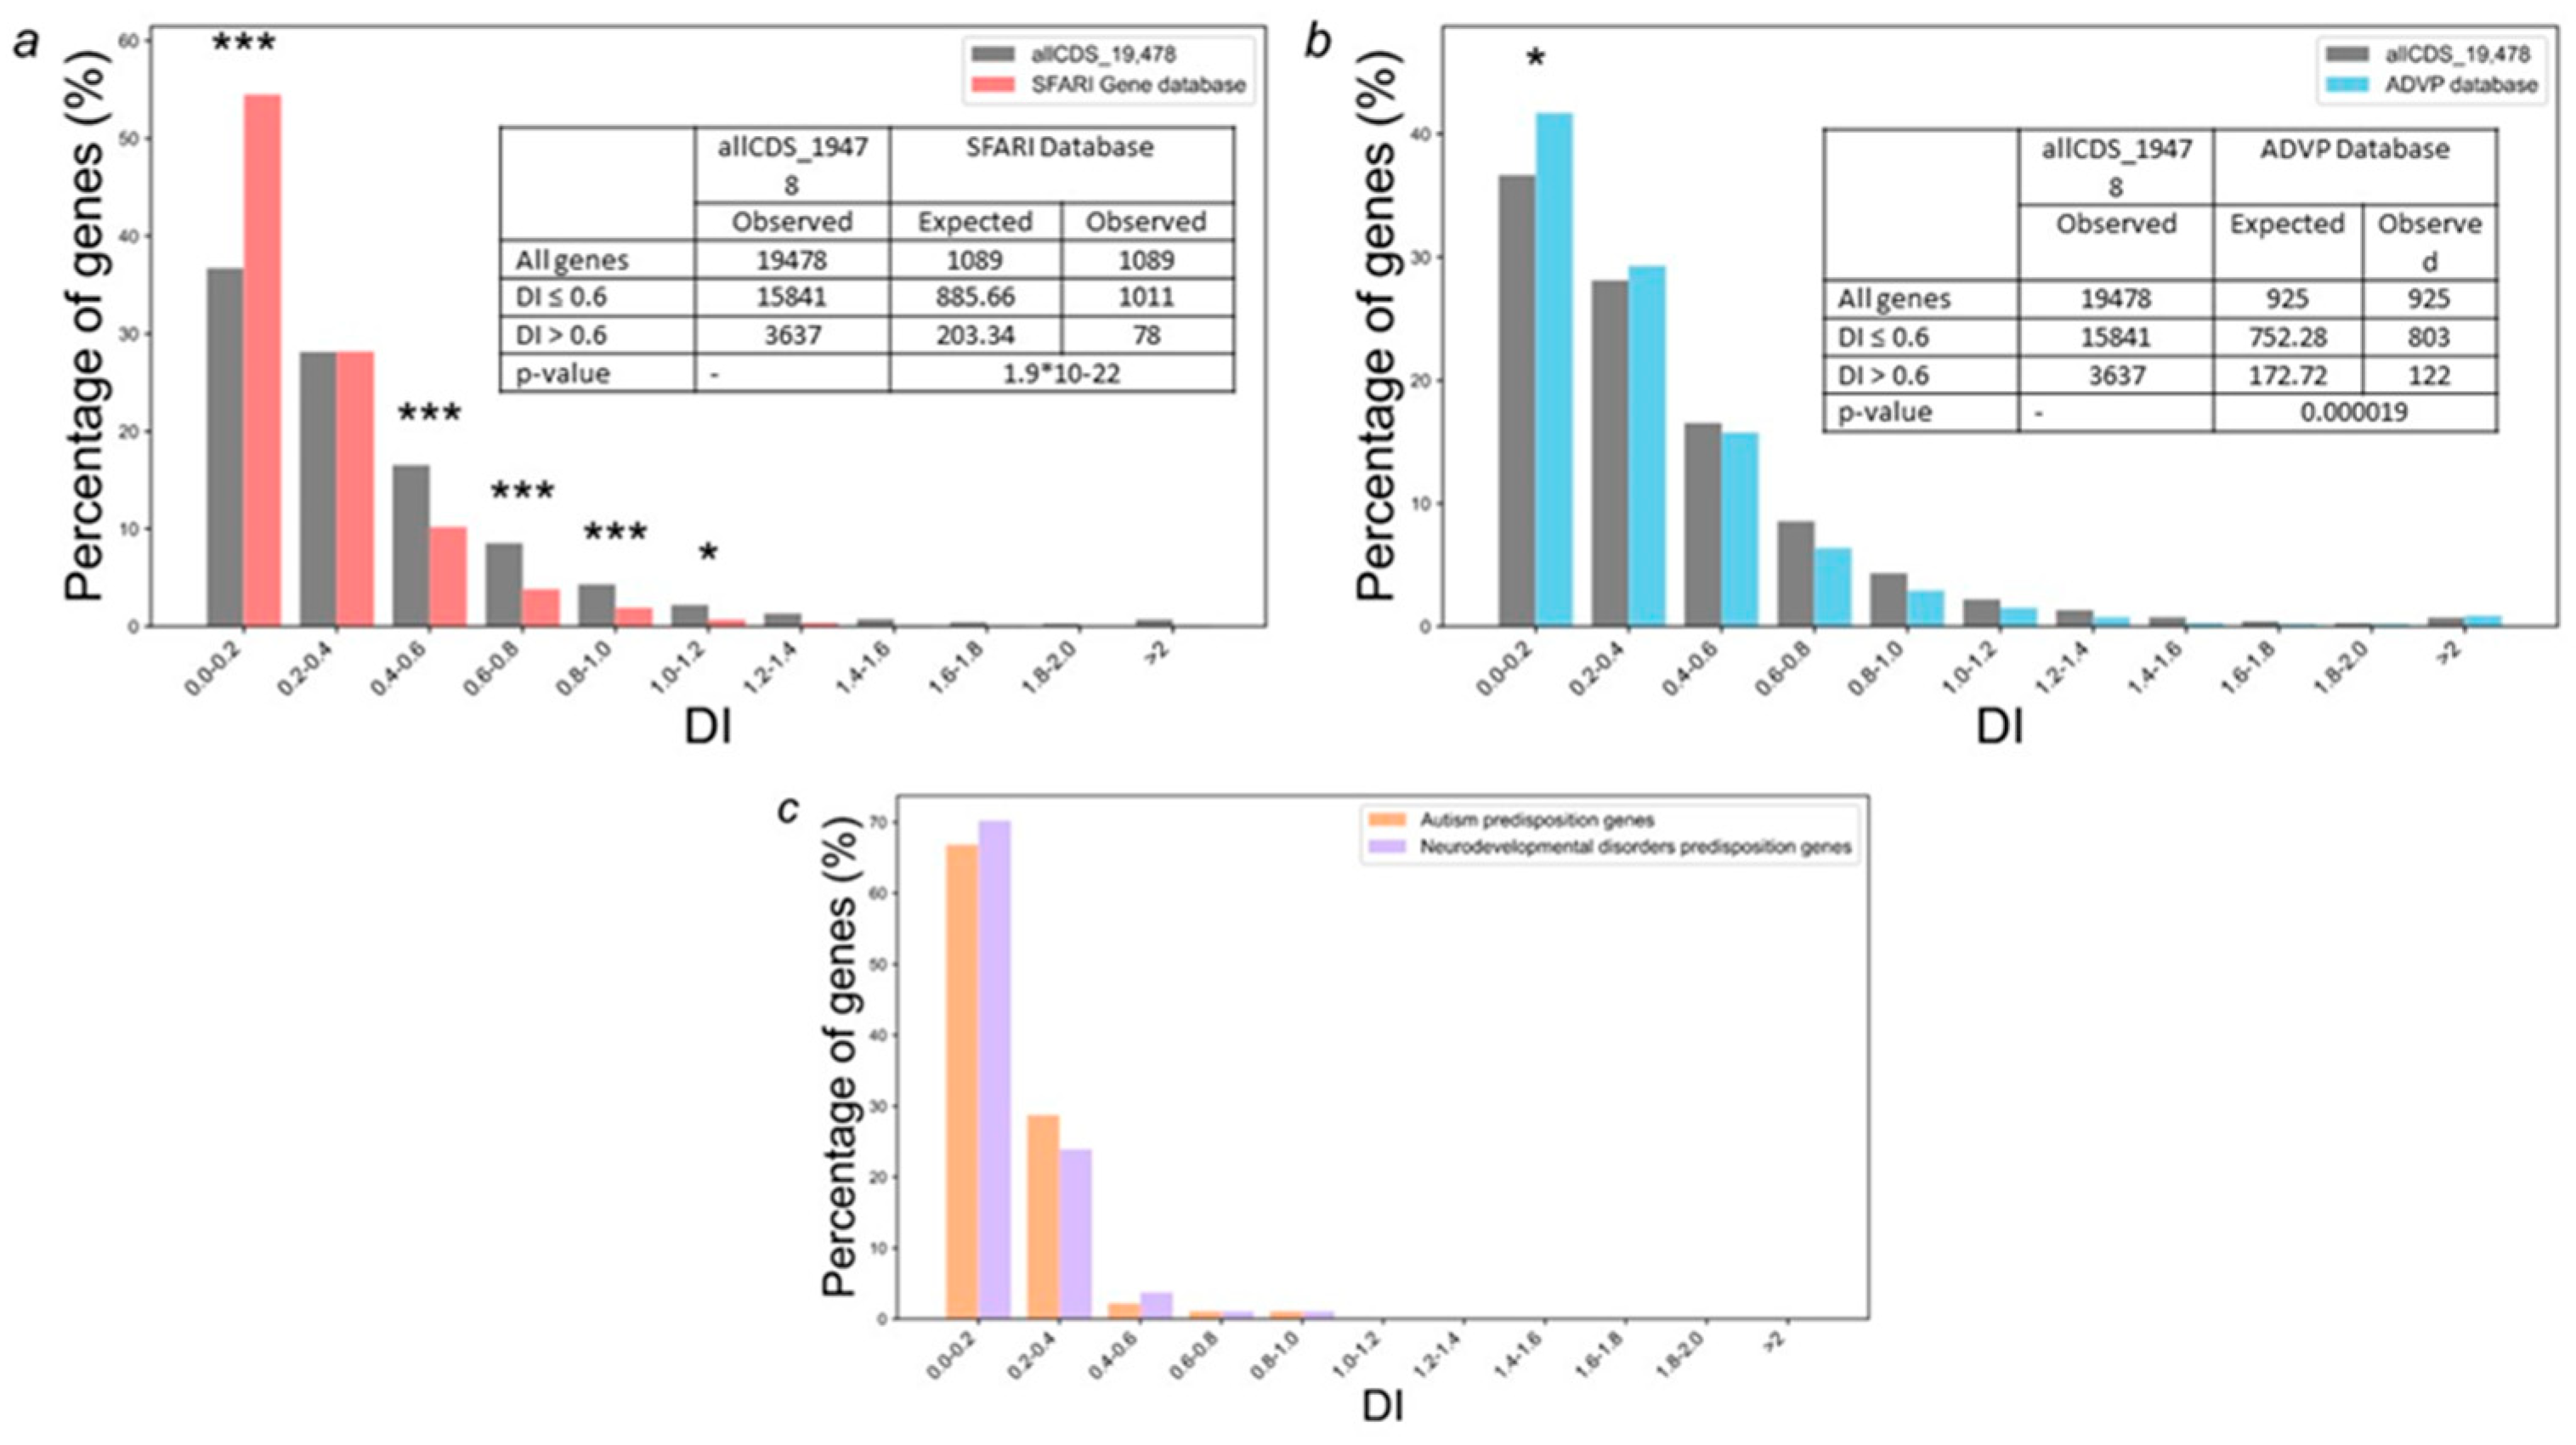
Figure 4.
A gene network representing genes predisposing to Alzheimer's disease and genes of autoimmune disorders. The left legend shows the color and degree of the nodes.
Figure 4.
A gene network representing genes predisposing to Alzheimer's disease and genes of autoimmune disorders. The left legend shows the color and degree of the nodes.
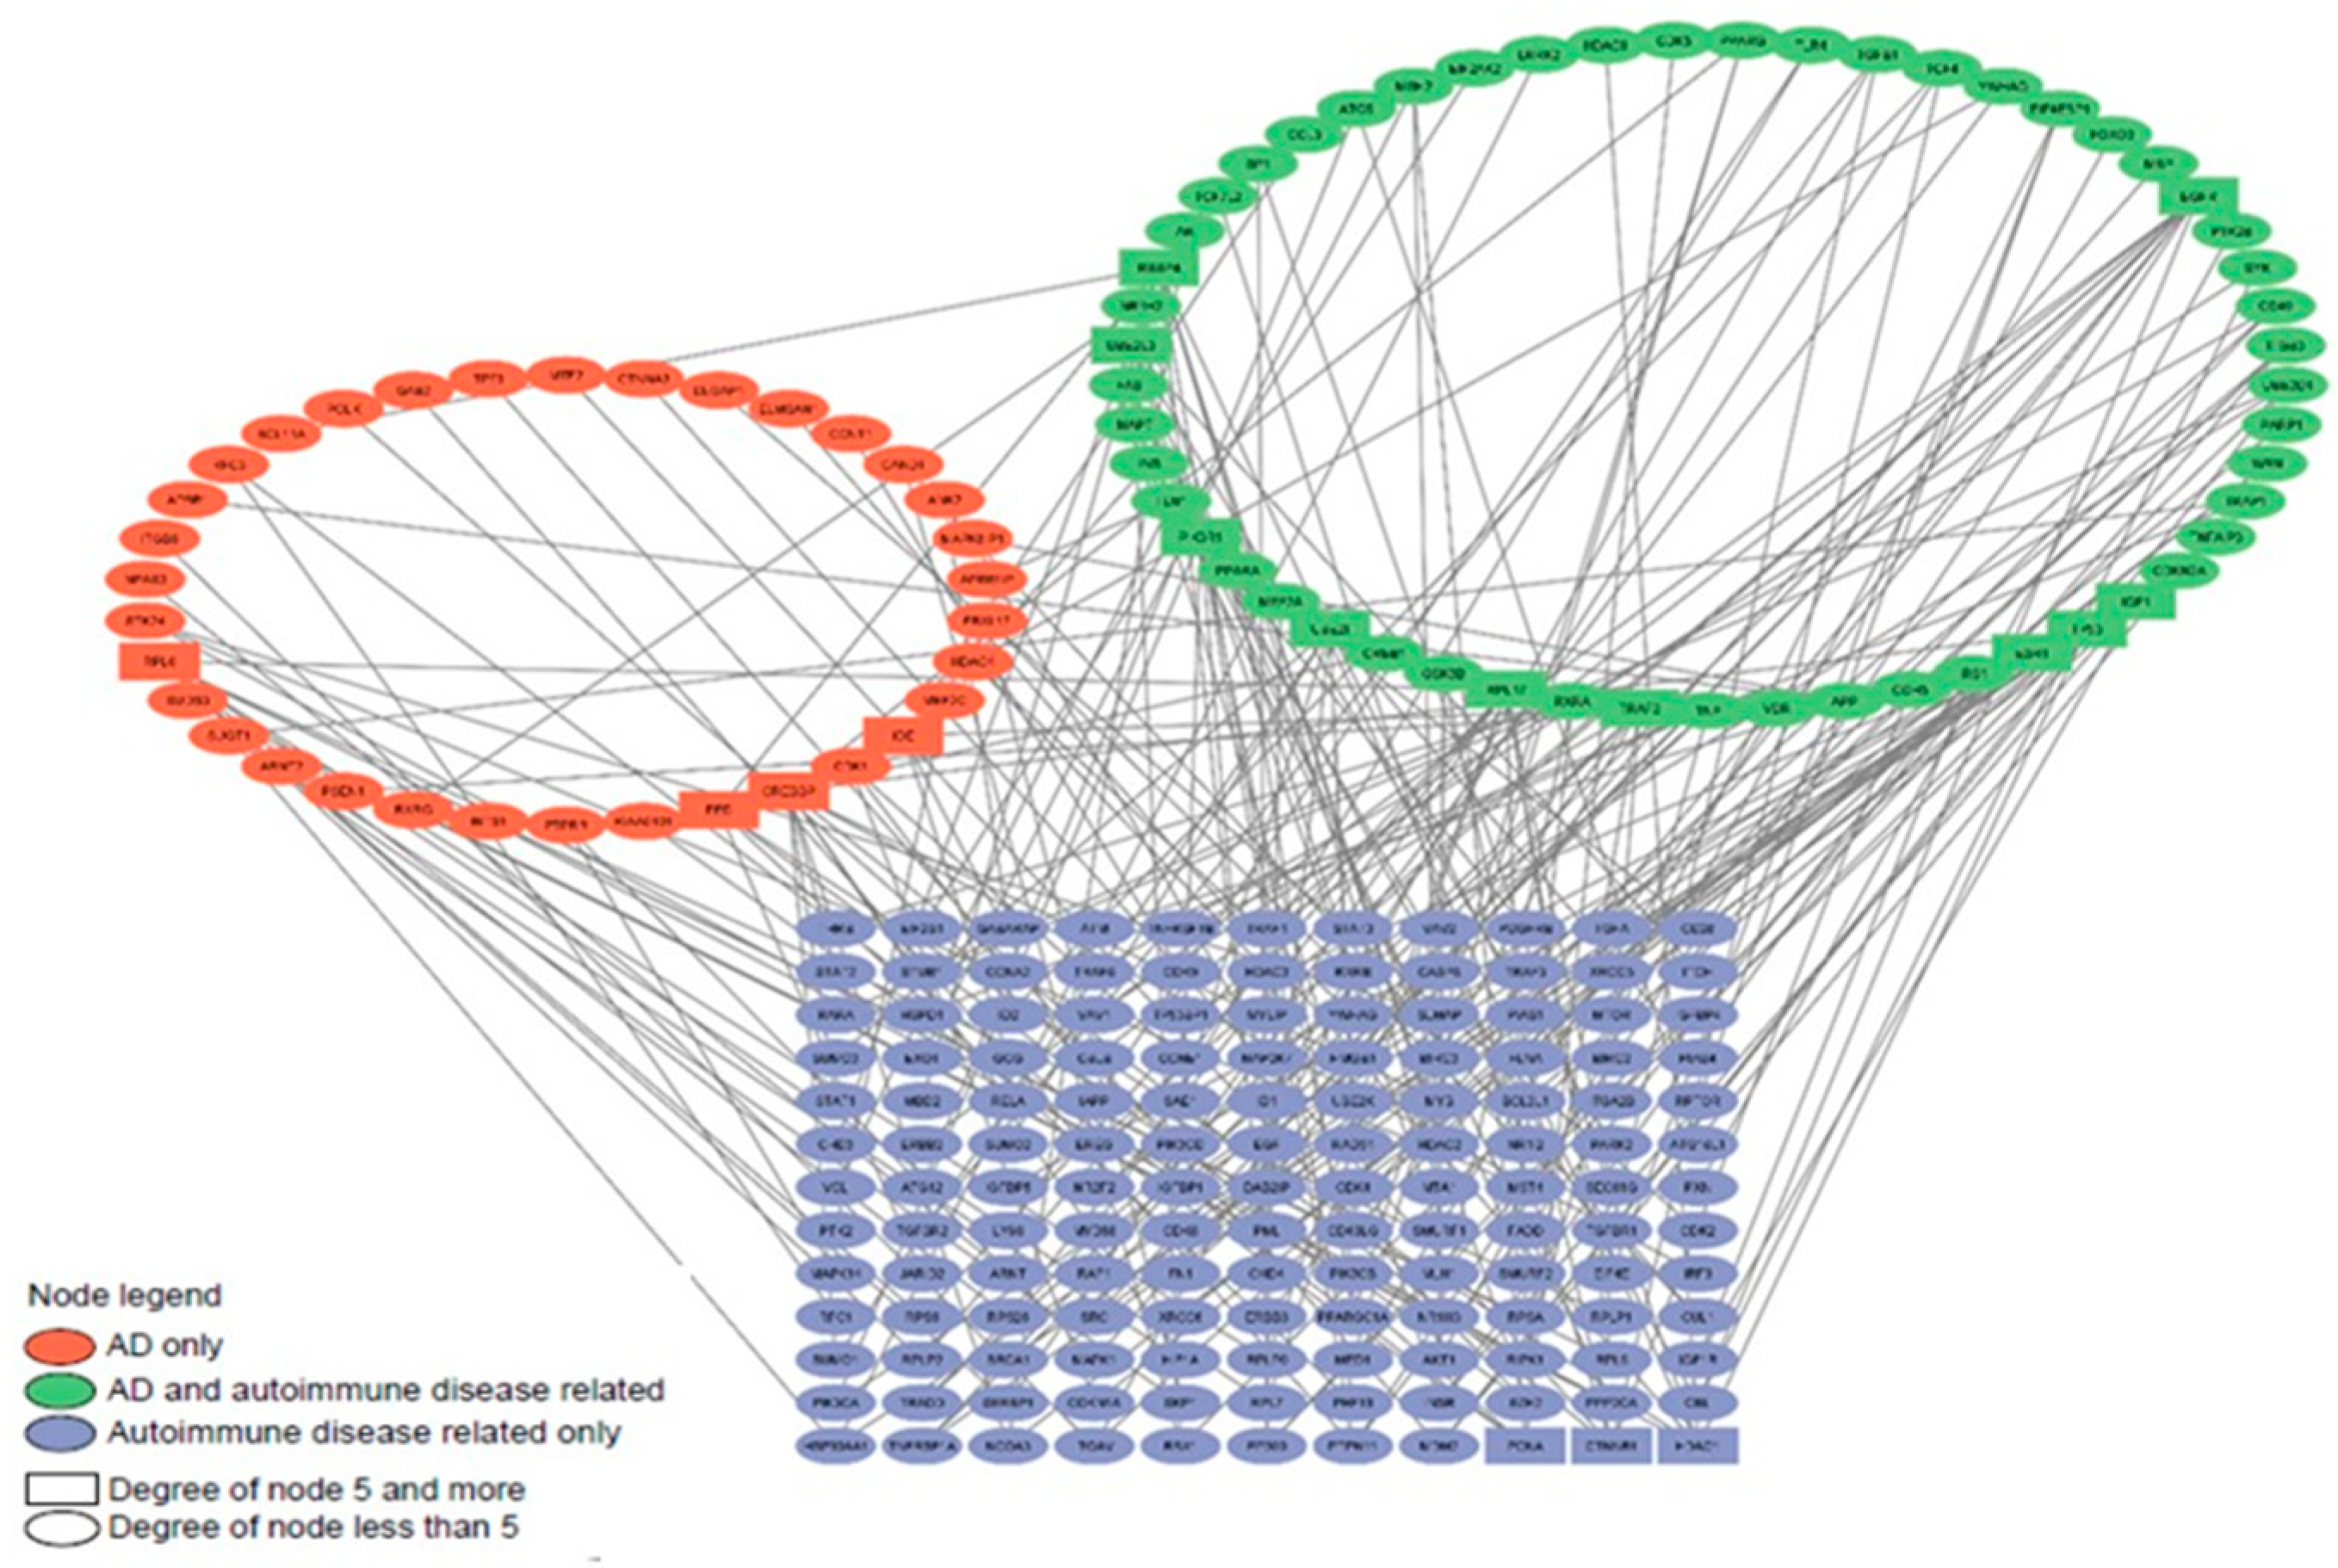
Figure 5.
A gene network representing genes predisposing to autism and developmental delay (NDD) and genes of autoimmune disorders. The left legend shows the color and degree of the nodes.
Figure 5.
A gene network representing genes predisposing to autism and developmental delay (NDD) and genes of autoimmune disorders. The left legend shows the color and degree of the nodes.
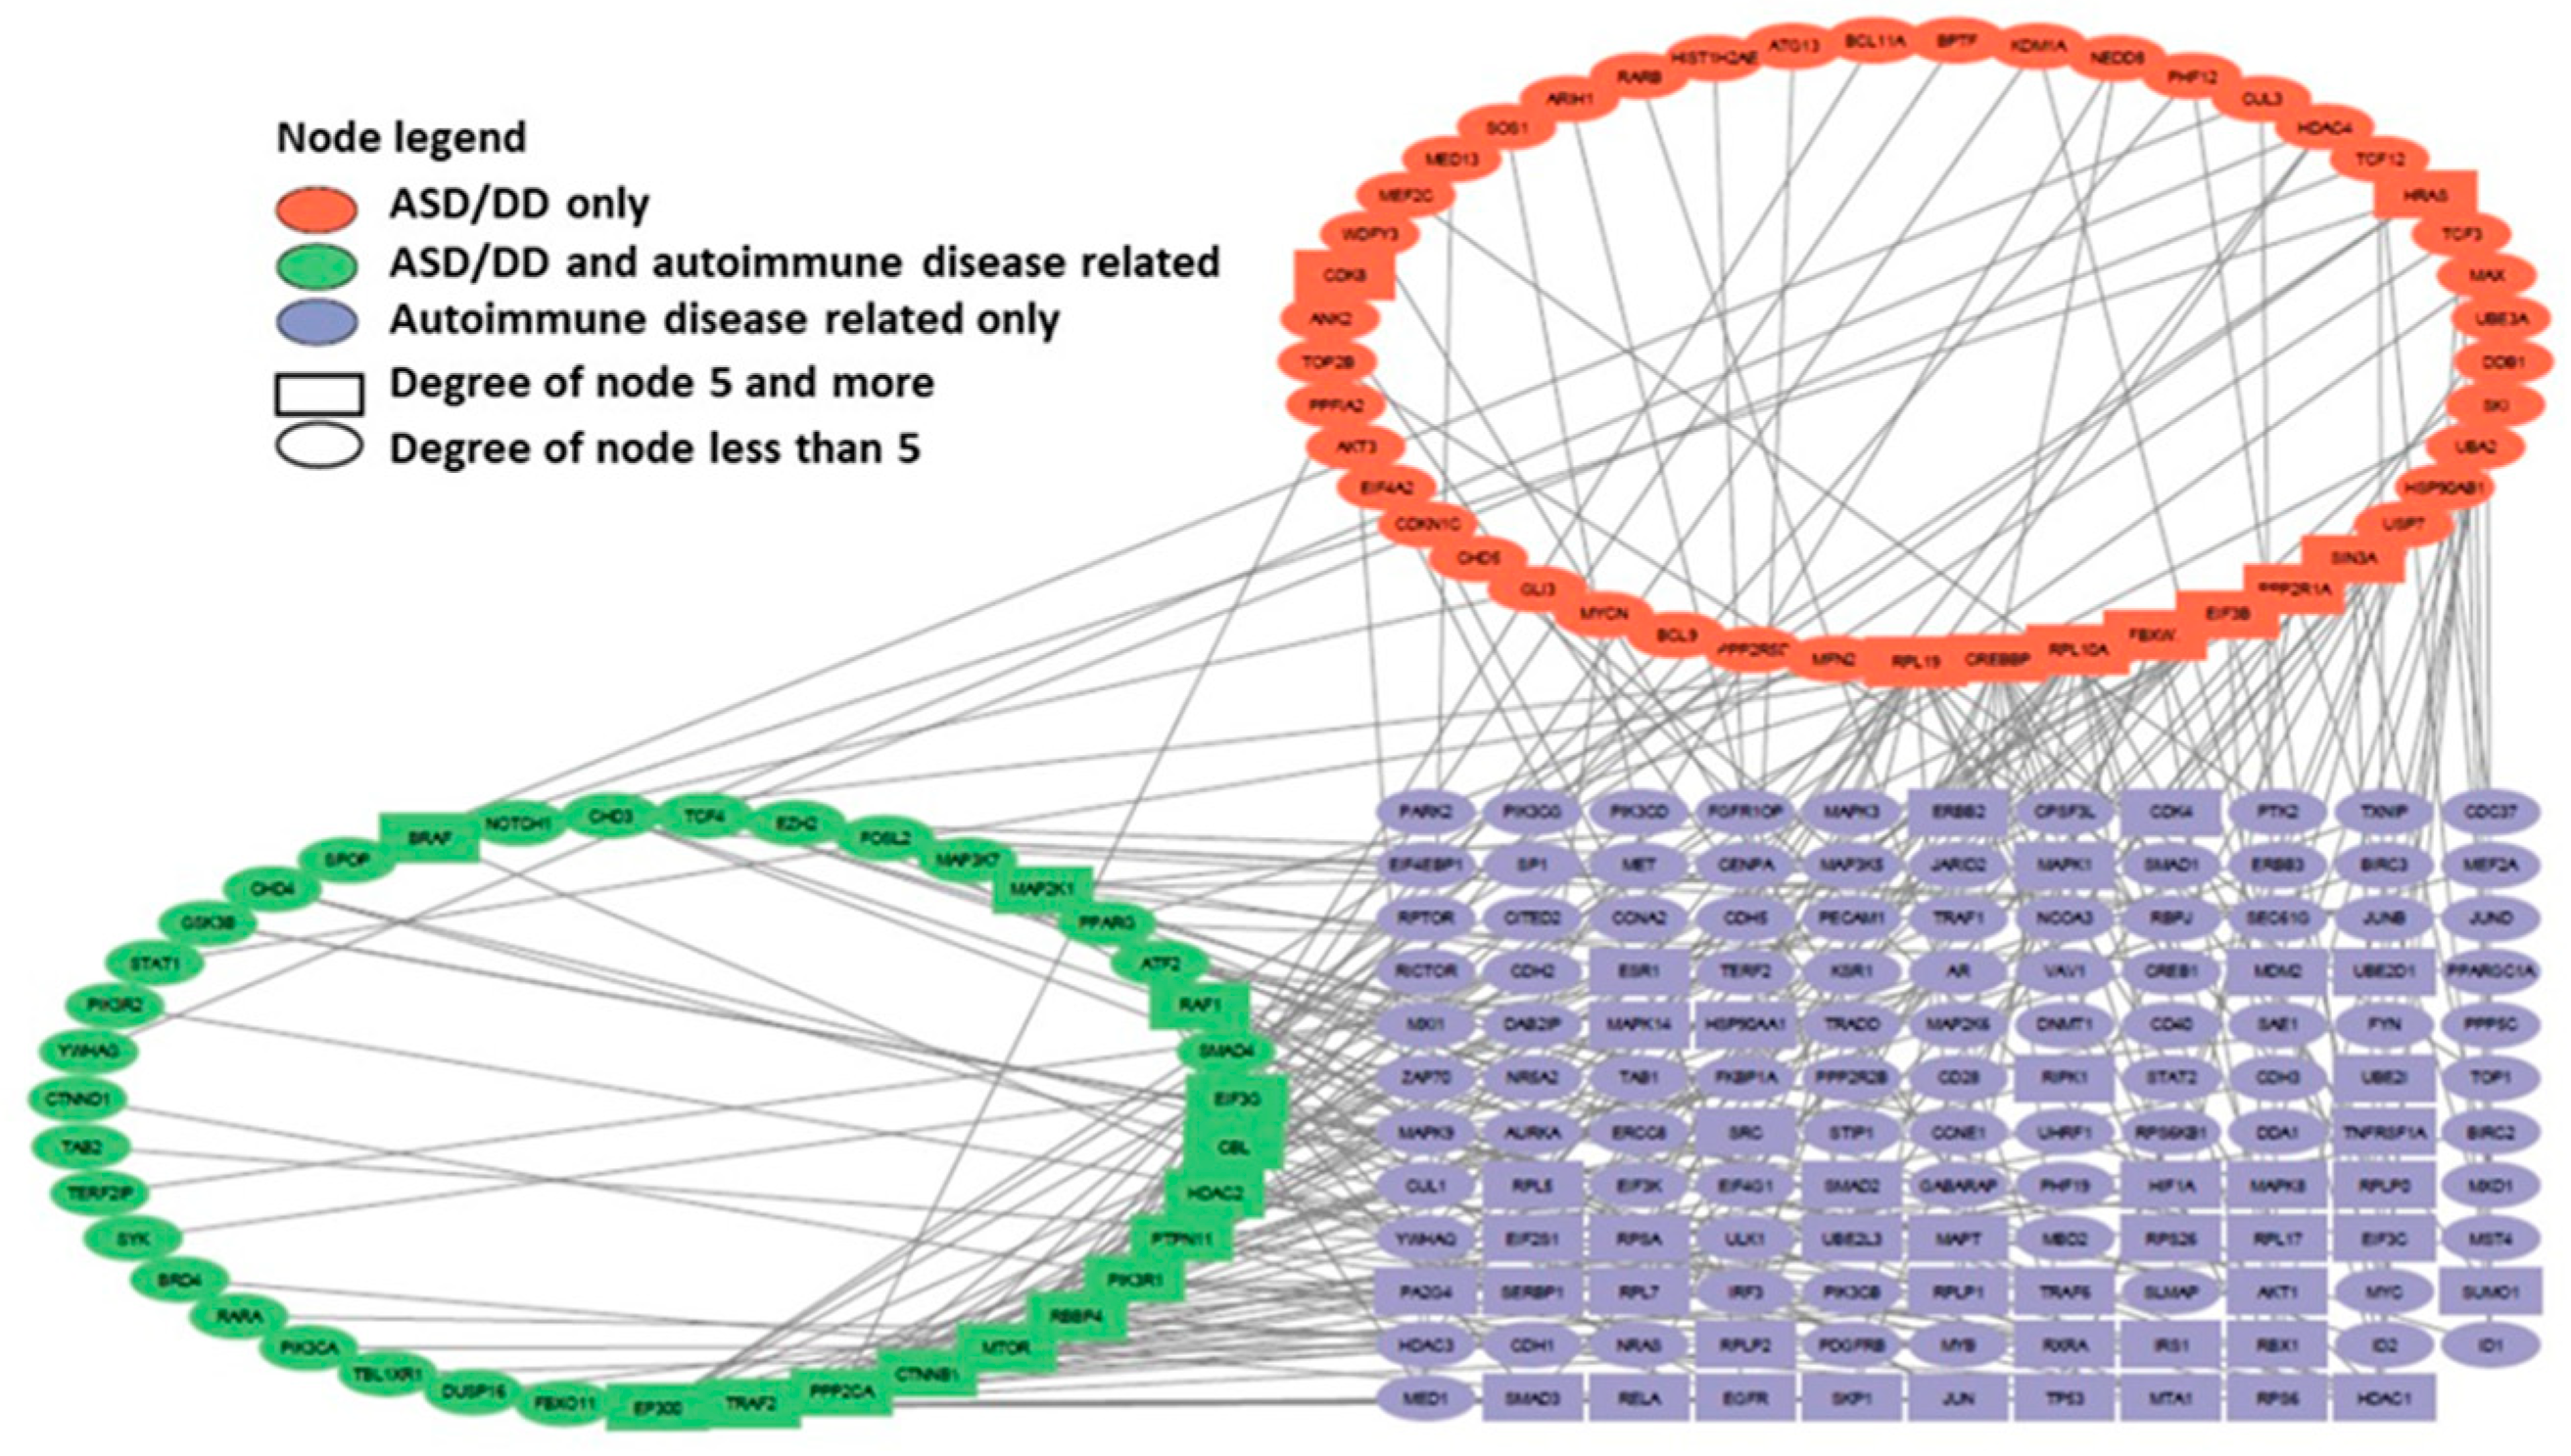
Figure 6.
Comparison of the most connected genes from the gene networks representing the interactions of genes predisposing to Alzheimer's disease and genes of autoimmune disorders (Figure 4) and genes associated with autism and developmental delay (NDD) and genes of autoimmune disorders (Figure 5).
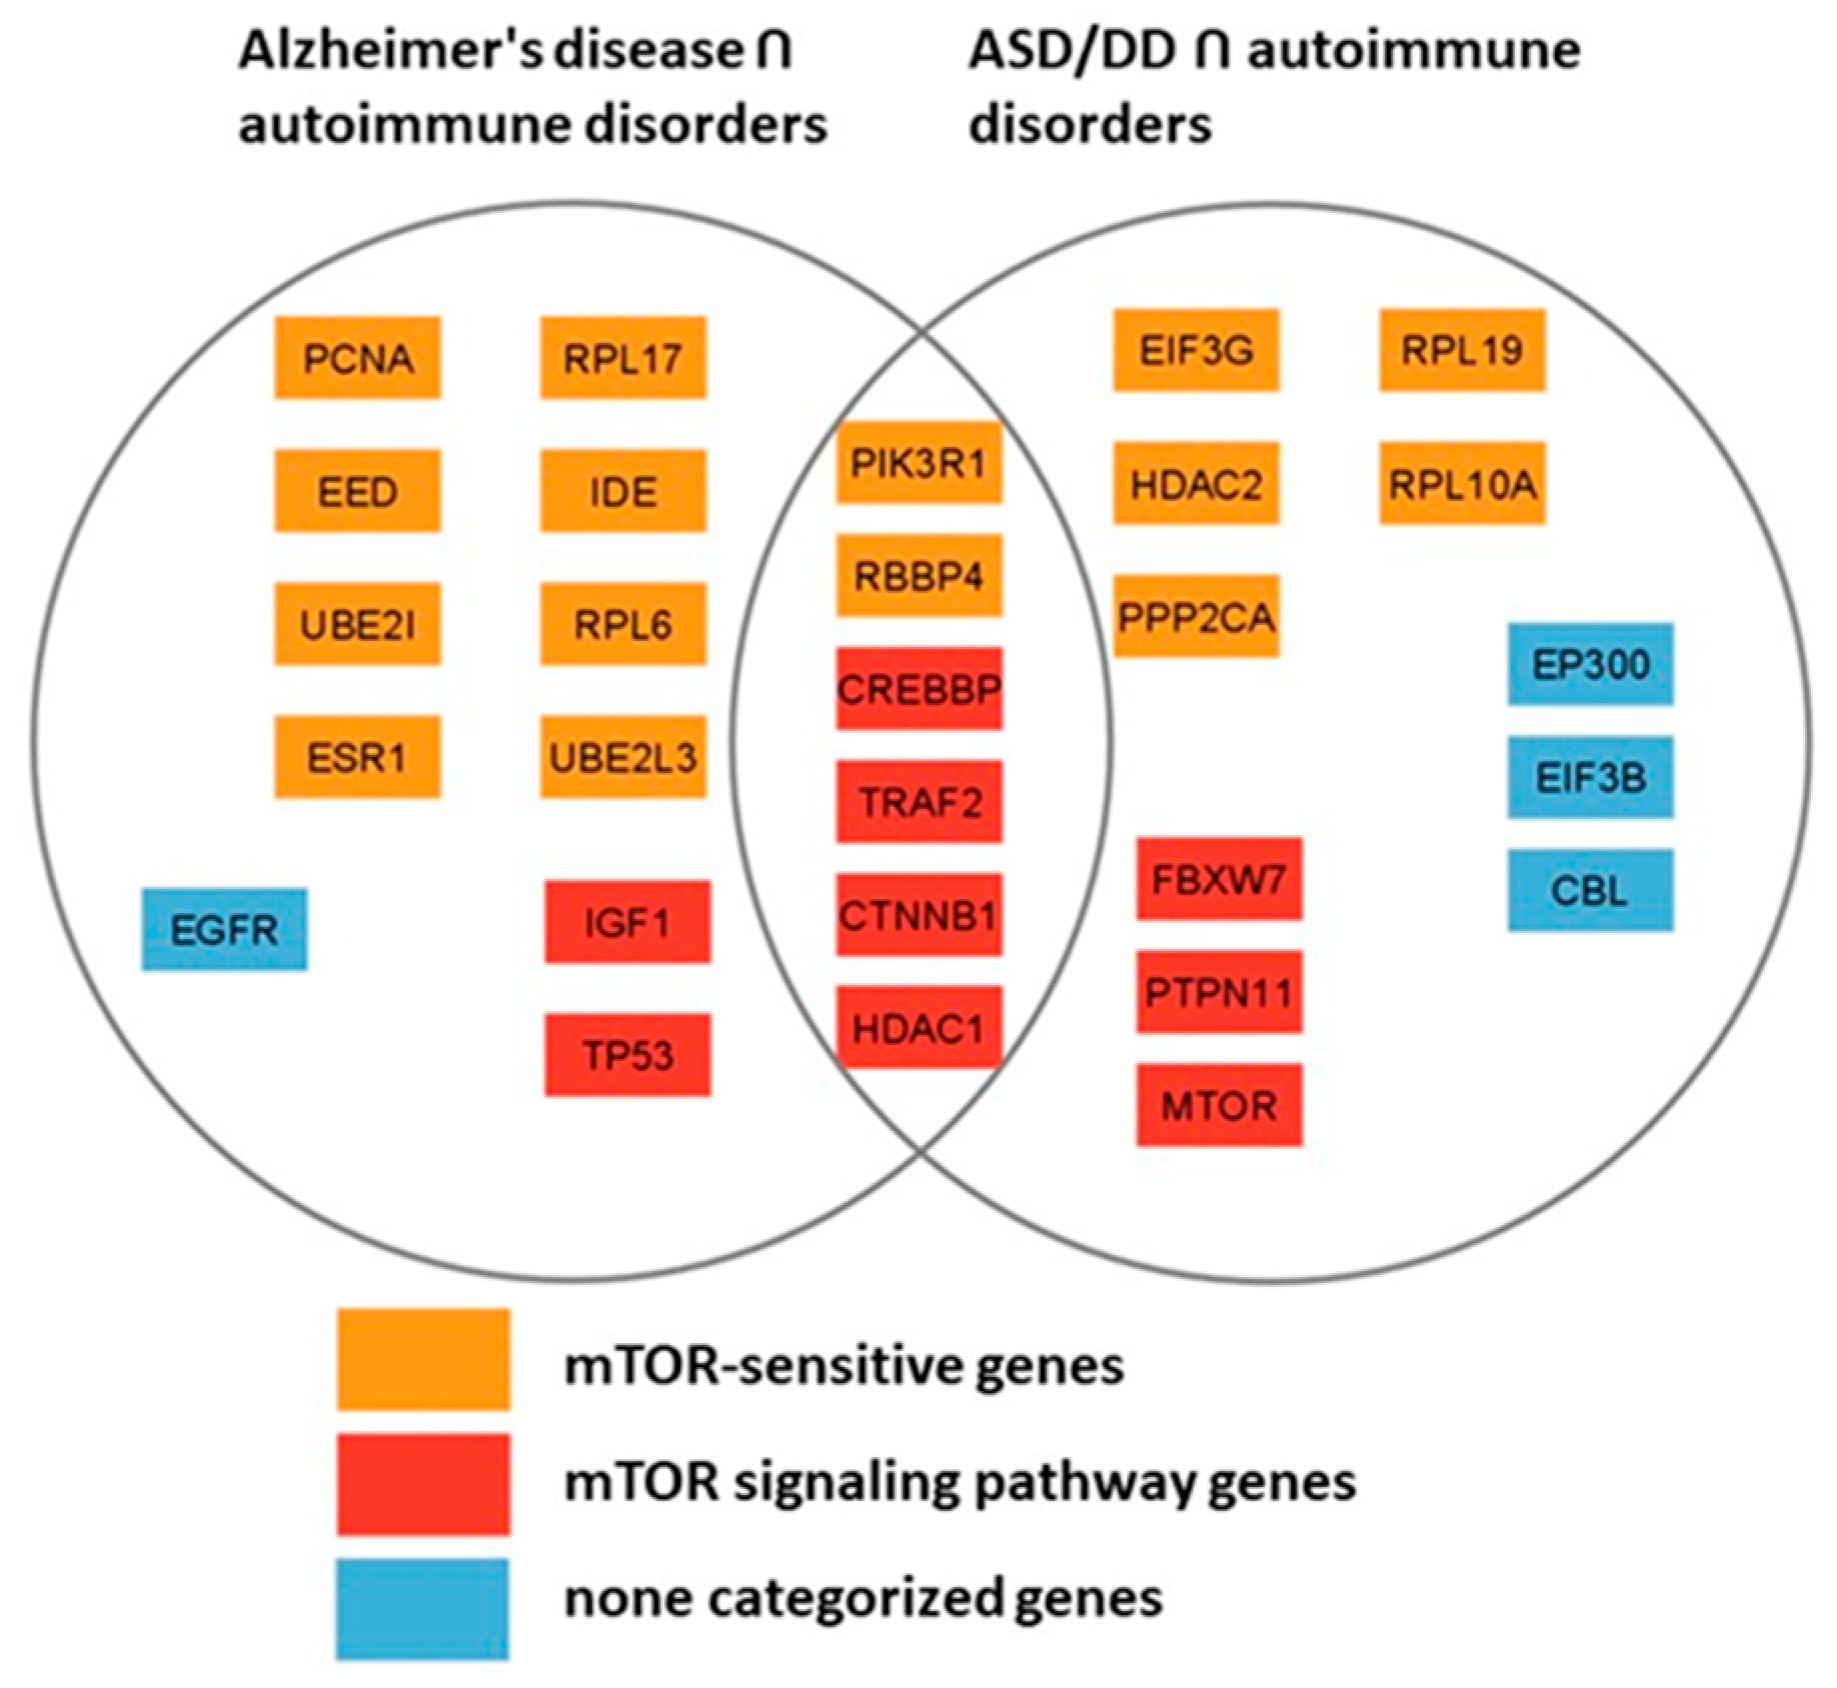
Figure 7.
An associative gene network representing the interactions of the main elements of the PI3K/Akt pathway and substances regulating their activity. On the left are Drug-type objects associated with Alzheimer's disease, but not associated with ASD; on the right are Drug-type objects associated with ASD.
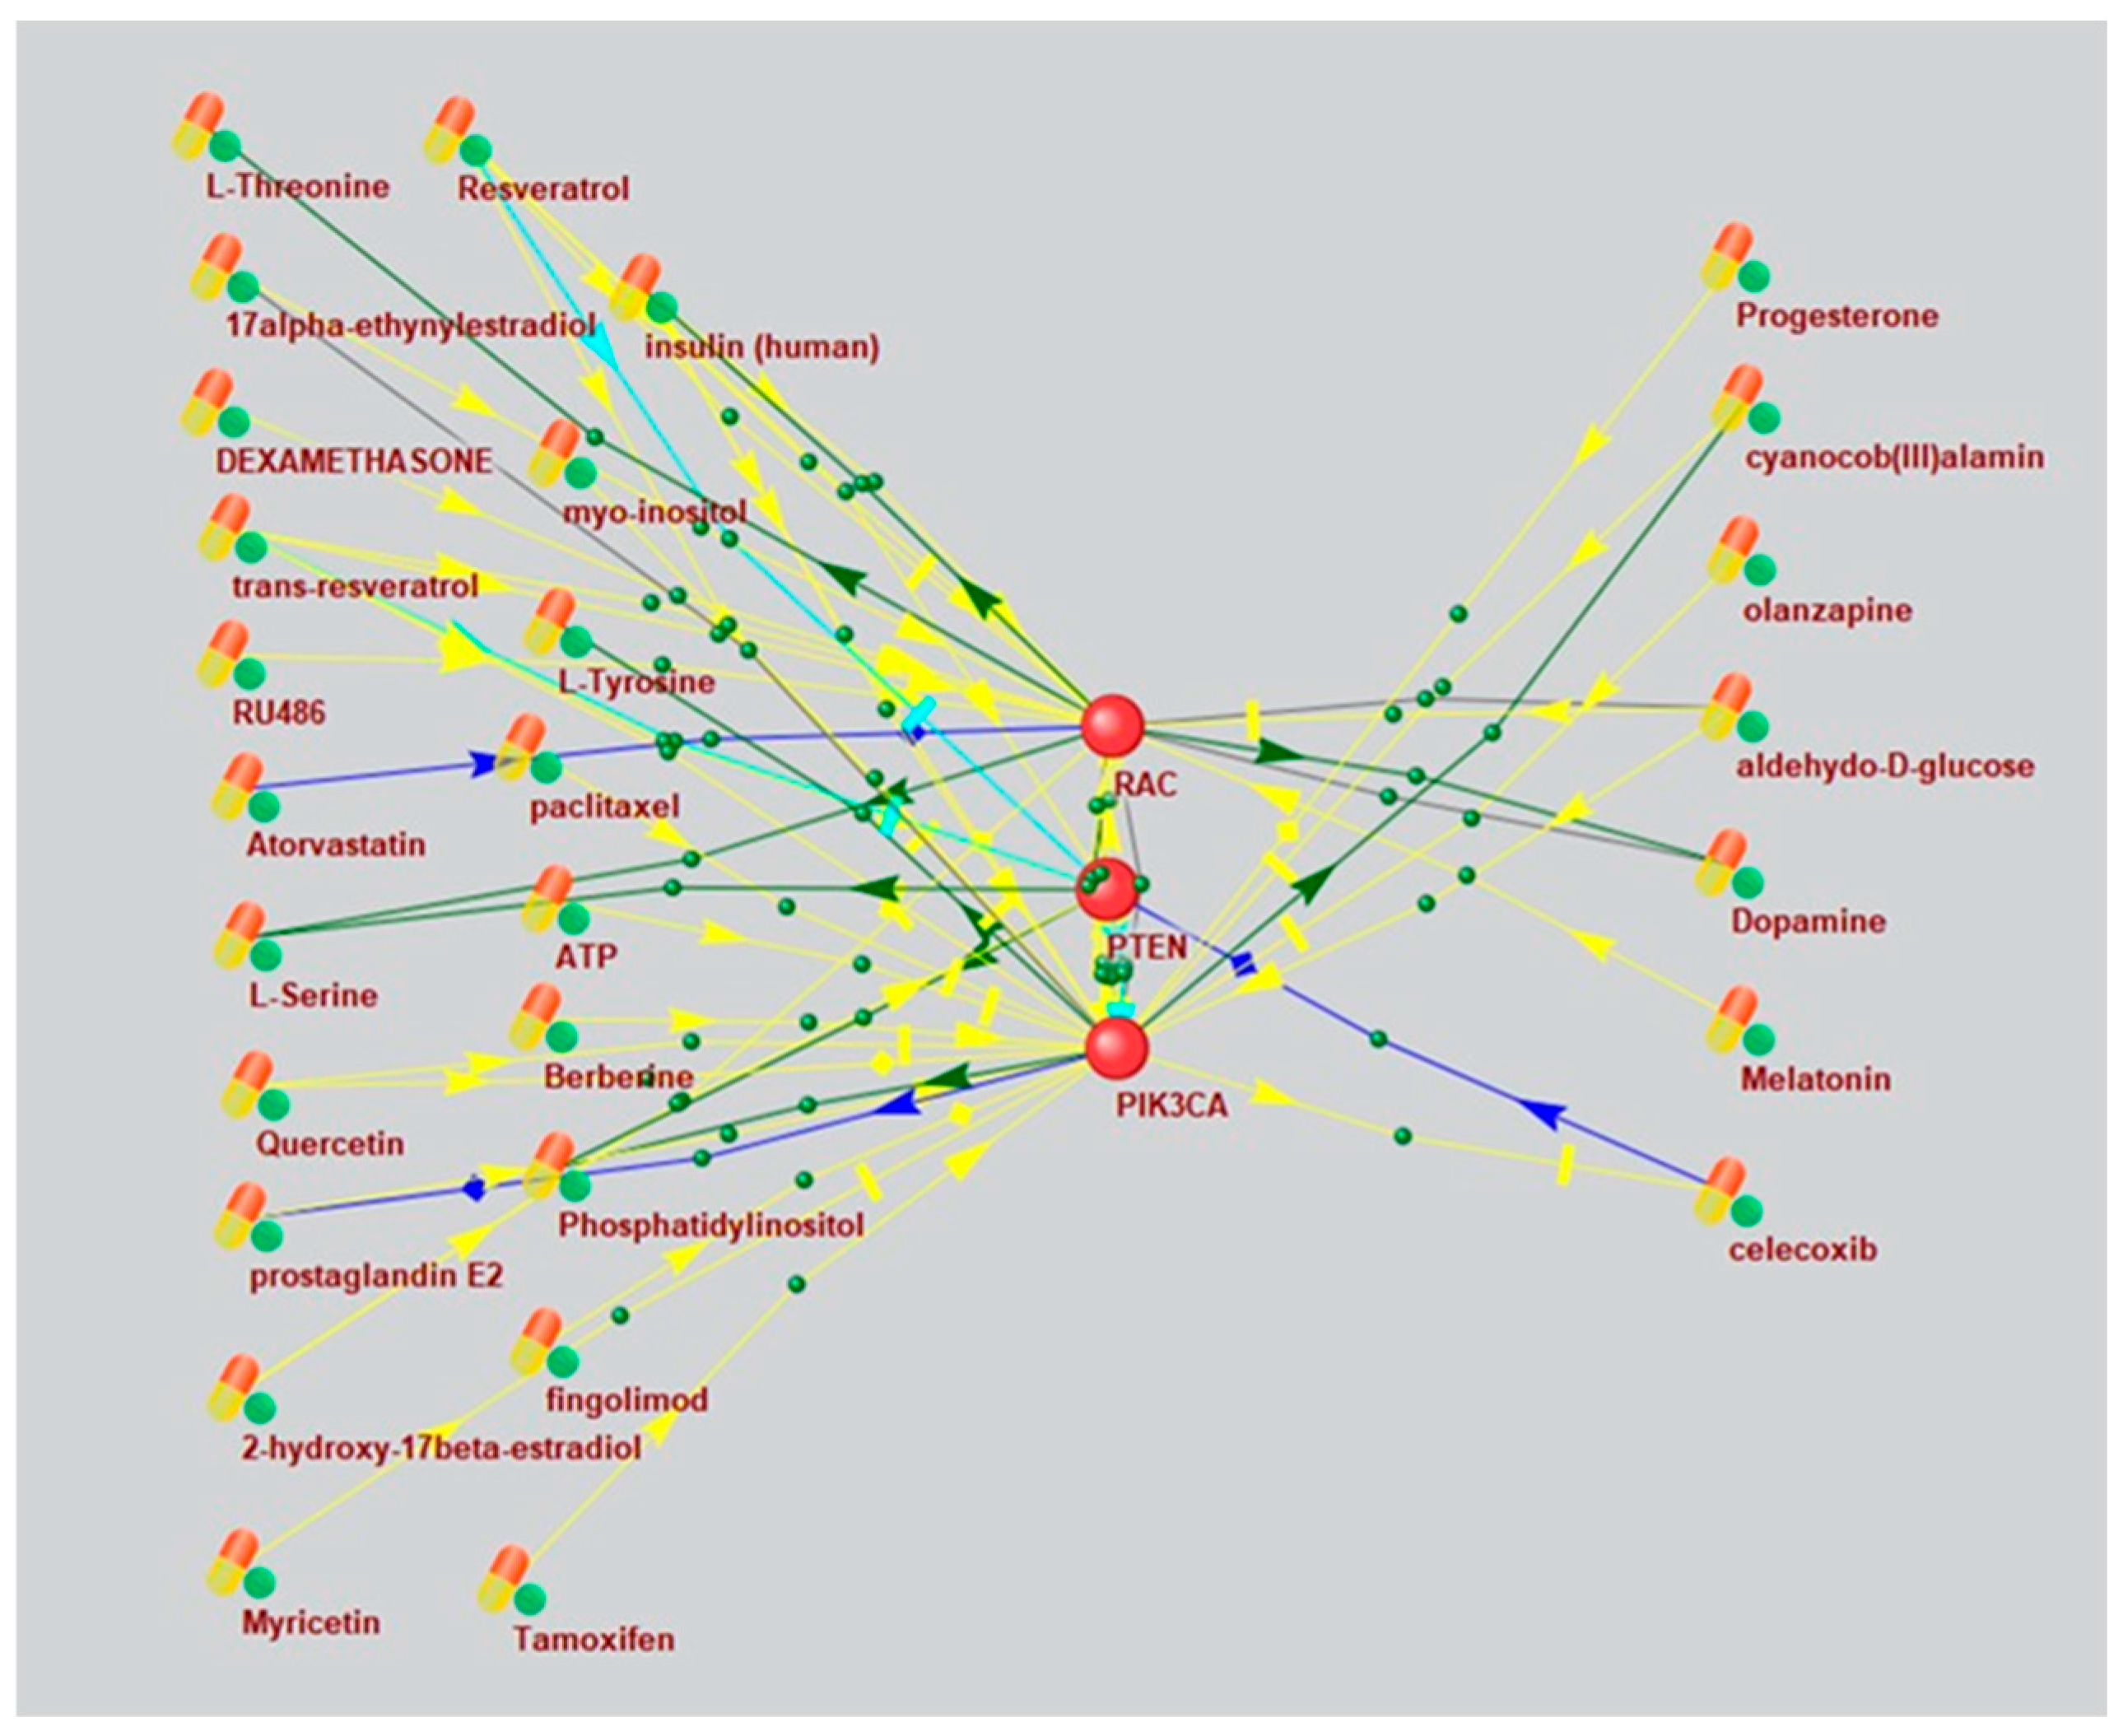
Figure 8.
An associative gene network representing the interactions of the main elements of the Ras pathway and substances regulating their activity. On the left are Drug-type objects associated with Alzheimer's disease, but not associated with ASD; on the right are Drug-type objects associated with ASD.
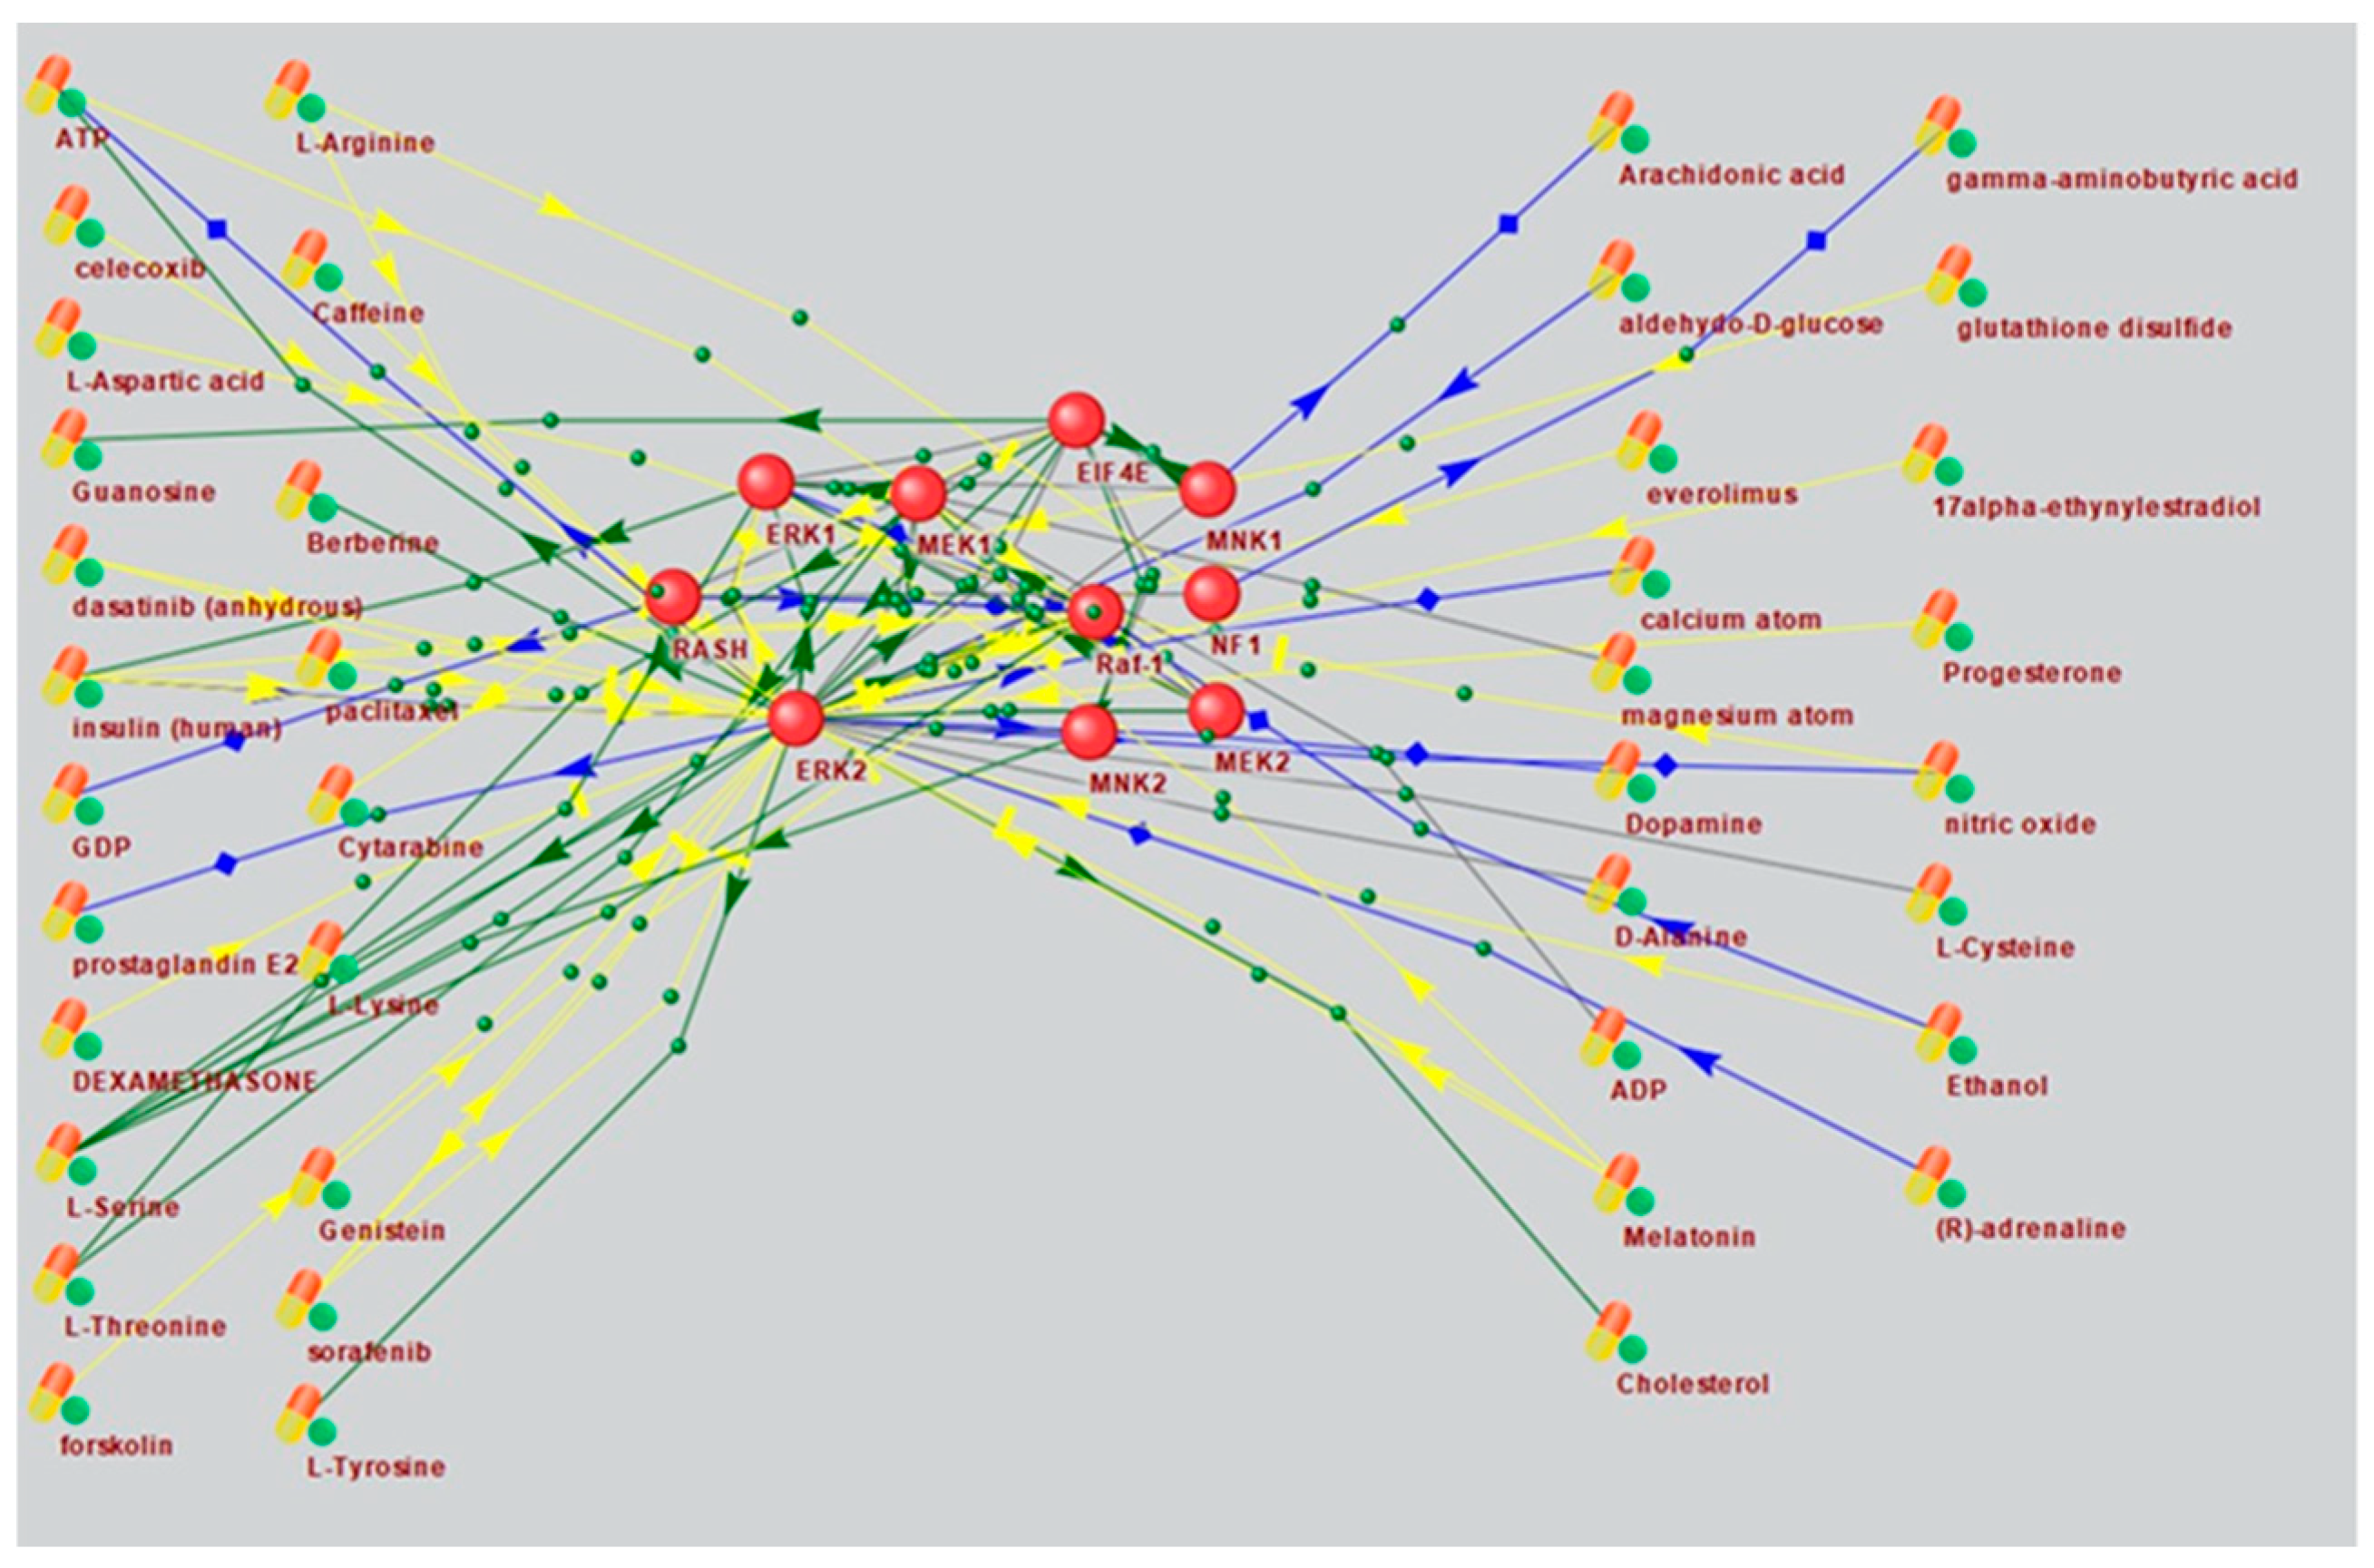
Figure 9.
An associative gene network representing the interactions of the main elements of the p38 MAPK pathway and substances regulating their activity. On the left are Drug-type objects associated with Alzheimer's disease, but not associated with ASD; on the right are Drug-type objects associated with ASD.
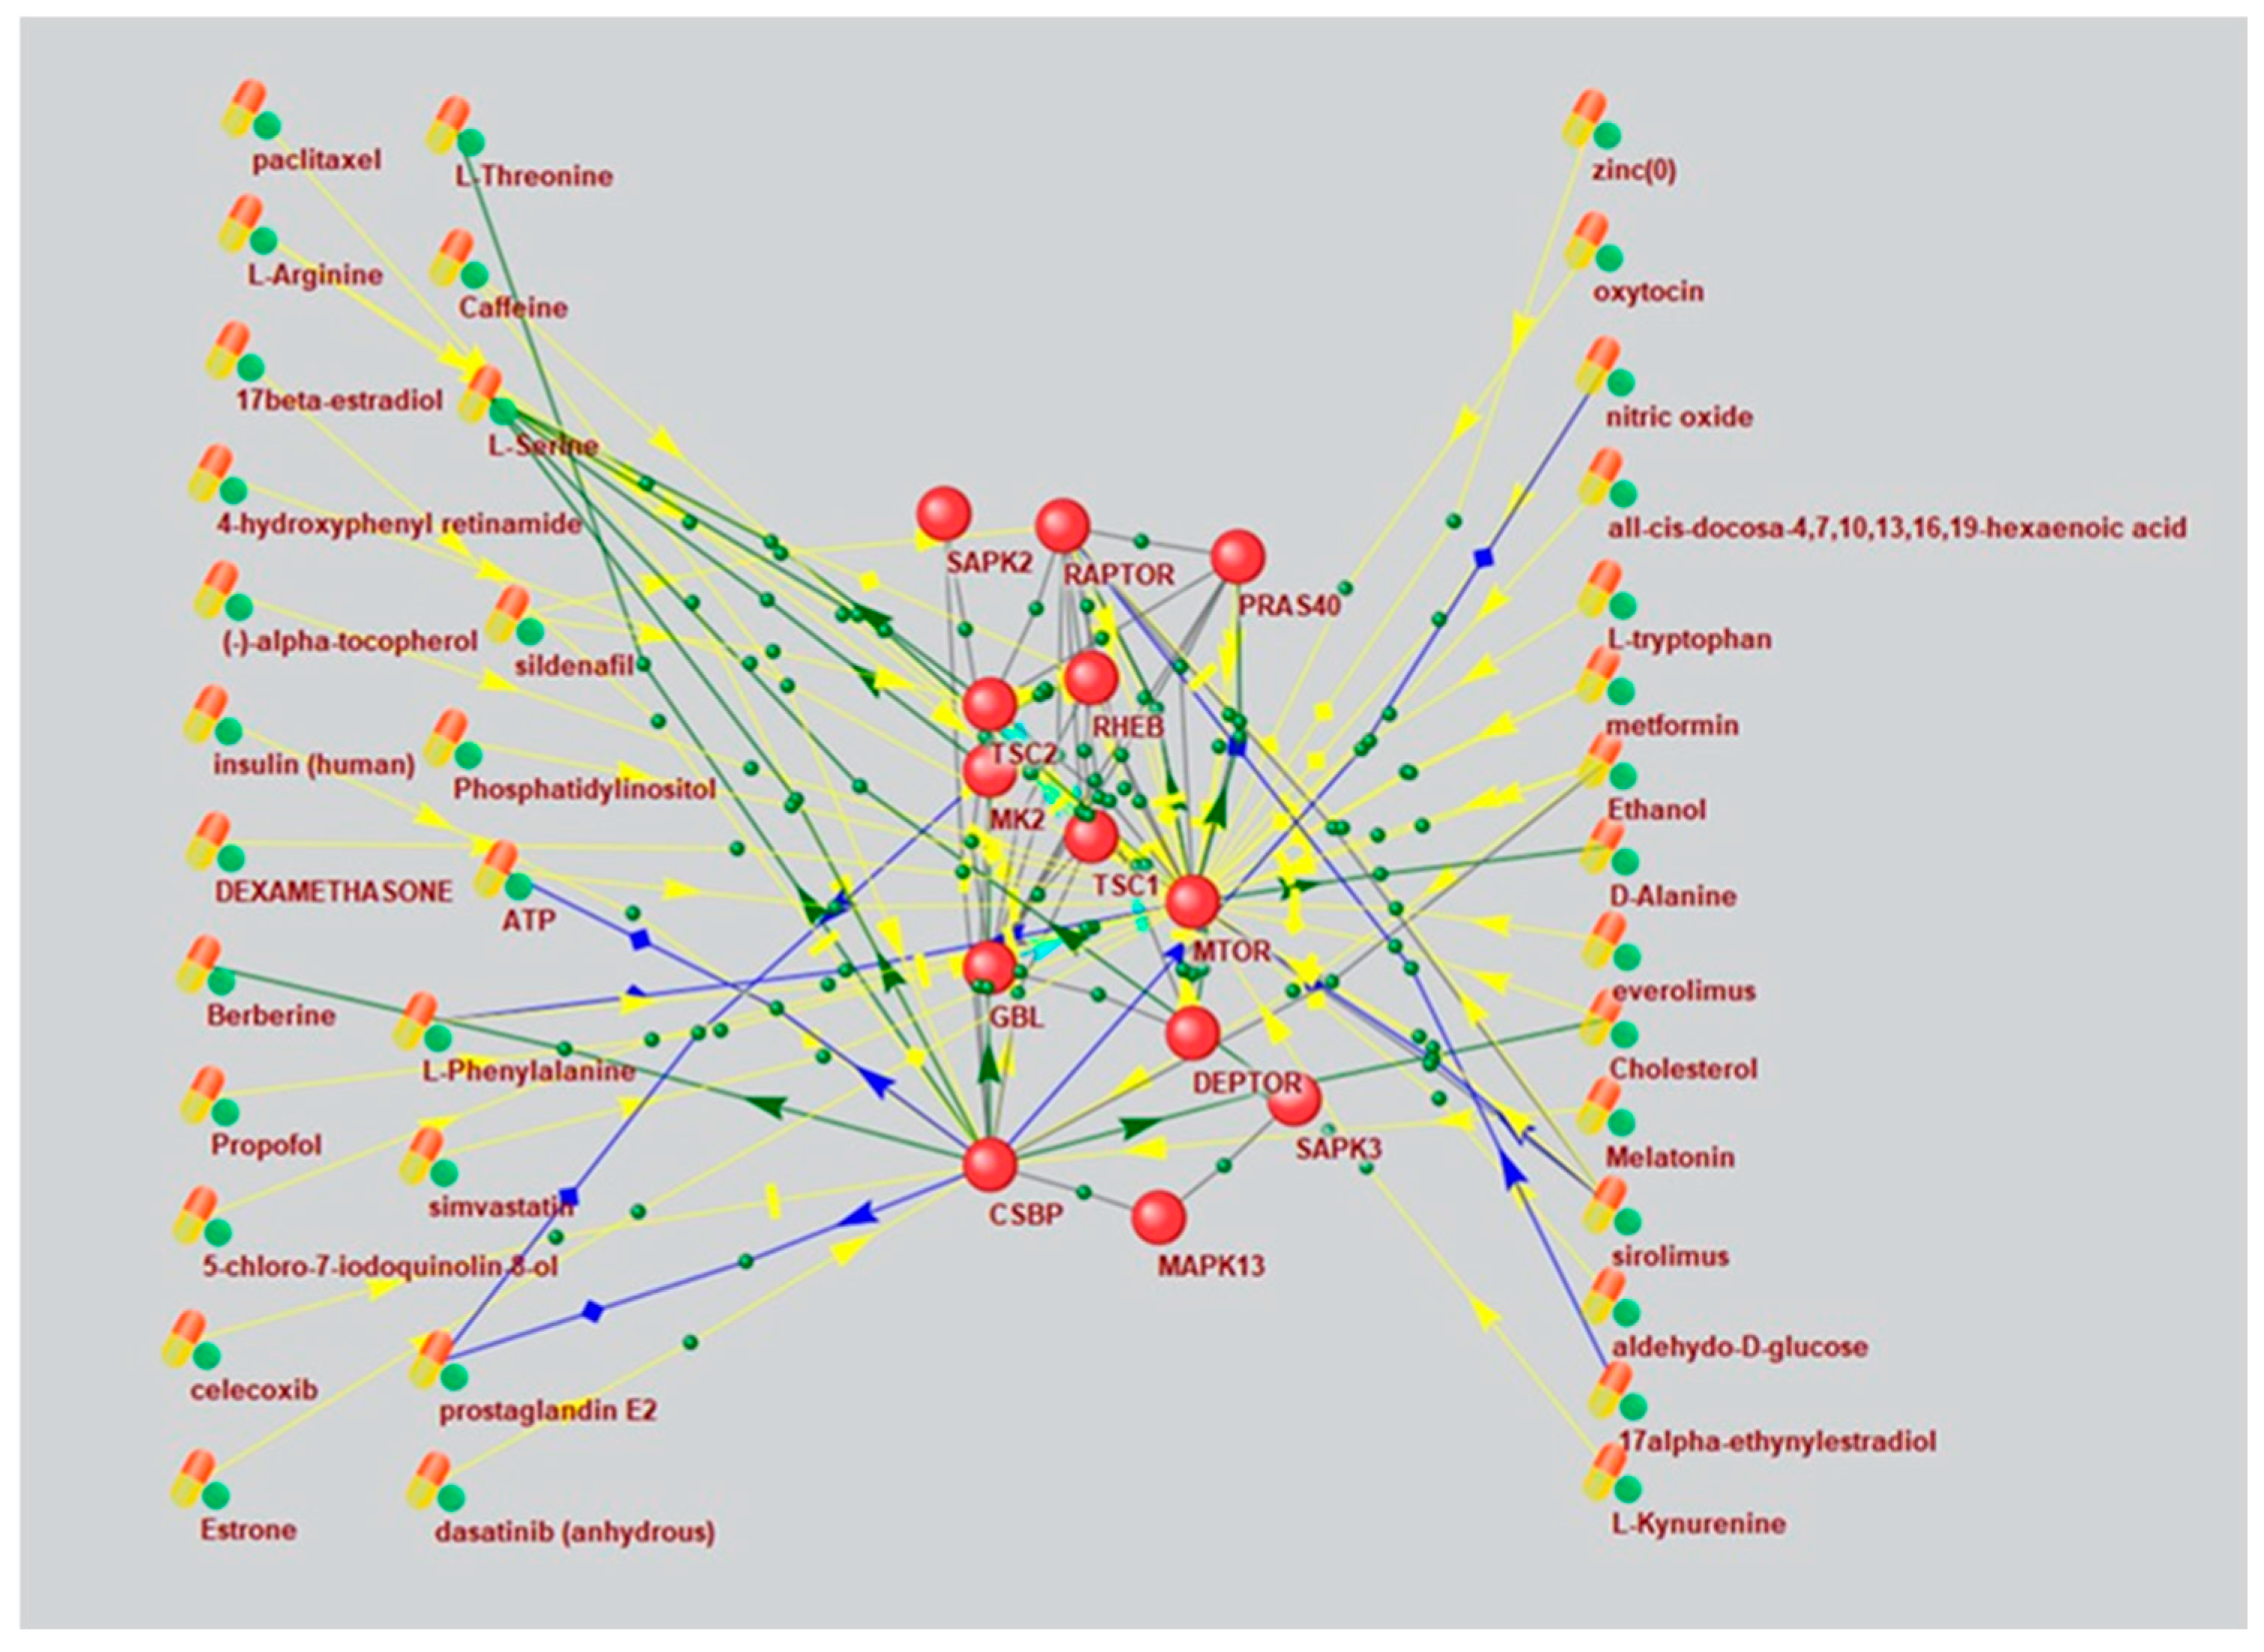

Table 1.
Average values of PAI and DI indices for genes involved in autism, neurodevelopmental disorders, Alzheimer's disease predispositions and mTOR signaling pathway.
Table 1.
Average values of PAI and DI indices for genes involved in autism, neurodevelopmental disorders, Alzheimer's disease predispositions and mTOR signaling pathway.
| Gene set number | Gene sets | PAI | DI |
| 1 | Genes implicated in autism susceptibility (from SFARI Gene database) [22] | 2.86 | 0.24 |
| 2 | Autism predisposition genes [20] | 2.80 | 0.16 |
| 3 | Neurodevelopmental disorders predisposition genes (NDD) [20] | 2.59 | 0.15 |
| 5 | Alzheimer's disease predisposition genes (from the ADVP database) [21] | 3.18 | 0.33 |
| 7 | Genes included in the mTOR signaling network [23] | 2.29 | 0.18 |
| 10 | All protein-coding human genes [24] | 3.29 | 0.38 |
Table 2.
PAI values and taxonomic units dating the corresponding phylostratigraphic age of genes.
| PAI | Phylostratum |
| 1 | Cellular Organisms |
| 2 | Eukaryota |
| 3 | Metazoa |
| 4 | Chordata |
| 5 | Craniata |
| 6 | Vertebrata |
| 7 | Euteleostomi |
| 8 | Mammalia |
| 9 | Eutheria |
| 10 | Euarchontoglires |
| 11 | Primates |
| 12 | Haplorrhini |
| 13 | Catarrhini |
| 14 | Hominidae |
| 15 | Homo |
| 16 | Homo sapiens |
Disclaimer/Publisher’s Note: The statements, opinions and data contained in all publications are solely those of the individual author(s) and contributor(s) and not of MDPI and/or the editor(s). MDPI and/or the editor(s) disclaim responsibility for any injury to people or property resulting from any ideas, methods, instructions or products referred to in the content. |
© 2025 by the authors. Licensee MDPI, Basel, Switzerland. This article is an open access article distributed under the terms and conditions of the Creative Commons Attribution (CC BY) license (http://creativecommons.org/licenses/by/4.0/).
Copyright: This open access article is published under a Creative Commons CC BY 4.0 license, which permit the free download, distribution, and reuse, provided that the author and preprint are cited in any reuse.


