Submitted:
20 September 2025
Posted:
23 September 2025
You are already at the latest version
Abstract
This study examined whether moving tactile stimuli to the soles induce body sway in a quiet stance. Fifteen healthy participants maintained a quiet stance. Tactile stimuli moving along the anterior-posterior (AP) or medio-lateral (ML) axis were provided to the soles of the feet. The center of pressure (COP) along the ML axis was dependent on the phase of the tactile stimuli moving along the ML axis when vision was unavailable. The direction of the body sway was opposite to the stimulus side. They must have perceived the body sway to the stimulated side. Based on this, when humans perceive the body sway along the ML axis, they sway the body to the direction contralateral to the stimulated side to compensate for the perceived body sway. The greater effect of the moving tactile stimuli on phase-dependent body sway, particularly when vision was unavailable, can be explained by the view that body sway in the ML axis, in accordance with the loci of the tactile sensation moving along the same axis, becomes unmasked when vision is absent. The total COP displacement during tactile stimulation moving along the AP axis was larger than that without stimulation, particularly when vision was unavailable. This can be explained by the view that, through intermodal reweighting, the contribution of tactile sensation to controlling body sway along the AP axis increases to compensate for the lack of visual input regulating COP displacement in this axis.
Keywords:
moving tactile stimuli
; quiet stance
; body sway
; center of pressure
; intermodal reweighting
; vision
; tactile sensation
1. Introduction
When humans maintain quiet stance, the only contact points between the body and the ground are the soles of the feet. The soles have cutaneous sensory receptors that perceive the weight loading on the ground. Thus, cutaneous sensation in the soles plays a crucial role in perceiving body weight distribution and body sway during quiet stance.
Previous findings regarding the contribution of the stationary tactile sensation of the soles to the body sway in a quiet stance must be the evidence supporting this view. For example, cutaneous anesthesia to the soles increased the displacement and velocity of the center of pressure (COP) in a quiet stance when vision was occluded [1]. The COP displacement in a quiet stance increased when tactile sensation to the soles was masked with an ischemic nerve block [2]. Acceleration of the lumbar deviation in a quiet stance was greater in patients with diabetic peripheral neuropathy who suffered impaired tactile sensation [3]. The recovery from leftward body sway in a quiet stance was greater when the tactile sensation of the soles was masked [4]. Tactile stimuli to the soles, masking tactile sensation, increased the COP displacement and velocity in a quiet stance [5].
Humans need to perceive the changes in weight distribution of the soles over time to maintain balance in quiet stance. To achieve this, they must be sensitive to the change in the tactile sensation of the soles. Moving tactile stimuli should simulate the temporal changes in weight distribution that occur when humans maintain quiet stance. Based on this view, in the present study, the change in the body sway induced by the moving tactile stimuli to the soles was examined.
Previous studies investigated the cortical activity during the moving tactile stimuli to the body parts [6,7]. Moving tactile stimuli to the body parts induced cortical activity in the primary sensory cortex, secondary sensory cortex, posterior parietal cortex, and hMT+/V5 [8,9,10,11,12]. Based on these previous findings, the moving tactile stimuli to the soles may influence the postural control in quiet stance via the cortical response to the stimuli.
Supporting this view, the COP rhythmically displaced along the medio-lateral (ML) axis along with the phase of the moving tactile stimuli [13]. In this previous study, the loci of the stimuli on the soles moved to mimic the change in the weight distribution during gait. Those stimuli moved both along the anterior-posterior (AP) and ML axes over time. Thus, it is not determined whether the effect observed in this previous study is due to the moving tactile stimulus along the ML or AP axis. In the present study, we examined the body sway in a quiet stance induced by the tactile stimuli moving along the AP axis and that induced by the stimuli moving along the ML axis separately. This allows us to distinguish the effect of the tactile stimuli moving along the AP axis from that moving along the ML axis.
2. Materials and Methods
2.1. Participants
The participants were 15 healthy males aged 31.7 ± 7.8 years. There are gender differences in physical characteristics, motor performance [14,15], and postural control [16]. The inter-individual variability of measures representing postural control in females is greater than that in males [17]. Based on those previous findings, to exclude the variability of postural responses caused by gender differences, and to minimize the inter-individual variability of postural control, only males were recruited. The participants had no history of neurological or musculoskeletal diseases. Two of our participants were left-footed, 12 were right-footed, and one was ambidextrous, according to the revised version of the Waterloo Footedness Questionnaire [18,19]. We obtained written consent from all participants before they participated in the study. The experiment was approved by the ethics committee of Osaka Prefecture University (Approved number: 2021-110).
2.2. Apparatus
The participants wore liquid crystal goggles to occlude their vision (T.K.K.2275; Takei Kiki, Tokyo). Earplugs were placed in the ears, and an earmuff was placed over the ears to minimize unnecessary auditory input. A geometric pattern with 80 cm height and 150 cm width was presented on a vertical wall 1 m in front of the participants. A moving tactile stimulator (S-20008; Takei Kiki, Tokyo) was placed on the ground [13,20]. The device consisted of 16 vibrators attached to the support surface of each foot (Figure 1). Each vibrator vibrated at the frequency of 100 Hz. The vibration devices were placed under the soles while the participant maintained a quiet stance. Each one of the strain gauges was placed at each corner of the rectangular platform, and the strain of the platform at each corner was measured. Using the signals from those four strain gauges, the COP was calculated.
2.3. Procedure
The participants maintained a quiet stance on the support surface of the moving tactile stimulator. Their arms were resting comfortably at their sides. The positions of the feet were finely adjusted immediately before each session so that all the vibration devices were under the soles. The foot positions relative to the positions of the vibration devices are shown in Figure 1. The participants gazed at a geometric pattern presented on a wall 1 m in front of them. In the sessions with visual occlusion (VO), the glass of the goggles was opaque so that vision was occluded. In the sessions without visual occlusion (non-VO), the glass was transparent so that vision was available. Tactile stimuli moving along the AP or ML axis were provided during the stimulus sessions (AP and ML sessions), but not during the control session. In total, we conducted six sessions: VO and non-VO for the control and stimulus sessions (AP and ML sessions). The order of these six sessions was randomly assigned to each participant. The interval between the sessions was four minutes.
2.4. Moving Tactile Stimuli
Tactile stimuli moving along the AP axis were provided in the AP session (Figure 2). Twelve stimulus phases were involved in each cycle of the stimuli. The duration of each phase was 83 ms. In each cycle of the moving tactile stimuli, the stimuli started from the heels, and they began moving toward the toes (from phase 1 to 6). When they reached phase 6, they began moving toward the heels (from phase 7 to 12). The stimuli at the most frontal loci appeared in phase 7. The stimuli at the most back loci appeared in phase 1. In this session, each cycle of the moving tactile stimuli lasted 994 ms. This cycle was repeated 40 times in each session.
Tactile stimuli moving along the ML axis were provided in the ML session (Figure 3). Fourteen stimulus phases were involved in each cycle of the stimuli. The duration of each phase was 71 ms. In each cycle of the moving tactile stimuli, the stimuli started from the leftmost column and moved to the right (from phase 1 to 7). When they reached the rightmost column, they began to move toward the left (from phase 8 to 14). The stimuli at the leftmost loci appeared in phase 1. The stimuli at the rightmost loci appeared in phase 8. Each cycle of the moving tactile stimuli lasted 996 ms. The cycle repeated 40 times in each session.
2.5. Data Analysis
The COP displacement along the AP axis is COPy, and that along the ML axis is COPx. The total COP displacement in each session was calculated to represent the amount of the body sway in each session. The mean COP in each session was calculated to represent the body position. The z-scores of the mean COP and total COP displacement were calculated. The mean COP or total COP displacement in each session was subtracted from the overall average across sessions and then divided by the standard deviation of the session-wise values across sessions. A positive z-score of the COP indicates a displacement toward the right or anterior direction, while a negative z-score indicates a displacement toward the left or posterior direction. The mean COP in each phase of the stimulus cycle was calculated. The z-score of the mean COP in each phase of the stimulus cycle was calculated.
Two-way repeated measures ANOVAs were conducted to test the main effect of the stimuli (control, AP, and ML) and vision (VO and non-VO) on the z-scores of the mean COP and total COP displacement. In addition, repeated measures ANOVAs were conducted to test the main effect of the stimulus phases on the COP. The result of Greenhouse–Geisser’s correction was reported whenever Mauchly’s test of sphericity was significant. When there was a significant interaction between the main effects, we conducted a test of the simple main effects. Bonferroni’s test was conducted for multiple comparison test (Bonferroni’s test). The alpha level was .05. All statistical analyses were carried out using Excel Tokei ver. 3.23 (Social Survey Research Information, Tokyo). All data in results were expressed as means and standard errors of the mean.
3. Results
3.1. COP in Each Phase of Tactile Stimuli
The COPx in each phase of the tactile stimuli moving along the AP axis is shown in Figure 4A and 4B. There was no significant main effect of the phase in either the VO [F (4.886, 68.407) = 0.758, p = 0.580] (Figure 4A) or non-VO [F (2.877, 40.282) = 0.871, p = 0.460] (Figure 4B). The COPy in each phase of the tactile stimuli moving along the AP axis is shown in Figure 4C,D. There was no significant main effect on the phase in either the VO [F (3.093, 43.301) = 0.541, p = 0.662] (Figure 4C) or non-VO [F (3.109, 43.529) = 0.403, p = 0.758] (Figure 4D).
The COPx in each phase of the tactile stimuli moving along the ML axis is shown in Figure 5A,B. There was no significant main effect of the phase in the non-VO [F (3.499, 48.986) = 0.563, p = 0.668] (Figure 5B). There was a significant main effect of the phase in the VO [F (4.477, 62.673) = 3.359, p =0.012] (Figure 5A). Multiple comparison test revealed that the COPx in the phase 2 was significantly deviated rightward than the phase 8 (p = 0.020) or phase 9 (p = 0.006). Similarly, phase 3 was significantly deviated to the rightward direction compared with phase 9 (p = 0.044), and phase 4 deviated to the rightward direction compared with phase 9 (p = 0.017). The COPy in each phase of the tactile stimuli moving along the ML axis is shown in Figure 5C,D. There was no significant main effect of the phase in the VO [F (3.583, 50.156) = 0.224, p = 0.908] (Figure 5C). There was no significant main effect of the phase in the non-VO [F (3.235, 45.287) = 0.329, p = 0.819] (Figure 5D).
3.2. Total COP Displacement
The total COPx displacement is shown in Figure 6A. There was a significant main effect of vision [F (1, 14) = 5.024, p = 0.042]. There was no significant main effect of stimuli [F (2, 28) = 2.768, p = 0.080]. There was a significant interaction between vision and stimuli [F (2, 28) = 3.603, p = 0.041]. The simple main effect of vision was insignificant in the control [F (1, 36) = 0.047, p = 0.829]. The simple main effect of vision was significant during the tactile stimuli moving along the AP [F (1, 36) = 7.049, p = 0.012] and ML [F (1, 36) = 5.956, p = 0.020] axes; the total COPx displacement in the VO was significantly greater than that in the non-VO. There was a simple main effect of the stimuli in the VO [F (2, 56) = 3.660, p = 0.032]. Multiple comparison test revealed that the total COPx displacement during the tactile stimuli moving along the AP axis was significantly greater than that in the control, and that during the tactile stimuli moving along the AP axis was significantly greater than that during the tactile stimuli moving along the ML axis in the VO (p < 0.05). In contrast, such a significant simple main effect was absent in the non-VO.
The total COPy displacement is shown in Figure 6B. There was a significant main effect of vision [F (1, 14) = 4.783, p = 0.046]. There was no significant main effect of stimuli [F (2, 28) = 2.450, p = 0.105]. There was a significant interaction between vision and stimuli [F (2, 28) = 3.467, p = 0.045]. The simple main effect of vision was insignificant in the control [F (1, 33) = 0.004, p = 0.948]. The simple main effect of vision was significant during the tactile stimuli moving along the AP [F (1, 33) = 6.370, p = 0.017] and ML [F (1, 33) = 6.289, p = 0.017] axes; the total COPy displacement in the VO was significantly greater than that in the non-VO. There was a simple main effect of the stimuli in the VO [F (2, 54) = 3.254, p = 0.046]. Multiple comparison test revealed that the total COPy displacement during the tactile stimuli along the AP axis was significantly greater than that in the control for the VO (p < 0.05). In contrast, such a significant simple main effect was absent for the non-VO.
3.3. Mean COP
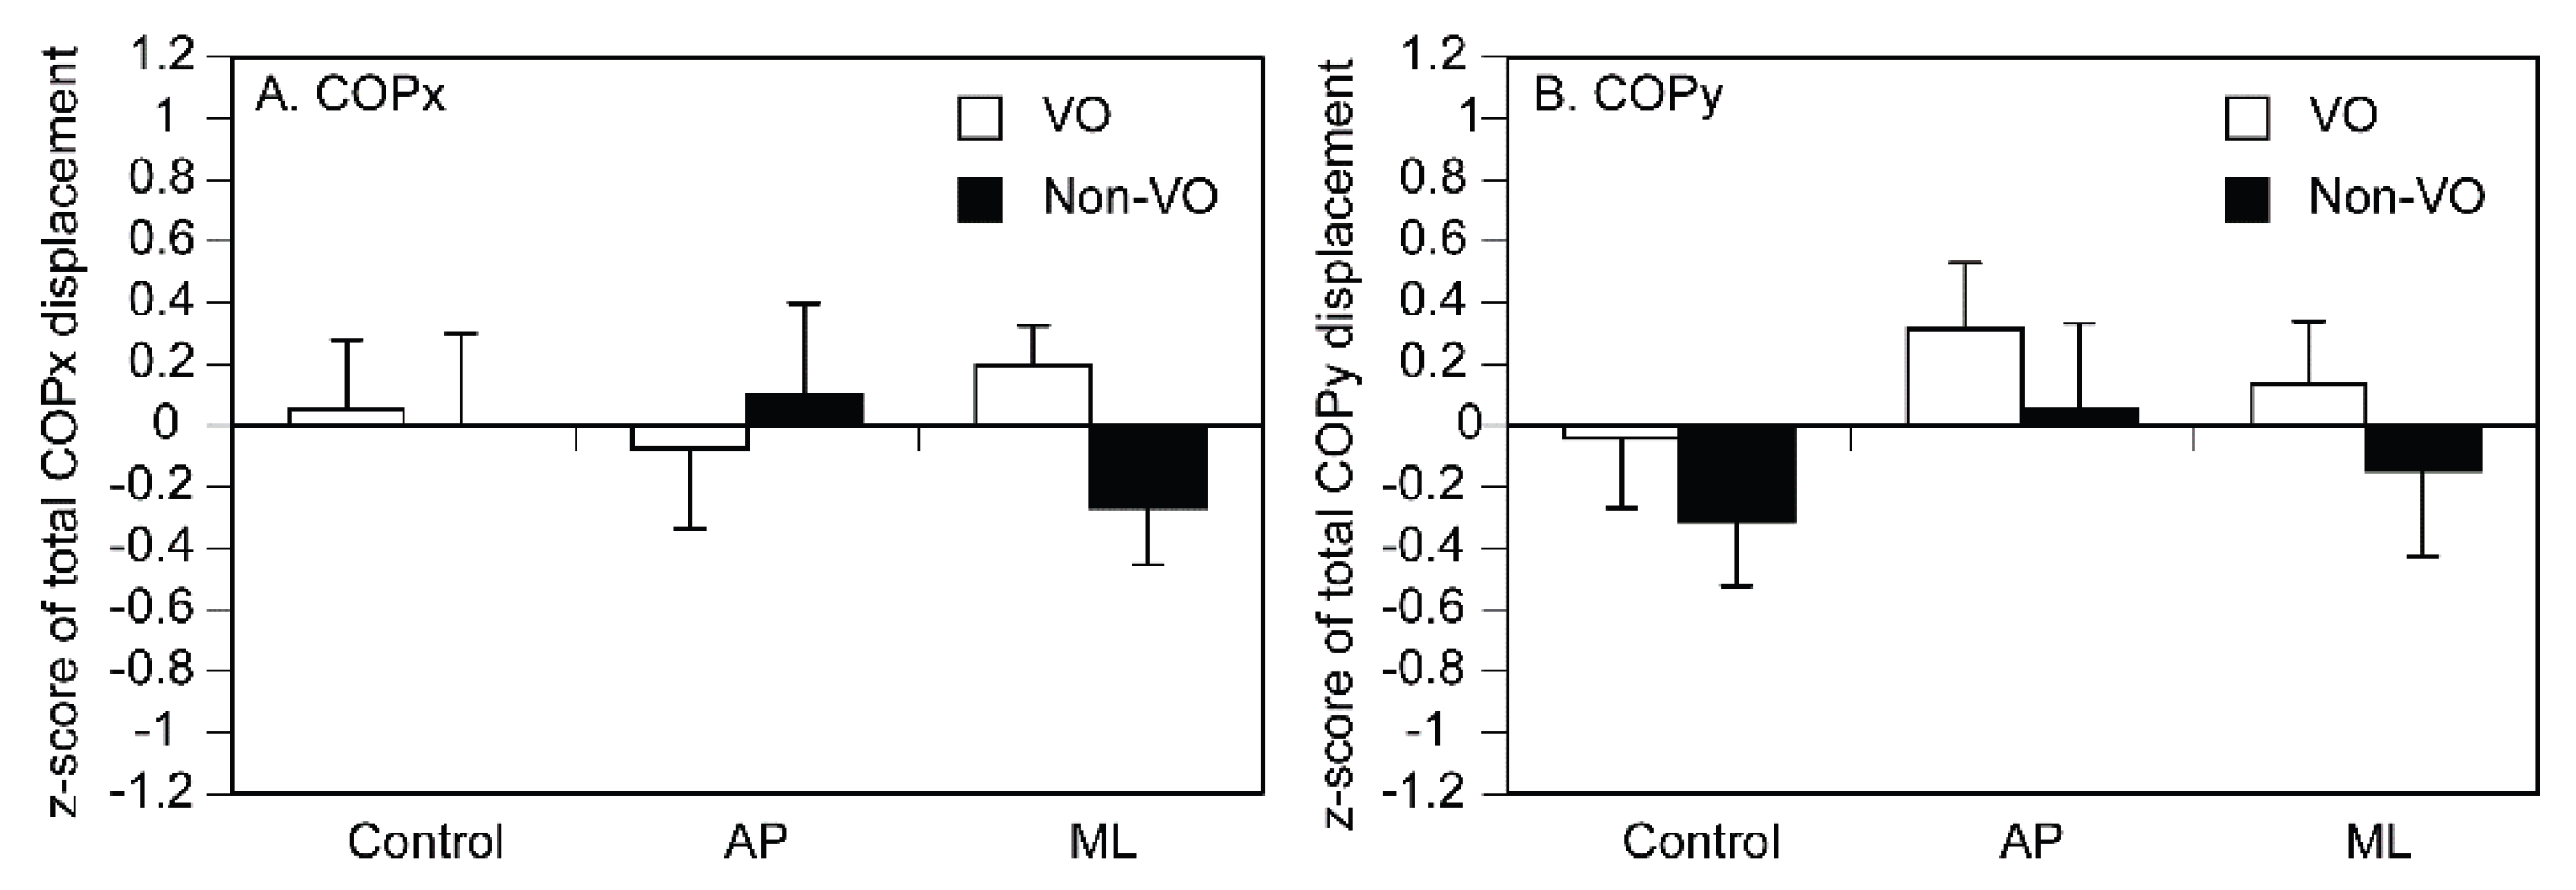
The mean COPx is shown in Figure 7A. There was no significant main effect of vision [F (1, 14) = 0.396, p = 0.539] or stimuli [F (2, 28) = 0.027, p = 0.974]. There was no significant interaction between vision and stimuli [F (2, 28) = 0.777, p = 0.469]. The mean COPy is shown in Figure 7B. There was no significant main effect of vision [F (1, 14) = 1.001, p = 0.334] or stimuli [F (2, 28) = 1.047, p = 0.365]. There was no significant interaction between vision and stimuli [F (2, 28) = 0.001, p = 0.999].
4. Discussion
4.1. Phase-Dependent COP Changes
On the one hand, the COPx was different between the phases of the tactile stimuli moving along the ML axis. This means that the body sways along the ML axis in accordance with the phase of the tactile stimuli moving along the same axis. On the other hand, the phase-dependent change in the COP was absent when the stimuli moved along the AP axis. A previous study reported the phase-dependent body sway during the moving tactile stimuli in a quiet stance; the COPx was rhythmically displaced in accordance with the movement phase of the moving tactile stimuli, mimicking the weight distribution changes during human gait [13]. The moving tactile stimuli mimicking the weight distribution change over the soles during gait involve both the movement of the tactile stimuli along the ML axis and that along the AP axis. Accordingly, in both the present and previous studies, the ML axis was the common direction of tactile stimulus movement. Thus, those findings are explained by the view that the tactile stimuli moving along the ML axis phase-dependently sway the body sway along the same axis, but this effect is cancelled by that moving along the AP axis.
The change in the body sway along the ML axis induced by the stimuli to the soles observed in the present study was consistent with previous findings that the static change in the sensation of the soles induced the change in the COP, particularly along the ML axis. For example, masking tactile sensation of the soles increased the peak COP displacement to the left [4]. In addition, local anesthesia of the forefoot soles increased the COP area and velocity in the ML axis when vision was occluded [1]. Taken together, no matter whether the change in the tactile sensation of the soles is static or dynamic, it specifically influences the body sway along the ML axis. The body sway in the AP axis is mainly controlled by the ankle, and in the ML axis it is controlled by the hip [21]. Based on this, the phase-dependent change in the body sway specifically along the ML axis may reflect the fact that the tactile sensation of the soles contributes particularly to the hip control in quiet stance.
The COPx in phase 2 deviated significantly rightward compared with phases 8 and 9. Similarly, phase 3 deviated significantly rightward compared with phase 9, and phase 4 also showed a significant rightward deviation compared with phase 9. The loci of the tactile stimuli in phases 2, 3, and 4 were relatively leftward compared with those in phases 8 and 9. Accordingly, the body swayed to the direction contralateral to the stimulated side along the ML axis when the tactile stimuli moving along the ML axis were provided. Such a body sway opposite to the locus of the tactile stimulus to the sole has been observed in previous studies; the posture sway showed an opposite relationship to the area to which the static tactile stimulus was applied [22,23]. Accordingly, the present finding can be explained by the view that humans perceive body sway toward the stimulated site and compensate for it by swaying the body to the contralateral side.
4.2. Intermodal Reweighting
Cutaneous anesthesia to the soles increased the displacement and velocity of the COP in a quiet stance only when vision was occluded [1]. This indicates that humans rely on the cutaneous sensation of the soles for controlling the body sway in quiet stance when vision is occluded. Loss of auditory cues increased the reliance of postural control on vision in a quiet stance [24]. Those findings are likely explained by intermodal reweighting between vision and the other modalities of sensation [25,26,27,28]. In this view, the tactile sensation of the soles contributes more to the body sway control when vision is occluded.
Contrasting findings regarding intermodal reweighting between vision and moving tactile sensation of the soles have been revealed. The moving tactile stimuli mimicking the weight distribution change in the soles during gait did not change the total COP displacement [13]. In contrast, in the present study, the total COP displacement during the tactile stimuli moving along the AP axis was larger than that without the stimuli when vision was occluded. In the previous study, the tactile stimuli moved both along the AP and ML axes. In contrast, in the present study, a significant effect of the tactile stimuli moving along the AP axis was present but it was insignificant along the ML axis on the total COP displacement when vision was unavailable. Thus, the greater contribution of the moving tactile stimuli caused by the unavailability of vision occurs for the movement, particularly along the AP axis. This is explained by the view that when vision is unavailable, the tactile stimuli moving particularly along the AP axis become effective on the body sway, but those moving along the ML axis cancel this effect.
Previous studies have demonstrated that visual occlusion has a greater contribution to the body sway in the AP axis than in the ML axis. For example, the standard deviation of the body sway of the waist and legs along the AP axis was greater when vision was occluded [29]. Similarly, the standard deviation of the COP in the AP axis in a quiet stance with visual occlusion was greater than without visual occlusion [30]. Visual occlusion increased the peak of the COP displacement, particularly in the AP axis [4]. Accordingly, the contribution of vision to the control of the body sway is greater along the AP axis. Based on this view, when vision is unavailable, reducing contribution of vision to the control of the body sway must be greater for the AP axis. In this case, through intermodal reweighting, the contribution of the tactile sensation to the control of the body sway in the AP axis becomes greater to compensate for the reduced contribution of vision to the control of COP displacement in this axis caused by the inability of vision.
Visual occlusion increased the total COP displacement during the stimuli moving either along the ML or AP axis. In contrast, the increase was absent when the stimuli were not provided. Moving tactile sensation must have masked the cutaneous sensation of the soles, and thus, the contribution of the tactile sensation to the body sway must have been reduced. In this case, the contribution of vision to the body sway must have become greater based on intermodal reweighting between vision and tactile sensation. Thus, the greater contribution of vision to the body sway control when masking tactile sensation with the moving tactile stimuli through intermodal reweighting between vision and tactile sensation must be the reason for the increase in the COP displacement induced by visual occlusion, particularly during the moving tactile stimuli.
As shown above, through intermodal reweighting, the contribution of the tactile sensation to the control of the body sway, particularly along the AP axis, must have been greater to compensate for the reduced contribution of vision to the control of COP displacement along this axis. On the one hand, the tactile stimuli moving along the ML axis induced a phase-dependent change in the COPx when vision was unavailable. This means that the contribution of the tactile stimuli moving along the ML axis on the body sway in the same axis becomes apparent, particularly when the contribution of vision to the body sway is absent. On the other hand, the effect of the tactile stimuli moving along the AP axis was absent, no matter whether vision was available. Thus, this view regarding intermodal reweighting between vision and tactile sensation conflicted with the phase-dependent effect of the tactile stimuli, particularly moving along the ML axis, caused by visual occlusion found in the present study. One interpretation of the present finding is that the phase-dependent body sway in the ML axis, in accordance with the phase-dependent change in the loci of the tactile sensation along the same axis, is unmasked when vision is unavailable, and this mechanism is different from intermodal reweighting.
4.3. Mean COP
Moving tactile stimuli mimicking the weight distribution change during gait did not change the mean COP [13]. In the present study, the mean COP was not influenced by the moving tactile stimuli, consistent with the previous finding. The mean COP was calculated from the COP over a session in the present study. Each vibration device was activated once in every stimulus cycle, which was repeated 40 times per session. Thus, when averaging the COP over a session, the total time of the tactile stimulus in each site was equal across the loci, although the timing of the stimulus at each locus varied. This must be the cause of the negative finding on mean COP in the present study.
5. Conclusions
The COP along the ML axis was dependent on the phase of the tactile stimuli moving along the ML axis when vision was unavailable. Thus, when humans perceive the body sway along the ML axis, they displace the body to the direction contralateral to the stimulated side to compensate for the perceived body sway. The greater effect of the moving tactile stimuli on phase-dependent body sway, particularly when vision was unavailable, can be explained by the view that body sway in the ML axis, in accordance with the loci of the tactile sensation moving along the same axis, becomes unmasked when vision is absent. The total COP displacement during tactile stimulation moving along the AP axis was larger than that without stimulation, particularly when vision was unavailable. This can be explained by the view that, through intermodal reweighting, the contribution of tactile sensation to controlling body sway along the AP axis increases to compensate for the lack of visual input regulating COP displacement in this axis.
Author Contributions
Conceptualization, T.K. and K.H.; methodology, T.K. and K.H.; formal analysis, T.K. and K.H.; investigation, T.K., Y.S., and K.H.; writing—original draft preparation, T.K.; writing—review and editing, K.H. All authors have read and agreed to the published version of the manuscript.
Funding
This research received no external funding.
Institutional Review Board Statement
The study was conducted in accordance with the Declaration of Helsinki, and approved by the ethics committee of Osaka Prefecture University (Approved number: 2021-110, The date of approval: November 8, 2021).
Informed Consent Statement
Informed consent was obtained from all subjects involved in the study.
Data Availability Statement
The raw data supporting the conclusions of this article will be made available by the authors on request.
Acknowledgments
During the preparation of this manuscript, the authors used ChatGPT for the purposes of English edition. The authors have reviewed and edited the output and take full responsibility for the content of this publication.
Conflicts of Interest
The authors declare no conflicts of interest.
References
- Meyer, P.F.; Oddsson, L.I.; De Luca, C.J. The role of plantar cutaneous sensation in unperturbed stance. Exp. Brain Res. 2004, 156, 505–512. [Google Scholar] [CrossRef]
- Wang, T.Y.; Lin, S.I. Sensitivity of plantar cutaneous sensation and postural stability. Clin. Biomech. 2008, 23, 493–499. [Google Scholar] [CrossRef]
- Turcot, K.; Allet, L.; Golay, A.; Hoffmeyer, P.; Armand, S. Investigation of standing balance in diabetic patients with and without peripheral neuropathy using accelerometers. Clin. Biomech. 2009, 24, 716–721. [Google Scholar] [CrossRef]
- Sawaguchi, Y.; Kawasaki, T.; Oda, H.; Kunimura, H.; Hiraoka, K. Contribution of vision and tactile sensation on body sway during quiet stance. J. Phys. Ther. Sci. 2022, 34, 393–399. [Google Scholar] [CrossRef]
- Lauzier, L.; Kadri, M. A.; Bouchard, E.; Bouchard, K.; Gaboury, S.; Gagnon, J. M.; Girard, M. P.; Larouche, A.; Robert, R.; Lapointe, P.; Silva, R. A.; Beaulieu, L. D. Vibration of the whole foot soles surface using an inexpensive portable device to investigate age-related alterations of postural control. Front. Hum. Neurosci. 2021, 15, 719502. [Google Scholar] [CrossRef]
- Amemiya, T.; Beck, B.; Walsh, V.; Gomi, H.; Haggard, P. Visual area V5/hMT+ contributes to perception of tactile motion direction: a TMS study. Sci. Rep. 2017, 7, 3921. [Google Scholar] [CrossRef] [PubMed]
- Pei, Y.C.; Bensmaia, S.J. The neural basis of tactile motion perception. J. Neurophysiol. 2014, 112, 3023–3032. [Google Scholar] [CrossRef] [PubMed]
- Bremmer, F.; Schlack, A.; Shah, N.J.; Zafiris, O.; Kubischik, M.; Hoffmann, K.P.; Fink, G.R. Polymodal motion processing in posterior parietal and premotor cortex: a human fMRI study strongly implies equivalencies between humans and monkeys. Neuron 2001, 29, 287–296. [Google Scholar] [CrossRef] [PubMed]
- Hagen, M.C.; Franzén, O.; McGlone, F.; Essick, G.; Dancer, C.; Pardo, J.V. Tactile motion activates the human middle temporal/V5 (MT/V5) complex. Eur. J. Neurosci. 2002, 16, 957–964. [Google Scholar] [CrossRef]
- Summers, I.R.; Francis, S.T.; Bowtell, R.W.; McGlone, F.P.; Clemence, M. A functional-magnetic-resonance-imaging investigation of cortical activation from moving vibrotactile stimuli on the fingertip. J. Acoust. Soc. Am. 2009, 125, 1033–1039. [Google Scholar] [CrossRef]
- Wacker, E.; Spitzer, B.; Lützkendorf, R.; Bernarding, J.; Blankenburg, F. Tactile motion and pattern processing assessed with high-field FMRI. PLoS ONE 2011, 6, e24860. [Google Scholar] [CrossRef]
- Van Kemenade, B.M.; Seymour, K.; Wacker, E.; Spitzer, B.; Blankenburg, F.; Sterzer, P. Tactile and visual motion direction processing in hMT+/V5. Neuroimage 2014, 84, 420–427. [Google Scholar] [CrossRef]
- Sawaguchi, Y.; Kawasaki, T.; Hiraoka, K. Effect of Moving Tactile Stimuli to Mimic Altered Weight Distribution During Gait on Quiet Stance Body Sway. Percept. Mot. Skills 2023, 130, 2547–2563. [Google Scholar] [CrossRef] [PubMed]
- Hamill, P.V.; Drizd, T.A.; Johnson, C.L.; Reed, R.B.; and Roche, A.F. NCHS growth curves for children birth-18 years; Department of Health Education and Welfare: Washington, DC, USA, 1977. [Google Scholar]
- Thomas, J.R.; French, K.E. Gender differences across age in motor performance: A meta-analysis. Psychol. Bull. 1985, 98, 260–282. [Google Scholar] [CrossRef]
- Gribble, P.A.; Robinson, R.H.; Hertel, J.; Denegar, C.R. The effects of gender and fatigue on dynamic postural control. J. Sport Rehabil. 2009, 18, 240–257. [Google Scholar] [PubMed]
- Kahraman, B.O.; Kahraman, T.; Kalemci, O.; Sengul, Y.S. Gender differences in postural control in people with nonspecific chronic low back pain. Gait Posture 2018, 64, 147–151. [Google Scholar] [CrossRef]
- Elias, L.J.; Bryden, M.P.; Bulman-Fleming, M.B. Footedness is a better predictor than is handedness of emotional lateralization. Neuropsychologia 1998, 36, 37–43. [Google Scholar] [CrossRef] [PubMed]
- Zverev, Y.P. Spatial parameters of walking gait and footedness. Ann. Hum. Biol. 2006, 33, 161–176. [Google Scholar] [CrossRef]
- Kunimura, H.; Oda, H.; Kawasaki, T.; Tsujinaka, R.; Hamada, N.; Fukuda, S.; Matsuoka, M.; Hiraoka, K. Effect of Laterally Moving Tactile Stimuli to Sole on Anticipatory Postural Adjustment of Gait Initiation in Healthy Males. Brain Sci. 2023, 13, 1411. [Google Scholar] [CrossRef]
- Winter, D.A.; Prince, F.; Sterior, P. Medial-lateral and anterior-posterior motor responses associated with center of pressure changes in quiet standing. Neurosci. Res. Commun. 1993, 12, 141–148. [Google Scholar]
- Kavounoudias, A.; Roll, R.; Roll, J. P. The plantar sole is a ‘dynamometric map’ for human balance control. Neuroreport 1998, 9, 3247–3252. [Google Scholar] [CrossRef] [PubMed]
- Kavounoudias, A.; Roll, R.; Roll, J. P. Foot sole and ankle muscle inputs contribute jointly to human erect posture regulation. J. Physiol. 2001, 532, 869–878. [Google Scholar] [CrossRef] [PubMed]
- Maurer, C.; Mergner, T.; Peterka, R.J. Multisensory control of human upright stance. Exp. Brain Res. 2006, 171, 231–250. [Google Scholar] [CrossRef]
- Peterka, R.J. Sensorimotor integration in human postural control. J. Neurophysiol. 2002, 88, 1097–1118. [Google Scholar] [CrossRef]
- Peterka, R.J. Sensory integration for human balance control. In Handb. Clin. Neurol.; Elsevier: Amsterdam, The Netherlands, 2018; Volume 159, pp. 27–42. [Google Scholar]
- Maheu, M.; Sharp, A.; Landry, S.P.; Champoux, F. Sensory reweighting after loss of auditory cues in healthy adults. Gait Posture 2017, 53, 151–154. [Google Scholar] [CrossRef]
- Assländer, L.; Peterka, R.J. Sensory reweighting dynamics following removal and addition of visual and proprioceptive cues. J. Neurophysiol. 2016, 116, 272–285. [Google Scholar] [CrossRef]
- Dickstein, R.; Abulaffio, N. Postural sway of the affected and nonaffected pelvis and leg in stance of hemiparetic patients. Arch. Phys. Med. Rehabil. 2000, 81, 364–367. [Google Scholar] [CrossRef]
- Carpenter, M.G.; Frank, J.S.; Silcher, C.P.; Patla, A.E. The influence of postural threat on the control of upright stance. Exp. Brain Res. 2001, 138, 210–218. [Google Scholar] [CrossRef] [PubMed]
Figure 1.
The loci of the vibration devices and feet positions on the moving tactile stimulator. The distances between the vibration devices are shown. The other numbers indicate means and standard error of mean.
Figure 1.
The loci of the vibration devices and feet positions on the moving tactile stimulator. The distances between the vibration devices are shown. The other numbers indicate means and standard error of mean.
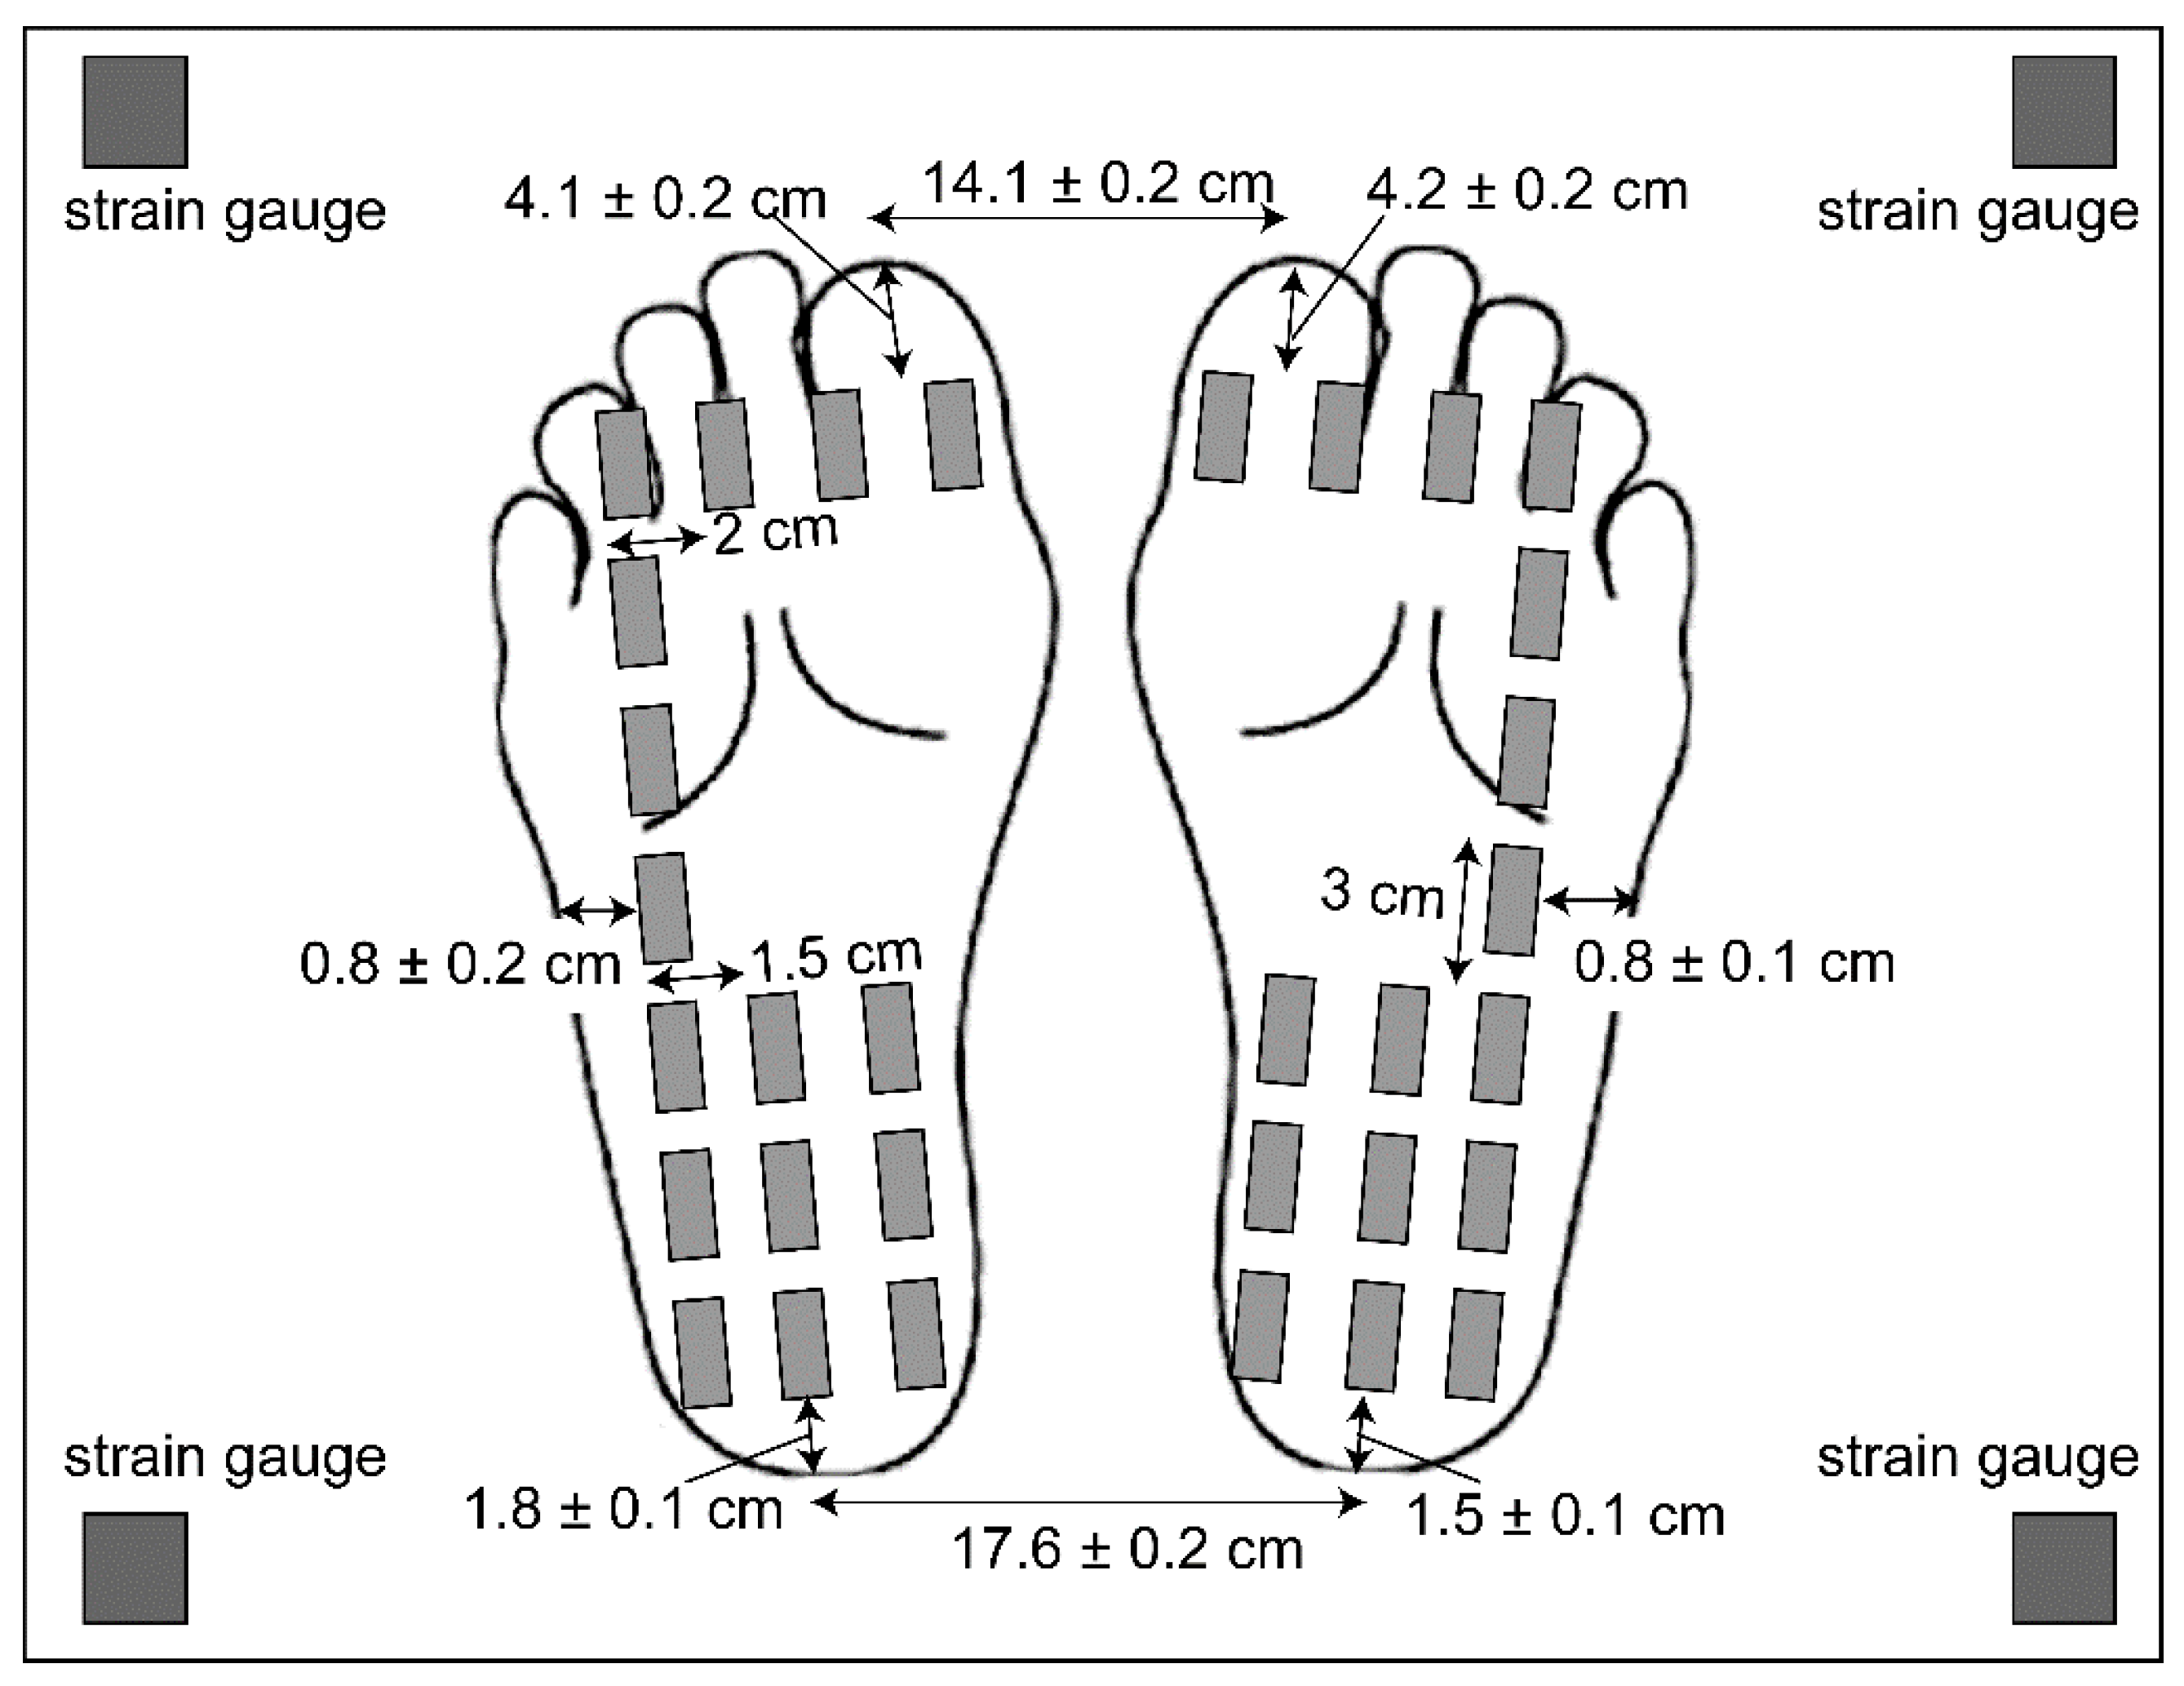
Figure 2.
The protocol of the tactile stimuli along the AP axis. Each schematic illustrates the activity of the vibration devices in each phase (83 ms per phase). Rectangles denote vibration devices, and filled rectangles indicate the active devices in each phase.
Figure 2.
The protocol of the tactile stimuli along the AP axis. Each schematic illustrates the activity of the vibration devices in each phase (83 ms per phase). Rectangles denote vibration devices, and filled rectangles indicate the active devices in each phase.
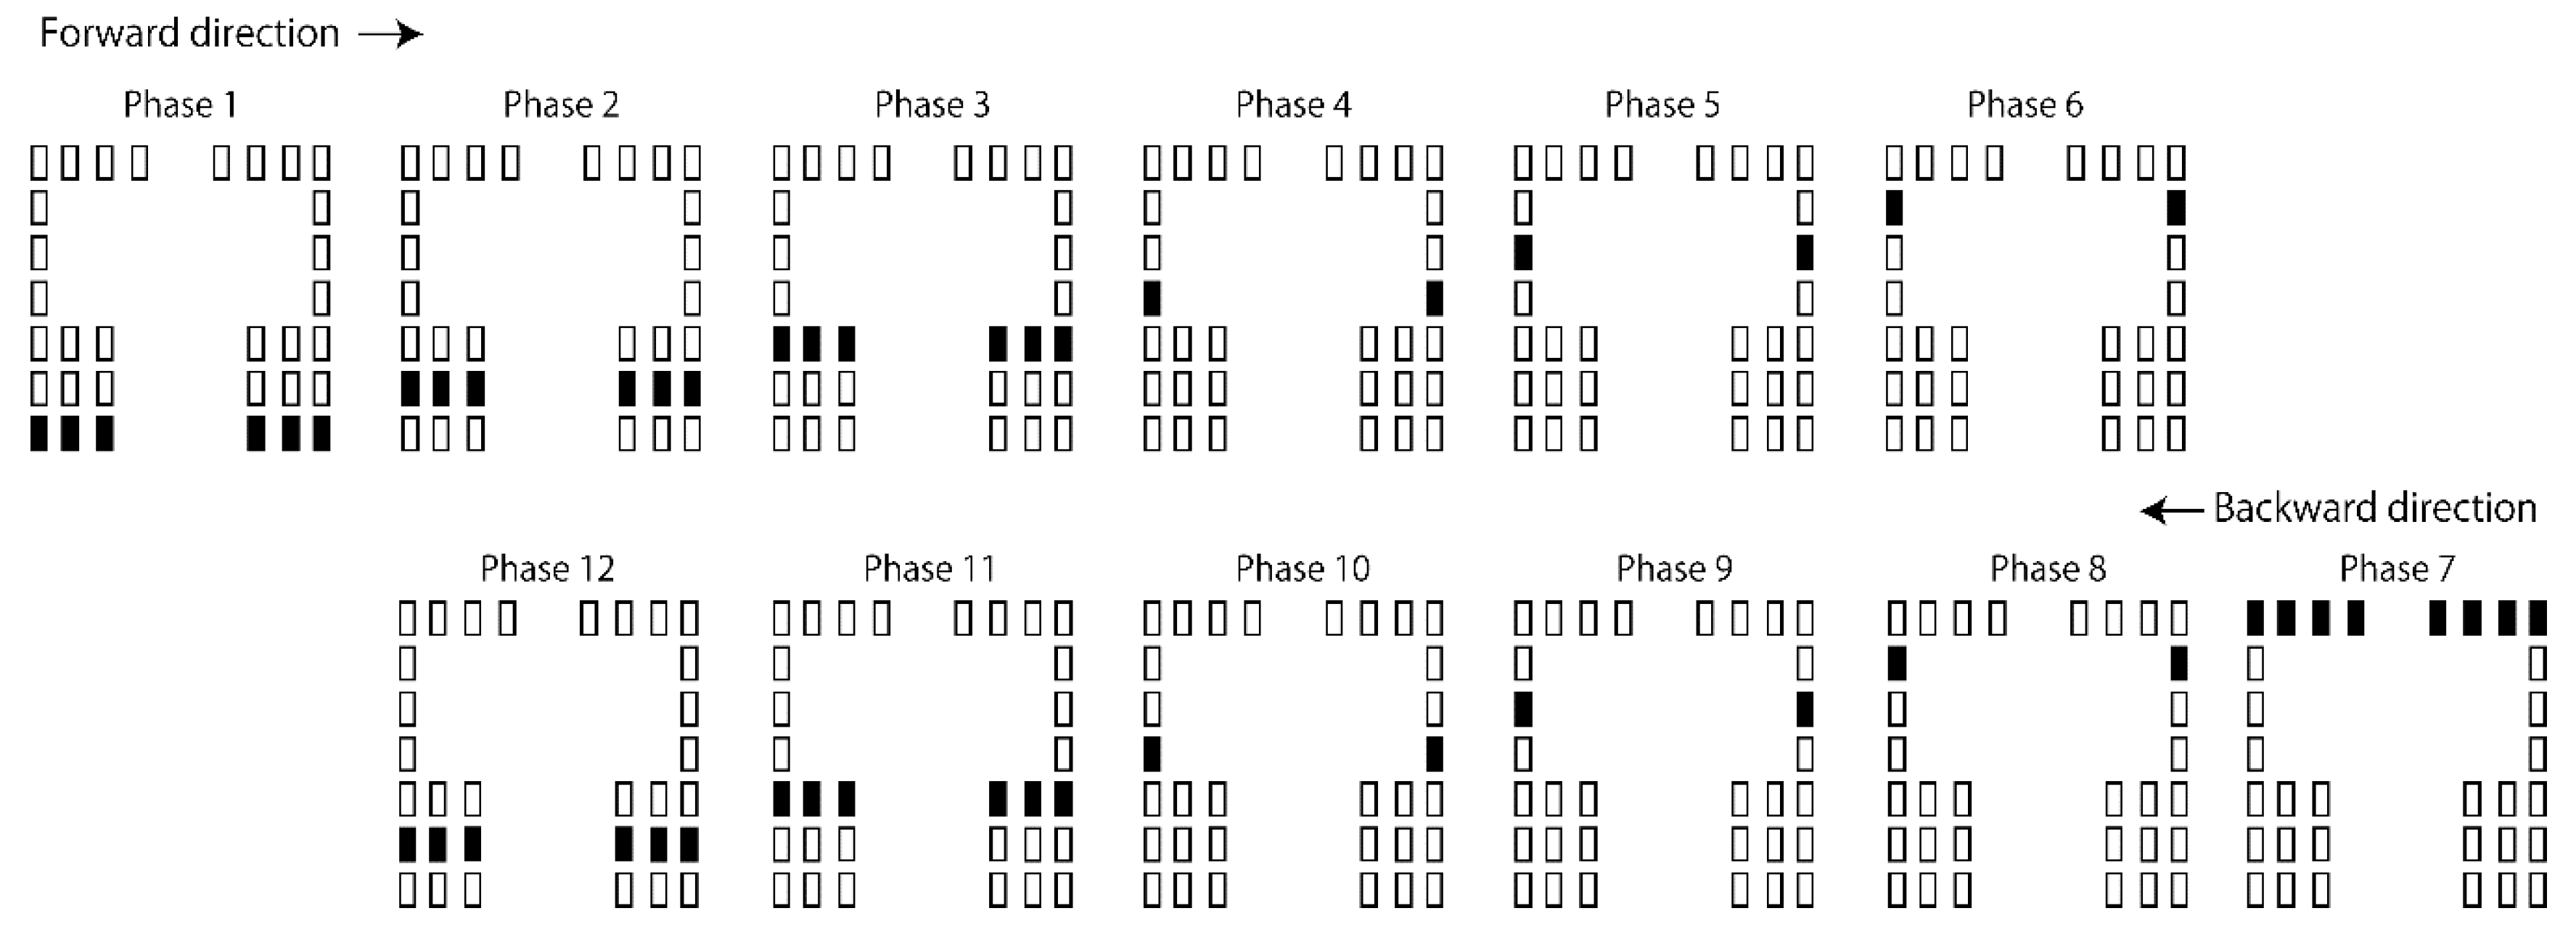
Figure 3.
The protocol of the tactile stimuli along the ML axis. Each schematic illustrates the activity of the vibration devices in each phase (71 ms per phase). Rectangles denote vibration devices, and filled rectangles indicate the active devices in each phase.
Figure 3.
The protocol of the tactile stimuli along the ML axis. Each schematic illustrates the activity of the vibration devices in each phase (71 ms per phase). Rectangles denote vibration devices, and filled rectangles indicate the active devices in each phase.
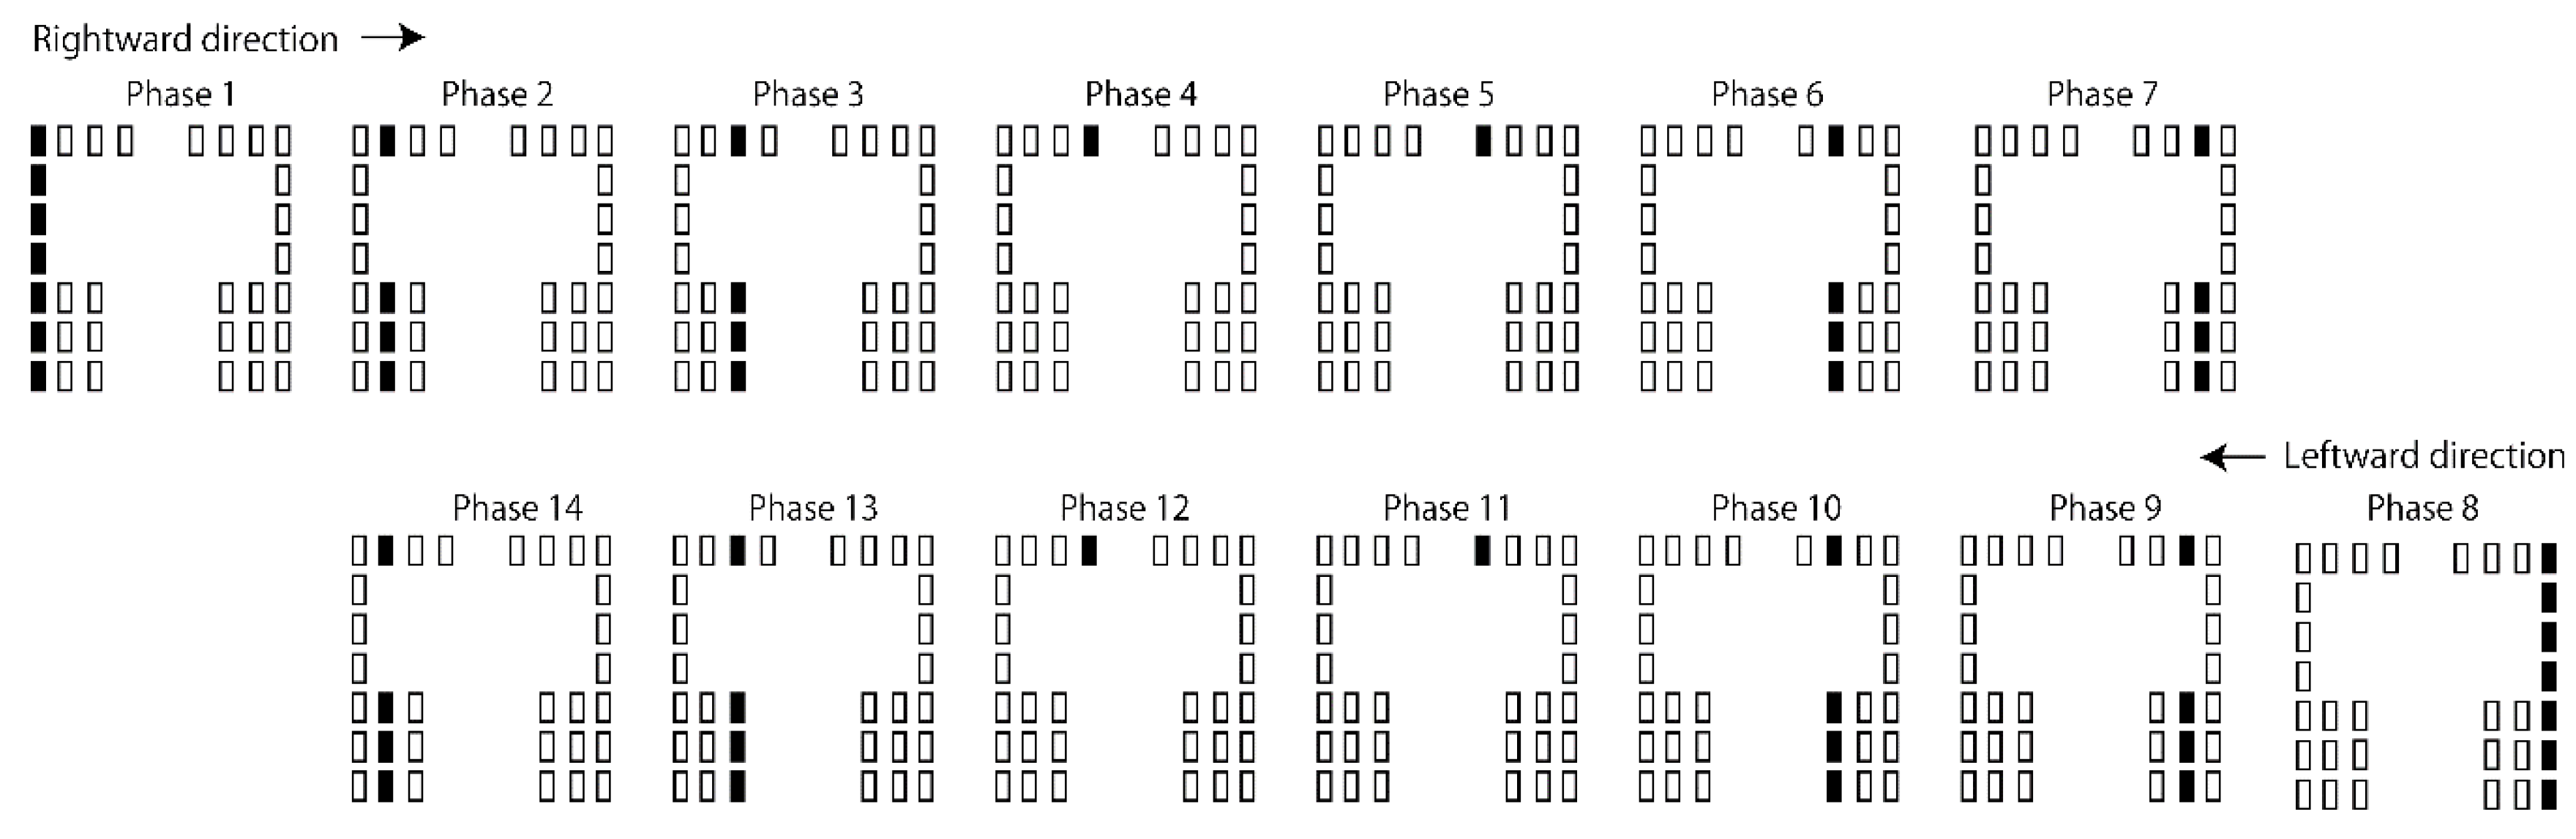
Figure 4.
The phase-dependent COP displacement during the tactile stimuli moving along the AP axis. The data points represent means, and the error bars represent the standard error of mean.
Figure 4.
The phase-dependent COP displacement during the tactile stimuli moving along the AP axis. The data points represent means, and the error bars represent the standard error of mean.
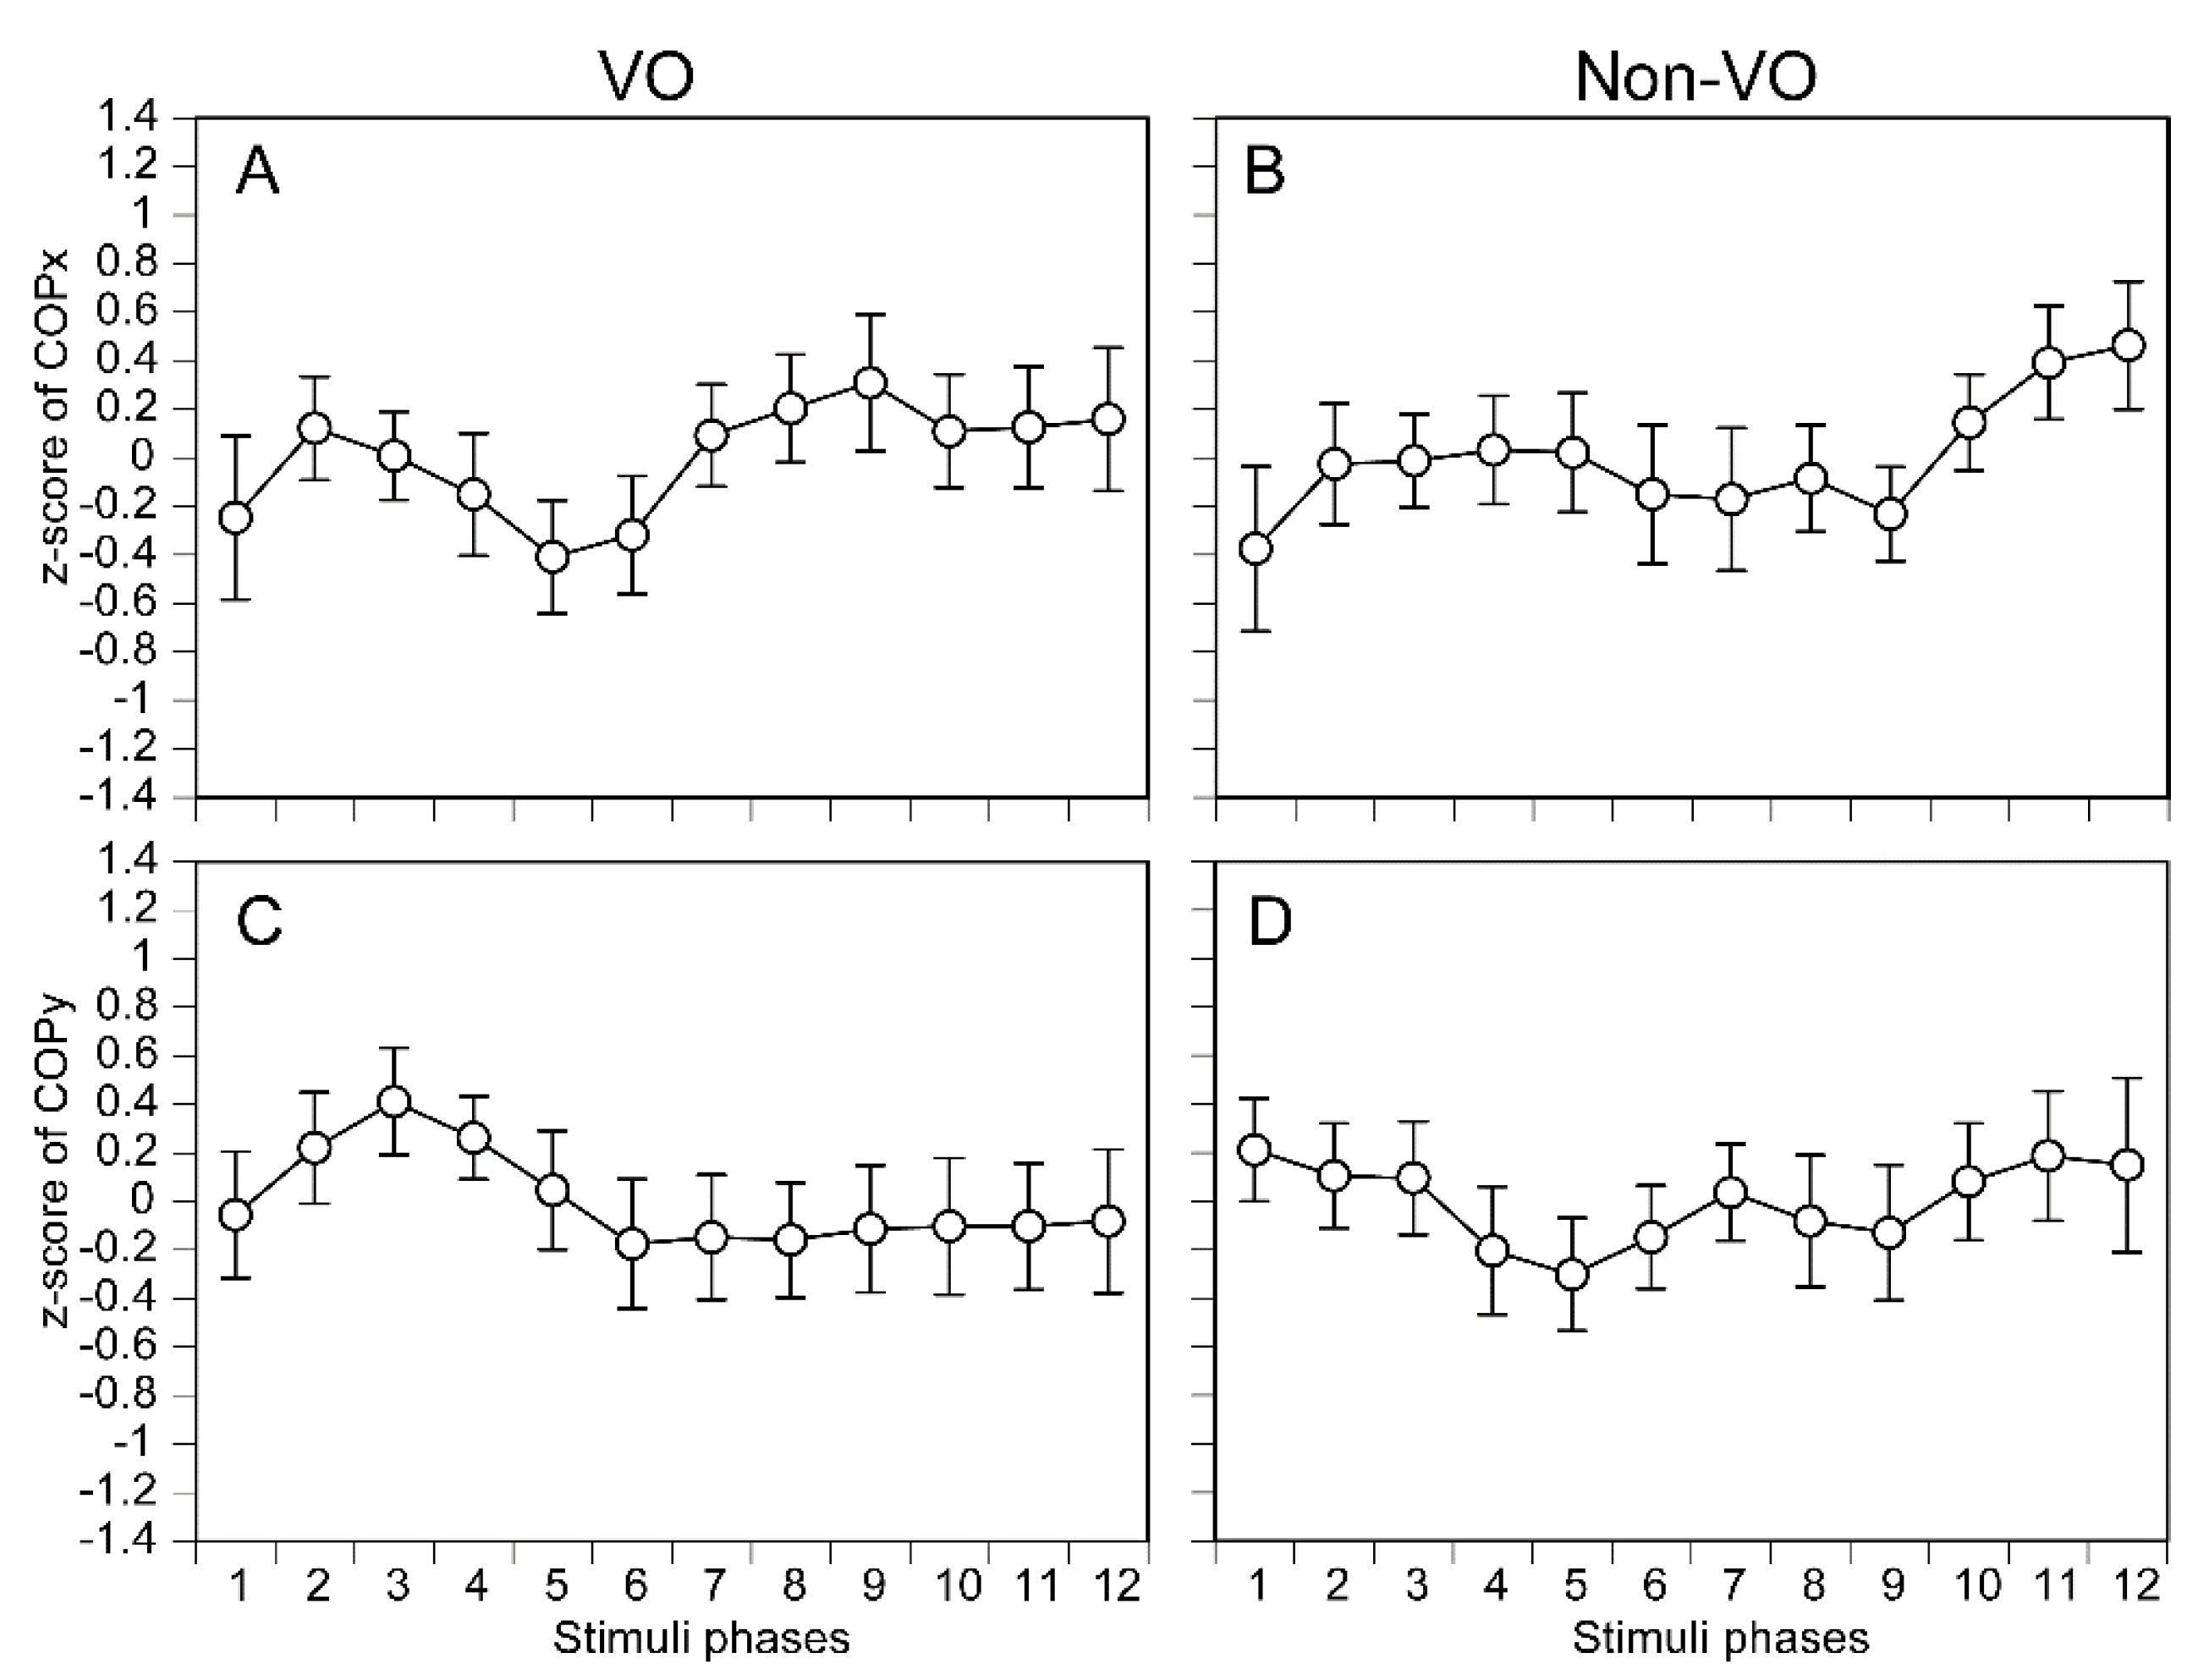
Figure 5.
The phase-dependent COP displacement during the tactile stimuli moving along the ML axis. The data points represent means, and the error bars represent the standard error of mean. Asterisks indicate significant differences between the phases by multiple comparison test (Bonferroni’s test, p < 0.05).
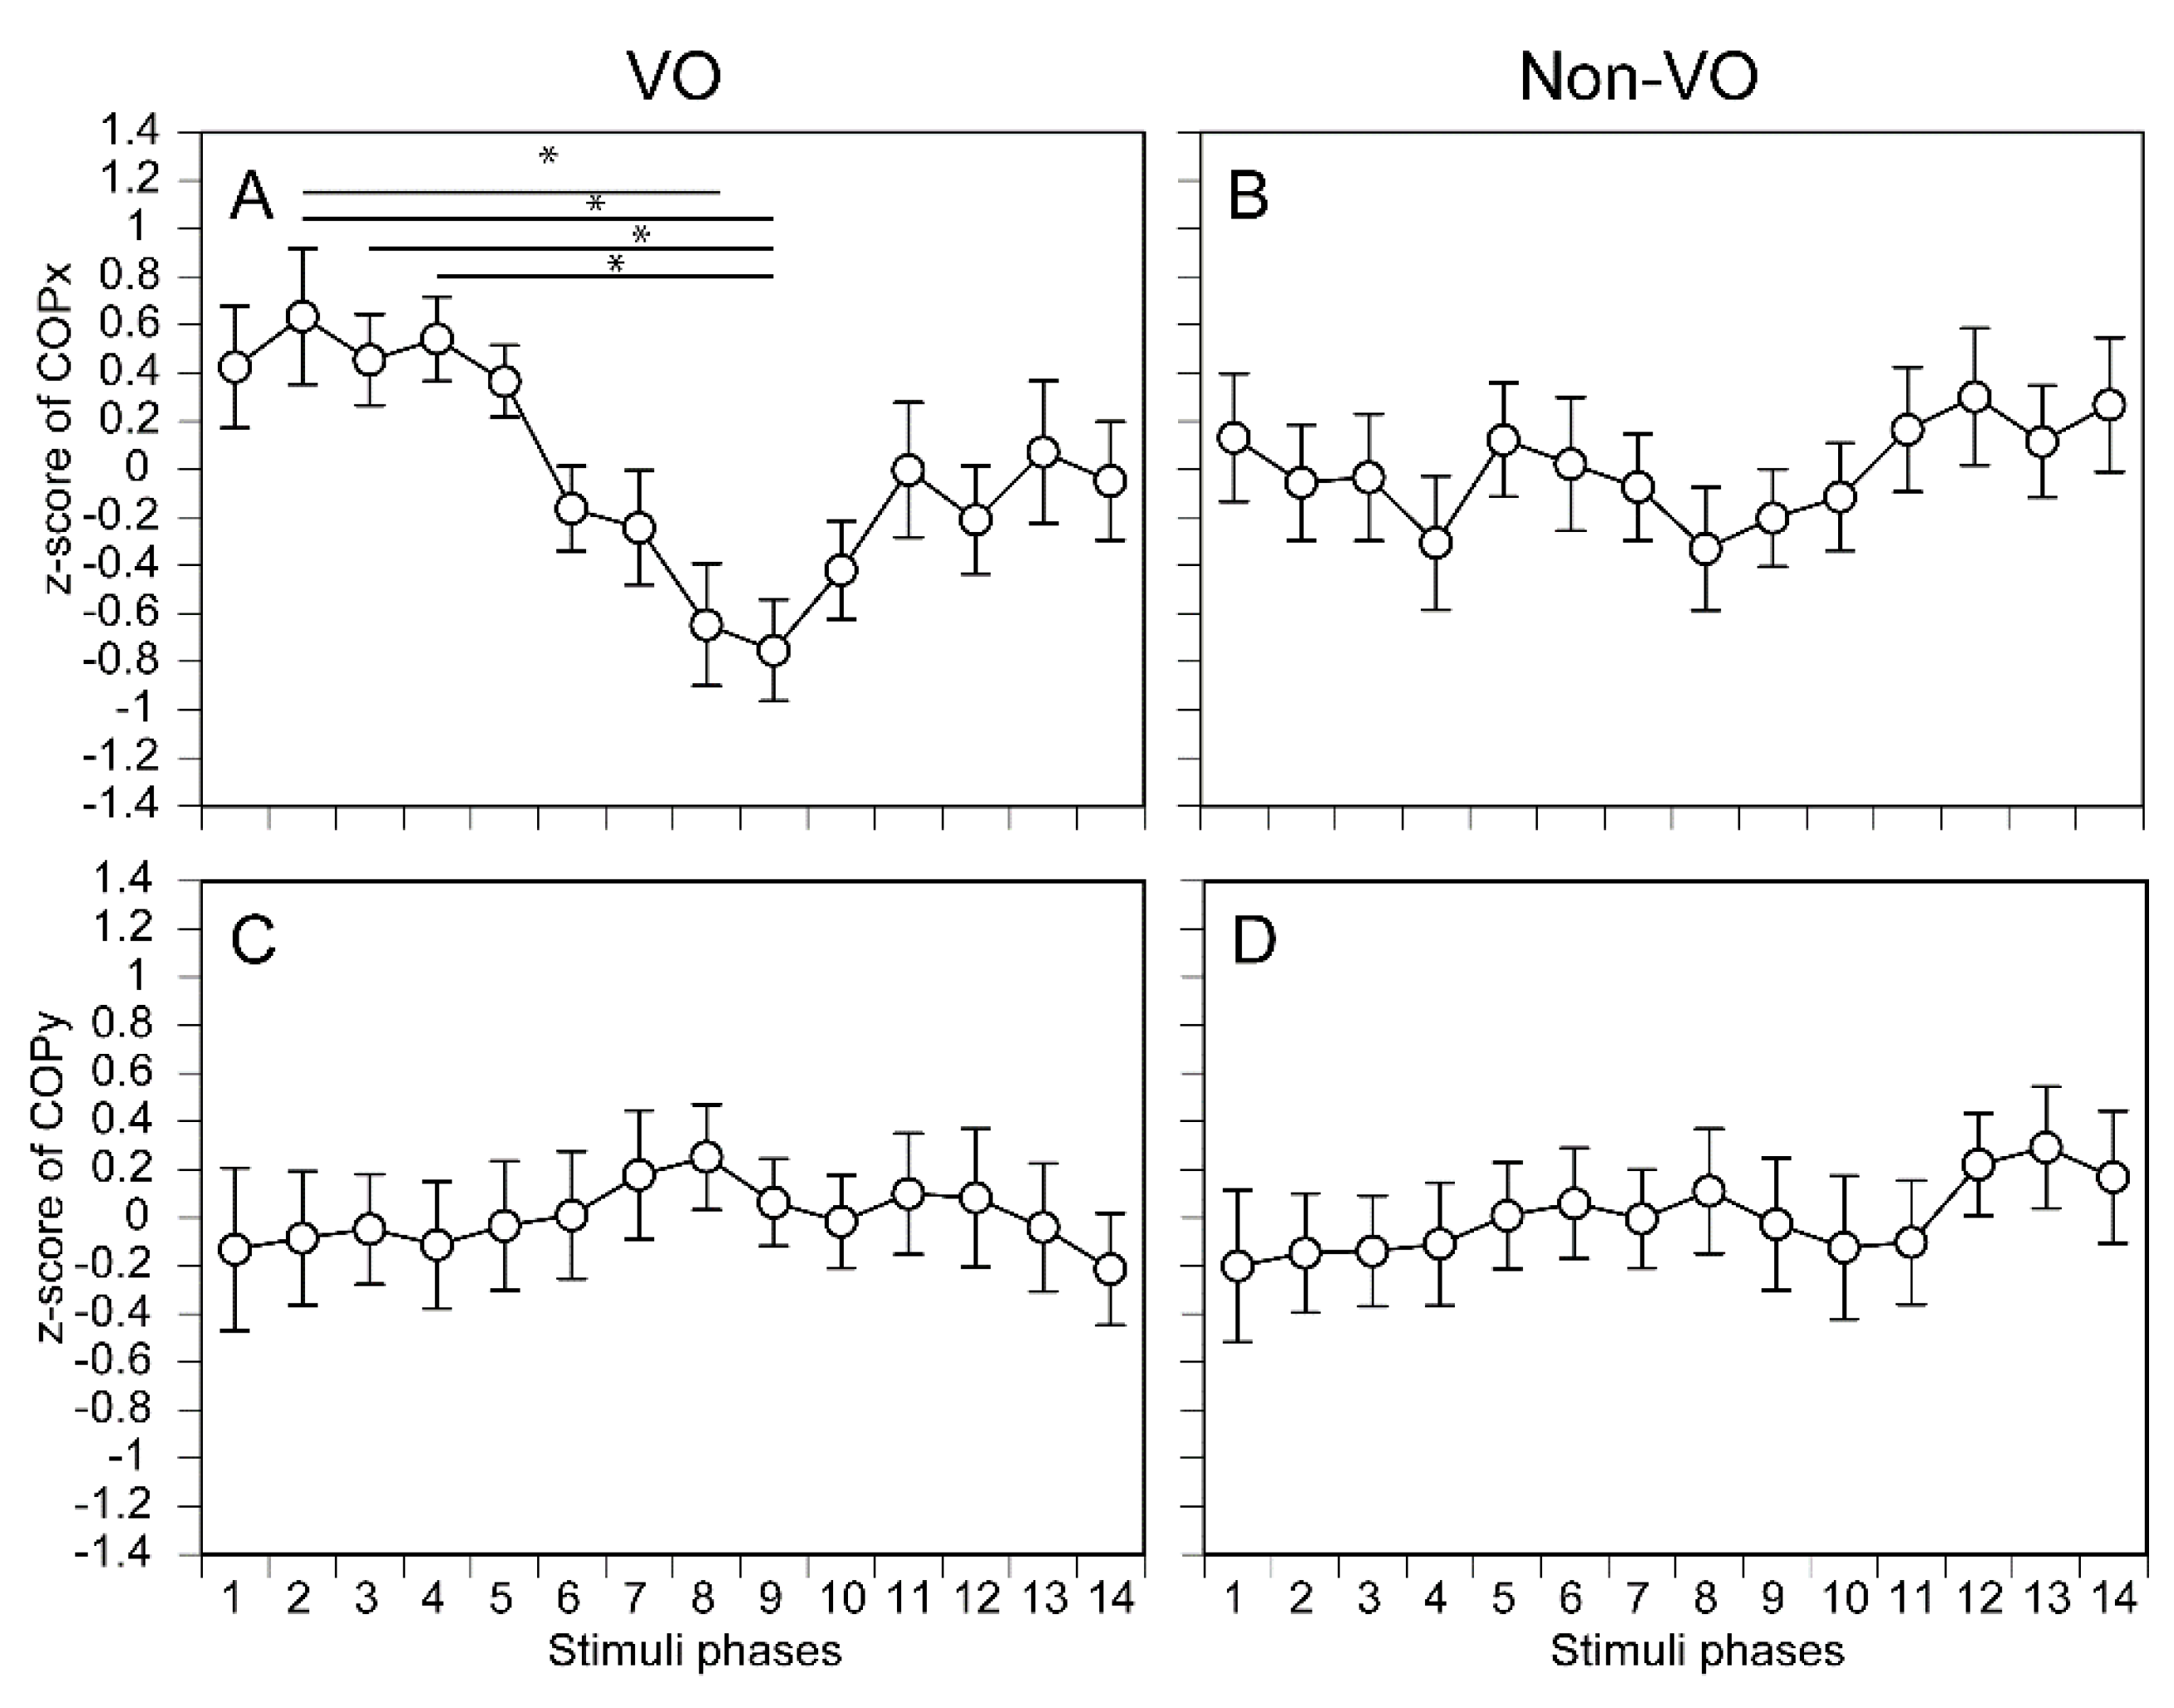
Figure 6.
The total COP displacement. The bars represent means, and the error bars represent the standard error of mean. Asterisks indicate significant differences between the VO and non-VO by test of simple main effect (p < 0.05). Daggers indicate significant differences between the stimulus conditions by multiple comparison test (Bonferroni’s test; p < 0.05).
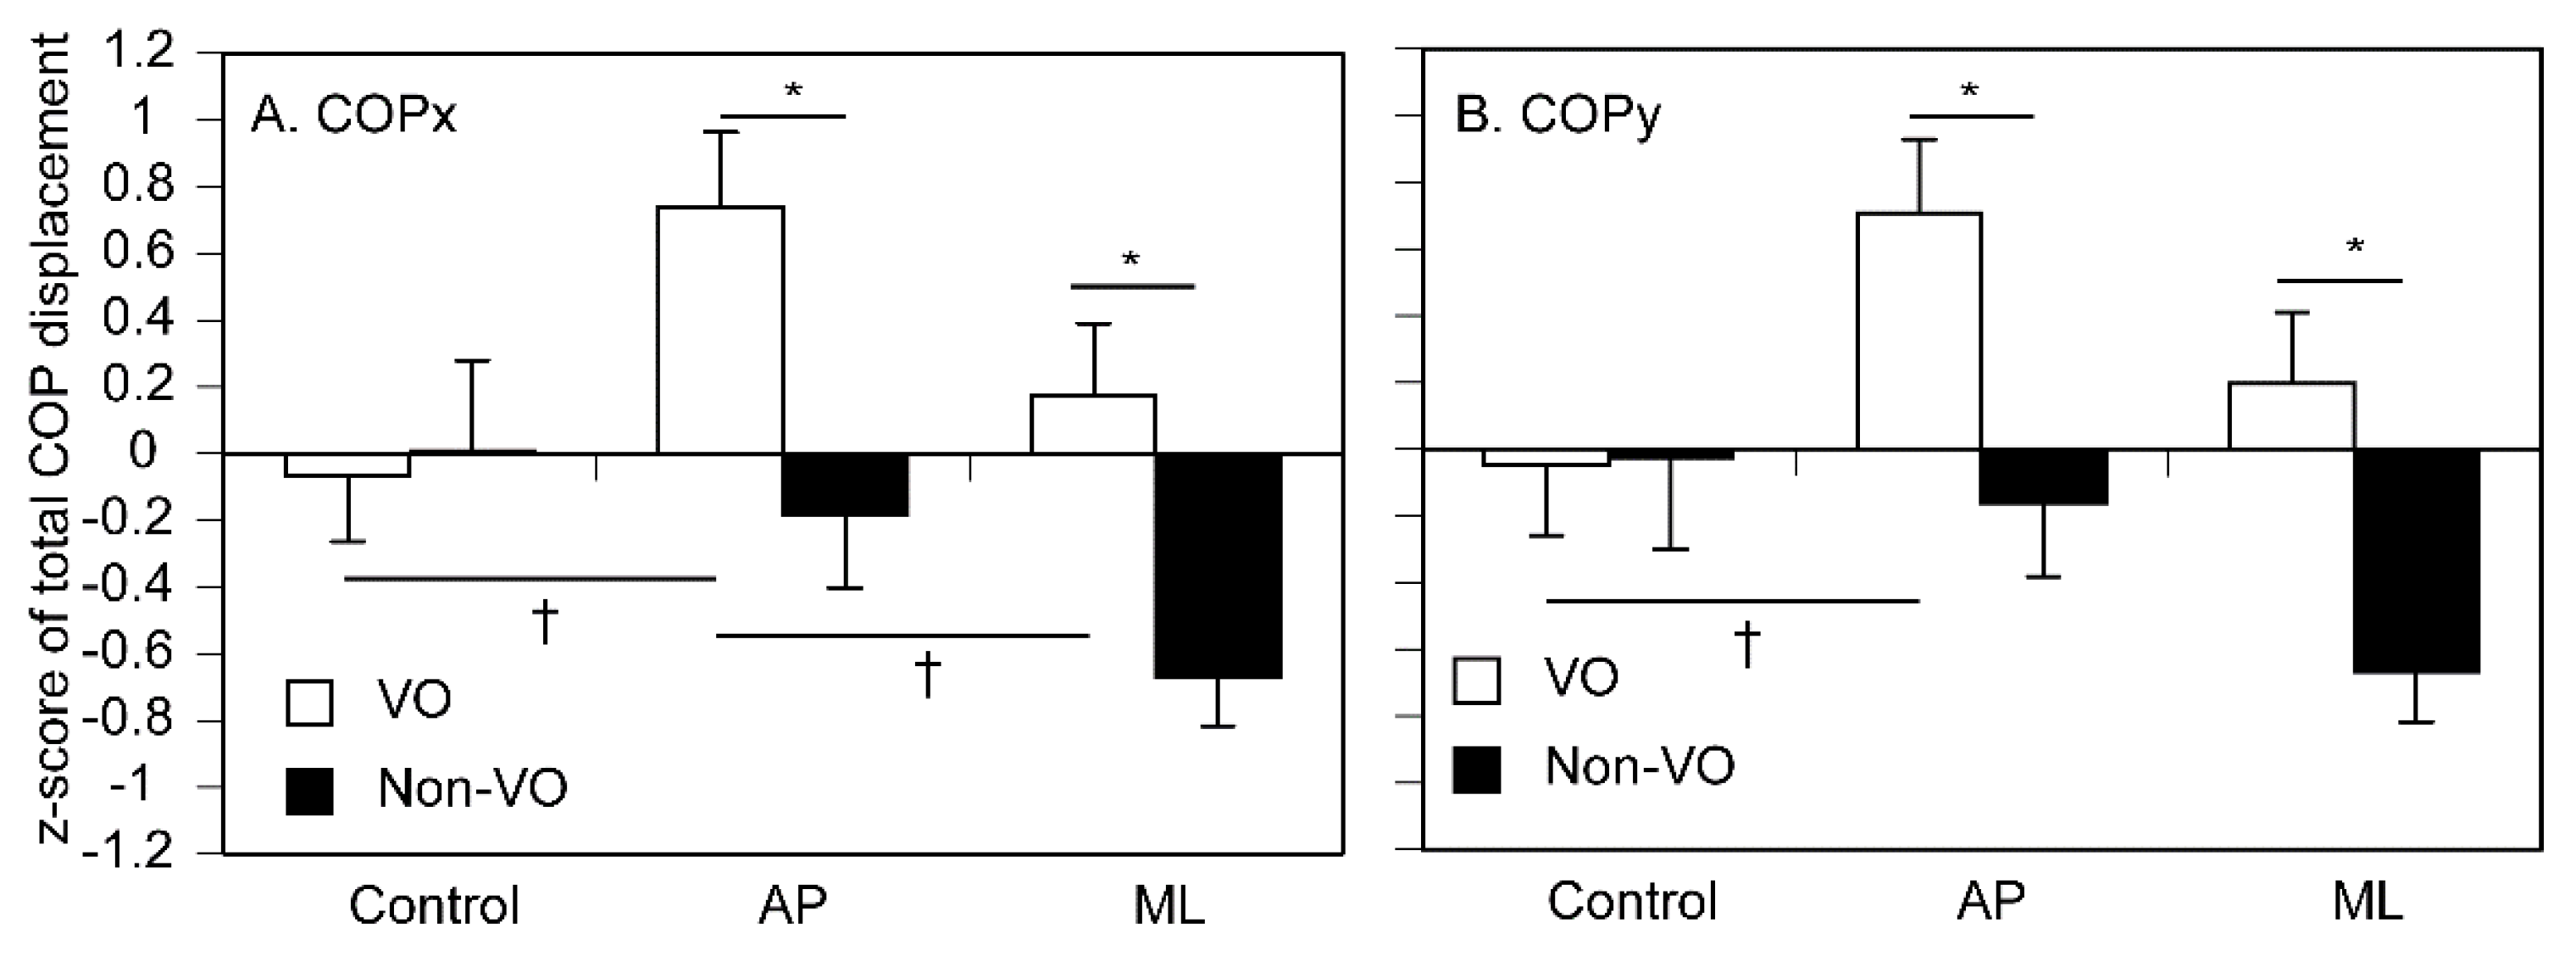
Figure 7.
Mean COP. The bars represent means, and the error bars represent the standard error of mean.
Figure 7.
Mean COP. The bars represent means, and the error bars represent the standard error of mean.
Disclaimer/Publisher’s Note: The statements, opinions and data contained in all publications are solely those of the individual author(s) and contributor(s) and not of MDPI and/or the editor(s). MDPI and/or the editor(s) disclaim responsibility for any injury to people or property resulting from any ideas, methods, instructions or products referred to in the content. |
© 2025 by the authors. Licensee MDPI, Basel, Switzerland. This article is an open access article distributed under the terms and conditions of the Creative Commons Attribution (CC BY) license (http://creativecommons.org/licenses/by/4.0/).
Copyright: This open access article is published under a Creative Commons CC BY 4.0 license, which permit the free download, distribution, and reuse, provided that the author and preprint are cited in any reuse.


