Submitted:
20 September 2025
Posted:
22 September 2025
You are already at the latest version
Abstract
Background: Millions of people have died from AIDS-related illnesses since the start of the epidemic. The objective of this study is to determine the relationship between life years lost and demographic factors in the subset of individuals with advanced HIV disease, that is, those who have received a diagnosis of AIDS, in Puerto Rico from 2000 to 2020, and to evaluate trends in poverty, age, and number of diagnoses and deaths over this timeframe. Methods: We identified 3,624 individuals diagnosed with AIDS who received services under the Eligible Metropolitan Area (EMA) of San Juan, Puerto Rico, and correlated demographic factors with AIDS descriptive statistics using a retrospective cohort study design. We used socioeconomic characteristics to describe the population, estimated the life years lost (LYL) compared with the life expectancy of the general population of Puerto Rico at a given age as the null model, and evaluated the relationship of demographic variables with LYL, as well as trends in poverty and age/number of deaths/diagnoses over time. Results: More life years are lost with earlier AIDS onset, and there is also a relationship between LYL and the level of poverty and the documented mode of transmission. An individual diagnosed with AIDS has an average life expectancy between 5 and 8 years, when averaged across all ages. LYL were greater in AIDS patients with lower income across all age groups; as well as in association with perinatal transmission as compared with other potential modes of transmission. LYL was also significantly increased in those without insurance in the age bracket of 40-49 years. No relationship with LYL and gender was detected. Moreover, over the years included in the timeframe of this study, certain trends emerged: we observed a greater proportion of AIDS to HIV diagnoses over time; HIV/AIDS diagnoses and deaths occurred on average at a higher age; the number of diagnoses per year initially rose over time and then declined; while the number of deaths per year as well as the poverty level in those diagnosed with HIV/AIDS increased over time. Conclusions: This study demonstrates the continued recent impact of the HIV epidemic specifically on those with advanced disease (AIDS),and further reaffirms the importance of treatment and prevention as well as demographic and social determinants of health, including age, poverty level, insurance status, and lifestyle, highlighting the increasing impact of HIV/AIDS on those with greater levels of poverty.
Keywords:
life years lost
; HIV/AIDS
; life expectancy
; Puerto Rico
1. Introduction
Since the start of the epidemic in 1981, 42.3 million people have died from illnesses related to AIDS, which is the late stage of infection of HIV. [1] AIDS is an advanced condition related to untreated HIV infection that is diagnosed based on specific AIDS-defining illnesses that are rare in the general population and tend to occur when circulating CD4+ lymphocytes are below <200/mm3 [2]. There have been advancements in diagnosis and in treatment of HIV, particularly with the development of antiretroviral therapy (ART), which has led to a rise in life expectancy. However, there is no cure and HIV is now considered a chronic disease [3]. In 2022, 630,000 people died from AIDS-related illnesses worldwide [1], and HIV/AIDS was the eleventh most common cause of disability-adjusted life-years globally in 2019–the second most common cause for individuals 25–49 years of age, and the ninth most common at 10-24 years of age [4]. A reduction in lifespan is one strategy to estimate a disease’s impact, although the traditional lifespan approach can be of limited value when the disease can be acquired at different ages. Life years lost (LYL) is a method of estimating disease impact that is calculated based on the age of onset or diagnosis of a condition [5] to overcome this limitation, and has been developed into an R package [6]. Average years of life lost (AYLL) describes the average number of LYL across all ages, to represent the number of additional years an individual would be expected to live if not for premature death from their disease versus the general population in their age group ([7,8]). This method is particularly valuable for conditions like AIDS, where the age of onset can vary widely.
LYL has previously been applied to cancer [9], epilepsy [10], and mental illness [11], though it has not frequently been used in HIV/AIDS [12,13,14]. We have previously calculated LYL in cohorts of patients with an HIV diagnosis without an AIDS diagnosis versus those with an AIDS diagnosis, regardless of HIV status [13]. We also calculated LYL in those with an HIV diagnosis regardless of AIDS status [14] and analyzed the demographic variables in the latter population. Here, we determine the LYL in those with an AIDS diagnosis. We have previously estimated LYL for patients with an HIV diagnosis at the ages of 0, 30, and 60 to be 39, 32, and 14, respectively, in this cohort [14]. Prior estimates for LYL in HIV/AIDS have been at 46 years lost following diagnosis at age 20 in a study in Iran [12]; 25 average years of life lost across all ages (AYLL) in a study in Tanzania due to six different illnesses that included HIV/AIDS [15]; and, in a US study (not including Puerto Rico), 12.8 AYLL for males and 16.5 years for females. In the latter study, LYL for individuals diagnosed with HIV at ages 20, 40, 60, and 80 years was 17.6, 14.1, 10.4, and 6.2 years, respectively, for males, and 24.5, 18.3, 12.1, and 7.3 years, respectively, for females [16].
LYL related to AIDS diagnosis has been estimated on a still more infrequent basis. A 2014 study estimated the burden of disease due to AIDS in the Brazilian Southern State of Santa Catarina at 257.5 years lost and 331.9 disability-adjusted life years (DALYs) per 100,000 total inhabitants, highest in males in the age groups of 30-44 and 45-59 [17]. A 2015 study in the same region estimated 593.1 DALYs/100,000 inhabitants (780.7 DALYs/100,000 men and 417.1 DALYs/100,000 women) among residents of the city of Tubarao, Santa Catarina State, Brazil, with men aged 30-44 years and women 60-69 years most affected. [18]. Other studies looked at sociodemographic variables, such as a 2016 descriptive study [19] that found a difference between males and females who died from AIDS and AIDS-related causes (987 males and 340 females) among youth with secondary education in South Africa between 2009-2011, and a 2022 study analyzing the association of AIDS deaths in females between 2007-2017 in Porto Alegre in Rio Grande do Sul, Brazil, with race/skin and social vulnerability indicators. The latter study estimated 86.5 years lost/1,000 females, with a higher proportion of deaths among females of White race/skin color (53.4%), but a higher rate of years of life lost among females of Black and mixed race/skin color living in regions with higher risk. [20]
We have previously demonstrated for HIV patients as a whole that various risk factors, such as poverty and transmission modality, are associated with greater LYL [13]. Poverty has previously been shown to be associated with decreased life expectancy among different age, gender, and racial/ethnic groups [21]. Risk factors, including different modes of transmission, have also been associated with differences in life expectancy [16,22].
Additionally, we have previously demonstrated reduced life expectancy in HIV patients compared with results from the mainland U.S., such as estimating 20-year-old to have approximately 22 years to live [14], as compared for example to one study estimating a 21-year-old to have 54.9 years left to live in 2000-2016 [23]. The earlier timeframe of the mainland U.S. study makes this likely a conservative comparison given that life expectancy has tended to improve over time based on this and other studies.
The estimation of life years lost allows the breakdown of specific contributors or causes of death at different ages of diagnosis, to evaluate the magnitude of each factor, and help implement focused public health programs. Life years lost have not been frequently estimated for HIV/AIDS in general, and the association between LYL specifically after an AIDS diagnosis and sociodemographic variables has not yet been evaluated for the Puerto Rican population per our knowledge. We previously characterized and estimated LYL in the Puerto Rico HIV/AIDS population [13,14]]. This included those HIV patients who received a diagnosis of AIDS, which entails an advanced HIV condition that is diagnosed based on specific AIDS-defining illnesses that are rare in the general population and tend to occur when circulating CD4+ lymphocytes are below <200/mm3, and correlates with untreated disease. The objective of the present study is to evaluate whether certain sociodemographic risk factors in patients with AIDS in Puerto Rico from 2000-2020 are associated with lower life expectancy as reflected in life years lost (LYL), as well as to detect trends such as level of poverty over time in this population that occur during this period.
2. Methods
Study Design and Participants
This study employed a retrospective cohort design. Our study population included people diagnosed with AIDS who received services under the Eligible Metropolitan Area (EMA) of San Juan, Puerto Rico, during the period from 2000 to 2020, and who had a documented date of diagnosis of AIDS and a date of death. We described sociodemographic characteristics, including gender, poverty level (%), documented mode of transmission, type of health insurance, and age of AIDS diagnosis in the study population. Posterior to describing the population, we estimated LYL by estimating life expectancy in people diagnosed with AIDS, and comparing with the general survivorship curves for Puerto Rico [24]. Subsequently, we calculated trends separately for various periods during the study for comparison.
We obtained the data for this study from electronic medical records of patients diagnosed with AIDS in the eligible metropolitan area (EMA) of San Juan, Puerto Rico, from 2000 to 2020. All information and data were kept strictly confidential, encoded with identification numbers, and stored only with those identification numbers. Access to coded or encrypted storage was physically limited to authorized personnel only via an access code. The San Juan Bautista School of Medicine IRB (EMSJBIRB-17-2022) approved the study.
Data Analysis
The population of AIDS patients was described using frequencies and proportions by category. Out of 24,143 patient records associated with a diagnosis of HIV and/or AIDS, the initial survey size for this study was 3,624 unique patients with a date of AIDS diagnosis. The sample size varies by analysis, and is noted in each case, since the information for some of the variables was not available. We only included patients who were diagnosed with AIDS and who had a date of death specified to be able to calculate the life expectancy, i.e., the average number of years between date of AIDS diagnosis and death. We then eliminated any patient data that appeared to be a duplicate or had incomplete or clearly incorrect information.
The relative impact of AIDS on individuals' means estimated life expectancy as a result of being diagnosed at a given age was estimated comparing with the null model for life expectancy of the survivorship curve of the 1999-2001 demographic survey for Puerto Rico [24]. Of note, evaluation of other survivorship curves (of other demographic surveys) showed only minimal differences and impact on the primary interpretation of the results. To analyze of the impact of the number of "Life Years Lost: LYL" related to a disorder, we used a method proposed by Andersen (2017) [5] and Erlangsen et al. (2017) [25]. This model considers the inherent challenge of evaluating life span for age-specific mortality rates (for details, see Andersen 2017 [5] and Plana-Ripoll et al. 2020 [6]). This approach has the advantage of estimating LYL from the time of the initial diagnosis of a specific disorder and comparing the average of these individuals with the general population (null model). The basic assumption is that an individual who would not have contracted HIV and developed AIDS would, on average, have had the same life span as the null model (general population). Consequently, the LYL is an estimate of the average mean number of years patients with the specific age of onset will lose. See reference [6,13], and [14] to see how the method has been used in another research.
Analyses were performed in R (version 4.2.2, R Core Team 2020) and Excel (version 16.72 Microsoft 2023). We utilized the "lilies" R package to estimate LYL, and our null distribution of life span is the general population [26]. Data wrangling and basic demographic and visualization tasks were done using the set of packages in "tidyverse" [27].
Analysis was performed with a generalized linear model for the association between life years lost and poverty level using a Gamma distribution, and between life years lost and insurance status, mode of transmission, and gender using a Gaussian distribution, with p-values less than 0.05 considered significant. We analyzed these factors in all patients with available demographic information in these categories, as well as an AIDS diagnosis date and a date of death. Regarding the poverty level, we compared the patient’s income in terms of the percentage of the national poverty level, which considers household income and family size [28], with the years of life lost using a gamma distribution model. Regarding insurance status, the patient’s status of being insured vs. uninsured and having private vs. public insurance, was compared with respect to average years of life lost for each group. Transmission or risk factor categories were also compared with respect to AYLL both by age group and overall. Lastly, males versus females were compared, both by age group and overall.
3. Results
Population Characteristics
This study used a data set that included 3,624 patients with a specific date of AIDS diagnosis and a date of death indicated, which was obtained from an initial data set of 24,143 patients with HIV/ AIDS belonging to the eligible metropolitan area (EMA) of San Juan, Puerto Rico, from 2000 to 2020.
The average age of AIDS diagnosis was 42.8 years for men and 41.4 years for women. For transgender patients, it was 40.7 years. In this study, individuals had an average annual income of $6,534. The majority of individuals (63.2 %) lived at or below 50% of the poverty level. Most individuals (85%) had public health insurance (58% had Medicaid, and the remaining 27% had Medicare/other public insurance). Additionally, 7.86% had private insurance, 2.48% had “other” insurance, 4.5% were uninsured, and 0.06% had no specified insurance information. 47.1% of individuals in this study reported being presumably infected through heterosexual contact, 25.6% through the use of intravenous drugs, and 20.9% through male-to-male sexual contact. Only 1% reported both homosexual contact and intravenous drug use, while 1% reported transfusion, and 2% reported perinatal transmission. Table 1 presents the demographic information of the patients.
LYL Results
The mean life expectancy of the general population of Puerto Ricans of 80.25 years old (76.7 years old for males and 83.6 years old for females.) is the mean life expectancy assumed by our model as the tau that we used for the maximum age required by the model for both males and females. We also tried varied the maximum tau between 80-99, with insignificant changes in interpretations of the main results.
Impact on AIDS Patients
The average expected LYL of all patients who were diagnosed with AIDS and already had a date of death (n = 505, after removing those with a date of death that preceded the date of AIDS diagnosis) is 28.56 overall (27.58-29.54), 54.75 years for the youngest patients (under 20) (35.87-73.63), 42.05 at age 30 (37.87-46.23), and 15.25 at age 60 (12.65-17.85). The average life expectancy across all ages (years of life remaining after the diagnosis) of an AIDS-diagnosed individual is between 5 and 8 years. The life expectancy of individuals with AIDS, irrespective of the age of onset, is many years less than that of the general population. An individual who is diagnosed with AIDS, at the age of 20, 30 and 50, has an expected mean lifespan of another ± 9, 10 and 7 years, respectively. The average life expectancy considering the whole population across all ages is ± 40 years remaining to live for an age-matched cohort.
Poverty Level
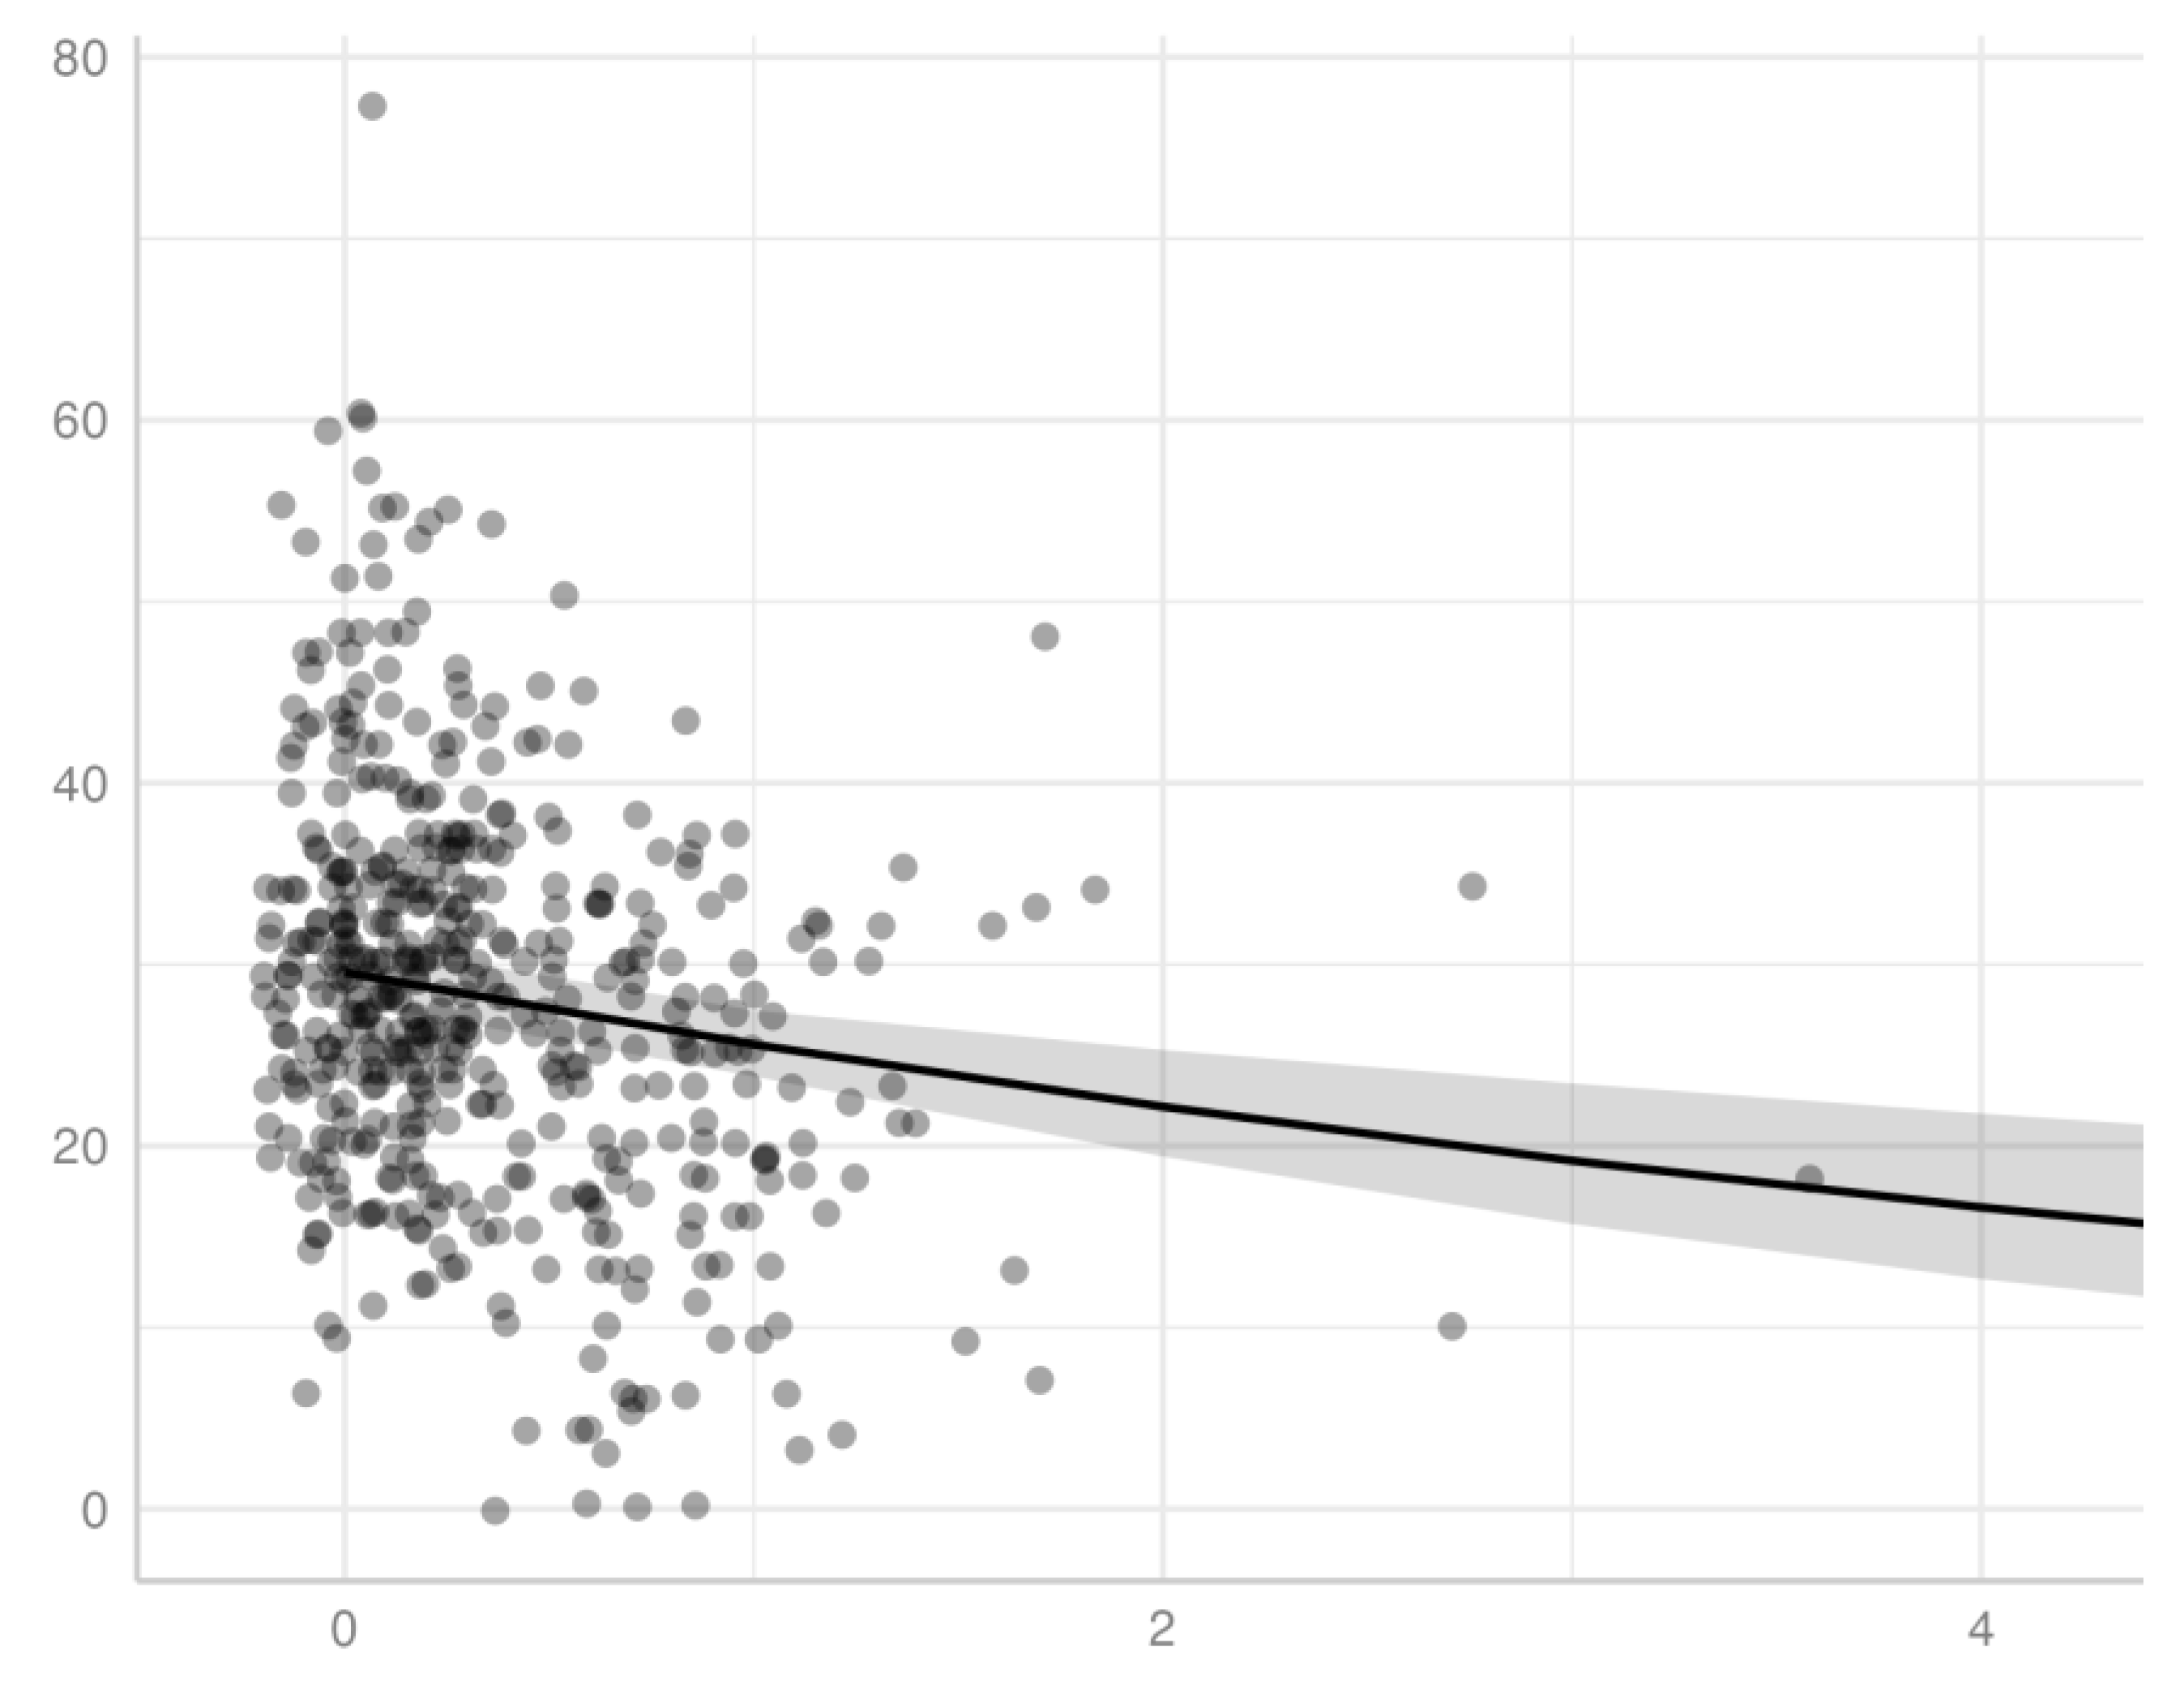
We demonstrated a significant inverse association for patients diagnosed with AIDS between income, measured by percentage of the poverty level, and LYL (p < 0.001), using a gamma distribution model. We observed this association model across all ages of AIDS diagnosis for patients in this study (Figure 2), as well as within specific age ranges of AIDS diagnosis, specifically for those diagnosed at the age ranges of 20-29, 30-39, 40-49, 50-59, and 60-69. An individual diagnosed with AIDS with <100% poverty level at the age of 35, 45, and 55 has an expected mean lifespan of approximately 44.4, 51.7, and 59.7, respectively. Of note, the latter set of ranges excludes the extremes of age, which had a smaller sample size and did not generate statistical significance, potentially related to lack of power. Extreme age ranges may also have less predictive accuracy with respect to both LYL as a measure of impact on survival (for example, in an elderly individual with a lower remaining life expectancy) as well as current household income as a measure of socioeconomic status (for example in a child or retired individual with no income.)
Figure 1.
Mean LYL versus poverty level of individuals diagnosed with AIDS. The points represent individuals, and the line represents predicted values of LYL based on a gamma distribution model, including 95% confidence levels (shaded area). The threshold for 100% the federal poverty limit is equal to 1. The x-axis excluded values larger than 3x the poverty level (only 1 data point.).
Poverty Level Over Time
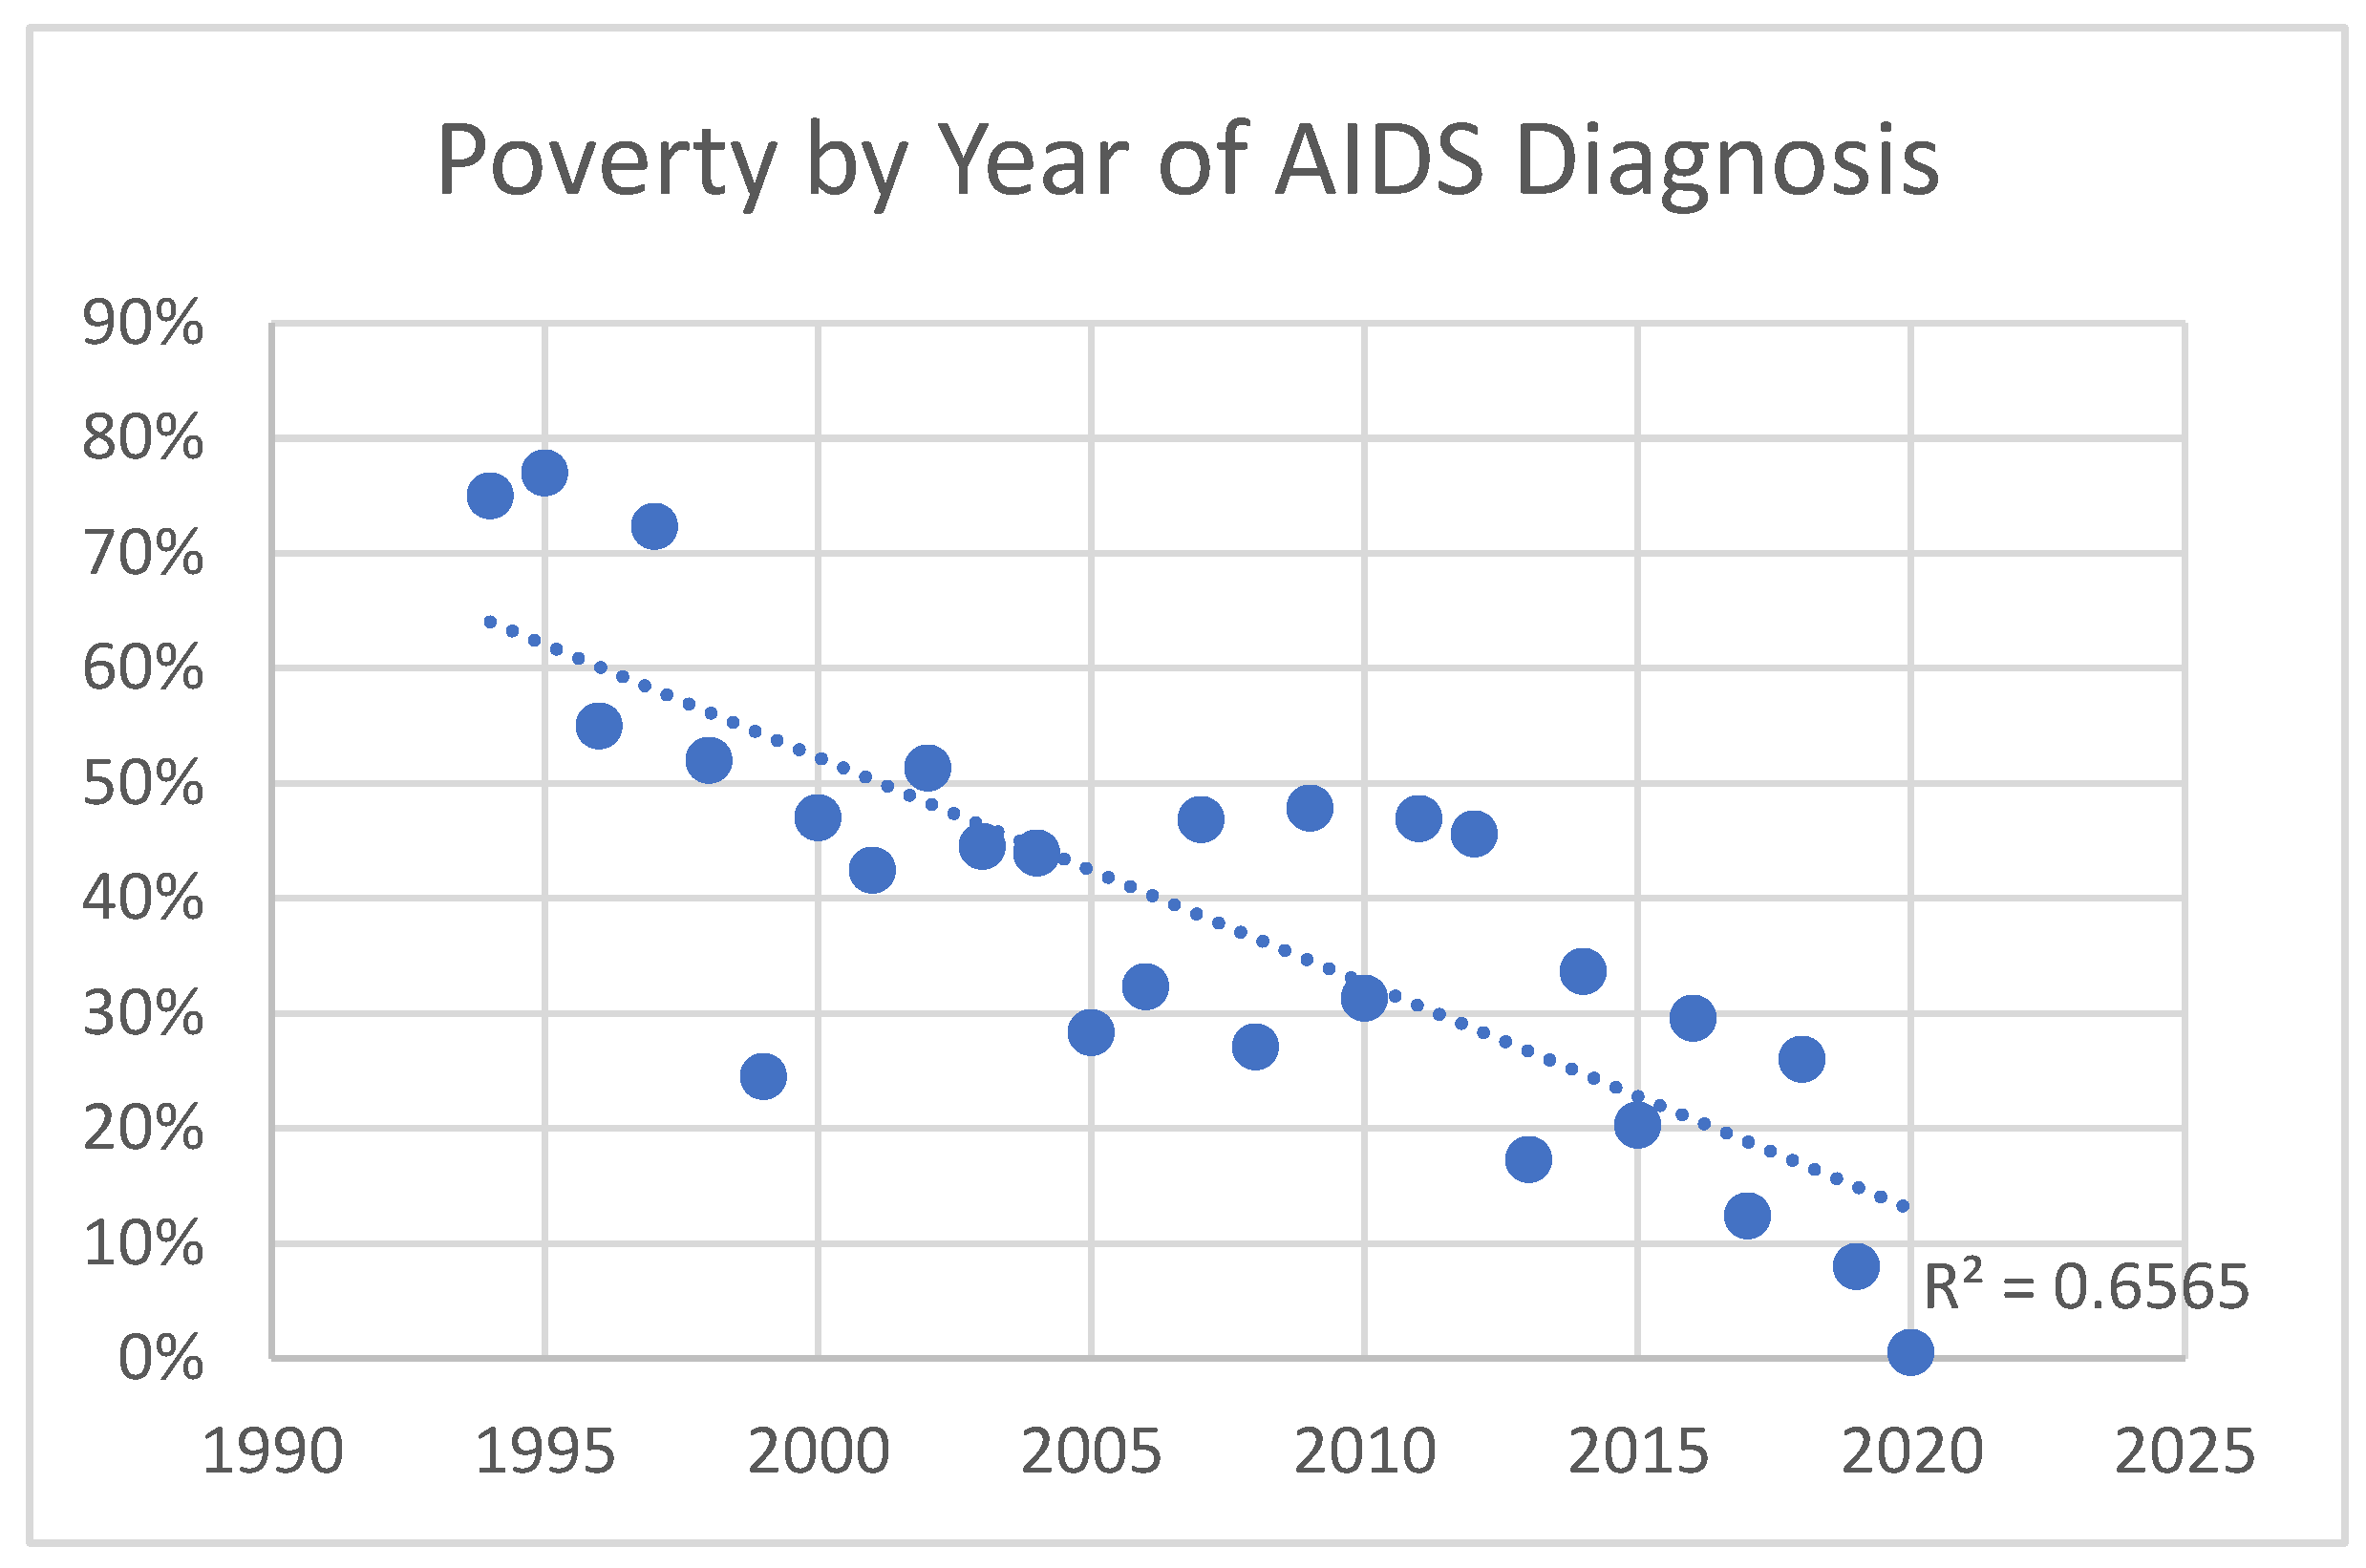
Poverty level increased over time in those diagnosed with AIDS, as well as HIV in general. The trend was greater for those with AIDS. Those diagnosed with HIV before 2010 had an average income at 40% of the poverty limit, versus 20% after 2010. (p=0.0003) Those diagnosed with AIDS before 2010 had an average income at 40% of the poverty limit, versus 30% for those diagnosed after 2010. (p=0.03) The trend for those diagnosed <1990, 1990-2000, 2000-2010, and 2010-2020 was 40%, 40%, 30%, and 20%, respectively, for HIV, and 170%, 50%, 40%, and 30% for AIDS. This indicates greater levels of poverty for those diagnosed with HIV and AIDS over time, which is more pronounced in those with AIDS. Thus, economic disparity has increased with AIDS in particular becoming more and more a disease of the poor (Figure 2 and Figure 3).
Figure 2.
Poverty by year of HIV diagnosis: Linear regression of level of poverty (by percentage of poverty limit) of individuals diagnosed with HIV as a function of year of diagnosis.
Figure 2.
Poverty by year of HIV diagnosis: Linear regression of level of poverty (by percentage of poverty limit) of individuals diagnosed with HIV as a function of year of diagnosis.

Figure 3.
Poverty by year of AIDS diagnosis: Linear regression of level of poverty (by percentage of poverty limit) of individuals diagnosed with AIDS as a function of year of diagnosis.
Figure 3.
Poverty by year of AIDS diagnosis: Linear regression of level of poverty (by percentage of poverty limit) of individuals diagnosed with AIDS as a function of year of diagnosis.
Mode of Transmission
Significantly greater LYL were found across all ages of patients diagnosed with AIDS with perinatal transmission compared to other modes of transmission, and greater LYL were found with IDU and MSM combined compared with heterosexual contact. Other differences were observed within specific age groups. Specifically, in the age group 20-29, IDU alone had greater LYL than IDU and MSM combined. (Figure 4). However, as a general pattern LYL was generally similar among transmission methods within a given group age category.
Medical Insurance
There was no significant difference found between insurance categories for LYL when calculated across all ages for AIDS patients in this study. Although greater LYL were found in those with no insurance (34.6) versus those with insurance (29.5), the difference was not significant (p = 0.13).
Among individuals with age range of diagnosis between 40-49, however, we did demonstrate significantly greater LYL were found in those with no insurance versus with insurance (34.3 versus 29.2, respectively, p = 0.04.) All age groups exhibited this general trend, but it was only significant in the 40-49 age group, which also included the greatest number of patients (n=179 with insurance, 7 without). Among the age group of 40-49 years, those with no insurance also had significantly greater LYL than those with public insurance or Medicaid specifically. No significant difference in LYL was observed between public versus private insurance in any age group, nor overall. We also found no significant difference between specific types of public insurance (e.g., Medicaid versus Medicare or other public insurance.)
Gender
We found no association with gender, with approximately equal LYL found overall, and within all age groups between males and females with AIDS. This was also previously found to be the case with males and females with HIV generally. [14]. Overall, patients lost a total of 28.6 years (28.4 ± 1.2 for males, and 28.9 ± 1.8 for females.) Transgender patients and those who refused to answer the question of gender tended to have greater AYLL, but these were few in number (n=1 and 1, respectively). In general, as we previously found for HIV/AIDS patients ([13,14]), number of life years lost decreased with increased age at AIDS diagnosis. Of note, our use of a Gaussian distribution for comparison of LYL is justified, as LYL values followed a normal distribution (Shapiro-Wilks test of normality, p >0.05; see Figure 5, below.)
Trends Over Time in AIDS Patients
Over the years of this study, AIDS diagnoses were made on average at a greater age in later years compared with earlier years of this data set, and was also at a greater age than for HIV (42.6 ± 1.1 prior to 2010 versus 49.6 after 2010 ±1.6 for AIDS diagnoses, versus 38.3 ± 0.7 prior to 2010 versus 48.3 ± 1.8 after 2010 for HIV diagnosis). Additionally, deaths occurred on average at a higher age during later years (e.g., recorded deaths in this population of HIV patients tended to occur on average between 42-50 years of age through 2012, then between 51-60 from 2013-2022). Diagnoses themselves initially increased and then decreased while deaths increased. The proportion of AIDS to HIV diagnoses increased over time. As noted above, poverty level in those diagnosed with AIDS trended to increased poverty over time, suggesting growing disproportionate affecting of those without means.
4. Discussion
Various demographic factors are associated with LYL among AIDS patients. Age of diagnosis carries an association with LYL, as previously demonstrated among HIV patients [14], as expected, given there are fewer years to lose with age. A newborn diagnosed with AIDS is likely to lose approximately 40 years of life, while a 50-year-old is expected to lose closer to 20 years of life. This trend is consistent with other studies estimating LYL in the United States ([16]). AIDS diagnoses are associated with greater LYL than HIV diagnoses, despite generally occurring at a later age. On average across all ages, those diagnosed with AIDS had 5-8 years left to live, versus those diagnosed with HIV, who had 12-14 years left. Compared to the average 31.67 life years lost following HIV diagnosis at age 30 [13], those diagnosed with AIDS at age 30 lost 42.05. Greater LYL for AIDS vs. HIV patients overall were also exhibited within the most impoverished segments of the population, where those with AIDS below 100% of the poverty level at the age of 35 and 45 had an expected mean lifespan of approximately 44.4 and 51.7 respectively, versus the HIV population overall below 100% of the poverty level with an expected mean lifespan of 51.2 ± 2.8 and 56.2 ± 2.5 years, respectively [14]. Diagnosis at later stages of disease may allow for less control of the disease and greater LYL that result. This finding is consistent with prior findings looking at those with HIV who never developed AIDS versus all those who developed AIDS [13], and also consistent with previous results in 2016 [16] indicating that those with late-stage disease at diagnosis (stage 3, i.e., AIDS) had a life expectancy that was, on average, 6.6 years lower than that for persons with HIV who never received a diagnosis of AIDS (stage 3 HIV). This indicates poorer outcomes with later diagnosis and more advanced/uncontrolled disease. 5.9 million people did not know they were living with HIV in 2021, per UNAIDS data [1], signifying the prevalence of those who are not aware that they were infected initially and are at risk of progressing to later stages of the disease before diagnosis and treatment.
Furthermore, certain risk factors are associated with increased mortality and trends associated this. We noted not only a significant association with poverty level, where poverty is associated with greater LYL, but that AIDS diagnoses have tended to occur in poorer populations over time. This signifies that this is becoming more and more a disease of the poor over time, particularly as treatments such as ART have been available to reduce, if not eliminate, the increased mortality in this population. This is further highlighted by the more pronounced trend associated with AIDS diagnoses versus HIV, suggesting that those who are diagnosed late or are found to be already be progressed AIDS when they are first discovered to be HIV positive tend to be those with less access to healthcare resources and in more underprivileged segments of society, even when as a whole our population tended to have high levels of poverty.
Certain modes of transmission were also associated with greater LYL than others. Although. potentially expected given the association with age, significantly greater AYLL were found following perinatal transmission compared with other modes of transmission. Greater LYL were also found in the IDU and MSM combined group versus heterosexual contact for patients overall, which was significant across patients of all ages combined, though not significant within any age category, likely due to lower power within the individual age categories. The greater years lost with IDU and MSM likely relate to rates of transmissibility of the virus and other infections with intravenous injection and male-to-male sexual contact, and/or association with risky behaviors and other risk factors such as lower socioeconomic status in the injection drug group. It is also hard to know how the disease was transmitted when multiple modes of transmission are possible. In addition, we are assuming accurate reporting of sexual behavior represented in the data set, despite the stigma still associated with varying sexual behaviors that may reduce this accuracy [30]. Moreover, acceptable social behavior and associated stigma may also vary among age groups.
We found greater LYL in individuals without insurance versus those with insurance across all age groups, although this difference was only significant in the age range of 40-49 years. This age range had the highest number of patients and thus greater power. Other factors could also play a role, such as the fact that this age group may have been more likely to have insurance tied to employment, versus children or young adults, whose insurance may be through the parents, school, or another entity, or older patients who are eligible for Medicare. No significant difference in LYL was detected between public versus private insurance in any age groups, which may be due to no actual difference, or due to inadequate reporting or lack of power leading to a type II error. This is interesting since U.S. Medicaid insurance has previously been shown not to be equivalent in services to private insurance [31]. Of note, we have also observed the above trends concerning insurance in our prior analysis involving HIV patients as a whole, with or without AIDS [14].
Many of our results are generally consistent with prior studies. Poverty has been associated with lower life expectancy in different age, gender, and racial/ethnic groups [17], and socioeconomic, racial, and geographic disparities in HIV/AIDS have persisted with higher HIV/AIDS mortality in more socioeconomically deprived groups [32]. Transmission/risk factor categories have also been analyzed, with the MSM category being found to have a longer life expectancy than other groups in some studies [16,18], though we did not detect this trend. We also did not detect gender differences in this study on AIDS patients, nor in prior analyses on HIV patients as a whole ([13,14]). However, other studies did find gender differences with regard to AIDS life expectancy specifically ([13,19,20]), as well as HIV generally in one study [23] where it was also found in the mainland US that adults with HIV have similar life expectancy to the general population, which differs with our results in Puerto Rico. This difference does not appear to be related to sample size but instead appears to be reflective of our demographic in Puerto Rico, as our study was adequately powered and demonstrated nearly identical LYL between genders as a whole and across all age groups.
Our study is limited in that the sample sizes are unequal among ages, as the number of newborns, youth, and those aged 60 or above diagnosed with AIDS was small. There was also only one transgender patient in this study population. Additionally, the deaths reported during the study period by the San Juan Eligible Metropolitan Area (EMA) were not matched with the Puerto Rico Demographic Registry. Moreover, the data for the San Juan Eligible Metropolitan Area (EMA) does not include people who have been tested anonymously or people infected with HIV/AIDS who were not tested.
Currently, another limitation is in the ability of our estimated values for LYL to be compared with prior studies, given the lack of prior studies using the same time frames, methods, and populations. For example, few studies include Puerto Rico (e.g., a 2016 U.S. study [16] and a 2010 U.S. study [29]) and therefore will likely produce different results due to the different population and access to care in the mainland United States versus Puerto Rico, in addition to different time frames and methods. Additionally, methods may vary (e.g., using a life table from a different year). The use of more recent data may also yield different results, with mortality potentially improved due to developments in treatment [16] that can help improve life expectancy, though not without co-morbidities [23]. However, HIV mortality in the United States mainland [23] is substantially different from that in Puerto Rico, likely reflective of socioeconomic, racial, and geographic disparities [32]. Nonetheless, caution is needed in comparing different studies with different methods that may estimate different quantities, and researchers should consider the purpose of the research and the type of available data when deciding among methods to estimate LYL [7].
Data limitations also exist, such as restrictions in categorization or limitations in knowledge to assign categories. For example, it may be challenging to determine with certainty the mode of transmission, particularly when more than one potential mode or risk factor exists. We combined MSM and IDU but did not include other combinations. The combined MSM and IDU group also reduced the number of patients in the individual MSM and IDU groups because we did not include individuals in more than one overlapping group, although the number in this combined group was relatively small.
In conclusion, we estimated average years of life lost to evaluate the impact of an AIDS diagnosis in Puerto Rico and evaluated associated risk factors. The number of life years lost (LYL) in AIDS patients is related to age of onset as well as to insurance/no insurance status, poverty level, and transmission mode, but not male versus female gender, and AIDS is becoming more of a disease of the poor with time. Additionally, those with AIDS have fewer years of life to live than those with HIV, despite AIDS being diagnosed later than HIV and an inverse association with age and LYL. This study has important implications regarding sociodemographic disparities in HIV/AIDS mortality.
Author Contributions
Conceptualization, GB, DR, RT; methodology, GB, DR, RT.; software DR, RT; formal analysis, DR, RT; investigation, GB, DR, RT; writing—original draft preparation, DR; writing—review and editing, GB, RT.; visualization, X.X.; supervision, GB. All authors have read and agreed to the published version of the manuscript.
Funding
This research received no external funding.
Institutional Review Board Statement
The San Juan Bautista School of Medicine IRB (EMSJBIRB-17-2022) approved the study on 17 January 2023.
Informed Consent Statement
Not applicable.
Acknowledgments
This study was supported by the San Juan Bautista School of Medicine. We kindly appreciate Dr. Estela S. Estapé, SJBSM Research Center director, for the manuscript's critical review. We thank Mrs. Ana Torres, Administrative Manager of the AIDS Task Force, for granting us permission to access the data.
Conflicts of Interest
There are no conflicts of interest to declare.
Abbreviations
The following abbreviations are used in this manuscript:
| AIDS | Acquired Immunodeficiency Syndrome |
| ART | Antiretroviral Therapy |
| AYLL | Average Years of Life Lost |
| EMA | Eligible Metropolitan Area |
| HIV | Human Immunodeficiency Virus |
| MSM | Men who have Sex with Men |
| IDU | Intravenous Drug Use |
| LYL | Life Years Lost |
| PR | Puerto Rico |
References
- UNAIDS. Global HIV & AIDS Statistics — 2023 Fact Sheet. 2023. Available online: https://www.unaids.org/en/resources/fact-sheet Accessed October 20, 2024.
- Swinkels HM, Nguyen AD, Gulick PG. HIV and AIDS. [Updated 2024 Jul 27]. In: StatPearls [Internet]. Treasure Island (FL): StatPearls Publishing; 2025 Jan-. Available from: https://www.ncbi.nlm.nih.gov/books/NBK534860/.
- Nokes K. Revisiting how the chronic illness framework can be applied to people living with HIV/AIDS. Sch Inq Nurs Pract 1998, 12:27–31.
- Global burden of 369 diseases and injuries in 204 countries and territories, 1990–2019: a systematic analysis for the Global Burden of Disease Study 2019. Lancet (London, England). 2020;396(10258):1204–22. Epub 2020/10/19. [CrossRef]
- Andersen PK. Life years lost among patients with a given disease. Stat Med. 2017; 36:3573–3582. PMID: 28585255. [CrossRef]
- Plana-Ripoll, O., Canudas-Romo, V., Weye, N., Laursen, T. M., McGrath, J. J., & Andersen, P. K. lillies: An R package for the estimation of excess Life Years Lost among patients with a given disease or condition. PloS one. 2020; 15(3), e0228073. [CrossRef]
- Chudasama YV, Khunti K, Gillies CL, Dhalwani NN, Davies MJ, Yates T, Zaccardi F. Estimates of years of life lost depended on the method used: tutorial and comparative investigation. J Clin Epidemiol. 2022 Oct; 150:42-50. Epub 2022 Jun 24. PMID: 35760239. [CrossRef]
- Salama, A. K., Rosa, N.d, Scheri, R. P., Herndon, J. E., Tyler, D. S., Marcello, J., Pruitt, S. K., & Abernethy, A. P. The effect of metastatic site and decade of diagnosis on the individual burden of metastatic melanoma: contemporary estimates of average years of life lost. Cancer investigation, 2012; 30(9), 637–641. [CrossRef]
- Lebanova, H., Stoev, S., Naseva, E., Getova, V., Wang, W., Sabale, U., & Petrova, E.. Economic Burden of Cervical Cancer in Bulgaria. International Journal of Environmental Research and Public Health. 2023; 20(3), 2746.
- Dreier, J. W., Laursen, T. M., Tomson, T., Plana-Ripoll, O., & Christensen, J. Cause-specific mortality and life years lost in people with epilepsy: a Danish cohort study. Brain. 2023; 146(1), 124-134.
- Ruffieux, Y., Wettstein, A., Maartens, G., Folb, N., Mesa Vieira, C., Didden, C., Haas, A. D. Life-years lost associated with mental illness: a cohort study of beneficiaries of a South African medical insurance scheme. medRxiv. 2023-01.
- Yaghoobi, H., Ahmadinia, H., Shabani, Z., Vazirinejad, R., Safari, R., Shahizadeh, R., Zolfizadeh, F., & Rezaeian, M. Life expectancy and years of life lost in HIV patients under the care of BandarAbbas Behavioral Disorders Counseling Center. Nepal journal of epidemiology, 2017; 7(4), 702–712. [CrossRef]
- Burgos-Barreto G, Reyes D, Tremblay R. Life Expectancy and Life Years Lost After HIV or AIDS Diagnosis: A Retrospective Cohort Study. International Journal of Current Science Research and Review. 2023; 6(4), 2409-2416.
- Burgos-Barreto, G., Reyes, D., & Tremblay, R. L. (2024). Life Expectancy and Life Years Lost After HIV Diagnosis in Puerto Rico, 2000- 2020. British Journal of Healthcare and Medical Research, Vol - 11(1). 180-194.
- Rumisha SF, George J, Bwana VM, Mboera LEG. Years of potential life lost and productivity costs due to premature mortality from six priority diseases in Tanzania, 2006-2015. PLoS One. 2020 Jun 9;15(6):e0234300. PMID: 32516340; PMCID: PMC7282655. [CrossRef]
- Siddiqi, A., Hall, H. I., Hu, X. & Song, R. Population-Based Estimates of Life Expectancy After HIV Diagnosis: United States 2008-2011. JAIDS Journal of Acquired Immune Deficiency Syndromes, 2016; 72 (2), 230-236. [CrossRef]
- Gonçalves e Silva HC, Silva Jd, Traebert J. Burden of AIDS in a Brazilian state. J Infect Public Health. 2014 Jul-Aug;7(4):308-13. Epub 2014 Apr 29. PMID: 24786608. [CrossRef]
- Da Silva J, Ramos V, Da Silva HC, Traebert J. Morbidity and mortality due to AIDS: a study of burden of disease at a municipal level. Rev Inst Med Trop Sao Paulo. 2015 Sep-Oct; 57(5):407-11. PMID: 26603227; PMCID: PMC4660449. [CrossRef]
- De Wet N. Gendered differences in AIDS and AIDS-related cause of death among youth with secondary education in South Africa, 2009-2011. SAHARA J. 2016 Dec;13(1):170-177. PMID: 27739338; PMCID: PMC5642439. [CrossRef]
- Bernardelli M, Stahnke DN, Pattussi MP, López LC, Gonçalves TR. Years of potential life lost due to AIDS in female, in Southern Brazil: a descriptive study, 2007-2017. Epidemiol Serv Saude. 2022 Dec 2;31(3): e2022481. PMID: 36477186; PMCID: PMC9887985. [CrossRef]
- Singh GK, Lee H. Marked Disparities in Life Expectancy by Education, Poverty Level, Occupation, and Housing Tenure in the United States, 1997-2014. Int J MCH AIDS. 2021;10(1):7-18. Epub 2020 Dec 30. PMID: 33442488; PMCID: PMC7792745. [CrossRef]
- Marcus JL, Chao CR, Leyden WA, Xu L, Quesenberry CP Jr, Klein DB, Towner WJ, Horberg MA, Silverberg MJ. Narrowing the Gap in Life Expectancy Between HIV-Infected and HIV-Uninfected Individuals With Access to Care. J Acquir Immune Defic Syndr. 2016 Sep 1;73(1):39-46. PMID: 27028501; PMCID: PMC5427712. [CrossRef]
- Marcus JL, Leyden WA, Alexeeff SE, Anderson AN, Hechter RC, Hu H, Lam JO, Towner WJ, Yuan Q, Horberg MA, Silverberg MJ. Comparison of Overall and Comorbidity-Free Life Expectancy Between Insured Adults with and Without HIV Infection, 2000-2016. JAMA Netw Open. 2020 Jun 1;3(6): e207954. 2020; 7954. PMID: 32539152; PMCID: PMC7296391 . [CrossRef]
- FM. Tablas de vida abreviadas para Puerto Rico. 1999-2002 a 2008-2010. Estado Libre Asociado de Puerto Rico, Departamento de Salud, Secretaría Auxiliar de Planificación y desarrollo. 2013. Available online: www.salud.gov.pr Accessed March 20, 2023.
- Erlangsen A, Andersen PK, Toender A, Laursen TM, Nordentoft M, & Canudas-Romo V. Cause-specific life-years lost in people with mental disorders: a nationwide, register-based cohort study. The lancet. Psychiatry. 2017; 4(12), 937–945. [CrossRef]
- Plana-Ripoll, O. Lillies: Estimation of Life Years Lost. R package version 0.2.9. 2021. Available online: https://CRAN.R-project.org/package=lillies.
- Wickham H, Averick M, Bryan J, Chang W, McGowan LD, François R, Grolemund G, Hayes A, Henry L, Hester J, Kuhn M, Pedersen TL, Miller E, Bache SM, Müller K, Ooms J, Robinson D, Seidel DP, Spinu V, Takahashi K, Vaughan D, Wilke C, Woo K, Yutani H. “Welcome to the tidyverse.” Journal of Open-Source Software. 2019; *4*(43), 1686. Doi:10.21105/joss.01686 . [CrossRef]
- Poverty Guidelines. Assistant Secretary for Planning and Evaluation. Updated 2023. Accessed Jul 29, 2023. https://aspe.hhs.gov/topics/poverty-economic-mobility/poverty-guidelines.
- Harrison, KM, Song R, & Zhang X. Life Expectancy After HIV Diagnosis Based on National HIV Surveillance Data From 25 States, United States. JAIDS Journal of Acquired Immune Deficiency Syndromes. 2010; 53 (1), 124-130. [CrossRef]
- Kutner BA, Simoni JM, King KM, Goodreau SM, Norcini Pala A, Creegan E, Aunon FM, Baral SD, Rosser BRS. Does Stigma Toward Anal Sexuality Impede HIV Prevention Among Men Who Have Sex With Men in the United States? A Structural Equation Modeling Assessment. J Sex Med. 2020 Mar;17(3):477-490. Epub 2020 Jan 10. PMID: 31932256; PMCID: PMC7227779. [CrossRef]
- llen H, Gordon SH, Lee D, Bhanja A, Sommers BD. Comparison of Utilization, Costs, and Quality of Medicaid vs Subsidized Private Health Insurance for Low-Income Adults. JAMA Netw Open. 2021 Jan 4;4(1):e2032669. PMID: 33399859; PMCID: PMC9377505. [CrossRef]
- Singh GK, Azuine RE, Siahpush M. Widening Socioeconomic, Racial, and Geographic Disparities in HIV/AIDS Mortality in the United States, 1987-2011. Adv Prev Med. 2013;2013:657961. [CrossRef]
Figure 4.
Average LYL by mode of transmission type of individuals diagnosed with AIDS, including 95% confidence levels and the age of first diagnosis.
Figure 4.
Average LYL by mode of transmission type of individuals diagnosed with AIDS, including 95% confidence levels and the age of first diagnosis.
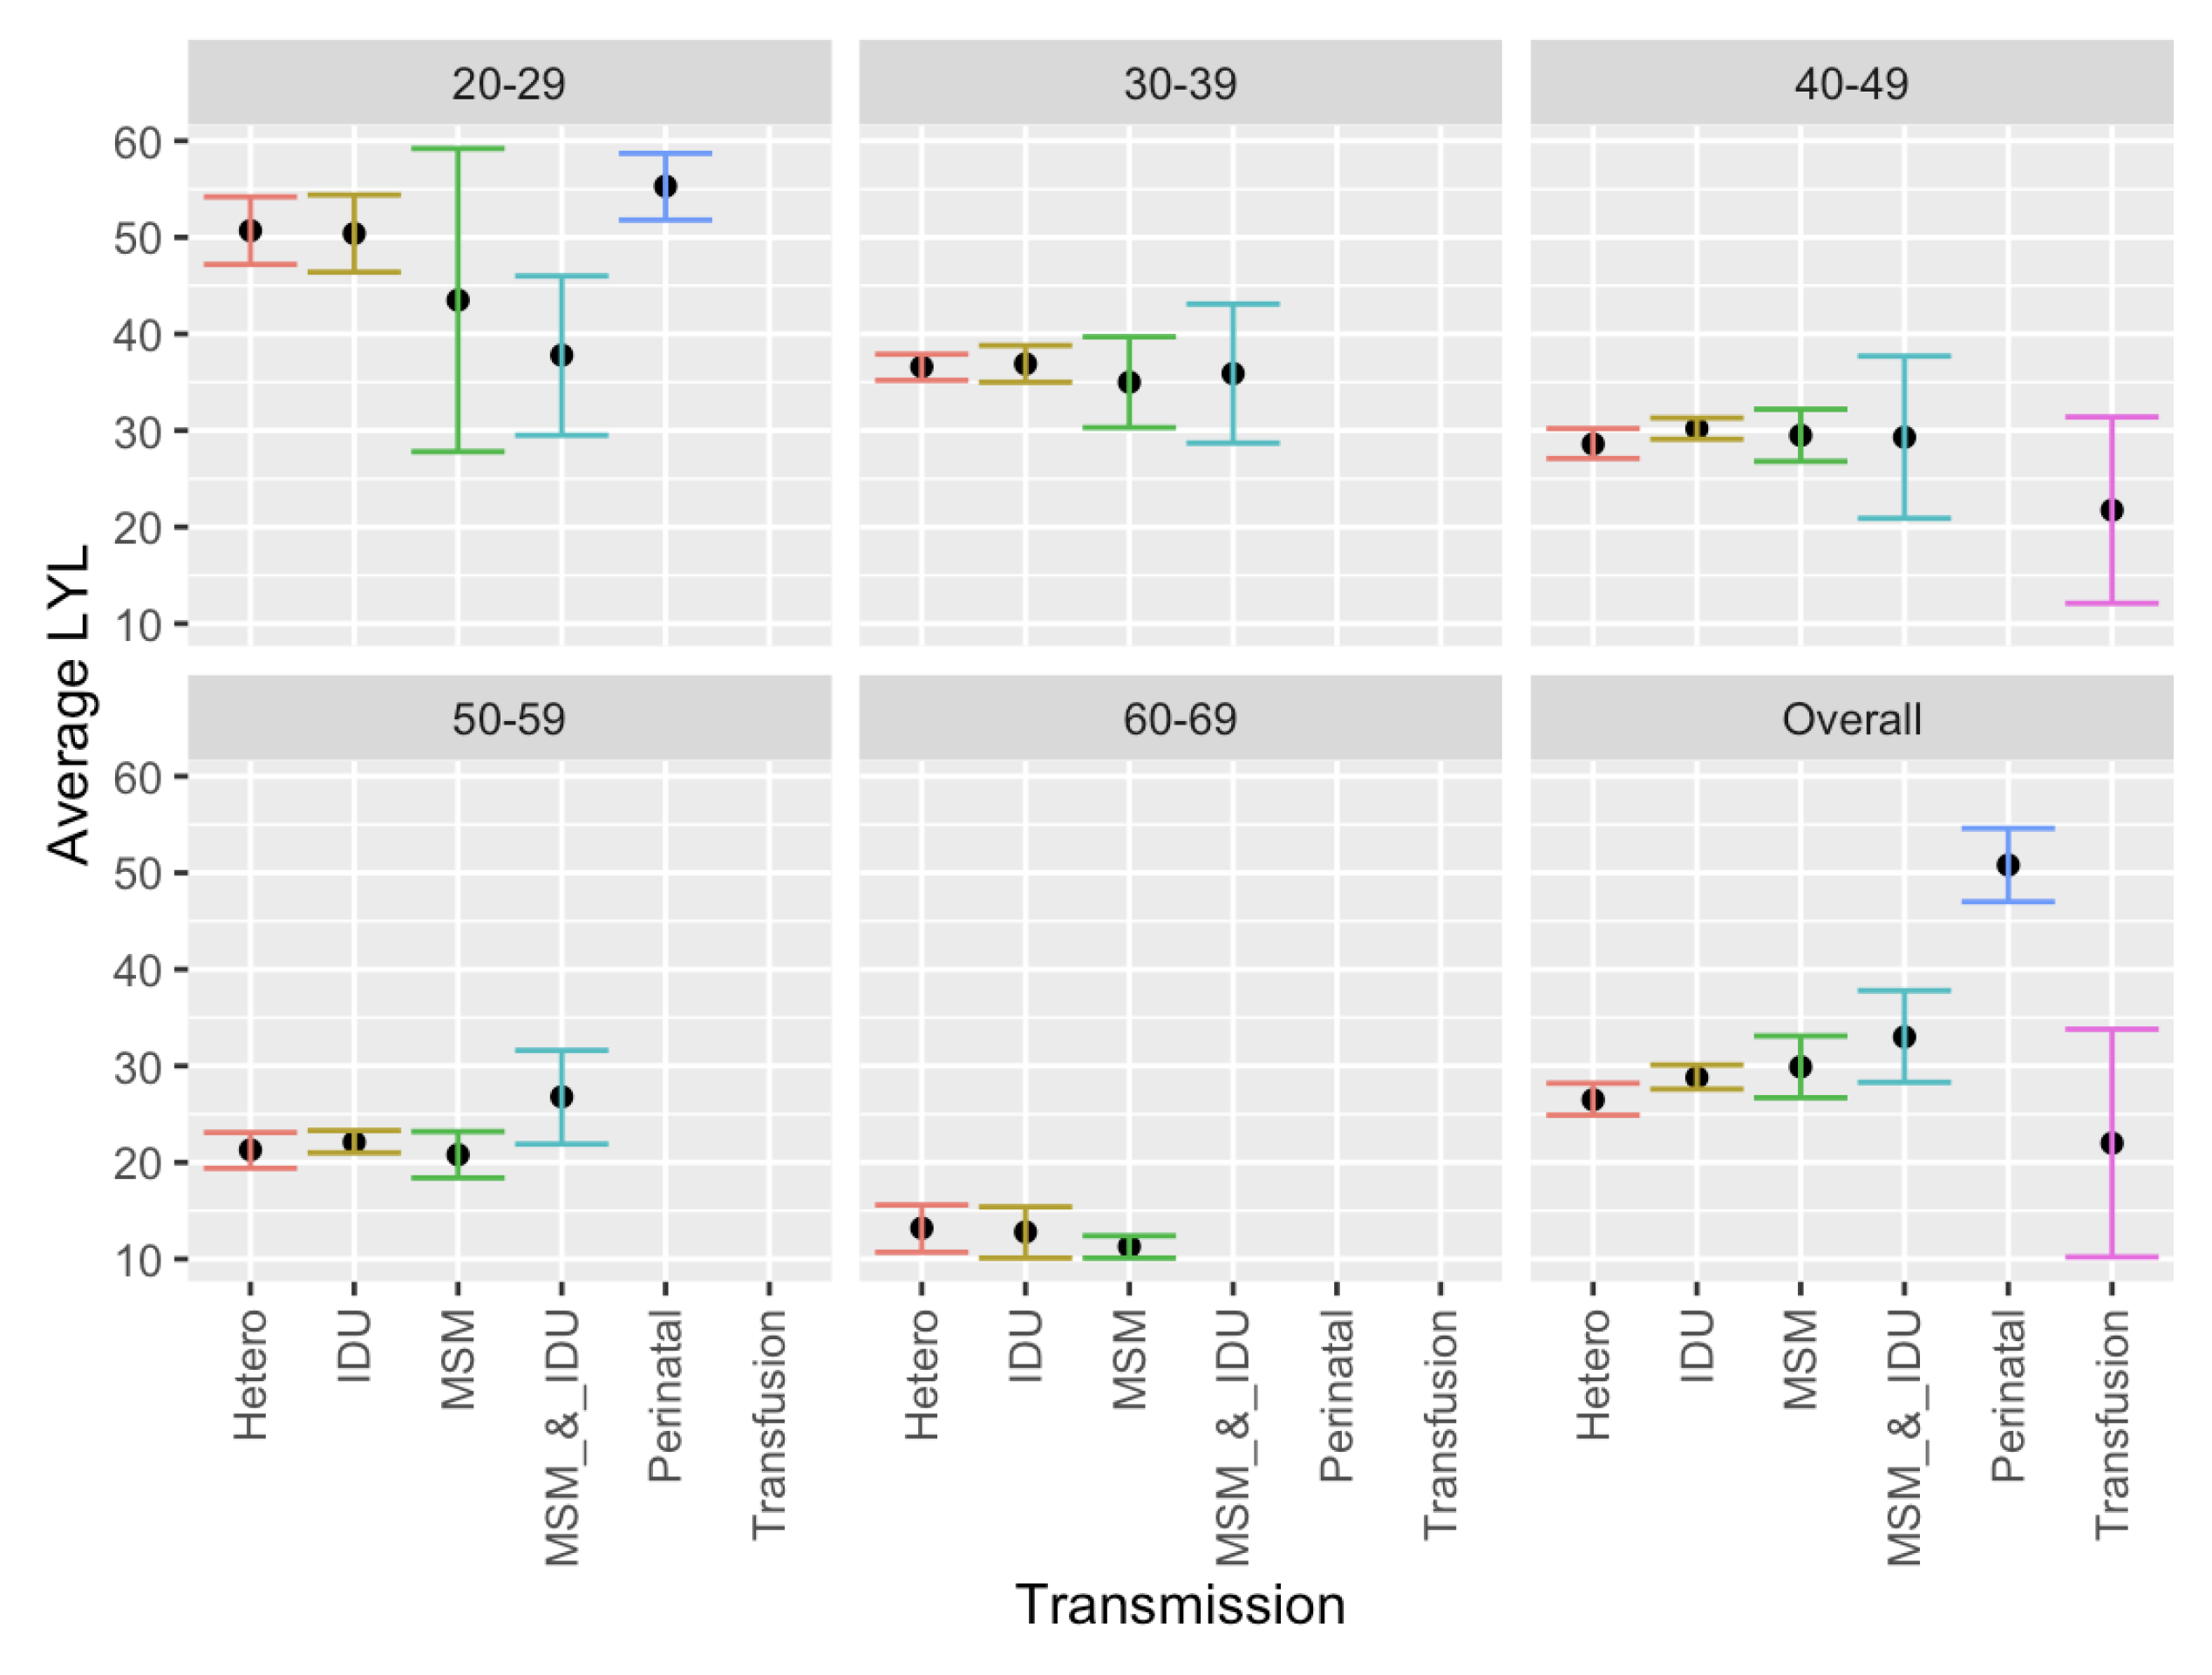
Figure 5.
Frequency distribution of LYL for all deceased individuals diagnosed with AIDS, irrespective of the age of diagnosis.
Figure 5.
Frequency distribution of LYL for all deceased individuals diagnosed with AIDS, irrespective of the age of diagnosis.
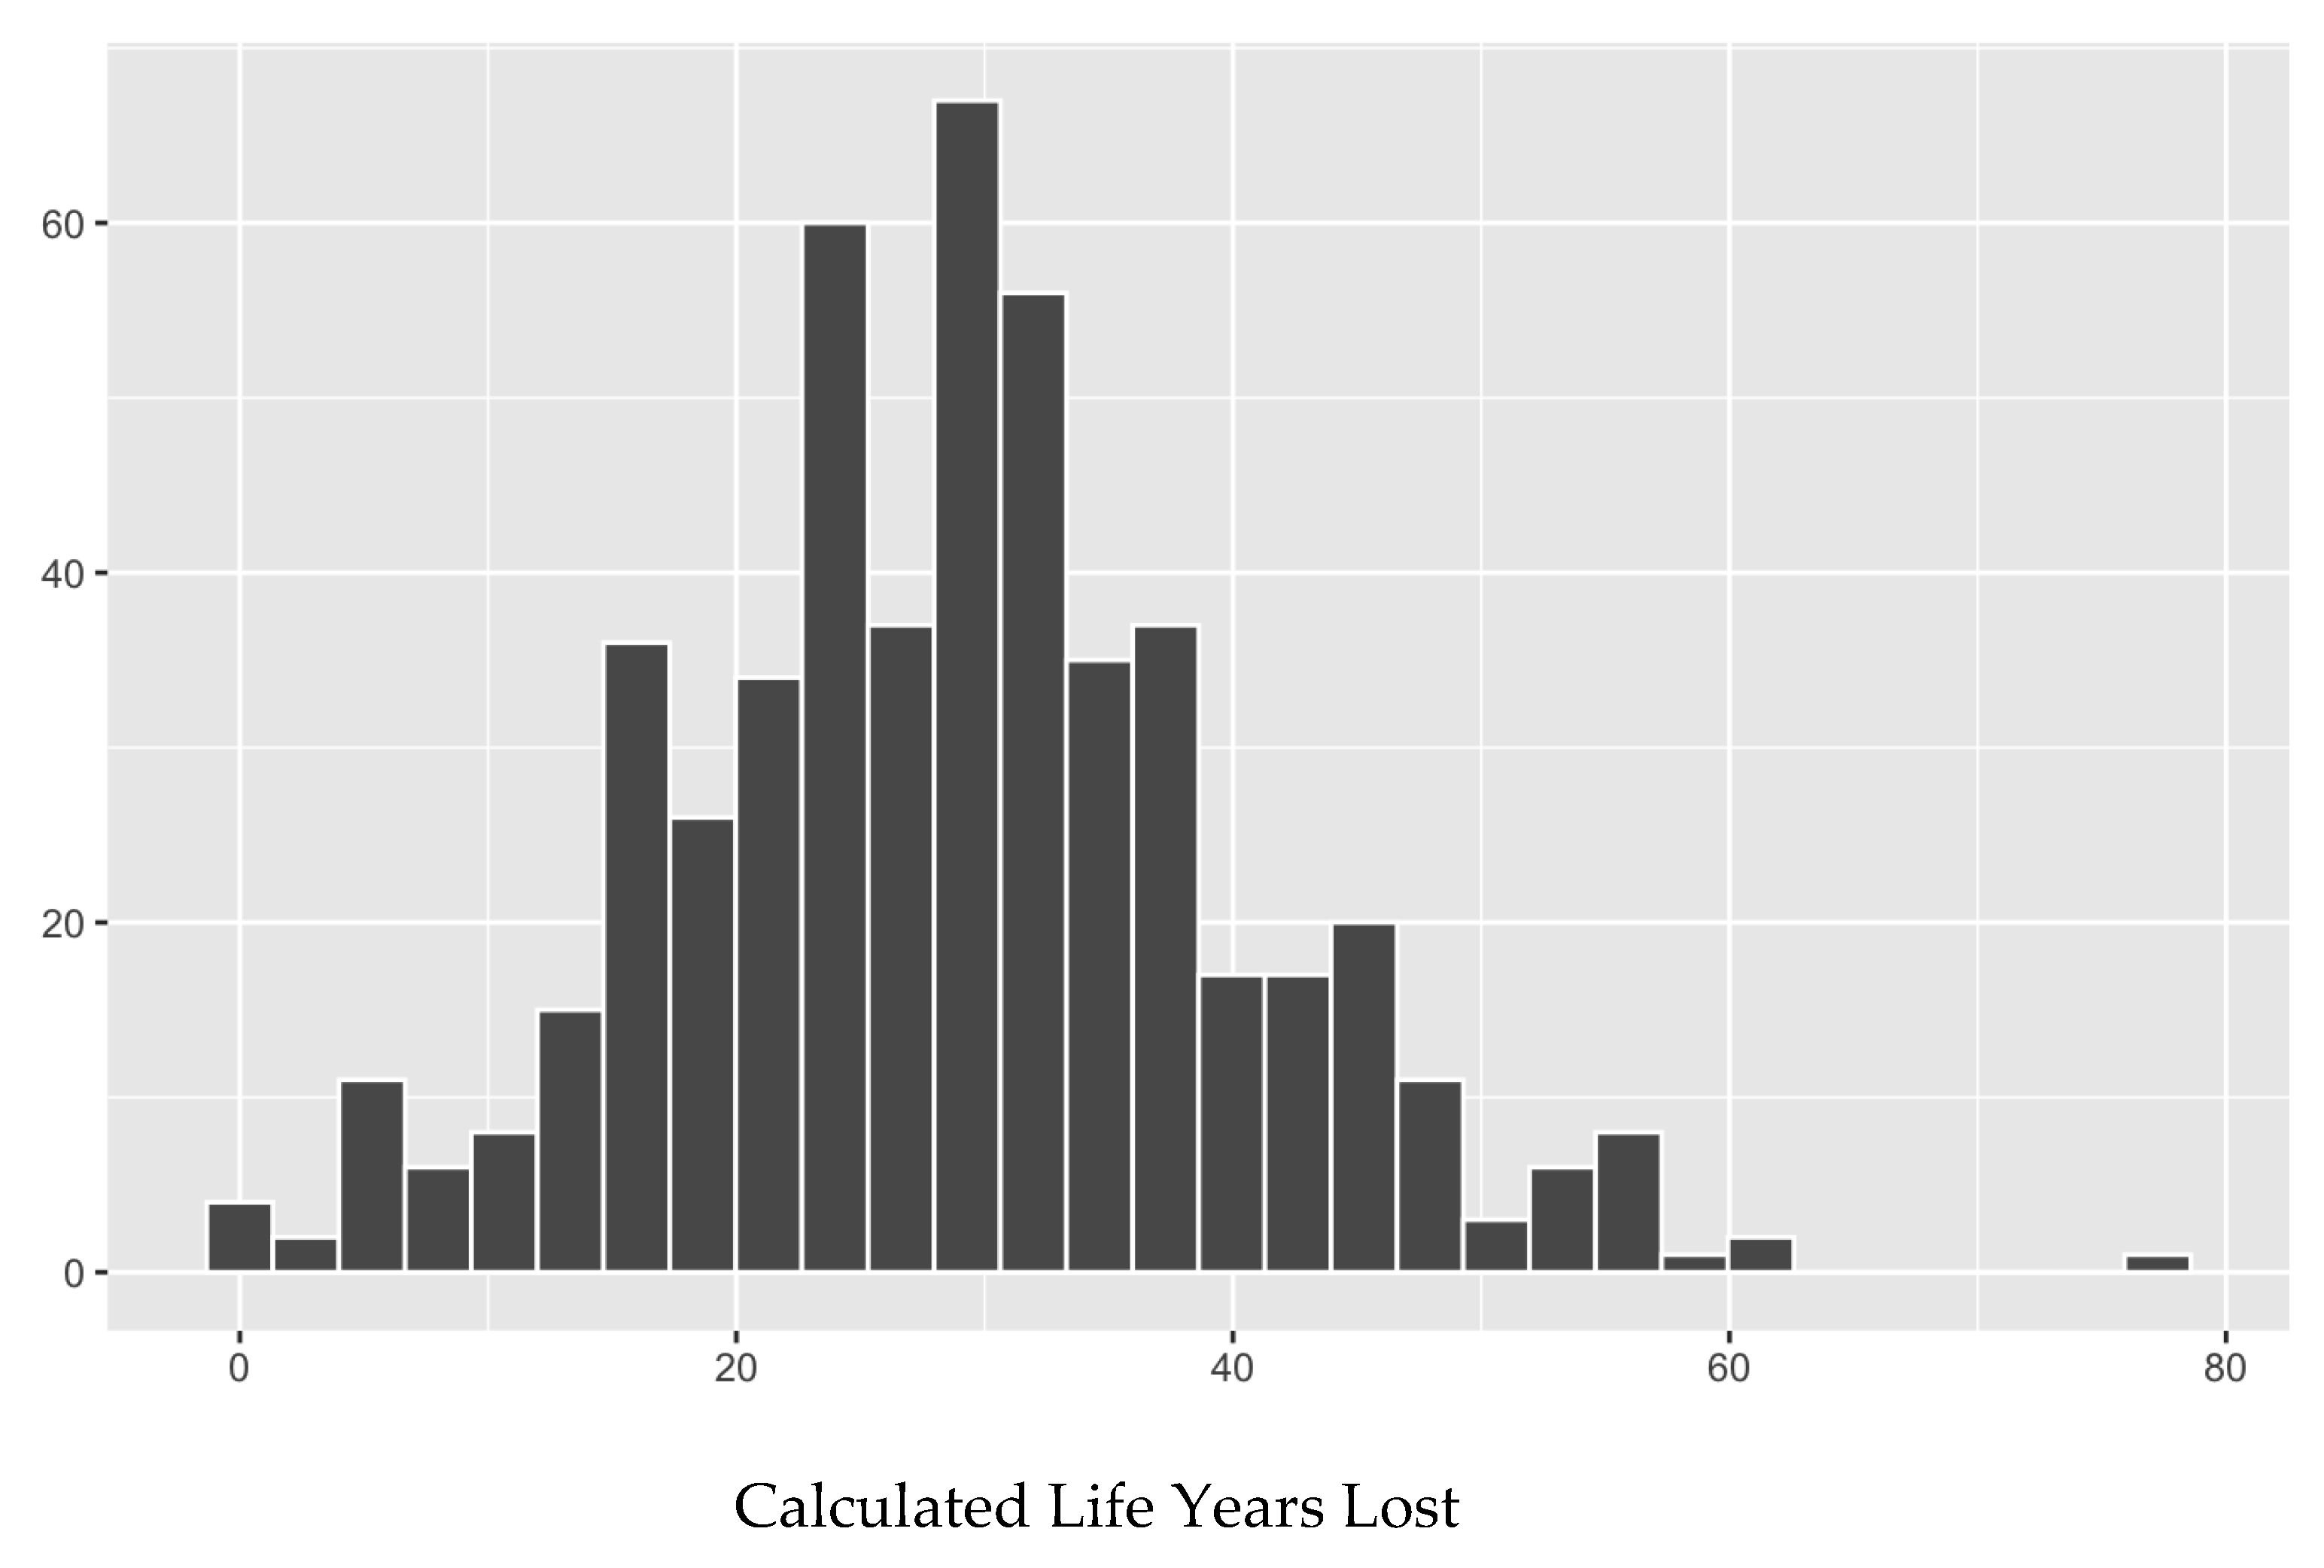

Table 1.
Demographic characteristics of AIDS patients in this study who received services under the Eligible Metropolitan Area (EMA) of San Juan, Puerto Rico, from 2000 to 2020.
Table 1.
Demographic characteristics of AIDS patients in this study who received services under the Eligible Metropolitan Area (EMA) of San Juan, Puerto Rico, from 2000 to 2020.
| Characteristic | N | Percent |
|---|---|---|
| Total | 3,624 | 100.00 |
|
Vital Status Alive Dead Unknown |
3,624 2,615 604 405 |
100.00 72.16 16.67 11.18 |
|
Gender Male Female Transgender No answer Unknown |
3,624 2,386 1,230 7 10 |
100.00 65.84 33.94 0.19 0.03 0.00 |
|
Age (years) at diagnosis 0-9 10-19 20-29 30-49 40-49 50-59 ≥ 60 |
3,624 22 36 382 977 1282 719 206 |
100.00 0.61 0.99 10.54 26.96 35.38 19.84 5.68 |
|
% Poverty Level ≤ 50 > 50% ≤ 100% > 100 “N/A” |
3,624 2,291 713 432 188 |
100.00 63.22 19.67 11.92 5.19 |
|
Type of Medical Insurance Public Medicaid Medicare Other public Private Other Uninsured Unknown |
3,624 3,084 2,118 311 655 285 163 90 2 |
100.00 85.10 58.44 8.58 18.07 7.86 2.48 4.50 0.06 |
|
Mode of transmission Heterosexual Intravenous Drug Use (IDU) Men Sex Men (MSM) Perinatal IDU & MSM Blood transfusion Other Hemophilia Not specified |
3,624 1,705 926 756 74 43 36 23 3 58 |
100.00 47.05 25.55 20.86 2.04 1.19 0.99 0.63 0.08 1.60 |
Disclaimer/Publisher’s Note: The statements, opinions and data contained in all publications are solely those of the individual author(s) and contributor(s) and not of MDPI and/or the editor(s). MDPI and/or the editor(s) disclaim responsibility for any injury to people or property resulting from any ideas, methods, instructions or products referred to in the content |
© 2025 by the authors. Licensee MDPI, Basel, Switzerland. This article is an open access article distributed under the terms and conditions of the Creative Commons Attribution (CC BY) license (http://creativecommons.org/licenses/by/4.0/).
Copyright: This open access article is published under a Creative Commons CC BY 4.0 license, which permit the free download, distribution, and reuse, provided that the author and preprint are cited in any reuse.


