Submitted:
18 September 2025
Posted:
19 September 2025
You are already at the latest version
Abstract
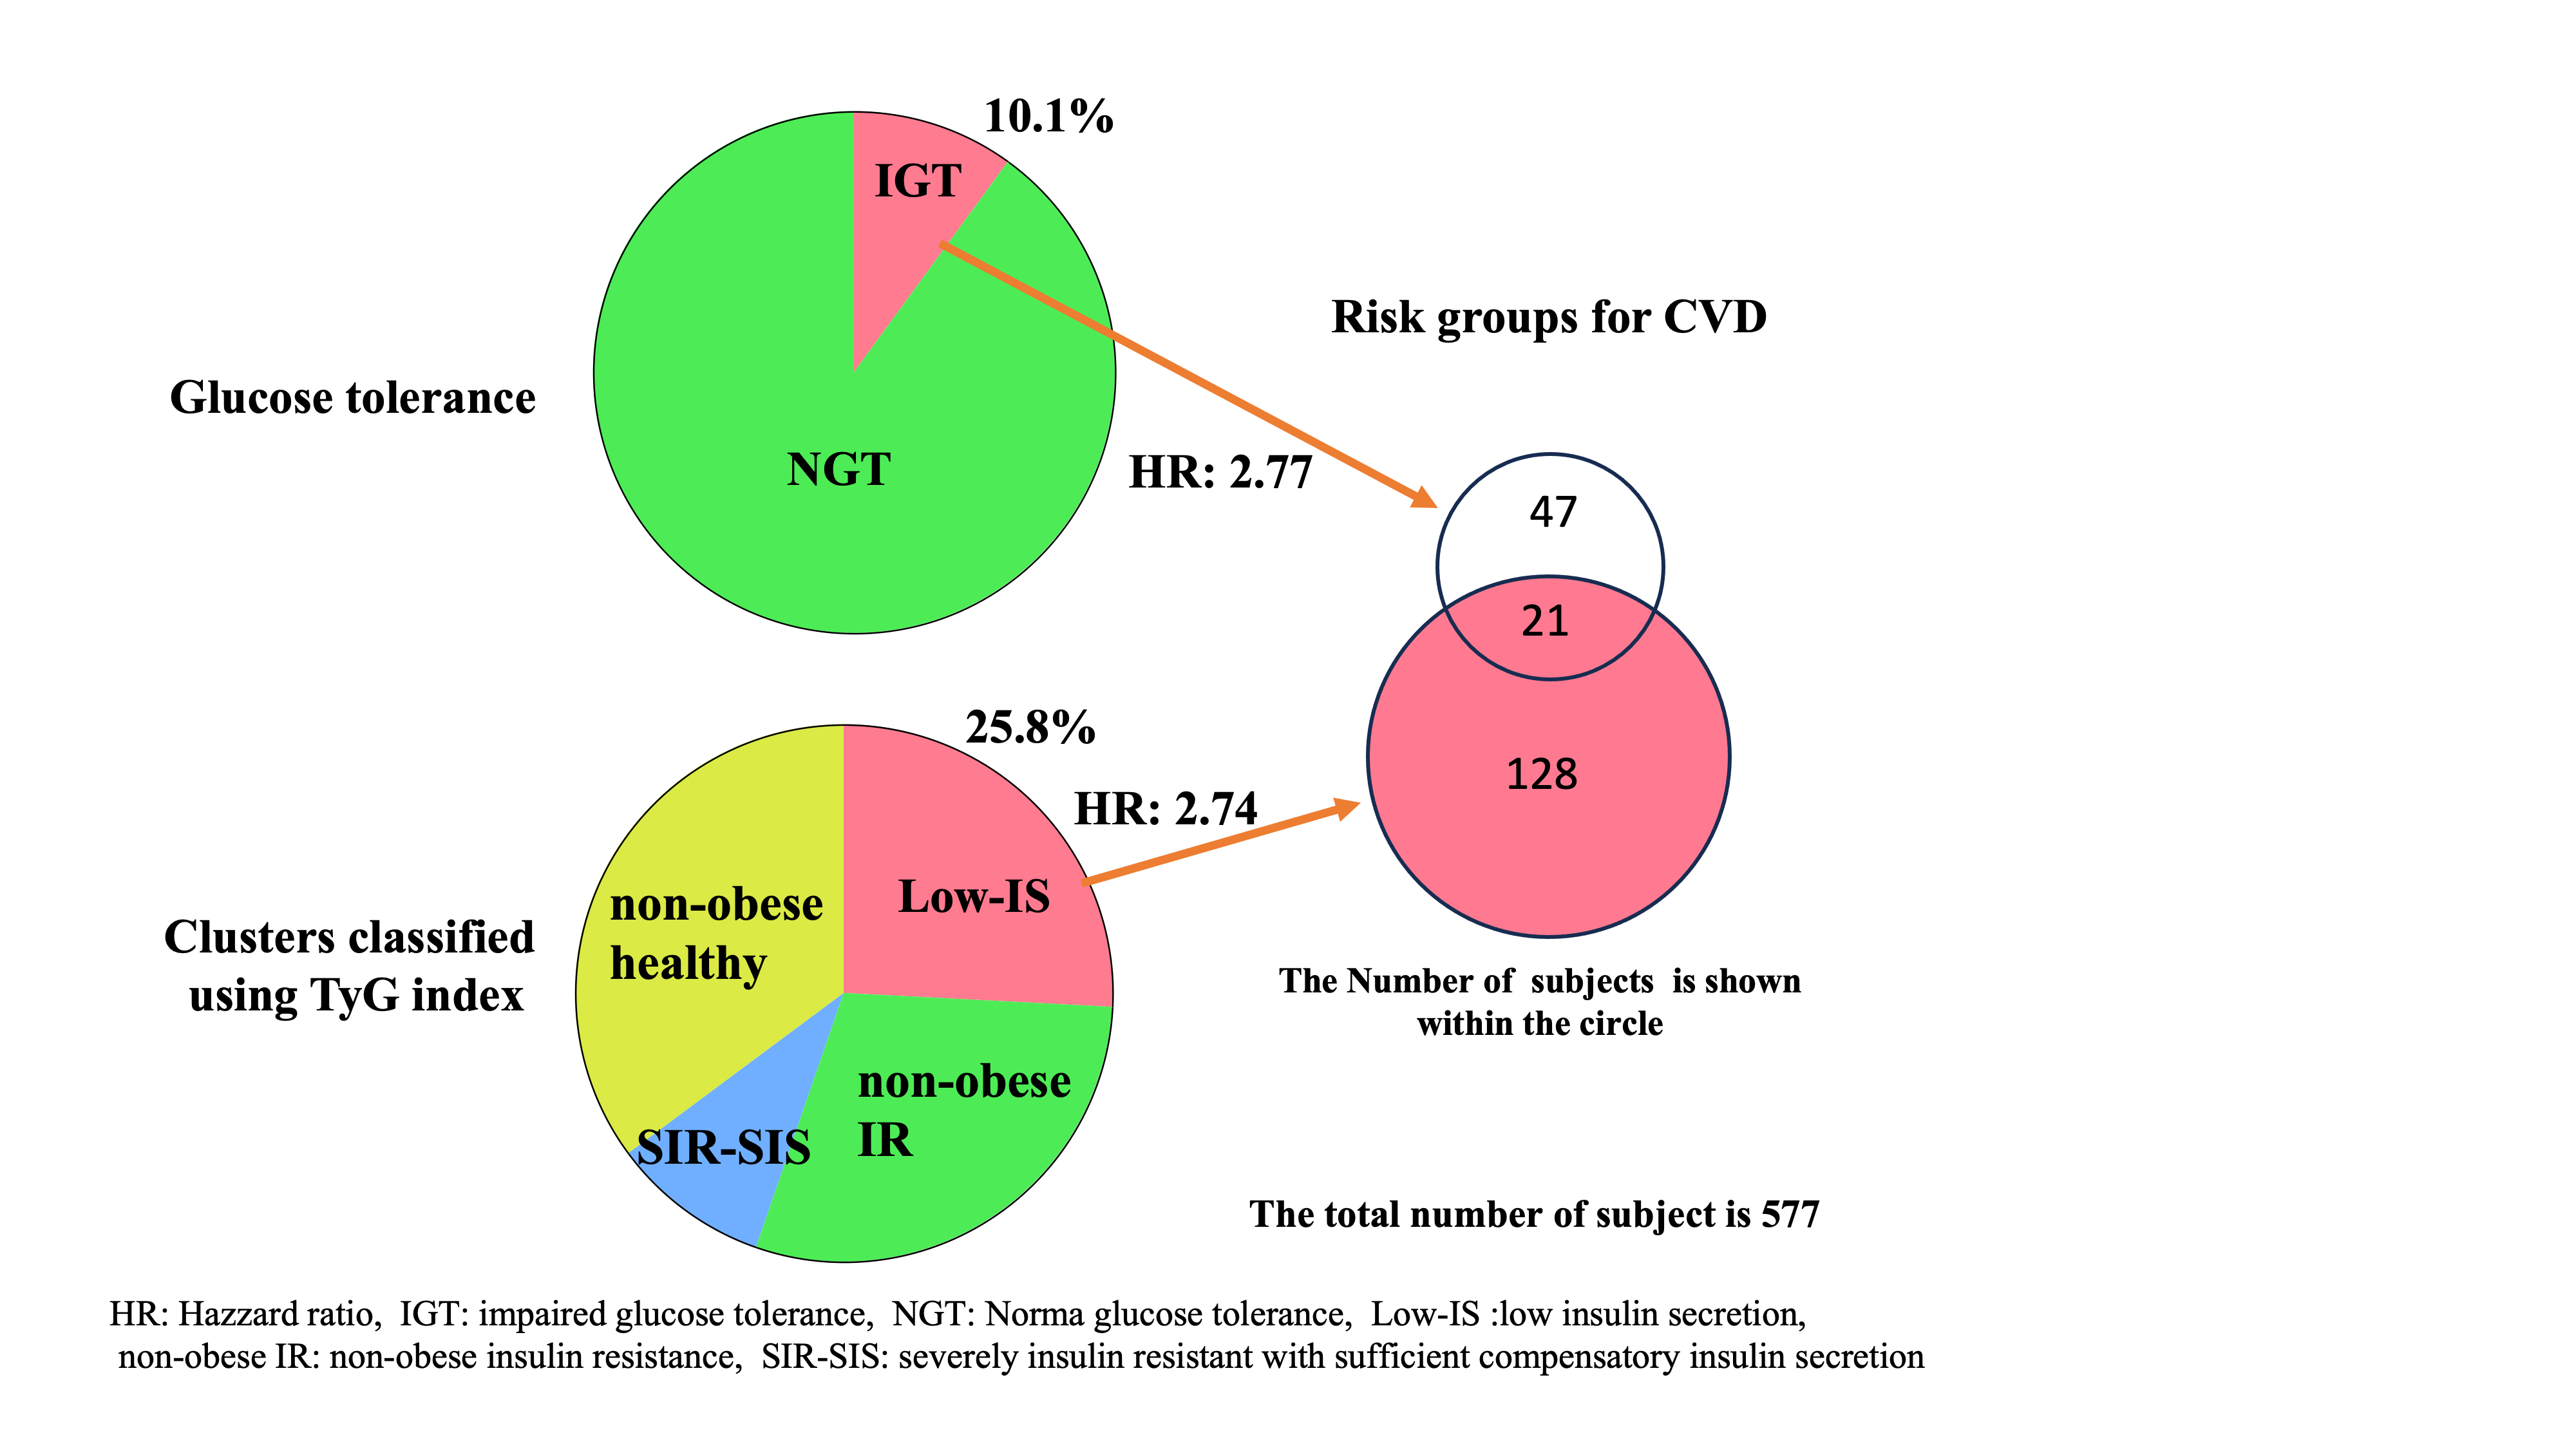
Background/Objective: Type 2 diabetes mellitus (T2DM) is a known risk factor for cardiovascular disease (CVD); however, not all individuals with T2DM have the same CVD risk. Traditional glycemic cluster analyses of individuals with diabetes using the homeostatic model assessment estimate of insulin resistance (HOMA-R) as an indicator of insulin resistance have identified severe insulin-resistant diabetes as a high-risk factor for incident CVD. To extend this observation, we further classified non-diabetic individuals to identify risk clusters for incident CVD. Methods: We performed hierarchical cluster analysis of 577 non-diabetic Japanese individuals using the glycated hemoglobin level, body mass index, homeostasis model assessment estimate of β-cell function, and the triglyceride-glucose (TyG) index instead of the HOMA-R to assess incident CVD risk over up to 188 months. Results: Analysis using a multiple risk factor-adjusted Cox proportional-hazard regression model showed that in addition to impaired glucose tolerance (IGT), among the four clusters observed, a cluster labeled “low insulin secretion (Low-IS (TyG))” was a risk factor for incident CVD (hazard ratio, [95% confidence interval]: 2.77 [1.11-6.91]). Furthermore, when the participants were stratified on the basis of the presence of IGT, the Low-IS (TyG) cluster was associated with an increased risk of CVD only in the non-IGT group (3.29 [1.32-8.18]), but not in the IGT group (1.66 [0.34-8.15]). Conclusions: Glycemic clustering incorporating the TyG index identified a novel at-risk group for incident CVD among non-diabetic individuals, offering a useful tool for early CVD risk stratification beyond traditional measures of glucose tolerance.
Keywords:
glycemic cluster analysis
; cardiovascular disease risk
; triglyceride-glucose (TyG) index
; non-diabetic population
; non-IGT
; insulin secretion
; HOMA-R
1. Introduction
Since type 2 diabetes (T2DM) is a heterogeneous disorder of glucose metabolism that is characterized by both insulin resistance (IR) and pancreatic β-cell dysfunction [1,2], the pathophysiology associated with the development of T2DM and the clinical characteristics of individuals with T2DM vary substantially across individuals. Accordingly, the risk of T2DM development varies substantially across individuals. Consequently, cluster analysis based on several variables representing glucose metabolism may be superior to analyses based on a single variable for evaluating individuals at risk of developing T2DM in a non-diabetic population. Indeed, recent attempts to classify non-diabetic individuals by cluster analysis based on the body mass index (BMI), glycated hemoglobin (HbA1c) level, and homeostatic model assessment (HOMA) estimates of b-cell function and IR, which are variables commonly used in the cluster analysis of diabetes, yielded two clusters labeled “obese insulin resistant with sufficient compensatory insulin secretion” (SIR-SIS) and “low insulin secretion” (Low-IS) as risk clusters for incident diabetes [3]. However, the relationship between these clusters and diabetes-related comorbidities such as cardiovascular disease (CVD) as well as the usefulness of cluster analysis based on these four glycemic variables for identifying individuals at risk for incident CVD in a non-diabetic population remain unclear.
Among the indices representing IR, the results of the euglycemic–hyperinsulinemia clamp test is now considered the gold standard. However, because this method requires expensive equipment and is effort-consuming, the HOMA estimate of IR (HOMA-R) is now commonly used in clinical settings, and, consequently, in studies based on cluster analysis. Nevertheless, the HOMA-R has several limitations: (1) Since the HOMA-R relies on a compensatory increase in insulin concentration upon IR, it may not precisely represent IR when the compensatory insulin secretion declines along with deterioration of glucose metabolism, especially when a decline in the compensatory increase in insulin secretion occurs before the development of diabetes or in non-diabetic individuals. (2) The HOMA-R cannot be used to assess IR in patients treated with insulin because of the influence of exogenous insulin on the insulin concentration. (3) The measurement of insulin concentration incurs additional costs in regular clinical settings. The triglyceride-glucose (TyG) index was established to address these limitations [4,5,6,7]. The TyG index was first proposed in 2008 and was found to be better than the HOMA-R in identifying IR in a large cross-sectional study of apparently healthy individuals [4]. Since then, various studies have provided evidence suggesting that the TyG index is associated with the development of CVD and diabetes and that the TyG index is better than the HOMA-R for evaluating IR [7,8,9,10,11].
In the present study, we classified non-diabetic individuals selected from the general Japanese population by hierarchical clustering analyses based on the TyG index instead of the HOMA-R, in addition to the HbA1c level, BMI, and the HOMA estimate of β-cell function (HOMA-β), to identify at-risk individuals or clusters for incident CVD in the non-diabetic population. We also examined the relationship between such clusters and impaired glucose tolerance (IGT), which is a well-established risk factor for CVD assessed by glucose levels alone [12,13,14], and identified a risk cluster, Low-IS (TyG), for incident CVD independent of IGT.
2. Materials and Methods
2.1. Participants
The Funagata study is a population-based longitudinal study conducted in Funagata, an agricultural area located approximately 400 km north of Tokyo, Japan [12,13]. Medical conditions, including CVD events (fatal and non-fatal), of 1781 non-diabetic participants aged >40 years registered from 1990 to 1992 and those aged >35 years registered from 1995 to 1997 were evaluated in this cohort study. Diabetes mellitus (DM) was defined on the basis of the following criteria published by the Japan Diabetes Society in 2010: fasting blood glucose (FBG) level ≥ 126 mg/dL or current treatment for diabetes [15]. IGT was defined by a plasma glucose level of 140–199 mg/dL 2 h after an oral glucose tolerance test.
Throughout 2008, death certificates were examined, and public health nurses interviewed participants and their families about the incidence of CVD. The participants who moved away during the follow-up period were identified using residence transfer documents. Death certificates of the deceased participants were collected annually with permission from the Management and Coordination Agency of the Japanese government. Death codes (International Classification of Diseases [ICD]-9 codes for 1990-1994 and ICD-10 codes for 1995-2008), dates, and places of death were reviewed. During the study period, the participants did not receive any interventions except for standard advice for health promotion. Among the participants, 1157 participants without data for serum insulin concentrations, which are required for the assessment of IR and secretory index in the HOMA index, were excluded. Patients with diabetes (n = 44) were also excluded. Furthermore, to accurately assess the HOMA-β, we excluded participants with FBG levels less than 63 mg/dL (n = 3). Thus, a total of 577 participants were included in the study.
This study was approved by the Ethics Committee of Yamagata University School of Medicine, and informed consent was obtained from all participants. The clinical characteristics of the study population are summarized in Table 1.
2.2. Parameters Measured
Blood samples were collected in the morning from the peripheral veins of the fasted participants. The following parameters were measured: height; body weight; BMI; percentage of body fat (fat [%]); FBG; fasting serum insulin (FI); glycated hemoglobin (HbA1c); systolic and diastolic blood pressure; and serum total cholesterol, triglyceride (TG), and high-density lipoprotein (HDL) cholesterol levels. Fat (%) was measured using the bioelectrical impedance method with a Tanita MC-190 body composition analyzer (Tanita Corp.). Laboratory testing was performed in a commercial laboratory (LSI Medience Co., Tokyo, Japan) in accordance with the manufacturer’s protocols. Pancreatic β-cell function and IR were evaluated by homeostasis model assessment using FPG and FI levels (HOMA-R and HOMA-β, respectively). The HOMA-R and HOMA-β were calculated using the respective formulas, (FBG (mg/dL) ×FI (μU/mL))/405 and (360 × FI)/(FPG-63), respectively. The TyG index was calculated using the following formula: ln (TG × FPG/2) [4,15].
Hypertension was defined as blood pressure > 140/90 mmHg or current treatment for hypertension. Hyperlipidemia was defined as total cholesterol ≥ 240 mg/dL, TG ≥ 150 mg/dL, or current treatment for hyperlipidemia.
2.3. Statistical Analysis
Data were presented as mean ± standard deviation (SD). The statistical significance of differences in values among groups (parametric) and case-control associations among groups (nonparametric) were assessed using analysis of covariance (ANOVA) with Tukey’s post-hoc analyses and Fisher’s exact test, respectively. The participants were divided into four groups or clusters by hierarchical clustering based on their HbA1c level, BMI, HOMA-β, and either HOMA-R or the TyG index, and the risk of incident CVD in each cluster was evaluated using Kaplan–Meier and multivariate Cox proportional-hazard regression analyses. Cox proportional-hazard regression models were used to calculate the hazard ratios (HRs) for incident CVD at baseline after adjusting for age, sex, hypertension, and hyperlipidemia. Statistical significance was defined by p < 0.05. All analyses were performed using JMP Pro software (version 18.0; SAS Institute Japan Ltd., Tokyo, Japan).
3. Results
3.1. Clinical Characteristics of the Participants at the Baseline
The clinical characteristics of the participants at baseline are shown in Table 1. The mean age of the participants was 50.3 ± 10.9 years. Although the national prevalence of hypertension and hyperlipidemia for individuals without diabetes has not been reported, the measured prevalences of hypertension (36.2%) and hyperlipidemia (34.3%) appeared to be not substantially different from those in the general Japanese population: the prevalence of hypertension reported by the National Integrated Project for Prospective Observation of Non-communicable Disease and its Trends in the Aged (NIPPON DATA) in 1990 was 21.7%, 38.9%, 56.1%, and 66.3% for men aged 30–39, 40–49, 50–59, and 60–69 years, respectively, and 9.6%, 29.2%, 50.5%, and 67.1%, respectively, for women in the same age groups [16]. The prevalence of hyperlipidemia reported in other areas of Japan was also similar [17,18,19].
3.2. Cluster Analysis Using Four Variables
On the basis of the HbA1c level, BMI, HOMA-β, and HOMA-R, the participants were grouped hierarchically into four major clusters (Figure 1A). Cluster 1 (n = 253 [43.8%]) was characterized by low insulin secretion and dysglycemia, and can be labeled as “low insulin secretion (Low-IS (HOMA-R)).” Cluster 2 (n = 164 [28.4%]) was characterized by non-obese individuals and a generally normal glycemic profile, and can be labeled as “non-obese healthy (HOMA-R).” Cluster 3 (n = 139 [24.1%]) was characterized by normal glycemia with moderate obesity and insulin resistance with sufficient compensatory insulin secretion, and can be labeled as “obese with mild insulin resistance (obese-mild IR (HOMA-R)).” Cluster 4 (n = 21 [3.6%]) was characterized by high BMI, high IR, and high insulin secretion, and can be labeled as “obese severely insulin resistant with sufficient compensatory insulin secretion (SIR-SIS (HOMA-R)).” However, when IR was assessed using the TyG index instead of HOMA-R, the Low-IS (HOMA-R) cluster was actually insulin resistant (mean TyG index for the Low-IS (HOMA-R) cluster vs. overall: 8.44 vs. 8.37; mean HOMA-R for the Low-IS (HOMA-R) cluster vs. overall: 0.77 vs. 1.05).
Next, the participants were grouped into four major clusters by cluster analysis based on the HbA1c level, BMI, HOMA-β, and the TyG index instead of the HOMA-R (Figure 1B). Although the clusters defined in the analysis using the TyG index can be labeled similarly to the clusters defined using the HOMA-R, the details appear quite different. Similar to the Low-IS (HOMA-R) cluster, cluster 1 (n = 149 [25.8%]) was characterized by low insulin secretion and dysglycemia and can be labeled “low insulin secretion (Low-IS (TyG)).” Cluster 2 (n = 170 [29.5%]) can be labeled “Non-obese IR (TyG)” because it was characterized by the presence of non-obese but insulin-resistant individuals who did not fit into any of the clusters defined by the analysis based on the HOMA-R. Cluster 3 (n = 55 [9.5%]) was characterized by high BMI, high IR, and high insulin secretion and, like cluster SIR-SIS (HOMA-R), can be labeled as “obese severely insulin resistant with sufficient compensatory insulin secretion (SIR-SIS (TyG)).” Cluster 4 (n = 203 [35.2%]) was characterized by a non-obese and a generally normal glycemic profile and, like non-obese healthy (HOMA-R), can be labeled “non-obese healthy (TyG).” Surprisingly, when insulin resistance was assessed with the HOMA-R instead of the TyG index, the Non-obese IR (TyG) cluster was shown to be non-insulin resistant (mean TyG index for the Non-obese IR (TyG) cluster vs. overall: 8.88 vs. 8.37; mean HOMA-R for the Non-obese IR (TyG) cluster vs. overall: 1.06 vs. 1.05).
The HbA1c level, BMI, HOMA-R, TyG index, and HOMA-β for each individual within each cluster are plotted on each panel. A: Clusters were identified on the basis of the HbA1c level, BMI, HOMA-R, and HOMA-β (clusters based on HOMA-R). B: Clusters were identified on the basis of the HbA1c level, BMI, TyG index, and HOMA-β (clusters based on the TyG index). The mean values for all the samples are shown in the line graph.
3.3. Risk of Incident CVD Associated with the Clusters
The risk of incident CVD in each cluster was also examined. During the 188-month follow-up period of the study, 31 participants (5.4%) had CVD. Analysis using the Kaplan–Meier method showed a significantly higher risk of CVD in the Low-IS (TyG) cluster (log-rank p = 0.037) but not in the Low-IS (HOMA-R) cluster (log-rank p = 0.348; Figure 2). Cox proportional-hazard regression model analysis also showed the effects of being in the Low-IS (TyG) cluster on the risk of incident CVD (HR [95% confidence interval (CI)]) vs. clusters 2-4 (TyG): 2.32 [1.14-4.71]) (Table 2). After further adjusting for multiple possible confounding factors (age, sex, hypertension, hyperlipidemia, and IGT), the Low-IS (TyG) cluster remained a risk factor for incident CVD (HR [95% CI]: 2.74 [1.25-6.03]).
The risk of incident CVD associated with each cluster during the 188-month follow-up period was examined using the Kaplan–Meier method. The risk of incident CVD associated with clusters identified by glycemic cluster analysis based on the HbA1c level, BMI, HOMA-β, and either HOMA-R (Panel A) or the TyG index (panels B and C) is shown. In Panel C, clusters 2–4 from Panel B were combined and set as the control group. Differences among the clusters were assessed using a log-rank test. Statistical significance was set at p < 0.05 and presented in red.
3.4. Relationship Between Clusters Defined by Cluster Analysis Using the HbA1c Level, BMI, HOMA-β, and HOMA-R and Clusters Defined by Cluster Analysis Using the HbA1c Level, BMI, HOMA-β, and TyG Index
As shown in Figure 3, approximately half of the participants in the Low-IS (HOMA-R) cluster belonged to the Low-IS (TyG) cluster, an at-risk cluster for incident CVD, while the majority of the remaining participants belonged to the Non-obese IR (TyG) cluster. This fact appears to indicate that the Low-IS (HOMA-R) cluster is a mixed cluster of the Low-IS (TyG) and Non-obese IR (TyG) clusters, which explains why the Low-IS (HOMA-R) cluster is not a risk factor for incident CVD. These findings imply that cluster analysis using the TyG index appears to be superior to cluster analysis using the HOMA-R for precisely evaluating the Low-IS cluster without IR and thus evaluating the risk groups for incident CVD.
The extent to which individuals in each cluster obtained by cluster analysis using the HOMA-R were reclassified into clusters obtained by cluster analysis using the TyG index is shown schematically with percentages and arrows. To simplify the figure, reclassifications of less than 10% are omitted.
3.5. Risk of Incident CVD in the Low-IS (TyG) Cluster Was Independent of Risk of Incident CVD Associated with IGT
The increased risk of incident CVD in the Low-IS (TyG) cluster could be explained by the high prevalence of IGT in this group. In fact, the prevalence of IGT in the Low-IS (TyG) cluster was greater than the combined prevalence in all other clusters (14.1% versus 8.6%, p = 0.043). However, a Cox proportional-hazard regression analysis that included both IGT and the Low-IS (TyG) cluster as covariates demonstrated that both factors are significant risk factors for incident CVD: after adjusting for additional confounding factors, including age, sex, hypertension, and hyperlipidemia, the HR (95% CI) was 2.77 (1.11-6.91) and 2.74 (1.25-6.03), respectively. Furthermore, when the participants were stratified on the basis of the presence or absence of IGT, analysis using the Kaplan–Meier method showed that the Low-IS (TyG) cluster was a risk factor for incident CVD only in the non-IGT group (log-rank p = 0.019), but not in the IGT group (log-rank p = 0.730) (Figure 4). Analyses using the Cox proportional-hazard regression model further supported this fact: the Low-IS (TyG) cluster was a risk factor for incident CVD only in the non-IGT group (HR [95% CI]: 3.29 [1.32-8.18]), but not in the IGT group (1.66 [0.34-8.15]) (Table 2).
The risk of incident CVD in relation to IGT (Panel A) and the Low-IS (TyG) cluster (Panels B and C) during the 188-month follow-up period was examined using the Kaplan–Meier method. The risk associated with the Low-IS (TyG) cluster was examined by stratification based on the presence or absence of IGT: IGT group (Panel B) and non-IGT group (Panel C). Differences among groups were assessed using the log-rank test. Statistical significance was indicated by p < 0.05 and is shown in red.
4. Discussion
In this study, using cluster analysis of four variables (HbA1c level, BMI, HOMA-β, and TyG index) in Japanese participants without diabetes, we identified Low-IS (TyG) as a unique cluster at risk for incident CVD. Cox proportional-hazard analysis revealed that the incident CVD risk in the Low-IS (TyG) cluster was independent of the risk of IGT, a well-known risk factor for incident CVD. In fact, the risk was only observed in participants with normal glucose tolerance, not in those with IGT. These results suggest that the Low-IS (TyG) cluster is associated with increased incident CVD risk independent of the IGT-related incident CVD risk. Identifying a unique group of individuals with normal glucose tolerance who are at risk for incident CVD may provide additional information regarding the pathophysiology associated with the development of CVD and could help identify individuals at risk for incident CVD before they develop IGT or DM.
The group identified here as being at risk for incident CVD was the Low-IS (TyG) cluster, which is characterized by low insulin secretion and dysglycemia. Elevated blood glucose levels are a well-known risk factor for incident DM, and IR is a well-known risk factor for incident CVD, particularly in patients with diabetes [20,21]. However, as mentioned above, no IR was observed in the Low-IS (TyG) cluster; thus, the reasons for the association in question are unclear. We speculate that this may be due to a rapid increase in blood glucose levels (e.g., within 0.5 to 1 h after eating), which cannot be defined as IGT. Recent studies have reported an association between the glycemia risk index (GRI), which was developed to assess the overall glycemic quality of patients with diabetes using continuous glucose monitoring (CGM) data, and several CVD-related conditions [22,23]. Since the GRI is an indicator of the risk of hypoglycemia and hyperglycemia [24,25], the reported association suggests that high glucose-level fluctuations may be a risk factor for CVD. On the basis of this idea, our hypothesis may be proven by investigating whether individuals in the Low-IS (TyG) cluster show significant fluctuations in blood glucose levels, such as in postprandial hyperglycemia or hypoglycemia.
IR is a well-known risk factor for incident CVD [20,21]. Therefore, the lack of an association between incident CVD risk and the SIR-SIS (TyG) cluster, which is characterized by high BMI, IR, and insulin secretion in this study is difficult to explain. Various studies that classified diabetes on the basis of cluster analysis using similar glucose-related variables (e.g., glutamic acid decarboxylase antibodies, age at diagnosis, HbA1c level, BMI, and HOMA indices) have shown that clusters with severe IR are risk factors for incident CVD [26,27,28,29,30,31,32]. The main difference between these previous and current studies is in the characteristics of the research participants: diabetic and non-diabetic patients. Therefore, on the basis of these results, we speculate that high IR is a substantial risk factor for incident CVD only when blood glucose levels are high enough to be diagnosed with diabetes, but not in individuals without diabetes. On the basis of this speculation and as shown in a previous study [3], because the SIR-SIS cluster is a risk cluster for incident diabetes, the prevalence of diabetes is expected to increase over the follow-up period, and this increase is likely to enhance the risk of incident CVD in this cluster over time. In fact, as shown in Figure 2B, as cluster 3, the SIR-SIS (TyG) cluster shows an increase in incident CVD risk toward the end of the follow-up period, which supports the hypothesis described above. However, this hypothesis needs to be verified in studies with larger study populations and detailed data for parameters such as the onset of diabetes.
Here, we used the TyG index instead of the HOMA-R as an indicator of IR in the glycemic cluster analysis and identified Low-IS (TyG) as a cluster with a high risk of incident CVD. This cluster appears to be part of the Low-IS (HOMA-R) cluster, which has similar characteristics and is defined using the HOMA-R (Figure 3). The results indicate that glycemic cluster analysis using the TyG index may help identify a group at higher risk for incident CVD and reduce the size of the target population for further studies (from 43.8% to 25.8%). We identified a group at risk for incident CVD in a population without DM or IGT. These results may provide useful information that can be considered by healthcare providers to prevent the development of CVD and DM.
This study had several strengths and limitations. We studied a sample from the general population and accounted for multiple factors that could have confounded our statistical analyses. Furthermore, this was a longitudinal study that permitted evaluation of the relationships between clusters and incident CVD. However, we recruited participants from a health promotion study rather than from among people attending health checkups; therefore, the study population may have consisted of individuals more invested in keeping themselves healthy than the general population. In addition, since only 577 of 1,781 participants (32.4%) were included in the study, the possibility of selection bias could not be ruled out. However, since the prevalence of hypertension and hyperlipidemia in the results did not differ substantially from that in the general Japanese population, the bias may not be so substantial. Second, only four variables were used in the cluster analysis. Including more variables such as family history or genetic background would improve the sensitivity and specificity of risk assessment for incident CVD. However, since the four variables, BMI, HbA1c level, HOMA-R, and HOMA-β, are commonly used for such glycemic cluster analyses, the analyses conducted here appear to be suitable, at least at present. Finally, this study showed that individuals with low insulin secretion are at risk for incident CVD; however, these results may be specific to the study population or to the general Japanese population. This is because East Asians, including the Japanese, are known to have reduced insulin secretion capacity [33]. Therefore, further studies involving other ethnic groups are necessary to determine the generalizability of the results reported herein.
5. Conclusions
In conclusion, we classified non-diabetic individuals selected from a general Japanese population by hierarchical clustering analyses based on the HbA1c level, BMI, HOMA-β, and the TyG index instead of the HOMA-R, and identified a risk cluster, Low-IS (TyG), which indicates the risk for incident CVD independent of IGT. The results showed that cluster analysis based on the TyG index was useful for identifying individuals at risk for CVD among those with normal glucose tolerance. In addition, the TyG index was shown to be superior to the HOMA-R as a marker of IR or for assessing individuals at risk for incident CVD.
Author Contributions
Conceptualization, M.D.; methodology, M.D.; software, M.D.; validation, S.S. and M.D.; formal analysis, M.D.; investigation, M.D.; resources, M.D, S.S., K.I., Y.H. and S.K.; data curation, S.K. and S.S.; writing—original draft preparation, M.D.; writing—review and editing, S.S., K.I., Y.H. and S.K.; visualization, M.D.; supervision, M.D.; project administration, S.S. and S.K.; Funding acquisition, M.D. All authors have read and agreed to the published version of the manuscript.
Funding
This work was supported by the Japan Science and Technology Agency KAKENHI Grant numbers, JP16590863 and JP20590595.
Institutional Review Board Statement
This present study was approved by the Ethics Committee of the Yamagata University School of Medicine (No. 2023-229) and was conducted according to principles of the Declaration of Helsinki.
Informed Consent Statement
Written informed consent was obtained from all the participants.
Data availability
All data generated or analyzed during this study are included in this published article.
Acknowledgments
We would like to thank Editage (www.editage.jp) for English language editing.
Conflicts of Interest
The authors declare no conflict of interest.
Abbreviations
The following abbreviations have been used in this manuscript
| T2DM | Type 2 diabetes |
| CVD | Cardiovascular disease |
| HOMA-b | Homeostatic model assessment estimates of b-cell function |
| HOMA-R | Homeostatic model assessment estimates of insulin resistance |
| BMI | Body mass index |
| IGT | Impaired glucose tolerance |
| TyG | The triglyceride glucose |
| FPG | Fasting blood glucose |
| FI | Fasting serum insulin |
| HbA1c | Glycated hemoglobin |
| HDL | High-density lipoprotein |
| HR | Hazard ratio |
| IR | Insulin resistance |
| SIR-SIS | Severely insulin resistant with sufficient compensatory insulin secretion |
| Low-IS | Low insulin secretion |
References
- Stumvoll, M.; Goldstein, B.J.; van Haeften, TW. Type 2 diabetes: principles of pathogenesis and therapy. Lancet 2005, 365, 1333-1346. [CrossRef]
- DeFronzo, R.A. Pathogenesis of type 2 diabetes mellitus. Med Clin North Am. 2004, 88, 787-835. [CrossRef]
- Ito, R.; Mizushiri, S.; Nishiya, Y.; Ono, S.; Tamura, A.; Hamaura, K.; Terada, A.; Tanabe, J.; Yanagimachi, M.; Wai, K.M.; et al. Two Distinct Groups Are Shown to Be at Risk of Diabetes by Means of a Cluster Analysis of Four Variables. J. Clin. Med. 2023, 12, 810. [CrossRef]
- Simental-Mendía, L.E.; Rodríguez-Morán, M.; Guerrero-Romero, F. The product of fasting glucose and triglycerides as surrogate for identifying insulin resistance in apparently healthy subjects. Metab. Syndr. Relat. Disord. 2008, 6, 299–304. [CrossRef]
- Placzkowska, S.; Pawlik-Sobecka, L.; Kokot, I.; Piwowar, A. Indirect insulin resistance detection: current clinical trends and laboratory limitations. Biomed. Pap. Med. Fac. Univ. Palacky. Olomouc. Czech. Repub. 2019, 163, 187–199. [CrossRef]
- Vasques, AC.; Novaes, F.S.; de Oliveira, M.S.; Souza, J.R.; Yamanaka, A.; Pareja, J.C.; Tambascia, M.A.; Saad, M.J.; Geloneze, B. TyG index performs better than HOMA in a Brazilian population: a hyperglycemic clamp validated study. Diabetes Res Clin Pract. 2011, 93, e98–e100. [CrossRef]
- Lee, S.H.; Kwon, H.S.; Park, Y.M.; Ha, H.S.; Jeong, S.H.; Yang, H.K.; Lee, J.H.; Yim, H.W.; Kang, M.I.; Lee, W.C.; et al. Predicting the development of diabetes using the product of triglycerides and glucose: the Chungju Metabolic Disease Cohort (CMC) study. PLoS ONE 2014, 9, e90430. [CrossRef]
- Sánchez-Íñigo, L, Navarro-González, D, Fernández-Montero, A, Pastrana-Delgado, J, Martínez, JA. The TyG index may predict the development of cardiovascular events. Eur. J. Clin. Invest. 2016, 46, 189–197. [CrossRef]
- Lee, S.B.; Ahn, C.W.; Lee, B.K.; Kang, S.; Nam, J.S.; You, J.H.; Kim, M.J.; Kim, M.K.; Park, JS. Association between triglyceride glucose index and arterial stiffness in Korean adults. Cardiovasc Diabetol. 2018, 17, 41. [CrossRef]
- Wang, S.; Shi, J.; Peng, Y.; Fang, Q.; Mu, Q.; Gu, W.; Hong, J.; Zhang, Y.; Wang, W. Stronger association of triglyceride glucose index than the HOMA-IR with arterial stiffness in patients with type 2 diabetes: a real-world single-centre study. Cardiovasc Diabetol. 2021, 20, 82. [CrossRef]
- Tao, L.C.; Xu, J.N.; Wang, T.T.; Hua, F.; Li, J.J. Triglyceride-glucose index as a marker in cardiovascular diseases: landscape and limitations. Cardiovasc. Diabetol. 2022, 21, 68. [CrossRef]
- Tominaga, M.; Eguchi, H.; Manaka, H.; Igarashi, K.; Kato, T.; Sekikawa, A. Impaired glucose tolerance is a risk factor for cardiovascular disease, but not impaired fasting glucose. The Funagata Diabetes Study. Diabetes Care 1999, 22, 920-924. [CrossRef]
- Oizumi, T.; Daimon, M.; Jimbu, Y.; Wada, K.; Kameda, W.; Susa, S.; Yamaguchi, H.; Ohnuma, H.; Tominaga, M.; Kato, T. Impaired glucose tolerance is a risk factor for stroke in a Japanese sample--the Funagata study. Metabolism 2008, 57, 333-338. [CrossRef]
- Brannick, B.; Dagogo-Jack, S. Prediabetes and cardiovascular disease. Endocrinol Metab Clin North Am. 2018, 47, 33–50. [CrossRef]
- Committee of the Japan Diabetes Society on the Diagnostic Criteria of Diabetes Mellitus, Seino, Y.; Nanjo, K.; Tajima, N.; Kadowaki, T.; Kashiwagi, A.; Araki, E.; Ito, C.; Inagaki, N.; Iwamoto, Y.; Kasuga, M.; et al. Report of the committee on the classification and diagnostic criteria of diabetes mellitus. J. Diabetes Investig. 2010, 1, 212–228. [CrossRef]
- Miura, K.; Nagai, M.; Ohkubo, T. Epidemiology of hypertension in Japan: where are we now? Circ. J. 2013, 77, 2226-2231. [CrossRef]
- Daimon, M.; Oizumi, T.; Saitoh, T.; Kameda, W.; Hirata, A.; Yamaguchi, H.; Ohnuma, H.; Igarashi, M.; Tominaga, M.; Kato, T. Decreased serum levels of adiponectin are a risk factor for the progression to type 2 diabetes in the Japanese Population: the Funagata study. Diabetes Care 2003; 26, 2015-2020. [CrossRef]
- Hata, J.; Ninomiya, T.; Hirakawa, Y.; Nagata, M.; Mukai, N.; Gotoh, S.; Fukuhara, M.; Ikeda, M.; Shikata, K.; Yoshida, D.; et al. Secular trends in cardiovascular disease and its risk factors in Japanese: half-century data from the Hisayama Study (1961-2009). Circulation 2013, 128, 1198-1205. [CrossRef]
- Fujiwara, T.; Saitoh, S.; Takagi, S.; Ohnishi, H.; Ohata, J.; Takeuchi, H.; Isobe, T.; Chiba, Y.; Katoh, N.; Akasaka, H.; et al. Prevalence of asymptomatic arteriosclerosis obliterans and its relationship with risk factors in inhabitants of rural communities in Japan: Tanno-Sobetsu study. Atherosclerosis 2004, 177, 83-88. [CrossRef]
- Ormazabal, V.; Nair, S.; Elfeky, O.; Aguayo, C.; Salomon, C.; Zuñiga, F.A. Association between insulin resistance and the development of cardiovascular disease. Cardiovasc. Diabetol. 2018, 17, 122. [CrossRef]
- Kosmas, C.E.; Bousvarou, M.D.; Kostara, C.E.; Papakonstantinou, E.J.; Salamou, E.; Guzman, E. Insulin resistance and cardiovascular disease. J. Int. Med. Res. 2023, 51, 3000605231164548. [CrossRef]
- Cai, L.; Shen, W.; Li, J.; Wang, B.; Sun, Y.; Chen, Y.; Gao, L.; Xu, F.; Xiao, X.; Wang, N.; Lu, Y. Association between glycemia risk index and arterial stiffness in type 2 diabetes. J. Diabetes Investig. 2024,15, 614-622. [CrossRef]
- Torimoto, K.; Okada, Y.; Mita, T.; Tanaka, K.; Sato, F.; Katakami, N.; Yoshii, H.; Nishida, K.; Tanaka, Y.; Ishii, R.; et al. Association of Glycaemia Risk Index With Indices of Atherosclerosis: A Cross-Sectional Study. J. Diabetes 2025, 17, e70065. [CrossRef]
- Klonoff, D.C.; Wang, J.; Rodbard, D.; Kohn, M.; Li C.; Liepmann, D.; Kerr, D.; Ahn, D.; Peters, A.L.; Umpierrez, G.E.; et al. A glycemia risk index (GRI) of hypoglycemia and hyperglycemia for continuous glucose monitoring validated by clinician ratings. J. Diabetes Sci. Technol 2023, 17, 1226–1242. [CrossRef]
- Oriot, P.; Prévost, G.; Philips, J.C.; Klipper Dit Kurz, N.; Hermans, M.P. Glycemia risk index (GRI): a metric designed to facilitate the interpretation of continuous glucose monitoring data: a narrative review. J. Endocrino.l Invest. 2025 May 17. doi: 10.1007/s40618-025-02609-1. [CrossRef]
- Ahlqvist, E.; Storm, P.; Käräjämäki, A.; Martinell, M.; Dorkhan, M.; Carlsson, A.; Vikman, P.; Prasad, R.B.; Aly, D.M.; Almgren, P.; et al. Novel subgroups of adult-onset diabetes and their association with outcomes: a data-driven cluster analysis of six variables. Lancet Diabetes Endocrinol. 2018, 6, 361-369. [CrossRef]
- Dennis, J.M.; Shields, B.M.; Henley, W.E.; Jones, A.G.; Hattersley, A.T. Disease progression and treatment response in data-driven subgroups of type 2 diabetes compared with models based on simple clinical features: an analysis using clinical trial data. Lancet Diabetes Endocrinol. 2019, 7, 442-451. [CrossRef]
- Zaharia, O.P.; Strassburger, K.; Strom, A.; Bönhof, G.J.; Karusheva, Y.; Antoniou, S.; Bódis, K.; Markgraf, D.F.; Burkart, V.; Müssig, K.; et al.; German Diabetes Study Group. Risk of diabetes-associated diseases in subgroups of patients with recent-onset diabetes: a 5-year follow-up study. Lancet Diabetes Endocrinol. 2019, 7, 684-694. [CrossRef]
- Tanabe, H.; Saito, H.; Kudo, A.; Machii, N.; Hirai, H.; Maimaituxun, G.; Tanaka, K.; Masuzaki, H.; Watanabe, T.; Asahi, K.; et al. Factors Associated with Risk of Diabetic Complications in Novel Cluster-Based Diabetes Subgroups: A Japanese Retrospective Cohort Study. J. Clin. Med. 2020, 9, 2083. [CrossRef]
- Kahkoska, A.R.; Geybels, M.S.; Klein, K.R.; Kreiner, F.F.; Marx, N.; Nauck, M.A.; Pratley, R.E.; Wolthers, B.O.; Buse, J.B. Validation of distinct type 2 diabetes clusters and their association with diabetes complications in the DEVOTE, LEADER and SUSTAIN-6 cardiovascular outcomes trials. Diabetes Obes. Metab. 2020, 22, 1537-1547. [CrossRef]
- Lugner, M.; Gudbjörnsdottir, S.; Sattar, N.; Svensson, A.M.; Miftaraj, M.; Eeg-Olofsson, K.; Eliasson, B.; Franzén, S. Comparison between data-driven clusters and models based on clinical features to predict outcomes in type 2 diabetes: nationwide observational study. Diabetologia 2021, 64, 1973-1981. [CrossRef]
- Xiong, X.F.;Yang, Y.; Wei, L.; Xiao, Y.; Li, L.; Sun, L. Identification of two novel subgroups in patients with diabetes mellitus and their association with clinical outcomes: A two-step cluster analysis. J. Diabetes Investig. 2021, 12,1346-1358. [CrossRef]
- Yabe, D.; Seino, Y.; Fukushima, M.; Seino, S. β cell dysfunction versus insulin resistance in the pathogenesis of type 2 diabetes in East Asians. Curr. Diab. Rep. 2015, 15, 602. [CrossRef]
Figure 1.
Characteristics of the clusters identified by glycemic cluster analysis.
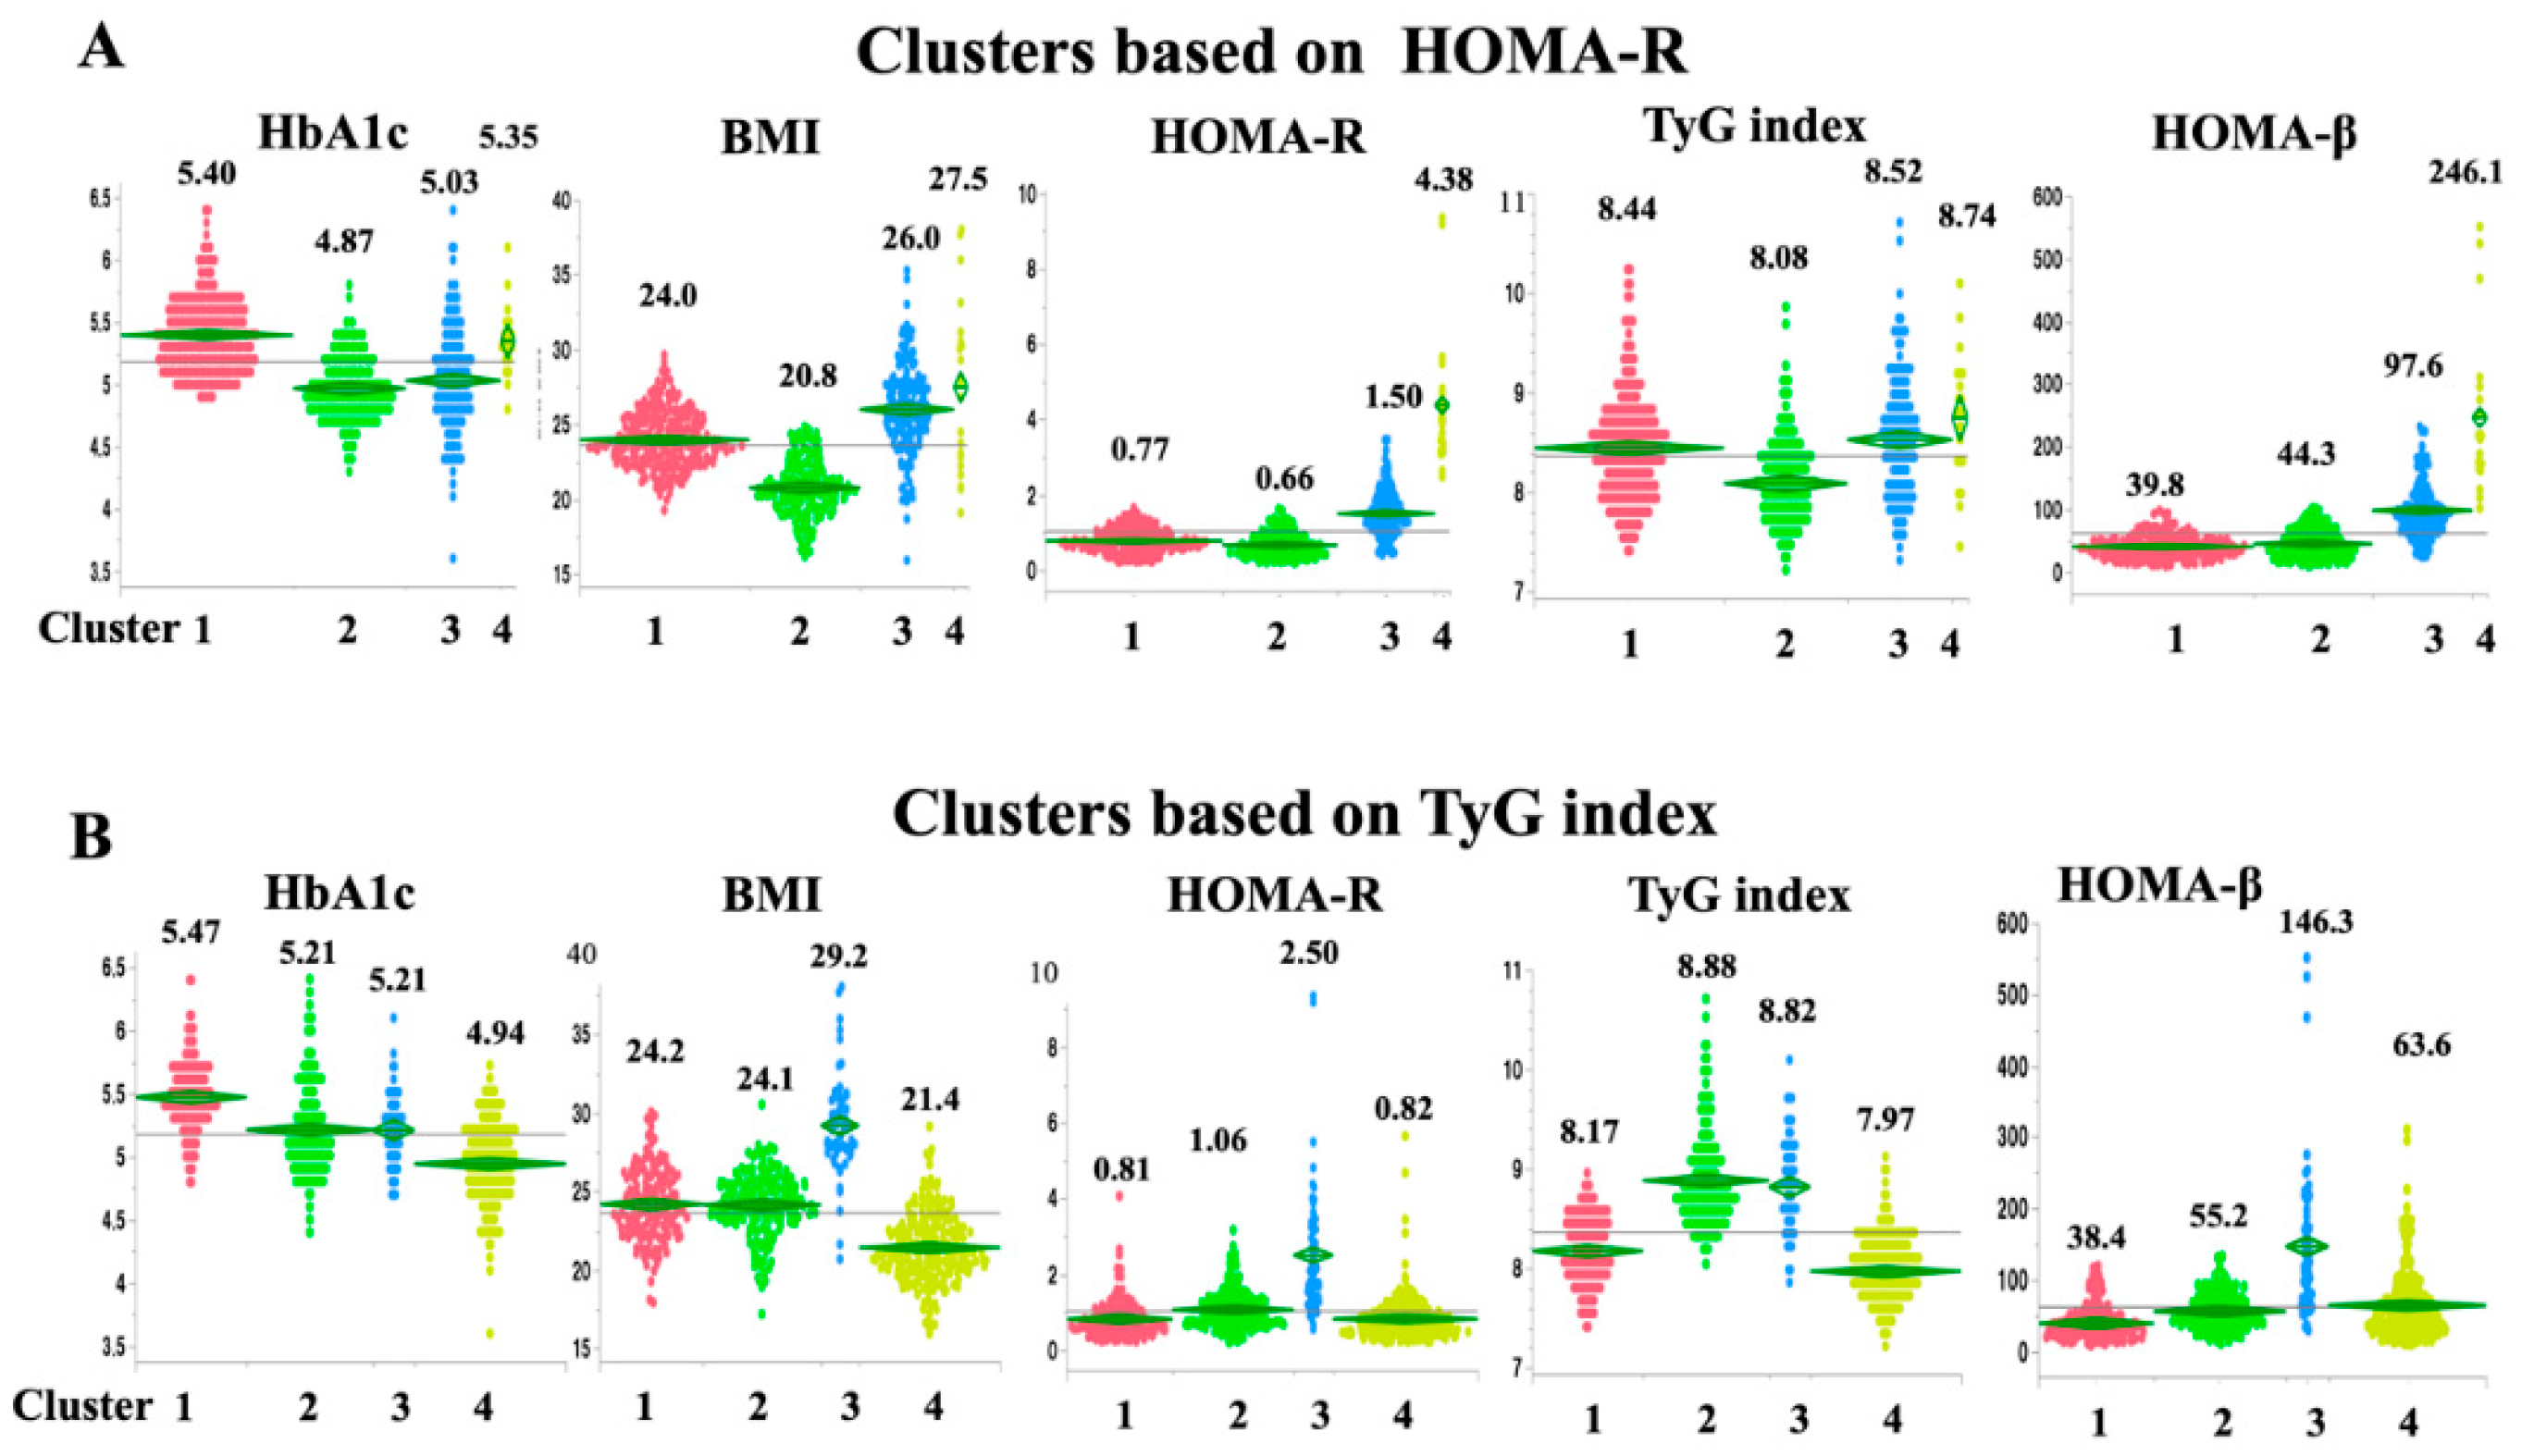
Figure 2.
Risk of incident CVD associated with each cluster.
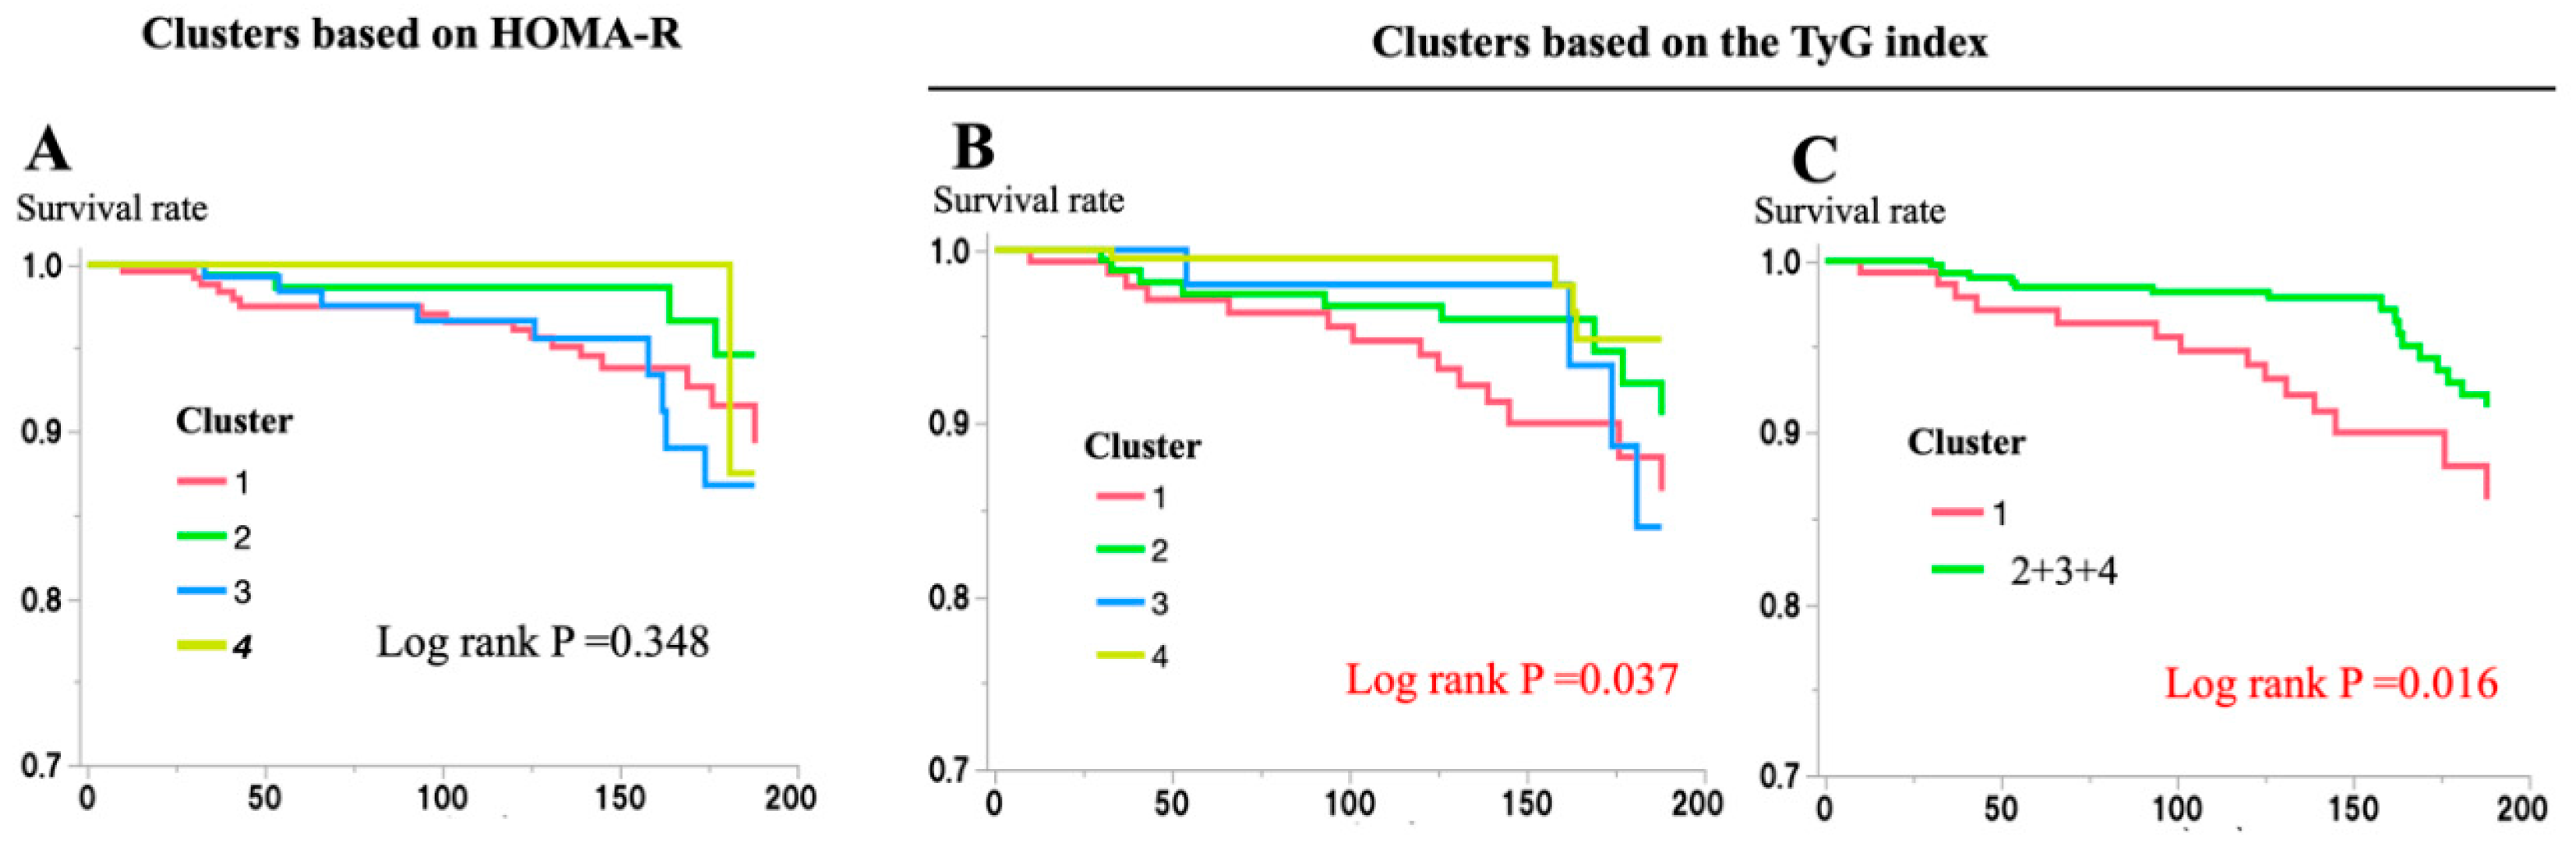
Figure 3.
Relationships between clusters defined by cluster analysis using the HbA1c level, BMI, HOMA-β, and HOMA-R (HOMA-R) or the TyG index (TyG index).
Figure 3.
Relationships between clusters defined by cluster analysis using the HbA1c level, BMI, HOMA-β, and HOMA-R (HOMA-R) or the TyG index (TyG index).
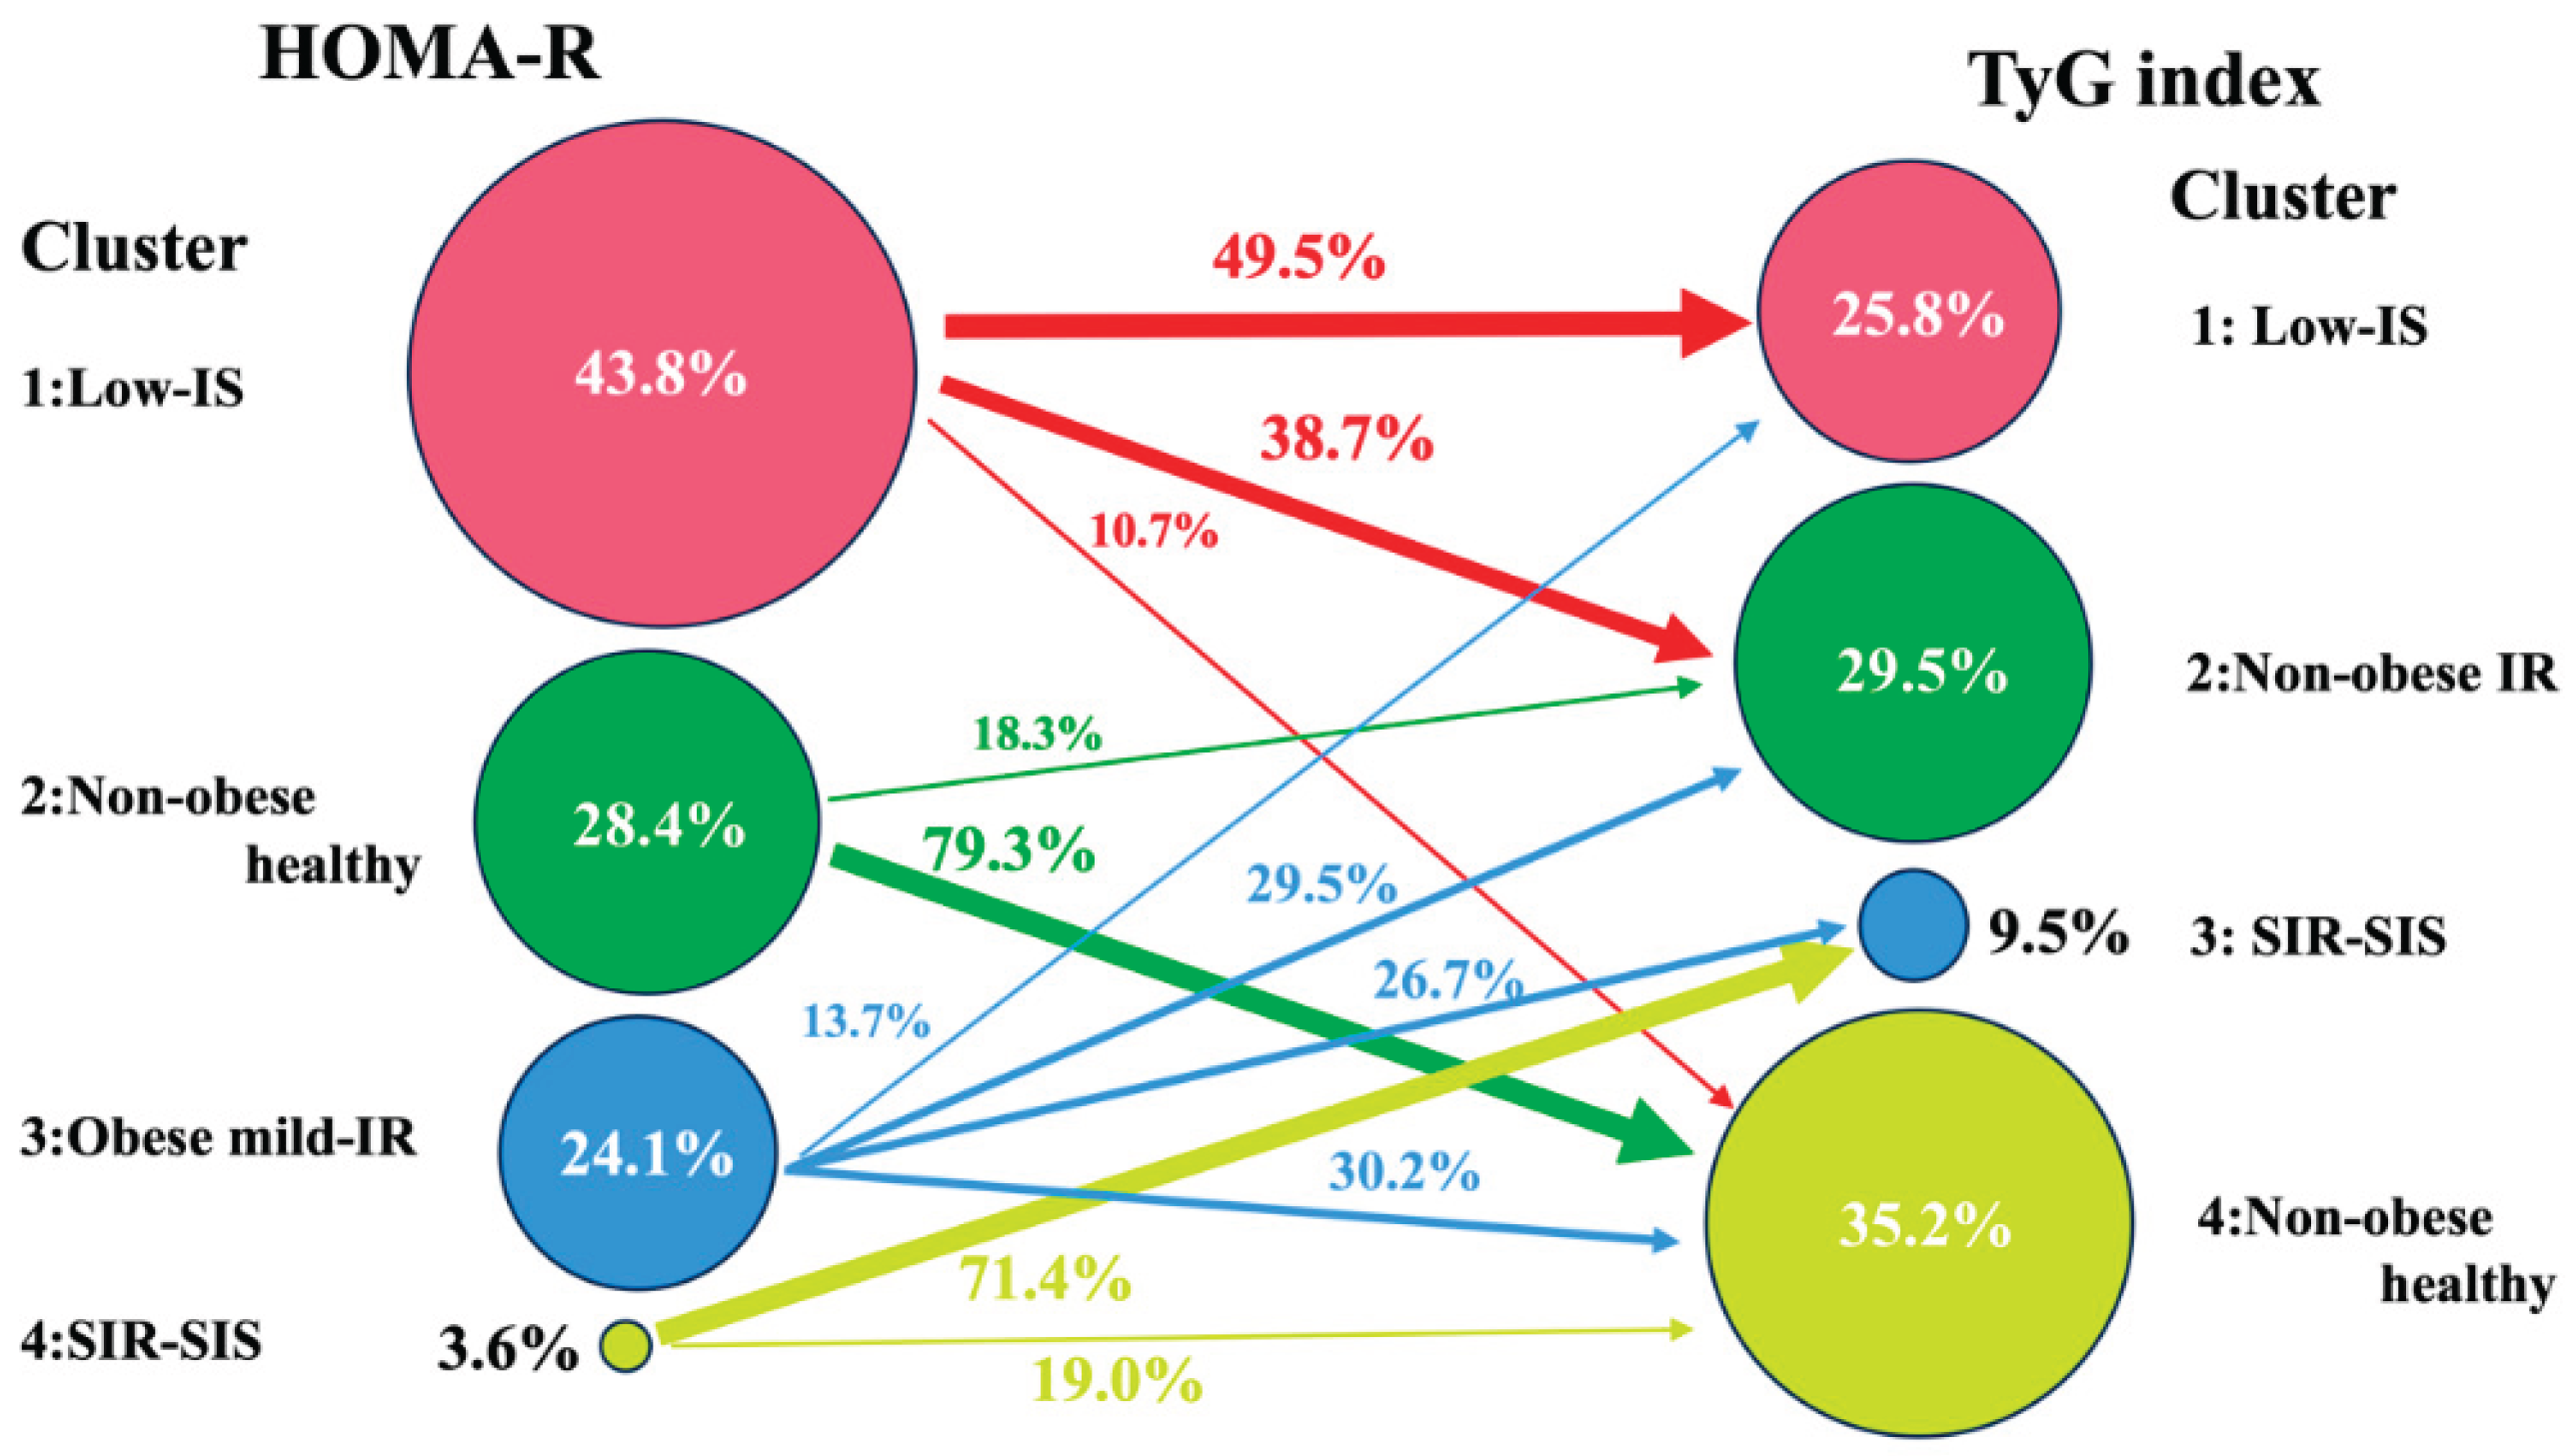
Figure 4.
Risk of incident CVD in relation to IGT and the Low-IS (TyG) cluster.


Table 1.
Baseline Characteristics of the study subjects.
| Number (Male/Female) | 577(265/312) |
| Age (yr) | 50.3±10.9 |
| Height (cm) | 158.0±8.8 |
| Body weight (kg) | 59.3±10.5 |
| Body mass index (kg/m2) | 23.7±3.2 |
| Plasma glucose (mg/dL) | 92.2±9.1 |
| Insulin (mU/mL) | 4.6±3.9 |
| HbA1c (%) | 5.18±0.38 |
| HOMA-R | 1.06±0.92 |
| HOMA-β | 62.5±56.2 |
| Body fat (%) | 16.7±13.5 |
| Total cholesterol (mg/dL) | 196.8±36.5 |
| Triglyceride (mg/dL) | 112.5±90.4 |
| TyG index | 8.371±0.566 |
| HDL cholesterol (mg/dL) | 56.3±13.7 |
| Systolic blood pressure (mmHg) | 122.5±17.3 |
| Diastolic blood pressure (mmHg) | 74.7±11.6 |
| Hypertension: n (%) | 209 (36.2) |
| Hyperlipidemia: n (%) | 198 (34.3) |
| Data are mean ± SD or number of subjects (%). | |
Table 2.
Risk of characteristics for CVD.
| Characteristics | Univariate | Age and gender adjusted | Multiple Factor adjusted | ||||||||
| HR | 95%CI | p | HR | 95%CI | p | HR | 95%CI | p | |||
| Age (per 1 year) | 1.00 | 0.95-1.03 | 0.905 | 1.00 | 0.97-1.03 | 0.953 | 0.98 | 0.94-1.02 | 0.309 | ||
| Gender (M vs F) | 2.84 | 1.34-6.04 | 0.007* | 2.84 | 1.34-6.04 | 0.007* | 2.66 | 1.24-5.71 | 0.012* | ||
| Hypertension | 1.07 | 0.85-2.20 | 0.855 | 1.07 | 0.46-2.45 | 0.881 | 1.00 | 0.43-2.33 | 0.991 | ||
| Hyperlipidemia | 1.51 | 0.74-3.06 | 0.254 | 1.48 | 0.73-3.01 | 0.279 | 1.85 | 0.83-4.10 | 0.131 | ||
| IGT | 2.68 | 1.16-6.25 | 0.021* | 3.16 | 1.30-7.69 | 0.011* | 2.77 | 1.11-6.91 | 0.028* | ||
| Low-IS (TyG) | |||||||||||
| Whole | 2.32 | 1.14-4.71 | 0.020* | 2.20 | 1.07-4.52 | 0.031* | 2.74 | 1.25-6.03 | 0.012* | ||
| in non IGT | 2.53 | 1.13-5.65 | 0.024* | 2.44 | 1.08-5.53 | 0.032* | 3.29 | 1.32-8.18 | 0.010* | ||
| in IGT | 1.30 | 0.29-5.81 | 0.731 | 1.77 | 0.37-8.35 | 0.472 | 1.66 | 0.34-8.15 | 0.534 | ||
| Multiple factors: All variables (Age, gender, hypertension, hyperlipidemia, IGT and Low-IS) were included. P<0.05 is indicated by*. | |||||||||||
Disclaimer/Publisher’s Note: The statements, opinions and data contained in all publications are solely those of the individual author(s) and contributor(s) and not of MDPI and/or the editor(s). MDPI and/or the editor(s) disclaim responsibility for any injury to people or property resulting from any ideas, methods, instructions or products referred to in the content. |
© 2025 by the authors. Licensee MDPI, Basel, Switzerland. This article is an open access article distributed under the terms and conditions of the Creative Commons Attribution (CC BY) license (http://creativecommons.org/licenses/by/4.0/).
Copyright: This open access article is published under a Creative Commons CC BY 4.0 license, which permit the free download, distribution, and reuse, provided that the author and preprint are cited in any reuse.


