
Submitted:
02 September 2025
Posted:
19 September 2025
You are already at the latest version
Abstract
This study presents a long-term assessment of inter-sensor radiometric calibration biases for NOAA OMPS nadir and CrIS instruments using four well-established validation methodologies implemented through the Inter-Sensor Radiometric Bias Assessment (iSensor-RCBA) portal, a component of the STAR Integrated Calibration/Validation System (ICVS) monitoring system. Four validation methods include the 32-Day Average, CRTM-DD, SNO, and Sensor-DD via SNO—to enhance monitoring and detect radiometric errors. The results demonstrate that the SDR data quality from three OMPS nadir instruments and three CrIS instruments aboard the SNPP, NOAA-20, and NOAA-21 satellites has generally remained stable over the long term, meeting scientific requirements with some margin—mainly during early orbit phases, anomalies, malfunctions, or calibration updates. Among four methodologies, the 32-Day method excels in identifying limitations of other used validation methods, particularly in terms of inter-sensor bias geographical coverage. For instance, the 32-Day method identifies an unusual feature in the NOAA-21 CrIS SDR data over the high latitudes of the Southern Hemisphere during the spring and summer seasons, which was not detected using the other three methods due to a limited coverage. The SNO method is particularly effective for detecting long-term calibration discrepancies in a single instrument. This is illustrated by an approximately 10-year time series of inter-sensor bias between SNPP OMPS Nadir Mapper and Metop-B GOME-2, which reveals significant degradation in GOME-2. Using the SNO method, two significant geolocation problems occurred on SNPP spacecraft were captured in inter-sensor biases between SNPP CrIS and GOES-16 ABI. Therefore, the iSensor-RCBA portal can serve as a crucial tool for providing supplemental information about long-term radiometric calibration stability of satellite radiance data across JPSS and other satellite instruments.
Keywords:
long-term inter-sensor radiometric calibration biases
; OMPS nadir instruments and CrIS instruments onboard the SNPP
; NOAA-20 and NOAA-21
; GOES-18 ABI
; Metop-B GOME-2
; Simultaneous Nadir Overpass (SNO)
; double differences via the third sensor
; double differences via a radiative transfer model
; 32-day average of radiance differences
; LEO-LEO
; LEO-GEO inter-sensor radiometric calibration biases
; inter-sensor calibration and validation monitoring system
1. Introduction
The successful launch of the SNPP satellite on 28 October 2011 started a new era for the NOAA, which is being followed with four Joint Polar Satellite System (JPSS) satellites from JPSS-1 through JPSS-4. The JPSS-1, aka NOAA-20, was successfully launched on November 18, 2017, while the JPSS-2, aka NOAA-21, was successfully launched on November 10, 2022. Across past more than one decade, there had been a number of calibration/validation analyses to ensure that the quality of TDR/SDR data from five types of JPSS instruments (i.e., ATMS, CrIS, OMPS NM, OMPS NP, and VIIRS) meet scientific requirements (e.g., [1]-[41]). In reality, the quality of the data might be degraded anytime during each satellite mission due to new anomalies or degradations occurred in spacecrafts, sensor, calibration algorithm, and SDR/TDR data processing stream. This calls for the necessity of keeping track of the lifetime performance for satellite spacecrafts, instruments, and scientific SDR/TDR data during the entire mission. The acronyms used in this study are explained in Appendix A, if they are not explained in the main body of the manuscript.
In the NOAA/STAR, an operational ICVS Long-Term Monitoring (LTM) web-based system has been developed for more than one decade to monitor the quality of SDR (TDR) data for more than 30 sensors in a near-real time (NRT) mode [42]. The monitored sensors include the aforesaid five types of operational JPSS instruments onboard from SNPP to NOAA-21, and heritage POES instruments (e.g., AMSU-A, MHS, and AVHRR). The baseline functions and sensor-based products in the ICVS-LTM system will be described in a companion paper [43]. For simplification, ICVS-LTM is frequently referred to as ICVS. Beyond individual sensor-based data quality monitoring, inter-sensor radiometric calibration consistency is becoming increasingly essential and will remain crucial for enhancing the understanding of science product quality, e.g., [44]-[69]. This is because the uncertainty of SDR (TDR) data records depends not only on the calibration accuracy and LT stability of individual sensors, but also on their calibration consistency across instruments and platforms. Therefore, a new portal—the Long-Term Inter-Sensor Radiometric Calibration Bias Assessment (iSensor-RCBA)—has been developed within the ICVS framework. This portal integrates multiple existing methods to monitor the mission-long radiometric consistency of SDR (TDR) data across a range of LEO and GEO instruments and satellites.
The iSensor-RCBA portal covers three basic inter-sensor comparison components: the JPSS instrument inter-sensor comparison component, including each of the abovementioned five JPSS instruments onboard the SNPP, NOAA-20 and NOAA-21 satellites; the other two components are the LEO-LEO and LEO-GEO. The JPSS instruments are categorized as an independent component, separate from the LEO-LEO component to highlight their significance in supporting JPSS missions. The LEO instruments in the LEO-LEO and LEO-GEO components include AMSU-A, MHS, IASI, and GOME-2, while the GEO instrument is ABI onboard the GOES-16 and GOES-18 platforms. The portal employs four existing methods: SNO [45]-[48], Sensor-double difference (DD), CRTM-DD, 32D-AD (32-day averaged difference) or 32-day average [51]. The Sensor- DD uses a third sensor on a different satellite as a transfer and is based on various SNO measurements, CRTM-DD uses the Joint Center for Satellite Data Assimilation (JCSDA) Community Radiative Transfer Model (CRTM) [70]-[72] as a transfer. The use of multiple methods leverages the advantage of each method in terms of geographical coverage and channel usage for inter-sensor radiance difference assessment.
This study will examine the applications of the iSensor-RCBA portal across three OMPS nadir instruments and three CrIS instruments onboard the SNPP, NOAA-20, and NOAA-21 satellites. The OMPS nadir instrument consists of two spectrometers, Nadir Mapper (NM) and Nadir Profiler (NP). In particular, the long-term stability of OMPS NM, OMPS NP, and CrIS SDR data quality is assessed using time series of inter-sensor radiometric biases between various OMPS and CrIS instrument pairs. In addition, two further inter-sensor radiance bias analyses will be conducted. The first analysis is to evaluate approximately ten-year time series of inter-sensor radiometric calibration biases at a few channels between SNPP OMPS NM and Metop-B GOME-2 to capture sensor throughput degradation features and derive yearly-average degradation rates of Metop-B GOME-2 at 11 overlapped channels. The resulting values will be further compared with those derived from GOME-2 Earth radiance and solar flux measurements provided by EUMETSAT’s Pieter Valks (personal communication). Another analysis is to evaluate time series of inter-sensor radiometric calibration biases at 3 ABI-like channels between SNPP CrIS and GOES-16 ABI to address two geolocation error events occurred on the SNPP CrIS data.
This study is organized as follows. The next section introduces the development of the iSensor-RCBA inter-sensor comparison portal, including the analyzed instruments, data, and methods. Section 3 presents the applications of the portal. Summary and conclusions are provided in the final section.
2. Development of the iSensor-RCBA Portal
The iSensor-RCBA portal leverages SDR and TDR data collected from JPSS instruments, legacy NOAA POES and Metop microwave sensors, as well as GOES ABI instruments. It applies one or more analytical methods to estimate long-term inter-sensor radiometric calibration biases for each instrument pair. A summary of the instruments, datasets, and methodologies used in this study is presented below, followed by an overview of the iSensor-RCBA functional chart.
2.1. Instruments and Data
The current LTICBA includes the following instruments: the aforesaid five types of operational instruments onboard from SNPP to NOAA-21 platforms, the ABI onboarding both GOES-16 and GOES-18, the AMSU-A and MHS from NOAA-18, NOAA-19, Metop-B and Metop-C, GOME-2 on the Metop-B, the IASI on the Metop-B and Metop-C. Detailed descriptions of the instruments can be found in [73]-[81]. However, the key channel information for the analyzed sensors in this study are summarized from Tables B1 to B3 in Appendix B.
The data per satellite sensor are typically divided into three levels: RDRs (level 0), SDR (level 1), and EDRs (level 2). The radiometric parameter in SDR data is available in one or another unit - radiance, reflectance, antenna temperature, or brightness temperature - depending upon the sensor or channel. The SDR data from SNPP, NOAA-20 and NOAA-21 are operationally processed within the NOAA JPSS Interface Data Processing Segment (IDPS). All operational SDR data are distributed through the OSPO Production Distribution and Access (PDA) (registration is required) in near-real time mode, and archived through the NOAA Comprehensive Large Array-data Stewardship System (CLASS) for the board national and international user community.
2.2. Briefing of Four Validation Methods
In the iSensor-RCBA portal, part or all of four following well-validated methods, 32D-AD, CRTM-DD, SNO, and Sensor-DD via SNO, are employed to compute inter-sensor radiometric biases, depending upon select-sensor pairs.
The 32D-AD is a statistical method by calculating 32-day average of radiometric differences between the same instrument onboard two of SNPP and JPSS platforms [51]. This method is based on the assumption that, after a satellite completes one orbit repeat cycle, each orbit on the first day can typically cover the entire globe and return to its initial measurement point, ensuring complete global coverage by both sensors. Two cycles, or 32 days, are used to minimize diurnal variations caused by the 50-minute orbital separation between SNPP and NOAA-20. By using SNPP and NOAA-20 (N20) as an example, the computation equation is expressed as follows.
The term represents the 32-day average of all quality-controlled daily global radiometric differences for the same instrument when comparing NOAA-20 and SNPP. In this context, refers to the average global NOAA-20 radiance on the ith day; denotes the average global SNPP radiance for the same day; a three-sigma (standard deviation) quality control is applied to eliminate outliers from their computations. This approach can also be used to compute ( ) or () for other instrument pairs. More detailed explanations about this method can be found in references [51].
The RTM-DD method calculates the double difference of radiance deviations from CRTM simulations for two selected instruments, as described below.
where and represent the averaged radiance deviations at the 1st or 2nd sensor respectively, compared to RTM simulations. It is assumed that the averaged simulation errors arising from RTM limitations and input inaccuracies are comparable for the two evaluated instruments and largely cancel out in (2). Therefore, the double difference resulting from (2) primarily reflects inter-sensor radiometric calibration errors between two instruments. In this study, the JCSDA CRTM [70]-[72] is used. Accordingly, RTM-DD is hereinafter replaced by CRTM-DD.
The SNO method was well presented in [47,48]. The method was initialized based on two polar-orbiting satellites that circle the Earth at slightly different periods will have simultaneous nadir overpass (SNO) events, where the satellites view the same nadir location at nearly the same time. Ideally, identical radiometers flown on different satellites should produce redundant observations at SNO locations, thus any deviation from these results would be primarily attributable to relative calibration differences between the radiometers. In this study, this method is applied to SNO analyses between OMPS NM and GOME-2, CrIS and ABI, CrIS and IASI, and proper quality control criteria are applied to remove outliers from obtained SNO observations (see Section 3.3 below for details).
The principle of the Sensor-DD method is similar to that of the RTM-DD method, except that a third sensor, rather than an RTM, is used as the transfer reference. Specifically, inter-sensor radiometric calibration biases are derived from the double differences of SNO-based inter-sensor radiometric comparisons using the third sensor as the transfer, as outlined below.
where and denote the average radiance deviations for the 1st or 2nd sensor respectively compared to the 3rd sensor respectively, which are computed based on collected SNO observations. An average is utilized to reduce impacts of imperfect SNO observations due to small differences in time, spatial and spectral response, distance, and azimuthal viewing conditions. Similar to the SNO method above, different quality control criteria are applied to remove outliers from computations of and depending upon selected instrument pairs (refer to Section 3.3 below).
2.3. iSensor-RCBA Portal
The iSensor-RCBA comprises three basic components (1) JPSS inter-sensor comparison, (2) LEO-LEO inter-sensor comparison, and (3) LEO-GEO comparison.
Figure 1(a) draws its diagram along with the involved instruments within each component. The JPSS component includes each JPSS instrument pair that onboard on two of the SNPP, NOAA-20 and NOAA-21 satellites, such as ATMS pair, CrIS pairs, OMPS NM pairs, OMPS NP pairs, and VIIRS pairs. The LEO-LEO component currently covers the following pairs of instruments: OMPS NM vs. GOME-2, ATMS vs. AMSU-A, CrIS vs. IASI. Here, AMSU-A is from one of available legacy NOAA and Metop satellites, GOME-2 is only from Metop-B now, and IASI from Metop-B and Metop-C. The LEO-GEO component includes sensor pairs such as VIIRS-ABI and CrIS-ABI, with ABI originating from GOES-16 and GOES-18. Products in both the LEO-LEO and LEO-GEO components are typically generated from intermediate products produced by the JPSS component, as described in (1) and (2) above. Additionally, the portal is a web-based monitoring tool. As an example, the website page of the OMPS portion about NM within the LTICBA JPSS component is described in Fig. 1(b).
3. Applications of the iSensor-RCBA
The iSensor-RCBA portal offers various long-term inter-sensor comparison results across numbers of satellite instruments, such as (SNPP) JPSS instruments, legacy NOAA and Metop AMSU-A and MHS, GOES-16 and GOES-18 ABI. Most of the products are operationally showcased on a publicly accessible ICVS website (https://www.star.nesdis.noaa.gov/icvs/index.php). The analysis in this study will focus on long-term inter-sensor radiance difference assessments for the following instrument pairs: OMPS pairs and CrIS pairs across SNPP, NOAA-20 and NOAA-21 platforms, SNPP OMPS NM and GOME-2 pair, SNPP CrIS and GOES-16 ABI pair. Application of the portal in VIIRS instrument pairs will be given in future studies.
3.1. Inter-Sensor Radiometric Biases between OMPS Instruments
The OMPS NM and NP are two nadir spectrometers onboard the SNPP and NOAA-20 and NOAA-21 platforms. They measure Earth radiance and Solar irradiance spectra in the UV bands. In particular, the NM covers wavelengths from 300nm to 380nm for operational observations of nadir total column ozone, while the NP covers wavelengths from 250 to 310nm for observations of ozone vertical distributions. An initial analysis of the inter-sensor comparison was conducted using either the CRTM-DD or the Sensor-DD, based on limited data period in previous studies [24]-[26]. Additionally, a conceptual analysis was given using the 32D-AD for limited data sets between SNPP and NOAA-20 OMPS NPs [51]. Those analyses have demonstrated agreement in the SDR data for most channels between the two OMPS NMs and NPs.
This study will extend from existing studies to three OMPS NMs and NPs to assess relatively long-term stability of inter-sensor radiometric calibration biases among the OMPS instruments primarily using the 32D-AD method. The CRTM-DD method will not be used here due to its very poor computation efficiency (about a few days are needed to complete one day of OMPS NM data radiance simulations). The SNO method will be applied to SNPP OMPS NM and Metop-B GOME-2 inter-sensor comparison analysis. Hence, only three methods, i.e., 32D-AD, SNO and GOME-2-DD via SNO, are used in the OMPS portion of the JPSS component, depending upon sensors (see Fig. 1(a) above).
Figs. 2(a) and (b) display averages and standard deviations of long-term inter-sensor normalized radiance (NR) differences (%) at all channels between NOAA-20 and SNPP OMPS NM and NP, respectively. Here, the NR is defined as the ratio of Earth-view radiance to solar irradiance. These results are a statistical analysis of multiple 32-day averages by using the data sets spanning the period from November 7th, 2019, to January 12th, 2025. As illustrated in the figures, the mean NR differences vary with wavelength for both OMPS NMs and OMPS NPs. Their magnitudes generally remain within ±2% for the NM and NP channels with certain exceptions. For example, the mean NR differences often exceed ±2% at wavelengths between 300 and 305 nm for both NMs, and at wavelengths below 255 nm and between 300 and 305 nm for both NPs. These discrepancies are relevant to one or both of the residual stray light effect and mis-match of wavelength scales in the dichroic range [41]. Non-identical OMPS spectral bandpass features between SNPP and NOAA-20 OMPS NP also contribute to the discrepancies [25]. Fortunately, these large inter-sensor errors don’t impact the quality of current OMPS NM SDR-derived atmospheric ozone products since the data below 305 nm are not used.
Figure 2(c) and 2(d) further display time series of 32-day running average radiometric biases between the two OMPS NMs and NPs at a few channels that are used in the current ozone retrievals [17]. The results confirm the long-term stability of inter-sensor radiometric calibration performance between SNPP and NOAA-20 OMPS NMs and NPs in the absence of satellite spacecraft issues. Apparently, the updates of calibration tables reduce the inter-sensor biases. For example, an updated NOAA-20 OMPS wavelength table on September 4th, 2020, reduced inter-sensor NR differences approximately by 1%. In addition, a seasonal pattern appears in the both NM and NP inter-sensor bias time series. A few factors contribute to this feature, including the high sensitivity of UV radiance to the solar zenith angle (SZA), the difference in orbit equator crossing times (approximately 50 minutes) between SNPP and NOAA-20 satellites, and seasonal variations in atmospheric composition (e.g., ozone and aerosols) and surface albedo. As a result, seasonal variations are still not entirely removed in the inter-sensor radiometric calibration differences between the two OMPS instruments, even though two orbit-cycles of data (32 days) are used. In contrast to the OMPS instruments, this seasonal pattern is not clearly observed for two CrIS instruments (see Section 3.2 below).
A similar analysis is conducted for the SNPP and NOAA-21 OMPS-NM and OMPS-NP pairs. Figure 3(a) and Figure 1(b) show the 32-day average inter-sensor biases from July 2, 2023, to January 12, 2025, for five channels in the two NMs and seven channels in the two NPs, respectively. Compared to the inter-sensor biases between SNPP and NOAA-20 shown in Figure 2, the absolute magnitudes of inter-sensor NR biases are significantly decreased in the displayed channels after April 11, 2024, following the implementation of an updated solar flux calibration table in the NOAA-21 OMPS NM and NP SDR processing system. The pre-launch albedo calibration of the NOAA-21 OMPS nadir instruments (NM and NP) was reported to have errors of several percent, varying by wavelength, either in the OMPS response or in the solar irradiance calibrations [courtesy of Jaros G. in the NASA for an email communication in 2024]. This issue resulted in significant radiometric calibration errors in the NOAA-21 OMPS SDRs, averaging 2.2% for the OMPS NM and 4.3% for the OMPS NP [41]. The updated solar flux calibration table was designed to eliminate these average biases in the OMPS NM and NP SDR data. However, substantial calibration errors still persist in some channels between 300 nm and 310 nm due to strong wavelength-dependent biases in the NOAA-21 solar calibration coefficients [41]. This also explains why the inter-sensor biases in Figure 3(b) still exceed the ±2% requirement for the NOAA-21 NP channels at 301.8 nm and 305.7 nm.
3.2. Inter-Sensor Radiometric Biases between CrIS Instruments
The CrIS is a hyperspectral infrared (IR) sounder that provides high-resolution, vertical temperature and moisture profiles of the atmosphere, aiding in weather forecasting. It covers 2211 spectral channels at a full spectral resolution (FRS) mode. The SDR data of CrIS instruments onboard SNPP, NOAA-20, and NOAA-21 have met the scientific requirements for a while [36]-[38]. The inter-sensor comparison performance of CrIS data during the limited data sets was also assessed by using either the CRTM-DD or the Sensor-DD in the previous studies [36]-[38]. A preliminary analysis covering 32 days of the data was also given for all CrIS channels by using the 32D-AD method [51]. This study extends previous analyses to longer time periods to evaluate the long-term stability of inter-sensor radiometric biases across three CrIS instruments.
The CRTM-DD method, detailed in Eq. (1) of Appendix D, calculates the double difference of radiance deviations from CRTM simulations for two selected instruments. This method is commonly used to evaluate CrIS inter-sensor radiometric calibration biases within the ICVS iSensor-RCBA portal, due to its balanced computational efficiency and simulation accuracy for clear-sky observations over open oceans. Figure 4 presents the long-term stability of SDR data across three CrIS instruments through time series of daily-average inter-sensor radiometric calibration biases at five channels. These results are derived by applying CRTM-DD to CrIS observations under clear sky conditions over ocean regions between 55°S and -55°N to reduce simulation errors due to inaccurate surface emissivity over land or sea-ice conditions. The simulations use ECMWF surface and atmospheric profiles [82,83] as inputs to the CRTM. An empirical scheme is proposed to exclude cloud-contaminated CrIS pixels by analyzing brightness temperature differences at the 925 cm⁻¹ window channel between the central FOV and each of the other eight FOV positions in a 9-FOV array. A pixel is flagged as cloud-contaminated if any of the eight differences exceeds 0.5 K. Additionally, if any brightness temperature among the eight surrounding FOVs is below 267 K, the pixel is also considered cloud-contaminated. Pixels meeting either criterion are excluded from the CRTM simulation.
at 5 channels among 3 CrIS instruments using CRTM-DD for CrIS observations during the daytime and nighttime under clear skies over oceans between −55°S and +55°N. In the figure, the results for different pair of CrIS instruments are marked in a different color, NOAA-20 and NOAA-21 are replaced using N20 and N21 to save space; the data coverage varies with each pair of CrIS instruments depending upon their availabilities. Five dash boxes with from 1 to 5 respectively in the figure mark approximate positions of the permanent loss in the SNPP SDR data due to different reasons. (a) 700 cm-1. (b) 900 cm-1. (c) 1500 cm-1. (d) 2320 cm-1. (e) 2500 cm-1.
Generally, observations at three instruments during the analyzed period are in a family with the averaged differences smaller than 0.2. Certain fluctuations or data gaps were observed, particularly in relation to the SNPP CrIS instrument issues. Due to the mission extending well beyond its standard lifetime, the CrIS instrument experienced failures in both the side-1 and side-2 electronics. As a result, three switches occurred between side-1 and side-2 electronics, as indicated in the figure. Each failure caused permanent loss of the data in MW band or LW band. For example, the first failure of the side-1 electronics from March 24th to June 23th, 2019, resulted in permanent loss of the MW bands data (see the gap labeled as #3 in Fig. 4 (c). The use of the side-1 electronics further caused permanent loss of the MW bands data from July 12th, 2021 to August 31st, 2023 (see the long gap labeled as # 4 in Fig. 4 (c). An excellent analysis and recalibration about SNPP CrIS SDR data after the side switch was given in a previous study of SNPP CrIS SDR data [16]. Additionally, the impact of the wrong calibration table is detected in the long-term inter-sensor biases. For instance, a wrong engineering packet with a neon laser wavelength default value was set up for a few months until 08/31/2023 for the SNPP CrIS after its electronics was switched from side-1 to side-2. This resulted in sudden drop by approximately 0.1K.
The CRTM-DD method provides insights into the quality of CrIS SDR data under clear skies in low- and mid-latitude regions. However, its effectiveness in detecting regional calibration inconsistencies remains insufficient, particularly when such deviations occur at non-CRTM simulation regions. In contrast, the 32D-AD method is suitable for global CrIS observations, thus identifying an unexpected feature on NOAA-21 observations over high latitudes. Figs. 5(a) and 5(b) showcase the average inter-sensor biases between NOAA-20 and NOAA-21 CrIS observations from January 1st to February 3rd, 2025, by using the CRTM-DD and the 32D-AD methods, respectively. The computations were performed separately for nighttime (descending data) and daytime (ascending data) to better assess the impact of potential regional calibration differences on the observations.
Figure 5.
Averaged inter-sensor radiometric calibration biases between NOAA-21 and NOAA-20 CrIS instruments, for ascending (daytime) and descending (nighttime) respectively. The data covers the period from January 5th to February 4th, 2025, and the results under clear skies over oceans between −55°S and +55°N using CRTM-DD method in (a) are an average of 32-day results to provide a consistent temporal period with that using the 32D-AD method. (a) CRTM-DD. (b) 32D-AD.
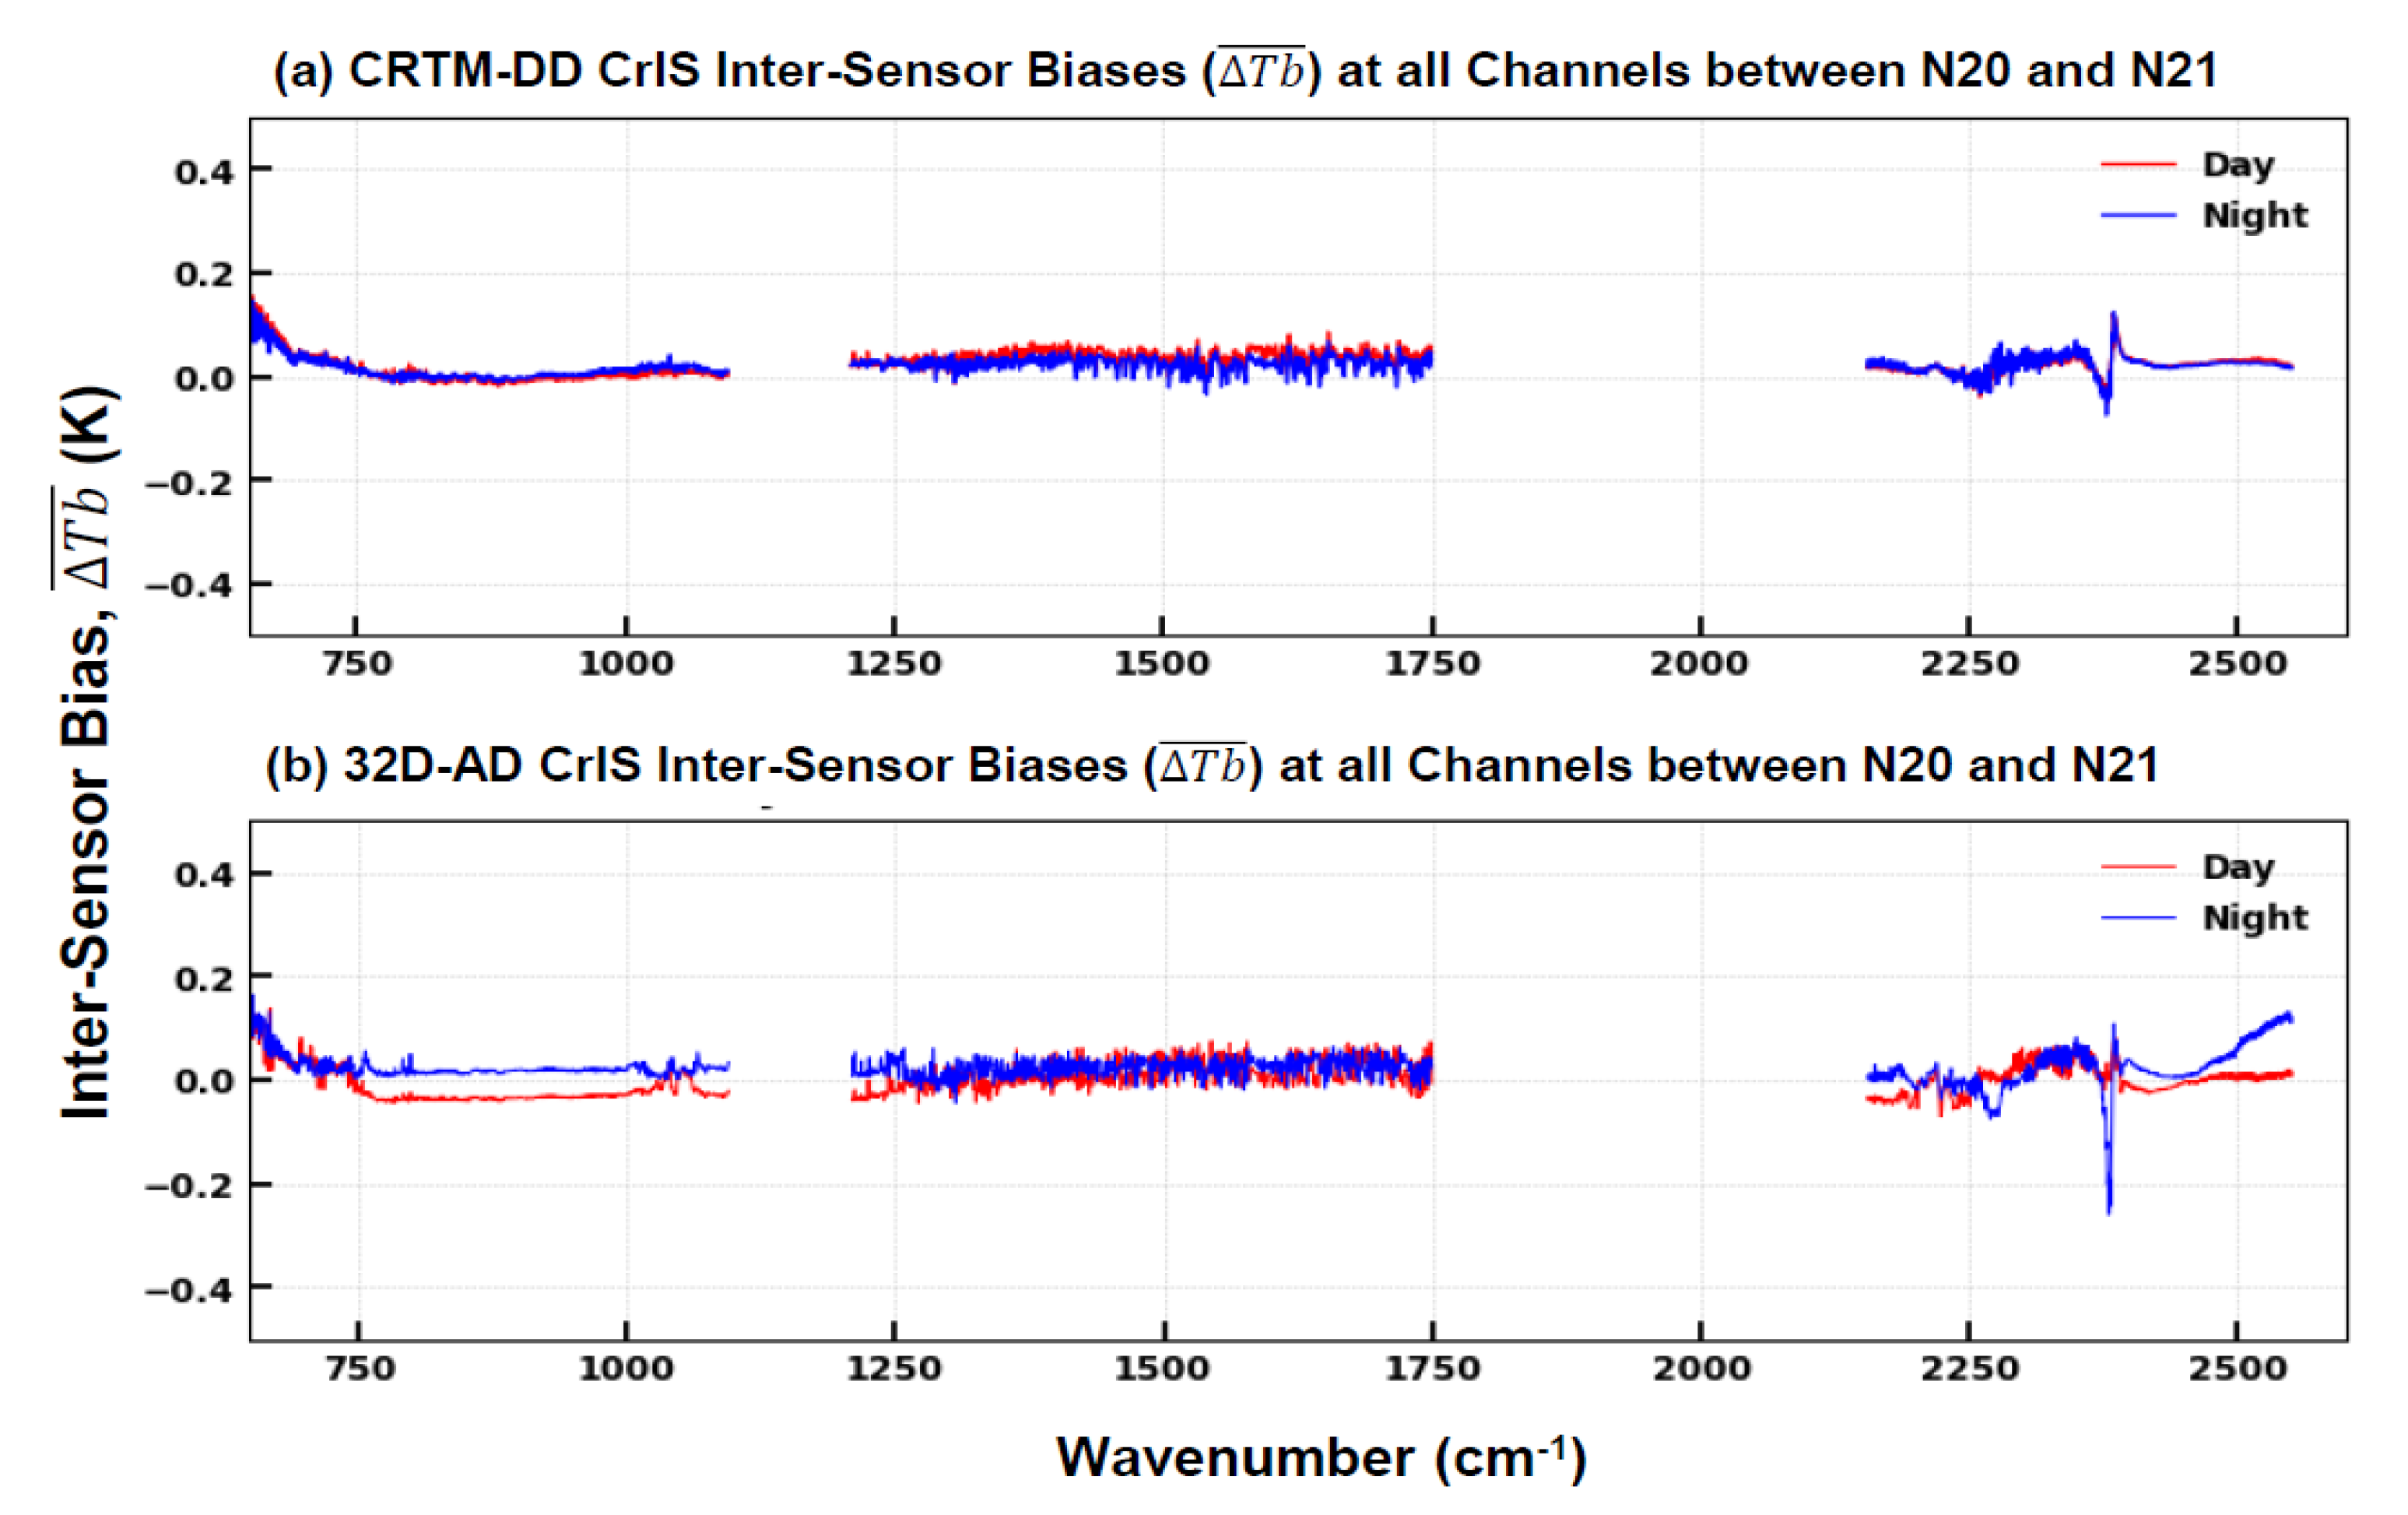
Generally, the two methods reveal that the NOAA-20 and NOAA-21 CrIS observations at both ascending and descending nodes are very comparable: is typically within ±0.2K, with an exception appears around 2350 cm-1, where | exceeds 0.2K from 32D-AD method. Another important feature in the 32D-AD based results is that the differences of around 2500 cm-1 between ascending and descending nodes exceed 0.1K (see Fig. 5b). This discrepancy not found in the CRTM-DD results. Recall that the CRTM-DD results for both ascending and descending nodes were computed using data between −55°S and +55°N, thus being unable to identify anomalous features in the CrIS data outside the CRTM simulation analysis region.
To understand this discrepancy in at 2500 cm-1 from 32D-AD method between two nodes (daytime and nighttime) of observations, further analysis was performed. Figure 6 shows the time series of at 2500 cm⁻¹, from April 1, 2023 to February 3, 2025, obtained using the 32D-AD method. The dates in x-axis represent the end dates of the 32-day dataset periods. The large differences in between ascending and descending data are observed primarily from March through September. This seasonal discrepancy indicates that some inconsistencies might remain in either NOAA-21 or NOAA-20 CrIS during this period. Based on our analysis, unexpected variations in the calibration target temperatures of NOAA-21 CrIS have been observed as the instrument transitions from orbital darkness into sunlight. These variations are believed to contribute to the observed errors in the NOAA-21 CrIS Earth-view radiances, and are likely responsible for the increase in inter-sensor radiometric biases between NOAA-21 and NOAA-20 CrIS during the nighttime period, as illustrated in Figure 6. While a detailed root-cause analysis of this performance behavior is beyond the scope of the present manuscript, it is being actively investigated in a dedicated study conducted by the operational CrIS calibration and validation (Cal/Val) team, which is currently under review. That study explores several preliminary hypotheses related to this behavior. The analysis presented here complements those efforts by providing independent cross-instrument comparisons and contributing to the long-term monitoring and assessment of radiometric consistency across CrIS sensors.
) at 2350 cm-1 between NOAA-21 and NOAA-20 CrIS observations at day-time and night-time separately. The time series of the results are carried out in a running 32-day of the data sets with one day-shift. The data sets used in the figure cover the period from April 1st, 2023 to Feb. 3rd, 2025 since the end date of each 32-day dataset in the computation is used a date index in the figure.
Therefore, the 32D-AD methodology has demonstrated its effectiveness in identifying and monitoring radiometric inconsistencies, such as the unusual feature observed in the NOAA-21 CrIS data, even in regions where other methods are unavailable.
3.3. Inter-Sensor Radiometric Biases for Other Instrument Pairs
In addition to the above results about the JPSS instrument pairs, the iSensor-RCBA portal produces various results of inter-sensor radiometric biases across JPSS (SNPP) and non-JPSS instruments using the SNO and Sensor-DD methods, as described in the LEO-LEO and LEO-GEO components in Fig. 1(a). Therefore, we conduct the following inter-sensor comparison analyses to illustrate scientific applications in identifying issues that impact the quality of SDR data in one SNPP or non-JPSS instrument: SNPP OMPS NM and Metop-B GOME-2 and SNPP CrIS and GOES-16 ABI.
3.3.1. SNPP OMPS NM and Metop-B GOME-2
The SNPP OMPS NM SDR data shows a long-term stability particularly at wavelengths above 310 nm [84]-[86], which is further confirmed in this study. In contrast, the Metop-B GOME-2 is undergoing significant sensor degradation over long mission period [87]. Therefore, it is interesting to investigate the feasibility of using OMPS and GOME-2 SNO-based inter-sensor biases to estimate GOME-2 sensor degradation rate.
Figure 7 (a) ~ (c) present time series of SNO-average inter-sensor biases at 317.42 nm, 345.38 nm, 372.93 nm respectively. The SNO observations are selected based on a window with less than 80km spatial distance and 120s temporal difference. The computation procedure is referred to two previous studies in [88,89]. The inter-sensor biases exhibit a gradual increase with time, having an obvious wavelength dependency from a smaller trend at longer wavelength to a large trend at short wavelength. The three channels in the figure span the range of the overlapping wavelengths, ensuring that the bias trends in the remaining eight channels in Table C3 align with those shown in Fig. 7 (a) and Fig. 7 (c) (figures omitted).
The SNPP OMPS NM sensor exhibits a long-term stability with a small degradation, less than 0.3% per decade at wavelengths above 310 nm [84]. The SNPP OMPS NM SDR data thus has a good stability with time: the maximum variation of mean reflectance at wavelengths above 330 nm within DCC targets is approximately 0.296% per decade [90]. As a result, it is reasonable to assume that the discovered trends in Figs. 7 (a) to (c) are caused primarily by the degradation of Metop-B GOME-2. Additionally, the derived inter-sensor reflectance differences increase approximately linearly over time, suggesting that the GOME-2 sensor degradation rate remains nearly constant throughout the analyzed period. Hence, the GOME-2 sensor degradation rate can be estimated using the slope of the linear fit for the inter-sensor reflectance difference trend. Note that the SNO observations between OMPS NM and GOME-2 were collected at nadir pixels. So, the derived degradation rates represent the performance of GOME-2 at nadir positions. Figure 7 (d) presents the GOME-2 yearly degradation rates, estimated at 11 overlapping channels. As a comparison, the results using GOME-2 Earth radiance and solar flux measurements from EUMETSAT, which was provided by Dr. Pieter Valks in EUMETSAT, are added in Fig. 7 (d). The yearly degradation rates computed using those two methods are very consistent. This indicates the reasonability of the above assumptions.
3.3.2. SNPP CrIS and GOES-16 ABI
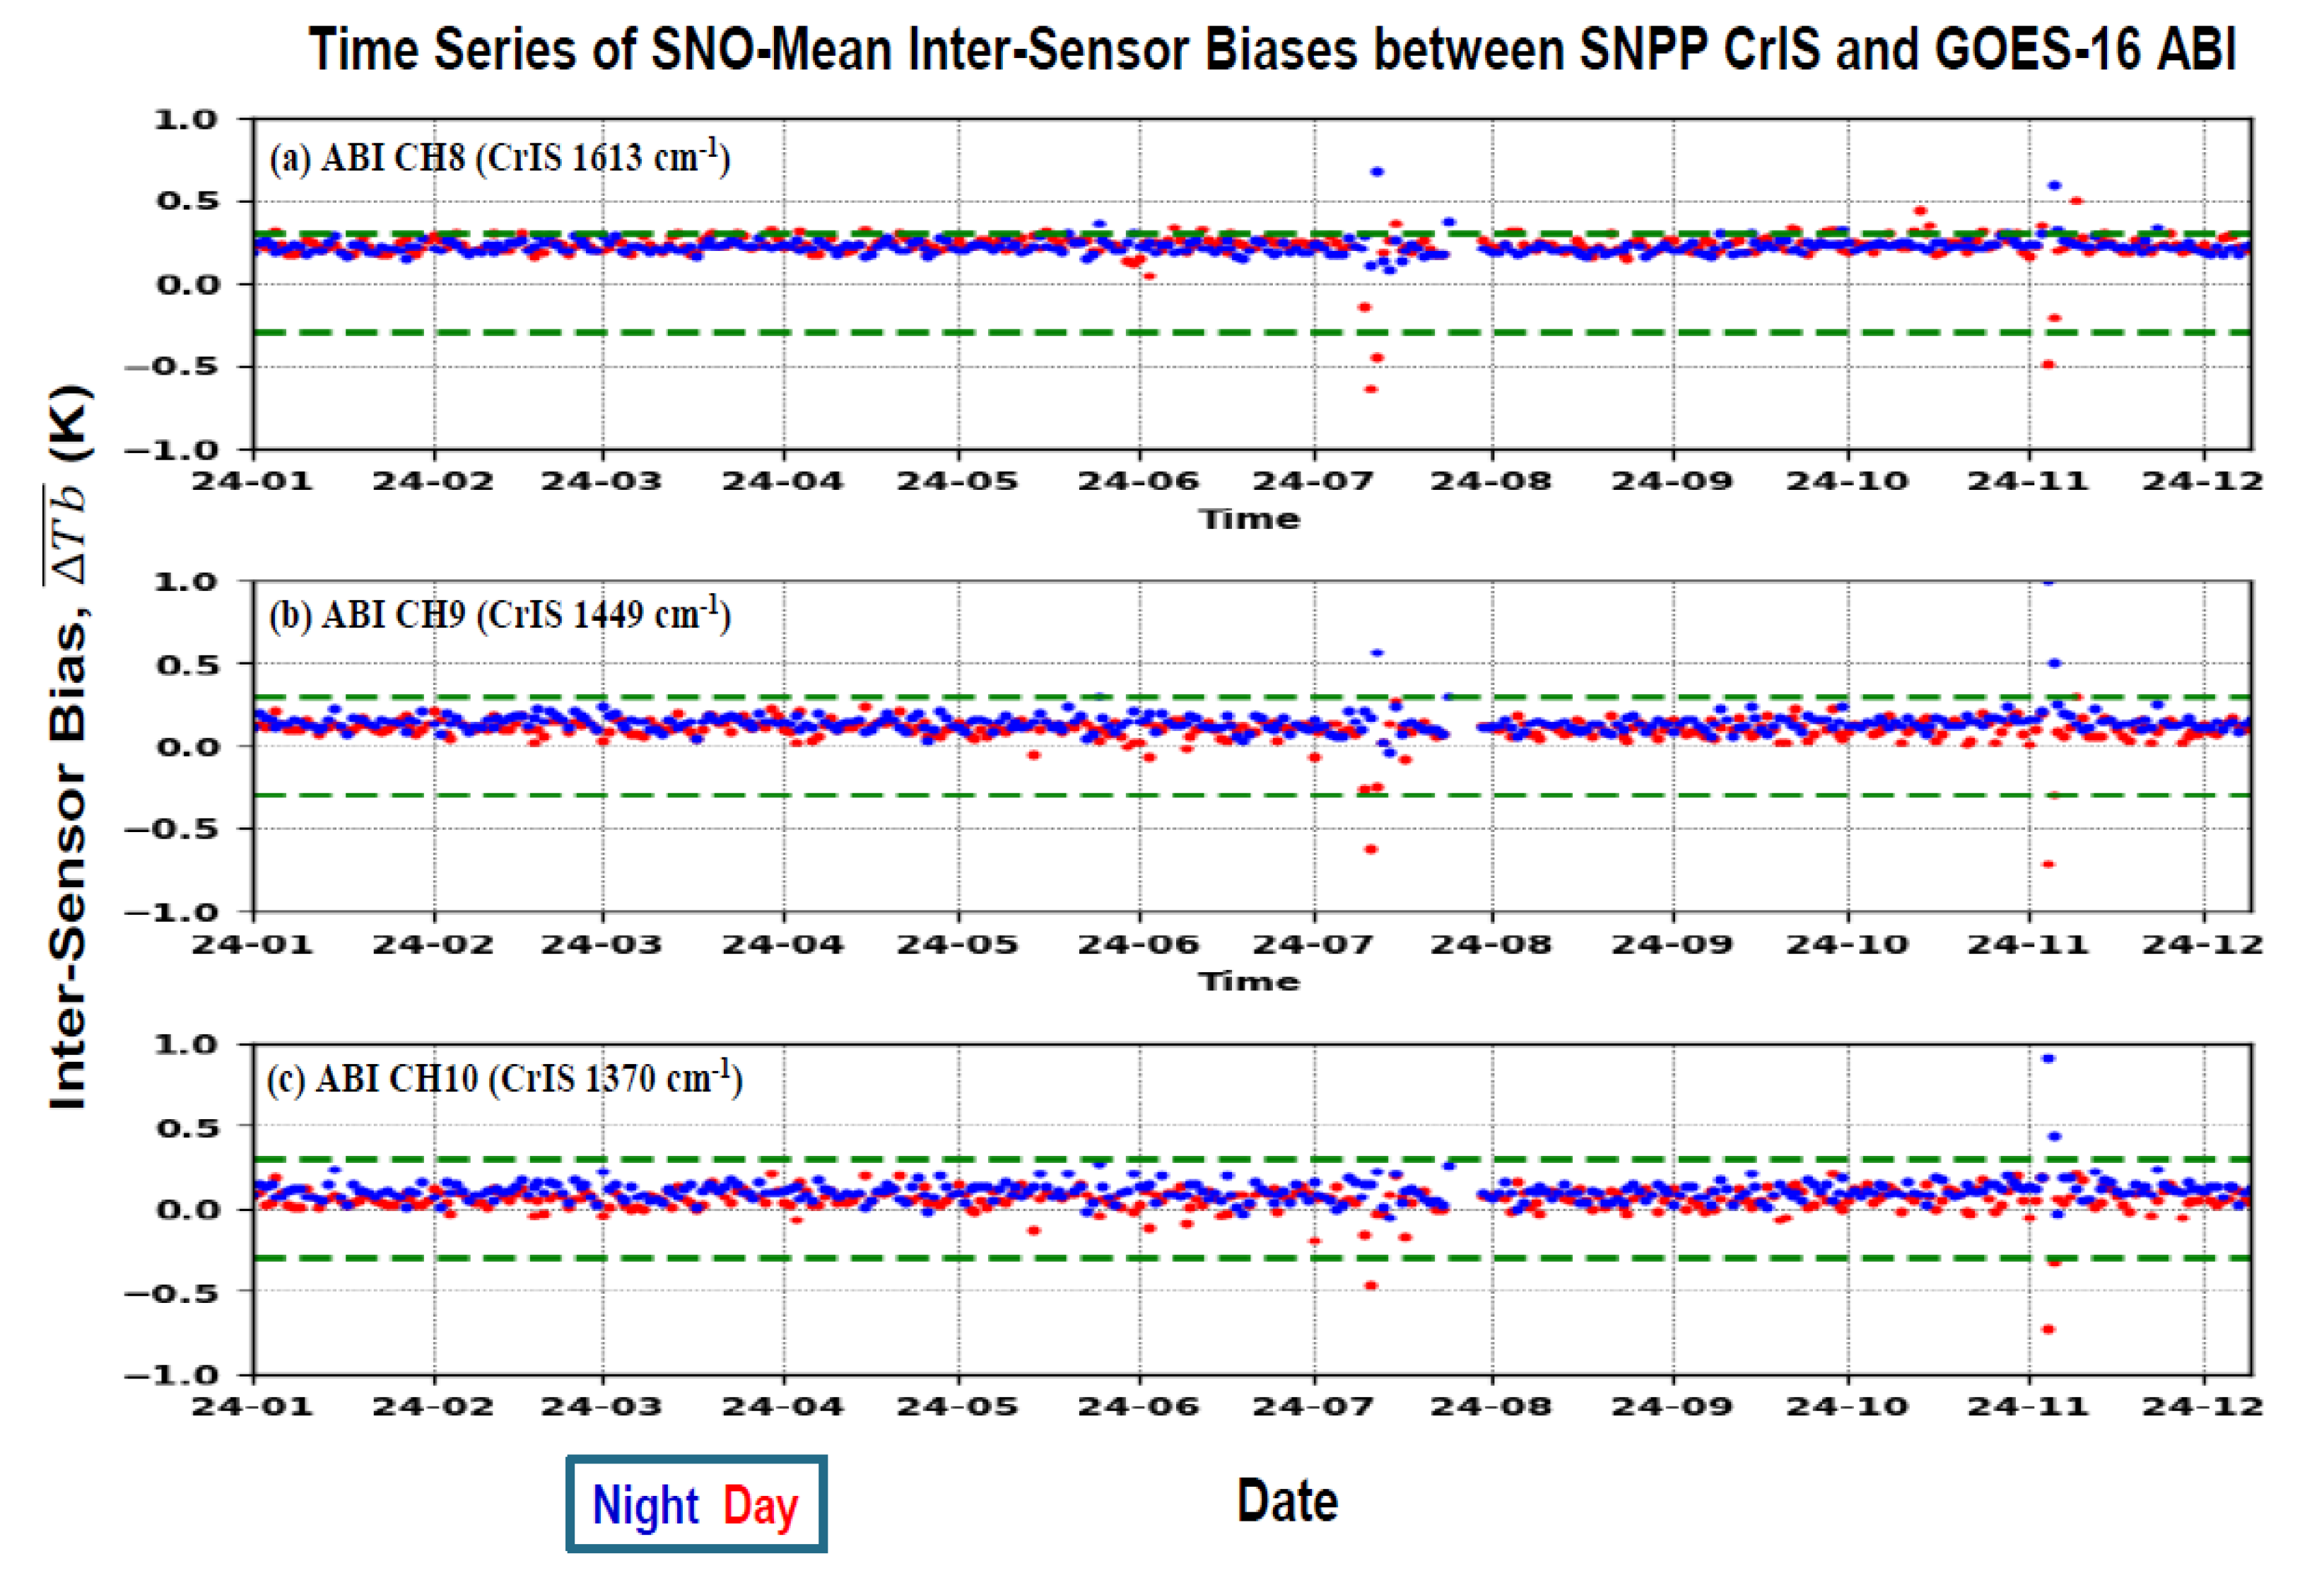
The SNPP satellite has been in operation for over 13 years since its launch, significantly exceeding its standard lifespan of six years. Thus, it is expected that the SNPP experiences some spacecraft problems beyond its standard lifespan. As a fact, the SNPP spacecraft has experienced several geolocation anomalies in the past year. Notable geolocation incidents occurred at the following three dates: May 25th, 2024, July 9th, 2024, and November 2nd, 2024. In particular, the last two GPS anomaly events caused large geolocation problems with the largest errors over 100km [Courtesy of NOAA STAR VIIRS SDR team]. These two significant geolocation issues led to sudden fluctuations in long-term inter-sensor radiometric calibration biases between GOES-16/GOES-18 ABI and SNPP CrIS. The overlapped channels are referred to Table B3 and C1 in Appendices B and C respectively.
Figure 8 shows time series of daily average of inter-sensor radiometric calibration biases at three ABI channels using the SNO method for the observations during day and night respectively between SNPP CrIS and GOES-16 ABI. In the figure, an existing method in [91] is employed to predict the CrlS gap channels in comparison with ABI channels. As illustrated in Figure 8, the inter-sensor biases at the three ABI channels (8 to 10) between SNPP CrIS and GOES-16 ABI remain stable within ±0.5K, except during two periods affected by the aforementioned two SNPP GPS anomalies. On July 12th, 2024 and November 6th, 2024, the geolocation errors were over 100km, thus showing unexpectedly large fluctuations in the inter-sensor biases. A similar feature was observed for the inter-sensor biases between SNPP CrIS and GOES-18 ABI (the figure is omitted). This capability stimulates the development of a new algorithm for quantifying geolocation errors of CrIS SDR data using ABI SDR data, which will be discussed in a separate manuscript.
In summary, the iSensor-RCBA portal has demonstrated its scientific values in monitoring long-term stability of inter-sensor radiometric calibration biases in SDR data sets that are measured in three OMPS nadir instruments, three CrIS instruments, and some other non-JPSS instruments such as Metop-B GOME-2 and GOES-16 ABI. These results provide important supplemental information to identify occurred problems in spacecraft, instrument, data, and validation methods.
5. Conclusions
This paper develops the iSensor-RCBA portal, which is built within the STAR ICVS monitoring system, and explores the scientific value of the portal in tracking long-term stability of inter-sensor radiometric calibration biases in SDR datasets. The analysis of SDR data sets focuses on three OMPS NM sensors, three OMPS NP sensors, three CrIS sensors, SNPP OMPS NM and Metop-B GOME-2, SNPP CrIS and GOES-16 ABI. Several important conclusions have emerged from these investigations, as summarized below.
Firstly, the results within this study reveal the long-term inter-sensor radiometric calibration consistency of SDR data sets throughout monitored periods at most of the analyzed channels for the OMPS nadir instruments and CrIS instruments across SNPP, NOAA-20, and NOAA-21 satellites. The degraded performance typically occurred during early-orbit stages, anomalies, malfunctions, calibration updates or certain channels. For example, for three CrIS instruments, the averaged inter-sensor radiance differences are typically smaller than 0.2, with some margins. For the three OMPS NM and OMPS NP sensors, inter-sensor radiometric calibration biases generally remain within 2% for the majority of channels, meeting the requirements. Exceptions are observed for OMPS NM in the 300–305 nm wavelength range, and for OMPS NP in channels with wavelengths below approximately 255 nm.
Secondly, the 32-Day average method excels over the other three validation methods in identifying inter-sensor radiance biases at the whole instrument channels as well as some calibration/validation problems. For instance, it detects an unusual feature in the NOAA-21 CrIS SDR data over the high latitudes of the Southern Hemisphere, which is not clearly observed by other methods due to restricted computation regions. Moreover, the SNO method is very useful for detecting calibration discrepancies by comparing an instrument against another with long-term stability. For example, SNPP OMPS NM data helps determine the nadir degradation rates of the Metop-B GOME-2 sensor. The annual degradation rates of the GOME-2 sensor, estimated through linear fitting of long-term inter-sensor radiance biases between the OMPS NM and the GOMES-2, are consistent with those derived from GOME-2 radiance and solar irradiance data analyzed by EUMETSAT (with thanks to EUMETSAT Pieter Valks for sharing the results). This consistency highlights the importance of long-term inter-sensor radiometric bias analysis in identifying sensors with poor performance relative to a stable reference instrument. Additionally, GOES-16 ABI data is utilized to capture geolocation problems in SNPP CrIS observations resulting from the spacecraft GPS issues.
In summary, the iSensor-RCBA portal can serve as a crucial tool for providing supplemental information about long-term radiometric calibration consistency and accuracy across JPSS and other LEO satellite instruments. The portal within the ICVS framework is designed to support JPSS missions, but the results are also interests of non-JPSS users and even the GSICS user community. The used analysis approaches are also applicable for other satellite missions including future JPSS-03 and JPSS-04 missions. Therefore, the portal demonstrates a good model in providing supplementary LT assessment information of the data quality for instrument vendors, instrument and data calibration scientists, LEO and GEO mission scientists, GSICS user community, and other end-product users.
Disclaimer/Publisher’s Note
The contents in this manuscript are solely the opinions of the authors and do not constitute a statement of policy, decision, or position on behalf of NOAA or the U. S. Government, and not of MDPI and/or the editor(s). MDPI and/or the editor(s) disclaim responsibility for any injury to people or property resulting from any ideas, methods, instructions or products referred to in the content.
Author Contributions
Conceptualization, B. Yan; methodology, B. Yan; D. Liang; X. Jin; software, D. Liang; X. Jin; L. Wang; validation, B. Yan; D. Liang; X. Jin; N. Sun; F. Iturbide-Sanchez; X. Wu; L. Wang.; formal analysis, D. Liang; X. Jin; L. Wang; investigation, B. Yan; D. Liang; X. Jin; resources, B. Yan; data curation, D. Liang; X. Jin; N. Sun; writing—original draft preparation, B. Yan; writing—review and editing, B. Yan; Wu., X.; F. Iturbide-Sanchez; visualization, D. Liang; X. Jin; supervision, B. Yan; project administration, B. Yan; funding acquisition, B. Yan.
Funding
This study is sponsored by the JPSS program.
Data Availability Statement
All SDR data sets are available in the NOAA Comprehensive Large Array-data Stewardship System (CLASS).
Acknowledgments
Thank Jingfeng Huang, Warren Porter, and C. Cao for their long-term efforts in support of ICVS maintenance and developments; thank Lori Brown for supporting the development of the ICVS monitoring system; thank Dr. Pieter Valks in EUMETSAT for providing the analysis results about Metop-B GOME-2 sensor degradation rates at nadir position; thank L. Zhou, Mitch Goldberg, Satya Kalluri, and Ingrid Guch for their support to the ICVS project; thank two STAR interval reviewers for providing many valuable comments in improving the quality of the manuscript.
Conflicts of Interest
The authors declare no conflict of interest.
Appendix A Acronyms

Table A1.
Acronyms used in this study.
| Acronym | Description |
| ATMS | Advanced Technology Microwave Sounder |
| CrIS | Cross-track Infrared Sounder |
| OMPS | Ozone Mapping and Profiler Suite |
| NM | Nadir Mapper |
| NP | Nadir Profiler |
| VIIRS | Visible Infrared Imaging Radiometer Suite |
| AMSU-A | Advanced Microwave Sounding Unit-A |
| AVHRR | Advanced Very High-Resolution Radiometer |
| MHS | Microwave Humidity Sounder |
| SSMI | Special Sensor Microwave/Imager |
| SSMIS | Special Sensor Microwave Imager/Sounder |
| IASI | Infrared Atmospheric Sounding Interferometer |
| GOME-2 | Global Ozone Monitoring Experiment-2 |
| ABI | Advanced Baseline Imager |
| GOES | Geostationary Operational Environmental Satellite |
| TIROS | Television Infrared Observation Satellite |
| RDR | Raw Data Record |
| TDR | Temperature Data Record |
| SDR | Sensor data record |
| EDR | Environmental Data Record |
| RSB | Reflective Solar Band |
| TEB | Thermal Emissive Band |
| SNO | Simultaneously Nadir Overpass |
| SCO | Simultaneously Conical Overpass |
| 32D-AD | 32-day averaged differences |
| POES | Polar-orbiting Operational Environmental Satellite program |
| LEO | Low Earth Orbit |
| GEO | Geosynchronous Equatorial Orbit |
| JPSS | Joint Polar Satellite System |
| SNPP | Suomi National Polar-orbiting Partnership |
| DMSP | Defense Meteorological Satellite Program |
| ICVS | Integrated Calibration/Validation System |
| PDA | Production Distribution and Access |
| IDPS | Interface Data Processing Segment |
| GSICS | Global Space-based Inter-Calibration System |
| CLASS | Comprehensive Large Array-data Stewardship System |
| RTM | Radiative Transfer Model |
| CRTM | Community Radiative Transfer Model |
| LT | Long-Term |
| NRT | Near-Real Time |
| STAR | Center for Satellite Application and Research |
| OSPO | Office of Satellite and Product Operations |
| NOAA | National Oceanic and Atmospheric Administration |
| JCSDA | Joint Center of Satellite Data Assimilation |
| NWP | Numerical Weather Prediction |
| ECMWF | European Centre for Medium-Range Weather Forecasts |
Appendix B Key Channel Information for OMPS and GOME-2 Spectrometers
Table B1.
Key channel information for OMPS and GOME-2 spectrometers.
| Instrument | Wavelength Coverage: nm | Bandwidth (FWHM): nm | Spectral Resolution: nm | Spatial Resolution (Nadir): km2 | |
| OMPS | NM | 300 ~ 380 nm | 1.0 | 0.42 | SNPP: 50 × 50 NOAA-20: 50 × 17 NOAA-21: 12 × 10 |
| NP | 250 ~ 310 nm | 1.0 | 0.42 | SNPP: 250 × 250 NOAA-20: 50 × 50 NOAA-21: 50 × 50 |
|
| GOME-2 Band 2B | 308-402 nm | 0.28 nm | 0.64 | 80 × 40 | |
| Note | FWHM: Full width at half maximum | ||||
Table B2.
Key channel information for CrIS Hyperspectral Instruments.
| Band | Spectral Range (cm-1) | Spectral Range (µm) | Spectral Resolution (cm-1) | Nadir Spatial Resolution (km) |
| Longwave | 650-1095 | 15.38-9.14 | 0.625 | 14 |
| Mid-wave | 1210-1750 | 8.26-5.71 | 0.625 | 14 |
| Shortwave | 2155-2550 | 4.64-3.92 | 0.625 | 14 |
Table B3.
Key channel information for ABI..
| Band Index | Wavelength (μm) (wavenumber, cm-1) |
Bandwidth (nm) |
| 1 | 0.47 | 40 |
| 2 | 0.64 | 100 |
| 3 | 0.86 | 40 |
| 4 | 1.37 | 30 |
| 5 | 1.6 | 60 |
| 6 | 2.2 | 50 |
| 7 | 3.9μm (2564) | 200 |
| 8 | 6.2 μm (1613) | 900 |
| 9 | 6.9 μm (1449) | 400 |
| 10 | 7.3 μm (1370) | 200 |
| 11 | 8.4 (1191) | 400 |
| 12 | 9.6 (1042) | 200 |
| 13 | 10.3 (971) | 500 |
| 14 | 11.2 (893) | 800 |
| 15 | 12.3 (813) | 1000 |
| 16 | 13.3 (752) | 600 |
| Note | ABI Spatial Resolution: 0.5 km for 0.64 visible and 1 km for other visible/NIR channels; 2 km for bands (>2 μm) | |
Appendix C Used Channels or Wavelengths or Wavenumbers in the Analyzed Instrument Pairs
Table C1.
Covered spectral wavenumber range for 2 CrIS instruments
| Method | Applied Band or Spectral Range |
| CRTM-DD | Full CrIS spectral wavenumber range; latitudes between −55°S and +55°N; open oceans under clear skies |
| ABI-DD | 10 ABI bands from 7 (2564 cm-1) through 16 (752 cm-1) (refer to Table B3) |
| 32D-AD | Full CrIS channels for global average of inter-sensor biases |
Table C2.
Covered spectral wavelength range for OMPS instruments.
| Sensor | Applied Spectral Wavelengths |
| OMPS NM | Full NM spectral wavelengths from 300 nm to 380 nm for global average of inter-sensor biases |
| OMPS NP | Full NP spectral wavelength range from 250 nm to 310 nm for global average of inter-sensor biases |
Table C3.
Covered wavelengths for the OMPS NM and GOME-2 pair.
| Method | Applied Central wavelength |
| GOME 2 - NM | 11 central wavelengths: 310.73, 311.98, 312.41, 313.24, 314.49, 317.42, 322.43, 331.20, 345.38, 359.98, 372.93nm |
References
- Yan, B.; Chen, J.; Zou, C.-Z.; Ahmad, K.; Qian, H.; Garrett, K.; Zhu, T.; Han, D.; Green, J. Calibration and Validation of Antenna and Brightness Temperatures from Metop-C Advanced Microwave Sounding Unit-A (AMSU-A). Remote Sens. 2020, 12, 2978. [Google Scholar] [CrossRef]
- Yan, B.; Kireev S., V. A New Methodology on Noise Equivalent Differential Temperature Calculation for On-Orbit Advanced Microwave Sounding Unit--A Instrument. IEEE Transactions on Geoscience and Remote Sensing, 59, 8554- 8567, 2021. [Google Scholar] [CrossRef]
- Yang, W.; Meng, H.; Ferraro, R. Cross-Scan Asymmetry of AMSU-A Window Channels: Characterization, Correction, and Verification. IEEE Transactions on Geoscience and Remote Sensing, 51, 1514- 1530, 2013. [Google Scholar] [CrossRef]
- Weng, F.; Yang, H.; and Zou, X. On convertibility from antenna to sensor brightness temperature for advanced technology microwave sounder (ATMS). IEEE Geosci. Remote. Sens. Letter, 2013. [Google Scholar] [CrossRef]
- Weng, F.; Zou, X.; Sun, N.; Yang, H.; Tian, M.; Blackwell, W. J.; Wang, X.; Lin, L.; Anderson, K. Calibration of Suomi national polar-orbiting partnership advanced technology microwave sounder, J. Geophys. Res. Atmos, 118, doi:10.1002/jgrd.50840, 2013.
- Weng, F.; Sun, N.; Lin, L; other coauthors, Suomi NPP ATMS CalVal Overview, NOAA JPSS Science Review, December 2013, https://www.star.nesdis.noaa.gov/jpss/documents/AMM/NPP/ATMS_SDR_Val.pdf.
- Yang, H.; Weng, *!!! REPLACE !!!*; F., *!!! REPLACE !!!*; Anderson, K. Estimation of ATMS Antenna Emission From Cold Space Observations,” IEEE Trans. Geosci. Remote Sens. Vol. 54, pp. 4479-4487, DOI:10.1109/TGRS.2016.2542526, 2016.
- Yang, H.; Sun, N.; Anderson, K.; Liu, Q.; Kim, E. 2018, Developing vicarious calibration for microwave sounding instruments using lunar radiation. EEE Transactions on Geoscience and Remote Sensing, No.99 PP.
- Iacovazzi, R.; Lin, L.; Sun, N.; Liu, Q. NOAA Operational Microwave Sounding Radiometer Data Quality Monitoring and Anomaly Assessment Using COSMIC GNSS Radio-Occultation Soundings. Remote Sens. 2020, 12. [Google Scholar] [CrossRef]
- Yang, H.; Iacovazzi, R.; Sun, N.; Liu Q.; coauthors. ATMS Radiance Data Products Calibration and Evaluation. IEEE Transactions on Geoscience and Remote Sensing. [CrossRef]
- Liu, Q., N. Sun, H. Yang, X. Zou, L. Lin, and co-authors: NOAA-20 ATMS TDR/SDR Validated Maturity Status Report, NOAA JPSS Science Review, June 15, 2018, https://www.star.nesdis.noaa.gov/jpss/documents/AMM/N20/ATMS_TDR_SDR_Validated.pdf.
- Han, Y.; Revercomb, H.; Cromp, M. ; co-authors. Suomi NPP CrIS measurements, sensor data record algorithm, calibration and validation activities, and record data quality, J. Geophys. Res. Atmos., 2013, 118, 12,734–12,748. [Google Scholar] [CrossRef]
- Han, Y.; Scott, D.; Revercomb, H.; Strow, L.; coauthors. Suomi NPP CrIS SDR Task Overview. NOAA JPSS Science Review, December 18, 2013, https://www.star.nesdis.noaa.gov/jpss/documents/AMM/NPP/CrIS_SDR_Val.pdf.
- Chen, Y.; Han, Y.; Weng, F. Characterization of long-term stability of Suomi NPP Cross-Track Infrared Sounder spectral calibration, IEEE Transactions on Geoscience and Remote Sensing, 2017, 55, 1147-1159.
- Iturbide-Sanchez F.; Tobin, D.; Strow, L.; co-authors. NOAA-20 CrIS SDR report for validated maturity review. NOAA JPSS Science Review, October 2, 2018, [Online]. Available: https://www.star.nesdis.noaa.gov/jpss/documents/AMM/N20/CrIS_SDR_Validated.pdf.
- Iturbide-Sanchez F.; Strow, L.; Tobin, D.; co-authors. Recalibration and Assessment of the SNPP CrIS Instrument: A Successful History of Restoration After Midwave Infrared Band Anomaly. IEEE Transactions on Geoscience and Remote Sensing, 60, 2022. [CrossRef]
- Flynn, L.; Long, C.; Wu, X. ; and co-authors. Performance of the Ozone Mapping and Profiler Suite (OMPS) products, J. Geophys. Res. Atmos., 2014, 119, 6181–6195. [Google Scholar] [CrossRef]
- Wu, X.; Liu, Q.; Zeng, J.; Grotenhuis, M.; Qian, H. ; and other coauthors. Evaluation of the sensor data record from the nadir instruments of the Ozone Mapping Profiler Suite (OMPS). J. Geophys. Res. Atmos., 2014, 119, 6170–6180. [Google Scholar] [CrossRef]
- Pan, C.; Flynn, L.; Buss, R.; Wu, X.; Yu, W.; Grotenhuis, M. Performance Monitoring of the S-NPP Ozone Mapping and Profiler Suite’s Sensor Data Records. IEEE Journal of Selected Topics in Applied Earth Observations and Remote Sensing, 2014, 7, 1763–1770. [Google Scholar] [CrossRef]
- Wu, X.; Jaross, G.; Sen, B.; and coauthors. Validated Maturity Review for SNPP OMPS SDR Earth View Products. NOAA JPSS Science Review, August 17, 2015, https://www.star.nesdis.noaa.gov/jpss/documents/AMM/NPP/OMPS_SDR_Val.pdf.
- Pan, C.; Weng, F.; Flynn, L. Spectral performance and calibration of the Suomi NPP OMPS Nadir Profiler sensor. Earth and Space Science, 4, 737–745, 2017. [CrossRef]
- Pan, C.; Zhou, L.; Cao, C.; Flynn, L.; Beach, E. Suomi-NPP OMPS Nadir Mapper’s, Operational SDR Performance IEEE Transactions on Geoscience and Remote Sensing, 2019. 57, NO. 2.
- Pan C.; Yan, B.; Cao, C.; Flynn, L.; Xiong, X.; Beach E.; Zhou, L. Performance of OMPS Nadir Profilers' Sensor Data Records. IEEE Transactions on Geoscience and Remote Sensing, doi: 10.1109/TGRS.2020.3026586. 06 October 2020.
- Yan, B.; Pan, C.; Beck, T.; Xiong, X.; Liang, D.; Chen, J.; Jaross, G.; Flynn, L. NOAA-20 OMPS NM SDR report for validated maturity review. NOAA JPSS Science Review, Nov. 2019, https://www.star.nesdis.noaa.gov/jpss/documents/AMM/N20/OMPS_TC_SDR_Validated.pdf.
- Yan, B.; Pan, C.; Beck, T.; Xiong, X.; Liang, D.; J. Chen, Jaross, G.; Flynn, L. NOAA-20 OMPS NP SDR report for validated maturity review. NOAA JPSS Science Review, April 2020, https://www.star.nesdis.noaa.gov/jpss/documents/AMM/N20/OMPS_NP_SDR_Validated.pdf.
- Yan, B.; Beck, T.; Chen, J.; Jin, X.; other-coauthors. Validated maturity science review for OMPS nadir mapper and nadir profiler sensor data record algorithm. 28 March 2024. Available online: https://www.star.nesdis.noaa.gov/jpss/documents/AMM/N21/NOAA-21_OMPS_Validated.pdf (accessed on April 2024).
- Weng, F.; Sun, N.; Lin, L.; Kim, E.; other coauthors, Suomi NPP ATMS CalVal Overview, December 18, 2013, https://www.star.nesdis.noaa.gov/jpss/documents/AMM/NPP/ATMS_SDR_Val.pdf.
- Liu, Q.; Kim, E.; VinceLeslie, M; other co-authors. NOAA-20 ATMS TDR/SDR Validated Maturity Status Report, June 15, 2018, https://www.star.nesdis.noaa.gov/jpss/documents/AMM/N20/ATMS_TDR_SDR_Validated.pdf.
- Liu, Q.; Sun, N.; Yang, H.; other coauthors. NOAA-21 ATMS Validated Maturity Review Material, June 22, 2023, https://www.star.nesdis.noaa.gov/jpss/documents/AMM/N21/NOAA-21_ATMS_Validated.pdf.
- Cao, C.; Blonski, S.; Uprety, S.; Sun, J.; co-authors. Suomi NPP VIIRS SDR Calibrated/Validated Maturity Overview. NOAA JPSS Science Review, December 2013, https://www.star.nesdis.noaa.gov/jpss/documents/AMM/NPP/VIIRS_SDR_Val.pdf.
- Cao C.; Deluccia, F.; Xiong, J.; Weng, F.; co-authors. NPP VIIRS SDR Postlaunch Calibration/Validation, Jan. 1, 2012, https://ncc.nesdis.noaa.gov/documents/presentations/ams-viirs-sdr-calval-star-cao-01232012.pdf.
- Cao, C.; Xiong, J.; Blonski, S.; Liu, Q.; Uprety, S.; Shao, X.; Bai, Y.; Weng, F. Suomi NPP VIIRS sensor data record verification, validation, and long-term performance monitoring. J. Geophys. Res. Atmos., 2013, 118, 11,664–11,678. [Google Scholar] [CrossRef]
- Cao, C.; Blonski, S.; Uprety, S.; Sun, J.; co-authors. Suomi NPP VIIRS SDR Calibrated/Validated Maturity Overview, NOAA JPSS Science Review, December 2013, https://www.star.nesdis.noaa.gov/jpss/documents/AMM/NPP/VIIRS_SDR_Val.pdf.
- Cao, C.; Blonski, S.; Wang, W.; Guch, I.; co-authors. VALIDATED MATURITY SCIENCE REVIEW FOR NOAA-20 VIIRS SDR, NOAA JPSS Science Review, June 15, 2018, https://www.star.nesdis.noaa.gov/jpss/documents/AMM/N20/VIIRS_SDR_Validated.pdf.
- Cao, C.; Blonski, S.; Wang, W.; co-authors. VALIDATED MATURITY SCIENCE REVIEW FOR NOAA-21 VIIRS SDR, NOAA JPSS Science Review, August 3, 2023, /https://www.star.nesdis.noaa.gov/jpss/documents/AMM/N21/NOAA-21_VIIRS_Validated.pdf.
- Han, Y.; Scott, D.; Revercomb, H.; other co-authors. Suomi NPP CrIS SDR Task Overview, NOAA JPSS Science Review, December 18, 2013, https://www.star.nesdis.noaa.gov/jpss/documents/AMM/NPP/CrIS_SDR_Val.pdf.
- Iturbide-Sanchez, F.; Tobin, D.; Strow L.; other co-authors. Validated Maturity Science Review For NOAA-20 CrIS SDR, NOAA JPSS Science Review, October 2, 2018, https://www.star.nesdis.noaa.gov/jpss/documents/AMM/N20/CrIS_SDR_Validated.pdf (duplicated with [25] ).
- Iturbide-Sanchez, F.; Tobin, D.; Strow L.; and co-authors. Validated Maturity Science Review For NOAA-21 CrIS SDR, NOAA JPSS Science Review, September 28, 2023, https://www.star.nesdis.noaa.gov/jpss/documents/AMM/N21/NOAA-21_CRIS_Validated.pdf.
- Wang W., C. Cao, S. Blonski, Y. Gu, B. Zhang: An Improved Method for VIIRS Radiance Limit Verification and Saturation Rollover Flagging, IEEE Transactions on Geoscience and Remote Sensing, TGRS-2021-00478, in press, 2021.
- Cao, C.; Zhang, B.; Shao, X.; Wang, W.; Uprety, S.; Choi, T.; Blonski, S.; Gu, Y.; Bai, Y.; Lin, L.; et al. Mission-Long Recalibrated Science Quality Suomi NPP VIIRS Radiometric Dataset Using Advanced Algorithms for Time Series Studies. Remote Sens. 2021, 13, 1075. [Google Scholar] [CrossRef]
- Yan, B.; Beck, T.; Chen, J.; Buckner, S.; Jin, X.; Liang, D.; Uprety, S.; Huang, J.; Flynn, L.E.; Wang, L.; et al. Calibration and Validation of NOAA-21 Ozone Mapping and Profiler Suite (OMPS) Nadir Mapper Sensor Data Record Data. Remote Sens. 2024, 16, 4488. [Google Scholar] [CrossRef]
- Sun, N.; Weng, F. Advances in STAR Integrated Calibration/Validation System (ICVS) for instrument status, data quality, and application monitoring,” in AMS 2017 Annu. Meeting, 13th Annu. Symp. on New Gener. Oper. Environ. Satell. Syst., GOES-R/JPSS Poster Session II, (2017).
- Sun, N.; Yan, B.; Jin, X.; Liang, D.; Iturbide-Sanchez, F.; Cao, C.; L. Zhou, L. An Integrated Calibration/Validation System Long-Term (LT) Monitoring System Applicable for Lifetime Performance and Science Data Quality Assessments of Suomi-NPP, NOAA-20, NOAA-21, and Legacy POES Instruments, to be submitted to Remote Sensing, 2025.
- Xiong, X.; Wu, A.; Cao, C. On-orbit calibration and intercomparison of terra and aqua MODIS surface temperature spectral bands, Int J Remote Sens, 2008, 29(17): 5347–5359.
- Cao, C.; Heidinger, A. Inter-Comparison of the Longwave Infrared Channels of MODIS and AVHRR/NOAA-16 using Simultaneous Nadir Observations at Orbit Intersections. Proceedings of SPIE 4814: 306–316, 2002.
- Cao C.; Xu H.; Sullivan, J; McMillin L.; Ciren, P.; Hou, Y. Intersatellite radiance biases for the High Resolution Infrared Radiation Sounders (HIRS) onboard NOAA-15, -16, and -17 from simultaneous nadir observations. Journal of Atmospheric and Oceanic Technology, 2005, 22(4): 381–395.
- Cao, C.; Weinreb, M.; Xu, H. Predicting simultaneous nadir overpasses among polar-orbiting meteorological satellites for the intersatellite calibration of radiometers. J. Atmos. Ocean. Tech., 21, 537–542, 2004.
- Cao, C.; Weng, F.; Goldberg, M. ; other coauthors. Intersatellite calibration of polar-orbiting radiometers using the SNO/SCO method. Proceedings. 2005 IEEE International Geoscience and Remote Sensing Symposium, Seoul, 2005, pp. 4 pp. [CrossRef]
- Iacovazzi Jr., R.; Cao, C. Quantifying EOS Aqua and NOAA POES AMSU-A Brightness Temperature Biases for Weather and Climate Applications Utilizing the SNO Method. J. Atmos. and Ocn. Tech., 2007, 24, 1895–1909. [Google Scholar] [CrossRef]
- Iacovazzi Jr., R.; Cao, C. Reducing Uncertainties of SNO-Estimated Intersatellite AMSU-A Brightness Temperature Biases for Surface-Sensitive Channels. J. Atmos. and Ocn. Tech., 2008, 25, 1048–1054. [Google Scholar] [CrossRef]
- Yan, B.; Goldberg, M.; Jin, X.; Liang, D.; Huang, J.; Porter, W.; Sun, N.; Zhou, L.; Pan, C.; Iturbide-Sanchez, F.; Liu, Q.; Zhang, K. A New 32-Day Average-Difference Method for Calculating Inter-Sensor Calibration Radiometric Biases between SNPP and NOAA-20 Instruments within ICVS Framework. Remote Sens. 2021, 13, 3079. [Google Scholar] [CrossRef]
- Uprety, S.; Cao, C.; Blonski, S.; Shao, X. Evaluating NOAA-20 and S-NPP VIIRS radiometric consistency," Proc. SPIE 10781, Earth Observing Missions and Sensors: Development, Implementation, and Characterization V, 107810V (23 October 2018). [CrossRef]
- Uprety, S.; Cao, C.; Shao, X. Geo-Leo intercalibration to evaluate the radiometric performance of NOAA-20 VIIRS and GOES-16 ABI. Proc. SPIE 11127, Earth Observing Systems XXIV, 111270S (9 September 2019). [CrossRef]
- Huang, J.; Yan, B.; Sun, N.; Liang, X.; Cao, C.; Uprety, S. Use of ABI As a Transfer to Evaluate the S-NPP and NOAA-20 VIIRS SDR Consistency with the STAR Integrated Calibration and Validation System (ICVS). 2019 Joint Satellite Conference.
- Huang, J.; Yan, B.; Jin, X.; Pan, C.; Beck, T.; co-authors, Improving Assessment Accuracy of Inter-Sensor Calibration Radiometric Biases between the NOAA-20 and S-NPP OMPS Radiance Observations against Radiative Transfer Model Simulations, January 2022, virtual conference, AMS 102nd Annual Meeting.
- Wang, L.; Goldberg, M.; Wu, X.; Cao, C.; Iacovazzi Jr., R. A.; Yu, F.; Li, Y. Consistency assessment of Atmospheric Infrared Sounder and Infrared Atmospheric Sounding Interferometer radiances: Double differences versus simultaneous nadir overpasses. J. Geophys. Res., 2011, 116. [CrossRef]
- Wang, L.; Chen, Y. Inter-comparing SNPP and NOAA-20 CrIS toward measurement consistency and climate data records. IEEE J. Sel. Top. Appl. Earth Obs. and Remote Sens., 12 (7), 2024 –2031 (2019). [CrossRef]
- Jin X.; Yan, B.; Sun, N. Advancing CrIS and ABI Inter-comparison Applicable for JSTAR Integrated Calibration/Validation System, AGU Fall meeting, 2019.
- Wang, L.; Sun, N.; Yan, B. NOAA ICVS/GSICS Recent Updates for GEO-LEO IR inter-calibration, GSICS 2021.
- Wang, L.; Wu, X.; Li, Y.; Sohn, S. H.; Goldberg, M.; Cao, C. Comparison of AIRS and IASI radiance measurements using GOES imagers as transfer radiometers. J. Appl. Meteorol. Climatol., 2010, 49, 478–492, Mar 01. [Google Scholar] [CrossRef]
- Yu, F.; Shao, X.; Wu, X. Validation of early GOES-16 ABI on-orbit NOAA ICVS/GSICS Recent Updates. 2017, Conference, Earth Observing Systems XXII. [CrossRef]
- Chang, T.; Xiong, X. GOES-16/ABI thermal emissive band assessments using GEO-LEO-GEO double difference. Earth and Space Science, 2019, 6, 2303–2316. [Google Scholar] [CrossRef] [PubMed]
- Wu, X.; Hewison, T.; Y. GSICS GEO-LEO intercalibration: baseline algorithm and early results. Proc. SPIE 7456, Atmospheric and Environmental Remote Sensing Data Processing and Utilization V: Readiness for GEOSS III, 745604. 2009. [CrossRef]
- Goldberg, M.; Ohring, G.; Butler, J.; Cao, C.; Datla, R. ; and other co-authors. The global space-based inter-calibration system. Bull. Am. Meteorol. Soc., 2011, 92, 467–475. [Google Scholar] [CrossRef]
- Hewison, T.; Wu, X.; Yu, F.; Tahara, Y. ; Hu, X; and other coauthors. GSICS inter-calibration of infrared channels of Geostationary Imagers using Metop/IASI. IEEE Trans. Geosci. Remote Sens., 2013, 51, 1160–1170. [Google Scholar]
- Xiong, X.; Cao, C; Chander, G. An overview of sensor calibration inter-comparison and applications. Front. Earth Sci. China 4, 237–252 (2010). [CrossRef]
- Huang, J.; Yan, B.; Sun, N. Monitoring of the Cross-calibration Biases between the S-NPP and NOAA-VIIRS Sensor Data Records using GOES Advanced Baseline Imager as a Transfer," 2020 IGARSS Virtual Symposium Proceedings.
- Jin, X.; Yan, B.; Sun, N. Improving SNPP and NOAA-20 CrIS LTM Inter-sensor Radiometric Bias Assessment by Using Interpolating ABI Measurements as Transfer. 2021, 101st AMS virtual conference.
- Sun, N.; Yan, B.; Liu, Q. Evaluation of Advanced Technology Microwave Sounder (ATMS) Science Data Long-Term Trending through Intersatellite Comparisons, 2021 101st AMS virtual conference.
- Han, Y.; Delst, P.; Liu, Q.; Weng, F.; Yan, B.; Treadon, R.; Derber, J. JCSDA Community Radiative Transfer Model (CRTM) - Version 1, NOAA Tech. Rep. NESDIS 122, pp.1-33, 2006.
- Chen, Y.; Weng, F.; Han, Y. ; Q. Liu, Q. Validation of the Community Radiative Transfer Model by using CloudSat data, Journal of Geophysical Research: Atmospheres, 2008, 113, DOI. [Google Scholar]
- Ding, S.; Yang, P.; Weng, F.; Liu, Q.; Han, Y.; Delst, P.; Li, J.; Baum, B. Validation of the community radiative transfer model, J. Quant. Spectrosc. Radiat. Transfer, 112, 1050-1064, Apr. 2011.
- Joint Polar Satellite System (JPSS) Advanced Technology Microwave Sounder (ATMS) SDR Radiometric Calibration Algorithm Theoretical Basic Document (ATBD), https://www.star.nesdis.noaa.gov/jpss/documents/ATBD/D0001-M01-S01-001_JPSS_ATBD_ATMS-SDR_B.pdf, Center for Satellite Applications and Research College Park, Maryland, April 2022.
- Joint Polar Satellite System (JPSS) Cross Track Infrared Sounder (CrIS) Sensor Data Records (SDR) Algorithm Theoretical Basis Document (ATBD), Rev C, Code 474, 474- 00032.
- Joint Polar Satellite System (JPSS) OMPS Nadir Profile Ozone Algorithm Theoretical Basis Document (ATBD), JPSS Ground Project Code 474-00026, Goddard Space Flight Center, Greenbelt, Maryland, June 2014.
- Joint Polar Satellite System (JPSS) OMPS Nadir Total Column Ozone Algorithm Theoretical Basis Document (ATBD), JPSS Ground Project Code 474-00029, Goddard Space Flight Center, Greenbelt, Maryland, July 2014.
- T. Schmit, T.; Griffith, P.; Gunshor, M. M. T. Schmit, T.; Griffith, P.; Gunshor, M. M.; and other coauthors. A closer look at the ABI on the GOES-R Series. Bull. Am. Meteorol. Soc., 2017, 681 –698 (2017). [CrossRef]
- Siméoni, D.; Blumstein, D.; Astruc, P.; Degrelle, C.; Chetrite, B.; Tournier, B.; Chalon, G.; Carlier, T.; Kayal, G. IASI: a Review of Instrument Performance," in Fourier Transform Spectroscopy/ Hyperspectral Imaging and Sounding of the Environment. OSA Technical Digest Series (CD) (Optical Society of America, 2007), paper FWD3. https://www.osapublishing.org/abstract.cfm?URI=FTS-2007-FWD3.
- Wu X.; Schmit, T. Product Performance Guide for Data Users of GOES-18 ABI Level 1b and Cloud and Moisture Imagery (CMI) Products Released for Full Validation Data Quality. November 1, 2023, https://www.noaasis.noaa.gov/pdf/ps-pvr/goes18/ABI/Cloud%20and%20Moisture%20Imagery/Full/G18_ABI_L1b-CMI_FullValidation_ProductPerformanceGuide_Publish.pdf.
- NOAA Technical Report NESDIS 142A, Visible Infrared Imaging Radiometer Suite (VIIRS) Sensor Data Record (SDR) User’s Guide, Version 1.2, NOAA National Environmental Satellite, Data, and Information Service, 2013.
- Robel J.; Graumann, A.; co-authors. NOAA KLM USER'S GUIDE with NOAA-N, N Prime, and MetOp SUPPLEMENTS (1-2530). National Oceanic and Atmospheric Administration, National Environmental Satellite, Data, and Information Service, National Climatic Data Center, 151 Patten Ave, Asheville, NC 28801-5001, April 2014.
- Carminati F., Migliorini1, S.; Ingleby, B.; other coauthors. Using reference radiosondes to characterize NWP model uncertainty for improved satellite calibration and validation, Atmos. Meas. Tech., 12, 83–106, 2019. [CrossRef]
- Ingleby, B. An assessment of different radiosonde types 2015/2016, ECMWF Technical Memoranda, 2017, https://www.ecmwf.int/en/publications.
- Pan, C.; Yan, B.; Flynn L.; Beck, T., Jin, X.; Beach, E. 10-Year Stability Performance of S-NPP OMPS Nadir Sensor, GSICS Annual Meeting, March 10th 2022, College Park, MD 20740.
- Liang, D.; Yan, B; Flynn, L.; Beck T.; other co-authors. Feasibility analysis of OMPS NM SDR data long-term stability assessment using deep convective cloud targets, 2023 IEEE International Geoscience and Remote Sensing Symposium, Pasadena, California, USA, 16 - 21 July, 2023.
- Yan, B.; Pan, C.; Beck, T.; Jin, X.; Wang, L.; Liang, D.; Flynn, L.; Chen, J.; Huang, J.; Buckner, S.; other co-authors. New Reprocessing towards Life-Time Quality-Consistent Suomi NPP OMPS Nadir Sensor Data Records (SDR): Calibration Improvements and Impact Assessments on Long-Term Quality Stability of OMPS SDR Data Sets. Remote Sens. 2022, 14, 3125. [Google Scholar] [CrossRef]
- Rasool, H. F. Metop-B GOME Annual In-Flight Performance Report, 2024, EUM/FLO/REP/24/1427821, EUMETSAT, Eumetsat-Allee 1, D-64295 Darmstadt, Germ.
- Liang, D.; Yan, B.; Flynn, L. Characterization and Correction of Intersensor Calibration Convolution Errors Between S-NPP OMPS Nadir Mapper and Metop-B GOME-2. IEEE Transactions on Geoscience and Remote Sensing, 60, 1-14, 2022, Art no. 5521114. [CrossRef]
- Liang, D.; B. Yan, C. Pan, T. Beck, L. Flynn, and N. Sun, Characterizing Inter-Sensor Calibration Radiometric Biases at Selected Channels between S-NPP and NOAA-20 OMPS Nadir Mapper (NM) Using Metop-B GOME-2 as a Transfer, 2022 AMS Collective Madison Meeting, Madison, WI, United States, 8-12 August 2022.
- Liang, D.; Yan, B; Flynn, L.; Beck T.; other co-authors. Feasibility analysis of OMPS NM SDR data long-term stability assessment using deep convective cloud targets, 2023 IEEE International Geoscience and Remote Sensing Symposium, Pasadena, California, USA, 16 - 21 July, 2023.
- Xu, H.; Chen, Y.; Wang, L. Cross-Track Infrared Sounder Spectral Gap Filling Toward Improving Intercalibration Uncertainties. IEEE Trans. Geosci. Remote Sens., 57, 509-519, 2019. [CrossRef]
Figure 1.
(a) ICVS iSensor-RCBA portal processing diagram and (b) An example of the portal for OMPS portion about NM within the JPSS component. In (a), NOAA-18 through NOAA-21 are simplified to be N18 through N21, respectively, while Metop-B and Metop-C are for M1 and M3 to save the space in the box. In (b), the example figure shows the 32-day averaged normalized radiance differences (%) at all OMPS NM wavelengths between NOAA-21 and NOAA-20 OMPS NM observations, using the data sets from January 16th to February 17th, 2025.
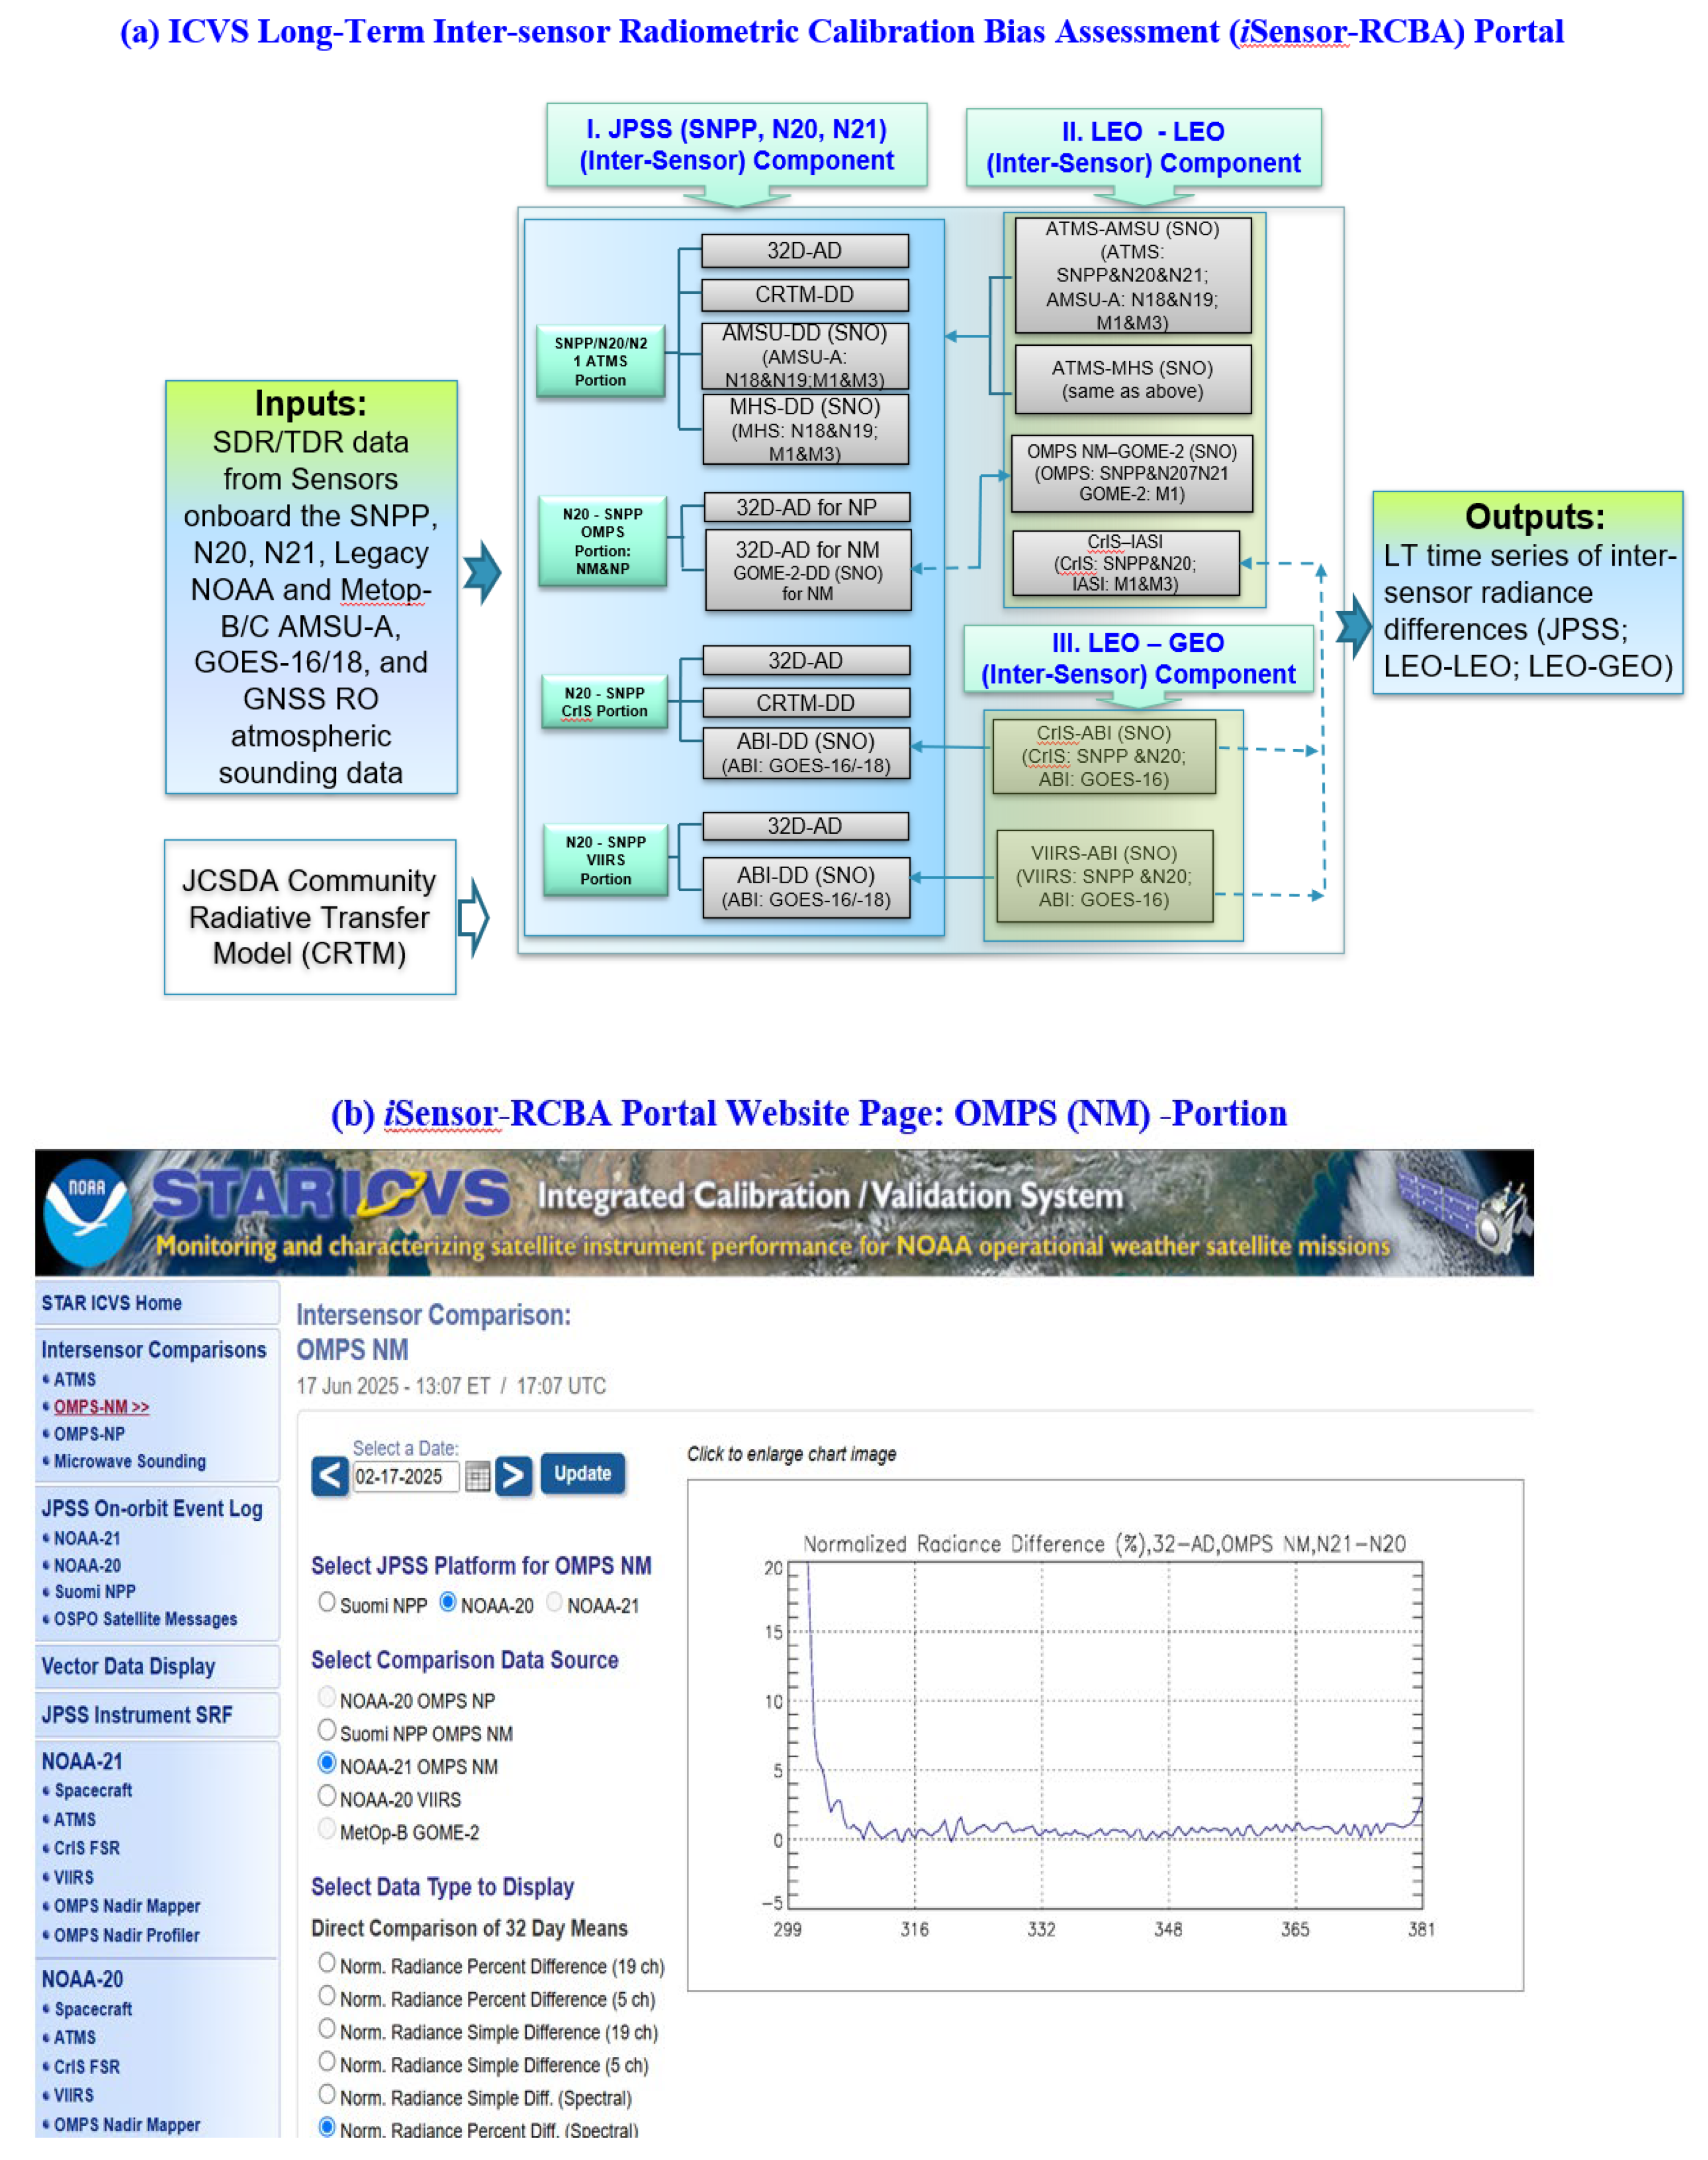
Figure 2.
(a) Averages and standard deviations of long-term 32D-AD normalized radiance differences between NOAA-20 and SNPP OMPS NM in the whole wavelength range from 310 nm to 380 nm, by using the data sets spanning the period from November 7th, 2019, to January 12th, 2025. (b) Same as (a) except for OMPS NP in the whole wavelength range from 250 nm to 310 nm. (c). Time series of 32D-AD running normalized radiance differences between NOAA-20 and SNPP OMPS NM at 5 wavelengths, covering the period from November 7th, 2019, to December 29th, 2024. (d) Time series of 32D-AD running normalized radiance differences between NOAA-20 and SNPP OMPS NP at 7 wavelengths, covering the period from November 7th, 2019, to December 29th, 2024. In (a), the average is expressed in a thick line, while the standard deviation is expressed in the vertical direction (average ±standard deviation), which are also applicable for Fig. (b). In (c), three labelled numbers from 1 to 3 are to mark approximate positions with occurrences of SNPP spacecraft anomaly, which are applicable for (d). In addition, in (d), the number with 4 is used to represent the approximate position using the updated NOAA-20 OMPS NP wavelength table from August 21, 2020.
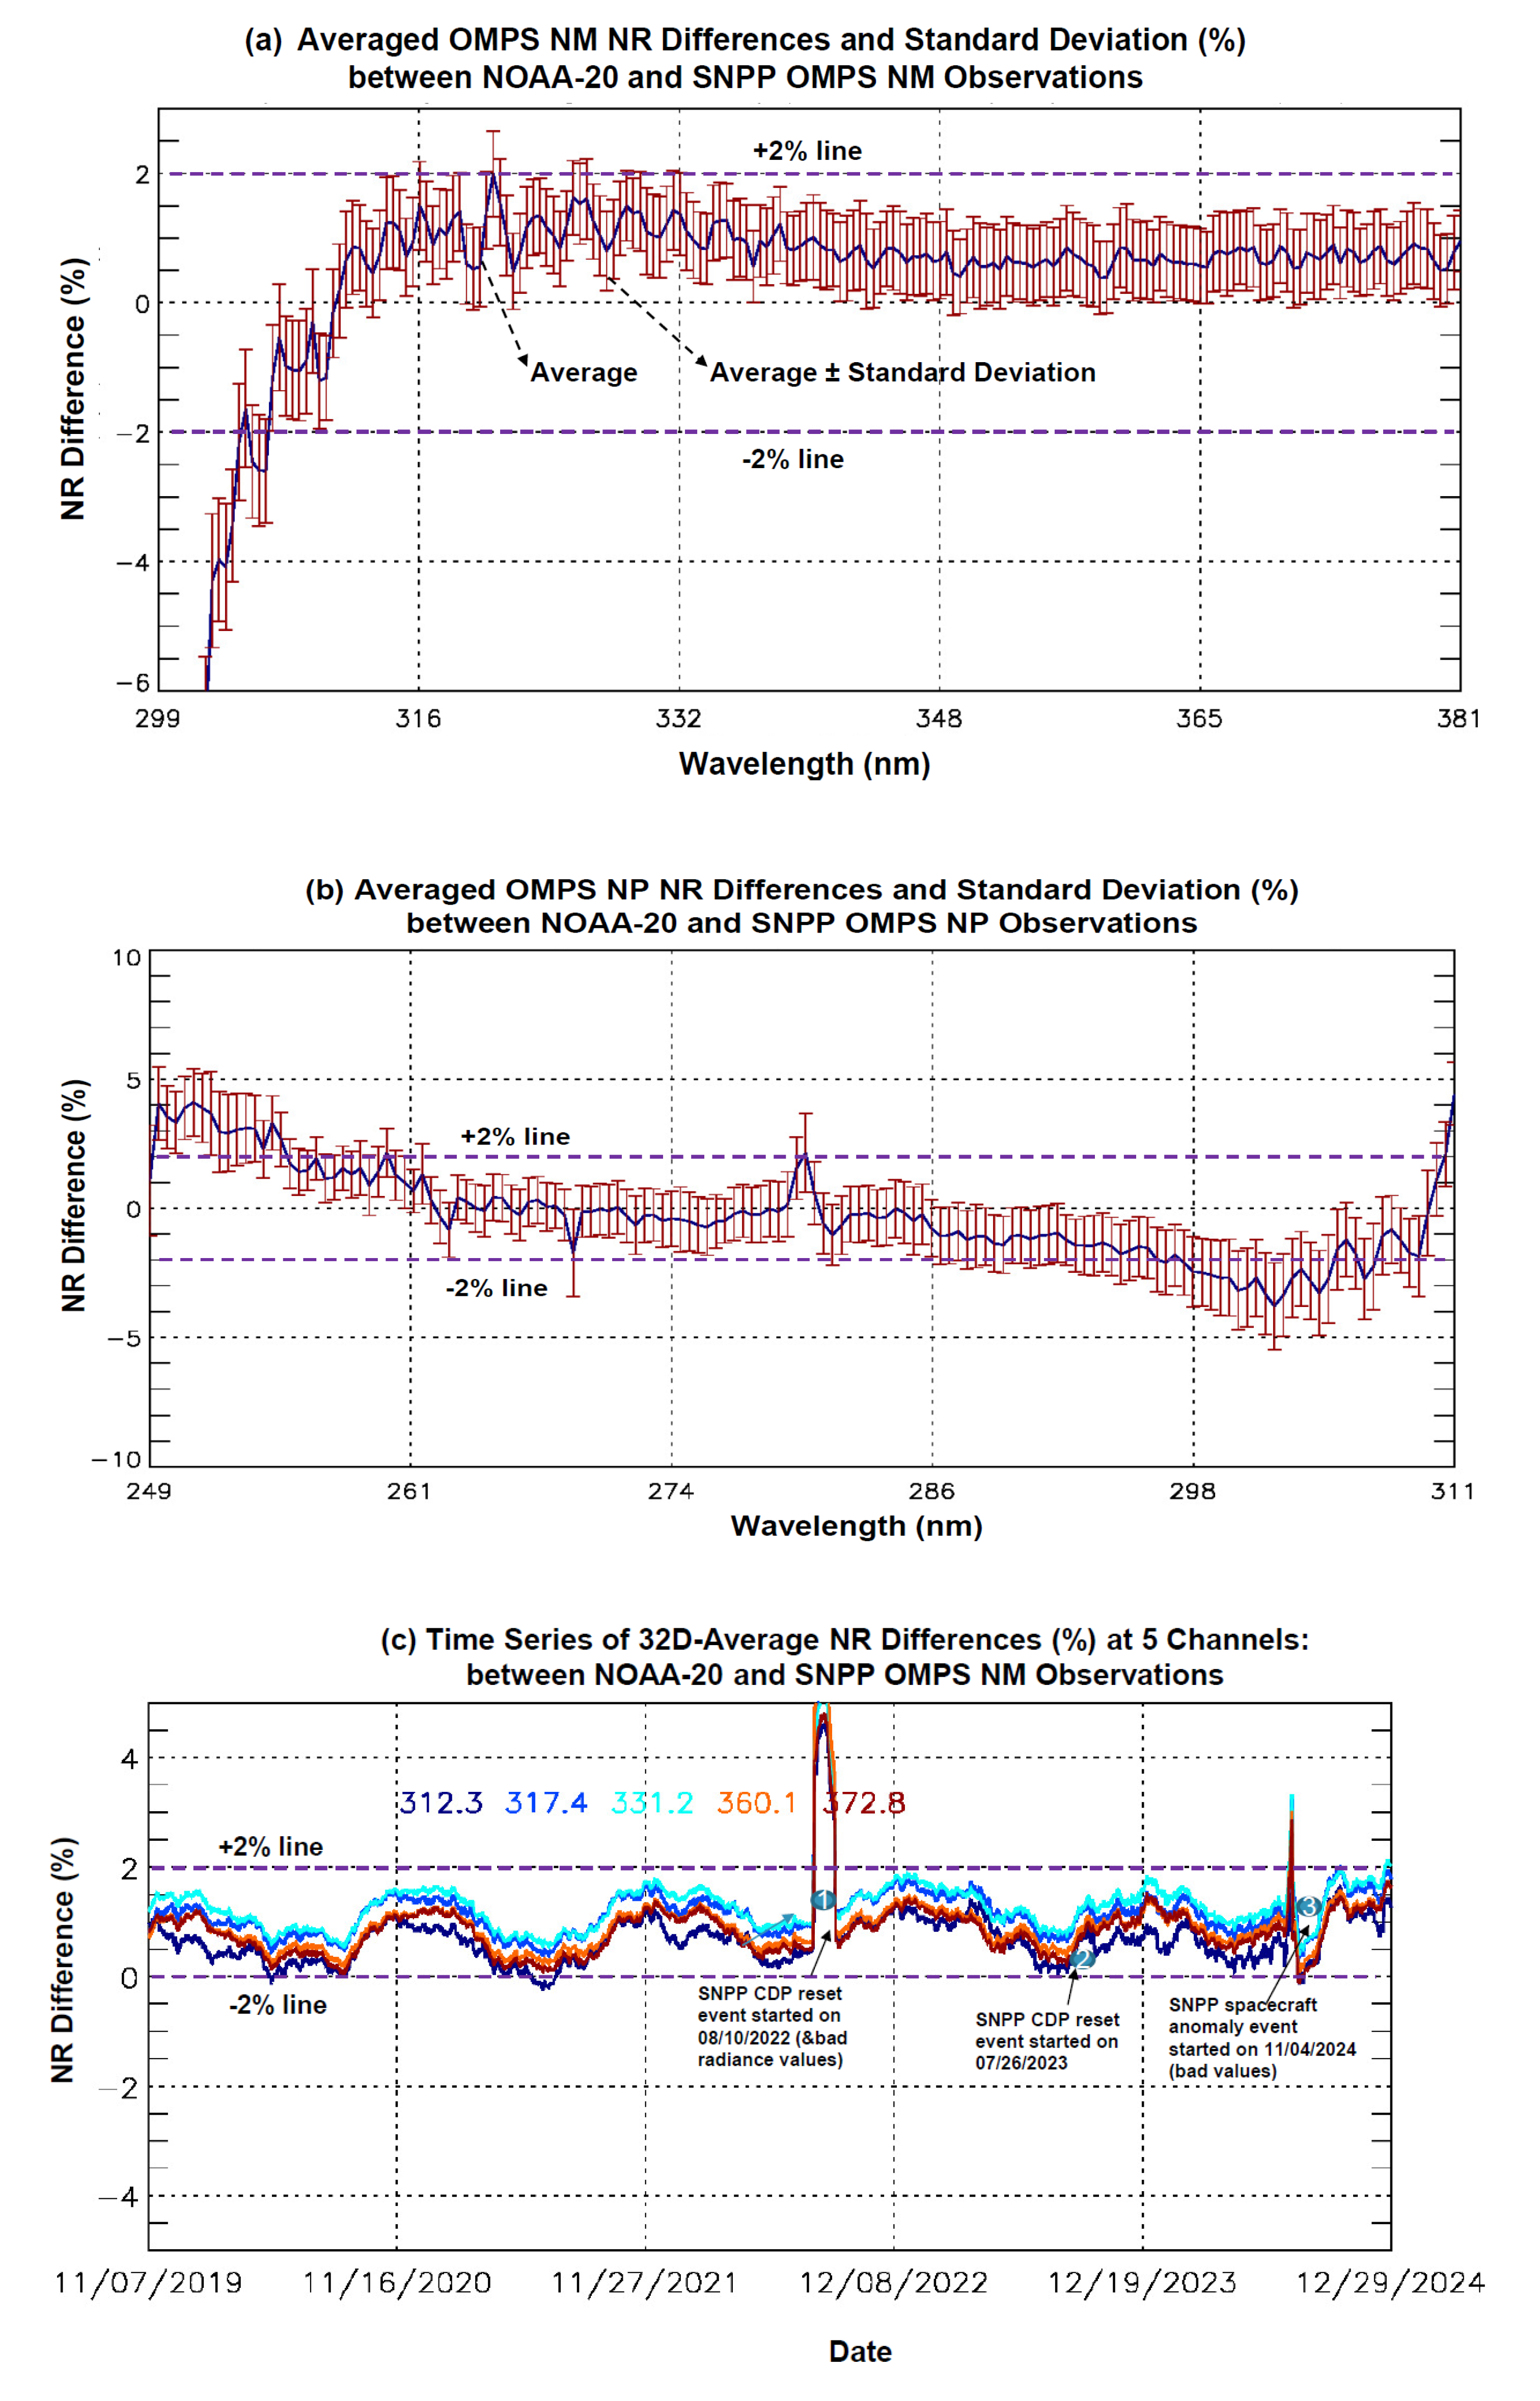
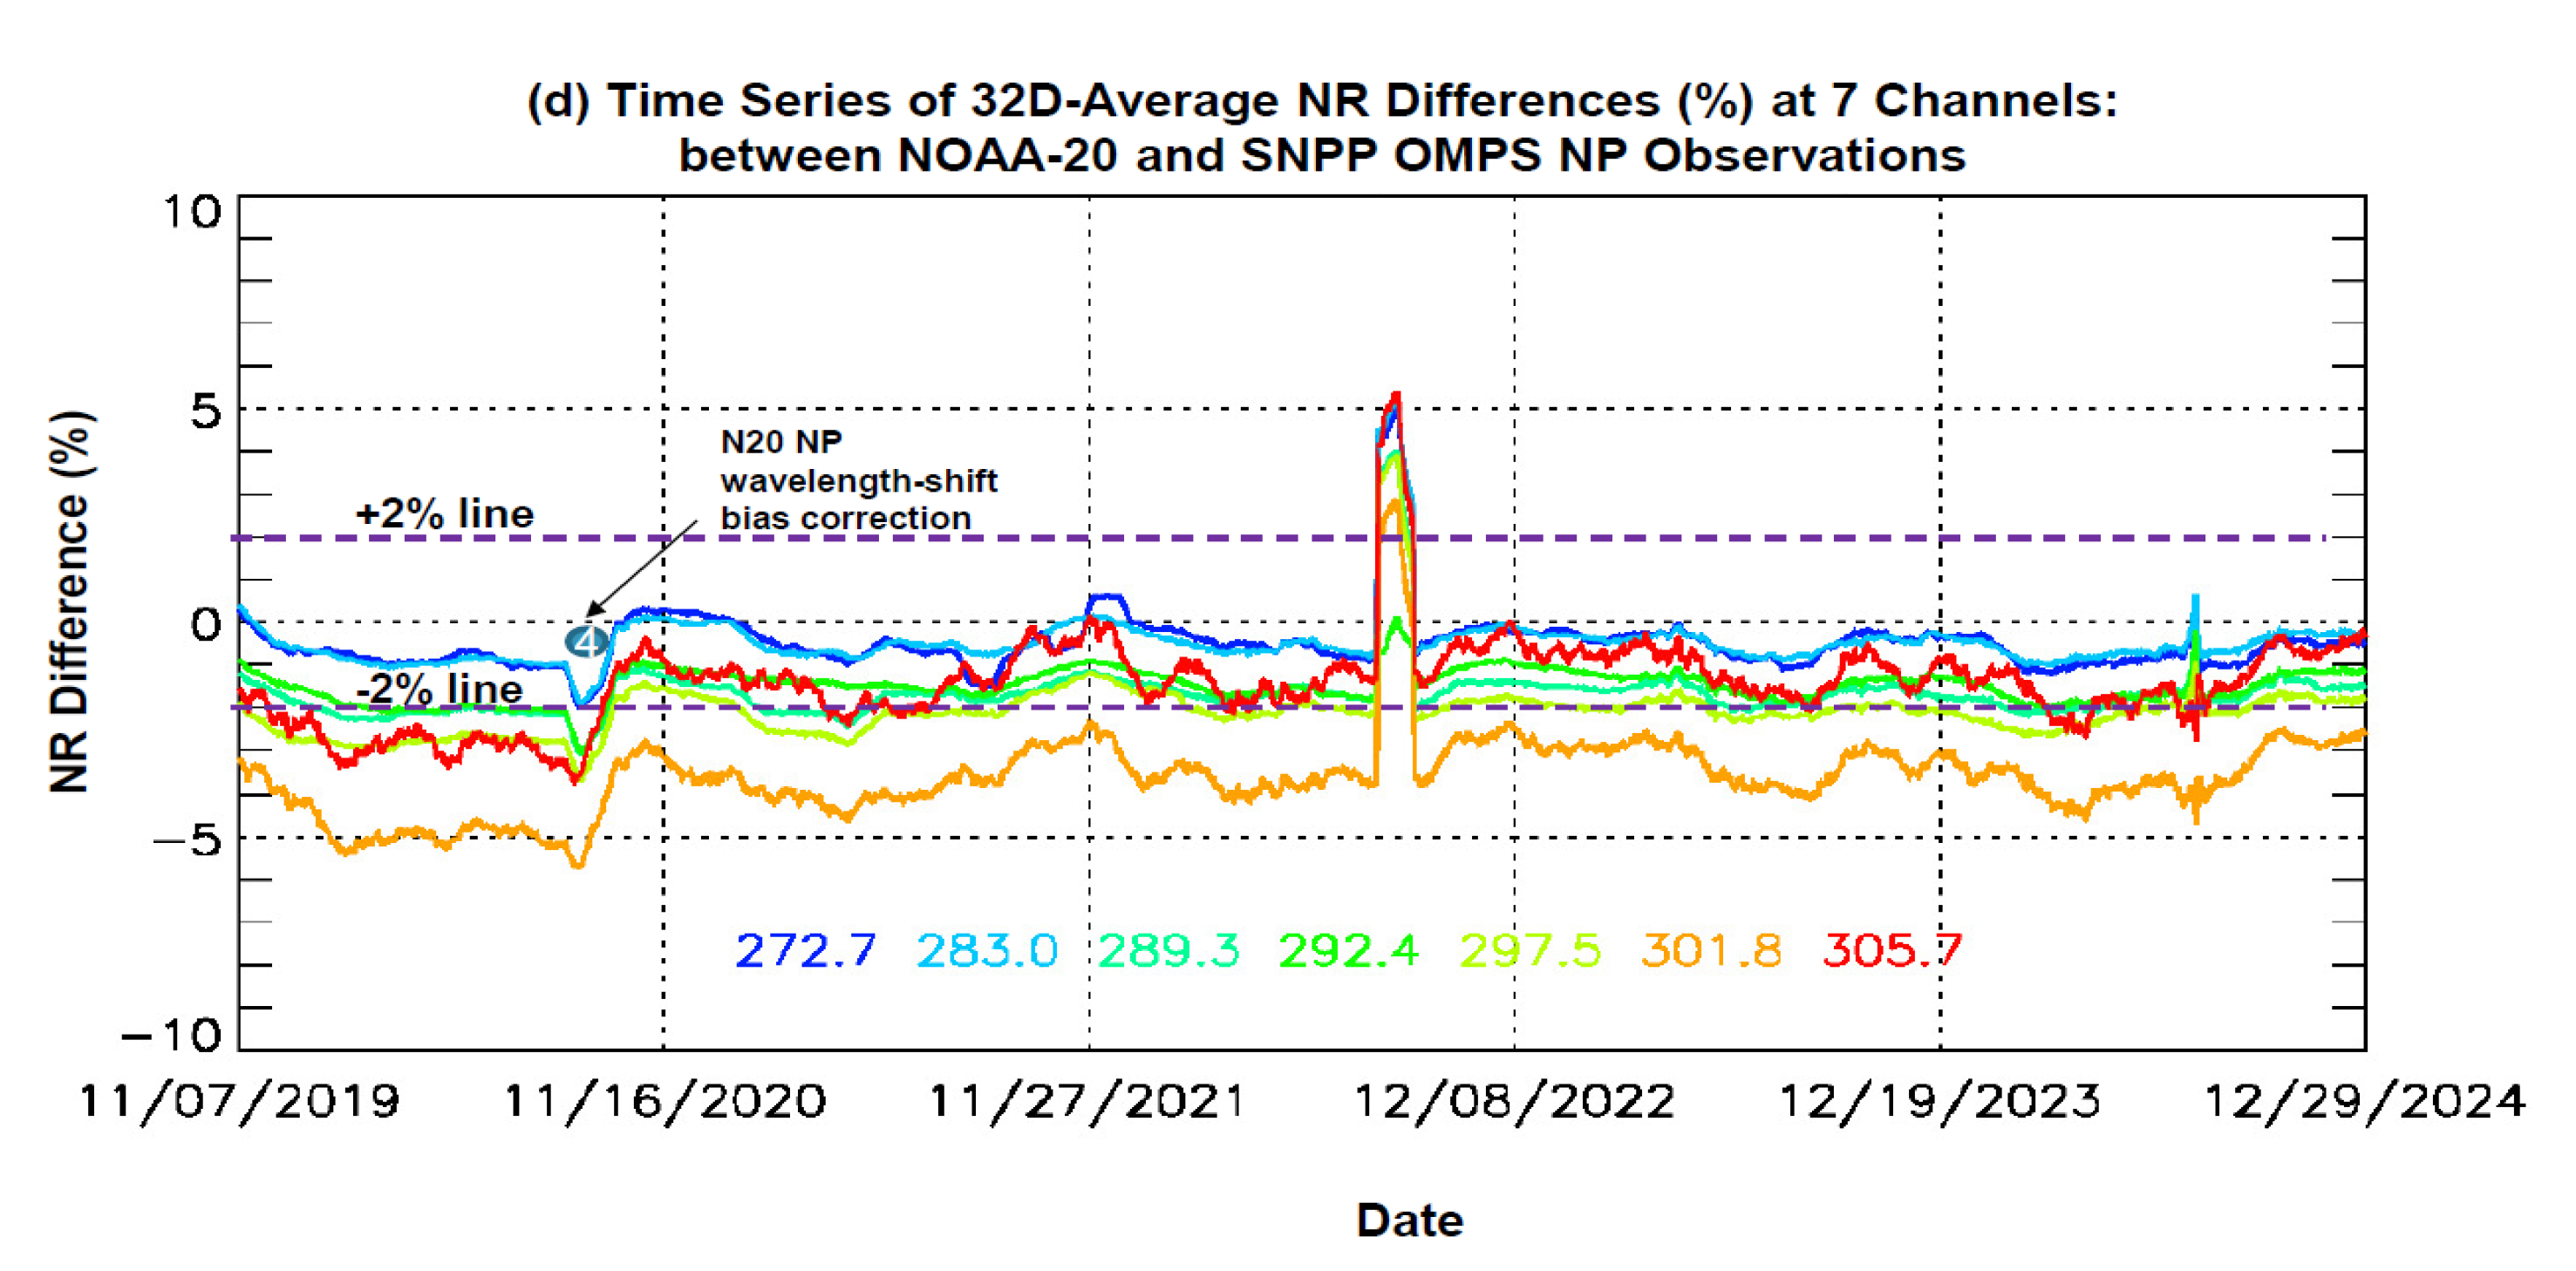
Figure 3.
(a). Time series of 32D-AD running normalized radiance differences between NOAA-21 and SNPP OMPS NM at 5 wavelengths, covering the period from July 2nd, 2023, to January 12nd, 2025. (b) Time series of 32D-AD running normalized radiance differences between NOAA-21 and SNPP OMPS NP at 7 wavelengths, covering the period from July 2nd, 2023, to January 12nd, 2025.
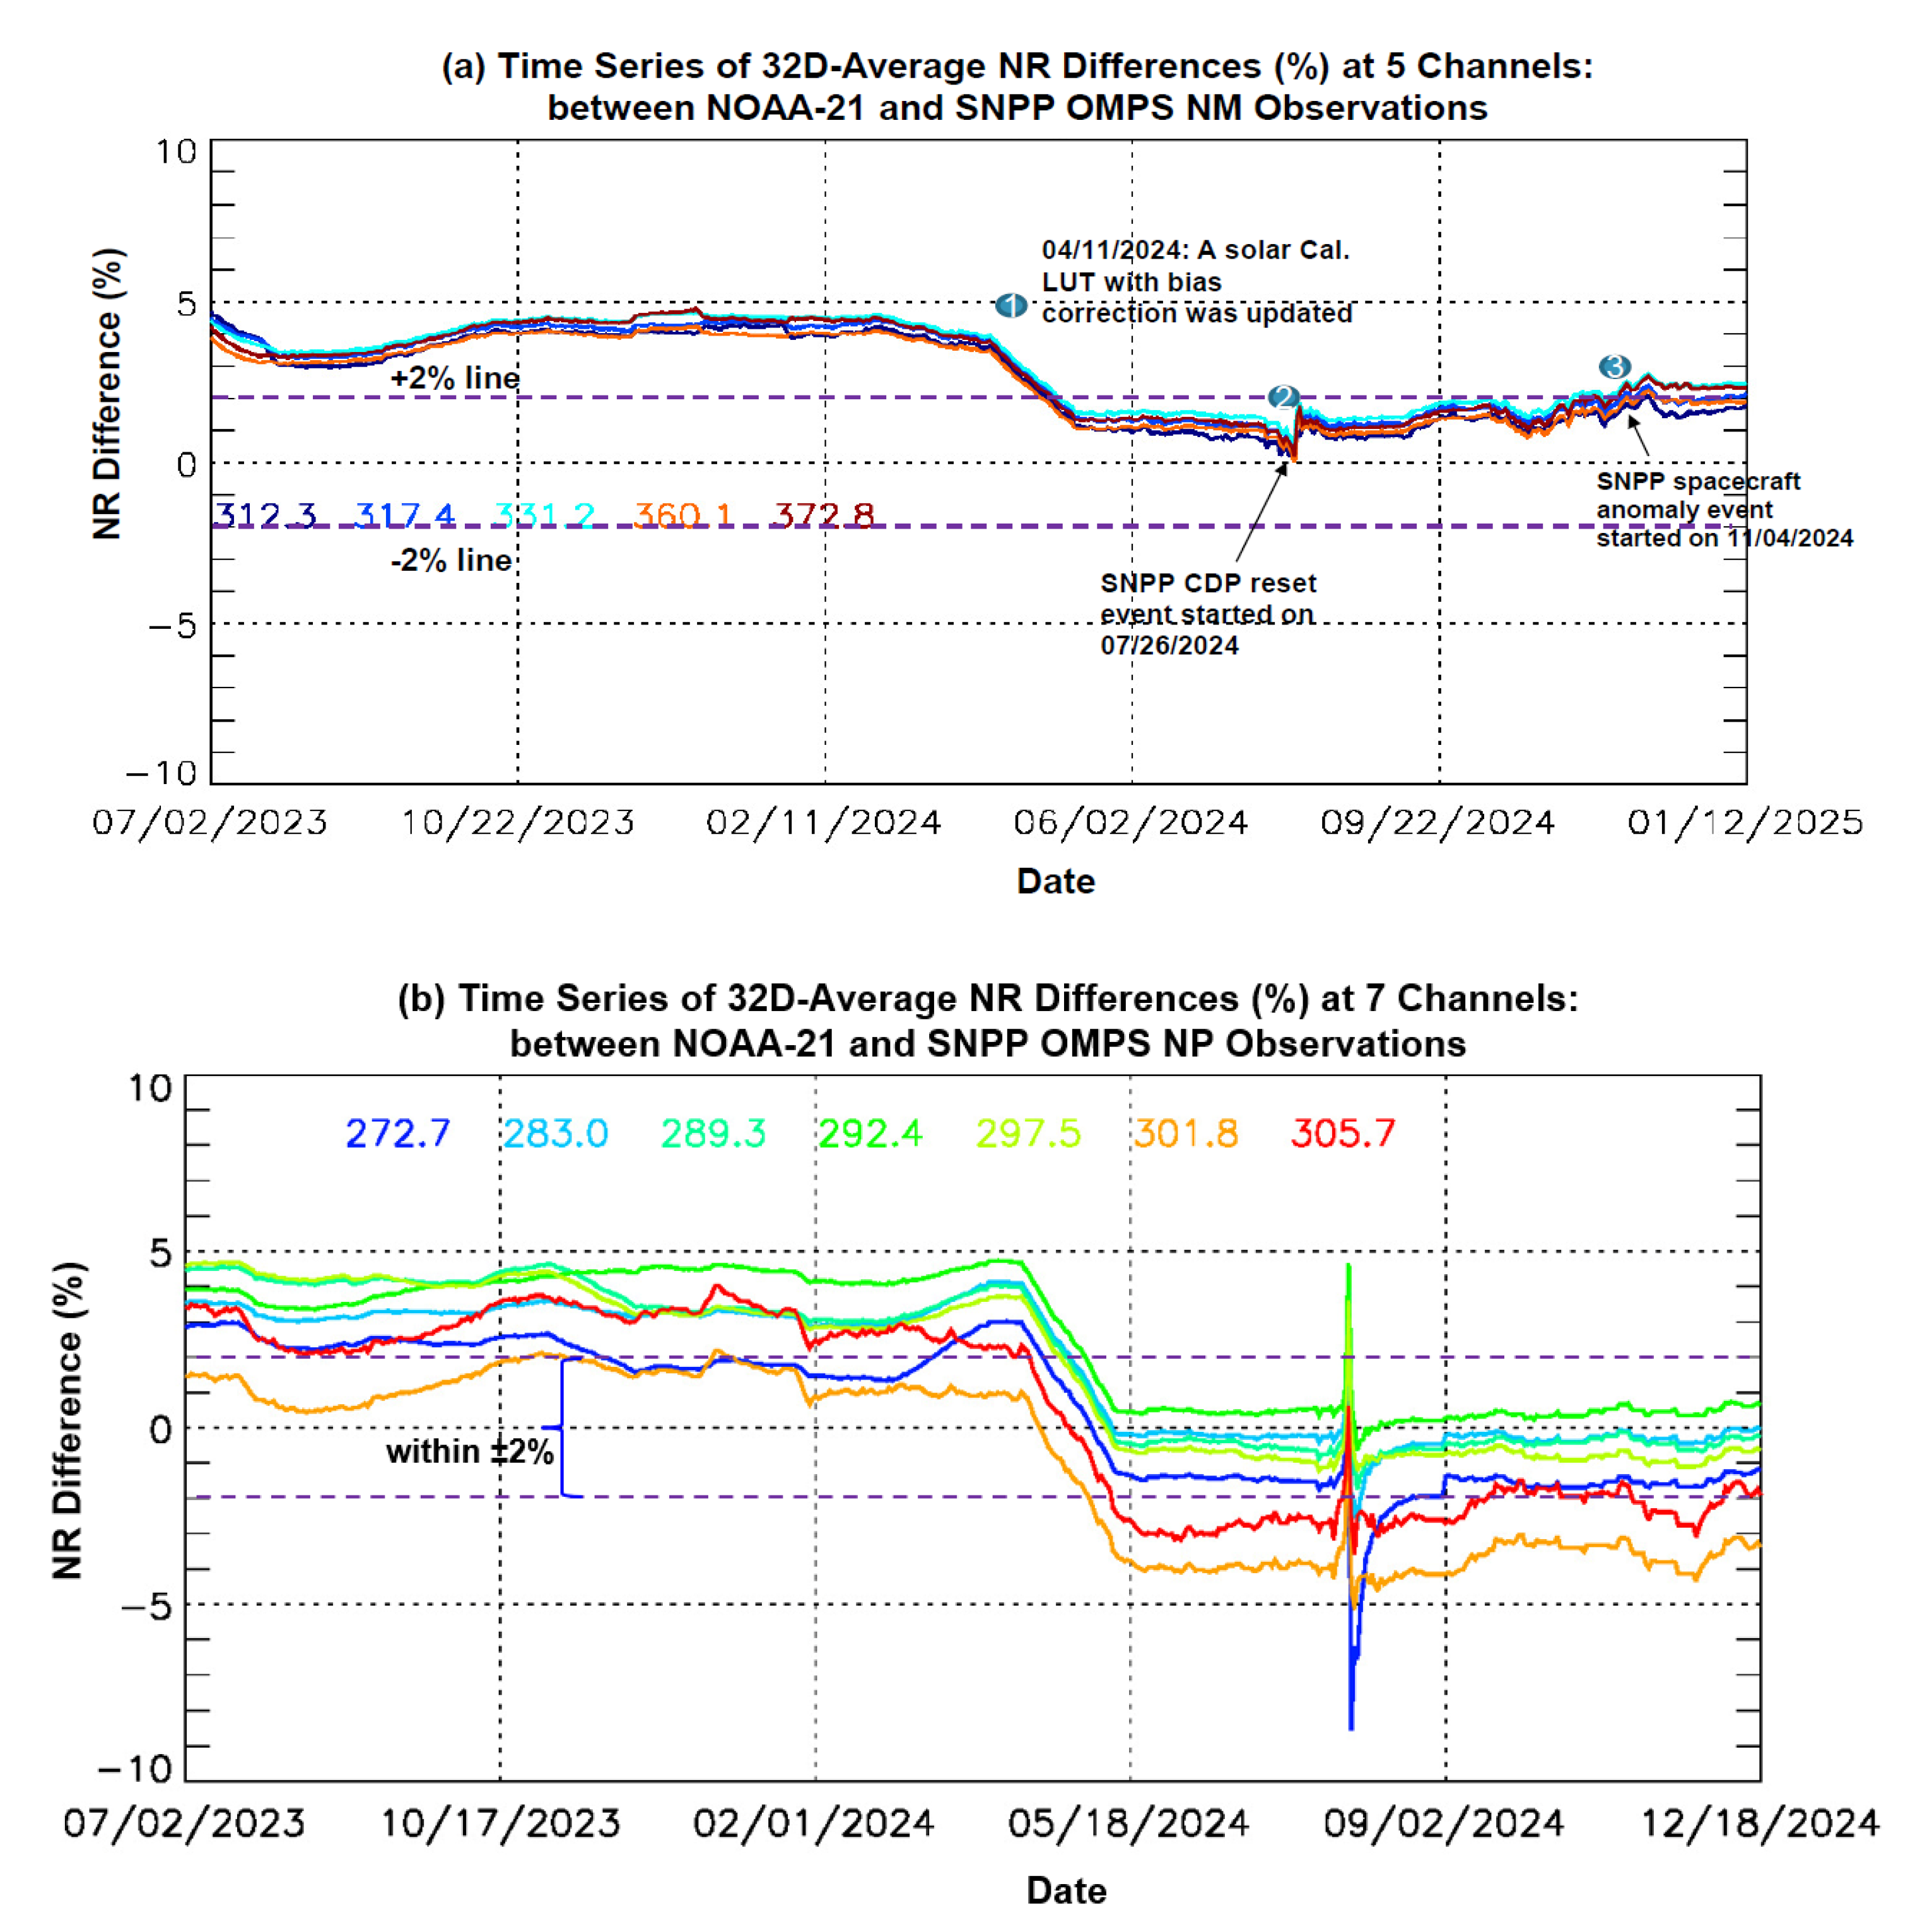
Figure 4.
Time series of daily-average inter-sensor radiometric calibration biases
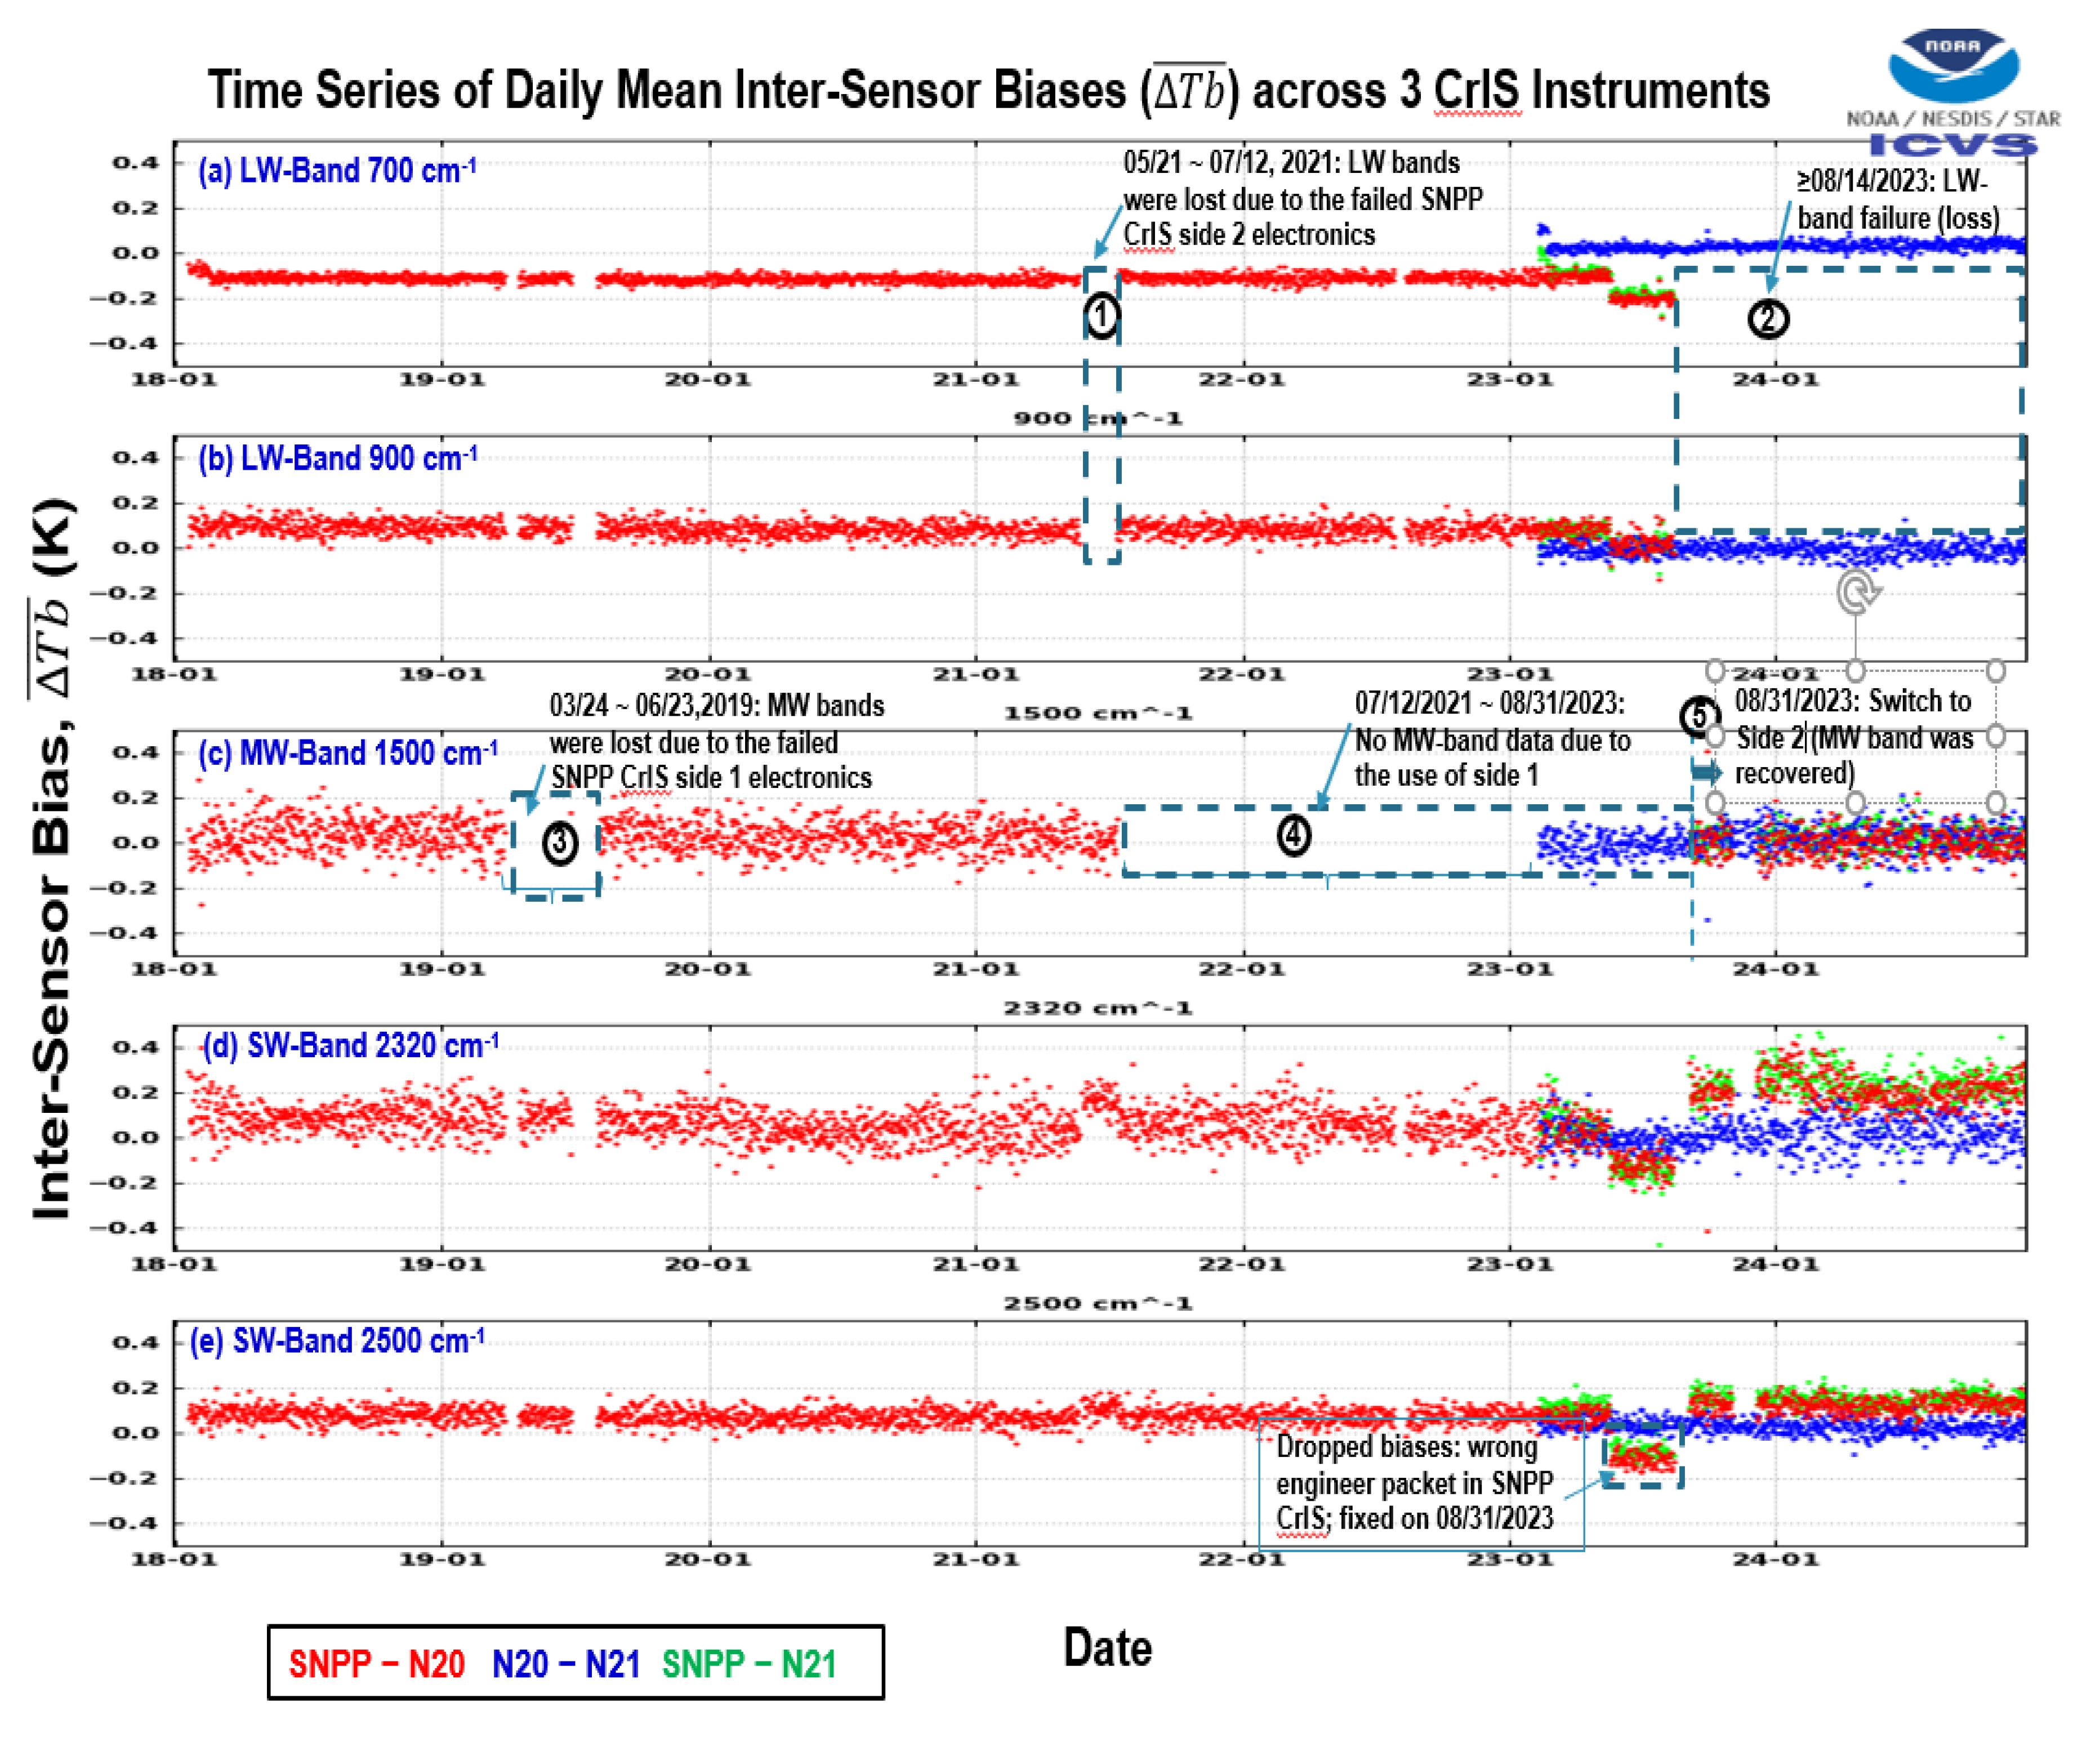
Figure 6.
Time series of 32D-AD average of inter-sensor radiometric calibration biases (
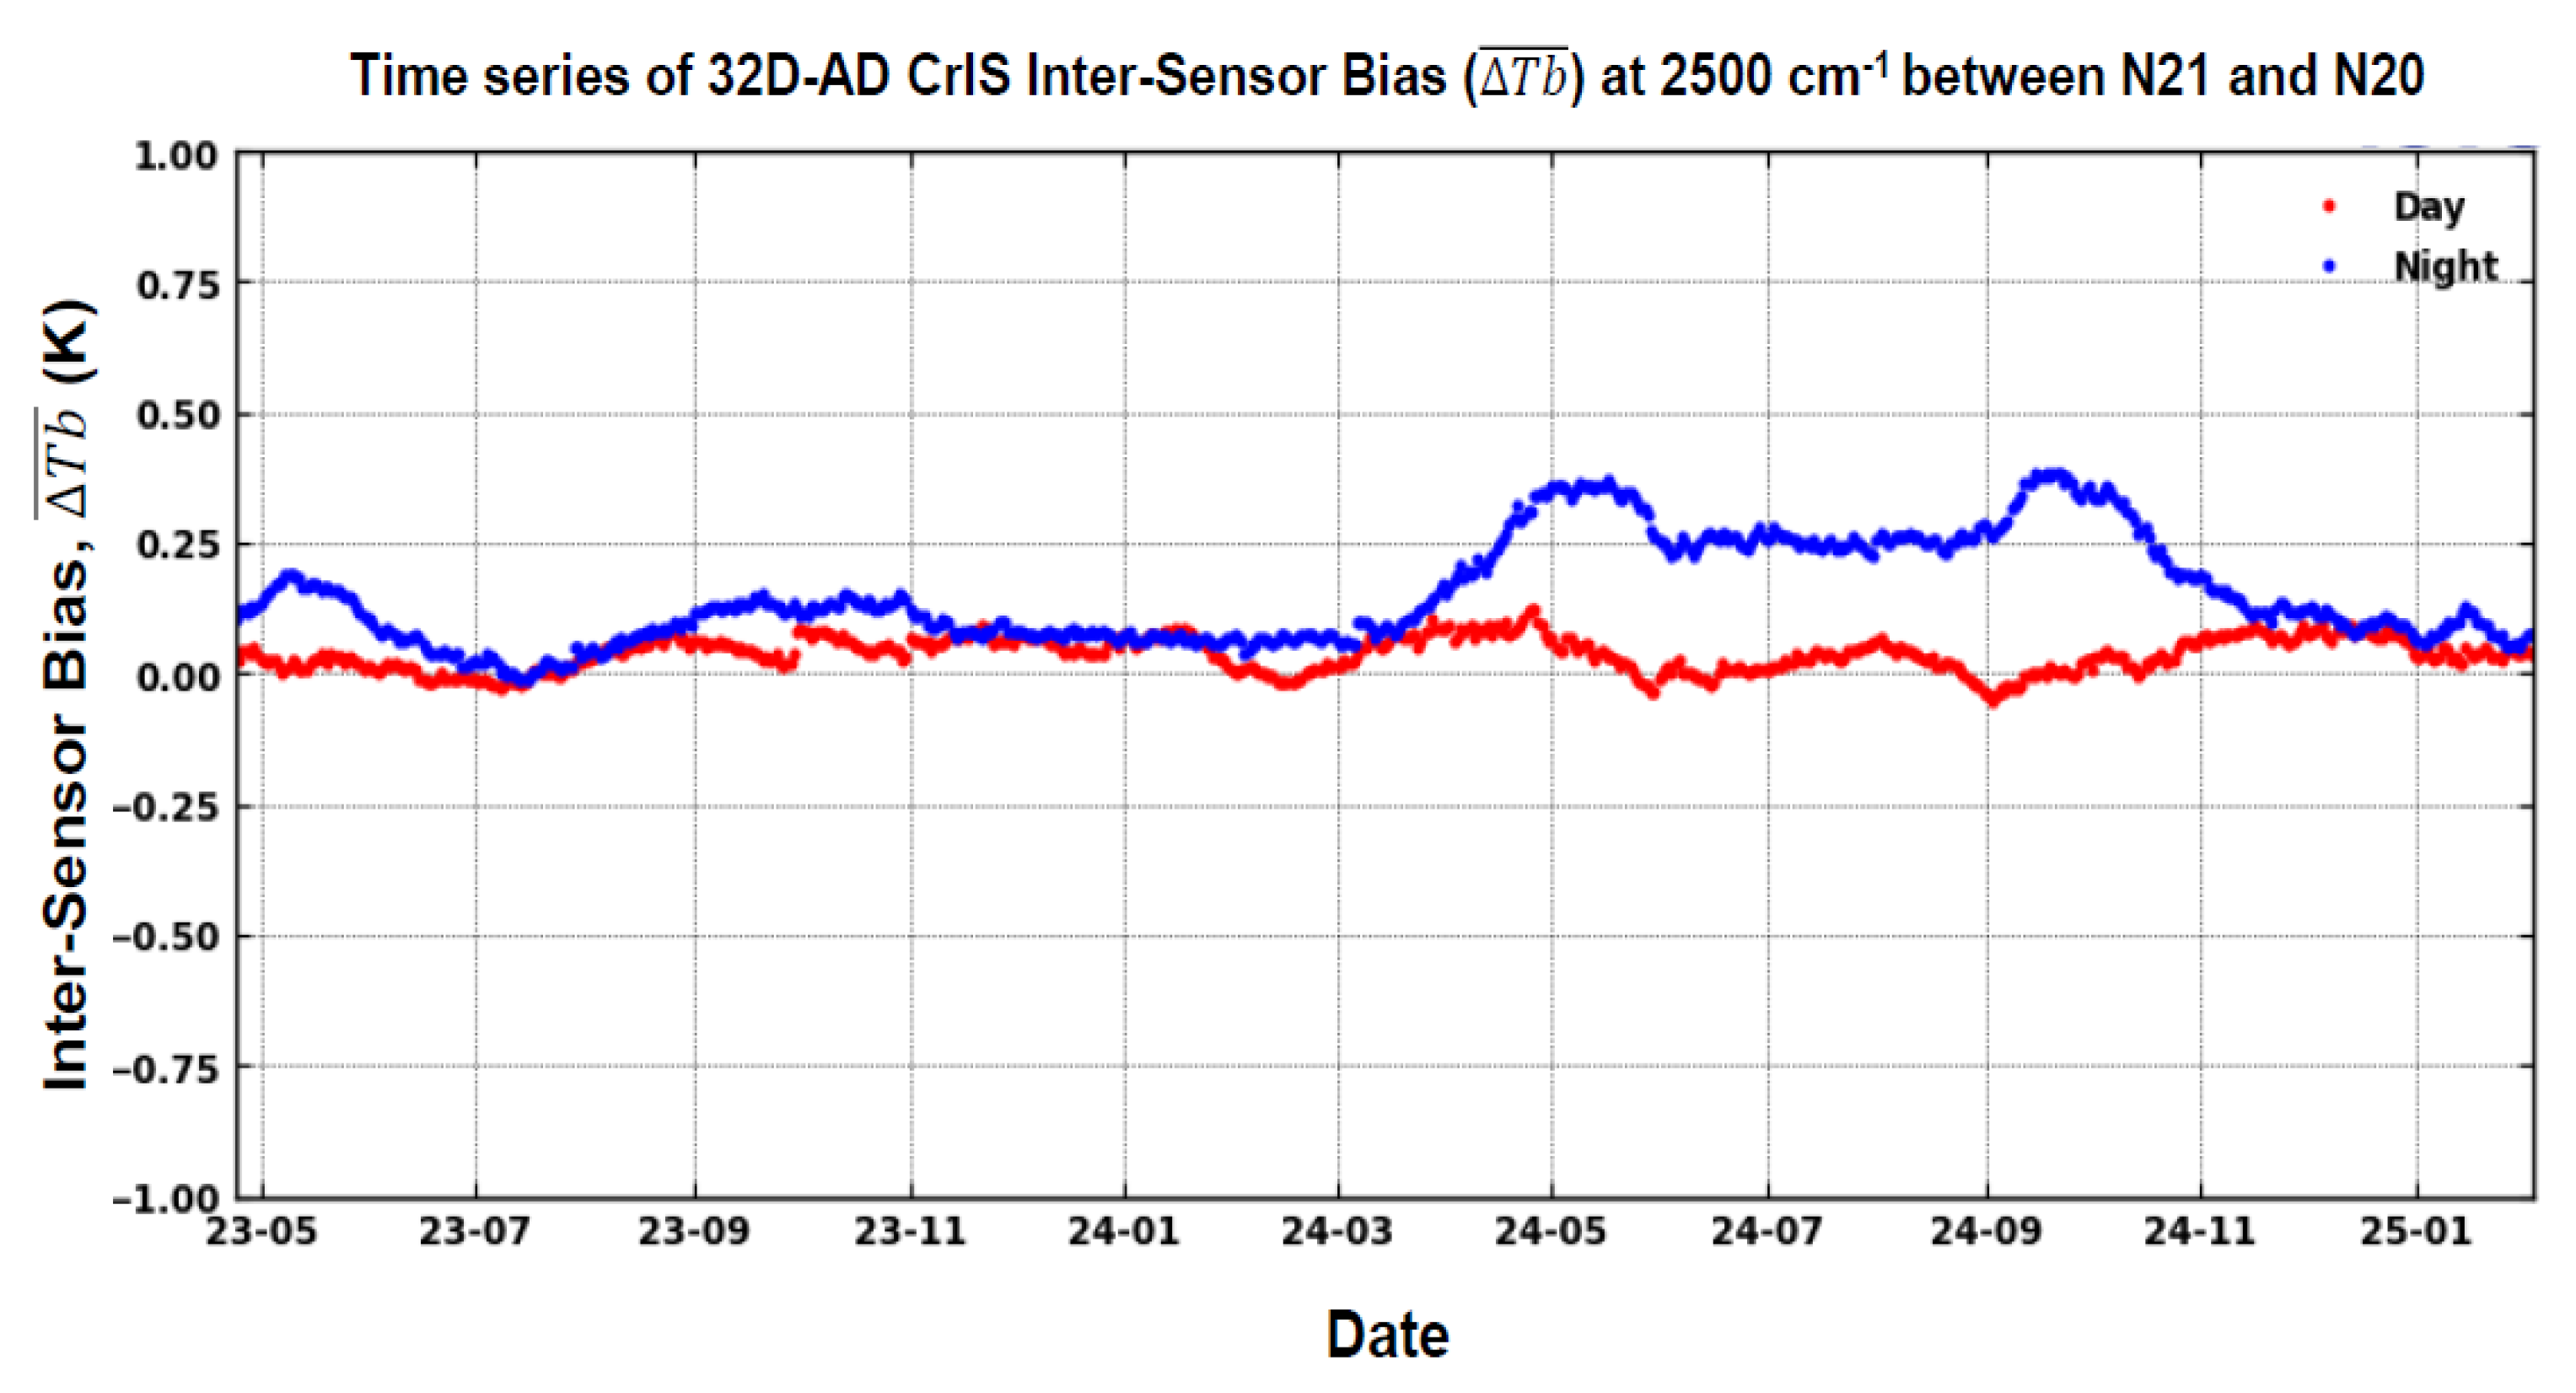
Figure 7.
(a) Time series of averaged inter-sensor radiometric calibration biases at 317.42 nm, using the SNO data sets spanning the period from April 19th, 2013 to January 16th, 2023. (b) Same as (a) except for at 345.38 nm. (c) Same as (a) except for at 372.93 nm. (d) Estimated yearly degradation rate per year at 11 channels, i.e., 310.73, 311.98, 312.41, 313.24, 314.49, 317.42, 322.43, 331.20, 345.38, 359.98, 372.93nm, that were computed using two methods. Th results marked in blue in (d) was computed using a linearly fitting for the time series of SNO-averaged inter-sensor biases per channel during almost ten-year period, which was carried out in this study. The results in red were provided by the EUMETSAT Pieter Valks using Metop-B GOME-2 Earth radiance and solar flux measurements.
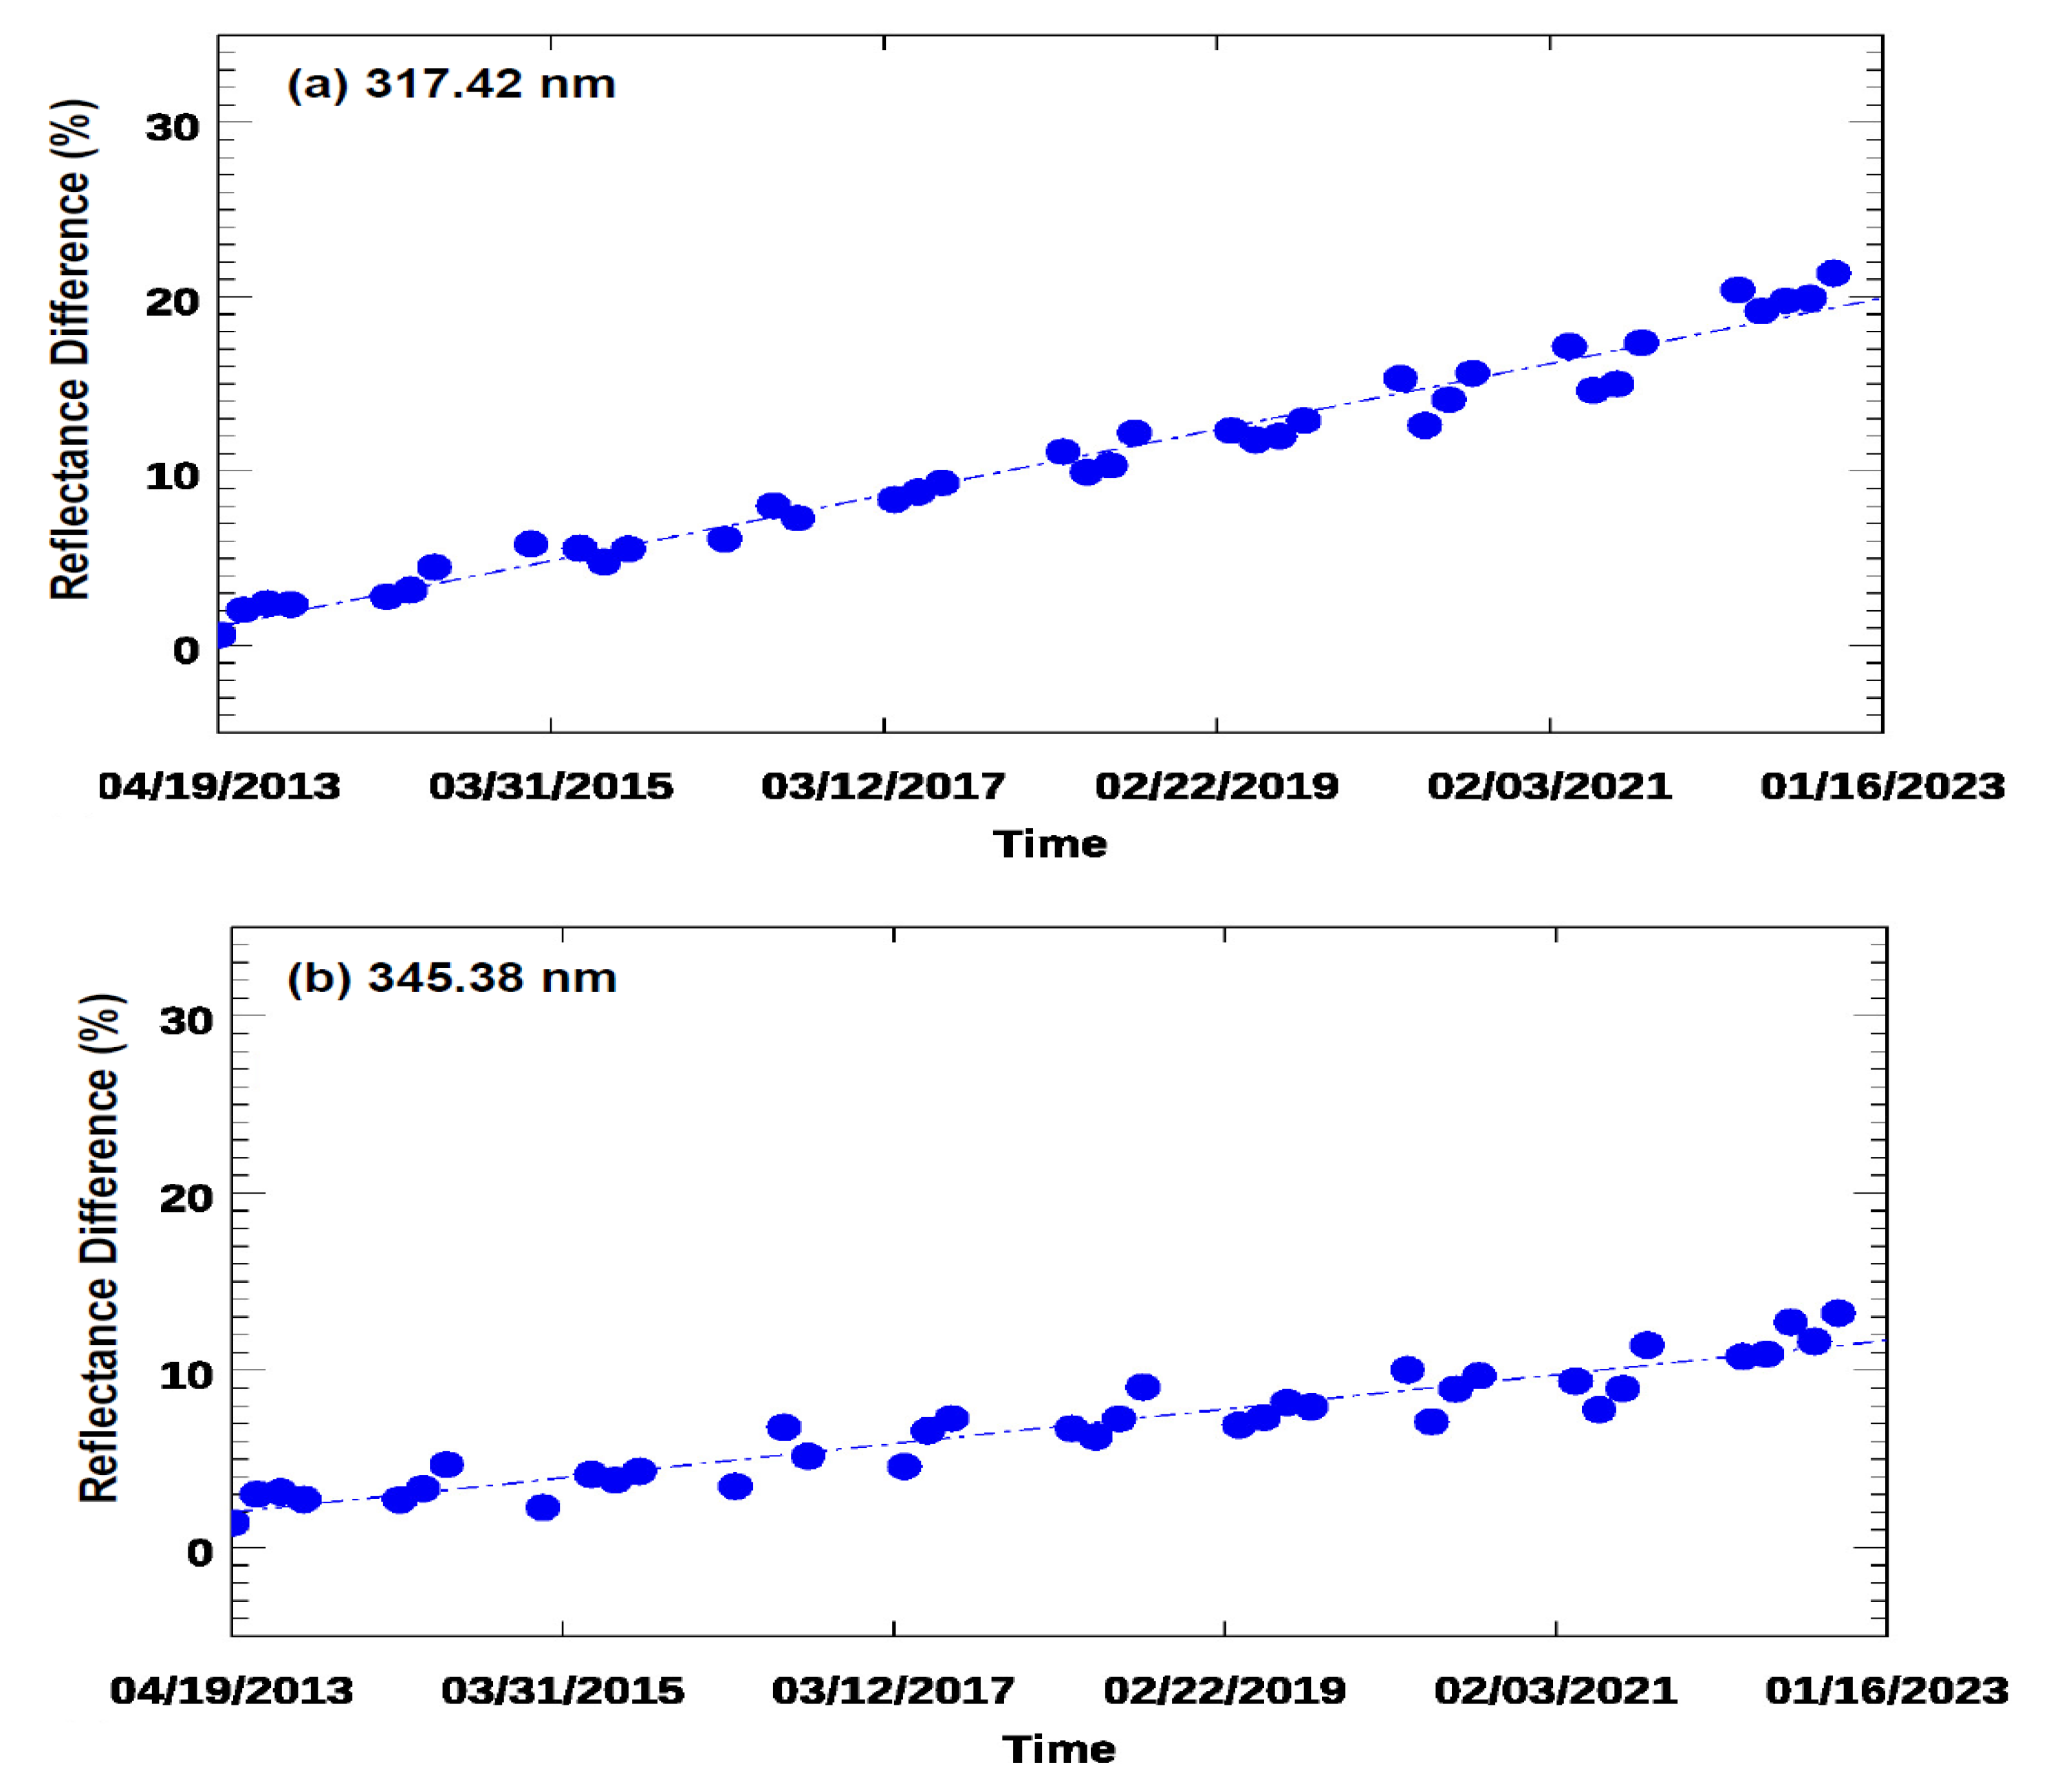
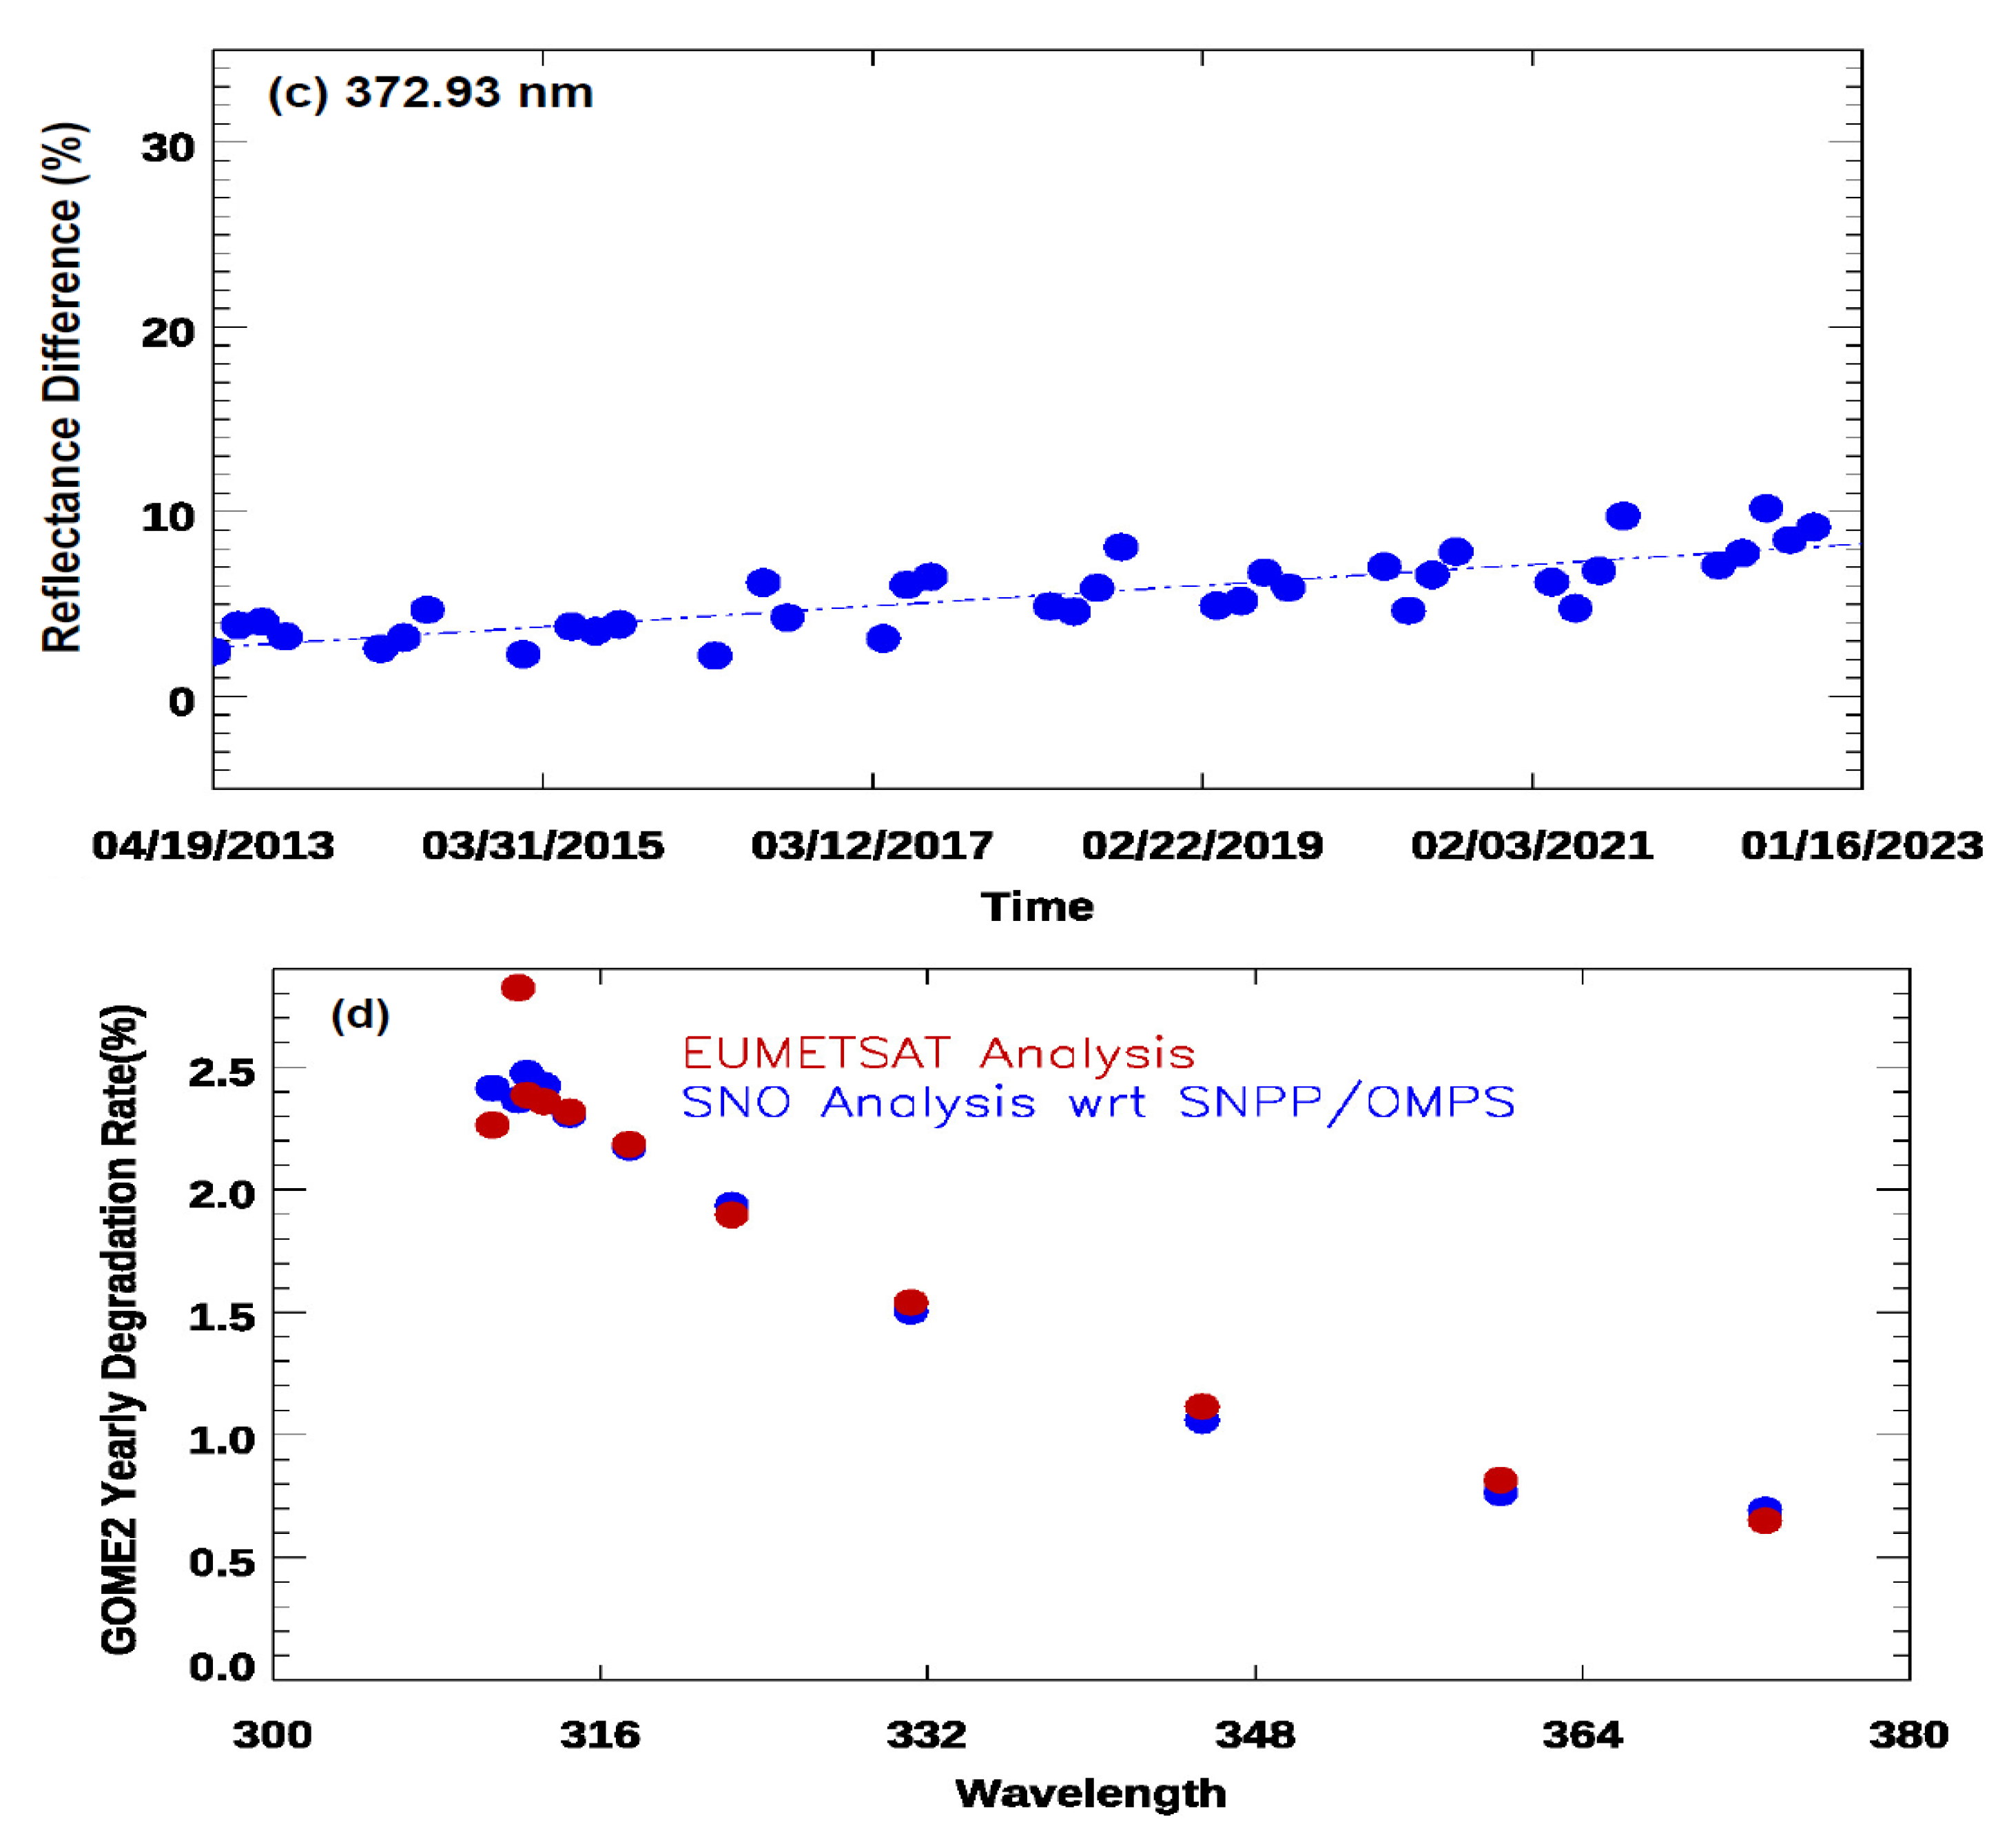
Figure 8.
Time series of daily average of inter-sensor radiometric calibration biases at three ABI channels for the observations during day and night respectively between SNPP CrIS and GOES-16 ABI. In the figure, the inter-sensor biases are computed using the SNO method [58,68]. To fill up the spectral gaps between CrIS and ABI, an existing method in [91] is employed to predict the CrlS gap channels in the figure. (a) ABI Channel 8 (corresponding to the CrIS channel at 1613 cm-1). (b) ABI Channel 9 (corresponding to the CrIS channel at 1449 cm-1). (c) ABI Channel 10 (corresponding to the CrIS channel at 1370 cm-1).
Disclaimer/Publisher’s Note: The statements, opinions and data contained in all publications are solely those of the individual author(s) and contributor(s) and not of MDPI and/or the editor(s). MDPI and/or the editor(s) disclaim responsibility for any injury to people or property resulting from any ideas, methods, instructions or products referred to in the content. |
© 2025 by the authors. Licensee MDPI, Basel, Switzerland. This article is an open access article distributed under the terms and conditions of the Creative Commons Attribution (CC BY) license (http://creativecommons.org/licenses/by/4.0/).
Copyright: This open access article is published under a Creative Commons CC BY 4.0 license, which permit the free download, distribution, and reuse, provided that the author and preprint are cited in any reuse.


