
Submitted:
17 November 2025
Posted:
18 November 2025
You are already at the latest version
Abstract
While essential for the ethical practice of veterinary medicine, euthanasia profoundly complicates research with a survival outcome. In particular, euthanasia can make it difficult to determine the extent to which a certain clinical sign, laboratory, or imaging finding is associated with poor prognosis since animals that die while receiving veterinary care are often euthanized rather than dying naturally. The reasons for euthanasia, however, could be dramatically different. Some are euthanized due to perceived poor prognosis, others due to client financial limitations, and others for multifactorial reasons. In addition, when a clinician-scientist veterinarian believes a clinical finding is associated with poor survival, they might consciously or unconsciously influence clients to euthanize their animals. In effect, this could create – or artificially inflate the strength of – an association between that finding and animal survival. In this viewpoint, I will discuss the use of causal inference tools like directed acyclic graphs (DAGs) to identify the treating veterinarian’s belief about prognosis as a variable that mediates the effect of clinical findings on the probability of survival. Then, I briefly discuss some statistical methods already in use to account for euthanasia in veterinary research and their limitations. Lastly, I speculatively propose the use of expert elicitation to estimate counterfactual survival probability distributions (CSPD) for euthanized animals. By using these CSPDs to weight survival probability in euthanized animals and DAGs to identify and adjust for potential confounding, investigators might be able to estimate the direct causal effects of different clinical findings on probability of animal survival.
Keywords:
causal inference
; counterfactual
; DAG
; prognosis
; expert elicitation
; survival
Introduction
Euthanasia complicates veterinary research.1 If a clinician sees a pet presenting to the ER with hypoglycemia, a sign they believe might be associated with poor survival, does that influence how they speak with that animal’s owner? Does their belief that this animal possesses a poor prognostic indicator influence an owner into deciding to euthanize that pet?
Clearly, a veterinarian’s assessment of a clinical scenario as suboptimal influences their communication with owners, and this could lead to owners choosing to euthanize their pet. To researchers, however, the story becomes considerably more complicated. This is because studies often aim to determine if certain clinical findings are associated with death and generalize those findings to new populations outside of the study. In human medicine, this tends to be more straightforward than in veterinary medicine as humans typically cannot be euthanized, whereas animals are often euthanized rather than dying naturally.2 Owners might have opted to euthanize because of veterinarian-perceived poor prognosis, financial limitations, excessive physical or emotional burden of continued treatment on caregivers, inability to maintain sufficient welfare for the individual, or any combination of these factors. Because of this, it is difficult to know how generalizable the findings are from veterinary research with survival as a principal study outcome.
In this perspective for veterinary clinical scientists, I offer an introduction to causal inference methods, such as directed acyclic graphs (DAGs) and their utility in identifying the treating veterinarian’s belief about prognosis as a key mediator upon animal survival. I conclude this perspective by describing the speculative concept of counterfactual outcome elicitation and its potential to make the results of veterinary research with survival outcomes more robust and generalizable.
Introduction to Causal Inference
Every year thousands of observational human and veterinary medical studies are published that detail risk factors for a variety of outcomes such as cardiovascular disease, cancer, or death. Unfortunately, there is often little to no consideration of whether those risk factors truly have any causal relationship to the outcome under study and thus no answers to whether modifying those risk factors would result in any improvement in outcomes. It does not have to be this way.
Causal inference aims to understand the causes of outcomes by combining data with causal models.3 Causal models are merely stated assumptions, based on expert or general knowledge, that any researcher or clinician might hold about the potential causal relationships between two or more variables being investigated. These models are often diagrammed in the form of directed acyclic graphs (DAGs) consisting of nodes representing different variables and arrows from one node to another representing how one variable is thought to possibly exert an effect on the other.4,5 In their simplest form, a DAG can consist of two nodes, X and Y, representing an exposure and outcome with an arrow from X to Y (Figure 1). DAGs describing more complicated real world phenomena, such as the pathophysiology of different diseases, can have many simple and complicated variables in their construction.
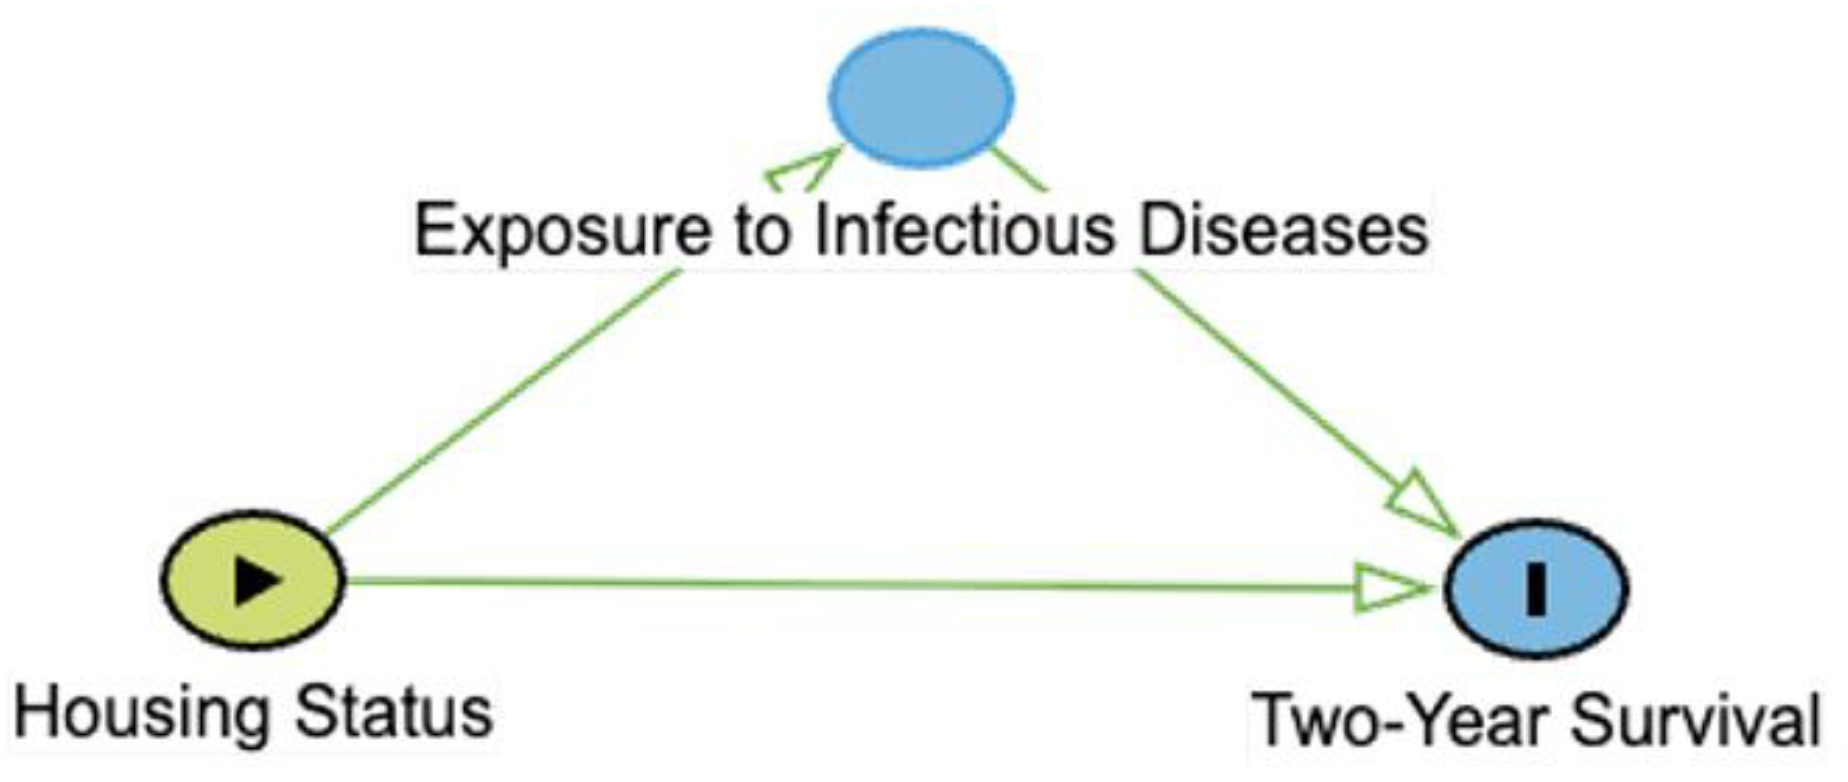
Any set of three variables in a DAG – exposure, outcome, and a third variable – can be connected in three ways (Table 1). One connection type is called a chain (Table 1A). In a chain, an exposure exerts an effect on a third variable, and the third variable exerts an effect on the outcome (in such cases, the exposure could also exert an independent direct effect on the outcome under study). Thus, the third variable acts to mediate the effect of the exposure on the outcome. The second connection type is called a fork (Table 1B). In a fork, one variable exerts an independent effect on two other variables. When this third variable affects both the exposure of interest and the outcome of interest, it is called a confounder because it makes it unclear whether a causal pathway actually exists between the exposure of interest and the outcome of interest.
As an example, consider a hypothetical study in which we are trying to determine the effect of housing status (indoor-only vs. indoor-outdoor) on two-year survival in the general population of cats with chronic kidney disease (CKD). In this case, preventive care could confound the relationship because it could affect both the housing status of the cat and survival; owners who seek routine preventive care for their cats might be more likely to house them inside due to perceived safety risks and might also seek veterinary attention or provide supportive care for cats with CKD, increasing the likelihood that they survive to two years. If we do not account for preventive care in some way, either by stratifying the data by preventive care-level or controlling for preventive care-level in a regression analysis, we might erroneously conclude that indoor-only housing is the cause of increased survival. However, this conclusion could be misleading as the cause of improved survival in the indoor-only group might be because those owners are better at overall pet care. By adjusting for preventive care-level, we could then determine that, for any given level, the survival in the indoor-only group is greater or less than in the indoor-outdoor cat group.
The third connection type is called a collider (Table 1C). In a collider, two variables independently affect a third variable; often, this is the exposure and outcome variables affecting a third variable. When this collider is not recognized or appreciated, it can cause an erroneous understanding of the causal relationships at play. Consider the same example as above. Let’s assume, out of convenience, we have opted to use cats in a clinical trial evaluating a new CKD treatment for our study. This is potentially problematic, however, because both being an indoor-only cat and having surviving for two years with CKD independently affect how likely a cat is to be included in a clinical trial. Indoor-only cats might be more likely to end up in a trial because their owners might have a closer relationship to a veterinarian. Similarly, a cat that has lived two years with CKD has had more time to be included into a trial. Thus, inclusion in the trial is a collider. When we condition on inclusion in a trial, the causal relationship between housing status and the survival in the general population of CKD cats is distorted, even when adjusting for confounders. A better strategy would be to sample randomly from the general population of cats with CKD.
Causal diagrams are especially useful for planning one’s data analysis and, data availability permitting, can even allow emulation of randomized control trials using observational data.6–8 They promote good statistical practice by requiring investigators to think about the topic of interest and define their hypotheses about causal links a priori, which limits both the number of statistical tests that are performed and the typical post-hoc rationalizations given when unexpected associations are found. Causal diagrams also allow identification of non-causal pathways linking the exposure-outcome dyad of interest, which are said to be “open” if confounders (or fork connections) of the exposure-outcome are not adjusted for or if collider variables are adjusted for, which would result in selection bias and distortion of the causal relationship in an exposure-outcome pair of interest.9 Mediator variables, the middles of chain connections, are often left unadjusted, because investigators are usually interested in the total effect of an exposure on an outcome.
Let’s return to our hypothetical study. According to our DAG (Table 1A), housing status has some direct effect on survival, but it also affects exposure to infectious diseases, which can themselves affect the survival by accelerating CKD or other pathology.10–12 During the data analysis, if the investigator unwittingly adjusts for infectious disease status by including it in a multiple regression analysis as a potential confounding variable, they are only evaluating the direct effects of housing status on survival, which could be so small as to be inconsequential. If the data are analyzed this way, the investigator might erroneously conclude that the housing status has no influence on survival. Had the investigator analyzed the data without adjusting for infectious disease status, i.e., including the total effects of housing status on two-year survival, they might have found a modest increase in survival due to the mediating effect of lowered exposure to infectious disease. This second way of analyzing the data is more relevant for answering the clinical question, but it can be easy to choose the first method if a causal model was not employed.
Euthanasia as a Fundamental Limitation in Veterinary Research
One important difference between clinical research in human and veterinary medicine, besides scale of the enterprises, is the widespread use of euthanasia in veterinary medicine. Euthanasia complicates veterinary research at a fundamental level because observational veterinary medical studies with a survival outcome often do not adequately address its impact.1,13–15 Because euthanasia is typically considered a preferable outcome to natural death from a welfare perspective, the number of animals that are euthanized is typically far greater than those which die naturally.2 These euthanized animals are often combined, however, with natural deaths into a single ‘nonsurvival’ outcome.14
This approach can be problematic because veterinarians are not perfect prognosticators. Their incorrect predictions have even been shown to be generally more pessimistic than reality, which had the potential to lead to discontinuation of care or euthanasia of animals that could have had better outcomes.13,16 A corollary is that if a clinician believes a particular clinical sign is a negative prognostic indicator and then consciously or unconsciously influences the owners of animals with that clinical sign to opt for euthanasia, they have effectively created or inflated a negative association between the presence of the clinical sign and animal survival.
Despite most ‘risk factor’ studies failing to employ causal models, investigators often present or interpret measures of risk (e.g., odds ratios) using causal language, such as ‘was affected by’ or ‘influenced’.17 To readers these measures can seem like an estimate of the direct effect of the risk factor on a survival outcome. In actuality, these measurements are the total effects of the risk factor on the outcome, including the effects that are mediated by the veterinarian’s belief about prognosis and the treatment effort.
A veterinarian's assessment of an animal's prognosis is affected by clinical signs, prior treatment effort, veterinarian experience, and published evidence (Figure 2A). Likewise, the treatment effort depends on the veterinarian belief about prognosis and the client’s ability to provide for treatment. Because these factors are highly situation-dependent and dramatically affect each animal’s outcome – one client’s inability to treat is not necessarily relevant to another case – mediation analysis could be used to estimate the direct effects of a particular clinical sign on survival. Mediation analysis aims to decompose the total effects of an exposure on an outcome into the mediated effect and direct effect.
After adjusting for confounders (Figure 2B), the variable of interest remains mediated by both treatment and, in euthanized animals, veterinarian belief about prognosis prior to euthanasia. Ideally, mediation analyses would adjust for the treatment received, eliminating the mediated effects of both the treatment received and the veterinarian belief about prognosis, leaving only the direct effect of the exposure, the clinical variable of interest, on survival (Figure 2C); unfortunately, this is often methodologically complex and more easily said than done. Another equivalent option for assessing direct effect would be, in euthanized animals, to adjust for the veterinarian belief about prognosis prior to euthanasia. Both approaches, however, are hampered by the facts that in real world datasets treatment effort is not always reliably captured, and veterinarian belief about prognosis prior to euthanasia is almost never quantified in the medical record.1 A third approach could stratify data into different levels of treatment effort and analyze direct effects within each strata; the drawback of this is that it can require large numbers of animals per stratum to ensure to estimate reasonably precise measures of risk. Ideally, there would be a way to avoid stratifying data, yet still mediate the effects of both the treatment received and the veterinarian belief about prognosis.
Counterfactuals in Euthanasia
One way a mediation analysis can account for a veterinarian’s belief about prognosis is to use counterfactuals. Counterfactuals are an essential component of the causal inference toolkit and are basically imagined realities that answer the question “what would have happened had some past action been different?”18 For euthanasia, the counterfactual question is “would this animal have survived had it not been euthanized?”
Randomized controlled trials (RCTs) are based on counterfactual thinking. In RCTs, we want to know the treatment effect for an average animal, namely what would happen if they received the new intervention versus standard care or a placebo (control group) regimen? Unfortunately, we often cannot assign an individual to both treatment and control groups and, thus, can only observe the outcome for their assigned condition (treatment or control); the counterfactual condition outcome cannot be directly observed or assessed on an individual level. Fortunately, through randomization and with a sufficient sample size, the average animal in the treatment group is sufficiently similar to the average animal in the control group, so the average control animal provides a surrogate counterfactual outcome for the average treatment animal. This idea is called exchangeability, and, in essence, is an assumption that had the control group instead received treatment and the treatment group received the control regimen, the average treatment effect would remain the same. Without randomization, however, the exchangeability of treated (or otherwise exposed) groups with their non-treated (or unexposed) counterparts is called into question. Individuals in the treated/exposed group could have a different average age, disease severity, or other set of factors that might impact their outcome and differ from those in the control/unexposed group. Because of this, most observational studies lack exchangeability.
Some relatively recent advances in observational studies aim to improve exchangeability by using demographic/clinical/social variables to estimate how likely an animal was to be treated (or exposed). In one of the methods, propensity score-matching, pairs of individuals are often matched based on having similar propensity to be treated but only one of which actually received treatment. In a second method, inverse probability of treatment weighting, the outcomes of individuals who had a low probability of receiving treatment but did receive treatment are weighted relatively greater than those with a high probability of receiving treatment that actually received treatment; the same is true for the non-treatment groups. Unfortunately, however, these methods to improve exchangeability can require large amounts of data, although some modifications such as stabilized weights and parsimonious propensity models can mitigate some small-sample instability.
Other Statistical Approaches to Account for Euthanasia
Other statistical approaches can effectively handle informative right-censoring of subjects, i.e., those whose outcome event was pre-empted due to either loss-to-follow up or competing risks, such as euthanasia or death from another cause. Markov models which include euthanasia, natural death, and loss-to-follow up as absorbing states have been shown to be superior to conventional time-to-event estimators like Kaplan-Meier curves.15 Cause-specific hazard and Fine-Gray models to estimate hazard ratios or subdistribution hazard ratios, respectively, can be used to treat euthanasia as a competing risk of death. Lastly, inverse probability of censoring weighting could be used to provide more weight to that subjects that were similar to censored subjects but were not themselves censored. The downside of all these methods is that they can require larger amounts of data than is realistically obtainable to estimate reasonably precise 1) transition probabilities for Markov models, 2) hazard ratios for natural death (due to predominance of euthanasia), and 3) weights for use in IPCW.
Expert Elicitation of Survival Probability
Given the typically limited sample sizes in veterinary medicine, it could be useful to borrow a novel concept from the human medical literature, eliciting expert opinions on predicted survival and incorporating them into statistical models.19,20 In these examples, experts were assembled to estimate pediatric leukemia patient survival at various time points beyond the time horizon of a clinical trial.
These opinions were derived through formal methods of expert elicitation (EE). Expert elicitation is the process of obtaining and aggregating the opinions of experts on a topic for which there is uncertainty due to limited data. Rather than informally asking experts what they think on a matter or how probable some event is, an array of EE methods, including Cooke’s classical model, Sheffield Elicitation Framework (SHELF), and Delphi procedures use formal protocols designed to minimize cognitive biases, like anchoring bias, availability heuristic, and overconfidence.21 For example, experts are provided training in the provision of probabilistic estimates, which is not always intuitive, prior to participation in the EE. Experts are also provided an evidence dossier which contains all the pertinent evidence on which they will have to provide their opinions. Detailed explanation of the EE process is beyond the scope of this perspective, but as an example, experts undergoing elicitation with the SHELF method are asked to individually estimate both the lower and upper plausible bounds of the parameter of interest as well as the median value and quartiles. Individual expert opinion-derived probability distributions are then aggregated either mathematically or behaviorally through a group discussion and consensus forming.22
In the context of EE, increasing the reproducibility and validity of estimates is tied to the use of these formal protocols. To increase reproducibility, it is crucial to have detailed documentation of the elicitation methodology. The criteria for which and methods by which the experts were chosen, their qualifications, and any potential conflicts of interest (e.g., current or prior research support from a company whose drug is being investigated) should all be reported. Well-defined questions are essential to eliminate ambiguity amongst experts as to what is being asked of them. Lastly, specifics of the elicitation protocol, including whether participants’ opinions were elicited individually or as a group and how they were aggregated, should be thoroughly documented to allow replication. To increase validity, the use of experts across practice settings and geographies can be used to avoid local effects, e.g., embedded attitudes or beliefs shaped by where one practices. Likewise, the use of calibration questions, which score experts according to known information, can be used to weight their contributions accordingly, with higher scoring experts contributing relatively more to shape of the probability distribution. While quantifying the validity of expert elicitation will remain impossible in some settings due to a lack of objective truth, in at least one study experts who estimated future survival of leukemia patients were found to be generally accurate when compared to longer term follow-up data.19
Application of Expert Elicitation to Counterfactual Survival Probability
While speculative for now, a similar concept could be applied to veterinary medical research with a survival outcome. Several outside experts, covering a range of practice settings and geography, might be recruited to form counterfactual outcome committees (COCs). Each committee would then be subject to EE methods with the aim of estimating a counterfactual survival probability density (CSPD) for each euthanized animal included in a study. In practice, this would require training experts, providing all experts with an evidence dossier (e.g., history and physical examination findings, clinical pathology, diagnostic imaging, biopsy results, and prior treatment up to the time of euthanasia) of each animal, and having a dedicated EE facilitator. Using a well-defined EE protocol, COC experts would be asked to envision a scenario in which similarly situated animals were not euthanized and were eligible to receive additional treatment (with a defined upper limit of treatment, such as that which can be reasonably provided in a tertiary referral hospital). As described before, COC experts would be individually asked a carefully structured series of questions to estimate that expert’s CSPD taking into consideration the evidence dossier, published evidence, and their own prior experience. These probability distributions would then be aggregated for each euthanized animal.
For each euthanized animal, these composite CSPDs could then be incorporated into a multiple logistic regression – based on the study’s DAG (Figure 3A) to adjust for other variables that could affect both the exposure of interest and the animal’s survival - to weight the probability of survival. This weighting, in its simplest form, would use the mean of each animal’s CSPD to adjust that animal’s influence on the regression. This approach, however, trades simplicity for accuracy. A more accurate, but computationally more complex approach would be to use a Monte Carlo simulation; this entails using computer simulations to repeatedly sample a single random value from each euthanized animal’s CSPD to use as a weight and then averaging the regression outputs over many iterations to better reflect the uncertainty (i.e., shape of the CSPD) around each CSPD mean. The coefficients from these weighted multiple regressions could defensibly be the primary outcome or they could be used as sensitivity to assess the robustness of the unweighted model to uncertainty in the outcomes of some animals.
In essence, the CSPD could act as more than a stand-in for the unmeasured variable, the treating veterinarian’s belief on prognosis prior to euthanasia (Tn+1) (Figure 3B). To illustrate this, consider that after several days of hospitalization for a pet, its owner tells the veterinarian they can only afford $200 of additional treatment. Assuming this animal was not ready for imminent discharge from hospital, this information would clearly affect the treating veterinarian’s belief about prognosis and the animal’s survival. By using solely clinical data – without additional client communication information – in the elicitation of CSPDs, the confounding effect of client willingness and ability to treat prior to euthanasia on the relationship between veterinarian belief about prognosis prior to euthanasia and survival would be removed (Figure 3C).
Eliciting the CSPD of only those animals that are euthanized might seem odd to some. However, these are the only animals at risk of having their outcome misclassified as essentially equivalent to natural deaths because withdrawal of all care without euthanasia is very rare. The animals that survive are known to survive, and the animals that died a natural death were essentially all undergoing active treatment for their condition. By analyzing data in this way, researchers might be able to partially account for biased estimates of causal effects of clinical variables on survival arising from situation-specific variables such as treating veterinarian-held beliefs about prognosis and client ability to pursue treatment. The widespread unintended inclusion of these variables in analyses is akin to overfitting in that the estimations of risk (e.g., ORs) correspond too closely to that particular set of data (i.e., those animals, those clients, those veterinarians) and can therefore fail to be generalizable. Thus, the use of CPSDs could be viewed as a soft constraint on the statistical models, guiding them to what might considered more plausible results.
Strengths and Limitations of Counterfactual Outcome Committees
One of the biggest strengths of this approach is that it could provide estimates of causal effects rather than associations. By understanding how different exposures can affect survival rather than simply be statistically associated with survival, clinicians can work to mitigate those exposures to improve the odds of good outcomes. Another strength of this approach is that it borrows an increasingly common method in human medical research as well as other domains, EE, and uses it to address a pervasive problem in veterinary research.
Perhaps paradoxically, one of the bigger limitations of this approach is also its use of EE, a methodology which has been considered by some authors to be of questionable validity and reliability.22,23 Much of this skepticism surrounding EE, including an anonymous referee of a previous draft of this manuscript, stems from the potential for expert judgements and estimations to be biased.23 In the context of euthanized animals, however, it should be noted that these data are already biased by the treating clinician’s beliefs about prognosis. CSPD estimates derived from EE will always remain subject to some of the same limitations as the treating clinician’s prognosis estimates (most significantly, sparse data) but are not constrained by client-specific information like willingness and ability to treat. To increase validity in EE, it is essential to employ rigorous methods and report those methods transparently so their face validity can be assessed by readers. Lastly, the other major limitation is one of logistics and limited ability to cover expenses associated with a COC. These costs might include labor – for both recruiting experts, facilitators and paying them – and data storage and distribution. Fortunately, there are freely available tools to both train experts for elicitation purposes and allow untrained facilitators to conduct competent elicitations.24,25
Conclusion
The ability to euthanize animals is essential to the practice of ethical veterinary medicine, but it creates considerable difficulties for investigators aiming to produce generalizable results in studies with a survival outcome. Using DAGs, it is possible to identify both treatment and veterinarian belief about prognosis as variables mediating the effect of an exposure variable on the survival outcome. Because sparse data often precludes more conventional statistical approaches and the treating veterinarian rarely documents a quantitative estimate of prognosis prior to euthanasia, I propose a speculative framework by which CSPDs for euthanized animals can be elicited from experts. While empirical testing of this approach remains necessary before widespread adoption, by using CSPD within regression models to weight survival probability of euthanized animals, investigators might be able to better understand the causal relationships between exposures of interest and survival, reducing the impact of external factors such as financial or emotional limitations of clients.
References:
References
- Cummings CO, Krucik DD. Not all euthanasias are alike: stratifying treatment effort to facilitate better prognosis prediction. Vet Rec. 2023;192:72–4.
- Pegram C, Gray C, Packer RMA, et al. Proportion and risk factors for death by euthanasia in dogs in the UK. Sci Rep. 2021;11:9145.
- Pearl J. Causality [Internet]. 2nd ed. Cambridge: Cambridge University Press; 2009 [cited 2025 Sep 27]. Available online: https://www.cambridge.org/core/books/causality/B0046844FAE10CBF274D4ACBDAEB5F5B (accessed on day month year).
- Textor, J. Drawing and Analyzing Causal DAGs with DAGitty. 2023 p. 13. Report No.: 3.1.
- Textor J, van der Zander B, Gilthorpe MS, et al. Robust causal inference using directed acyclic graphs: the R package ‘dagitty.’ Int J Epidemiol. 2016;45:1887–94.
- Pegram C, Diaz-Ordaz K, Brodbelt DC, et al. Target trial emulation: Do antimicrobials or gastrointestinal nutraceuticals prescribed at first presentation for acute diarrhoea cause a better clinical outcome in dogs under primary veterinary care in the UK? PLOS ONE. 2023;18:e0291057.
- Pegram C, Diaz-Ordaz K, Brodbelt DC, et al. Target Trial Emulation: Does surgical versus non-surgical management of cranial cruciate ligament rupture in dogs cause different outcomes? Prev Vet Med. 2024;226:106165.
- Pegram C, Diaz-Ordaz K, Brodbelt DC, et al. Later-age neutering causes lower risk of early-onset urinary incontinence than early neutering–a VetCompass target trial emulation study. PLOS ONE. 2024;19:e0305526.
- Hernán MA, Monge S. Selection bias due to conditioning on a collider. BMJ. 2023;381:p1135.
- Hartmann K, Pennisi MG, Dorsch R. Infectious Agents in Feline Chronic Kidney Disease: What Is the Evidence? Adv Small Anim Care. 2020;1:189–206.
- Baxter KJ, Levy JK, Edinboro CH, et al. Renal Disease in Cats Infected with Feline Immunodeficiency Virus. J Vet Intern Med. 2012;26:238–43.
- Poli A, Tozon N, Guidi G, et al. Renal Alterations in Feline Immunodeficiency Virus (FIV)-Infected Cats: A Natural Model of Lentivirus-Induced Renal Disease Changes. Viruses. 2012;4:1372–89.
- Le Gal A, Barfield DM, Wignall RH, et al. Outcome prediction in dogs admitted through the emergency room: Accuracy of staff prediction and comparison with an illness severity stratification system for hospitalized dogs. J Vet Emerg Crit Care. 2024;34:69–75.
- Hosgood G, Scholl DT. The effects of different methods of accounting for observations from euthanized animals in survival analysis. Prev Vet Med. 2001;48:143–54.
- Hosgood, GL. Markov models to estimate and describe survival time and experience in cohorts with high euthanasia frequency [Ph.D.]. [Baton Rouge, LA]: Louisiana State University; 2002.
- Molitoris A, Pfaff A, Cudney S, et al. Early career clinicians euthanize more dogs with nontraumatic hemoabdomen but not gastric dilatation and volvulus than more experienced clinicians. J Am Vet Med Assoc. 2022; 260:1514–1517.
- Sargeant JM, O’Connor AM, Totton SC, et al. Watch your language: An exploration of the use of causal wording in veterinary observational research. Front Vet Sci. 2022; 9:1004801.
- Höfler, M. Causal inference based on counterfactuals. BMC Med Res Methodol. 2005;5:28.
- Cope S, Ayers D, Zhang J, et al. Integrating expert opinion with clinical trial data to extrapolate long-term survival: a case study of CAR-T therapy for children and young adults with relapsed or refractory acute lymphoblastic leukemia. BMC Med Res Methodol. 2019;19:182.
- Cooney P, White A. Direct Incorporation of Expert Opinion into Parametric Survival Models to Inform Survival Extrapolation. Med Decis Making. 2023;43:325–36.
- O’Hagan, A. Expert Knowledge Elicitation: Subjective but Scientific. Am Stat. 2019;73(sup1):69–81.
- Cadham CJ, Knoll M, Sánchez-Romero LM, et al. The Use of Expert Elicitation Among Computational Modeling Studies in Health Research: A Systematic Review. Med Decis Making. 2022;42:684–703.
- Drescher M, Edwards RC. A systematic review of transparency in the methods of expert knowledge use. J Appl Ecol. 2019;56:436–49.
- Oakley JE, O’Hagan A. Sheffield Elicitation Framework [Internet]. The Sheffield Elicitation Framework (SHELF). 2025. Available from: https://shelf.sites.sheffield.ac.
- Oakley JE, Ren S, Forsyth JE, et al. Expert Elicitation For Long-Term Survival Outcomes. Sheffield, UK: University of Sheffield; 2025. Report No.: 26.
Figure 1.
Directed acyclic graphs (DAGs) describing the effect of an intravenous overdose of barbiturates on cardiac output. Green arrow represents an open causal pathway between two variables. Green oval represents the exposure of interest, intravenous overdose of barbiturates, and blue oval represents the outcome, cardiac output.

Figure 2.
Directed acyclic graphs (DAGs) where green arrows represent open direct causal pathways between two variables, while pink arrows represent open non-causal or indirect pathways. Green oval represents the exposure of interest, plain blue ovals represent unadjusted ancestor variables of the outcome, pink ovals represent unadjusted ancestor variables of both the exposure of interest and the outcome of interest, blue oval with black outline represents the outcome, white ovals represent adjusted variables. A) Directed acyclic graph (DAG) of the effect of a particular clinical sign on survival, unadjusted for other demographic and clinical variables. B) DAG of the effect of a particular clinical sign on survival, adjusted for other demographic and clinical variables, and mediated by both the veterinarian’s belief about prognosis and the treatment received. C) DAG of the effect of a particular clinical sign on survival, adjusted for other demographic and clinical variables and treatment received. The interdependency of veterinarian belief about prognosis and treatment is displayed using different timepoints (denoted with T 0, T1,Tn,Tn+1) to show how each variable is affected by the other. Importantly, this DAG is a simplified system, and mediation analyses with real-world data are often more methodologically complex than represented here.
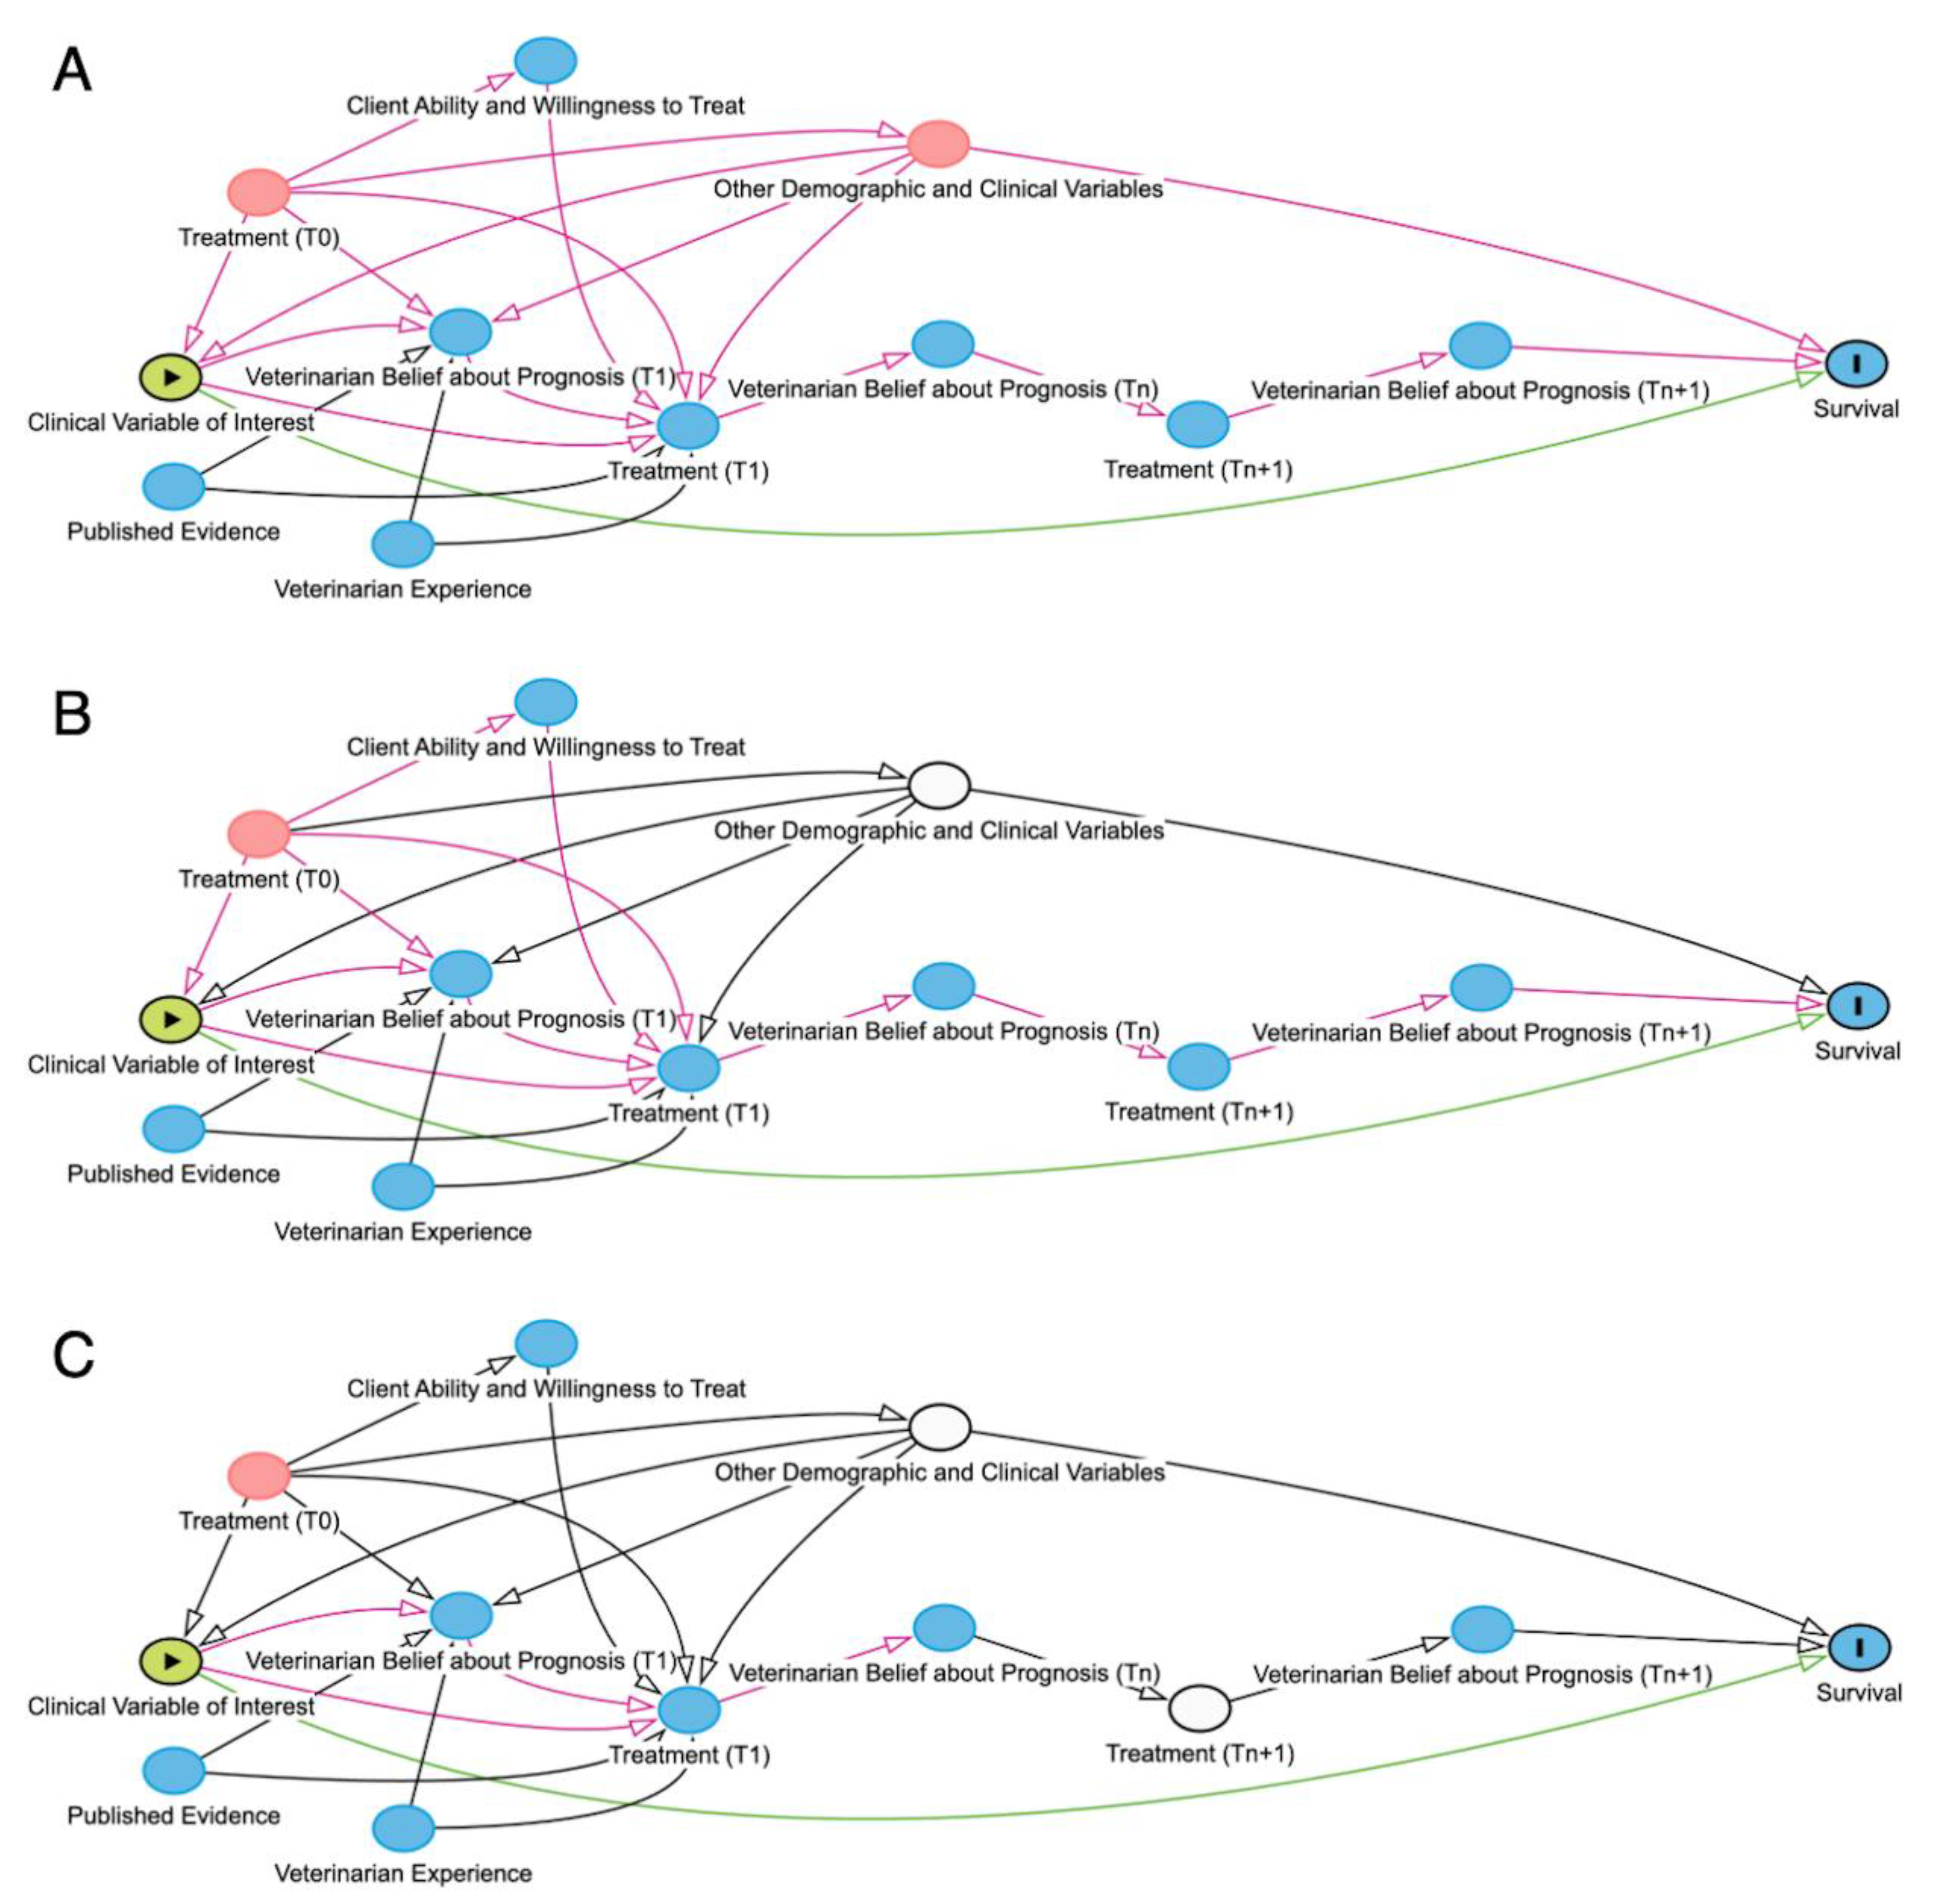
Figure 3.
Directed acyclic graphs (DAGs) where green arrows represent open causal pathways between two variables, while pink arrows represent open non-causal pathways. Green oval represents the exposure of interest, plain blue oval represents unadjusted ancestor variable of the outcome, blue oval with black outline represents the outcome, white ovals represent adjusted variables, white oval with hatched interior represents speculative adjustment method being proposed. A) Directed acyclic graph (DAG) of the effect of a particular clinical sign on survival, adjusted for other demographic and clinical variables and disease process for an animal that either survived or experienced natural death. B) DAG of the effect of a particular clinical sign on survival, adjusted for other demographic and clinical variables and veterinarian belief on prognosis prior to euthanasia (Tn+1) (as though belief about prognosis prior to euthanasia had been recorded in the medical record). C) DAG of the effect of a particular clinical sign on survival, adjusted for other demographic and clinical variables and veterinarian belief on prognosis prior to euthanasia (Tn+1) (adjusted using expert-elicited counterfactual survival probability distributions to weight survival probability in euthanized patients). N.B. This type of adjustment is novel and remains speculative.
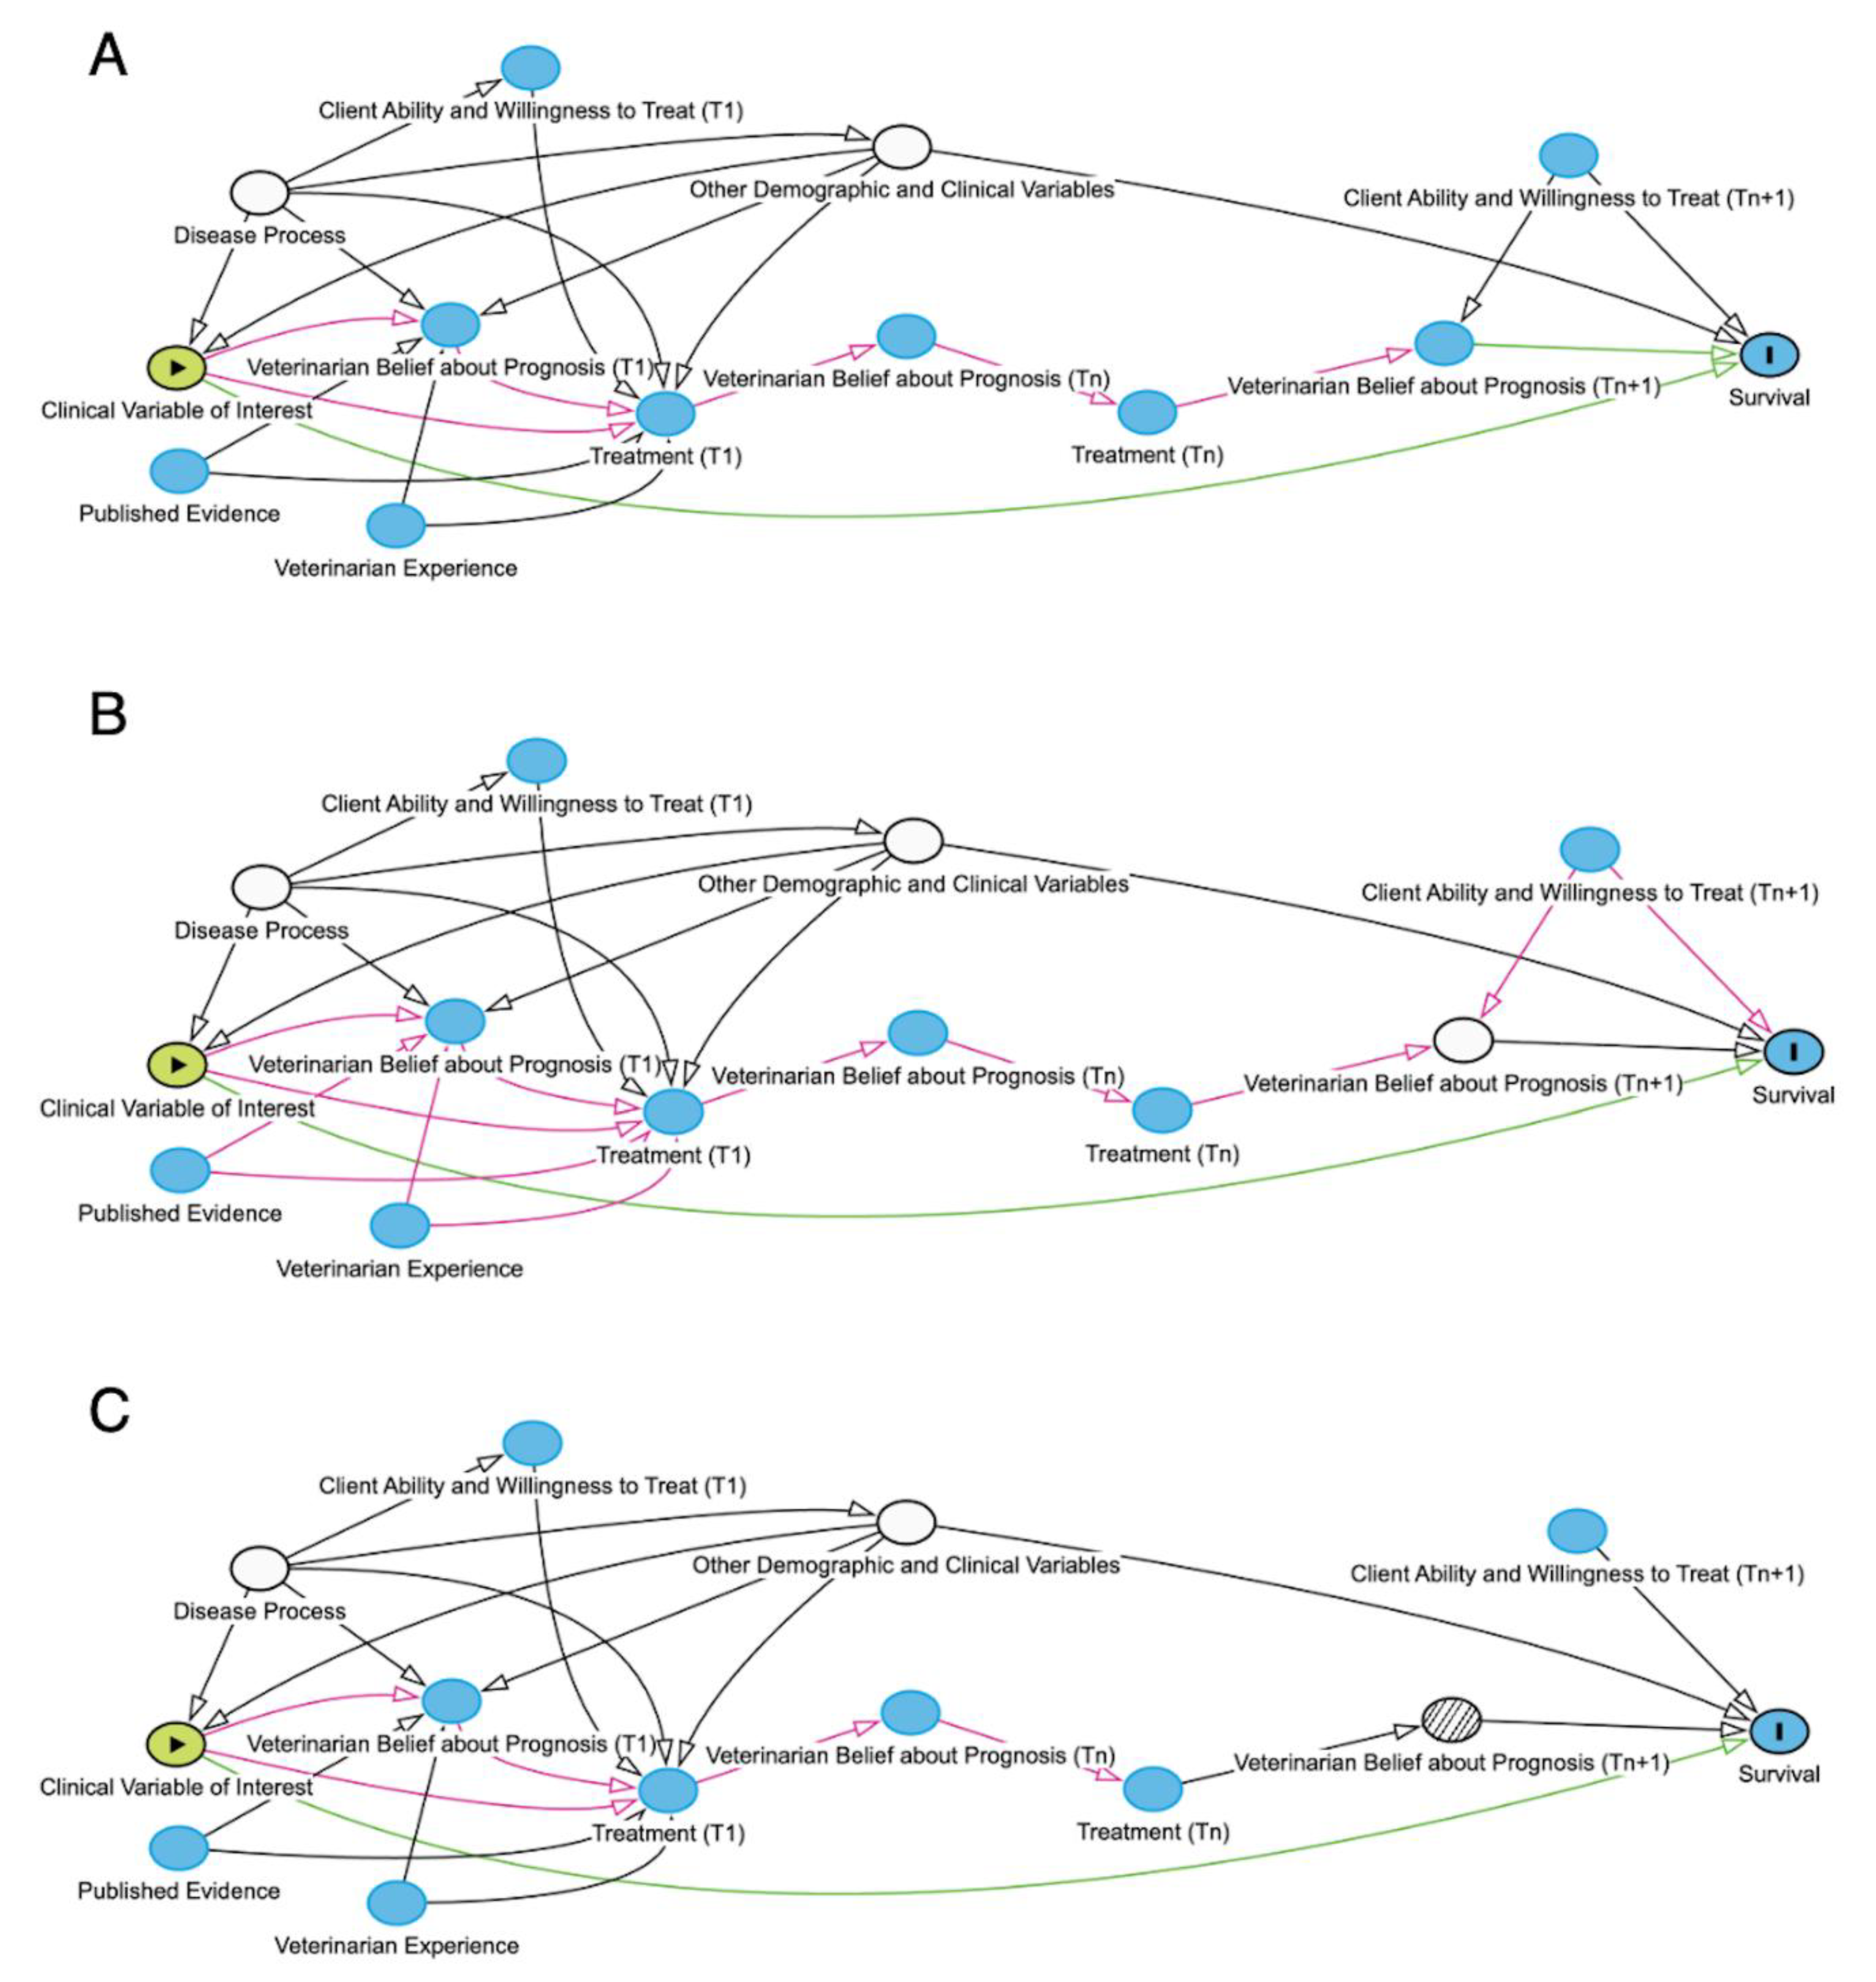

Table 1.
Types of 3-node connections in directed acyclic graphs (DAGs). Green arrows represent open causal pathways between two variables, while pink arrows represent open non-causal pathways. Variables represented include X (exposure), Y (outcome), and Z, which depending on the connection type is a mediator (chain), confounder (fork), or a collider. Arrows represent a proposed causal relation that one variable affects the other. A chain is when three variables are connected in one direction, such as X → Z → Y. A fork is when three variables are connected such that two variables are affected by the third, such as X ← Z → Y. A collider is when three variables are connected such that one variable is affected by the other two, such as X → Z ← Y. Example is derived from a hypothetical study aimed at identifying causal link between housing status (indoor-only vs. indoor-outdoor) and two-year survival in cats with chronic kidney disease (CKD). Additional details may be found in the accompanying text.
| Types of Connections | Conceptual | Example | Interpretation |
|---|---|---|---|
| Chain | 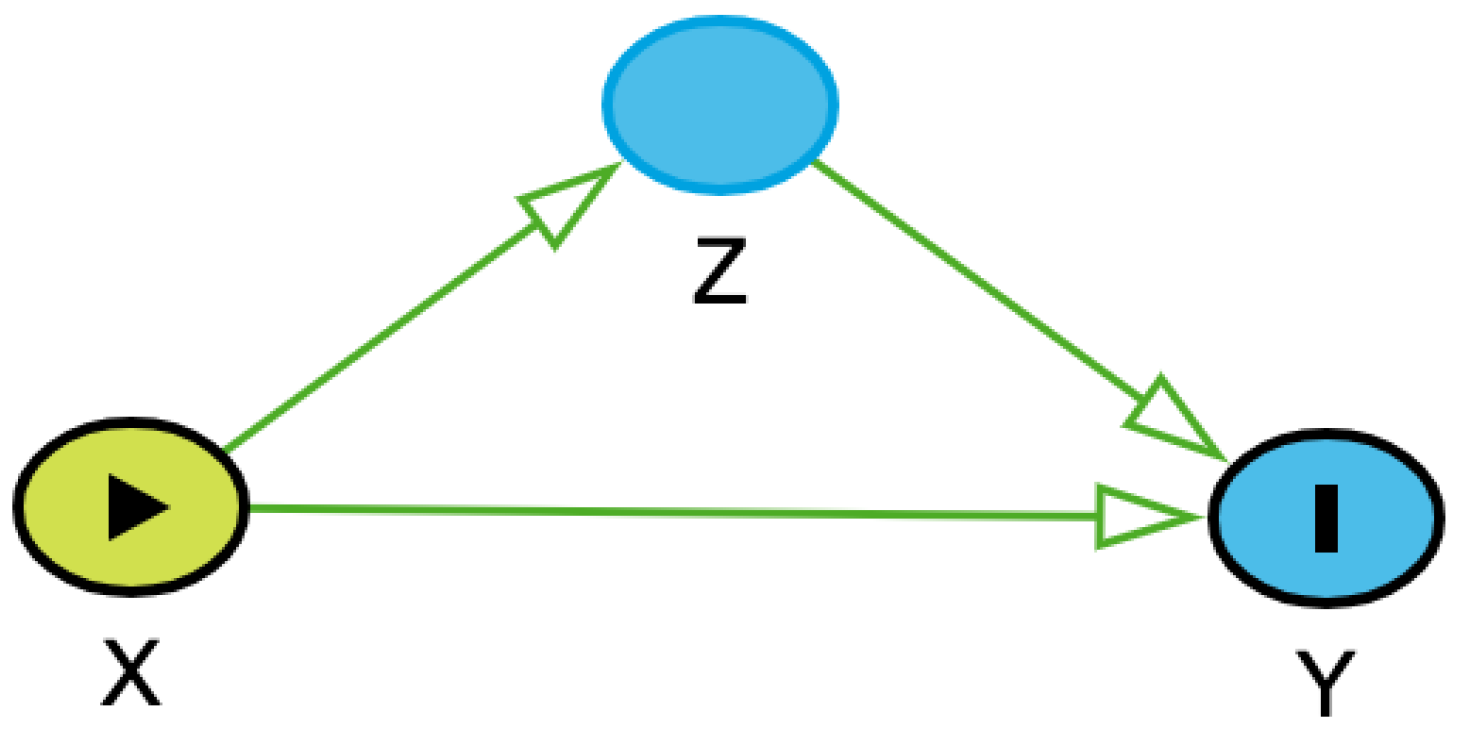 |
 |
The occurrence or value of X affects the probability or value of Y, and X also affects the probability or value of Z, which affects the probability or value of Y. Z is along the causal pathway of X to Y. No adjustment for Z is necessary, unless the aim is to assess the direct effect of X on Y. |
| Fork | 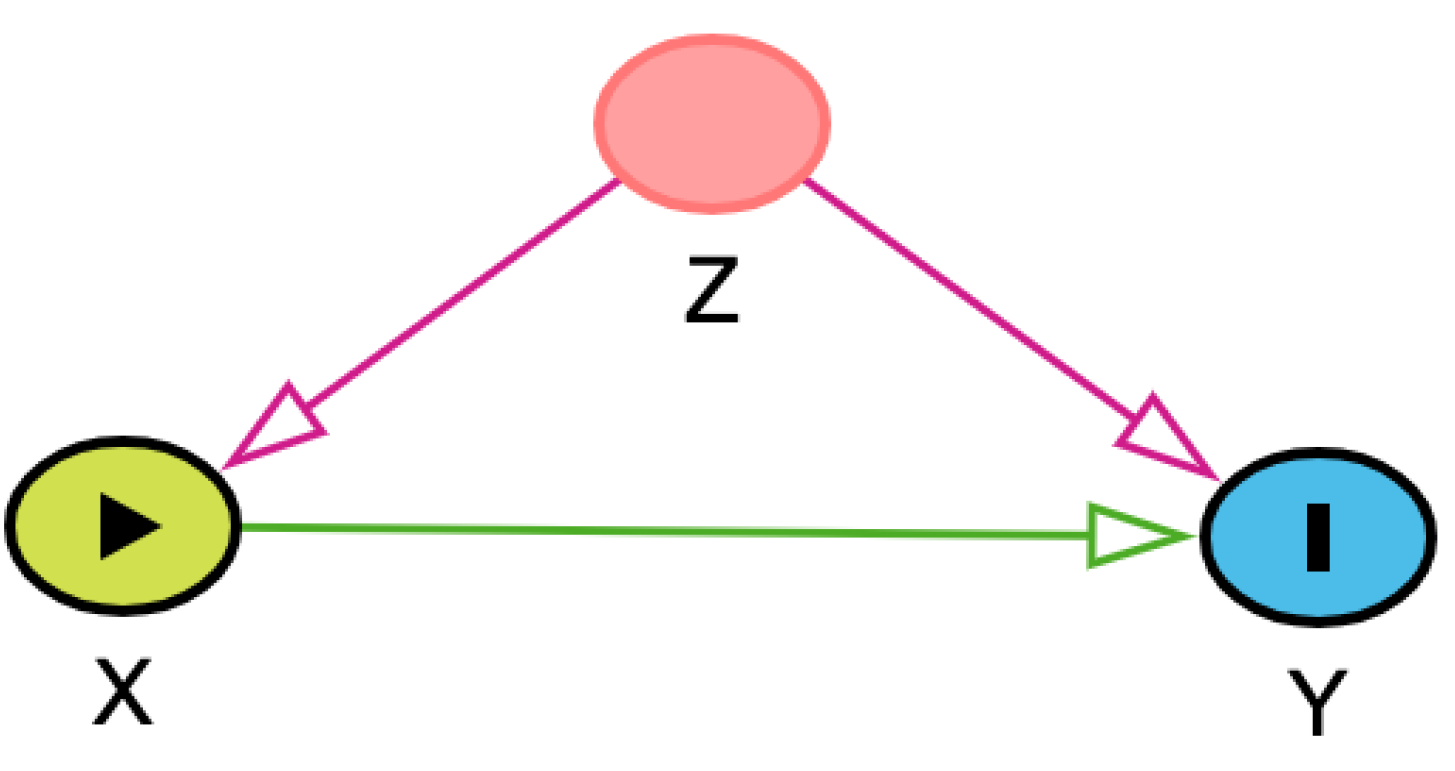 |
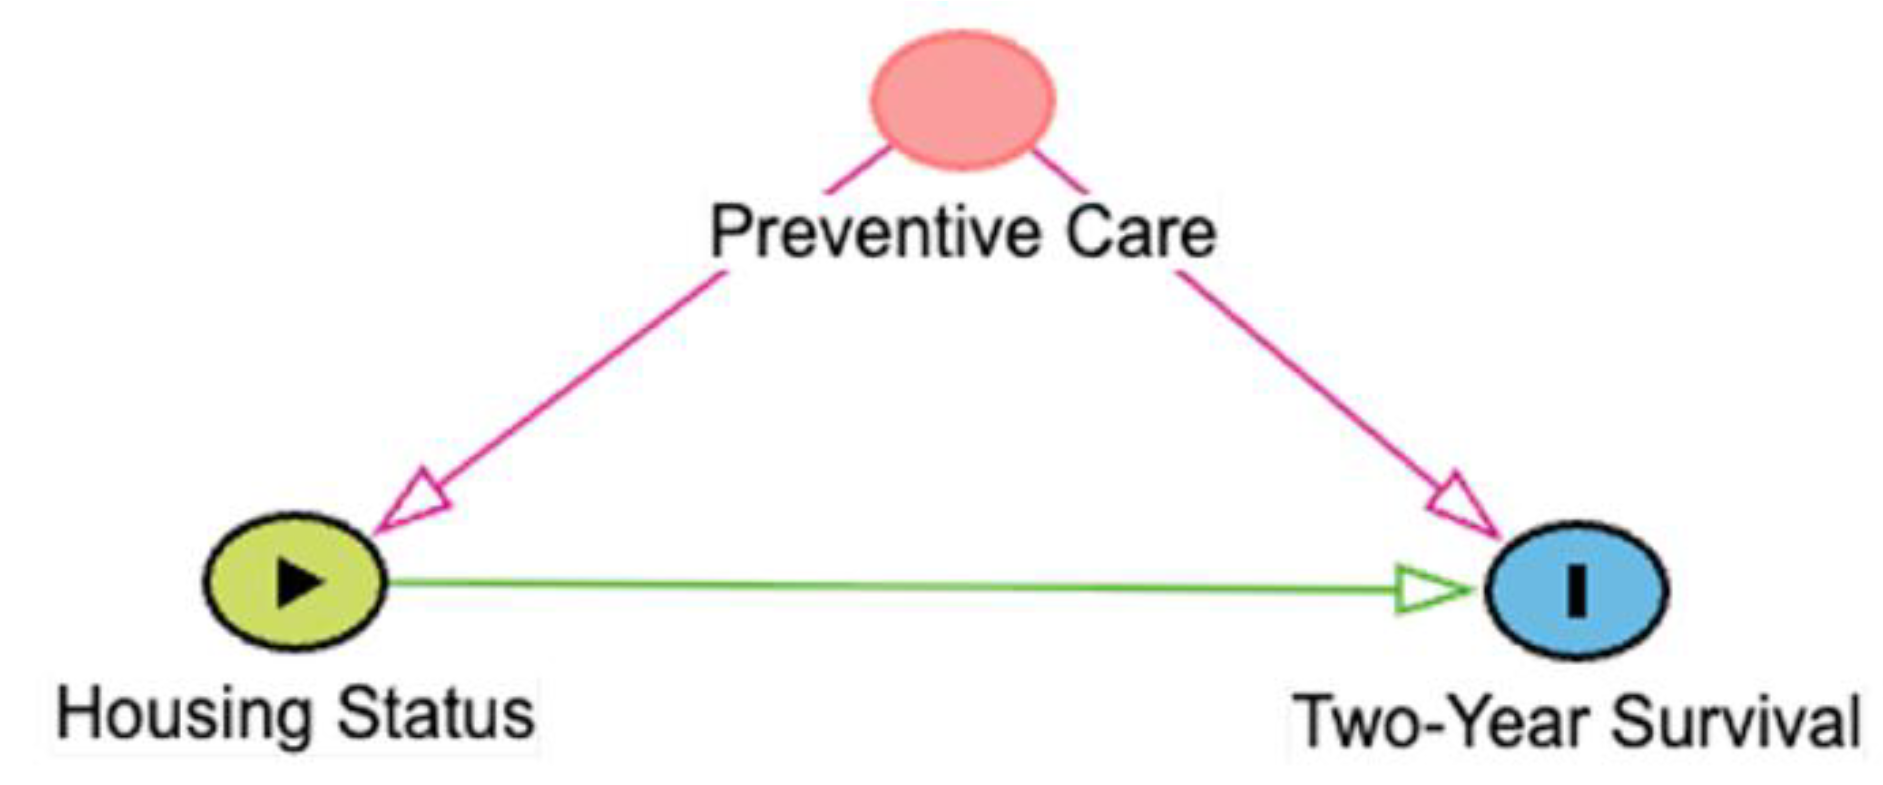 |
The occurrence or value of Z affects the probability or value of both X and Y, ie, it is a confounder. When Z is not adjusted for in statistical analysis, an “open” non-causal pathway exists between X and Y. Adjustment for Z is necessary to estimate the effect of X on Y. |
| Collider | 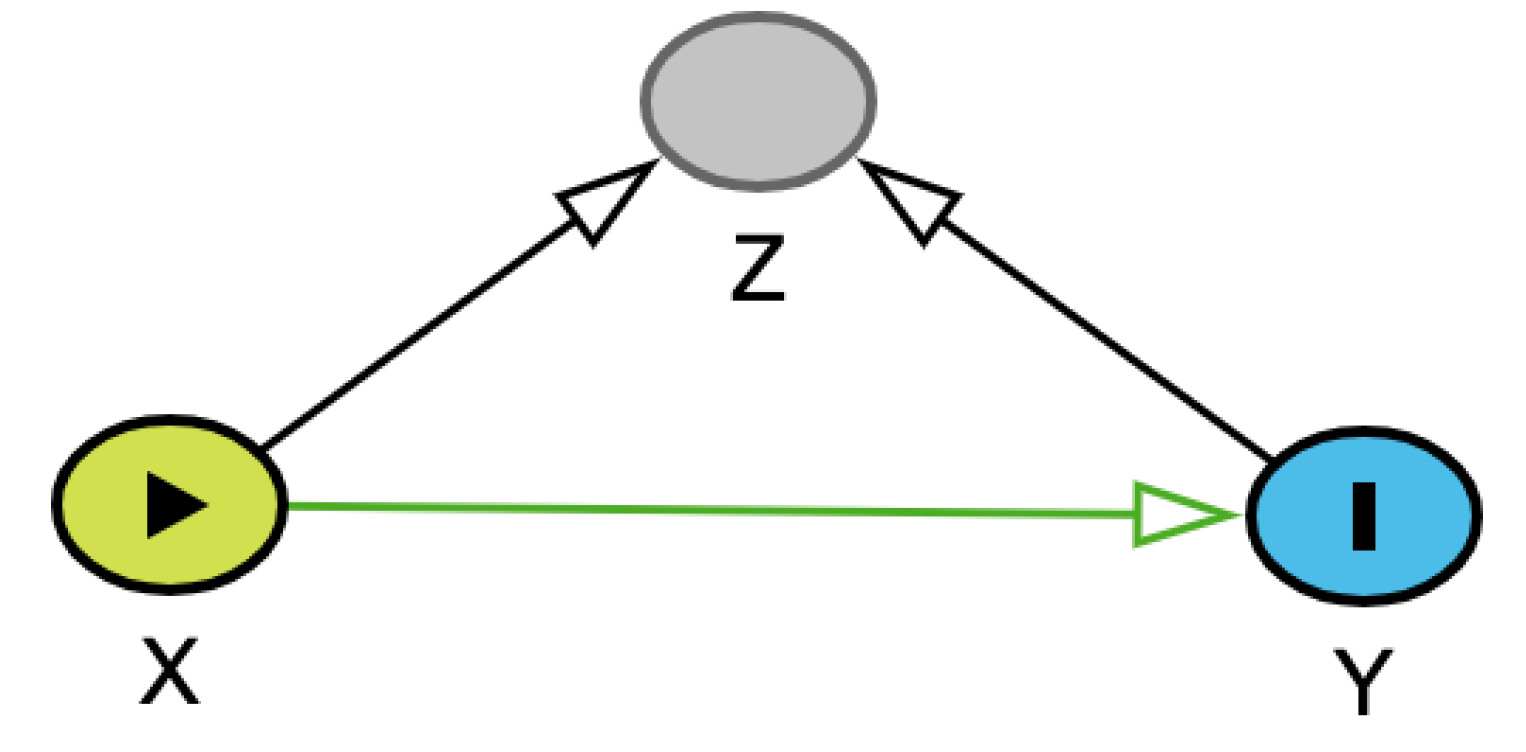 |
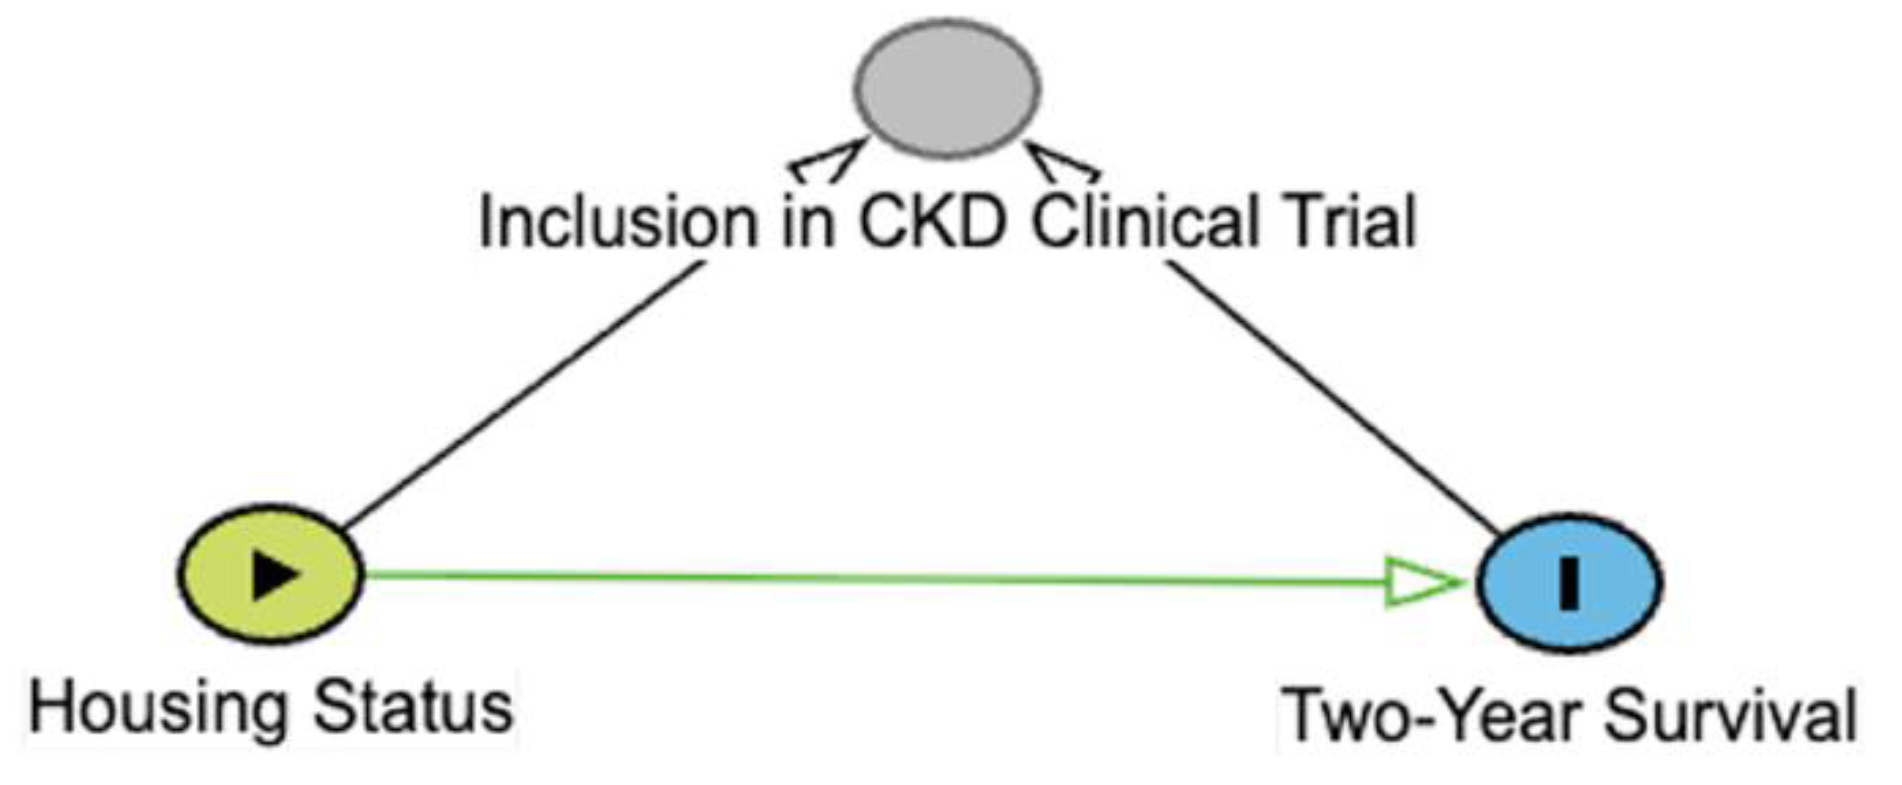 |
The probability or value of Z is affected by occurrence or values of both X and Y, ie, it is a collider. When Z is left unadjusted, there is no “open” non-causal pathway. Adjustment for or selection into study conditioned on Z is contraindicated and doing so distorts the effect of X on Y. |
Disclaimer/Publisher’s Note: The statements, opinions and data contained in all publications are solely those of the individual author(s) and contributor(s) and not of MDPI and/or the editor(s). MDPI and/or the editor(s) disclaim responsibility for any injury to people or property resulting from any ideas, methods, instructions or products referred to in the content. |
© 2025 by the authors. Licensee MDPI, Basel, Switzerland. This article is an open access article distributed under the terms and conditions of the Creative Commons Attribution (CC BY) license (http://creativecommons.org/licenses/by/4.0/).
Copyright: This open access article is published under a Creative Commons CC BY 4.0 license, which permit the free download, distribution, and reuse, provided that the author and preprint are cited in any reuse.


