Submitted:
12 September 2025
Posted:
16 September 2025
You are already at the latest version
Abstract
The Jinsha River Basin, spanning Sichuan, Tibet, and Yunnan provinces, is a typical mountain–valley composite region characterized by complex and heterogeneous topography. To quantitatively assess the effects of topographic factors on land-use patterns, this study selected the Zhaotong section as the research area and employed Geographic Information System (GIS) technology to integrate administrative boundary data with high-resolution digital elevation models (DEM). Land-use categories were reclassified and analyzed in relation to elevation, slope, and aspect through GIS-based spatial statistics and gradient analysis. The results reveal that: (1) Elevation strongly stratifies land use. Below 2000 m, cropland dominates (42.7%), while above 2500 m natural land types prevail, including grassland (36.4%), shrubland (21.8%), and forestland (31.2%), with cropland and built-up land both falling below 10%. (2) Slope exerts the most critical influence. On gentle slopes (< 5°), cropland accounts for 48.5%, whereas at slopes >25°, grassland expands sharply to 54.2%, accompanied by significant increases in shrubland and forestland. (3) Aspect analysis indicates that cropland is more common on sunny slopes (19.6%) than shady slopes (15.8%), while grassland is more prevalent on shady slopes (37.4%). Built-up land, although below 2% overall, is concentrated in low-elevation, gentle-valley zones. Beyond topographic controls, the study employed GIS-supported models of coordination, coupling, and responsiveness to analyze human–land relationships and land-use evolution from 2016 to 2023. The findings suggest that guiding cropland consolidation toward low-slope areas, restricting slope cultivation, and strengthening the protection of high-altitude ecological land are essential strategies for optimizing ecological security and promoting sustainable land use in the Zhaotong section of the Jinsha River Basin.
Keywords:
GIS
; land-use pattern
; Jinsha River Basin
; elevation gradient
; slope differentiation
; aspect effect
; humanland relationship
; DEM-based spatial analysiss
1. Introduction
Land use represents a key interface of human–environment interactions, reflecting the continuous or periodic utilization of natural attributes to achieve economic and social objectives [1,2,3]. Its spatial configuration and temporal evolution have profound impacts on ecosystem stability, as well as the carrying capacity of regional resources and the environment. Among the various drivers, topographic factors act as fundamental controls of land-use distribution by regulating soil fertility, water availability, solar radiation, and vegetation types [4,5,6,7]. Distinct topographic units not only govern natural processes such as soil erosion and vegetation succession but also strongly influence human activities and land development. For instance, plains with flat terrain and abundant water resources often serve as concentrated zones of cropland and construction land, whereas steeply sloping mountainous and hilly areas are more prone to soil erosion and thus limit agricultural and urban development [8,9,10].
Globally, increasing attention has been devoted to examining how topographic factors shape land-use distribution, facilitated by advances in geographic information systems (GIS) and remote sensing technologies [11,12,13]. Previous studies have demonstrated that different landform types exhibit distinct land-use characteristics and emphasized the dominant role of terrain in shaping regional patterns. Terrain classification based on environmental parameters has been combined with land-use/cover datasets to explore the coupling between topographic categories and land-use types, offering new theoretical insights into terrain-driven land-use evolution [14,15,16,17]. In addition, spatial analyses have revealed significant correlations between terrain differentiation and land-use distribution, highlighting the roles of slope and aspect in constraining agricultural development and influencing ecosystem dynamics [18]. Empirical research has further demonstrated that slope exerts a strong influence over the spatial allocation of cropland, forestland, and grassland, while aspect indirectly affects vegetation cover types by regulating solar radiation and thermal conditions [19]. More recent work has also emphasized the coupling mechanisms between natural terrain and socio-economic activities, underscoring the differentiated land-use structures in mountainous and hilly regions [20,21,22,23].
Although considerable progress has been made, most existing studies have concentrated on relatively homogeneous geomorphic units or large-scale regions. High-relief mountainous gorge areas, where elevation gradients, slope variability, and aspect effects are compounded by hydrological processes and human activities, remain insufficiently investigated [24,25,26,27]. In such environments, land-use patterns are governed by complex multi-factor interactions that cannot be fully explained by simplified models. In particular, the middle reaches of the Jinsha River, such as the Zhaotong section, represent a typical high-relief mountainous gorge region where systematic and quantitative analyses of terrain-driven land-use distribution are still scarce. This study aims to address these gaps by quantitatively examining the influence of topographic factors on land-use distribution in the Zhaotong section of the Jinsha River Basin. Using a digital elevation model (DEM), three representative terrain parameters—elevation, slope, and aspect—are extracted and integrated with current land-use data. The objective is to determine the spatial relationships between terrain characteristics and land-use types, elucidating the regulatory roles of topographic differentiation in shaping the distribution of cropland, forestland, grassland, shrubland, and construction land. The findings are expected to enhance understanding of human–land coupling mechanisms in complex terrain regions and provide practical insights for ecological security planning and land resource management in the upper Jinsha River Basin.
2. Geological Conditions in the Study Area
The Zhaotong section of the Jinsha River Basin is located in the northeastern part of Yunnan Province and constitutes an important part of the right bank of the lower Jinsha River. Geographically, the area lies at the junction of Yunnan, Guizhou, and Sichuan Provinces, within the core of the Wumeng Mountain region, and holds considerable strategic significance. Zhaotong City governs one district and ten counties, covering a total area of 23,021 km², with an east–west span of 241 km and a north–south width of 234 km. It is the last prefecture-level administrative region traversed by the Jinsha River in Yunnan. The Zhaotong section faces several counties in Sichuan Province across the river, including Pingshan, Yibin, Leibo, Jinyang, and Ningnan, demonstrating a cross-provincial geographic interconnection. The local riverbank stretches nearly 45 km and includes several major reservoir segments: approximately 157 km of the Xiangjiaba Reservoir, 2 km of the Xiluodu Reservoir, and approximately 1.7 km of the Baihetan Reservoir in Qiaojia County. These geographic features not only establish the Zhaotong section as a key component in the spatial configuration of the Jinsha River Basin but also exert profound influences on land resource utilization and the regional ecological environment. The landscape is highly diverse, comprising mountains, gorges, basins, and plateaus. Pronounced topographic relief and sharp altitudinal gradients have resulted in remarkable spatial heterogeneity of land use. The distribution of cropland, forestland, grassland, and construction land varies significantly across geomorphic units, highlighting the fundamental role of topographic factors in shaping land-use patterns.
As shown in Figure 1, Zhaotong city lies in the transitional zone between the southeastern margin of the Tibetan Plateau and the Yunnan–Guizhou Plateau, characterized by strong relief and complex mountain systems. The maximum elevation difference reaches 4,006 m, resulting in a typical geomorphic pattern of alternating alpine gorges and stepped plateaus. The region encompasses diverse landform types, including mountains, gorges, plateaus, basins, karst, and Danxia landforms, each exerting distinct influences on land-use modes. For example, gorge landscapes, constrained by steep slopes and soil erosion risks, limit large-scale agricultural development; in contrast, plateaus and basins, with relatively gentle terrain and favorable hydrothermal conditions, provide suitable environments for cropland and construction land. Karst and Danxia landforms, characterized by shallow soils and fragile ecosystems, are more suitable for forest and grassland distribution.
Climatically, the region experiences a subtropical monsoon climate with four distinct seasons, featuring hot and rainy summers and mild, dry winters. The mean annual temperature is approximately 28 °C, with extreme highs reaching 35 °C. Annual precipitation averages 1,300 mm, but its spatial and temporal distribution is highly uneven: more than 60% falls during summer, while winters remain relatively arid. Hydrologically, the Jinsha River serves as the main trunk stream, with a total length of 2,300 km and a drainage area of 340,000 km². The river is abundant in water resources, with an average flow velocity of approximately 3 m/s. However, due to intensive industrial and agricultural activities in the upper reaches, certain local segments face risks of water pollution.
Overall, the combination of complex landform types and significant altitudinal gradients shapes the macro-scale spatial patterns of land use in the region, while the spatiotemporal variability of climatic and hydrological conditions further drives the dynamic evolution of land utilization. The coupled effects of these natural geographic factors determine that land use patterns in the Zhaotong section exhibit strong spatial heterogeneity and regional adaptability.
3. Materials and Methods
3.1. Methods
Land use classification constitutes the fundamental basis for analyzing land use patterns and spatial distribution characteristics. This study employed the National Land Use Classification System [28], which provides a standardized hierarchical framework dividing land use into five primary categories and fifteen secondary categories. The primary classes include cropland, forest, grassland, water bodies, and built-up land. At the secondary level, further refinements are made, such as shrubland and bare land, to better capture the heterogeneity of land use patterns.
Considering the natural conditions and anthropogenic utilization characteristics of the Zhaotong section of the Jinsha River Basin, this study focused on four primary classes (cropland, forest, grassland, and water bodies) and two secondary classes (shrubland and bare land) as the main objects of analysis. This classification approach ensures both scientific validity and comparability, while also providing a solid basis for examining land use distribution patterns under varying topographic conditions. Specifically, cropland is concentrated in low-elevation valleys and gently sloping basins; forest and grassland coverage increases with elevation; shrubland and bare land occur in steep and arid regions with poor soil fertility; whereas water bodies and built-up land, though limited in extent, exhibit distinct signatures of human disturbance in localized areas.
Through the application of this classification framework, the study systematically investigates the trends of different land use categories along gradients of elevation, slope, and aspect. This enables the elucidation of the mechanisms by which topographic factors drive the evolution of land use patterns in the study area.

Table 1.
Classification of land use types.
| No. | Primary category | Secondary category | No. | Primary category | Secondary category |
| 1 | Grassland | Natural grassland | 3 | Cropland | Paddy field |
| Marsh grassland | Dry land | ||||
| Artificial pasture | 4 | Built-up area | Residential area | ||
| Other grassland | Commercial area | ||||
| 2 | Forestland | Wooded land | 5 | Other land use | Bare land |
| Shrubland | Idle land | ||||
| Field ridge | |||||
| Other forestland | Agricultural facilities Land |
To quantitatively investigate the influence of topographic factors on land use patterns, this study extracted three key topographic variables—elevation, slope, and aspect—using GIS-based spatial analysis from the digital elevation model (DEM) data of the study area. Regarding elevation, the study area was divided into five gradient intervals (258–1000 m, 1000–1500 m, 1500–2000 m, 2000–2500 m, and >2500 m) based on regional terrain variations, aiming to capture the constraints of different altitudinal conditions on land use types. Slope, an important factor affecting soil erosion, agricultural practices, and engineering construction, was expressed in degrees and categorized into five classes (0–2°, 2–6°, 6–15°, 15–25°, and >25°) according to relevant standards [29]. Aspect was classified from the perspective of solar radiation and hydrothermal conditions, dividing slope orientations into nine types to explain variations in land use under different energy environments.
To systematically characterize the correspondence between topographic factors and land use types, a distribution index model was employed. Elevation distribution index (E), slope distribution index (S), and aspect distribution index (A) were calculated to quantitatively describe the degree of concentration of each land use type under varying topographic conditions. The calculation formulas are as follows:
Where Aij, Aik, Ail denote the area of land use type i within elevation interval j, slope class k, and aspect type l, respectively; Aj, Ak and Al denote the total area of the corresponding elevation interval, slope class, and aspect type; n, m and p are the total number of elevation intervals, slope classes, and aspect types considered.
A distribution index greater than 1 indicates that a specific land use type is concentrated in the corresponding topographic condition, whereas a value less than 1 suggests relative dispersion. This approach provides a quantitative framework for assessing how different topographic factors constrain land use patterns.
In the formula, VE, Vs, and VA represent the area of a specific land use type within the ranges of elevation, slope, and aspect, respectively; PE, PS, and PA denote the total land area within the corresponding elevation, slope, and aspect ranges; VC indicates the total area of the land use type across the entire study region, and P represents the total land area of the study region. When the index value approaches or is less than 1, it indicates that the terrain factor has a limited influence on the distribution of the land use type; conversely, values greater than 1 suggest a significant preference for the land use type in specific topographic conditions. This approach not only reveals the differential influence of various terrain factors on the spatial patterns of land use but also provides a theoretical and methodological basis for quantitatively analyzing the terrain-driven mechanisms.
The human activity pressure on the land in Zhaotong City is evaluated using P. Here, the land area represents elements of the natural environment, whereas the total population and the regional gross domestic product (GDP) represent elements of human activities. The ratio between these factors reflects the current state of the human–land relationship. The specific calculation is as follows:
In the formulas, P represents the pressure coefficient of human activities on land in Zhaotong City, which is used to evaluate the degree of tension in the human–land relationship, H denotes the pressure from human activities on land in Zhaotong, and L indicates the carrying capacity of land resources in the Zhaotong region. The human activity pressure H generated by land use is calculated as follows:
where P1 is the ratio of population density in Zhaotong to that of Yunnan Province, and P2 is the ratio of economic density in Zhaotong to that of Yunnan Province, with economic density measured using the gross domestic product (GDP).
The formula for calculating the land resource carrying capacity L in Zhaotong is expressed as follows:
where RFi is the reference indicator of land use type i in the study unit, NFi is the corresponding reference indicator for the same land use type in Zhaotong, fi denotes the area of land use type i in the study unit, t is the total land area of the study unit, Fi represents the total area of land use type i in Zhaotong, and T is the total land area of the entire Zhaotong region.
3.2. Data Sources
The land use data employed in this study cover the Zhaotong section of the Jinsha River Basin from 2016 to 2023 (Figure 2). These data were obtained from the national land use classification database publicly released by Wuhan University, with a spatial resolution of 10 m. Such high-resolution data enable a detailed representation of the spatial patterns of land use within the study area.
To ensure scientific rigor and spatial accuracy, the land use classification dataset was first imported into a GIS platform and overlaid with the boundary layer of the study area. Redundant information beyond the study boundary was removed using spatial analysis techniques such as masking and clipping, resulting in a land use classification map that fully covers the Zhaotong section. The dataset encompasses multiple land use categories, including cropland, forests, grassland, water bodies, built-up land, and unused land. These categories reflect not only the allocation of natural resources shaped by environmental conditions but also the impact of socio-economic activities on land resource utilization. The refined extraction and classification of land use types provide a robust data foundation for subsequent terrain factor analyses, particularly in exploring the differentiation of land use under varying elevation, slope, and aspect conditions. Compared with conventional medium- and low-resolution data, this database offers substantial advantages in spatial detail and classification accuracy, thereby enhancing the scientific reliability and credibility of the spatiotemporal analysis of land use patterns presented in this study.
4. Influence of Topography and Human–Land Relationships on Land Use Spatial Patterns
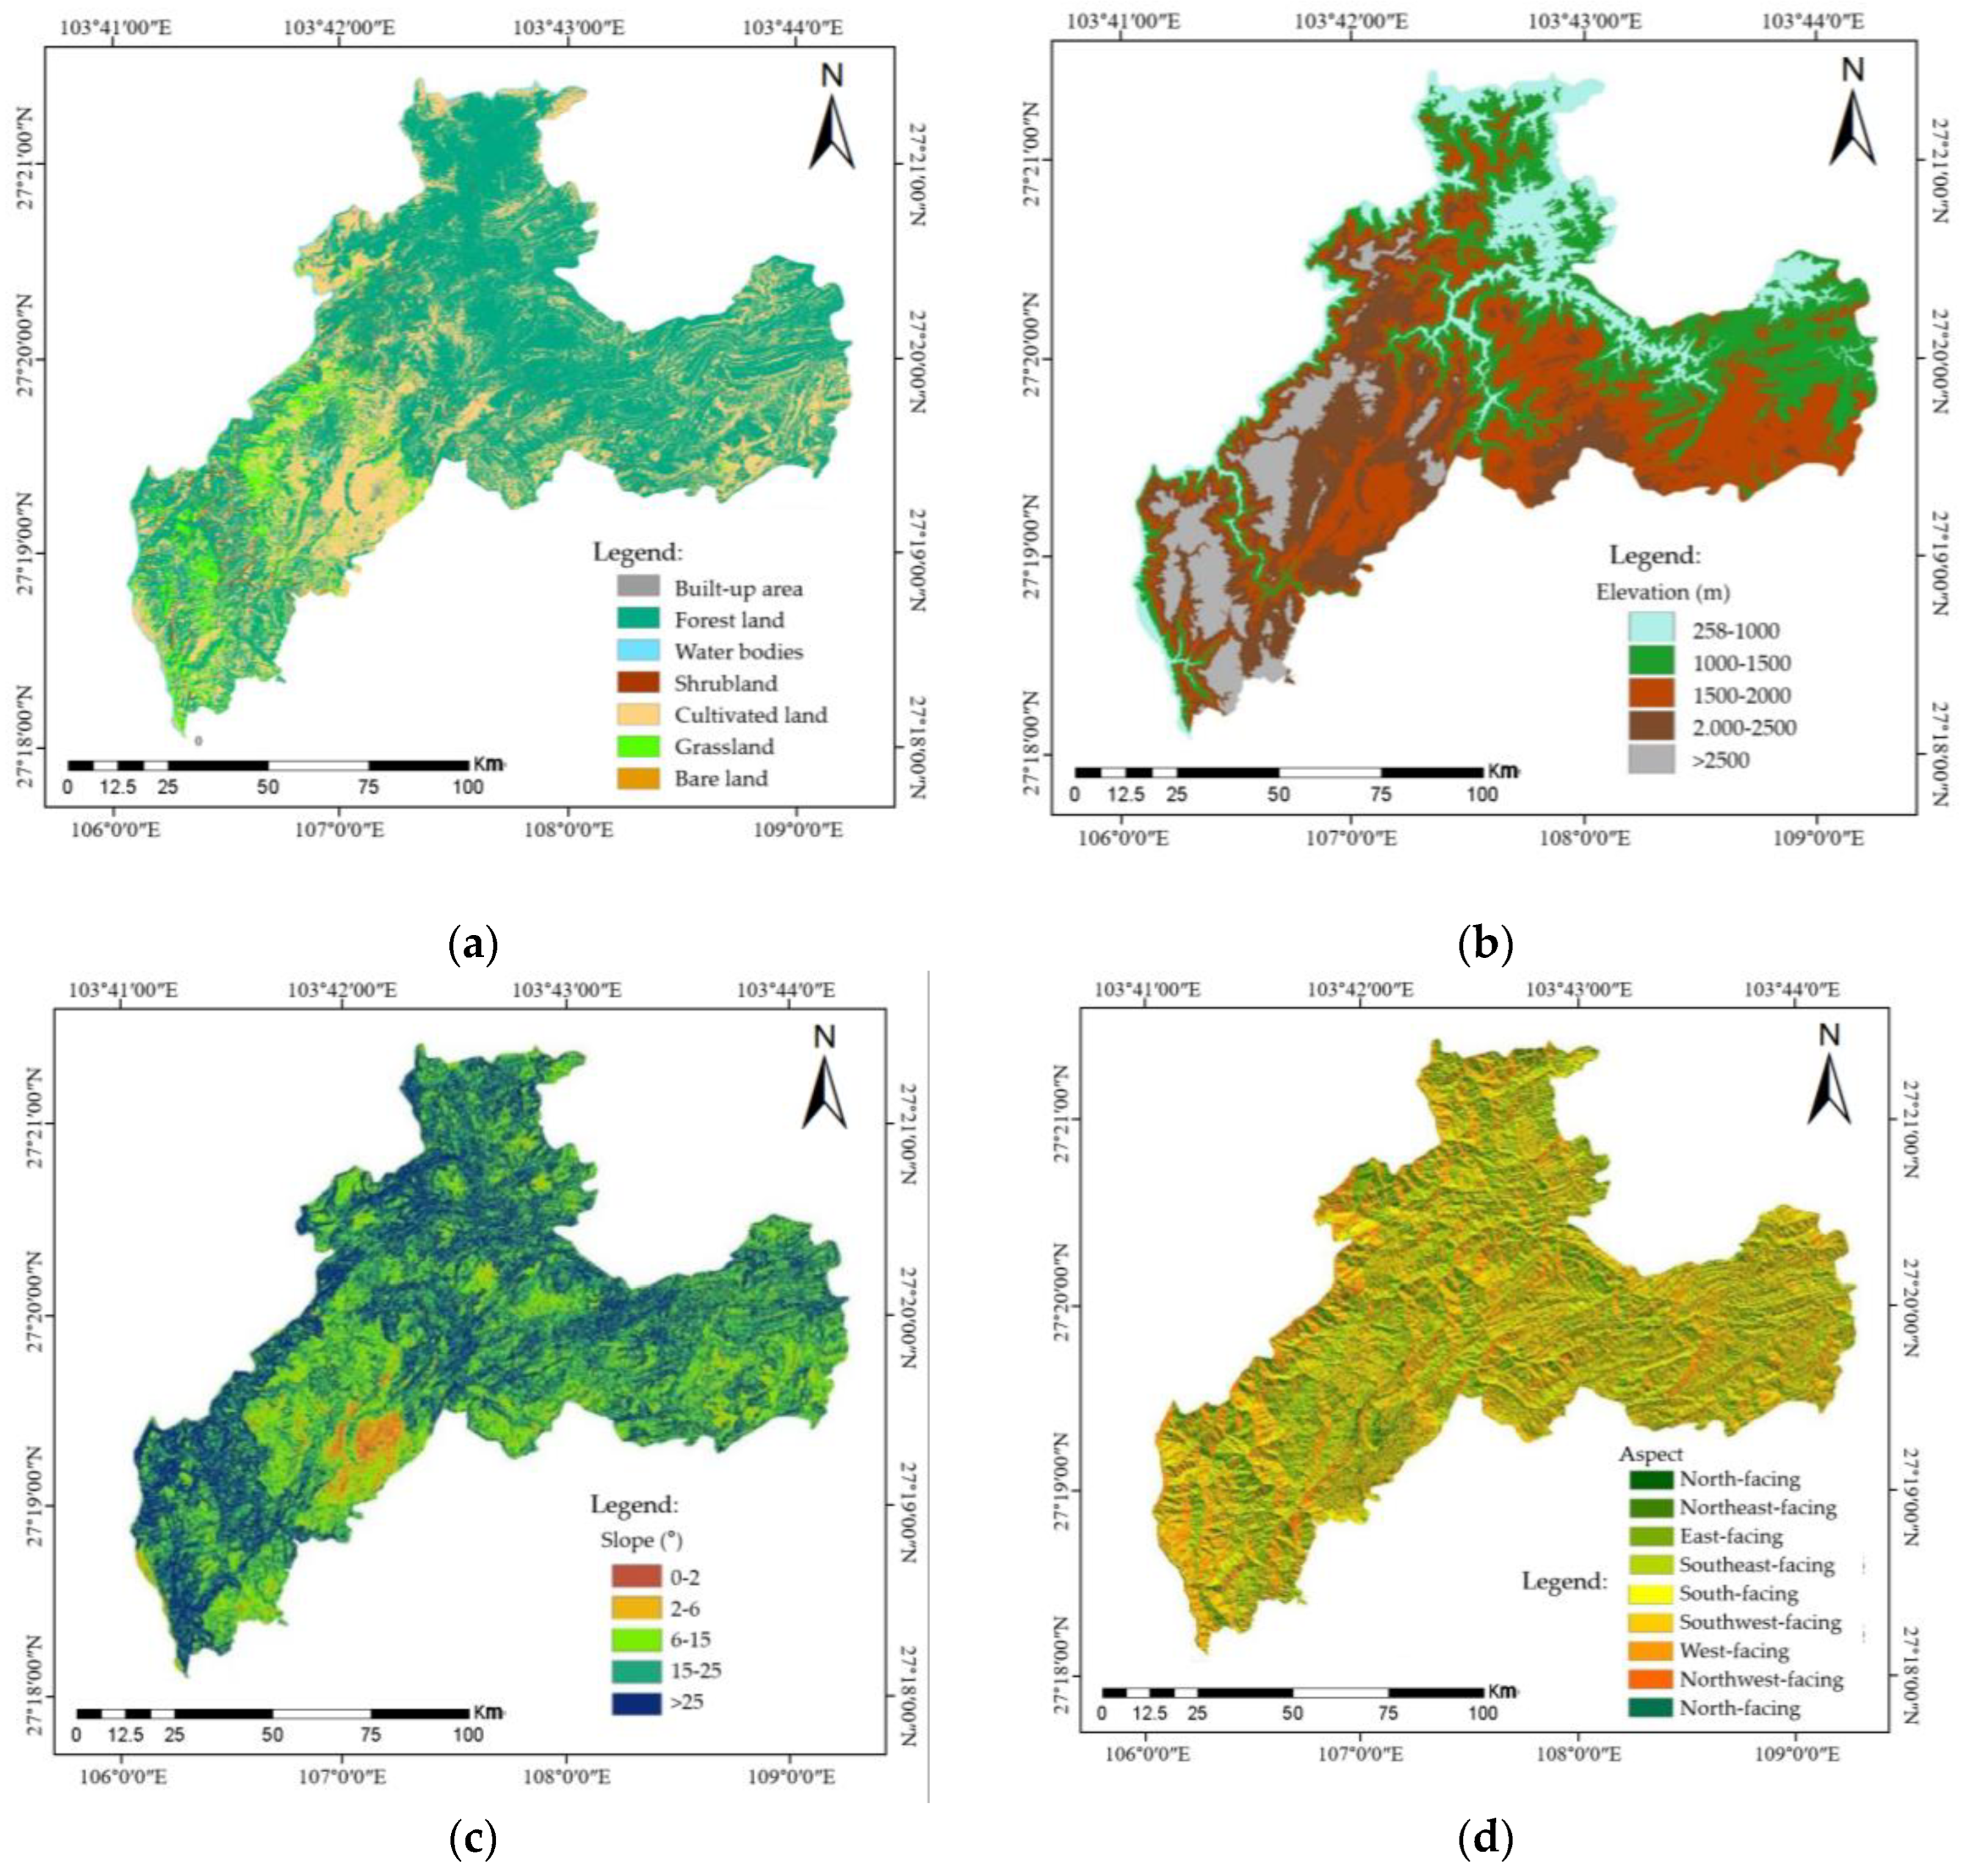
In this study, a hierarchical statistical approach was employed to examine the effects of topographic factors—elevation, slope, and aspect—on land use patterns within the watershed. Major land use types, including cropland, forest, grassland, shrubland, urban areas, and bare land, were quantified in terms of their proportion across different elevation intervals. This analysis revealed the distribution patterns of various land use types along elevation gradients (Figure 2).
Elevation is recognized as a critical natural factor influencing land use patterns and ecological distribution in geographical and land use studies. By rasterizing the converted land use data and overlaying it with a digital elevation model (DEM) stratified by elevation levels, this study systematically characterized the spatial distribution of different land use types across elevation gradients in the Jinsha River Basin (Zhaotong section). The results indicate significant differences in the distribution of land use types at varying elevations, showing distinct increasing or decreasing trends along the elevation gradient. These variations not only reflect the constraining effects of natural topography on land use but also reveal the intensity of human activities and land use preferences across different altitudinal zones.
Figure 2.
Classification and spatial distribution of land use and topographic factors in the Jinsha River Basin (Zhaotong section): (a) land use types; (b) elevation classification; (c) slope classification; (d) aspect classification.
Figure 2.
Classification and spatial distribution of land use and topographic factors in the Jinsha River Basin (Zhaotong section): (a) land use types; (b) elevation classification; (c) slope classification; (d) aspect classification.
4.1. Relationship Between Topography Factors and Land Use
4.1.1. Relationship Between Elevation and Land Use
According to the variation patterns presented in Table 2, the proportion of certain land use types exhibits a consistent increasing trend with rising elevation. Grassland, as a representative example, shows a marked increase in area percentage as elevation increases, indicating a pronounced spatial advantage in high-altitude regions. This pattern is closely associated with both natural topographic conditions and characteristics of human activities. High-altitude areas generally feature rugged terrain and steep slopes, which constrain large-scale agricultural cultivation and urban development. Consequently, the distribution of cropland and built-up areas is limited, whereas grasslands, owing to their strong ecological adaptability, can thrive in regions with shallow soils, lower temperatures, and relatively limited water availability, leading to their extensive presence at higher elevations.
Moreover, the continuation and development of traditional pastoral practices in alpine and mountainous grasslands have further contributed to the expansion of grassland coverage. Therefore, the observed increase in grassland area with elevation reflects not only the selection imposed by natural environmental conditions but also the adaptation of human land-use strategies to these environmental constraints.
Another type of pattern is characterized by an initial increase followed by a decrease with rising elevation, reaching a maximum within a certain elevational range before gradually declining. Cropland and forestland are typical examples of this pattern. The study found that both cropland and forestland are predominantly concentrated in low to low–mid elevation zones, with a pronounced presence at approximately 1000 meters, but gradually decrease at higher elevations. This distribution reflects the concentration of human activities in low-elevation areas. Such areas generally feature relatively flat terrain and favorable hydrothermal conditions, making them preferred regions for agricultural production and human settlements; consequently, cropland is extensively distributed within this range. Meanwhile, the distribution of forestland is influenced by human logging and vegetation degradation. In low to low–mid elevation zones, high population density and intensive economic activities have led to a certain degree of reduction in forested areas. At higher elevations, however, forest growth is constrained by climatic and soil conditions, resulting in a declining trend in forestland coverage. This pattern not only highlights the limiting effects of natural environmental factors on forest growth but also underscores the significant influence of human activities on the spatial distribution of cropland and forestland.
4.1.2. Relationship Between Slope and Land Use
As a key topographic factor, slope significantly influences the distribution and dynamics of land use types. Different slope conditions not only determine soil thickness, erosion intensity, and water retention capacity, but also directly affect the potential for human utilization and the suitability of ecosystems. Based on the existing land use data, this study overlaid the land use map with a slope classification map and statistically analyzed the proportion of each land use type across different slope gradients. This approach reveals the spatial distribution patterns of land use types along slope gradients (Table 3). The results indicate that cropland, forestland, grassland, built-up areas, shrubs, and bare land exhibit distinct differentiation under varying slope conditions, reflecting the coupled effects of natural constraints and human activities. Quantitative analysis using slope distribution indices further highlights the dominance of specific land use types and provides a scientific basis for the rational development and conservation of regional land resources.
Table 3 presents the area and percentage of each land use type under different slope categories in 2023. Overall, forest area tends to increase with slope, demonstrating a strong adaptability to terrain variation. Forests are not confined to low-slope plains but are also widely distributed across hills, plateaus, and mountainous regions. This adaptability is largely due to the strong soil and water conservation functions of forest vegetation, which allow stable ecosystem maintenance even on steep slopes. In contrast, shrubs display considerable flexibility and adaptability, without a clear positive or negative correlation with slope. Shrubs can thrive in low-slope alluvial plains or terraces as well as in steep mountains and valleys, reflecting their tolerance to variations in soil depth, slope conditions, and hydrological and thermal environments. This adaptability enables shrubs to occupy ecological niches that are not fully covered by forests and grasslands. Built-up areas, however, exhibit a strong slope constraint. The study finds that urban and rural settlements are predominantly located on gentle slopes, with the proportion of their area declining rapidly as the slope increases. This distribution pattern aligns with human preference for flat terrain, as steep slopes increase construction costs, geohazard risks, and infrastructure planning challenges. Similarly, cropland is mainly concentrated on low slopes of 0–15°, which are favorable for irrigation, mechanized farming, and soil fertility maintenance. Beyond this slope range, the proportion of cropland gradually decreases, highlighting the high dependency of agricultural activities on topographic conditions.
4.1.3. Relationship Between Aspect and Land Use
Aspect, the directional orientation of a slope surface, is a critical topographic factor influencing microclimate, soil moisture, and soil development. In mountainous and hilly regions, aspect affects solar radiation, soil temperature, evapotranspiration, and vegetation growth, which in turn indirectly shape the spatial distribution of land use types. In this study, land use types were overlaid with an aspect classification map, and the proportions of areas under different aspect conditions were calculated. Aspect distribution indices were further computed to quantify the spatial dominance of each land use type (Table 4).
The results show that, overall, there is little difference between sun-facing and shaded slopes in land use patterns, although minor variations are observed in the distribution of cropland, forests, and shrubs. These findings provide quantitative evidence of the sensitivity of regional land use to aspect, reflecting the interactions between natural environmental conditions and human activities. Specifically, grassland areas on sun-facing and shaded slopes are 749.58 km² and 535.96 km², accounting for only 0.07% and 0.05% of the total area, respectively, indicating negligible spatial differentiation in relation to aspect. Cropland covers 3960.13 km² on sun-facing slopes (0.35%) and 3044.88 km² on shaded slopes (0.26%), suggesting that sun-facing slopes are relatively more suitable for cultivation. This may be attributed to higher solar radiation, elevated temperatures, faster soil moisture evaporation, and earlier snowmelt in spring, all of which promote crop growth and facilitate agricultural operations. Conversely, shaded slopes, characterized by lower light, cooler temperatures, and higher humidity, limit cropland distribution. However, forests and certain natural vegetation types, such as shrubs, can maintain relatively stable distributions on shaded slopes.
4.1.4. Relationship Between Aspect and Land Use
Further quantitative analysis of land use patterns across different elevation, slope, and aspect classes was conducted using the distribution indices defined in Equations (1) and (2), with the results summarized in Table 5. The findings indicate that in the low-elevation range of 258–1000 m, cropland and forestland exhibit absolute dominance (E > 1), suggesting that agricultural activities and forest cover are the primary land uses in these areas. In contrast, grassland, shrubland, and built-up areas have distribution indices slightly below 1, indicating relatively limited presence, while bare land is almost absent. In the mid- to high-elevation range of 1000–2500 m, cropland maintains a moderate advantage (E > 1), whereas forestland reaches absolute dominance, reflecting the substantial expansion of forested vegetation at higher elevations. Grassland and shrubland, although present, do not show significant dominance. In areas above 2500 m, cropland and forestland continue to dominate, while built-up areas and bare land are entirely absent. These patterns reveal a clear altitudinal transition in land use: with increasing elevation, natural ecological land types become predominant, whereas anthropogenic land uses gradually diminish, displaying pronounced spatial differentiation.
Regarding slope gradients, in the 0–2° gentle slope range, grassland, cropland, built-up areas, and forestland all exhibit absolute dominance (S > 1), with index values of 5.06, 65.13, 6.39, and 12.51, respectively, indicating that flat terrains serve as zones where human activities and natural ecosystems coexist. Within the 2–15° slope range, cropland and forestland maintain dominance (S > 1), with indices of 9.3 and 4.45, respectively, showing continued suitability for agricultural use and forest distribution. On steeper slopes of 15–25° and >25°, only forestland retains absolute dominance (S > 1), with indices of 1.9 and 2.36, highlighting forests as the land use type most resilient to increasing slope and the principal component of mountainous steep-slope ecosystems. Shrubland and bare land exhibit distribution indices below 1 across all slope categories, indicating their lack of regional dominance.
Ana analysis of aspect (Table 5) reveals that forested areas account for substantial proportions on both sunny and shady slopes, covering 5859.74 km² (0.53%) and 7716.13 km² (0.67%), with distribution indices of 1.10 and 1.30, respectively, indicating slightly higher dominance on shady slopes. This aligns with forest ecological principles: shaded slopes generally retain more soil moisture, favoring tree growth and stable forest development, making these areas priority zones for ecological conservation. Conversely, shrubland exhibits low coverage on both sunny and shady slopes (283.20 km² and 80.41 km²), with distribution indices of only 0.05 and 0.01, suggesting minimal dominance and a spatial distribution largely influenced by microtopography, soil conditions, and human disturbances. Built-up areas and bare land have very low coverage (36.72–52.70 km²) and indices (0.00–0.01) on both slope aspects, indicating that aspect exerts limited influence on construction land, which is concentrated mainly in local gentle areas or along river valleys.
In summary, the integrated analysis of elevation, slope, and aspect demonstrates that terrain significantly constrains and guides the spatial distribution of land use in the Jinsha River Basin (Zhaotong section). Elevation shows strong spatial differentiation: low-elevation areas are dominated by human activities (cropland and built-up areas), while natural factors increasingly determine land use at higher elevations, with a marked increase in ecological land types such as grassland and forest. Slope exhibits a clear gradient effect: flat areas support coupled human-natural land use patterns, mid-to-high slopes favor forest dominance with grassland and shrubland as complementary components, and steep slopes are almost exclusively forested, reflecting the critical role of natural conditions in maintaining ecosystem stability. Aspect has a comparatively minor influence but still exerts local effects: sunny slopes slightly favor cultivation due to higher light and temperature, whereas shady slopes slightly favor forest growth due to greater soil moisture retention. Collectively, these results indicate that the land use patterns in the Jinsha River Basin are shaped by the interaction between natural topography and human activities, with elevation and slope serving as the primary determinants of spatial distribution, and aspect playing a secondary, localized regulatory role.
4.2. Relationship Between Topography Factors and Land Use
4.2.1. Analysis of Human–Land Relationship and Land Use Dynamics
To analyze land use changes in Zhaotong City between 2016 and 2023, it is essential to first quantify the magnitude of these changes. The magnitude reflects fluctuations in the area covered by different land use types, thereby illustrating the overall development trends of each land category. The change rate can be expressed as follows:
where Rt represents the change rate of a specific land use type during the study period, and Ua and Ub denote the areas covered by the land use type at the beginning and end of the study period, respectively.
Based on this expression, the comparative results of land use changes in Zhaotong City from 2016 to 2023 were calculated and are presented in Table 6.
According to Table 3, between 2016 and 2023, the land use dynamics of construction land in Zhaotong City exceeded those of agricultural land. Among agricultural land types, the overall dynamic degree remained relatively stable, with a change rate of 2.53%; however, the subcategories exhibited distinct dynamic patterns. Notably, grassland showed the most significant decline in dynamic degree, reaching -16.13%, primarily due to its conversion into forestland and orchard land. Forestland experienced the highest positive dynamic change. The dynamic degrees of cropland and orchard land were comparable, reflecting trends consistent with socioeconomic development and indicating the demand for these land types in response to urbanization and economic growth.
Figure 3.
Dynamic degrees of different land use types in Zhaotong City from 2016 to 2023.

The dynamic degree of construction land in Zhaotong City from 2016 to 2023 was 3.06%, significantly higher than the 0.53% observed for agricultural land. Within construction land, transportation land showed the most pronounced positive dynamic change (4.78%), followed by residential, industrial, and mining land (4.32%). These changes were primarily guided by land use policies and overall urban planning. Conversely, grassland, other construction land, and unused land displayed negative dynamic degrees of -16.13%, -5.70%, and -10.44%, respectively, indicating limited development and substantial conversion to other land types. Grassland was mainly transformed into forestland and orchards, while other construction land was largely converted to residential and transportation land. The negative dynamic degree of unused land reflects the gradual exploitation and development of previously undeveloped areas in line with socioeconomic growth, representing an inevitable trend in Zhaotong City's urban and economic expansion.
4.2.2. Land Development and Utilization Changes
From 2016 to 2023, Zhaotong City experienced significant changes in land development and utilization. To quantify these changes, this study introduces the land development degree (D), an index that measures the extent to which a specific land type has been newly developed over a given period. Since unused land is generally not subject to new development, it was excluded from this assessment. The land development degree is expressed mathematically as follows:
where Dab represents the development degree of a land type from time a to b, Ua is the area covered by the land type at time a, T is the total duration of the study period, and the numerator denotes the cumulative area newly converted to the target land type.
In contrast, the land consumption degree (C) indicates the actual reduction or utilization of a land type over a given period, expressed as follows:
where, Cab represents the consumption degree of the land type, Ua is the area at the starting time, and T is the interval between times a and b.
The relationships between land development and consumption were analyzed using data from the 2016–2023 Zhaotong Statistical Yearbooks and land use change surveys (Table 6).
From 2016 to 2023, construction land exhibited the highest development intensity, whereas cropland and water bodies showed relatively low development (Table 6); specifically, after accounting for a 0.81% consumption degree, the degree of development of construction land reached 5.8%, mainly derived from the conversion of cropland and orchards, reflecting the demands of socioeconomic development. Cropland showed a higher degree of consumption (0.81%) than development (0.55%), indicating that most cropland was converted to forestland or construction land, consistent with urban expansion and regional cultural contexts. The development and consumption of orchard and forestland were relatively balanced, demonstrating a stable and positive growth pattern. The development rate of orchards increased by 1.69%, reflecting the rational use and effective management of horticultural land.
Water bodies exhibited a consumption rate exceeding their development rate, indicating limited new development. Unused land had the highest consumption degree among all land types (2.28%), demonstrating effective utilization, especially through conversion to construction land. Overall, Zhaotong City displayed prominent development in construction land, whereas the development and utilization of cropland and water bodies remained modest, reflecting urban development priorities and policy guidance.
4.3. Evaluation System for the Evolution of Humanland Relationhips in Zhaotong Based on Land Use
Human activity intensity, as a key driver of the evolution of human–land relationships, reflects the degree of human disturbance to the environment within a specific region. In other words, it characterizes the processes through which human activities influence and transform regional environmental conditions. Different research objectives necessitate distinct analytical approaches: accurately quantifying the environmental impacts of human activities requires rigorous quantitative analysis, whereas assessments of sustainable development must also consider the current status of natural resources. Given the combination of subjective and objective aspects inherent in human activities, accurately reflecting reality requires a robust analytical methodology and a scientifically grounded indicator system. Moreover, to fully understand variations in the selected indicators, constructing a systematic and scientific model is essential to ensure that both analytical approaches effectively capture real-world dynamics (Figure 4).
Considering the systemic, holistic, dynamic, and complex nature of interactions between regional human activities and resource–environment evolution, it is necessary to scientifically and reasonably characterize the interaction and variation patterns between the intensity of human activities and resource–environment conditions [30,[31,32]. Following principles of scientific rigor, simplicity, systematization, stability, comparability, operability, and regional specificity, emphasis was placed on selecting macro-level and foundational indicators. Drawing on existing studies, separate evaluation indicator systems were developed for the intensity of human activities and resource–environment conditions (Table 10).
Table 7.
Evaluation indicator system for the coordination of human–land relationships based on land use.
Table 7.
Evaluation indicator system for the coordination of human–land relationships based on land use.
| Objective Layer | Criterion Layer | Sub-Criterion Layer | Indicator Code | Indicator Layer | Indicator Nature | Indicator Weight |
| Evaluation indicator system | Human Activity System (0.5) | Population Expansion (HP, 0.35) |
H1 | Total population (10,000 persons) | − | 0.150 |
| H2 | Population density (persons/km²) | − | 0.100 | |||
| H3 | Urbanization rate (%) | + | 0.100 | |||
| Economic Development Intensity (He, 0.35) |
H4 | Gross domestic product (CNY 10,000) | + | 0.150 | ||
| H5 | Economic density (CNY/km²) | + | 0.100 | |||
| H6 | Proportion of non-agricultural industries (%) | + | 0.100 | |||
| H7 | Cultivation rate (%) | + | 0.075 | |||
| Land Use Intensity (Hl, 0.30) |
H8 | Multiple cropping index (%) | + | 0.050 | ||
| H9 | Irrigation rate (%) | + | 0.045 | |||
| H10 | Per capita construction land area (m²/person) | + | 0.065 | |||
| H11 | Proportion of construction land to total land (%) | + | 0.065 | |||
| Resource–Environment System (0.5) | Resource–Environment Support Capacity (Rh, 0.35) |
R1 | Forest coverage rate (%) | + | 0.080 | |
| R2 | Cultivated land area per capita (ha/person) | + | 0.085 | |||
| R3 | Green land area per capita (m²/person) | + | 0.080 | |||
| R4 | Per capita water resources (m³/person) | + | 0.085 | |||
| Resource–Environment Pressure (Rs, 0.35) |
R5 | Wastewater discharge per unit area (t/km²) | − | 0.150 | ||
| R6 | Solid waste generation per unit area (t/km²) | − | 0.100 | |||
| R7 | Fertilizer application per unit area (t/km²) | − | 0.100 | |||
| Resource–Environment Resilience (Rr, 0.30) |
R8 | Compliance rate of wastewater discharge (%) | + | 0.100 | ||
| R9 | Comprehensive utilization rate of industrial solid waste (%) | + | 0.100 | |||
| R10 | Soil and water conservation rate (%) | + | 0.100 |
The selected indicators may vary due to differences among system components. To eliminate these differences, this study applies a normalization method to unify units and formulas, simplifying calculations and enabling precise analysis of complex interrelations within the human–land system. Raw data are standardized based on benchmark values and normalized for both positive and negative indicators to construct a normalized judgment matrix.
Where xij is the actual value of the jth indicator for the ith evaluation unit, and max(xij) and min(xij) are the maximum and minimum values of that indicator, respectively. After normalization, the entropy of each indicator is calculated based on the entropy method:
Where pij represents the proportion of the ith unit in the jth indicator, and k is a constant ensuring 0≤ej≤1. Indicator weights are then determined by integrating entropy analysis with prior research experience.
Combining normalized indicators, entropy-derived weights, and previous studies, a linear weighted summation method is used to calculate the Human Activity Index (HA) and Resource–Environment Index (RE):
Where HAi and REi are the normalized values of the ith indicators for human activity and resource–environment subsystems, respectively, and is the corresponding weight.
4.3.1. Coupling Model of Human Activity Intensity and Resource–Environment Level
Coupling degree is a key metric for assessing the evolution of human–land relationships, as it identifies patterns and temporal relationships between human activities and the natural environment. However, coupling alone cannot fully capture the synergistic effects of the development of human and natural resource systems. Sole reliance on coupling may lead to misinterpretation; therefore, constructing a comprehensive coordination model that integrates "coupling," "synergy," and "effectiveness" is critical.
Building on existing coupling models, this study develops a model to evaluate the coordination between human activity and resource–environment subsystems. The model serves dual purposes: it assesses the coordination level between human activities and resources/environment, and it analyzes their coupled development. This approach facilitates a more precise understanding and evaluation of dynamic human–land interactions.
The coupling degree (H) and coordination degree (L) are calculated as follows:
where, HA is the human activity intensity index, RE is the resource–environment index, and T is a comprehensive index of human activity intensity and resource–environment level. Parameters λ1 and λ2 satisfy λ1+λ2=1. Given the equal importance of humans and land in human–land relations, λ1=λ2=0.5 is adopted. Higher L values indicate better coordination, whereas higher H values indicate higher levels of coupled development. Classification standards for coordination and coupling levels are provided in Table 8 [33,[34,35].
4.3.2. Dynamics of Human Activity Index and Integrated Resource–Environment Index
Overall, both the Resource–Environment Comprehensive Index and the Human Activity Intensity Index showed an upward trend between 2016 and 2023, although the rates of change for each exhibited slight divergence.
As shown in Figure 5a, the Human Activity Pressure Index in Zhaotong City increased from 0.530 in 2016 to 0.890 in 2023, reflecting the intensified human activity associated with population growth, industrialization, and urbanization. The annual average growth rate of the Human Activity Intensity Index was approximately 6.2% over the entire period, rising to about 8.08% between 2020 and 2023 due to industrial restructuring and economic expansion. The year 2019 represented a notable turning point, closely linked to government industrial support policies and investment promotion activities. The Resource–Environment Level Index also gradually increased alongside human activity intensity, particularly after 2019. The integrated index T remained relatively stable, benefiting from the moderate economic development pace of Zhaotong as a fifth-tier city and effective governmental resource protection measures.
Figure 5b illustrates the evolution of the internal components of the Human Activity Intensity Index from 2016 to 2023. While there were year-to-year fluctuations, the overall trend was upward. The other three constituent indices also showed general increases, though the annual volatility varied. Data analysis indicates that the Population Scale Expansion Index led the growth trend compared with the Economic Development Intensity and Land Use Intensity indices. However, its annual average growth rate was approximately 2.51%, which is not particularly high. This is largely attributable to Zhaotong’s extensive geographic area and the developmental characteristics of western Chinese cities, where urban centers grow rapidly while counties lag behind. In addition, the relatively high proportion of non-resident populations slowed overall population growth and density but contributed to more pronounced increases in economic and land use intensity, with annual average growth rates of 3.84% and 4.43%, respectively. Although land use intensity was slightly lower than economic development intensity, the ongoing urbanization and industrialization processes led to continuous expansion of construction land and steadily increasing land development intensity, gradually narrowing the gap between the two indices.
As shown in Figure 5c, after a period of fluctuation, the Resource–Environment Level Index in Zhaotong exhibited a steady upward trend. Although the Resource Support Index experienced some fluctuations, active ecological restoration and construction measures have enhanced the protection and quality of key resources such as water, arable land, and forests. Simultaneously, the decline in the Resource–Environment Pressure Index indicates that pollutant emissions have been curbed, to some extent, through industrial restructuring and adjustments in growth patterns. Despite improvements observed after 2022, the overall resource–environment situation remains challenging, warranting continued attention and effort.
As shown in Figure 5d, the negative impact of human activity intensity on the resource–environment system has gradually weakened. Between 2016 and 2023, the pressure induced by human activities and the resulting changes in the resource–environment system exhibited synchrony and continuity. Historically, the intensity of human activity generally exerted negative effects on resource–environment levels. However, the negative response value improved from −0.38 in 2016 to −0.29 in 2023, indicating a positive trend. Notably, during 2005–2008, the response index dropped from 0.29 to 0.18, suggesting a transition of human activity patterns in Zhaotong from extensive to intensive use, with decreasing pressure on the environment.
Although human activities still exert significant pressure, the trend of decreasing response index demonstrates the effectiveness of regulation. The 2023 response index of 0.18, however, indicates that pressure remains considerable. Reducing this response index further, or even reversing it to a positive value, remains a critical challenge. It cannot be assumed that future human activities will automatically reduce environmental pressure or that harmonious development will be easily achieved, as this interaction is highly complex and influenced by multiple factors.
5. Discussion
The findings of this study highlight that the interplay between topographic factors and human–land relationships plays a decisive role in shaping land use efficiency and spatial allocation in mountainous river basins. In the Zhaotong region of the Jinsha River Basin, the coexistence of construction land scarcity and idle rural homesteads represents a structural constraint on regional land management. While low-elevation, gentle-slope areas are heavily utilized for agricultural and construction purposes, mid- to high-elevation and steep zones are predominantly occupied by ecological land. This spatial mismatch reflects both the natural limitations imposed by topography and the socio-economic dynamics of rural—urban migration. The phenomenon of “dual-occupancy” homesteads—where rural populations work in urban centers while retaining underutilized or expanding rural land—exacerbates land use inefficiency and hinders the effective integration of urbanization processes. These results emphasize that land management strategies must account for both the biophysical suitability of the terrain and the demographic patterns influencing land demand.
Furthermore, our analysis suggests that implementing coordinated policies for the withdrawal and intensive reuse of idle rural homesteads could substantially improve land use efficiency and support urban–rural integration. With China’s urbanization rate projected to reach 80% by 2050 and a potential urban land deficit of 70,000 km², strategic reuse of existing rural construction land offers a viable solution for alleviating urban land scarcity without expanding total construction areas. In the Zhaotong context, prioritizing development in low-elevation, gentle-slope areas while preserving ecological land in higher and steeper regions can optimize land resource allocation, enhance sustainable urbanization, and mitigate rural hollowing. These insights underscore the importance of integrating topographic constraints and human–land dynamics into land use planning frameworks, providing a practical approach for balancing ecological conservation and socio-economic development in mountainous regions.
6. Conclusions
The land use patterns in the Zhaotong region of the Jinsha River Basin are significantly influenced by three topographic factors—elevation, slope, and aspect—that exhibit distinct spatial heterogeneity. Among these factors, elevation exerts the strongest constraint on land use types. In low-elevation areas (258–1000 m), the distribution indices of cropland and built-up areas are 1.12 and 0.85, respectively, occupying 0.35% and 0.01% of the total area, indicating intensive human activities with agricultural and construction land dominating. As elevation increases to the 1000–2500 m range, forested land becomes predominant (E > 1), covering 7,716.13 km², or 0.67% of the total area, while the proportion of grassland and shrubs also increases, and cropland and built-up areas gradually decrease, highlighting the increasing influence of natural conditions on land use. Slope further modulates land use patterns: in flat areas with a 0–2° slope, the distribution indices of cropland, forestland, and built-up areas are 65.13, 12.51, and 6.39, respectively, reflecting concentrated human activity, whereas in steep slopes of 15–25° and >25°, forestland distribution indices are 1.9 and 2.36, dominating the landscape, while cropland and built-up areas are nearly absent, illustrating the dominance of natural ecosystems in steep terrains. Aspect has a relatively limited effect; south-facing slopes have a slightly higher cropland distribution index (0.741) than north-facing slopes (0.51), whereas forests are slightly more prevalent on north-facing slopes (1.30 vs. 1.10). Overall, elevation and slope are the primary determinants of spatial land use distribution, while aspect plays a supplementary role in fine-tuning local agricultural and forest patterns.
Land use patterns are shaped not only by natural topography but also by human–land interactions and rural–urban population flows. Cropland and built-up areas are concentrated in low-elevation and gentle-slope areas, reflecting high human dependence on land resources. However, as an underdeveloped fifth-tier city in Yunnan Province, Zhaotong has experienced outmigration of young and middle-aged laborers, resulting in hollowing of rural settlements. Approximately 10%–15% of rural homesteads nationwide, equivalent to approximately 9,116 km², remain idle, leading to low efficiency of rural construction land. This “dual-occupancy” phenomenon—where the population works in cities while retaining or expanding rural homesteads—exacerbates urban–rural land use conflicts. Similar imbalances are observed in economically developed cities such as Kunming, where an influx of migrants increases demand for urban construction land, yet structural constraints on land supply create conflicts between expansion and availability. The findings indicate that uncoordinated human–land relationships lead to overuse of cropland, built-up areas, and some forests in low-elevation, gentle-slope zones, whereas high-elevation and steep areas are predominantly occupied by ecological land. This underscores the need for land management policies that account for population mobility, rural–urban migration patterns, and homestead utilization to balance land allocation efficiency with ecological conservation.
Author Contributions
Conceptualization, J.F. and SC.W.; methodology, J.F. and NQ.L.; software, J.F. and JQ.P.; validation, J.F., M.Y., and LC.W.; formal analysis, J.F.; investigation, J.F. and NQ.L.; resources, S.W.; data curation, J.F. and JQ.P.; writing—original draft preparation, J.F. and LC.W.; writing—review and editing, S.W. and M.Y.; visualization, J.F. and JQ.P.; supervision, S.W.; project administration, S.W.; funding acquisition, M.Y. All authors have read and agreed to the published version of the manuscript.
Funding
This research was funded by the SCIENTIFIC RESEARCH FUND OF THE YUNNAN PROVINCIAL DEPARTMENT OF EDUCATION (grant number 2024J1071) and the 2024 YOUNG SCIENTISTS FUND UNDER THE JOINT SPECIAL PROJECT FOR BASIC RESEARCH IN UNDERGRADUATE COLLEGES AND UNIVERSITIES IN YUNNAN PROVINCE (grant number 202401BA070001-008). The authors also gratefully acknowledge support from the 2025 ZHAOTONG XINGZHAO TALENT SUPPORT PROGRAM, as well as the research initiation grant for high-level talents (grant number s106240004) provided through Central Government Funding (Yun Cai Jiao [2024] No. 104).
Data Availability Statement
The datasets generated and/or analyzed during the current study are available from the corresponding author upon reasonable request.
Acknowledgments
The authors thank the administrative staff of the Kunming University of Science and Technology and Zhaotong University for their logistical support throughout the field investigations. The authors used ChatGPT (OpenAI, GPT-4, August 2025 version) for assistance with language refinement and editorial clarity during the preparation of this manuscript. The authors also used ArcGIS 10.8 software in the design of the study, as well as in the collection, analysis, and interpretation of the data. The authors have reviewed and edited the output and take full responsibility for the content of this publication.
Conflicts of Interest
The authors declare no conflicts of interest. The funders had no role in the design of this study; in the collection, analyses, or interpretation of data; in the writing of the manuscript; or in the decision to publish the results.
References
- Koumoulidis, D.; Varvaris, I.; Hadjimitsis, D.; et al. Profiling Land Use Planning: Legislative Structures in Five European Nations. Land 2025, 14, 1261. [Google Scholar] [CrossRef]
- Helm, L.T. Research on Plastic Mitigation Underestimates the Potential Land-Use Impact of Bio-Based Plastic Alternatives. GCB Bioenergy 2025, 17, e70024. [Google Scholar] [CrossRef]
- Magalhes, T.M.; Reckziegel, R.B.; Paulino, J. . Soil organic carbon in tropical shade coffee agroforestry following land-use changes in Mozambique. Agrosystems, Geosciences & Environment 2025, 8, e70043. [Google Scholar] [CrossRef]
- Petrakovska, O.S.; Mykhalova, M.Y. . Environmental factors for land use restrictions establishment in Ukraine. Naukovyi Visnyk Natsionalnoho Hirnychoho Universytetu 2025, 76–81. [Google Scholar] [CrossRef]
- Gang, S.; Kong, X.; Jia, T.; et al. Analysis of the spatiotemporal evolution and driving factors of land use change in Jinan springs area of the Northern Karst region, China from 1986 to 2022. Discover Applied Sciences, 2025, 7, 1–22. [Google Scholar] [CrossRef]
- Xue, X.X.; Luo, Y.; Liao, M.Y.; et al. Land Use Changes and Their Driving Factors in the Liuchong River Basin Based on the Geographical Detector Model. Journal of Resources and Ecology 2025, 16, 376–386. [Google Scholar] [CrossRef]
- Ye, L.; Zhao, S.; Yang, H.; et al. Urban land use simulation and carbon-related driving factors analysis based on RF-CA in Shanghai, China. Ecological Indicators 2024, 166, 15. [Google Scholar] [CrossRef]
- Momene Tuwa, B.; Fossi, D.H.; Nzeugang Nzeukou, A.; et al. Integrated analysis of landslide susceptibility: geotechnical insights, frequency ratio method, and hazard mitigation strategies in a volcanic terrain. Arabian Journal of Geosciences 2025, 18, 1–21. [Google Scholar] [CrossRef]
- Zhang, L.; Hu, B.; Hu, W. . Response of ESV Topographic Gradient to LULC in Mountain-River-Sea Transitional Space Based on Markov-PLUS Modeling: A Case Study of the Southwest Guangxi Karst-Beibu Gulf, China. Land Degradation & Development 2025, 36. [Google Scholar] [CrossRef]
- Zhang, M.; Deng, Y.; Hai, Y.; et al. Monitoring Vegetation Dynamics and Driving Forces in the Baijiu Golden Triangle Using Multi-Decadal Landsat NDVI and Geodetector Modeling. Land 2025, 14, 1111. [Google Scholar] [CrossRef]
- Valjarevi, A.; Morar, C.; Brasanac-Bosanac, L.; et al. Sustainable land use in Moldova: GIS & remote sensing of forests and crops. Land Use Policy 2025, 152, 107515. [Google Scholar] [CrossRef]
- Haile, D.C.; Bizuneh, Y.K.; Bedhane, M.D.; et al. Effects of land management technology adoptions on land use land cover dynamics using GIS and remote sensing: the case of Goyrie watershed, southern Ethiopia. Environmental Monitoring and Assessment 2025, 197, 1–33. [Google Scholar] [CrossRef]
- Larbi, M.Y.; Derridj, A.; Zanndouche, O. . Using A Gis For Mapping Land Use, Floral Richness, and Urbanization in the Peri-Urban Forest of Harouza (Tizi Ouzou, Algeria). Ekológia 2024, 43, 214–218. [Google Scholar] [CrossRef]
- Tarafdar, A.; Middya, A.I.; Banerjee, S.; et al. A CNN-based framework for land use land cover classification of heterogeneous terrain using satellite images. Neural Computing & Applications 2025, 37, 16381–16408. [Google Scholar] [CrossRef]
- Parashar, D.; Kumar, A.; Palni, S.; et al. Use of machine learning-based classification algorithms in the monitoring of Land Use and Land Cover practices in a hilly terrain. Environmental Monitoring & Assessment 2024, 196, 8. [Google Scholar] [CrossRef]
- Li, C.; Li, H.; Zhou, Y.; et al. Detailed Land Use Classification in a Rare Earth Mining Area Using Hyperspectral Remote Sensing Data for Sustainable Agricultural Development. Sustainability (2071-1050) 2024, 16. [Google Scholar] [CrossRef]
- Rawat, S.; Saini, R. . Evaluating the impact of sampling designs on the performance of machine learning techniques for land use land cover classification using Sentinel-2 data. International journal of remote sensing 2023, 44, 7889–7908. [Google Scholar] [CrossRef]
- Zhang, C.F.; Wang, Z.Y.; Wang, Q.; et al. Interaction of population density and slope will exacerbate spatiotemporal changes in land use and landscape patterns in mountain city. Scientific Reports 2025, 15. [Google Scholar] [CrossRef]
- Zhao, X.; Xia, N.; Li, M.C. . 3-D multi-aspect mix degree index: A method for measuring land use mix at street block level. Computers, Environment and Urban Systems 2023, 104, 13. [Google Scholar] [CrossRef]
- Belho, K.; Rawat, M.S.; Rawat, P.K.; et al. Threatening dynamics of landslide disaster risk in Himalaya region due to adverse climatic and anthropogenic changes: geospatial approach. Natural Hazards 2025, 121, 14091–14121. [Google Scholar] [CrossRef]
- Zhang, X.; Yu, J.; Feng, H.; et al. Landscape Ecological Risk and Drivers of Land-Use Transition under the Perspective of Differences in Topographic Gradient. Land 2024, 13, 876. [Google Scholar] [CrossRef]
- Liu, C.; Xu, Y.; Lu, X.; et al. Trade-offs and driving forces of land use functions in ecologically fragile areas of northern Hebei Province: Spatiotemporal analysis. Land Use Policy 2021, 104, 105387. [Google Scholar] [CrossRef]
- Zhixue, L.; Zhongxiang, H.; Songlin, Z. . Research on the impact of expressway on its peripheral land use in Hunan Province, China. Open Geosciences 2021, 13, 1358–1365. [Google Scholar] [CrossRef]
- Marzini, S.; Tasser, E.; Wellstein, C.; et al. Future expansion of upper forest-grassland ecotone under land-use and climate change in the Eastern Alps. Landscape Ecology 2025, 40, 55. [Google Scholar] [CrossRef]
- Hongmin, C.; Fenglian, L.; Bowen, Y.; et al. Spatial-Temporal Evolution and Driving Factors of Habitat Quality Based on Different Topographic Gradients in Zhaotong City, Yunnan Province. Journal of Resources & Ecology 2025, 16, 306–205. [Google Scholar] [CrossRef]
- Alvarez, C.I.; Govind, A. . Assessing climate and land use changes in Morocco (2001–2023): from a geospatial and farmers' perspective. Theoretical & Applied Climatology 2025, 156, 420. [Google Scholar] [CrossRef]
- Maulana, M.H.; Pratiwi, S.D.; Rosana, M.F. . Geomorphological Aspect Analysis In Cikangkung And Surrounding Area, Ciracap Subdistrict, Sukabumi Regency, West Java. Journal of Geological Sciences and Applied Geology 2025, 8, 28–36. [Google Scholar] [CrossRef]
- Vlachogianni, S.; Servou, A.; Karalidis, K.; et al. Remote sensing-based monitoring of land use and cover dynamics in surface lignite mining regions: a supervised classification approach. Earth Science Informatics 2025, 18, 1–20. [Google Scholar] [CrossRef]
- Raffay, M.R.M.; Bagheri, M.; Marzuki, A.; et al. Monitoring and analyzing land use changes for sustainable development in Teluk Bahang, Penang, Malaysia: a GIS-based approach. Journal of Engineering and Applied Science 2025, 72, 1–41. [Google Scholar] [CrossRef]
- Lu, P. . Vegetation, Architecture, and Human Activities: Reconstructing Land Use History from the Late Yangshao Period in Zhengzhou Region, Central China. Land 2025, 14, 321. [Google Scholar] [CrossRef]
- Rakesh, S.; Pranati, S.; Shalini, K.; et al. Assessing tectonic influence on landscape evolution:case study of the Nandakini Watershed,Western Himalaya. Journal of Mountain Science 2025, 22, 666–680. [Google Scholar] [CrossRef]
- Said, Y.; Saidani, O.; Algarni, A.D.; et al. Lightweight multiscale information aggregation network for land cover land use semantic segmentation from remote sensing images. Scientific Reports 2025, 15, 30265. [Google Scholar] [CrossRef]
- Li, W.; Chen, Z.J.; Li, M.C.; et al. Spatial conflict identification and scenario coordination for construction‒agricultural‒ecological land use. Environment, development and sustainability 2025, 27, 1933–1961. [Google Scholar] [CrossRef]
- Pan, Z.; Tian, P.; Pengchao, M.A.; et al. Spatiotemporal evolution and driving factors in coupling coordination of cultivated land use transformation and county-level urban-rural integration in Harbin-Changchun urban agglomeration. Transactions of the Chinese Society of Agricultural Engineering 2025, 41, 228–239. [Google Scholar] [CrossRef]
- Feng, X.U.; Huan, W.; Danyu, Z.; et al. How does the coupling coordination relationship between high-quality urbanization and land use evolve in China? New evidence based on exploratory spatiotemporal analyses. Journal of Geographical Sciences 2024, 34, 871–890. [Google Scholar] [CrossRef]
Figure 1.
Map of the study area in Zhaotong City, Yunnan Province.
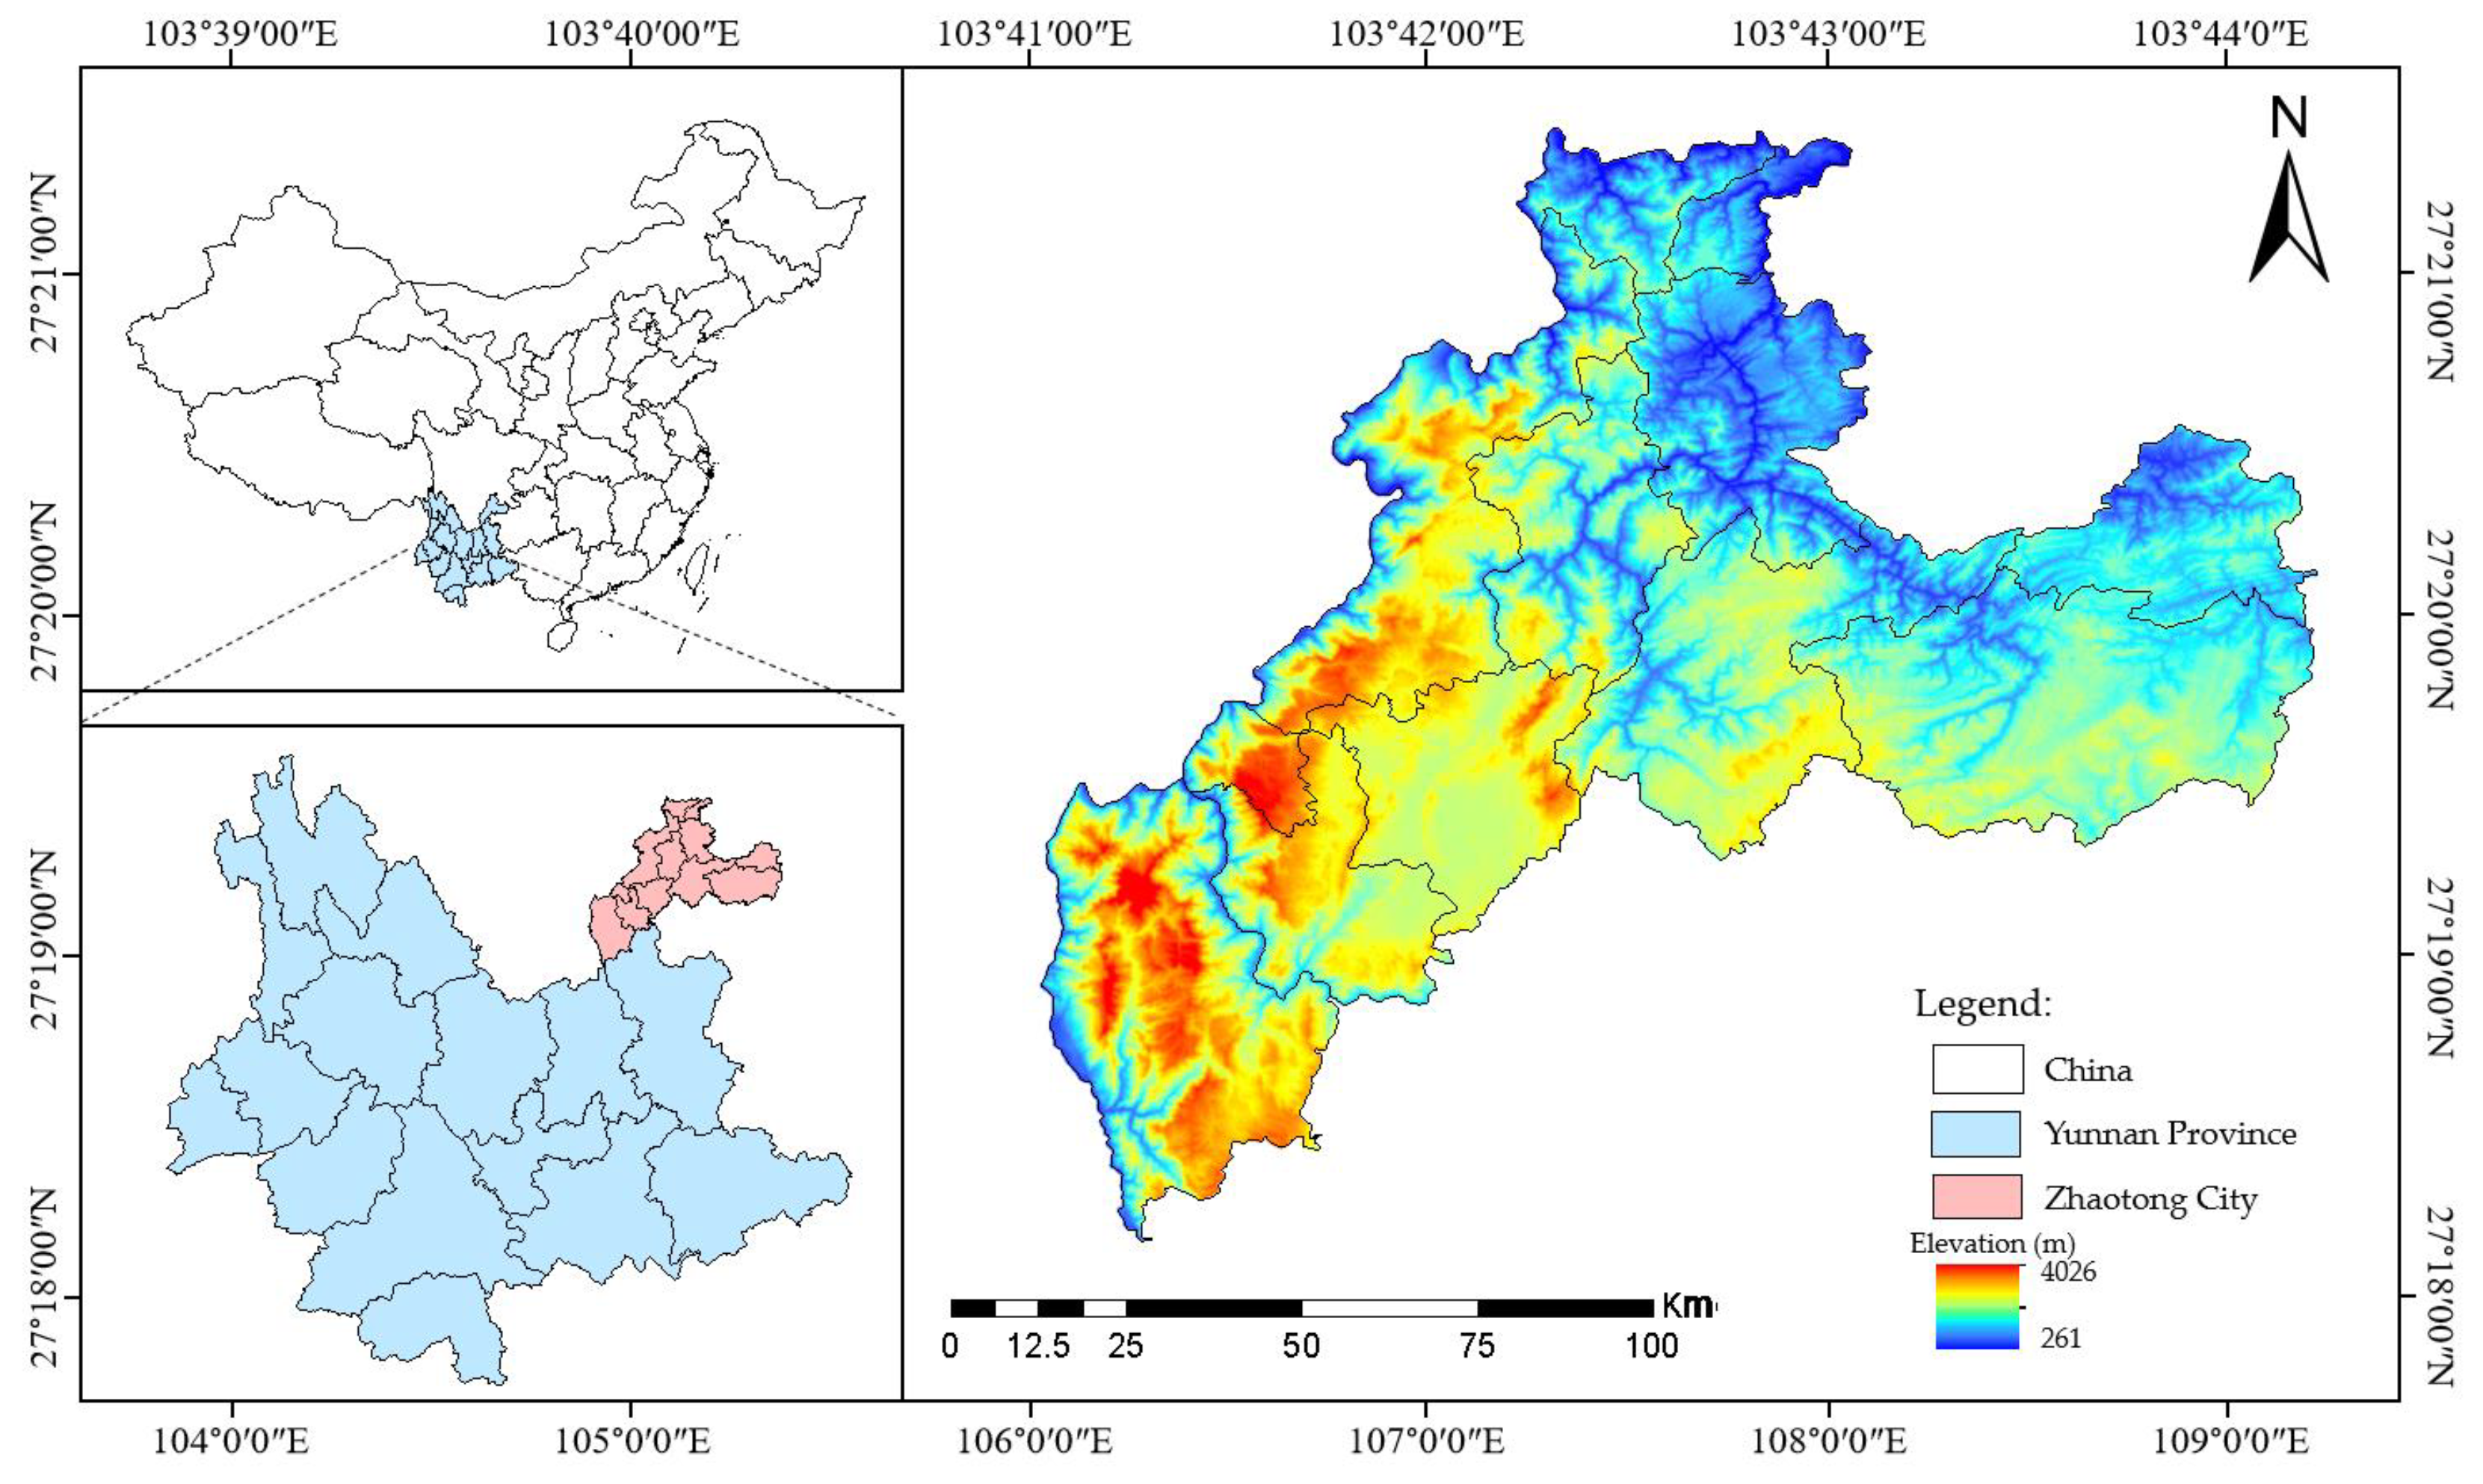
Figure 2.
Land use changes in Zhaotong City from 2016 to 2023: (a) 2016; (b) 2018; (c) 2021; (d) 2023.
Figure 2.
Land use changes in Zhaotong City from 2016 to 2023: (a) 2016; (b) 2018; (c) 2021; (d) 2023.

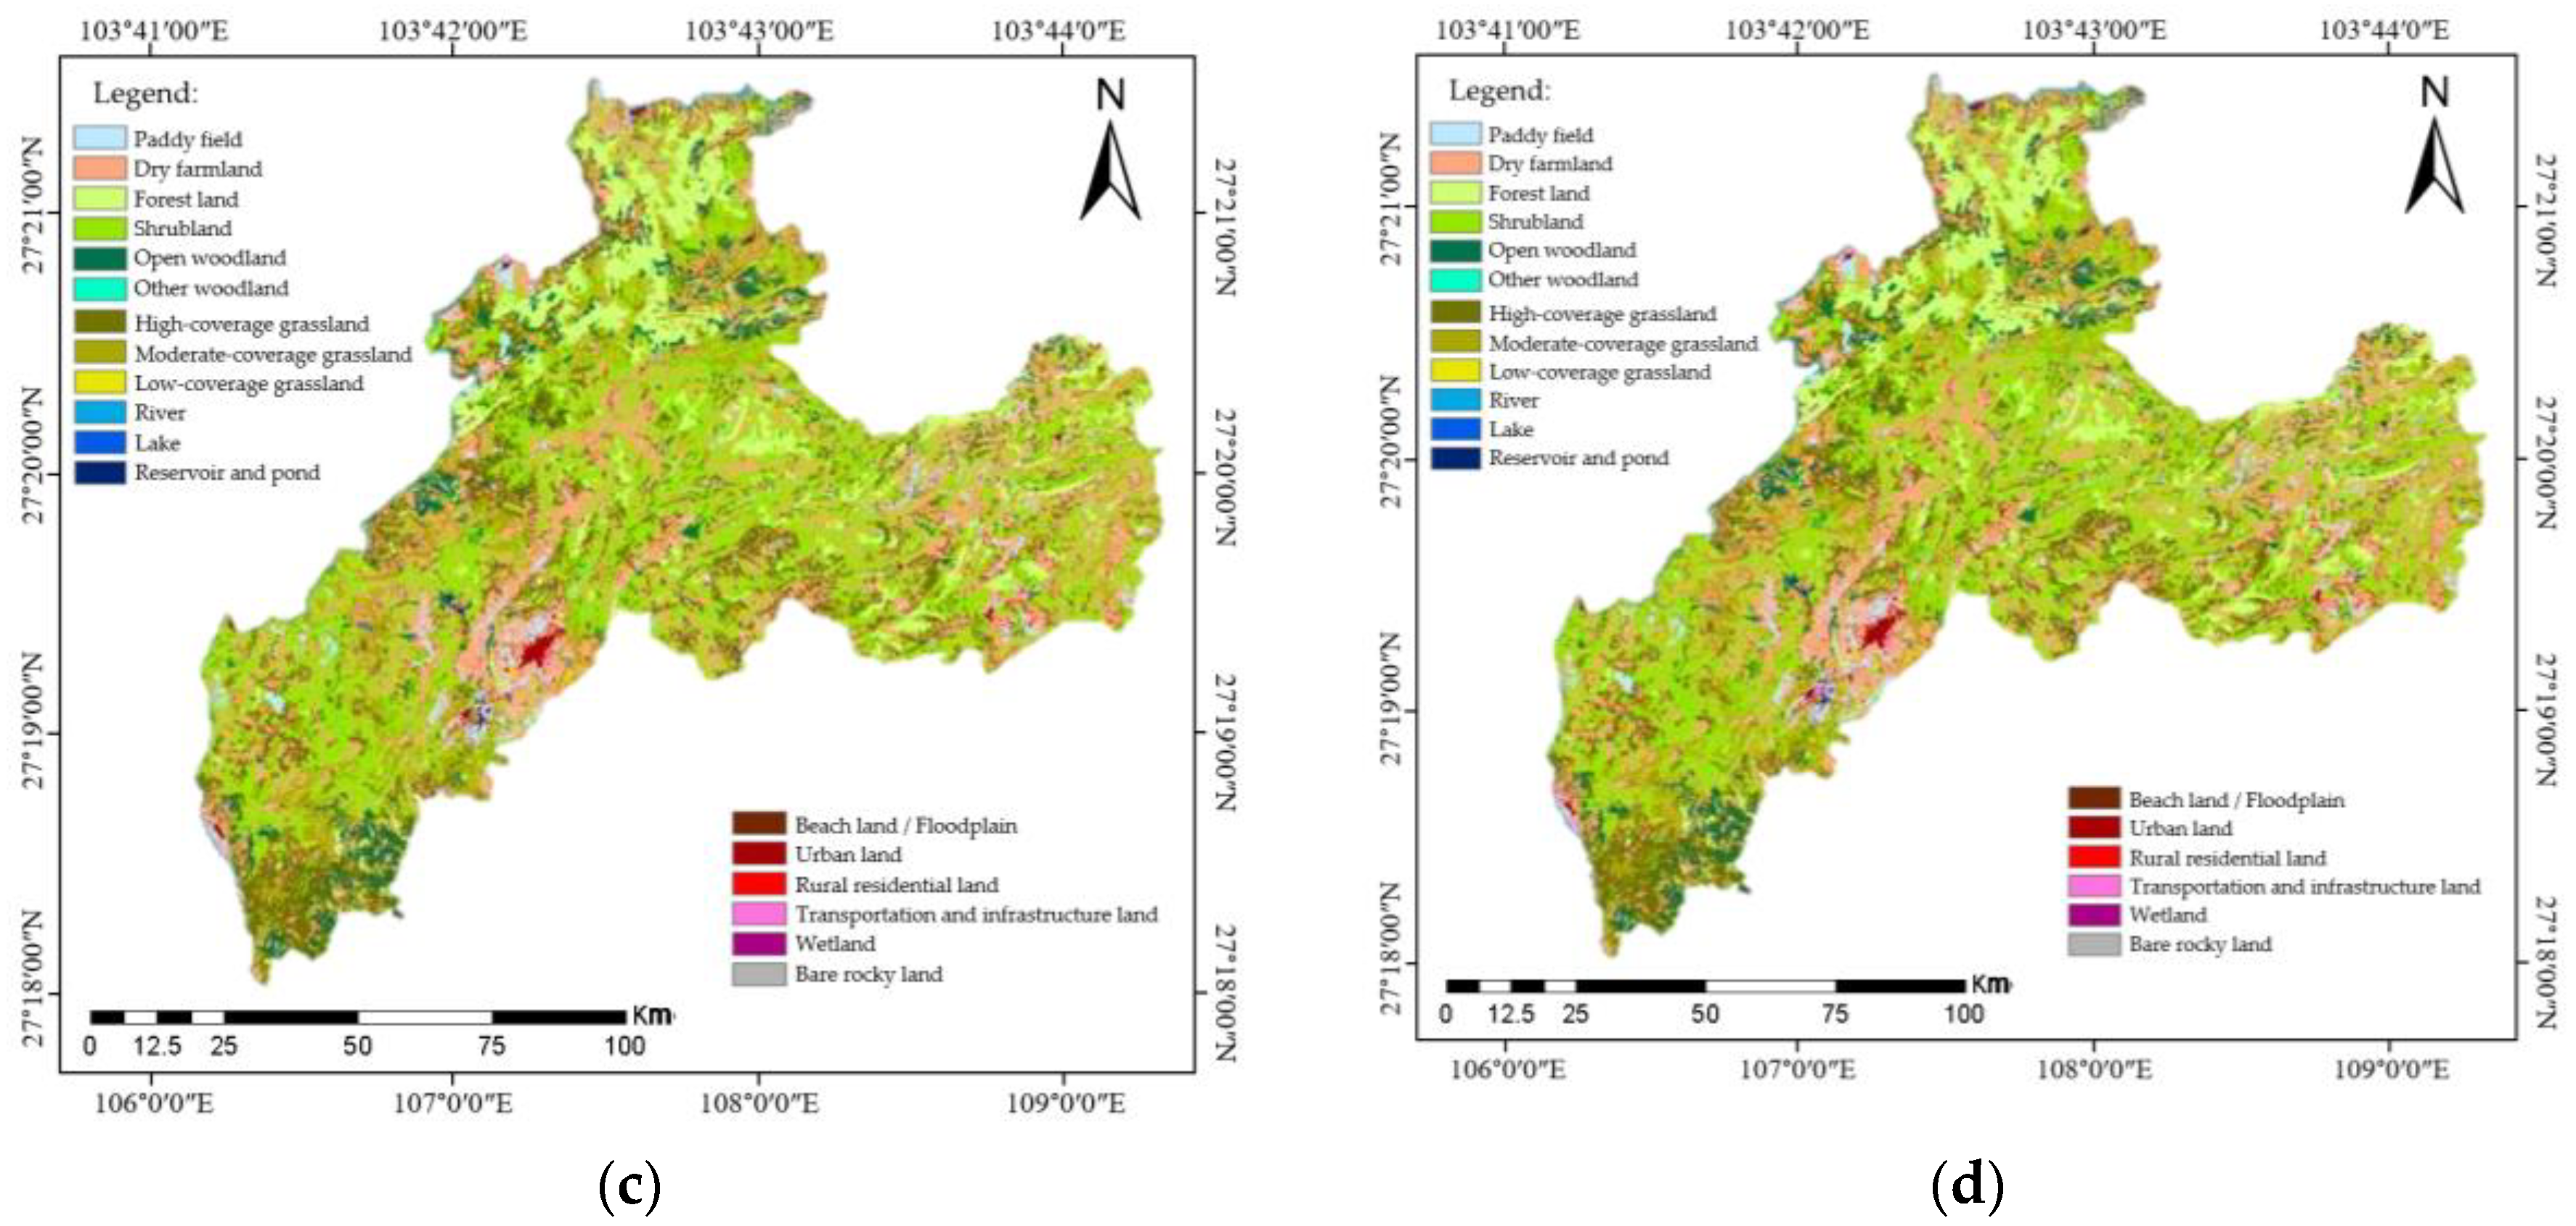
Figure 4.
Model framework for the evolution of humanland relationhips and its driving factors in Zhaotong.
Figure 4.
Model framework for the evolution of humanland relationhips and its driving factors in Zhaotong.

Figure 5.
Classification and spatial distribution of land use and topographic factors in the Jinsha River Basin (Zhaotong section): (a) changes in human activity pressure, resource–environment level, and their coupling degree in Zhaotong City (2016–2023); (b) evolution of the internal composition of human activity intensity in Zhaotong City (2016–2023); (c) evolution of the internal composition of resource–environment level index in Zhaotong City (2016–2023); (d) evolution of the response of resource–environment level to human activity intensity in Zhaotong City (2016–2023).
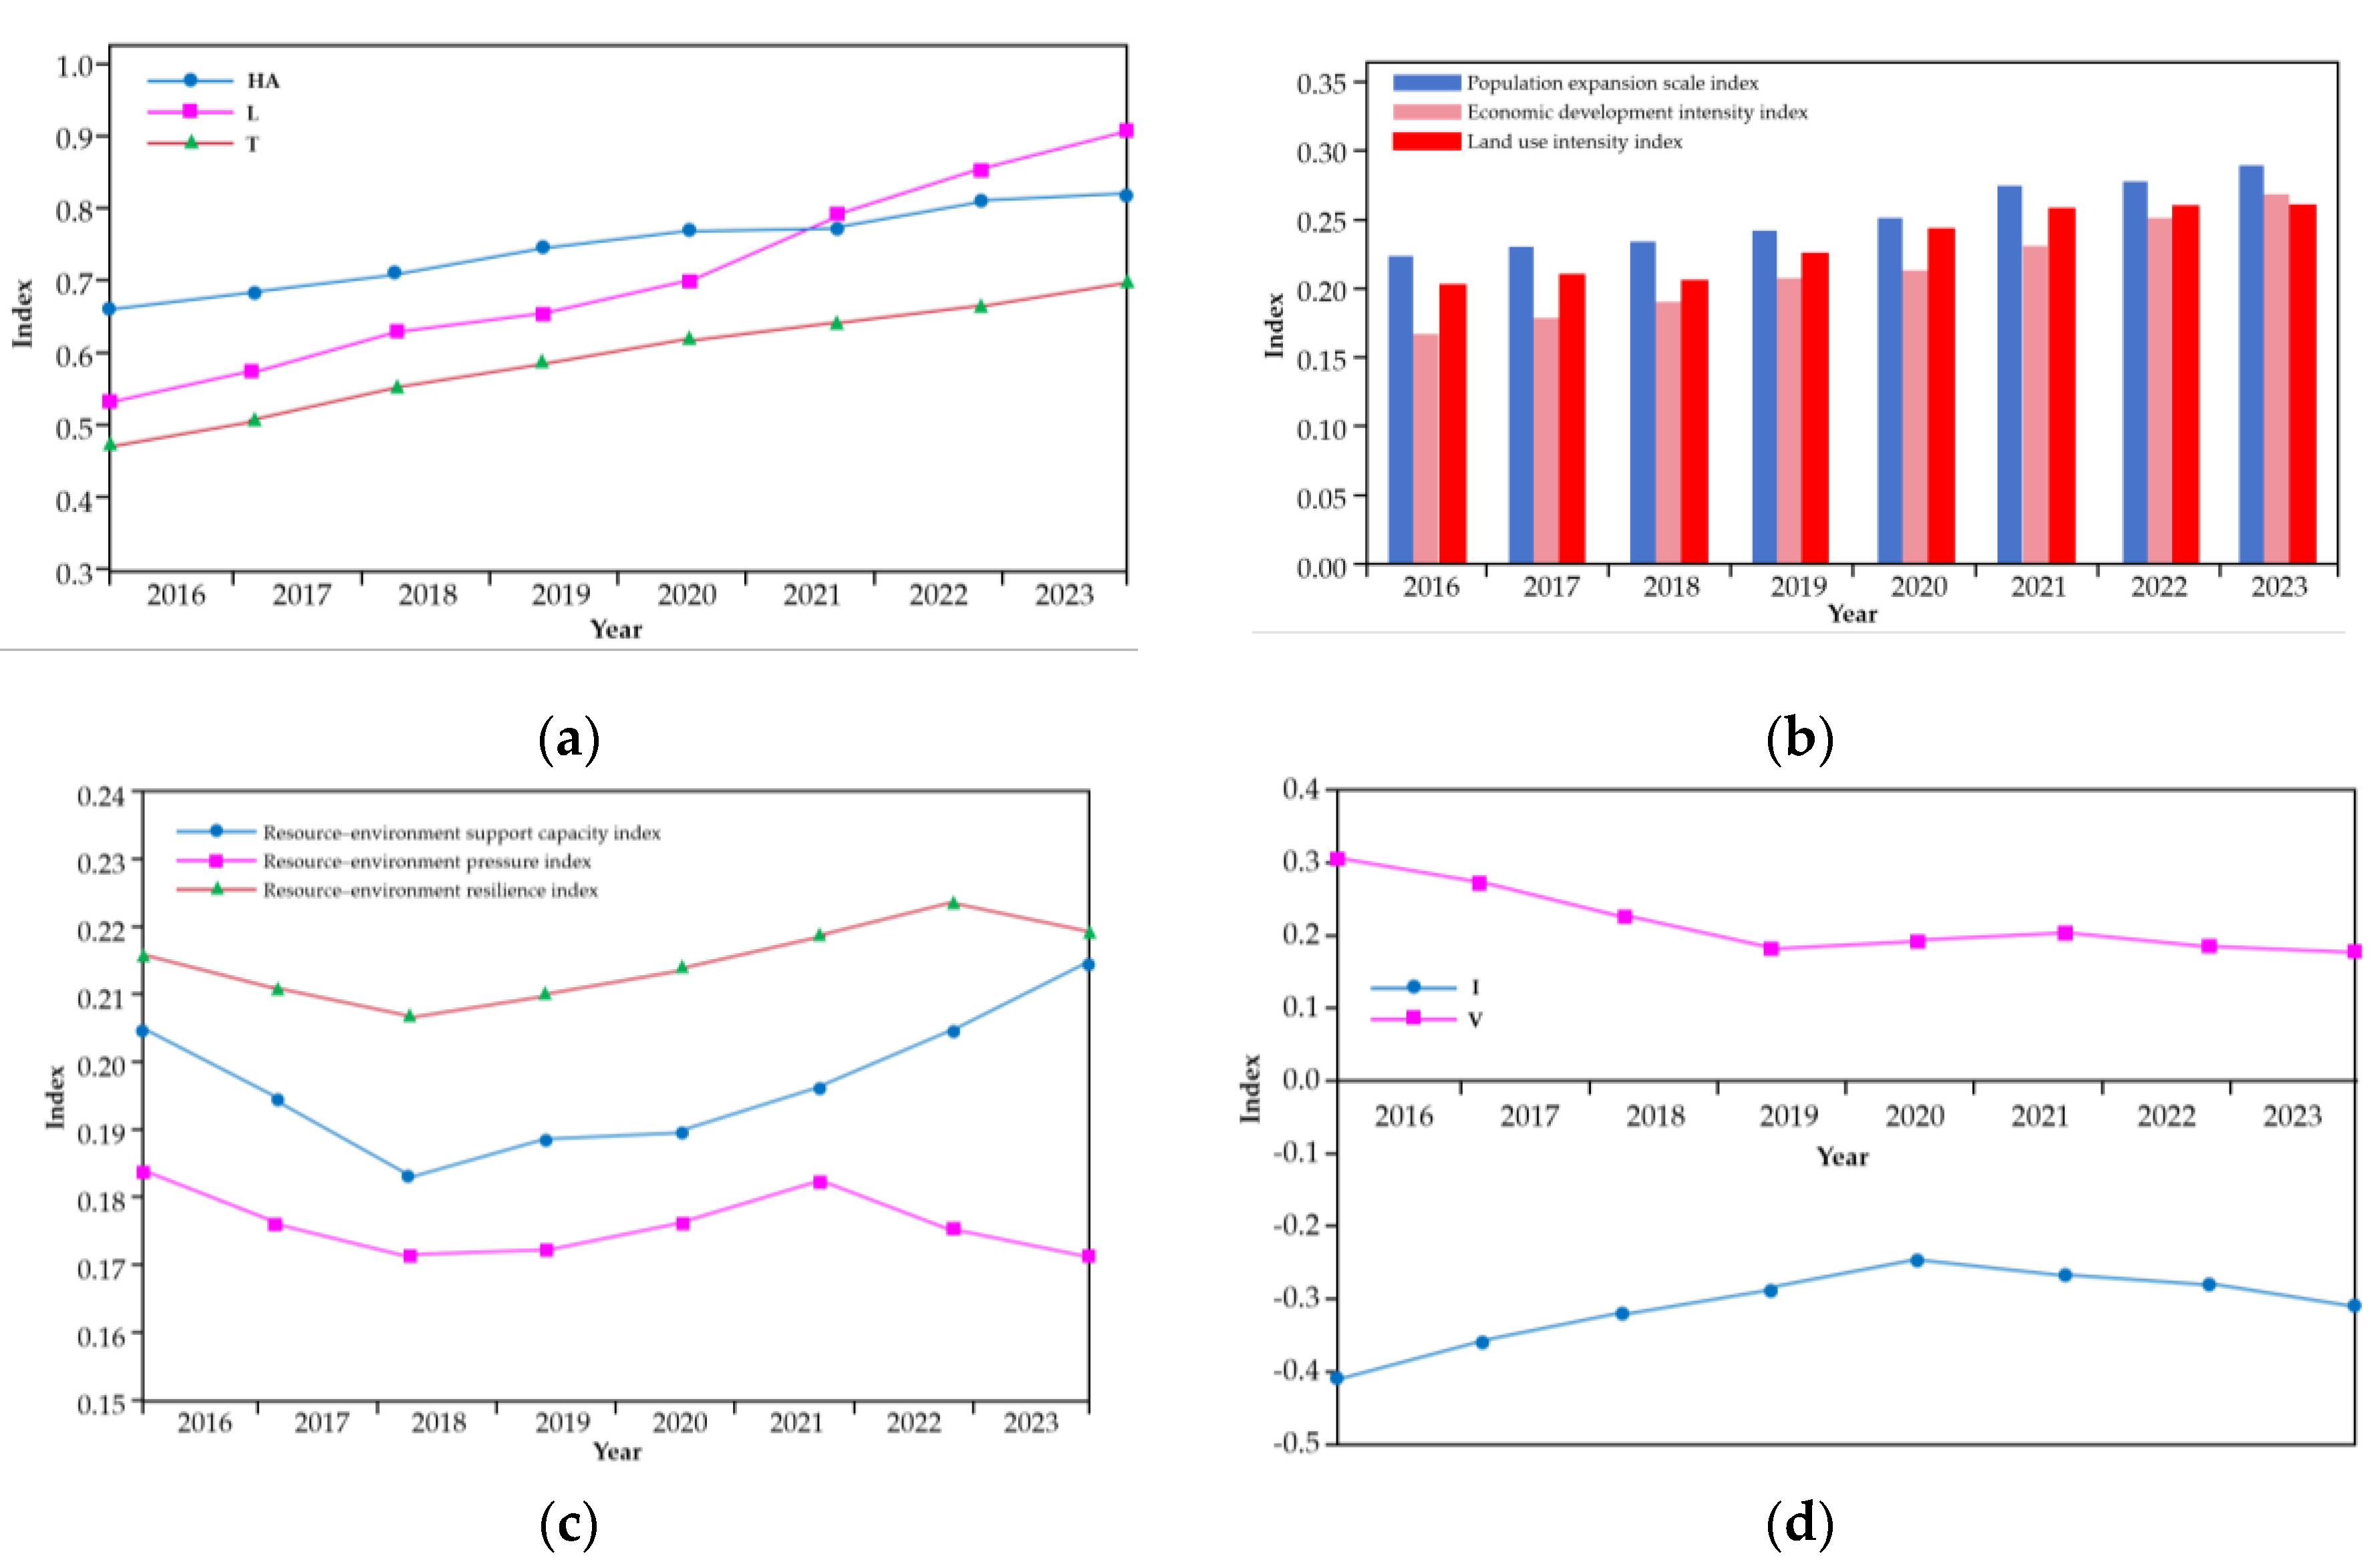
Table 2.
Area and percentage of land use types at different elevations in 2023.
| Land use types | 258-1000 m | 1000-1500 m | 1500-2000 m | 2000-2500 m | >2500m | |||||
|
Area (km2) |
Percentage (%) |
Area (km2) |
Percentage (%) |
Area (km2) |
Percentage (%) |
Area (km2) |
Percentage (%) |
Area (km2) |
Percentage (%) |
|
| Grassland | 55.6 | 0.02 | 91.01 | 0.02 | 152.5 | 0.02 | 349.11 | 0.08 | 637.81 | 0.29 |
| Cropland | 1118.62 | 0.39 | 1528.54 | 0.26 | 2217.53 | 0.32 | 1517.5 | 0.33 | 624.78 | 0.28 |
| Shrub land | 12.47 | 0.01 | 67.73 | 0 | 135.87 | 0 | 113.02 | 0 | 34.6 | 0 |
| Built-up area | 41.9 | 0.01 | 7.84 | 0 | 34.05 | 0 | 5.33 | 0 | 0.41 | 0 |
| Forestland | 1521.96 | 0.52 | 4113.12 | 0.71 | 4461.12 | 0.64 | 2568.89 | 0.56 | 913.22 | 0.41 |
| Bare Land | 0.01 | 0 | 0 | 0 | 0.13 | 0 | 0.03 | 0 | 0 | 0 |
Table 3.
Area and percentage of land use types at different slopes in 2023.
| Land use types | 0-2° | 2-6° | 6-15° | 15-25° | >25以上 | |||||
|
Area (km2) |
Percentage (%) |
Area (km2) |
Percentage (%) |
Area (km2) |
Percentage (%) |
Area (km2) |
Percentage (%) |
Area (km2) |
Percentage (%) |
|
| Grassland | 14.2 | 0.06 | 93.69 | 0.06 | 399.69 | 0.07 | 426.49 | 0.06 | 351.42 | 0.05 |
| Cropland | 182.74 | 0.73 | 908.69 | 0.62 | 2603.48 | 0.44 | 2187.94 | 0.29 | 1122.01 | 0.16 |
| Shrub land | 0.23 | 0 | 2.91 | 0 | 23.82 | 0 | 86.84 | 0.01 | 249.81 | 0.03 |
| Built-up area | 17.93 | 0.07 | 36.85 | 0.02 | 21.38 | 0 | 8.74 | 0 | 4.51 | 0 |
| Forestland | 35.11 | 0.14 | 434.38 | 0.29 | 2838.83 | 0.48 | 4824.29 | 0.64 | 5448.02 | 0.76 |
| Bare Land | 0.03 | 0 | 0.1 | 0 | 0.02 | 0 | 0.02 | 0 | 0 | 0 |
Table 4.
Area and percentage of land use types at different aspects in 2023.
| Land use types | 0-2° | 2-6° | 6-15° | 15-25° | >25 | |||||
|
Area (km2) |
Percentage (%) |
Area (km2) |
Percentage (%) |
Area (km2) |
Percentage (%) |
Area (km2) |
Percentage (%) |
Area (km2) |
Percentage (%) |
|
| Grassland | 14.2 | 0.06 | 93.69 | 0.06 | 399.69 | 0.07 | 426.49 | 0.06 | 351.42 | 0.05 |
| Cropland | 182.74 | 0.73 | 908.69 | 0.62 | 2603.48 | 0.44 | 2187.94 | 0.29 | 1122.01 | 0.16 |
| Shrub land | 0.23 | 0 | 2.91 | 0 | 23.82 | 0 | 86.84 | 0.01 | 249.81 | 0.03 |
| Built-up area | 17.93 | 0.07 | 36.85 | 0.02 | 21.38 | 0 | 8.74 | 0 | 4.51 | 0 |
| Forestland | 35.11 | 0.14 | 434.38 | 0.29 | 2838.83 | 0.48 | 4824.29 | 0.64 | 5448.02 | 0.76 |
| Bare Land | 0.03 | 0 | 0.1 | 0 | 0.02 | 0 | 0.02 | 0 | 0 | 0 |
Table 5.
Dominance of different land use types across elevation, slope, and aspect gradients.
| Types | Level | Grassland | Cropland | Shrub land | Built-up area | Forestland | Bare Land |
| Elevation | 258-1000m | 0.15 | 3 | 0.33 | 0.11 | 4.07 | 0 |
| 1000-1500m | 0.07 | 1.01 | 0.05 | 0.01 | 2.74 | 0 | |
| 1500-2000m | 0.07 | 1.01 | 0.06 | 0.02 | 2.04 | 0 | |
| 2000-2500m | 0.38 | 1.65 | 0.12 | 0 | 2.19 | 0 | |
| >2500 | 0.39 | 2.86 | 0.16 | 0 | 4.19 | 0 | |
| Slope | 0-2° | 5.06 | 65.13 | 0.08 | 6.39 | 12.51 | 0.01 |
| 2-6° | 0.96 | 9.3 | 0.03 | 0.38 | 4.45 | 0 | |
| 6-15° | 0.26 | 1.68 | 0.02 | 0.01 | 1.83 | 0 | |
| 15-25° | 0.17 | 0.86 | 0.03 | 0 | 1.9 | 0 | |
| >25° | 0.15 | 0.49 | 0.11 | 0 | 2.36 | 0 | |
| Aspect | Sun-facingslope | 0.14 | 0.741 | 0.05 | 0.01 | 1.1 | 0 |
| Shaded slope | 0.1 | 0.51 | 0.01 | 0.01 | 1.3 | 0 |
Table 6.
Results of comparative analysis of land use change dynamics by type in Zhaotong City, 2016–2023.
Table 6.
Results of comparative analysis of land use change dynamics by type in Zhaotong City, 2016–2023.
| Primary category of land use types | Secondary category of land use types | 2016 | 2023 | Dynamics |
|
Area (km2) |
Area (km2) |
|||
| Agricultural Land | Cropland | 1796521.2 | 1796884.171 | 2.02% |
| Orchards | 21408.95069 | 21412.99775 | 1.89% | |
| Forestland | 216506.8499 | 216601.9382 | 4.39% | |
| Grassland | 11032.13907 | 11014.37289 | -16.13% | |
| Other agricultural land | 32782.6221 | 32785.93348 | 1.01% | |
| Subtotal | 2078251.762 | 2078777.693 | 2.53% | |
| Construction Land | Residential and Industrial land | 25252.66046 | 25263.57432 | 4.32% |
| Transportation land | 3493.7722 | 3495.443022 | 4.78% | |
| Water conservancy facilities land | 7753.820821 | 7755.682185 | 2.40% | |
| Other construction land | 1216.796525 | 1216.103346 | -5.70% | |
| Subtotal | 37717.05001 | 37728.59496 | 3.06% | |
| Other Land | Other land | 128010.1884 | 127876.6851 | -10.44% |
| Total | 2243979.00 | 2243979.00 | 0 |
Table 6.
Degree of land development and utilization in Zhaotong City (2016–2023).
| Land use types | Construction Land | Cultivated Land | Orchard Land | Forestland | Water Area | Unused Land |
| Land Development Degree (%) | 6.11 | 0.55 | 3.93 | 1.22 | 0.05 | — |
| Land Consumption Degree (%) | 0.81 | 1.06 | 2.24 | 0.51 | 0.26 | 2.28 |
Table 8.
Classification of coupling degree between human activity intensity and resource–environment levels, and of human–environment coordination degree and associated characteristics.
Table 8.
Classification of coupling degree between human activity intensity and resource–environment levels, and of human–environment coordination degree and associated characteristics.
| Evaluationfactors | Hand LRange | Level | Characteristics |
| Coupling degree between human activity intensity and resource–environment |
H=0 | Weakest | The system or elements within the system are uncorrelated, and the system tends toward disorder. |
| 0.0<H≤0.3 | Low | Human activity level is low, and the resource–environment system has strong carrying capacity. | |
| 0.3<H≤0.5 | Antagonistic | Economic development accelerates, while the carrying capacity of the resource–environment system declines. | |
| 0.5<H≤0.8 | Adaptation | The system begins to exhibit positive coupling. | |
| 0.8<H<1.0 | High | Human and environmental systems mutually promote each other, achieving a high degree of synergy; coupling between or within system elements is maximized. | |
| H=1 | Maximum | Elements achieve resonant, positive coupling, and the system tends toward a new ordered structure. | |
| Coordination degree between human–environment and associated characteristics |
L=0 | Uncoordinated | The human–environment system is in decline. |
| 0.0<L≤0.3 | Low | Resources and environment are barely maintained within the carrying capacity. | |
| 0.3<L≤0.5 | Moderate | Resources and environment are maintained within the carrying threshold and acceptable in the short term. | |
| 0.5<L≤0.8 | Good | The system is generally coordinated; the growth rate of human activities exceeds the improvement rate of the ecological environment, achieving a relatively high level of overall synergy. | |
| 0.8<L<1.0 | High | The human–environment relationship is relatively balanced and stable. | |
| L =1 | Extreme | Human and environmental systems mutually reinforce each other, achieving optimal coordinated coexistence. |
Disclaimer/Publisher’s Note: The statements, opinions and data contained in all publications are solely those of the individual author(s) and contributor(s) and not of MDPI and/or the editor(s). MDPI and/or the editor(s) disclaim responsibility for any injury to people or property resulting from any ideas, methods, instructions or products referred to in the content. |
© 2025 by the authors. Licensee MDPI, Basel, Switzerland. This article is an open access article distributed under the terms and conditions of the Creative Commons Attribution (CC BY) license (http://creativecommons.org/licenses/by/4.0/).
Copyright: This open access article is published under a Creative Commons CC BY 4.0 license, which permit the free download, distribution, and reuse, provided that the author and preprint are cited in any reuse.


