Submitted:
15 September 2025
Posted:
16 September 2025
You are already at the latest version
Abstract
This paper proposes a site reliability optimizationtechnique based on synthetic monitoring. By simulating the userbehavior to build an active monitoring mechanism, combined withanomaly detection, root cause analysis and fault predictionmethods, it realizes real-time mastery of site operation status andfault self-healing. A Kubernetes-based experimental environmentis constructed, and a variety of typical failure scenarios aredesigned for comparative experiments. The results show thatsynthetic monitoring outperforms traditional monitoring in termsof failure detection timeliness, recovery efficiency, and alarmaccuracy. The relevant technical solutions have strong scalabilityand practical value, and provide technical support and theoreticalbasis for improving the business continuity of cloud platform.
Keywords:
cloud environment
; synthetic monitoring
; sitereliability
I. Introductory
With the complexity of cloud computing architectures and the extension of business access chains, traditional passive monitoring can no longer meet the requirements for high availability and real-time response[1]. Synthetic monitoring, with active detection, behavior simulation and data-driven analysis as its core, provides a feasible path to improve site reliability. In this paper, we focus on its key technologies, build an experimental environment for comparative validation, and explore site stability optimization solutions applicable to cloud environments, so as to promote the monitoring system to evolve in the direction of intelligence and predictability.
Cao et al. (2025) proposed a utility-driven virtual machine allocation strategy in edge cloud scenarios, emphasizing resource optimization under dynamic workloads [1]. Ibrahim and Yasin (2025) reviewed deep learning-based threat detection frameworks in cloud environments, highlighting the growing complexity of monitoring under high concurrency [2]. Chandrasiri and Meedeniya (2025) introduced a deep learning approach for energy-efficient workflow scheduling, suggesting the importance of real-time orchestration for reliability [3]. Salameh and Wittevrongel (2025) established a mathematical model for clustered service systems, revealing inherent limitations in traditional monitoring under large-scale service dependencies [4]. However, most existing studies overlook active monitoring paradigms that emulate user behavior. This paper addresses that gap by focusing on synthetic monitoring and its role in site reliability optimization.
II. Synthetic Surveillance in a Cloud Environment
With the increasing complexity of service structures in cloud computing, traditional passive monitoring mechanisms—which rely on backend logs and system metrics—struggle to capture the real-time, end-to-end user experience. In contrast, synthetic monitoring operates on the principle of proactive measurement. It simulates user operations using predefined scripts, enabling continuous tracking of system responsiveness and availability from the user’s perspective. The theoretical foundation of synthetic monitoring lies in behavior-driven performance modeling, where synthetic agents emulate user paths and interactions to build a virtual performance landscape.
The general availability model used in synthetic monitoring is defined as follows:
where indicates site availability at time , is the uptime, and is the response time for detected anomalies.
Synthetic monitoring not only provides observable capabilities with high real-time and wide coverage, but also provides continuity data support for fault prediction. Figure 1 shows the distribution of site access delay of synthetic monitoring under multi-node deployment, which shows that the response delay of city nodes increased steeply between 10:05 and 10:10, which was later investigated as a result of CDN node congestion[3].
III. Key Technologies for Synthetic Monitoring
A. Modeling Techniques for Simulating User Behavior
Modeling technology that simulates user behavior is the core of synthetic monitoring, and the key lies in accurately reproducing user access paths and interaction behaviors to obtain real service availability and performance indicators[4]. This technique usually adopts a script-driven approach to build user behavior models, and the mainstream tools include Selenium, Puppeteer and Playwright, which can write automated scripts to simulate the user’s actions in the browser, such as clicking, typing, jumping, waiting for the elements to load and so on [4]. In order to improve model generality and stability, finite state machines (FSM) or behavior trees are usually used to abstractly model user behaviors, define state nodes and transfer conditions, and form a structured process. At the same time, CSS selectors or XPath are used to locate page elements, and explicit wait mechanisms are combined to deal with asynchronous loading problems, thus reducing false positives. To improve test coverage, path traversal algorithms can also be introduced for complex sites to generate multi-path script combinations to automatically explore potential access scenarios. In addition, key performance indicators, such as time to first byte (TTFB), total loading time, DOM parsing time, etc., are captured during script execution, and log links are opened for subsequent correlation analysis[5].
B. Anomaly Detection and Root Cause Analysis Techniques
Anomaly detection and root cause analysis techniques in synthetic monitoring are mainly used to identify anomaly patterns and locate the root cause of faults by monitoring indicator fluctuations in real time and combining them with algorithmic models[6]. One of the commonly used anomaly detection formulas is the standard deviation method:
where is the current observation, is the historical mean and is the standard deviation. When exceeds a set threshold (e.g., 2 or 3), it is judged to be an anomaly. Another method is the sliding average prediction:
It is used to construct a normal trend line, which triggers an alert if the current value deviates too much from the predicted value . Root cause analysis can be combined with response path analysis algorithms to construct a topology map of service calls through request chain tracing (e.g., OpenTelemetry) to locate latency bottlenecks. Further latency impact metrics can be defined:
where is the response time of the first service, and the larger is, the more significant is the impact on the overall delay[7].
C. Fault Prediction and Automatic Repair Technology
Fault prediction and automatic repair technology relies on historical monitoring data, constructs a time series model to realize early warning, and combines with a strategy engine to automatically execute repair actions[8]. Commonly used prediction models such as ARIMA, whose basic form is:
where is the current observation, is the autoregressive coefficient, is the moving average coefficient, and is the white noise. The model is used to predict the future trend of performance indicators. Alternatively, a failure probability function can be introduced:
where is the failure rate and is the time, which is used to estimate the probability of service failure within a certain period of time. When the predicted value exceeds the threshold, automatic repair policies can be triggered, such as Pod restart or traffic switching [9]. The repair action can be guided by a minimum recovery time optimization function:
where, is the recovery time of the first option, and A\mathcal{A}A is the set of feasible actions. Through the prediction-response closed-loop mechanism, the system stability and self-healing ability are effectively improved [10].
IV. Experimental Analysis and Validation
A. Experimental Environment Setup
The experimental environment is built using a cloud-native architecture based on Kubernetes and deployed on an AliCloud ECS cluster. A microservice site containing front-end, back-end and database is first created with Nginx+Vue for the front-end, Spring Boot for the back-end and MySQL for the database.The infrastructure is deployed using Terraform automation to configure the VPC, Load Balancing and Security Group Policy. The synthetic monitoring module is based on Grafana Loki, Prometheus and Selenium Grid, and user behavior is simulated through custom probe scripts at regular intervals. All services are deployed as containers and managed through Helm for easy expansion and version control. Access to OpenTelemetry for distributed tracking to support subsequent root cause analysis and data collection.
B. Experimental Design and Procedure
The experiment compares synthetic and traditional monitoring in a shared cloud environment. Synthetic monitoring uses Selenium scripts to simulate user actions, while traditional monitoring relies on Prometheus metrics. Three faults are injected at set times, with detection, alert, and recovery metrics recorded. Data is stored in InfluxDB and visualized in Grafana to assess performance and availability.
C. Analysis and Discussion of Experimental Results
The response time and recovery efficiency of different monitoring methods are compared and analyzed under a variety of typical failure scenarios, and the specific experimental results are shown in Table 1.
Table 1 shows that synthetic monitoring detects faults 77% faster and recovers 40% quicker than traditional methods. It maintains higher user availability (98.5%–99.2%) versus 96.1%–97.4% in traditional monitoring across all failure scenarios. See Figure 2 for details.
In terms of alarm accuracy, this paper further compares the response quality, false alarm rate and missed alarm rate between synthetic and traditional monitoring, and the experimental statistics are summarized in Table 2.
Table 2 shows that synthetic monitoring is more advantageous in average response time control, maintaining at 215ms, which is slightly improved compared with 230ms of traditional monitoring. In terms of alarm quality, the accuracy of synthetic monitoring is as high as 95.6%, which is significantly better than the 84.2% of traditional monitoring. In terms of false alarm rate, synthetic monitoring is only 2.4%, while the traditional method reaches 6.7%, resulting in frequent false triggering of intervention strategies. The leakage rate, a key indicator of the stability of a surveillance system, is controlled at 1.8%, much lower than the 9.1% of the traditional method.
Comparing the performance of different monitoring methods during continuous operation, this paper records the dynamic changes in site availability and response latency between synthetic and traditional monitoring over a 10-minute period, as shown in Table 3.
As can be seen from Table 3, synthetic monitoring consistently maintains a high level of availability throughout the 10-minute test cycle, with an average of 99.75%, a high of 99.95%, and a low of 99.58%. The availability of traditional monitoring, on the other hand, generally fluctuates around 97.2%, with the lowest being only 97.25%, which is a larger fluctuation. In terms of latency, the average response time of synthetic monitoring basically stays within 210ms, for example, the 4th minute reaches a minimum of 202.6ms; while the latency of traditional monitoring is generally higher, and even reaches 255.7ms in the 2nd minute, which shows the response lag and instability.
V. Reach a Verdict
Synthetic Monitor demonstrates superior fault detection, response and recovery capabilities in cloud environments, effectively improving site availability and stability. By simulating user behavior modeling, introducing multi-dimensional anomaly detection algorithms and self-healing repair mechanisms, it realizes a complete closed loop from active sensing to automatic response. The experimental data verifies its real-time and accuracy advantages in complex scenarios, and it has good engineering adaptability and application promotion value. In the future, we can further integrate multi-source monitoring data, optimize the model generalization ability, and introduce reinforcement learning strategy to achieve dynamic self-optimization of fault handling decision-making, so as to continuously enhance the reliability guarantee capability of the cloud platform.
References
- Cao J ,Zhang C ,Qi P , et al. Utility-driven virtual machine allocation in edge cloud environments using a partheno-genetic algorithm [J]. Journal of Cloud Computing, 2025, 14 (1): 15-15. [CrossRef]
- Ibrahim Y I ,Yasin M H . Deep Learning Techniques for Threat Detection in Cloud Environments: A Review [J]. Asian Journal of Research in Computer Science, 2025, 18 (3): 325-334. [CrossRef]
- Chandrasiri S ,Meedeniya D . Energy-Efficient Dynamic Workflow Scheduling in Cloud Environments Using Deep Learning [J]. Sensors, 2025, 25 (5): 1428-1428. [CrossRef]
- Salameh O ,Wittevrongel S . An analytical model of a cluster-based service system with application to a cloud environment [J]. Cluster Computing, 2025, 28 (4): 272-272. [CrossRef]
- Hua X ,Zhan X ,Li F , et al. Financial service composition with various privacy levels in multiple cloud environment [J]. Journal of Cloud Computing, 2025, 14 (1): 11-11. [CrossRef]
- Attou H ,Guezzaz A ,Benkirane S , et al. A New Secure Model for Cloud Environments Using RBFNN and AdaBoost [J]. SN Computer Science, 2025, 6 (2): 188-188. [CrossRef]
- Umarani G S ,R. G . Effectiveness Review of the Machine Learning Algorithms for Scheduling in Cloud Environment [J]. Archives of Computational Methods in Engineering, 2023, 30 (6): 3769-3789. [CrossRef]
- Kashav A ,Kumar T T . Energy-efficient virtual machine scheduling in IaaS cloud environment using energy-aware green-particle swarm optimization [J]. International Journal of Information Technology, 2023, 15 (4): 1927-1935. [CrossRef]
- D. M ,S. V L . An Efficient Wolf Optimizer System for Virtual Machine Placement in Wireless Network Over the Cloud Environment [J]. Wireless Personal Communications, 2023, 129 (3): 2141-2156. [CrossRef]
- Ankita S ,Narander K . Multi-Objective Binary Whale Optimization-Based Virtual Machine Allocation in Cloud Environments [J]. International Journal of Swarm Intelligence Research (IJSIR), 2023, 14 (1): 1-23. [CrossRef]
Figure 1.
Synthetic Monitoring: Latency Distribution Across Nodes.
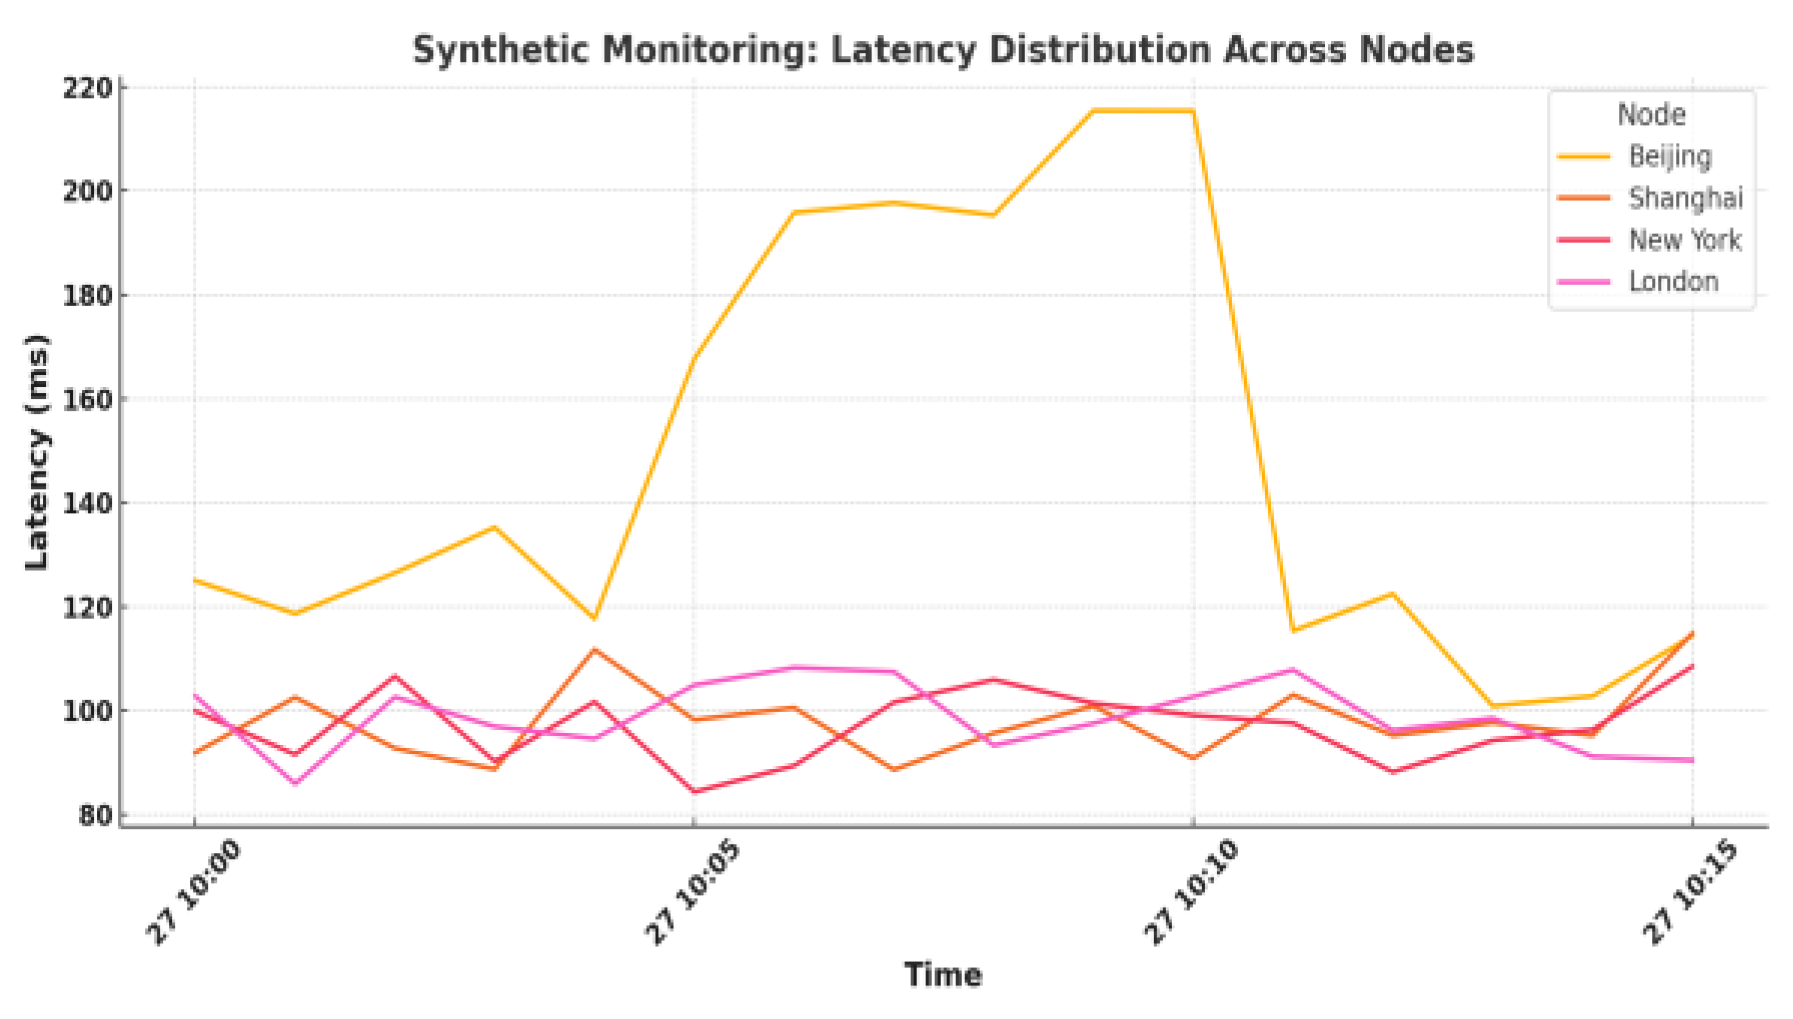
Figure 2.
comparative analysis.
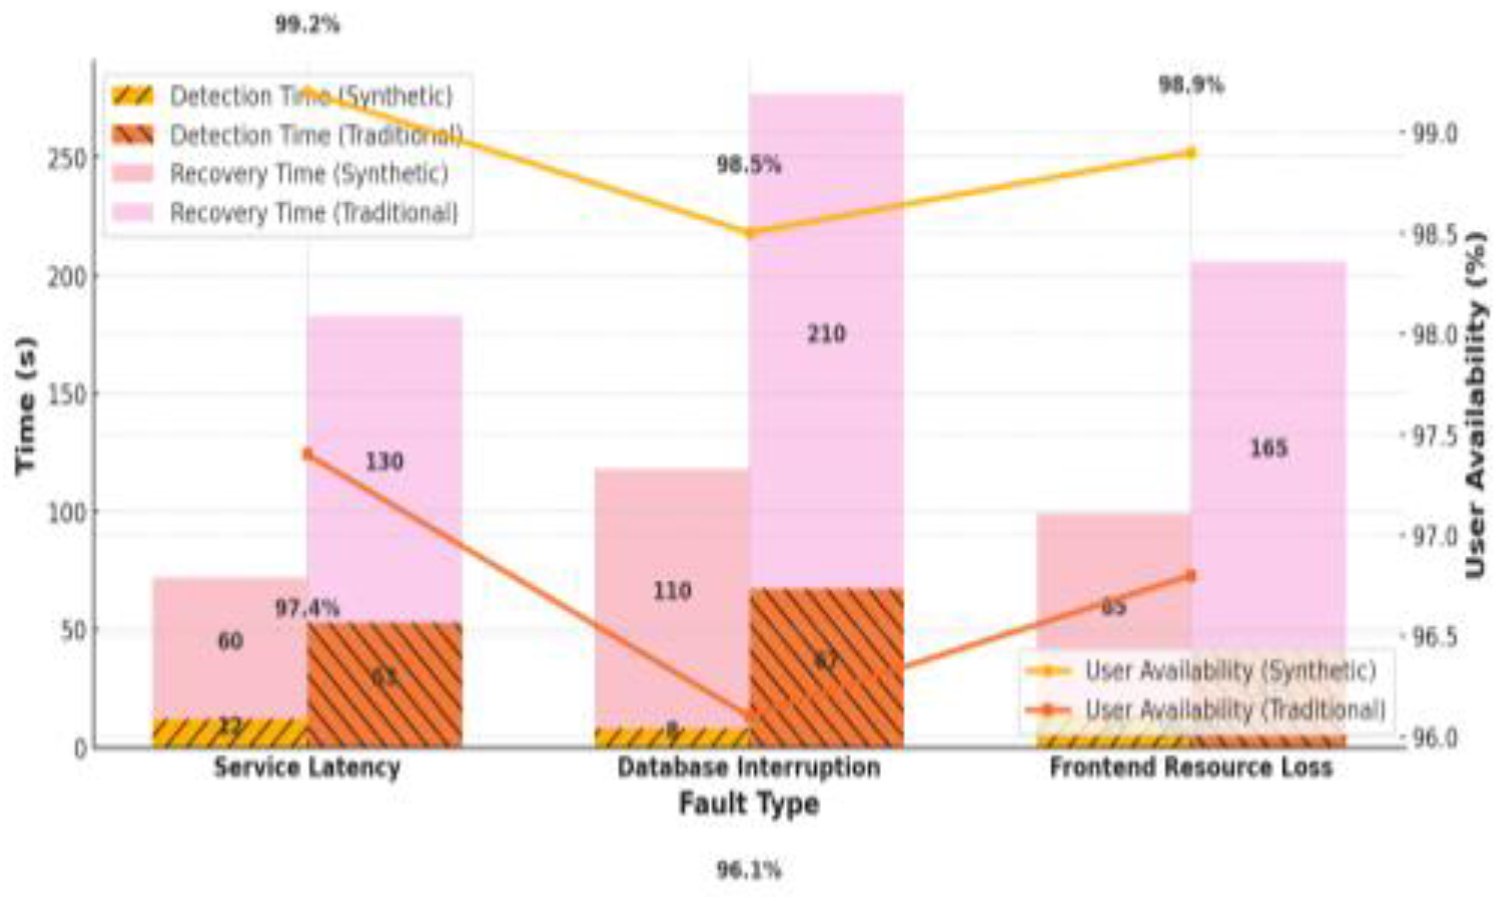

Table 1.
Comparison of Monitoring Methods in Fault Detection and Recovery Efficiency.
| Fault Type | Monitoring Method | Detection Time (s) | Recovery Time (s) | User Availability (%) |
| Service Latency | Synthetic | 12 | 60 | 99.2 |
| Database Interruption | 8 | 110 | 98.5 | |
| Frontend Resource Loss | 14 | 85 | 98.9 | |
| Service Latency | Traditional | 53 | 130 | 97.4 |
| Database Interruption | 67 | 210 | 96.1 | |
| Frontend Resource Loss | 41 | 165 | 96.8 |
Table 2.
Comparative Analysis of Alarm Performance.
| Monitoring Method | Avg. Response Time (ms) | Alert Accuracy (%) | False Alarm Rate (%) | Missed Detection Rate (%) |
| Synthetic | 215 | 95.6 | 2.4 | 1.8 |
| Traditional | 230 | 84.2 | 6.7 | 9.1 |
Table 3.
Minute-Level Availability and Latency Comparison.
| Time (min) | Availability (%) - Synthetic | Availability (%) - Traditional | Avg. Latency (ms) - Synthetic | Avg. Latency (ms) - Traditional |
| 1 | 99.85 | 97.26 | 184.5 | 252.3 |
| 2 | 99.58 | 97.78 | 216.5 | 255.7 |
| 3 | 99.7 | 97.5 | 218.6 | 236.7 |
| 4 | 99.95 | 97.25 | 202.6 | 220.3 |
| 5 | 99.87 | 97.38 | 232.7 | 244.8 |
| 6 | 99.3 | 97.33 | 195.5 | 252.3 |
| 7 | 99.69 | 97.8 | 210.5 | 268.5 |
| 8 | 99.47 | 97.12 | 208.1 | 268 |
| 9 | 99.48 | 97.33 | 225.3 | 244.2 |
| 10 | 99.58 | 96.86 | 224.7 | 245.5 |
Disclaimer/Publisher’s Note: The statements, opinions and data contained in all publications are solely those of the individual author(s) and contributor(s) and not of MDPI and/or the editor(s). MDPI and/or the editor(s) disclaim responsibility for any injury to people or property resulting from any ideas, methods, instructions or products referred to in the content. |
© 2025 by the authors. Licensee MDPI, Basel, Switzerland. This article is an open access article distributed under the terms and conditions of the Creative Commons Attribution (CC BY) license (http://creativecommons.org/licenses/by/4.0/).
Copyright: This open access article is published under a Creative Commons CC BY 4.0 license, which permit the free download, distribution, and reuse, provided that the author and preprint are cited in any reuse.


