
Submitted:
12 September 2025
Posted:
16 September 2025
You are already at the latest version
Abstract
Transmission and reflection spectra of single-crystal germanium plates were experimentally measured in the terahertz spectral range. The optical parameters of germanium were determined at various Sb-doping levels. Saturation of the absorption index was detected with increasing wavelength in the range of 1000-3000 μm. The optical parameters of germanium correspond to the Drude-Lorentz model.
Keywords:
terahertz
; germanium
; transmittance
; reflectance
; refractive index
; absorption coefficient
; extinction coefficient
1. Introduction
Germanium is one of the main materials of modern electronics [1]. Many physical phenomena in semiconductors were first studied in this material. Germanium is widely used for optical applications in the infrared (IR) region of the spectrum. The advantages of germanium appear when it is used in atmospheric transparency windows of 3-5 and 7-14 microns, which makes it possible to manufacture optoelectronic devices, such as IR cameras, IR thermal imagers, IR sights, etc. In addition to its work in active devices and use in detection structures, germanium finds use as an optical material in spectral devices for the manufacture of IR lenses, prisms, and optical windows [2].
Studies of the optical properties of Ge were mainly carried out in the IR region of the spectrum where the characteristics of germanium are already well known [3,4,5], while these in the terahertz region (10-0.1 THz, 30-3000 microns) have so far been studied much less. There are only several papers on this subject [6,7,8,9,10,11,12]. Optical spectra of germanium at the photon energy less than the band gap are determined by the light interaction with the band gap energy states, phonons, and free charge carriers - electrons and holes. The interaction of radiation with germanium is characterized by the refractive index n, dielectric constant ε, extinction coefficient k, absorption coefficient α, conductivity σ, and other material constants. Knowledge of these constants makes it possible to describe the propagation of electromagnetic radiation in a material medium.
The study of the optical properties of germanium in the terahertz spectral range is based on measuring the reflection and transmission spectra of Ge plates of different thicknesses [8,9,11]. The absorption coefficient spectra α were obtained in the wavelength range of 60–1500 μm [8] for germanium plates with five different levels of antimony doping. The absorption coefficient increases in the range of 200–1500 μm. The refractive index spectra of Ge were studied in the range of 39-71 μm (4.2–7.7 THz) in the temperature range of 4–296 K [10]. The refractive index increases with increasing temperature. Real permittivity of Ge increases with increasing temperature from 15 to 16.3 in the range of 4 –350 K. Excitation of Ge surface with femtosecond optical pulses generates THz pulses [13]. The amplitude of THz pulses depends on the angle between the optical field vector and crystalline axes. Arsenic donor in Ge was investigated with time-domain spectroscopy [14]. The decay time of excited states was found as 0.8 ns and 0.6 ns. The THz radiation, in the range of 0.36 – 2.67 THz both creates free holes through photoionization of Ga and induces the cyclotron resonance of these holes at Ga-doped germanium [15].
Free-carrier absorption on free charge carriers at wavelength range greater than 200 μm manifestly depends on the carrier concentration. Note that absorption is possible both on free electrons and on free holes and absorption coefficient [16] is
where L(λ) describes the interaction of radiation with phonons (lattice absorption) [17,18]. The terms Ah(λ)p and Ae(λ)n describe the free-carrier absorption where p and n are the concentrations of free holes and electrons while Ah and Ae are the corresponding cross-sections. It was found [16] that at 10.6 µm wavelength, Ah=5.33·10-16 cm2 and Ae=0.34·10-16 cm2.
α = L(λ)+Ah(λ)p+Ae(λ)n,
The optical properties of germanium and its application in photonics are described in [19]. The electrical properties of germanium are described in [20].
Germanium optical windows protect the photodetector from atmospheric influences, provide transmission of IR radiation and screening from external electromagnetic fields [6,7]. The efficiency of this screening depends on the concentration of free carriers [6].
We investigated a set of eleven samples with different carrier concentrations. In order to determine the dependence of transmission, reflection, absorption and optical parameters of the samples on their doping level, a set of samples with a donor impurity concentration of 2.46·1013 cm-3 – 9.1·1014 cm-3 was investigated. Antimony was used as an impurity, since it is often used by manufacturers of germanium plates to obtain n-type doping.
2. Materials and Methods
To study the interaction of terahertz radiation with single-crystalline germanium at room temperature, we used Sb-doped n-type Ge blanks with a diameter of 50 mm and a thickness of 3 mm, manufactured by Vital Advanced Materials Co., Ltd, China, and polished them on both sides by Tydex, LLC, Russia. The resulting plates had orientation (100). Eleven plates with room temperature resistivities ranging from 1.45 to 49.88 Ohm·cm were studied. The parameters of germanium plates are shown in Table 1. This range of resistivity values was chosen because it covers all applications of germanium in optics, including optical windows and lenses and electromagnetic shielding. The donor concentration Nd for the average resistivity in the intervals given in Table 1 varied from 2.46·1013 cm-3 to 9.1·1014 cm-3, where the lowest value is close to the intrinsic concentration in Ge at room temperature.
Spectral measurements of germanium plates were performed at room temperature on a Bruker Vertex 70 Fourier spectrometer in the range of 1.5 – 670 µm and on a Menlo Systems TERA K8 time-domain terahertz spectrometer [21] in the range of 200 – 3000 µm. The experimental methodology is described in detail in [21,22].
Transmission of germanium plates was measured at normal beam incidence. Reflection was measured at beam incidence at 12 degrees to the normal to the plate surface. This makes it possible to ignore the polarization of the incident radiation.
The hole concentration p0 for the average resistivity value in the intervals given in Table 1 is calculated using the formula [1]
where ni is the intrinsic concentration and n0 = ni+Nd is the free carrier concentration. The donor concentration Nd was determined from the experimental dependencies of resistivity on the donor concentration [19]. The plasma frequency ωpn was calculated [23] as
where ε0 is the permittivity of vacuum, εL is the dielectric constant of the semiconductor and mn is the effective mass.
Calculation of the refractive index n, extinction coefficient k and absorption coefficient α in the region of 200 – 3000 μm based on experimental measurements were carried out using the TeraLyzer Data Extraction Software package. The measurement includes at least one echo pulse within the measured time window. The quantity α is related to k as
α=4πk/λ.
3. Results and Discussions
We calculated the optical constants of germanium using experimental transmission and reflection spectra. The transmission spectra are shown in Figure 1. In the spectral range 1.88 – 11.5 µm there is a transparency window. For a 3 mm plate, the transmittance is 0.46-0.47. Calculation of the refractive index in this spectral region gives the values n = 4.03 ± 0.03. These data are consistent with previously published results [10]. This spectral range is used to make IR lenses, prisms, and optical windows.
The phonon absorption spectra were observed in the spectral range 11.5 – 300 µm. Since single-phonon absorption in germanium is prohibited, the transmission spectra clearly show absorption peaks related to various combinations of two phonons. These phonon combinations can be found in [3,4,16,17,18]. Free carrier absorption clearly manifests itself in the spectral range of 200 – 3000 µm. It occurs also both in the region of the transparency window and in the region of phonon absorption and overlaps with them, but at the existing free carrier concentrations of free carriers makes a small contribution for the wavelengths less than 200 μm. Transmission in the region of free carrier absorption decreases with the increase of donor concentration.
The experimental reflection spectra of the plates are shown in Figure 2.
The reflectance spectra of the plates clearly show a dependence of the reflectance on the donor concentration (Figure 2b). The reflection increases from sample #1 to sample #11, i.e. with a decrease in the donor concentration and, consequently, the concentration of free electrons. The reason for this dependence is multiple reflections from the germanium–air interfaces. The absorption coefficient α depends on the concentration of carriers - the higher the concentration, the greater the absorption. Therefore, the intensity of echo pulses depends on the absorption in the germanium plate. In plates with a higher concentration of free carriers, the intensity of echo pulses is lower.
From the given spectra it follows that in plates the reflection increases at wavelengths growth. This is due to the presence of plasma resonance (see Table 1). At wavelengths exceeding the plasma resonance wavelength λpn, reflection can increase up to 90% due to the formation of plasma waves [4,28]. For samples #1 and #2, the plasma resonance wavelengths are located directly in the measured region. For sample #3 it is close to it. The increase in reflection from plates #10 and #11 at long wavelengths (more than 2500 μm) may be associated with plasma resonance of electron-hole pairs. The plasma frequency of pairs can exceed that calculated by formula (2) by approximately 1.5 times [29,30]. The formula (2) is derived at assumption of oscillations of electrons (or holes) relative motionless impurity atoms. When oscillations take place at electron – hole plasma then both electrons and holes are movable and formula (2) is inapplicable and we have to use results of [29,30]. The role of electron-hole pair oscillations will be greater at a low concentration of free electrons, when the number of free holes is greater. Samples #10 and #11 have more oscillating pairs than other samples.
If we assume that the absorption cross sections Ah and Ae remain the same as at a wavelength of 10.6 μm [16], then it is clear that in samples #6-#11 the main contribution to the absorption is brought by free holes, and in plates #1 - #5 - by free electrons. But the contribution of free holes in plates #3 - #5 still remains noticeable, and only in plates #1 and #2, that is for the impurity concentration more than 3·1014 cm-3, electron absorption dominates.
Combinational phonon absorption in the range of 11.5 – 70 µm weakly depends on the germanium doping level.
As follows from the equations given in [30], the real part of the dielectric constant
and its imaginary part
where <τ> is the energy averaged mean free time. Γ1 and Γ2 are correction functions. Based on ε1 and ε2, model values of n, k and α were calculated. In this case, the value of the momentum relaxation time, determined from the table values of electron mobility, is taken as <τ>, and Γ1 and Γ2 are taken equal to 1. If we take into account that in Ge the typical mobility of electrons at room temperature is 3900 cm2/V·s and the mobility of holes is 1900 cm2/V·s [20], then we obtain an average mean free time for electrons of 2.7·10-13 s and that for holes - 5.4·10-13 s.
The refractive index and extinction coefficient are defined as
Figure 3 shows the refractive index spectra calculated on the basis of experimental dependences (Figure 3a) using the TeraLyzer Data Extraction Software package and model calculations with formula (7) (Figure 3b). One can see the qualitative resemblance of these spectra. Some difference may be due to the using of simplified relaxation times and correction functions in the calculations.
The refractive index decreases with increasing doping level. The reason for this dependence is the influence of free carriers on the dielectric constant, since free carriers in the external field of the light wave are redistributed and partially screen this field, changing the value of the polarization vector [28,29,30]. This result follows from the Drude-Lorentz equation. The donors themselves can also influence the polarization vector due to the difference in the polarizability of impurity atoms from the polarizability of atoms of the main material. But at the values of donor concentration in the studied samples, this effect can be neglected, since the maximum donor concentration in the samples is ~ 1015 cm-3, and the density of germanium atoms is 4.45·1022 cm-3. The refractive index in the wavelength range of 37-75 μm is close to that obtained in [10].
Figure 4 shows the wavelength dependences of the experimental and model calculation of the extinction coefficient. It was calculated on the basis of experimental dependences (Figure 4a) using the TeraLyzer Data Extraction Software package and model calculations with formula (8) (Figure 4b). They demonstrate qualitative agreement. The extinction coefficient (Figure 4a) increases both with increasing wavelength and with increasing doping level. This behavior is consistent with model calculations using formula (8) (Figure 4b).
The results of experimental and model calculations of the absorption coefficient α are shown in Figure 5. These calculations are made using formula (4) based on the data in Figure 4.
The absorption coefficient is a complex function of frequency. The peculiarity of the range 200 – 3000 microns consists in its intermediate position between the high-frequency and low-frequency limits. The dielectric constant (formulas 5, 6) in the presence of free electrons contains the factor 1/(1+ω2 τ2), where ω is the angular frequency of electromagnetic radiation and τ is the average mean free time of electrons. This factor is included in both the real and imaginary parts of the dielectric constant [32,33]. Mean free time was used for electrons of 2.7·10-13 s. That is, in the IR region of the spectrum ω2τ2 >>1 and α ~ ω-2 ~ λ2, which corresponds to the Drude - Lorentz model [31]. But in the terahertz range, ω2τ2 is approximately 6.25 at a wavelength of 200 μm and 0.03 at a wavelength of 3000 μm. As a result, this leads to a dependence of the absorption coefficient on the wavelength in the range of 200 – 1800 µm, where ω2τ2 >1, and the absence of such a dependence at the wavelength values greater than 1800 µm, where ω2τ2<<1. Thus, free carrier absorption changes at the high-frequency terahertz range and is independent of wavelength as it approaches 3000 μm. As can be seen from Figure 5 (a), the light absorption increases in the range of 200 – 1800 µm, and then, up to 3000 µm, does not depend on the wavelength.
4. Conclusions
The reflection and transmission spectra of n-type Ge with a resistivity of 1.45 – 49.88 Ohm·cm were measured at room temperature in the wavelength range 1.88 – 3000 µm. The terahertz spectral range is quite difficult for studying the optical parameters of germanium [10]. Our measurements showed the wavelength dependence of reflection, transmission, and absorptivity in Ge at various doping levels up to intrinsic concentration. Based on the experimental spectra, the refractive index n, extinction coefficient k and absorption coefficient α of germanium plates were found using the TeraLyzer Data Extraction Software package. The absorption coefficient increases in the range of 200 – 1800 µm, and then, up to 3000 µm, does not depend on the wavelength. This nature of the dependence of the absorption coefficient α on the wavelength qualitatively corresponds to the model calculation.
CRediT authorship contribution statement: Alexey Shakhmin: Validation, Formal analysis, Investigation, Resources, Data Curation, Visualization. Victoria Gerasimova: Software, Formal analysis, Data Curation, Visualization. Sergey Musikhin: Methodology, Software, Formal analysis, Data Curation, Writing - Original Draft, Writing - Review & Editing, Visualization. Grigory Kropotov: Conceptualization, Methodology, Resources, Writing - Review & Editing, Supervision, Project administration, Funding acquisition.
Acknowledgments
Tydex company resources were used at performing the work.
Declaration of competing interest: The authors declare that they have no known competing financial interests or personal relationships that could have appeared to influence the work reported in this paper.
References
- Sze, S.M.; Ng, K.K. Physics of Semiconductor Devices. John Wiley & Sons, Hoboken, New Jersey, USA; 2007; p. 815.
- Harris, D.C. Materials for infrared windows and domes: properties and performance. SPIE – The international society for optical engineering. Bellingham, Washington; 1999; p. 403.
- Ukhanov, Yu.I. Optical properties of semiconductors. Moscow, Russia, 1977; p. 366.
- Pankove, J.I. Optical processes in semiconductors. New York, USA, 1975; p. 422.
- Moss, T.S.; Burrel, G.J.; Ellis, B. Semiconductor Opto-Electronics. Butterworth &Co., Haisted, New York, USA, 1973; p. 441.
- Ҫat, Y.; Baran, V.; Afacan, G.; Coşar, M.B; Ӧzcelik, S. Investigation of electromagnetic interference shielding effectiveness of CZ grown Ge optical windows. Crystal Research & Technology 2018, 53, 1800069. [Google Scholar]
- Ҫat, Y.; Baran, V.; Ӧzçelik, S. EMI shielding effectiveness and heater behavior for Ge IR windows. Phys. Status Solidi A 2019, 1900005. [Google Scholar]
- Kaplunov, I.A.; Kolesnikov, A.I.; Kropotov, G.I.; Rogalin, V.E. Optical properties of single-crystal germanium in the THz range. Optics and spectroscopy 2019, 126, 191–194. [Google Scholar] [CrossRef]
- Kaplunov, I.A.; Rogalin, V.E. Optical properties and applications of germanium in photonics. Photonica 2019, 13, 88–106. [Google Scholar] [CrossRef]
- Naftaly, M.; Chick, S.; Matmon, G.; and Murdin, B. Refractive Indices of Ge and Si at Temperatures between 4-296 K in the 4 – 8 THz Region. Applied Sciences 2021, 11, 487. [Google Scholar] [CrossRef]
- Kaplunov, I.A.; Smirnov, Yu.M.; Kolesnikov, A.I. Optical transparency in crystalline germanium. J. Opt. Technol. 2005, 72, 214–220. [Google Scholar] [CrossRef]
- Grischkowsky, D.; Keiding, S.; van Exter, M. , and Fattinger, Ch. Far-infrared time-domain spectroscopy with terahertz beams of dielectrics and semiconductors. J. Opt. Soc. Am. B 1990, 7, 2006–2015. [Google Scholar] [CrossRef]
- Krotkus, A.; Nevinskas, I.; Norkus, R. Semiconductor Characterization by Terahertz Excitation Spectroscopy. Materials 2023, 16, 2859. [Google Scholar] [CrossRef]
- Gill, T. B.; Kidd, C.; Dean, P.; Burnett, A. D.; Dunn, A.; Pavlov, S. G.; Abrosimov, N. V.; Hübers, H.-W.; Linfield, E.H.; Davies, A.G.; and Freeman J., R. Ultrafast Two-Dimensional Time-Domain Spectroscopy of Hydrogen-Like Impurity Centers in Germanium. Proceedings of the 47th International Conference on Infrared, Millimeter and Terahertz Waves, 2022. [Google Scholar]
- Bernáth, B.; Gogoi, P.; Marchese, A.; Kamenskyi, D.; Engelkamp, H.; Arslanov, D.; Redlich, B.; Christianen, P. C. M. and Maan, J. C. Nonlinear terahertz transmission spectroscopy on Ga-doped germanium in high magnetic fields. Phys. Rev. B 2022, 105, 205204. [Google Scholar] [CrossRef]
- Hatchinson, C.J.; Lewis, C.; Savage, J.A.; Pitt, A. Surface and bulk absorption in germanium at 10.6 μm. Applied optics 1982, 21, 1490–1495. [Google Scholar] [CrossRef] [PubMed]
- Johnson, F.A.; Loudon, R. Critical point analysis of the phonon spectra of diamond, silicon and germanium. Proceedings of the Royal society A 1964, 281, 274–290. [Google Scholar]
- Johnson, F.A. Lattice Bands in Diamond and Zinc Blende Crystals. Progress in Semiconductors 1965, 9, 179–235. [Google Scholar]
- Kropotov, G.; Rogalin, V.; Kaplunov, I. Germanium single crystals for photonics. Crystals 2024, 14, 796. [Google Scholar] [CrossRef]
- Brooks, H. Theory of the Electrical properties of Germanium and Silicon. Advances in Electronics and Electron Physics 1955, 7, 85–182. [Google Scholar]
- Terahertz Metrology. Naftaly, M., Ed., Artech House, Boston, London, USA, 2015, p. 359.
- Kropotov, G.I.; Shakhmin, A.A.; Kaplunov, I.A.; Rogalin, V.E. Application of Spectral Devices in the Optical Engineering and Scientific Research. Photonics 2023, 17, 378–392. [Google Scholar]
- Yu, P. Y. and Cardona, M., Fundamentals of semiconductors, 2005 3rd edition, p. 639.
- Sze, S.M.; Irvin, J.C. Resistivity, Mobility, and impurity levels in GaAs, Ge, and Si at 300 K. Solid State Electron. 1968, 11, 599–602. [Google Scholar] [CrossRef]
- Fan, H.Y. Infra-red absorption in semiconductors. Reports on progress in physics 1956, XIX, 107–155. [Google Scholar] [CrossRef]
- Moss, T.S. Optical properties of semi-conductors. Butterworths Publications Ltd, London, 1959, p. 279.
- Spitzer, W.G. and Fan H.Y. Determination of optical constants and carrier effective mass of semiconductors. Physical Review 1957, 106, 882–890. [Google Scholar] [CrossRef]
- The infrared handbook. W.L. Wolfe, G.J. The infrared handbook. W.L. Wolfe, G.J. Zissis, Eds., IRIA Center, Environmental Research Institute of Michigan, 1993.
- Cavaliere, A. Relativistic limits to non-linear plasma oscillations. Nuovo Cimento 1962, 23, 440–413. [Google Scholar] [CrossRef]
- Kichigin, G.N.; Strokin, N.A. Energy release processes in space plasma. ISTU, Irkutsk 2007, p. 396.
- Klingshirn, C.F. Semiconductor Optics. Springer. 2012 4th edition, p. 849.
- Ristić, S.; Prijić, A.; Prijić, Z. Dependance of static dielectric constant of silicon on resistivity at room temperature. Serbian journal of electrical engineering 2004, 1, 237–247. [Google Scholar] [CrossRef]
- Alfaramawi, K. Correlation between electron mobility and static dielectric permittivity of n – InSb. Open Phys. 2015, 13, 334–338. [Google Scholar] [CrossRef]
Figure 1.
(a) Experimental transmittance spectra of germanium plates 3 mm thick at IR and THz regions; (b) Transmittance spectra at THz region. The arrow shows the order of samples from #1 to #11 corresponding to decrease of the electron concentration.
Figure 1.
(a) Experimental transmittance spectra of germanium plates 3 mm thick at IR and THz regions; (b) Transmittance spectra at THz region. The arrow shows the order of samples from #1 to #11 corresponding to decrease of the electron concentration.
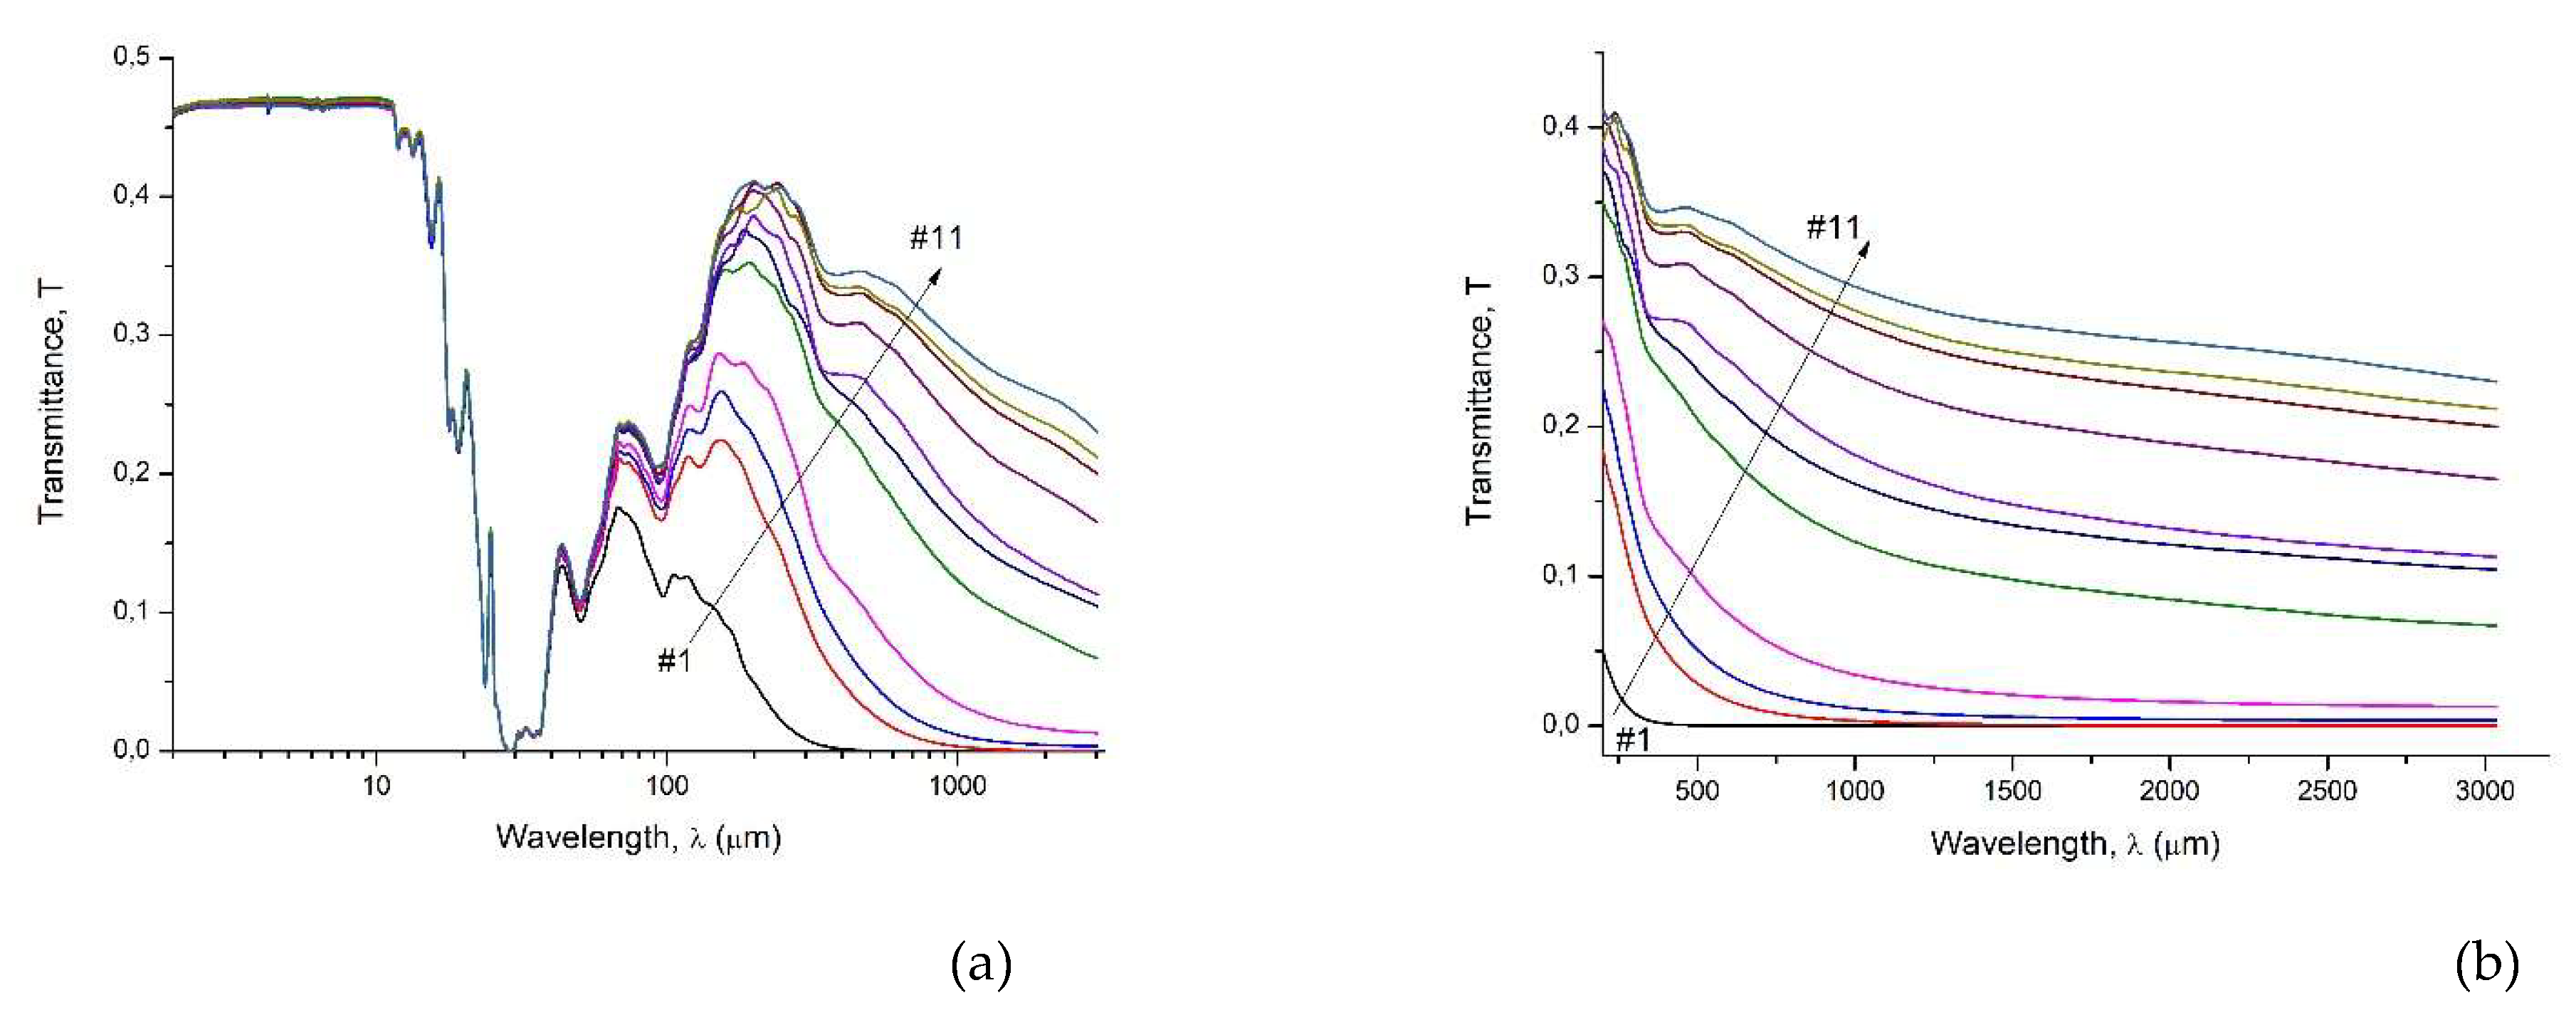
Figure 2.
(a) Experimental reflectance spectra of germanium plates at IR and THz regions; (b) Reflectance spectra at THz region. The arrow shows the order of samples from #1 to #11 corresponding to decrease of the electron concentration.
Figure 2.
(a) Experimental reflectance spectra of germanium plates at IR and THz regions; (b) Reflectance spectra at THz region. The arrow shows the order of samples from #1 to #11 corresponding to decrease of the electron concentration.
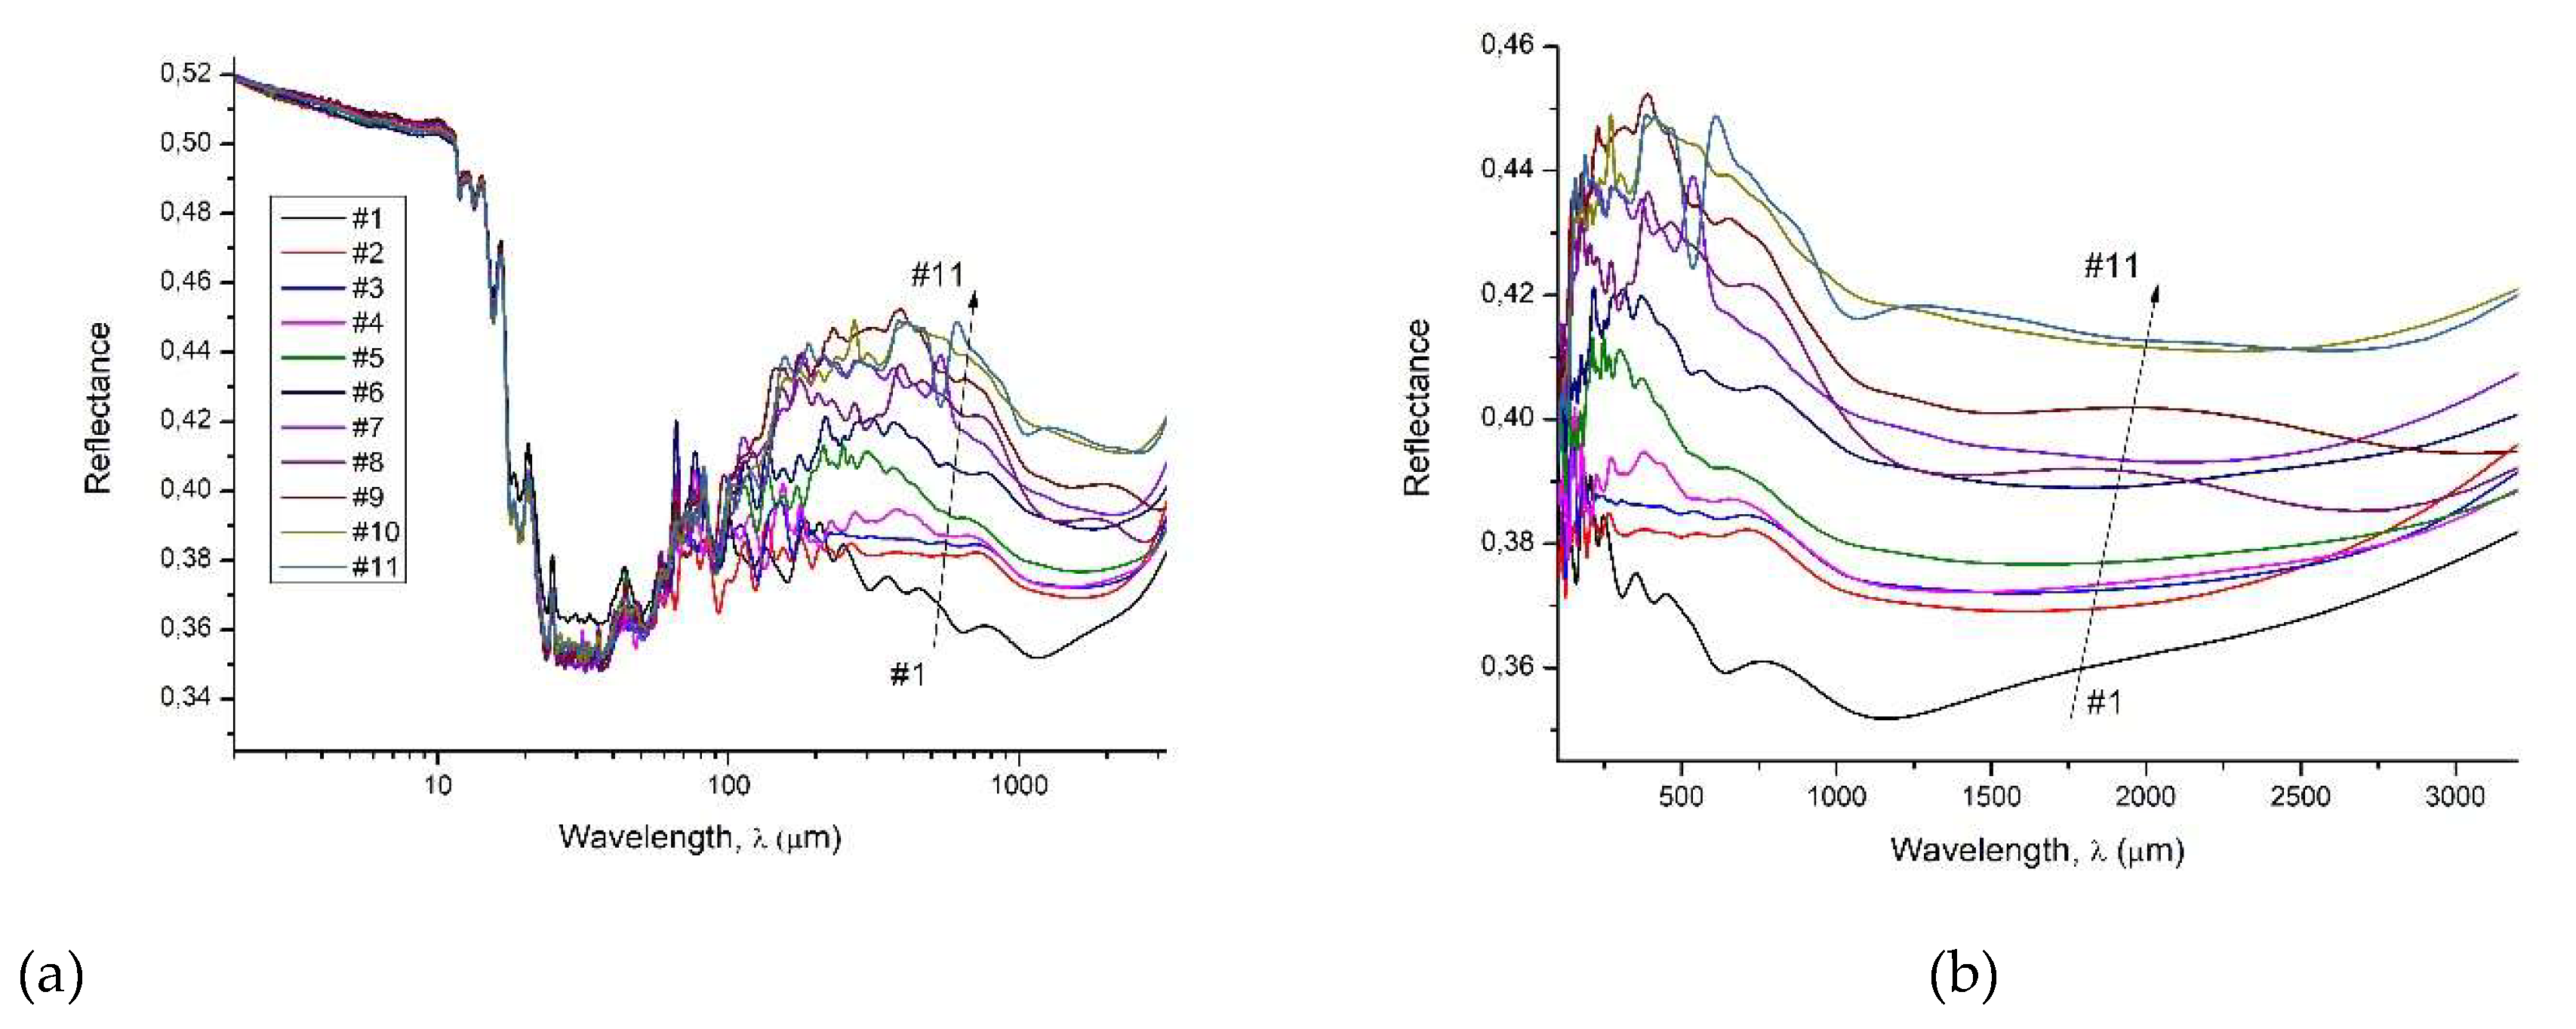
Figure 3.
(a) Refractive index n of germanium plates calculated from experimental measurements using the TeraLyzer Data Extraction Software package; (b) Refractive index n of germanium plates calculated with formula (7). The arrows indicate the order of samples from #1 to #11 corresponding to decrease of the electron concentration.
Figure 3.
(a) Refractive index n of germanium plates calculated from experimental measurements using the TeraLyzer Data Extraction Software package; (b) Refractive index n of germanium plates calculated with formula (7). The arrows indicate the order of samples from #1 to #11 corresponding to decrease of the electron concentration.
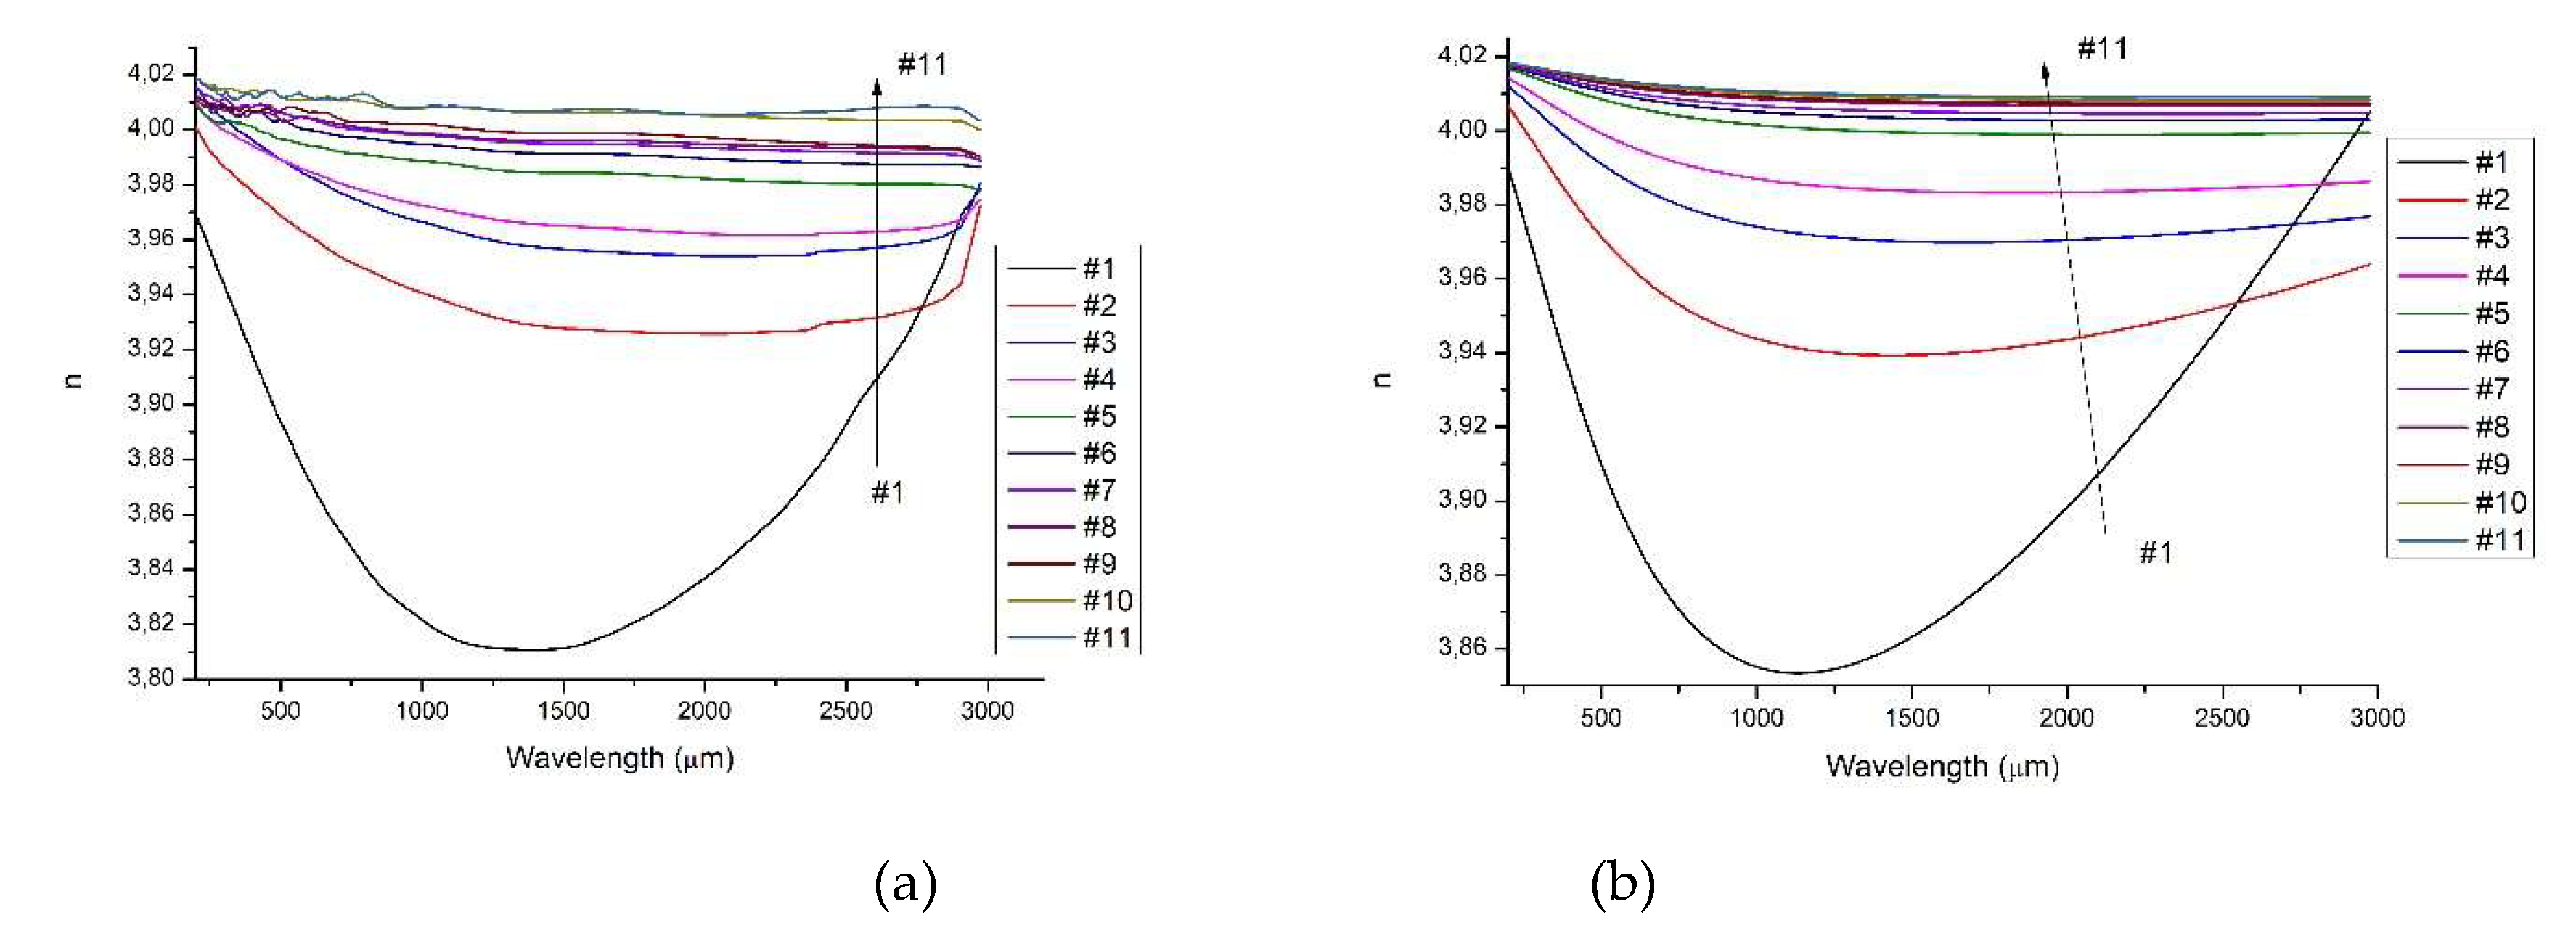
Figure 4.
(a) Spectra of the extinction coefficient k calculated from experimental measurements by using the TeraLyzer Data Extraction Software package; (b) Spectra of the extinction coefficient k calculated with formula (8). The arrows indicate the order of the samples from #1 to #11, corresponding to decrease of the electron concentration.
Figure 4.
(a) Spectra of the extinction coefficient k calculated from experimental measurements by using the TeraLyzer Data Extraction Software package; (b) Spectra of the extinction coefficient k calculated with formula (8). The arrows indicate the order of the samples from #1 to #11, corresponding to decrease of the electron concentration.
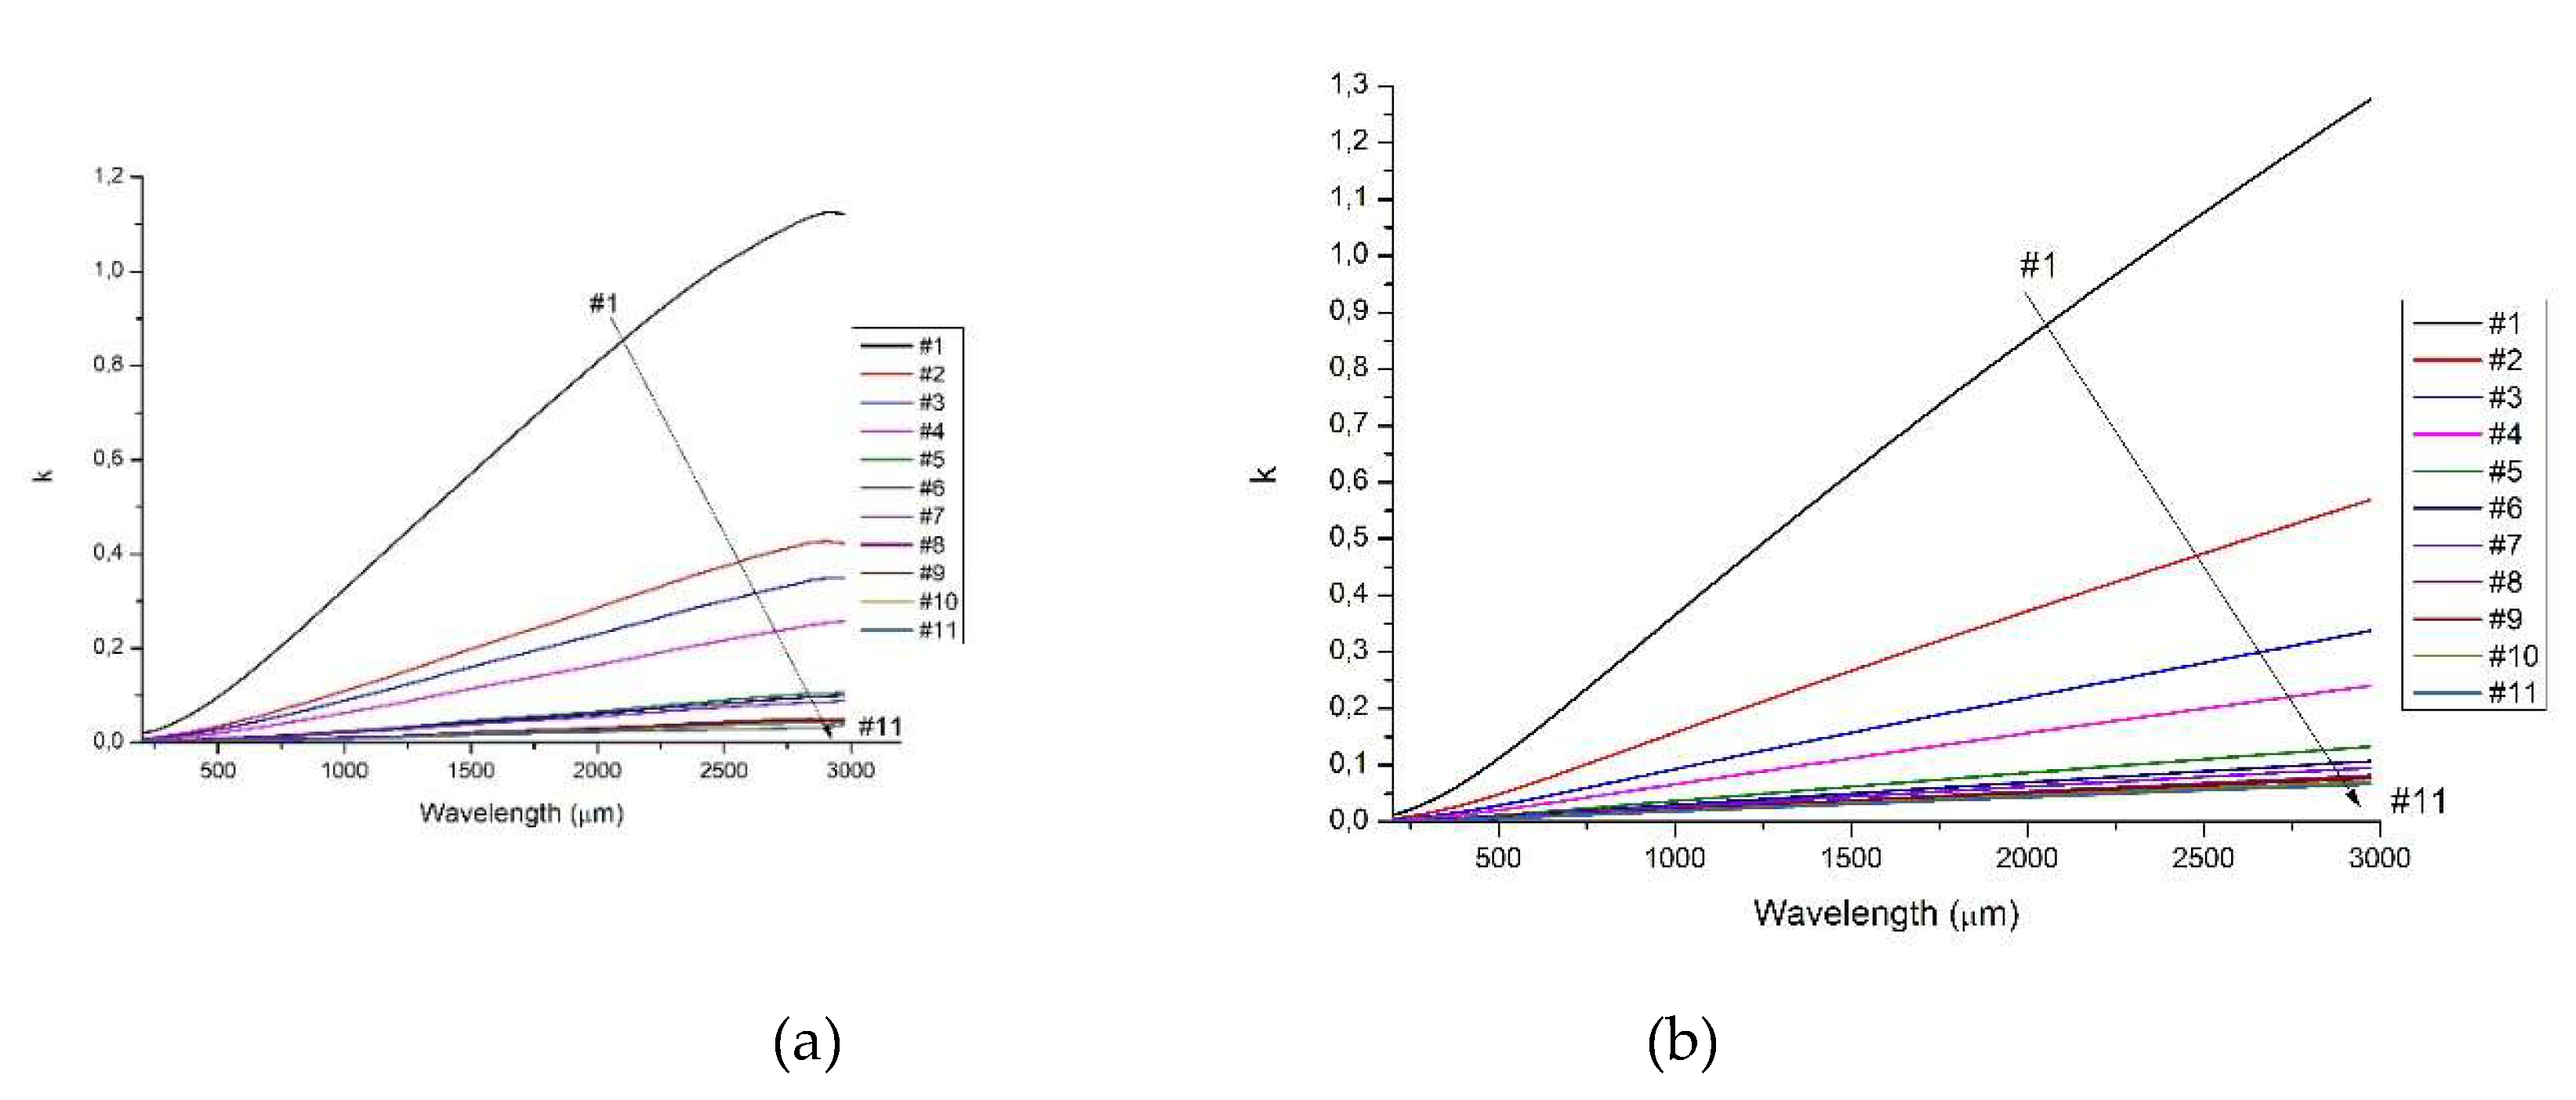
Figure 5.
(a) Calculated spectra of absorption coefficient α based on results of figure 4 (a); (b) Calculated spectra of absorption coefficient α based on results of figure 4 (b). The arrows indicate the order of samples from #1 to #11 corresponding to decrease of the electron concentration.
Figure 5.
(a) Calculated spectra of absorption coefficient α based on results of figure 4 (a); (b) Calculated spectra of absorption coefficient α based on results of figure 4 (b). The arrows indicate the order of samples from #1 to #11 corresponding to decrease of the electron concentration.
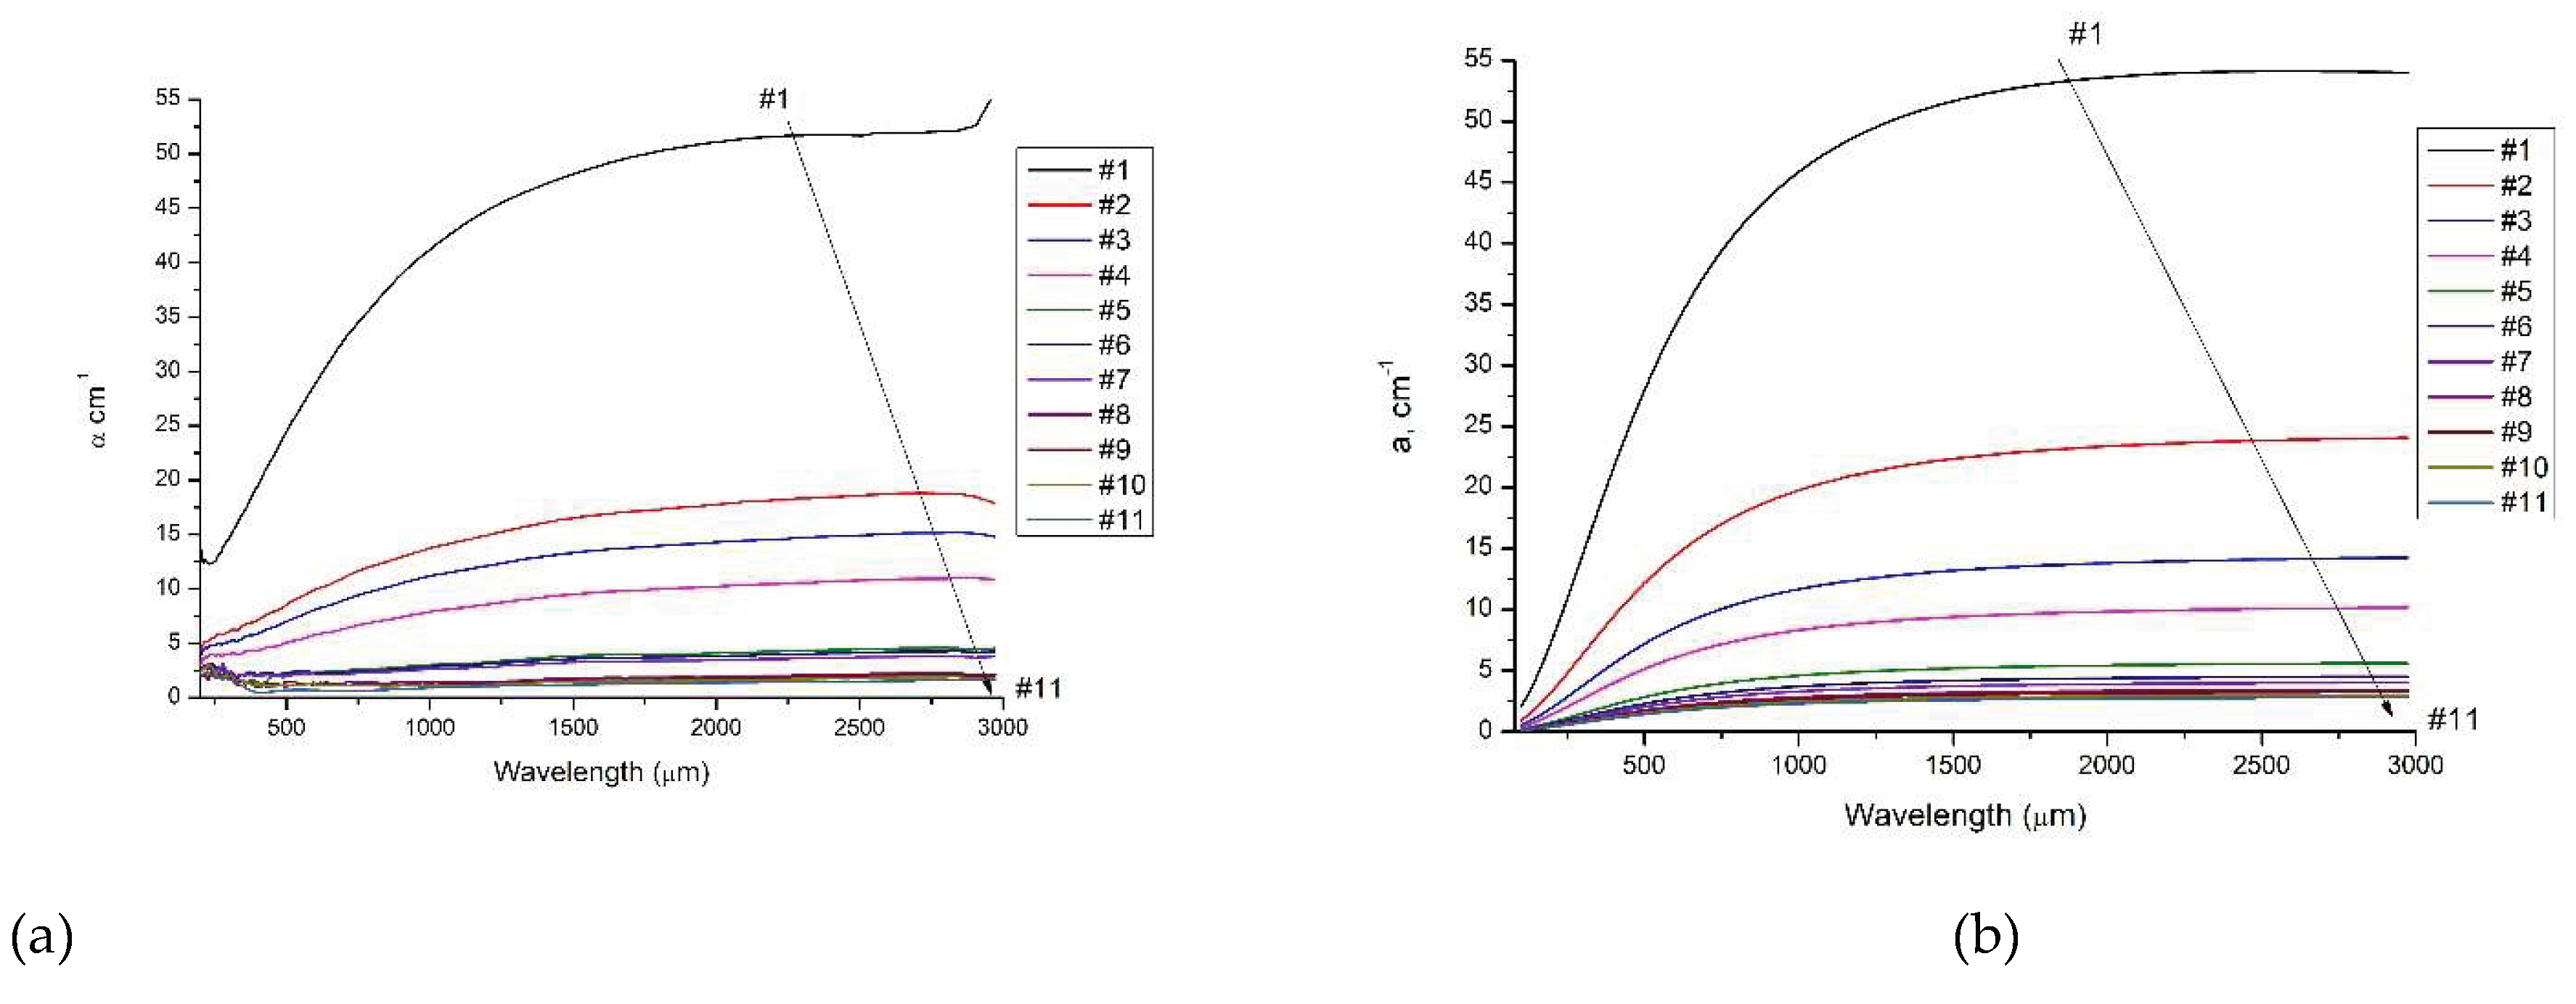

Table 1.
Parameters of Ge plates.
| Sample number (#) | Resistivity, Ohm·cm |
Average donor concen-tration (Nd), cm-3 | Average electron concen-tration (n0), cm-3 | Average hole concen-tration (p0), cm-3 | Electron plasma frequency ωpn, radians/s |
Electron plasma wave-length, λpn, µm |
|---|---|---|---|---|---|---|
| 1 | 1.45 - 2.11 | 9.1·1014 | 9.34·1014 | 6.17·1011 | 1,11·1012 | 1695 |
| 2 | 3.06 - 4.68 | 3.88·1014 | 4.12·1014 | 1.40·1012 | 7,39·1011 | 2552 |
| 3 | 5.99 - 6.91 | 2.21·1014 | 2.45·1014 | 2.35·1012 | 5,70·1011 | 3309 |
| 4 | 7.82 - 10.41 | 1.51·1014 | 1.75·1014 | 3.29·1012 | 4,81·1011 | 3915 |
| 5 | 16.28 - 18.94 | 7.30·1013 | 9.7·1013 | 5.94·1012 | 3,58·1011 | 5259 |
| 6 | 21.60 - 24.80 | 5.43·1013 | 7.83·1013 | 7.36·1012 | 3,22·1011 | 5853 |
| 7 | 25.76 - 28.49 | 4.57·1013 | 6.97·1013 | 8.26·1012 | 3,04·1011 | 6204 |
| 8 | 32.90 - 35.00 | 3.57·1013 | 5.97·1013 | 9.65·1012 | 2,81·1011 | 6703 |
| 9 | 35.60 - 38.79 | 3.24·1013 | 5.64·1013 | 1.02·1013 | 2,73·1011 | 6897 |
| 10 | 40.71 - 44.12 | 2.8· 1013 | 5.2·1013 | 1.11·1013 | 2,62·1011 | 7183 |
| 11 | 45.76 - 49.88 | 2.46·1013 | 4.86·1013 | 1.19·1013 | 2,54·1011 | 7430 |
Disclaimer/Publisher’s Note: The statements, opinions and data contained in all publications are solely those of the individual author(s) and contributor(s) and not of MDPI and/or the editor(s). MDPI and/or the editor(s) disclaim responsibility for any injury to people or property resulting from any ideas, methods, instructions or products referred to in the content. |
© 2025 by the authors. Licensee MDPI, Basel, Switzerland. This article is an open access article distributed under the terms and conditions of the Creative Commons Attribution (CC BY) license (http://creativecommons.org/licenses/by/4.0/).
Copyright: This open access article is published under a Creative Commons CC BY 4.0 license, which permit the free download, distribution, and reuse, provided that the author and preprint are cited in any reuse.