1. Introduction
The demand for lightweight yet mechanically robust materials continues to grow, particularly in the automotive, aerospace, biomedical, and construction sectors. Conventional metal components, although strong, often result in increased structural weight and higher manufacturing costs. Conversely, polymers offer advantages such as low density, corrosion resistance, and chemical stability, but they fall short in terms of mechanical performance. In this context, hybrid structures that integrate metal and polymer components are gaining significant interest because of their ability to merge the strengths of both materials. These composite systems allow the optimization of weight-to-strength ratio while maintaining design flexibility and reducing production expenses. Metal–polymer hybrid composites enable the exploitation of the strength and durability of metals alongside the lightweight characteristics of polymers, offering an attractive solution for industries aiming to improve structural efficiency without compromising material integrity (Alhmoudi et al., 2023; Yeh & Hsu, 2016). As noted by (Barakat et al., 2023). such hybrids are appealing due to their low manufacturing cost, high specific strength, and adaptability in design. (Ozlati et al., 2019) further emphasized their elastic modulus and corrosion resistance, making them suitable for challenging operational environments. In addition,(Kolzunova et al., 2022) highlighted the economic benefit of these composites, particularly when used in additive manufacturing, as the reduction in metallic volume substantially lowers production costs while preserving strength..
Fused Deposition Modeling (FDM), a subset of material extrusion additive manufacturing, has garnered increasing attention for its capability to fabricate complex geometries in a cost-efficient and environmentally sustainable manner (Vakharia et al., 2021) .This technique operates by extruding a thermoplastic filament through a heated nozzle, depositing it layer by layer to build the desired structure. FDM also supports the fabrication of components from multiple materials, including ABS, PLA, PC, and high-performance polymers such as ULTEM, making it suitable for aerospace, medical, and automotive applications. This process allows the production of fully functional parts in a faster and more economical manner compared to conventional manufacturing methods(Kumaresan et al., 2021).Furthermore, the technology contributes to sustainability by reducing material waste and enabling decentralized production models. The inherent roughness of the printed surfaces and the ability to embed defined patterns during fabrication make FDM particularly attractive for producing hybrid joints, especially in metal-polymer composites.(Alhmoudi et al., 2023).
The mechanical enhancement of FDM parts is another area of interest. For instance, (Maggiore et al., 2020) .demonstrated that the integration of reinforcement materials such as copper fibers into PLA matrices improves tensile strength and dynamic mechanical properties, depending on raster angles and build orientation. These findings confirm the adaptability of FDM in producing high-performance composite parts for structural applications. Similarly, (Vakharia et al., 2021) applied CFRP sandwich structures to FDM-printed ABS parts to overcome the typical limitations in strength and stiffness, especially in applications such as unmanned aerial vehicles. Their approach successfully combined lightweight properties with improved specific modulus and mechanical durability.
Recent advancements in additive manufacturing, particularly Fused Deposition Modeling (FDM), have enabled the fabrication of composite structures by combining polymers with reinforcing materials to enhance mechanical performance. However, the mechanical strength of these printed composites remains highly sensitive to the selection of process parameters. Inadequate nozzle temperatures may result in insufficient melting of the PLA filament, leading to poor interlayer bonding and reduced structural integrity. Conversely, excessively high extrusion temperatures can cause over-melting, leading to deformation and marginal strength improvements (Rivera-López et al., 2024) This variability underscores the need for precise control over process parameters during fabrication. Existing studies reveal that critical parameters such as layer thickness, infill density, printing temperature, and build orientation significantly affect tensile strength and overall performance. A comparative review by (Syrlybayev et al., 2021) identified layer thickness as the most influential factor among the parameters investigated. (Ahmed et al., 2023)employed a Taguchi L18 design to optimize process and post-process variables, concluding that a gyroid infill pattern coupled with annealing at 90°C yielded the highest tensile strength of 37.15 MPa. Similarly, (Shahrjerdi et al., 2023) used statistical modeling to show that increased infill density and an extrusion temperature of 220°C could elevate failure load to 1218 N. Meanwhile, (Alhmoudi et al., 2023) explored how printing speed, bed temperature, and nozzle Z-offset affected lap shear strength, emphasizing the multifactorial nature of interfacial adhesion and mechanical bonding in hybrid structures.Process parameters such as printing temperature, infill density, and infill pattern significantly influence the mechanical behavior of metal-polymer composites, yet their optimal combinations remain inadequately understood. According to (Manola et al., 2024) the mechanical enhancement of ABS-based metal/polymer composites reinforced with dual metal fillers was strongly dependent on these FDM parameters. Using a machine learning model based on Classification and Regression Tree (CART) analysis, the study demonstrated the hierarchical impact of each parameter on ultimate tensile strength (UTS), providing evidence that precise parameter tuning can significantly improve structural integrity. The research further emphasized the difficulty of managing parameter interactions due to their nonlinear effects and the lack of standardized predictive models.
This study aims to evaluate the tensile strength performance of titanium–PLA composites fabricated through fused deposition modeling (FDM) and compare it to that of pure PLA under identical manufacturing conditions. By examining how titanium integration influences mechanical behavior, the investigation seeks to identify whether surface integration and material combination strategies enhance the load-bearing capacity of polymer components. The findings are intended to support the development of stronger and more reliable hybrid structures for structural and lightweight applications.
2. Materials and Methods
2.1. Printing Materials
In this study, for the printing of materials, 1.75mm diameter PLA filaments were utilized, obtained from Polymaker Industrial Company in China. The specifications of these filaments are delineated in
Table 1. The selection of PLA was predicated on its low melting point (150–180 ◦C), which facilitates ease of printing and good layer adhesion, enabling the fabrication of intricate designs.(Plamadiala et al., 2025).Polylactic acid (PLA) is a biodegradable polymer derived from renewable resources such as sugar cane and corn. Its user-friendliness, low melting temperature, and environmentally sustainable properties render it a favored choice for fused filament fabrication (FFF) applications. Furthermore, PLA is increasingly employed in the biomedical sector to produce custom implants and prostheses, owing to its biocompatibility, sterilization capability, lightweight nature, and cost-effectiveness. Ultimately, at the conclusion of its lifecycle, PLA can decompose harmlessly in the environment (Pang et al., 2024).
Titanium and its alloys have emerged as key materials in the advancement of multifunctional structures across several high-performance industries. The increasing demand for components that are simultaneously lightweight, strong, and resistant to harsh conditions has accelerated interest in titanium-based solutions. Titanium alloy, especially Ti-6Al-4V, is known for its high specific strength, low density, excellent corrosion resistance, and biocompatibility, making it highly desirable in aerospace, biomedical, and structural engineering applications (Li et al., 2024).(Shanbhag et al., 2021).
2.2. Design of Experiment (DOE)
It is essential to comprehend how the process parameters of the FDM manufacturing technique affect mechanical properties and to optimize them for desired results to improve the performance and functionality of parts made with this technology. In this study, the Taguchi Design of Experiments (DOE) using an orthogonal L9 array, created with Minitab2021 software, was utilized to assess the impact of process parameters and to identify the combination of parameter levels that achieve the optimal Ultimate Tensile Strength (UTS) for PLA and Titanium-PLA composite specimens produced via FDM technology. The process parameters investigated, such as printing temperature, bed temperature, and layer height, along with their respective levels, are detailed in
Table 2. A one-way ANOVA was performed to evaluate the significance of these parameters in affecting the UTS. The Taguchi method was chosen for its organized and systematic approach, which reduces the number of tests needed, thus saving time and costs associated with the testing process.
Table 3 shows the parameters studied and the total number of experiments conducted using the orthogonal L9 array. To ensure the reproducibility and reliability of the measurements, each experimental run included 3 specimens, resulting in a total of 27 specimens for the nine experimental runs.
2.3. Specimen Printing
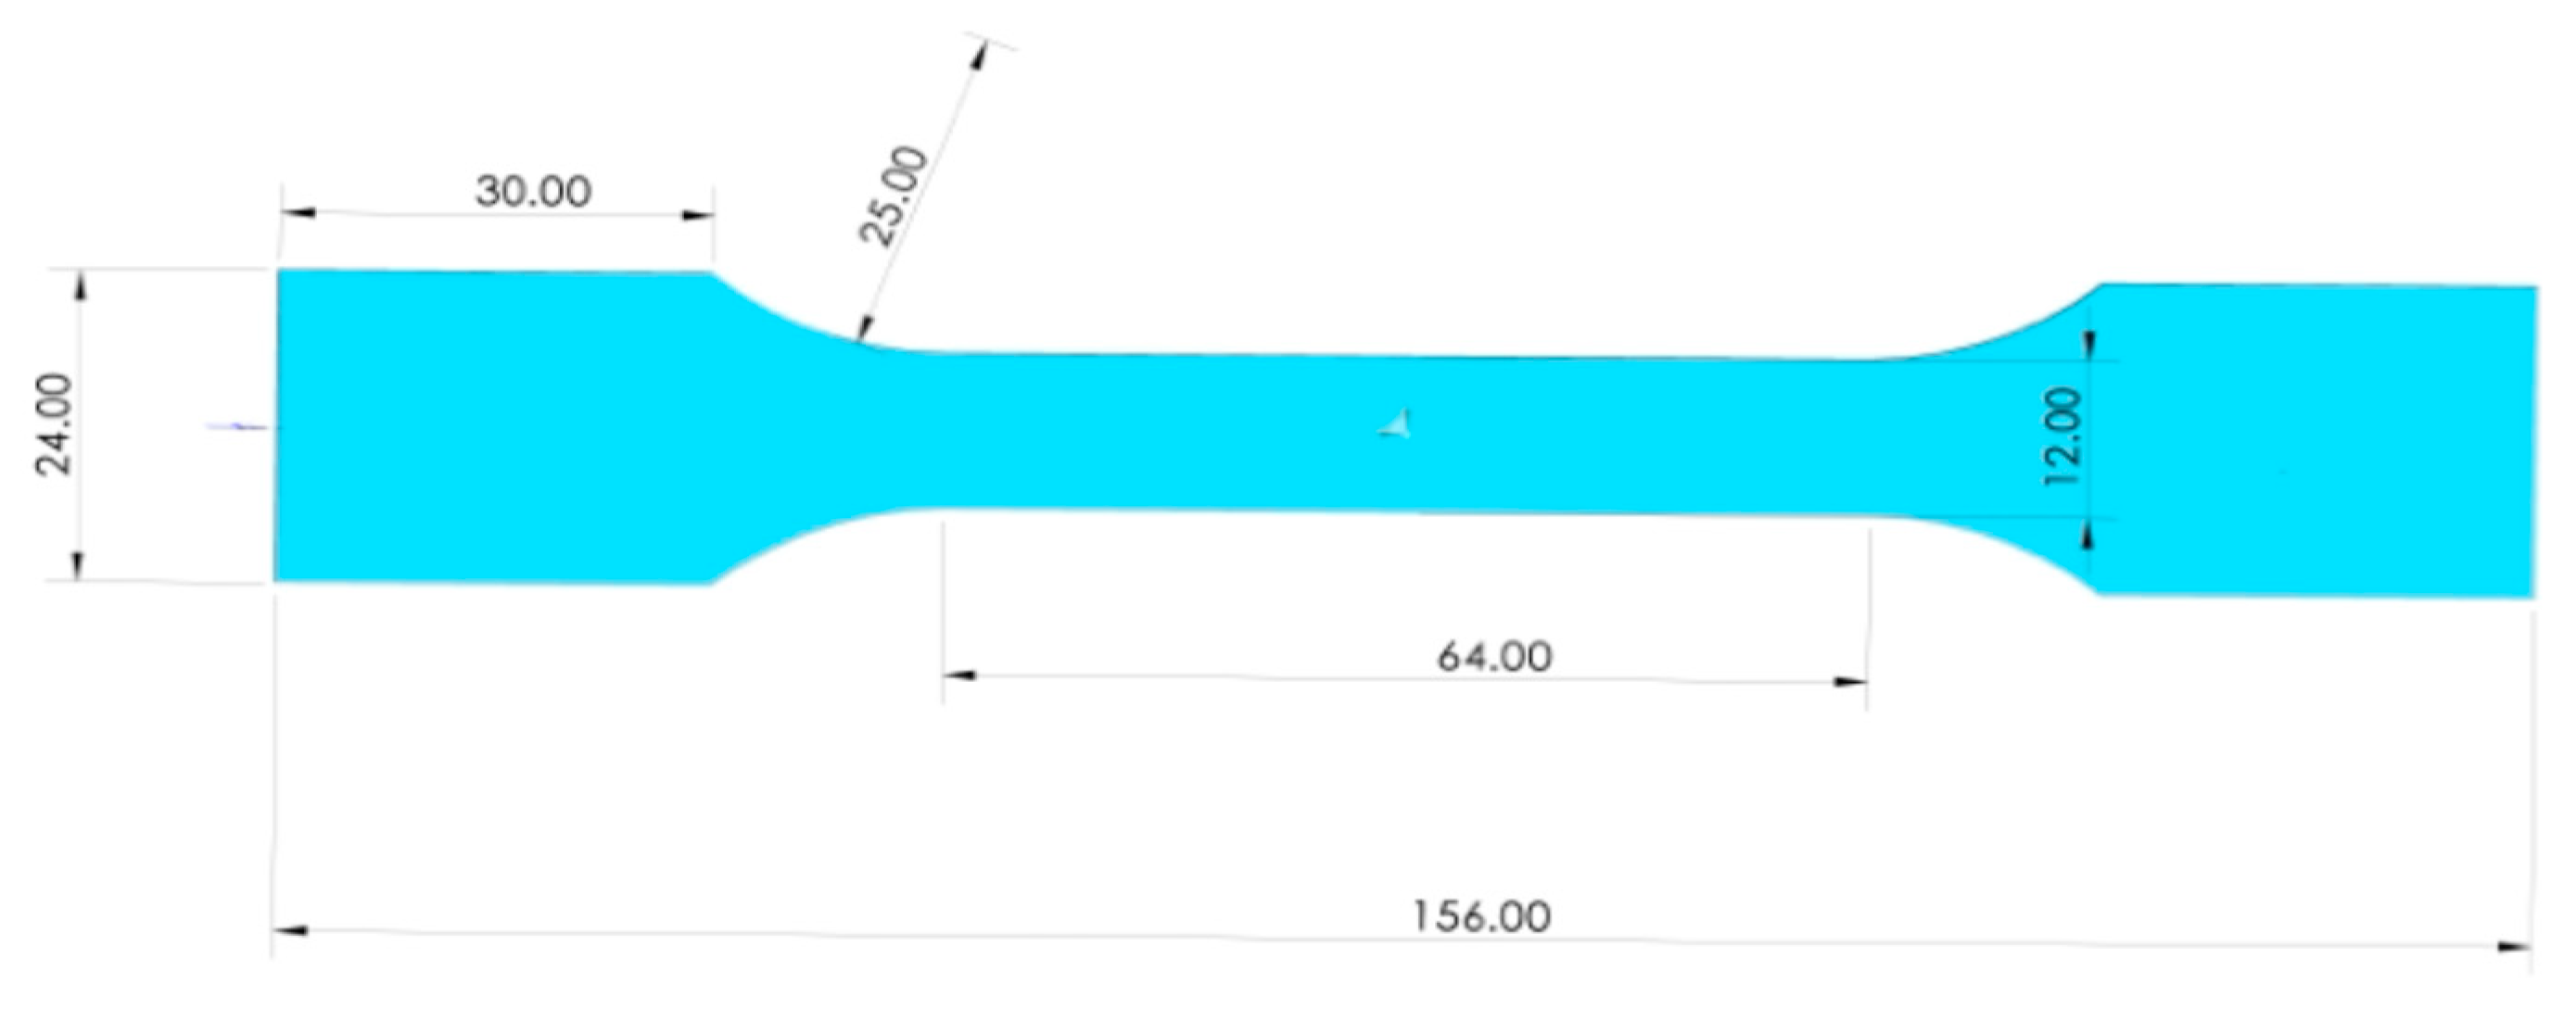
The tensile test specimens were produced using a Raise 3D printer. The CAD model for the specimen was created with SolidWorks 2021 software, following the dimension specifications from the Chinese Standard (GB/T 228.1-2021) where the length width (W) is 12 mm, length overall (LO) 156 and thickness (T) is 3mm as shown in
Figure 2 (Li et al., 2024)and then converted into STL format. The STL file was processed with ideaMaker 4.3.3 software to generate the G-code. Figure 1a–d illustrates the chosen FDM process parameters, each with three different levels: printing temperatures of 180°, 200° and 220°,bed temperature of 50°,60°,70°and layer height at 0.1mm,0,15mm and 0.2mm.
Table 4.
FDM printer and common 3D printing parameters.
Table 4.
FDM printer and common 3D printing parameters.
| Name of parameter |
Value |
| Model |
Raise 3D |
| Working area (mm) |
330mm x 340mm x4mm |
| Nozzle diameter (mm) |
0.4 |
| Infill pattern |
Grid |
| Infil percentages (%) |
100 |
| Shell |
2 |
| Fan speed |
100% |
2.4. Tensile Test
A tensile test is performed using Universal Testing Machine (model: Instron 3382) with a 100kN computerized MTS model closed-loop servo-hydraulic system at a speed of 1mm/min under the room temperature. The specimens are loaded in tension until fracture. This machine The results of this test are taken through at three measurements for each process. A stress-strain diagram was obtained from the tests. The Bluehill Universal Software was employed to collect data to assess the force and strain applied, which was subsequently calculated to determine the tensile strength, modulus, and other related information.
Figure 2.
Tensile specimens of following the dimension specifications from the Chinese Standard (GB/T 228.1-2021) with dimensions in mm.
Figure 2.
Tensile specimens of following the dimension specifications from the Chinese Standard (GB/T 228.1-2021) with dimensions in mm.
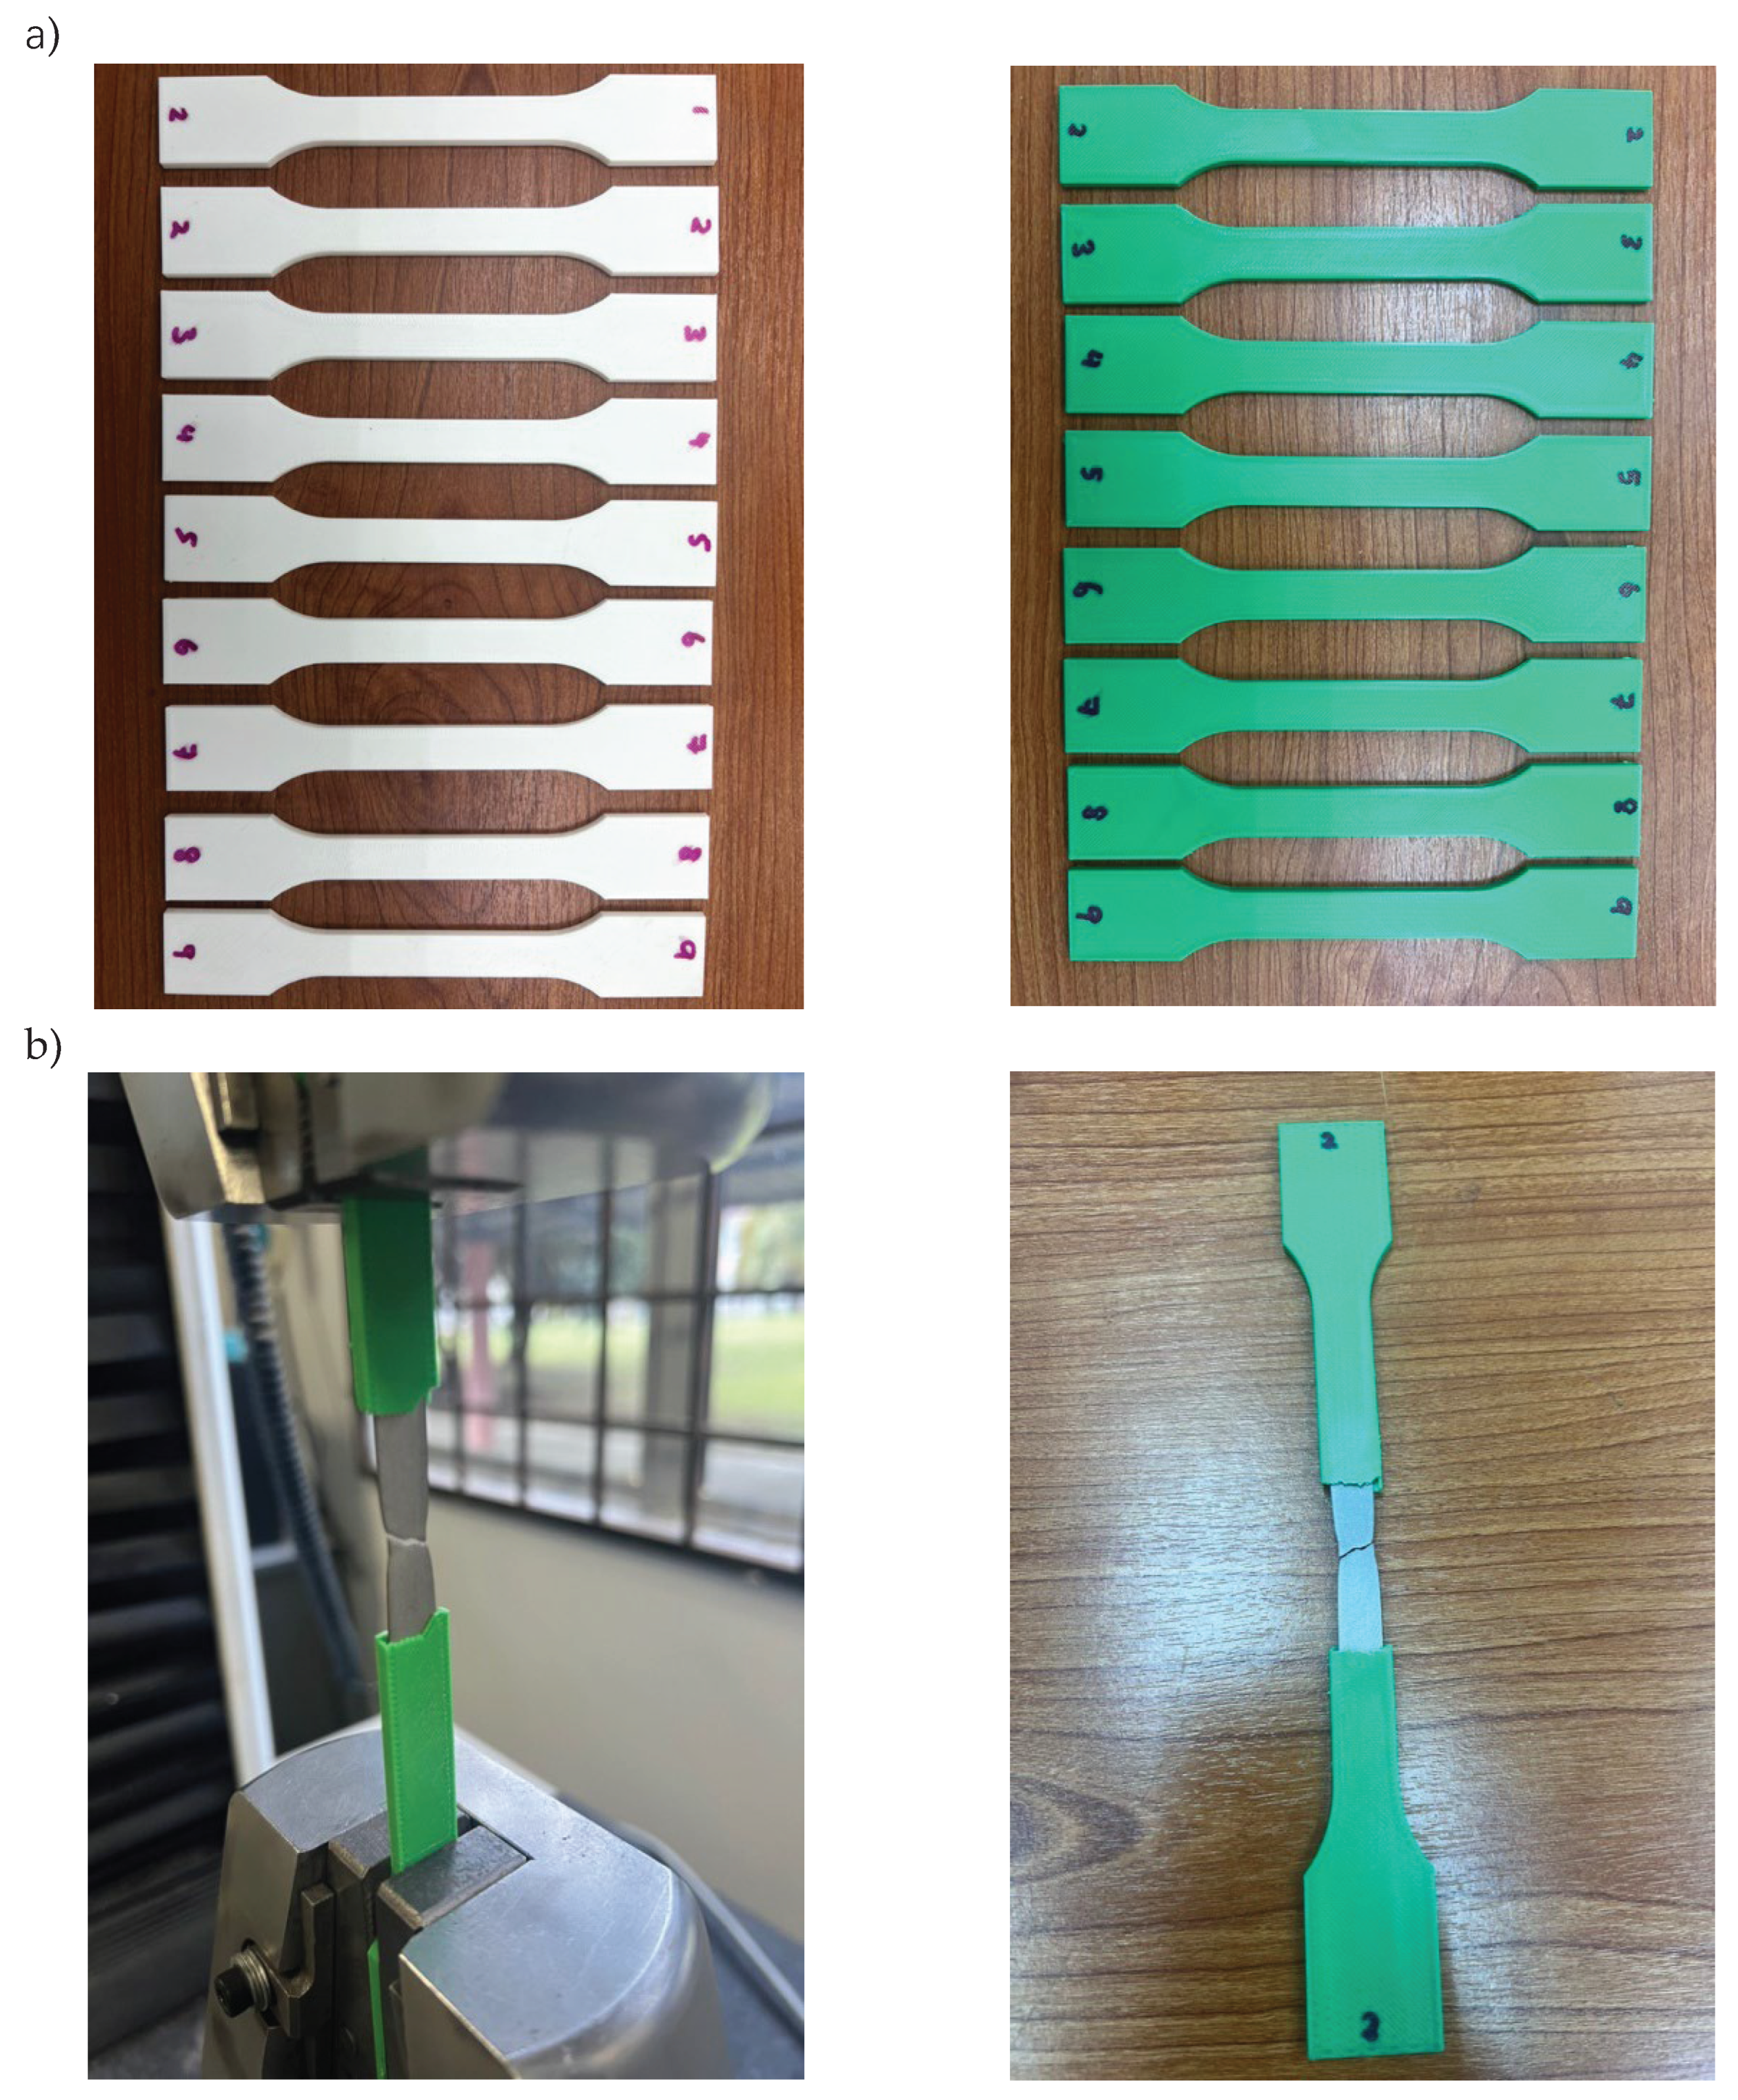
Figure 3.
(a) tensile test (b) tested specimen.
Figure 3.
(a) tensile test (b) tested specimen.
3. Results and Discussions
3.1. Experimental Result
The UTS results from tensile test on three specimens for each of the nine experimental runs in the Taguchi L9 orthogonal array, along with their average values are detailed in
Table 5. The tensile test was conducted according to L9 OA and
Table 2, including the maximum tensile strength. Statistical analysis was conducted using SPSS software to assess the significance of the performance differences between pure PLA and Titanium–PLA composites.
| No |
Parameter |
Tensile |
| |
A |
B |
C |
D |
|
| 1 |
50 |
180 |
50 |
0.1 |
0 |
| |
| 2 |
50 |
200 |
60 |
0.15 |
95.29 |
| |
| 3 |
50 |
220 |
70 |
0.2 |
108.86 |
| |
| 4 |
50 |
180 |
60 |
0.2 |
104.58 |
| |
| 5 |
50 |
200 |
70 |
0.1 |
107.83 |
| |
| 6 |
50 |
220 |
50 |
0.15 |
104.69 |
| |
| 7 |
50 |
180 |
70 |
0.15 |
125.5 |
| |
| 8 |
50 |
200 |
50 |
0.2 |
118.72 |
| |
| 9 |
50 |
220 |
60 |
0.1 |
109.85 |
| No |
Parameter |
Tensile |
| |
A |
B |
C |
D |
|
| 1 |
50 |
180 |
50 |
0.1 |
34.35 |
| |
| 2 |
50 |
200 |
60 |
0.15 |
34.73 |
| |
| 3 |
50 |
220 |
70 |
0.2 |
36.72 |
| |
| 4 |
50 |
180 |
60 |
0.2 |
36.15 |
| |
| 5 |
50 |
200 |
70 |
0.1 |
35.32 |
| |
| 6 |
50 |
220 |
50 |
0.15 |
36.55 |
| |
| 7 |
50 |
180 |
70 |
0.15 |
29.69 |
| |
| 8 |
50 |
200 |
50 |
0.2 |
29.51 |
| |
| 9 |
50 |
220 |
60 |
0.1 |
32.31 |
Outliers are data that exhibit a unique mix of traits that distinguish them from what is considered normal. According to
Table 4.4, the sample contains 2 outliers with the value of tensile strength is 0 Mpa and 125.1Mpa. However, after removing outliers, the parameter number 1 and 7 also remove before analyzing.
3.2. Descriptive statistics
For this study, data were gathered from the experimental test. The total 54 specimens were test. The data collected are summarised in
Table 4.1 for mean strength by material
Table 4. 1.
Mean strength by material.
Table 4. 1.
Mean strength by material.
| Material |
N |
Mean Strength |
Std.Deviation |
| PLA |
7 |
34.470 |
2.654 |
| CMT |
7 |
107.117 |
7.045 |
The mean strength of PLA was 34.47, whereas that of CMT was 107.11.Based on the descriptive statistics, CMT with higher strength produced a higher average strength.
3.3. Independent Sample T-Test
An independent sample t-test was conducted to compare the strengths of the PLA and CMT materials. Levene’s Test for Variance was not significant (1,12) = 2.137, p =0.169 indicating that the assumption of equal variance was met. The results revealed a statistically significant difference in strength between the two materials, t(12) =25.529, p <. 001.Specifically, CMT produced significantly higher strength than PLA, with a mean difference of 72.647 units. The 95% confidence interval for the difference ranged from 66.03 to 79.26, indicating a substantial and reliable effect of the material type on strength. Based on the mean and t-test, CMT showed a more significant strength.
Table 4. 2.
Independent Sample T-Test.
Table 4. 2.
Independent Sample T-Test.
| T-test for Equality of Means |
t |
df |
Sig.(2-tailed) |
Mean Difference |
95% CI (Lower) |
95% CI (Upper) |
| |
25.529 |
12 |
<.001 |
72.647 |
66.035 |
79.258 |
3.4. One Way ANOVA
A series of One Way ANOVA were conducted to examine the effect of the material type (CMT vs PLA) on strength across three parameters: PT,BT and LH .For PT, the result showed no significance difference between CMT (F,12)= 0.055,p =0.948) and PLA (F,12)= 0.567,p =0.607), suggesting that the material type does not significantly influence strength for this parameter. Similarly for BT the ANOVA result indicated no significant difference between the material CMT (F,12) = 0.869, p =0.486) and PLA (F,12) = 0.539, p =0.621) with CMT and PLA showing comparable strength. Lastly for LH, the ANOVA result revealed no significance difference between (material CMT (F,12)= 1.935, p =0.258) and PLA (F,16) = 0.206, p =0.822) indicating that the material type does not have significant effect on strength for this parameter either. Overall, the result that the material type does not significantly affect strength across the parameters of PT,BT and LH.
Table 4. 3.
One -Way ANOVA Results for Strength by Parameter (PT, BT,LH) and Material (PLA vs CMT).
Table 4. 3.
One -Way ANOVA Results for Strength by Parameter (PT, BT,LH) and Material (PLA vs CMT).
| Comparison |
Material |
df (Between, Within) |
F |
p-value (Sig) |
∏2(Effect Size) |
Significance (p<0.05) |
| PT |
PLA |
(2,12) |
0.567 |
0.607 |
0.2208 (large effect) |
NOT SIGNIFICANT |
| |
CMT |
(2,12) |
0.055 |
0.948 |
0.0266(small effect) |
NOT SIGNIFICANT |
| BT |
PLA |
(2,12) |
0.539 |
0.621 |
0.2121 (large effect) |
NOT SIGNIFICANT |
| |
CMT |
(2,12) |
0.869 |
0.486 |
0.3028 (large effect) |
NOT SIGNIFICANT |
| LH |
PLA |
(2,12) |
0.206 |
0.822 |
0.0934 (medium effect) |
NOT SIGNIFICANT |
| |
CMT |
(2,12) |
1.935 |
0.258 |
0.492 (large effect) |
NOT SIGNIFICANT |
4.5. One Way ANOVA for material comparison
A One Way ANOVA was conducted to compare the strength between PLA and CMT materials. The analysis revealed a significant difference in strength between the two materials (F1,12) = 651.173, p< 0.001, indicating that the material type significantly influences strength. The mean strength for PLA was 34.47 (SD=2.654), while the mean strength for CMT was significantly higher at 107.117 (SD = 7.045). The effect size measured by Eta squared n was 0.982 suggesting a larger effect with 98.2% of the variance in strength attributable to the material type. Thus, CMT exhibited significantly higher strength compared to PLA, with the result being statistically significant (p<0.001).
Table 4. 5.
One Way ANOVA for material comparison.
Table 4. 5.
One Way ANOVA for material comparison.
| Factor |
Material |
N |
Mean |
Std.Deviation |
Df (Between/Within) |
F-value |
P-value |
Effect Size (Cohen’s) |
Significant |
Conclusion |
| Material Comparison |
PLA |
7 |
34.470 |
2.654 |
(1,12)
|
651.173 |
<.001 |
0.982 (large effect) |
Significant |
PLA has lower strength |
| CMT |
7 |
107.117 |
7.045 |
CMT has highest strength |
4. Conclusion
For this study, data were gathered from the experimental test. An Independent Sample T-Test was conducted to compare the strength between PLA and Titanium PLA composite materials. Based on Mean and Independent Sample T-Test, Titanium PLA composite shows more significant to strength. Similarly for BT the ANOVA result indicated no significant difference between the material CMT (F,12) = 0.869, p =0.486) and PLA (F,12) = 0.539, p =0.621) with Titanium-PLA composite and PLA showing comparable strength. Overall the result that the material type does not significant affect strength across the parameters of PT,BT and LH. A One Way ANOVA was conducted to compare the strength between PLA and CMT materials. The results showed a very large effect of material on tensile performance, η² = 0.982, indicating that 98.2% of the total variance in tensile strength can be explained by the material type, it indicates a practical significance in real-world applications, suggesting that incorporating titanium layers into PLA significantly improves mechanical strength.
Author Contributions
Conceptualization, S.I.S and M.K.A.A.; methodology, S.I.S., M.K.A.A and M.I.S.I.; software, S.I.S.; validation, M.K.A.A., M.I.S.I., and K.A.M.R.; formal analysis, S.I.S and M.K.A.A.; investigation, S.I.S., M.K.A.A and M.I.S.I., K.A.M.R.; writing—original draft preparation, S.I.S.; writing—review and editing, S.I.S., M.K.A.A., M.I.S.I., K.A.M.R., M.P., and Z.H.; supervision, M.K.A.A., M.I.S.I., M.P., and K.A.M.R.; All authors have read and agreed to the published version of the manuscript.
References
- Ahmed, B. A. , Nadeem, U. , Hakeem, A. S., Ul-Hamid, A., Khan, M. Y., Younas, M., & Saeed, H. A. Printing Parameter Optimization of Additive Manufactured PLA Using Taguchi Design of Experiment. Polymers 2023, 15. [Google Scholar] [CrossRef]
- Alhmoudi, A. , Sheikh-Ahmad, J. , Almaskari, F., & Bojanampati, S. Joining of polymer to metal using material extrusion additive manufacturing. International Journal of Advanced Manufacturing Technology 2023, 129, 3303–3319. [Google Scholar] [CrossRef]
- Barakat, A. A. , Darras, B. M., Nazzal, M. A., & Ahmed, A. A. A Comprehensive Technical Review of the Friction Stir Welding of Metal-to-Polymer Hybrid Structures. Polymers 2023, 15. [Google Scholar] [CrossRef]
- Kolzunova, L. G. , Shchitovskaya, E. V, Lubimyi, N. S., Polshin, A. A., Gerasimov, M. D., Tikhonov, A. A., Antsiferov, S. I., Chetverikov, B. S., Ryazantsev, V. G., Brazhnik, J., & Ridvanov, I. (2022). Justification of the Use of Composite Metal-Metal-Polymer Parts for Functional Structures. [CrossRef]
- Kumaresan, R. , Samykano, M, Kadirgama, K., Ramasamy, D., Keng, N. W., & Pandey, A. K. 3D Printing Technology for Thermal Application: A Brief Review. Journal of Advanced Research in Fluid Mechanics and Thermal Sciences 2021, 83, 84–97. [Google Scholar] [CrossRef]
- Li, G. , Wang, Y., Liang, Y., Gao, P., Liu, X., Xu, W., & Yang, D. Microstructure and mechanical properties of laser welded Ti-6Al-4V (TC4) titanium alloy joints. 2024, 170. Optics and Laser Technology 2024, 170. [Google Scholar] [CrossRef]
- Maggiore, S. , Pedemonte, M., Bazurro, A., Stagnaro, P., Utzeri, R., & Luciano, G. Characterization of the effect of an epoxy adhesive in hybrid FSW-bonding aluminium-steel joints for naval application. International Journal of Adhesion and Adhesives 2020, 103. [Google Scholar] [CrossRef]
- Manola, M. S. , Singh, B., Singla, M. K., Chohan, J. S., Kumar, R., Kumar, R., Bisht, Y. S., Kumar, R., Alkahtani, M. Q., Islam, S., Ammarullah, M. I., Ammarullah, M. I., & Ammarullah, M. I. Investigation of melt flow index and tensile properties of dual metal reinforced polymer composites for 3D printing using machine learning approach: Biomedical and engineering applications. AIP Advances 2024, 14. [Google Scholar] [CrossRef]
- Ozlati, A. , Movahedi, M, Tamizi, M., Tartifzadeh, Z., & Alipour, S. An alternative additive manufacturing-based joining method to make Metal/Polymer hybrid structures. Journal of Manufacturing Processes 2019, 45, 217–226. [Google Scholar] [CrossRef]
- Pang, R. , Lai, M. K., Ismail, K. I., & Yap, T. C. Characterization of the Dimensional Precision, Physical Bonding, and Tensile Performance of 3D-Printed PLA Parts with Different Printing Temperature. Journal of Manufacturing and Materials Processing 2024, 8. [Google Scholar] [CrossRef]
- Plamadiala, I. , Croitoru, C., Pop, M. A., & Roata, I. C. Enhancing Polylactic Acid (PLA) Performance: A Review of Additives in Fused Deposition Modelling (FDM) Filaments. Polymers 2025, 17. [Google Scholar] [CrossRef]
- Rivera-López, F. , Pavón, M. M. L., Correa, E. C., & Molina, M. H. Effects of Nozzle Temperature on Mechanical Properties of Polylactic Acid Specimens Fabricated by Fused Deposition Modeling. Polymers 2024, 16. [Google Scholar] [CrossRef]
- Shahrjerdi, A. , Karamimoghadam, M., & Bodaghi, M. Enhancing Mechanical Properties of 3D-Printed PLAs via Optimization Process and Statistical Modeling. Journal of Composites Science 2023, 7. [Google Scholar] [CrossRef]
- Shanbhag, G. , Wheat, E., Moylan, S., & Vlasea, M. Effect of specimen geometry and orientation on tensile properties of Ti-6Al-4V manufactured by electron beam powder bed fusion. Additive Manufacturing 2021, 48. [Google Scholar] [CrossRef]
- Syrlybayev, D. , Zharylkassyn, B., Seisekulova, A., Akhmetov, M., Perveen, A., & Talamona, D. Optimisation of strength properties of FDM printed parts—A critical review. Polymers 2021, 13. [Google Scholar] [CrossRef]
- Vakharia, V. S. , Kuentz, L., Salem, A., Halbig, M. C., Salem, J. A., & Singh, M. Additive manufacturing and characterization of metal particulate reinforced polylactic acid (Pla) polymer composites. Polymers, 2021; 13. [Google Scholar] [CrossRef]
- Yeh, R. Y. , & Hsu, R. Q. Improving the adhesion of plastic/metal direct bonding by injection moulding using surface modifications. Advances in Materials and Processing Technologies 2016, 2, 21–30. [Google Scholar] [CrossRef]
|
Disclaimer/Publisher’s Note: The statements, opinions and data contained in all publications are solely those of the individual author(s) and contributor(s) and not of MDPI and/or the editor(s). MDPI and/or the editor(s) disclaim responsibility for any injury to people or property resulting from any ideas, methods, instructions or products referred to in the content. |
© 2025 by the authors. Licensee MDPI, Basel, Switzerland. This article is an open access article distributed under the terms and conditions of the Creative Commons Attribution (CC BY) license (http://creativecommons.org/licenses/by/4.0/).