Submitted:
10 September 2025
Posted:
15 September 2025
You are already at the latest version
Abstract
Serum uric acid (SUA) overproduction, leading to hyperuricemia, has been found to be of common detection in a number of clinical conditions characterized by an elevated cardiovascular risk, namely metabolic syndrome, essential hypertension, dyslipidemia, obesity and diabetes mellitus. Similar findings have been also reported for the Atherogenic Index of Plasma (AIP), i.e., the logarithmic transformation of the ratio between plasma triglycerides value and high-density plasma lipoprotein cholesterol. Both SUA and AIP have been found to be sensitive predictors of fatal and non-fatal cardiovascular events and all-cause mortality, their association representing a highly sensitive marker potentiating the predictive value of each single factor. Although a number of studies have investigated the relationships between SUA and AIP, the association between these two metabolic variables still remains indistinct. The main features of this hypothetical relationship and their connection with an unique leading metabolic alteration represent elements of interest for cardiovascular pathophysiology worthy of clinical investigation. The present paper, after briefly summarizing the main features of the Pressioni Arteriose Monitorate E Loro Associazioni (PAMELA) study, will review the epidemiologcal and clinical relevance of SUA as cardiovascular risk factor, based on the findings reported in the context of the above mentioned clinical investigation. The paper will finally report the data on the association between UA and AIP found in the PAMELA study, comparing them to the findings of the published studies on the topic.
Keywords:
uric acid
; hyperuricemia
; atherogenic index of plasma
; cardiovascular risk
1. Introduction
Serum uric acid (SUA) represents the final product of the purine metabolism both of exogenous and endogenous origin. In physiological conditions, SUA is synthetized and excreted (mainly by the kidney) in equal amounts. Hyperuricemia may thus result from overproduction or underexcretion, or a combination of these two mechanisms [1]. Although the most frequent consequences of hyperuricemia are articular gout and kidney disease, this metabolic variable has been associated also with cardiovascular (CV) diseases and in particular with chronic coronary syndrome [2,3]. This latter association rose the interest of the cardiological community, which recognized it as a variable capable to reclassify patients CV risk [2,3].
Regarding the mechanisms leading to hyperuricemia, a decrease in the renal excretion of uric acid is the main determinant of its underexcretion, while a diet rich in purine/fructose, a tumor lysis syndrome (due to chemotherapy) and various metabolic disturbances are the potential causes of its overproduction [1]. Indeed SUA has been related to several manifestations of the metabolic syndrome, such as the development and progression of high blood pressure (BP) [4], dyslipidemia [5], adiposity/obesity [6], hyperglycemia and diabetes mellitus [7]. With this background in mind the relationship between SUA and the Atherogenic Index of Plasma (AIP) results of interest. This index, firstly described at the beginning of the new millennium, represents the logarithmic transformation of the ratio between serum triglycerides and High-Density Lipoprotein (HDL) cholesterol [8]. The logarithmic transformation is needed to correct the skewed distribution of triglycerides. This index has been related to CV events and mortality [9,10], with better performance than other lipid values, due to its ability to integrate both atherogenic (triglycerides at the numerator) and protective (HDL at the denominator) lipid components.
Also AIP has been related to the metabolic syndrome and its components [11], as previously mentioned for SUA, and this allows to raise the question whether these two variables are linked together by a close relationship. This relationship could have a main direction (SUA increases AIP or vice-versa), could be bidirectional, or could be related to a common factor, the SUA-AIP increase being mainly determined by a single metabolic disturbance.
In this review we will report data on the association between SUA and AIP collected in the frame of the PAMELA (Pressioni Arteriose Monitorate E Loro Associazioni) study, comparing them with the findings reported in the main studies published during the past few years on the same topic.
2. The PAMELA Study: An Overview
In the PAMELA study, 3200 residents in Monza (a town located in the North East outskirts of Milan, Italy), aged from 25 to 74 years, were randomly selected to be representative of the general population, stratified for gender and age decades, according to the criteria of the World Health Organization Monitoring Diseases project performed in the same geographic area [4,12]. The initial evaluation was carried out between 1990 and 1993, and the participation rate amounted to 64%, allowing to collect data in more than 2000 individuals [4,12]. The main objective of this first survey was the definition of the normal values of 24-hour ambulatory and home BP in the general population, unknown at that time, and crucial for employing out-of-office BP measurements in daily clinical practice [12]. Survivors were then reassessed (with another completely analogous evaluation) during the follow-up after 10 years (2002/2003, 1412 subjects) and subsequently after addional 15 years (2017/2018, 562 participants) [4,12]. On the whole the study duration amounted to 25 years, making the PAMELA study the epidemiological investigation on ambulatory and home BP with the longest follow-up available so far.
All the scheduled medical visits were carried out at the outpatient clinic of the Saint Gerardo University Hospital of Monza (a town in the outskirts of the Milan area, north Italy), during the morning of a working day, following an overnight fast and 24 hours abstinence from alcohol and cigarette smoking. The study protocol complied with the Declaration of Helsinki and it was approved by the Ethics Committee of the Institution involved. For each subject, after signing the study informed consent, a full medical history was collected. Office BP was measured, using a mercury sphygmomanometer in the first and second survey and an oscillometric device in the third one. Office BP was taken three times in the sitting position and the average value was used for the analyses. Ambulatory 24-hour BP was set to obtain automated oscillometric BP and heart rate readings every 20 minutes over the 24 hours. Subjects were asked to pursue their normal activities during the monitoring period, holding the arm still at time of the BP readings, going to bed not later than 11.00 pm and waking up not before 7.00 am. Height and weight were obtained to calculate body mass Index, and waist circumference was measured with the subject in the standing position. Laboratory analyses included SUA, blood glucose, total plasma cholesterol, HDL cholesterol, TG and creatinine (from which Glomerular Filtration Rate was estimated – eGFR - by Cockcroft-Gault formulae), Low Density Lipoprotein (LDL) cholesterol calculated according to the Friedewald equation.
Furthermore, also a complete echocardiographic evaluation was performed in all the three PAMELA surveys with left ventricular and left atrium functional and structural focused evaluation. From the second survey of the study also arterial structural (intima-media thickness) and functional (arterial stiffness) parameters have been evaluated. Finally, fatal and non-fatal CV events and all-cause deaths were recorded giving the opportunity to thorougly assess the relationships between BP values (office, 24-hour and home), hypertension-related target organ damage, biochemical parameters and CV events.
3. Main SUA Findings of the PAMELA Study
The first paper published on SUA with data collected in the frame of the PAMELA study was focused on the analysis of the relationships between this metabolic variable and office, ambulatory and home BP values [4]. Results can be summarized as follows. SUA value came out as one of the major predictors, together with age, body mass index and plasma glucose, of high BP development throughout the years of the study follow-up. This was the case when office BP values were considered to define new-onset hypertension, but also when to out-of-office BP, namely 24-hour and home BP, were taken into account [4]. These findings allowed us to conclude that SUA levels represent important predictors of future hypertension, independently on how BP values are assessed [4].
A further result of the PAMELA study was the finding that elevated SUA levels are of common detection in the different high BP phenotypes, including sustained hypertension, white-coat hypertension, masked hypertension, orthostatic and drug-resistant hypertension as well [13]. Greater SUA values were detected in the sustained hypertension patients while intermediate values were found in the white-coat and masked hypertensive penotypes as compared to the pure normotensive BP state [12]. In contrast, the non-dipping pattern of the 24-hour BP profile was not associated with any substantial difference of SUA when compared to the data collected in individuals with the physiological nightime BP drop [12].
Not only absolute BP values but also BP variability is significantly linked to the SUA profile. Indeed in another analysis of the PAMELA data, we were able to demonstrate that elevated SUA levels are associated with a decrease in 24-hour BP variability [12]. This was found for different BP variability measurements (24-hour standard deviation, day-time standard deviation, first cyclic component, and the residual uncyclic component) which have been demonstrated to carry a significant prognostic value [13].
An additional paper from our group, also based on PAMELA data, focused on the mechanisms through which SUA, in conjunction with hemodynamic and non-hemodynamic factors, may trigger the development and progression of cardiac organ damage, which represents structural cardiovascular alteration of most common detection in hypertensive patients, closely associated with an increased risk of fatal and non-fatal CV events [2,4,12]. In particular, SUA was found to be capable to strongly predict the development of left ventricular hypertrophy, independently on other confounders, in about 1000 patients evaluated during a 10 year follow-up [12]. Results indeed indicate that for each 1 mg/dl increase in SUA a 26% increased risk of left ventricular hypertrophy is expected [12]. The relationship between SUA and hypertension-related cardiac organ damage appears to be specific for left ventricular hypertrophy. Indeed, no significant relationship was found in the PAMELA study between SUA and echocardiographic indices of left atrial enlargement [12]. This finding suggests that SUA may trigger a different effect on cardiac morphology, favoring to a greater extent factors which are involved in determining the hypertrophic process of the myocardial fibers witin the cardiac chambers rather than the atrial remodeling.
Data collected in the context of the PAMELA study have also allowed to provide new information on the relationships between SUA and the metabolic disarray [14]. Indeed, data collected during the 10 year follow-up of the study (second PAMELA survey) have shown a significant association between SUA and the increased risk of new-onset impaired fasting plasma glucose and new-onset diabetes mellitus [2,12]. As far as the obese condition is concerned, this cardiometabolic alteration was identified in 14% of the PAMELA population and associated with elevated SUA values [15] However, SUA in the obese subjects was not found to predict the development of new-onset hypertension and the occurrence of subsequent CV events. It could be possible to speculate that obesity-related factors (insulin resistance, glycemic disturbances, endothelial dysfunction, oxidative stress, autonomic impairment, sleep apnoea) might have overshadowed the role of SUA in promoting the above mentioned outcomes [16,17].
4. SUA, Lipid Profile and Adiposity Indices
We have previously mentioned the relationship between SUA and plasma lipids reported in a number of studies, with evidence of a significant correlation with plasma triglycerides [5]. As far as adiposity indices are concerned, previous studies focused on the Visceral Adiposity Index (VAI), while in the PAMELA study the SUA relationships with Cardio-Metabolic Index (CMI) and Lipid Accumulation Product (LAP) were also assessed [5]. Indeed, data from 1892 subjects were analysed, confirming that SUA correlates with all the lipids values (with the strongest βeta value for triglycerides) and all the adiposity indices (VAI, CMI and LAP) [5].
Frequently the cut-off value for SUA in defining CV risk was the one used in the URic acid Right for heArt health (URRAh) investigation, corresponding to 5.1 mg/dl in females and 5.6 mg/dl in males, because more sensitive in predicting future CV events as compared to the classic one (6.0/7.0 mg/dl) [2,18]. In the PAMELA study we found that the cut-off indicated in the URRAh study was significantly related to atherogenic lipids profile (Odds Ratio - OR - 1.33 for LDL and 1.59 for non-HDL, P<0.0001, see upper panel of Figure 1), the degree of significance being greater than the one detected employing the classic SUA cut-off values (lower panel of Figure 1). This was also the case for the association with the different adiposity indices (Figure 1). Based on these findings we can suggest that SUA can favor the development of CV events at lower cut-offs mainly through pro-atherogenic lipoprotein alterations, while, when SUA levels are markedly increased, also adiposity and general metabolic abnormalities may participate. In the PAMELA study, development of hyperuricemia was associated, at the multivariable analysis, with female gender, home and 24-hour BP, diuretic treatment, serum TG and baseline SUA, as well as the increase in waist circumference and the reduction in renal function (Figure 2). This finding therefore suggests that baseline SUA level is one of the most important variables capable to predict the future development of hyperuricemia.
5. Relationships Between SUA and AIP
The relationships between SUA and AIP were systematically assessed in a number of studies, which we identified through a comprehensive literature search of PubMed databases up to August 15, 2025. Only English writes papers were considered. The keywords searching were “atherogenic index of plasma” AND “serum uric acid” with 67 studies retrieved. Fiftyeight papers not focused on the correlation among the two biomarkers were excluded, the 9 remaining papers being discussed thereafter.
In the published studies SUA showed a significant correlation with AIP [19,20,21,22,23]. However, in most of them the study population was relatively small (less than 350 subjects) [19,20,21,22,23] or including very specific subgroups (post-menopausal women [21], patients with coronary artery disease and recent percutaneous revascularization [23], renal transplant recipients [22], patients with depression [20]). Four studies were carried out in larger population samples. In 645 diabetic patients [53.5% males, age 59.4±12.6 years, mean±standard deviation] SUA levels were significantly greater in the patients subgroups with higher AIP values to which they were significantly correlated at the univariate analysis (r=0.154, P<0.001) [24]. Furthermore, results were confirmed at multivariable model where AIP is the variable with the highest OR in the relationship with SUA.
Analysis of the data data collected in 9439 participants enrolled in the NHANES (National Health and Nutrition Examination Survey) allowed to show a non-linear L-shaped relationship between AIP and SUA levels and hyperuricemia prevalence [25]. The AIP saturation point (above which no significant association was detected) amounted to 0.588 for SUA levels and to 0.573 for hyperuricemia, respectively. Below these thresholds, the OR for increased SUA and hyperuricemia was 0.854 (95% CI 0.762-0.946) and 4.4 (95% CI 3.528-5.488), respectively (P<0.001 for both).
In another study, 8258 normal-weight adults with hypertension from the China Hypertension Registry Study were analyzed [26]. Mean age was 64.9±8.9 (mean±standard deviation) years and 15.55% of the population suffered from diabetes. Multivariate logistic regression analysis indicated that there was a significant association between AIP and the detection of diabetes mellitus (OR 3.73, 95% CI 2.82-4.94), with an interaction between hyperuricemia and AIP. This means that the association between AIP and diabetes mellitus appears to be more close in hyperuricemic subjects than in those displaying normal SUA.
Finally, in 11324 subjects [age 53.8±10.6 (mean±standard deviation) years, 46.3% males, 9.7% with hyperuricemia] from China rural areas, AIP was positively correlated with SUA (r=0.310 for males, r=0.347 for females, P<0.001 for both) [27]. When the study population was subdivided in subgroups according to established AIP cut-off values [27], the prevalence of hyperuricemia progressively increased as AIP values were higher. This was confirmed at the multivariate logistic regression analysis where participants in the higher AIP group displayed hyperuricemia (males: OR 2.164; 95% CI 1.782, 2.628; P<0.001; females: OR 2.960, 95% CI 2.311, 3.792; P<0.001). To the best of our knowledge, no longitudinal study has been published so far examining the relationships between SUA and AIP in the long-term period.
With this background in mind we performed an analysis of the data collected in the context of the PAMELA research project, examining the behaviour of AIP and its relationships with SUA in the general population of the study. The analysis was based on data from 2035 subjects belonging to the first PAMELA survey. Mean age of participants amounted to 50.9±13.7 (mean±standard deviation) years and 50.6% of the subjects were males. Mean body mass index amounted to 25.6±4.4 kg/m2 and the subjects displayed mean office BP values amounting to 132.9/83.9±21.3/10.6 mmHg. About 20% of the recruited subjects displayed elevated BP values and were under antihypertensive drug treatment. Regarding biochemical variables, average glycemic values were 87.2±13.7 mg/dl, while total cholesterol amounted to 224.1±42.8 mg/dl, HDL cholesterol to 55.5±15.5 mg/dl and TG to 97.3± 16.6 mg/dl. Mean calculated LDL was 145.4±39.1 mg/dl, SUA values were 4.9±1.3 mg/dl and estimated GFR amounted to 91.8±27 ml/min. All values are represented as means±standard deviation.
Figure 3, panel A, shows the distribution of AIP values in the PAMELA population, the average value amounting to -0.1±0.3 a.u. Male subjects displayed significantly greater AIP values than females (Figure 3, panel B) and this was the case for the hypertensive patients as compared to normotensive controls (Figure 3, panel C). The study population was then subdivided in AIP sub-groups as described in a previous study [27]: low (AIP <0.11), intermediate (AIP 0.11-0.21) and high (AIP >0.21). A progressive significant increase in AIP values was found from the low to the high SUA subgroups (Figure 4).
As shown in Table 1 at the univariate correlation analysis all variables considered, excluding heart rate, showed a significant correlation with AIP. Apart from the relationships with HDL cholesterol and TG (which by definition are involved in the calculation of AIP values), the strongest correlation was detected for SUA (r=0.43008, P<0.001). The univariate correlation remained statistically significant in all the subgroups of subjects evaluated (males/females, normotensives/hypertensives, body mass index strata, age below or above 65 years, use of antihypertensive drugs), except for patients with diabetes mellitus (Table 2). At the multiple linear regression analysis, age, sex, office BP, use of antihypertensive drugs, total cholesterol and SUA were the variables associated with AIP (Table 3).
6. Conclusions
Original data of the PAMELA investigation reviewed in this paper strongly support the notion that that SUA and AIP are significantly related ech other. This finding has clinical implications considering that both these two metabolic variables retain prognostic relevance in different cardiometabolic disease. Future longitudinal studies will allow to obtain information on the patterns and consequences of this relationship in the long-term period.
Funding
none.
Acknowledgements
none.
Conflict of interest
authors have no conflict of interest to declare.
Disclosures
the authors declare they have no conflict of interest.
References
- Chaudhary, K; Malhotra, K; Sowers, J; Aroor, A. Uric acid - key ingredient in the recipe for cardiorenal metabolic syndrome. Cardiorenal Med. 2013, 3: 208-220.
- Maloberti, A; Mengozzi, A; Russo, E; Cicero, AFG; Angeli, F; Agabiti Rosei, E; Barbagallo, CM; Bernardino, B; Bombelli, M; Cappelli, F; et al. The results of the URRAH (Uric Acid Right for Heart Health) project: a focus on hyperuricemia in relation to cardiovascular and kidney disease and its role in metabolic dysregulation. High Blood Press. Cardiovasc. Prev. 2023, 30, 411–425. [Google Scholar] [CrossRef]
- Mancia, G; Kreutz, R; Brunström, M; Burnier, M; Grassi, G; Januszewicz, A; Muiesan, ML; Tsioufis, K; Agabiti-Rosei, E; Algharably, EAE; et al. 2023 ESH Guidelines for the management of arterial hypertension The Task Force for the management of arterial hypertension of the European Society of Hypertension: endorsed by the International Society of Hypertension (ISH) and the European Renal Association (ERA). J Hypertens. 2023, 41, 1874–2071. [Google Scholar]
- Bombelli, M; Ronchi, I; Volpe, M; Facchetti, R; Carugo, S; Dell’Oro, R; Cuspidi, C; Grassi, G; Mancia, G. Prognostic value of serum uric acid: new-onset in and out-of-office hypertension and long-term mortality. J. Hypertens. 2014, 32, 1237–44. [Google Scholar] [CrossRef] [PubMed]
- Peng, TC; Wang, CC; Kao, TW; Yi-Hsin Chan, J; Yang, YH; Chang, YW; Chen, WL. Relationship between hyperuricemia and lipid profiles in US adults. Biomed. Research Int. 2015, 2015, 127596. [Google Scholar]
- Yeo, C; Kaushal, S; Lim, B; Syn, N; Oo, AM; Rao, J; Koura, A; Yeo, D. Impact of bariatric surgery on serum uric acid levels and the incidence of gout - A meta-analysis. Obes. Rev. 2019, 20, 1759–1770. [Google Scholar] [CrossRef]
- Kodama, S; Saito, K; Yachi, Y; Asumi, M; Sugawara, A; Totsuka, K; Saito, A; Sone, H. Association between serum uric acid and development of type 2 diabetes. Diabetes Care 2009, 32, 1737–1742. [Google Scholar] [CrossRef]
- Dobiásová, M; Raslová, K; Rauchová, H; Vohnout, B; Ptácková, K; Frohlich, J. Atherogenic lipoprotein profile in families with and without history of early myocardial infarction. Physiol. Res. 2001, 50, 1–8. [Google Scholar] [CrossRef]
- Zhao, J; Li, N; Li, S; Dou. J. The predictive significance of the triglycerides-glucose index in forecasting adverse cardiovascular events among type 2 diabetes mellitus patients with co-existing hyperuricemia: a retrospective cohort study. Cardiovasc. Diabetol. 2025, 24, 218. [Google Scholar] [CrossRef]
- Yang, SH; Du, Y; Li, XL; Zhang, Y; Li, S; Xu, RX; Zhu, CG; Guo, YL; Wu, NQ; Qing, P; et al. Triglyceride to high-density lipoprotein cholesterol ratio and cardiovascular events in diabetics with coronary artery disease. Am. J. Med. Sci. 2017, 354, 117–124. [Google Scholar] [CrossRef]
- Andraschko, LM; Gazi, G; Leucuta, DC; Popa, SL; Chis, BA; Ismaiel, A. Atherogenic index of plasma in metabolic syndrome-a systematic review and meta-analysis. Medicina (Kaunas). 2025;61,611.
- Grassi, G; Vanoli, J; Facchetti, R; Mancia, G. Uric acid, hypertensive phenotypes, and organ damage. Data from the PAMELA Study. Curr. Hypertens. Report 2022, 24, 29–35. [Google Scholar] [CrossRef]
- Sheikh, AB; Sobotka, PA; Garg, I; Durin, I; Minhas, AMK; Dhandhi, MMH; McDonnel, BJ; Fudim, M. Blood pressure variability in clinical practice: past, present and the future. J. Am. Heart Assoc. 2023, 12, e029297. [Google Scholar] [CrossRef]
- Kurukulasuriya, LR; Stas, S; Lastra, G; Manirique, C; Sowers, JR. Hypertension in obesity. Endocrinol. Metab. Clin. North Am. 2008, 37, 647–662. [Google Scholar] [CrossRef]
- Maloberti A, Dell’Oro R, Bombelli M, Quarti-Trevano F, Facchetti R, Mancia G, Grassi G. Long-term increase in serum uric acid and its predictors over a 25 year follow-up: Results of the PAMELA study. Nutr. Metab. Cardiovasc. Dis. 2024, 34, 223–229. [Google Scholar] [CrossRef]
- Ding, L; Guo, H; Zhang, C; Jiang, B; Zhang, S; Zhang, J; Sui, X. Serum uric acid to high-density lipoprotein cholesterol ratio is a predictor for all-cause and cardiovascular disease mortality in patients with diabetes. Evidence from NHANES 2005-2018. Nutr Metab Cardiovasc Dis. 2024,34,2480-2488.
- Wang, MA; Huang, W; Zhing, X; Li, L; Wang, H; Peng, B; Mao, M. Meta-analysis of the correlation between serum uric acid level and carotid intima-media thickness. Plus One 2021, 16, e0246416. [Google Scholar] [CrossRef] [PubMed]
- D’Elia, L; Masulli, M; Virdis, A; Casiglia, E; Tikhonoff, V; Angeli, F; Barbagallo, CM; Bombelli, M; Cappelli, F; Cianci, R; et al. Triglyceride-glucose index and mortality in a large regional-based italian database (Urrah Project). J. Clin. Endocrinol. Metab. 2025, 110, e470–e477. [Google Scholar] [CrossRef] [PubMed]
- Baliarsingh, S; Sharma, N; Mukherjee, R. Serum uric acid: marker for atherosclerosis as it is positively associated with “atherogenic index of plasma”. Arch. Physiol. Biochem. 2013,119,27-31.
- Bortolasci, CC; Vargas, HO; Vargas Nunes, SO; de Melo, LG; de Castro: MR, Moreira, EG; Dodd, S; Barbosa, DS; Berk, M; Maes, M. Factors influencing insulin resistance in relation to atherogenicity in mood disorders, the metabolic syndrome and tobacco use disorder. J. Affect. Disord. 2015, 179, 148–155. [Google Scholar] [CrossRef] [PubMed]
- Nansseu, JR; Moor, VJ; Nouaga, ME; Zing-Awona, B; Tchanana, G; Ketcha, A. Atherogenic index of plasma and risk of cardiovascular disease among Cameroonian postmenopausal women. Lipids Health Dis. 2016, 15, 49. [Google Scholar] [CrossRef]
- Biyik, Z; Guney, I. Relationship between uric acid, proteinuria, and atherogenic index of plasma in renal transplant patients. Transplant Proc. 2018,50,3376-3380.
- Zheng, Y; Li, C; Yang, J; Seery, S; Qi, Y; Wang, W; Zhang, K; Shao, C; Tang, YD. Atherogenic index of plasma for non-diabetic, coronary artery disease patients after percutaneous coronary intervention: a prospective study of the long-term outcomes in China. Cardiovasc. Diabetol. 2022,21,29.
- Akbas, EM; Timuroglu, A; Ozcicek, A; Ozcicek, F; Demirtas, L; Gungor, A; Akbas, N. Association of uric acid, atherogenic index of plasma and albuminuria in diabetes mellitus. Int. J. Clin. Exp. Med. 2014, 7, 5737–5743. [Google Scholar]
- Huang, J; Chen, C; Jie, C; Li, R; Chen,C. L-shaped relationship between atherogenic index of plasma with uric acid levels and hyperuricemia risk. Front. Endocrinol. (Lausanne) 2024, 15, 1461599. [Google Scholar]
- Tao, Y; Wang, T; Zhou, W; Zhu, L; Yu, C; Bao, H; Li, J; Cheng, X. Threshold effect of atherogenic index of plasma on type 2 diabetes mellitus and modification by uric acid in normal-weight adults with hypertension. Front. Endocrinol. (Lausanne) 2024, 15, 1495340. [Google Scholar]
- Chang, Y; Li, Y; Guo, X; Guo, L; Sun, Y. Atherogenic index of plasma predicts hyperuricemia in rural population: a cross-sectional study from northeast China. Int. J. Environ. Res. Public Health 2016, 13, 879. [Google Scholar] [CrossRef]
Figure 1.
Unadjusted and adjusted logistic model for hyperuricemia (dependent variable) using cutoff values reported in the URRAh study (upper panel) and in previous studies (lower panel). Abbreviations: HDL = High Density Lipoprotein; LDL = Low Density Lipoprotein; VAI = Visceral Adiposity Index; CMI = CardioMetabolic Index; LAP = Lipid Accumulation Product.
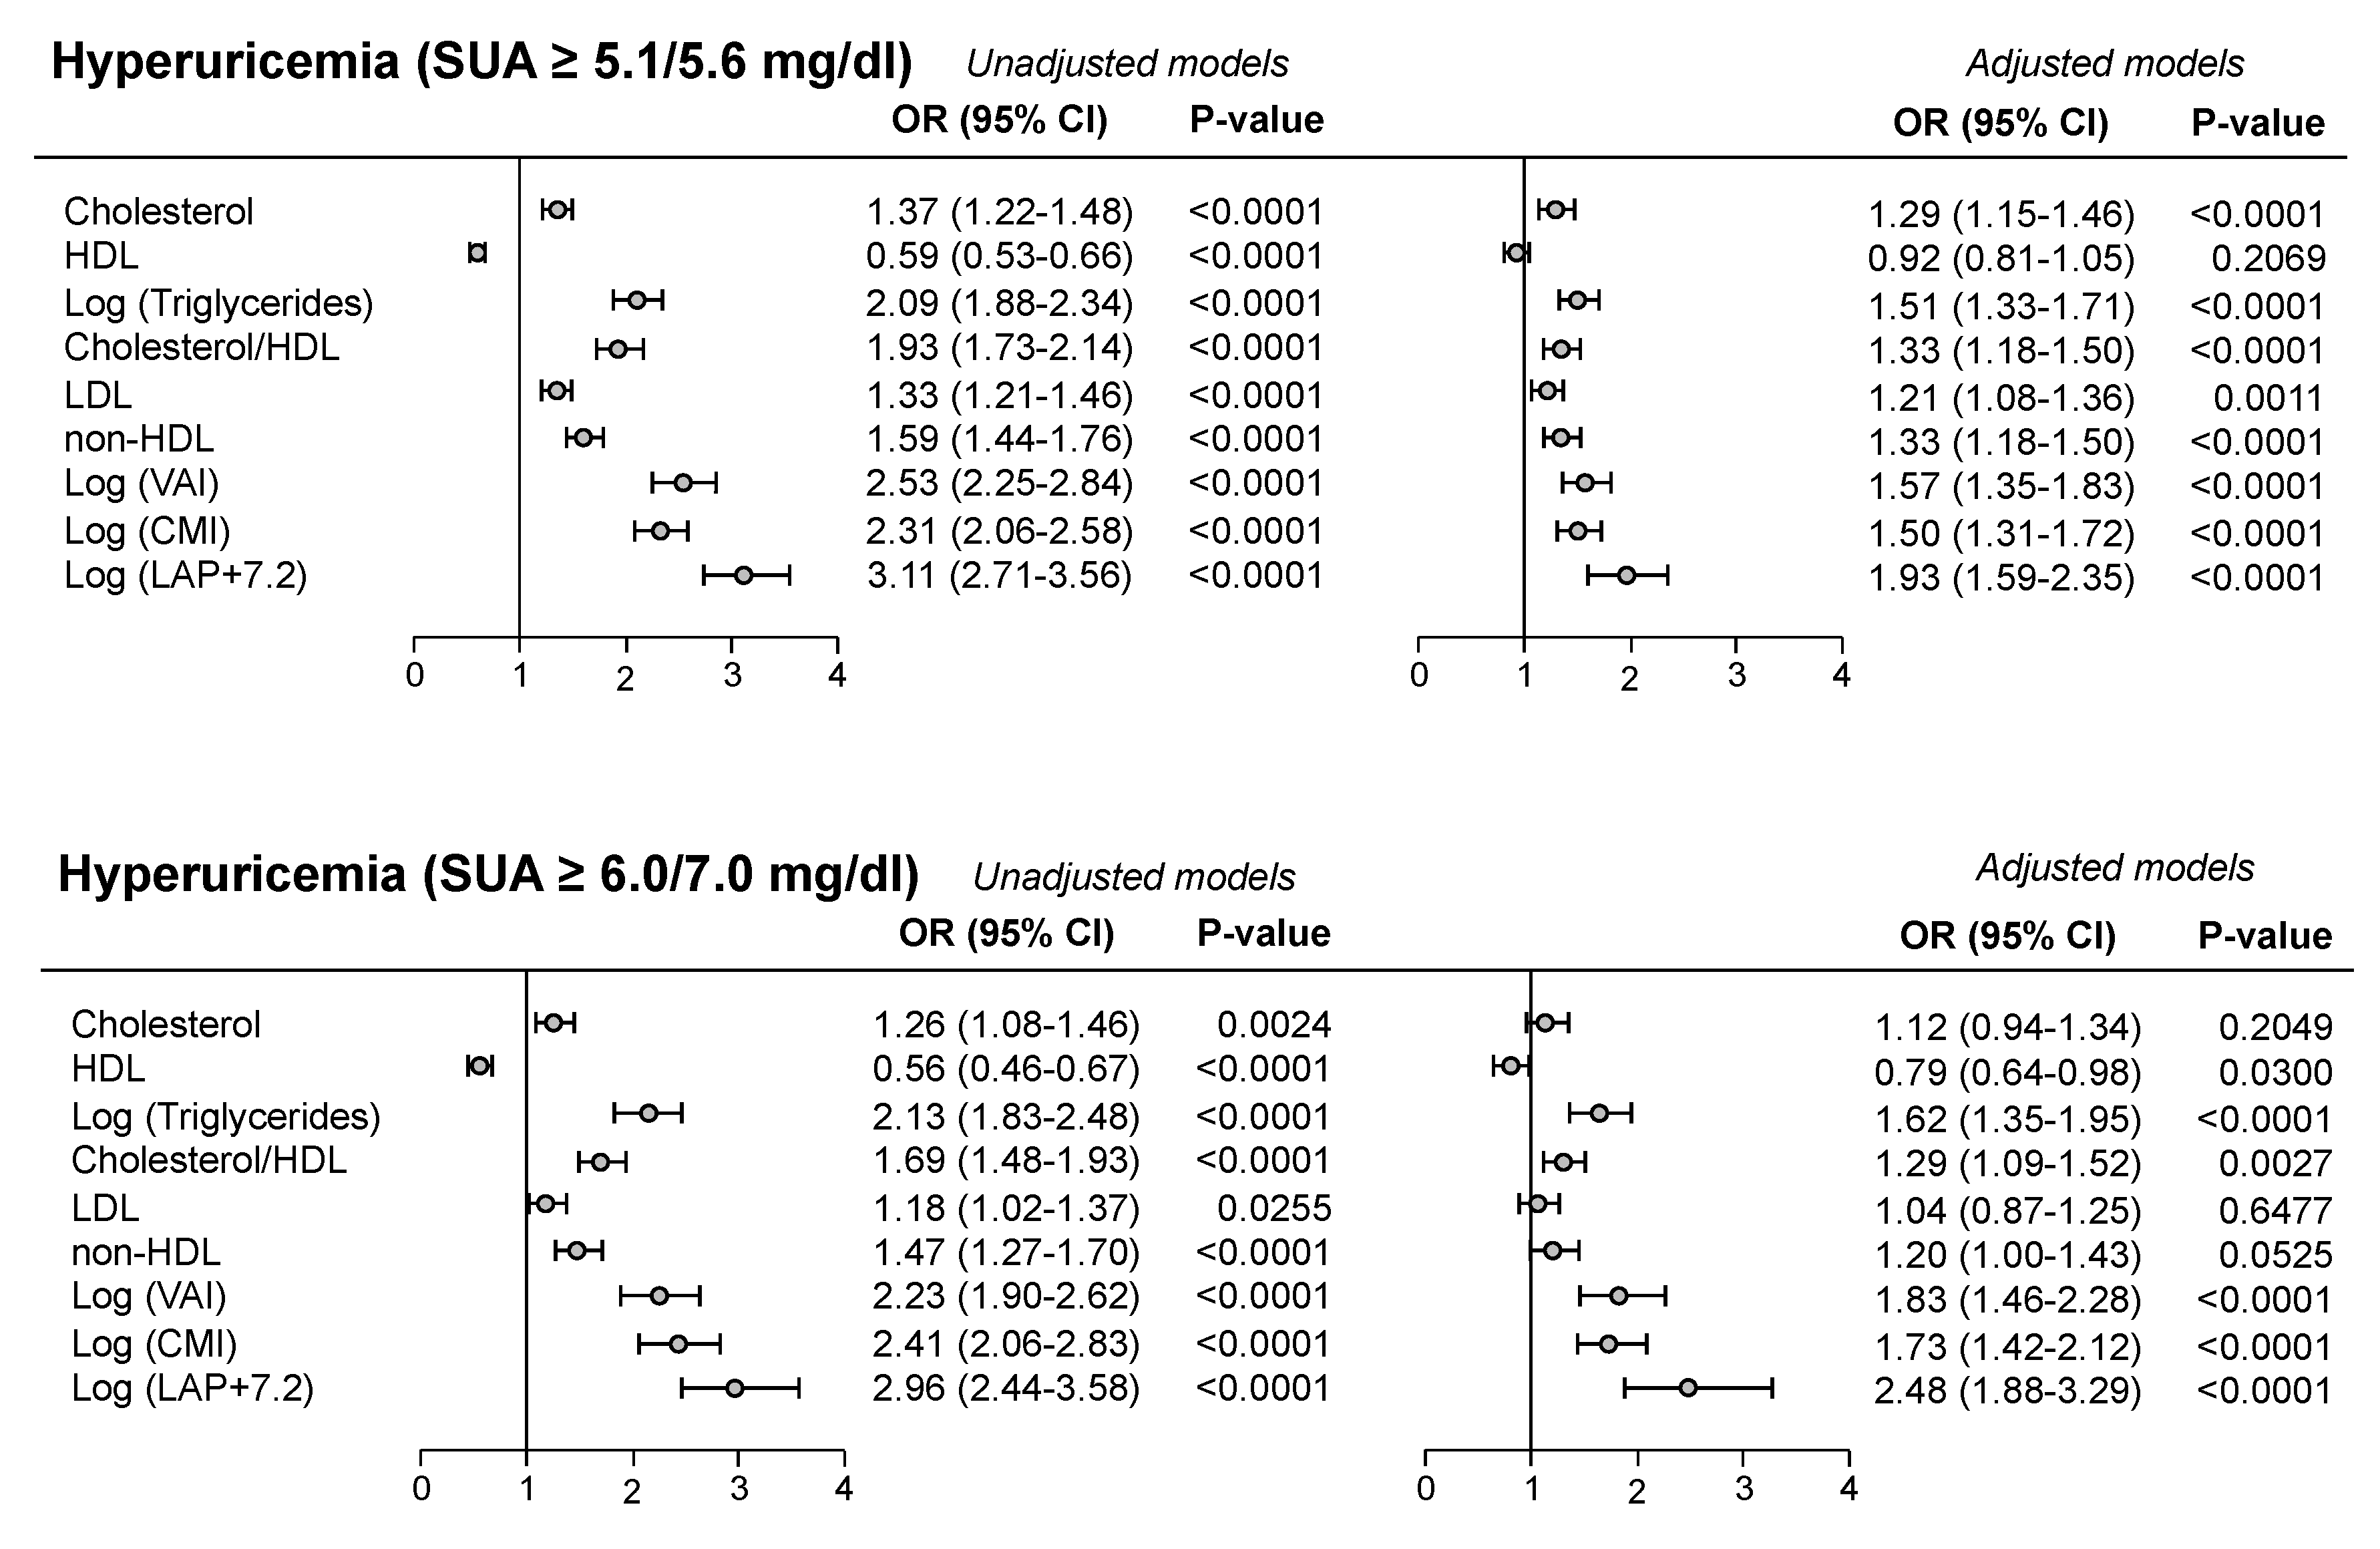
Figure 2.
Multiple regression model (linear or logistic) development of new hyperuricemia. Abbreviations: BMI = Body mass index; ΔGFR = changes in glomerular filtration rate during follow-up; ΔWC = changes in waist circumference during follow-up; SBP = Systolic blood pressure; OR = Odds Ratio.
Figure 2.
Multiple regression model (linear or logistic) development of new hyperuricemia. Abbreviations: BMI = Body mass index; ΔGFR = changes in glomerular filtration rate during follow-up; ΔWC = changes in waist circumference during follow-up; SBP = Systolic blood pressure; OR = Odds Ratio.
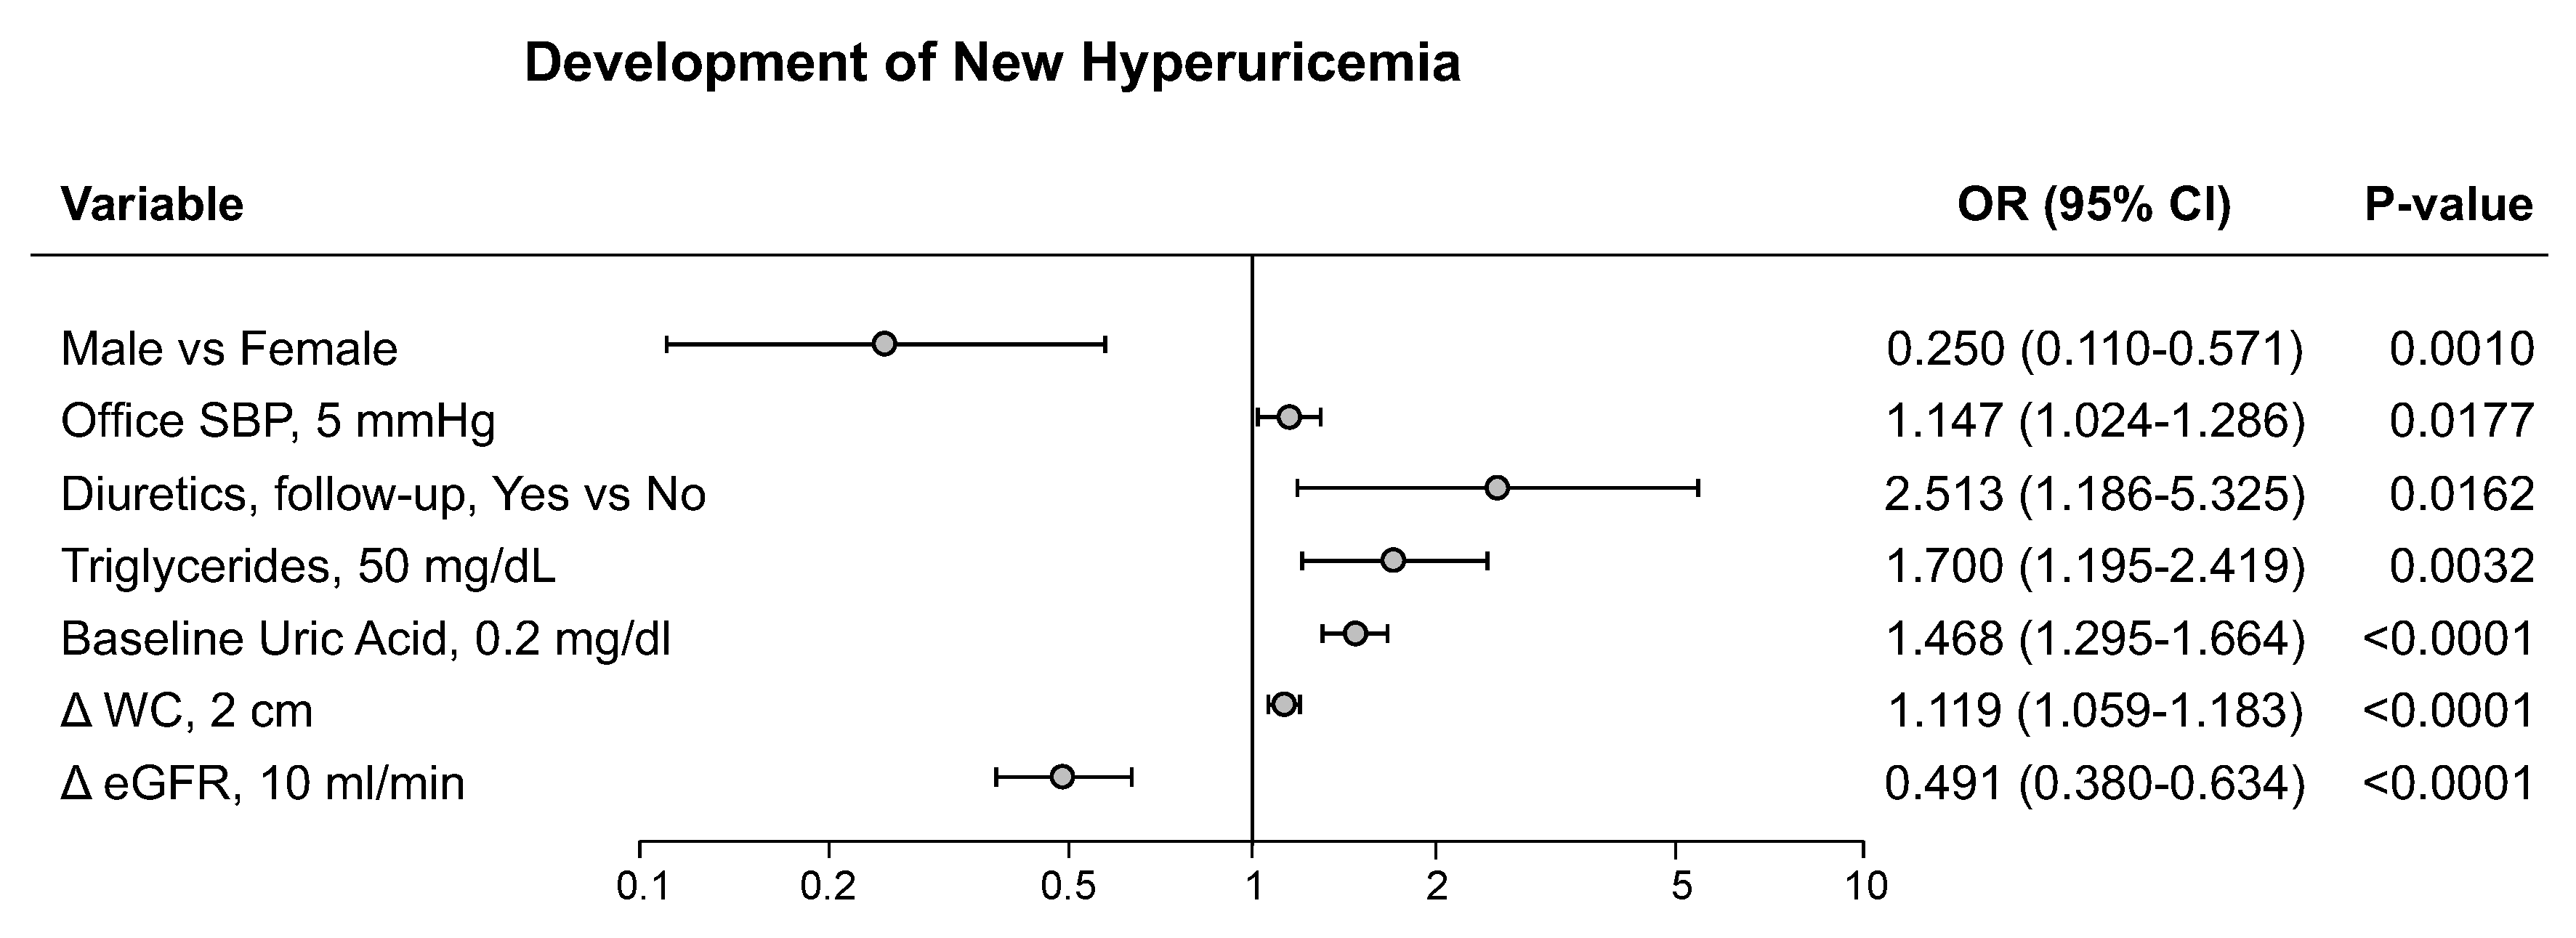
Figure 3.
Atherogenic Index of Plasma distribution in the whole PAMELA population (panel A), in males and females (panel B) and in normotenisve and hypertensive subjects (panel C). Abbreviations: AIP = Atherogenic Index of Plasma; M = Males; F = Females; NT = Normotensive; HT = Hypertensive.
Figure 3.
Atherogenic Index of Plasma distribution in the whole PAMELA population (panel A), in males and females (panel B) and in normotenisve and hypertensive subjects (panel C). Abbreviations: AIP = Atherogenic Index of Plasma; M = Males; F = Females; NT = Normotensive; HT = Hypertensive.
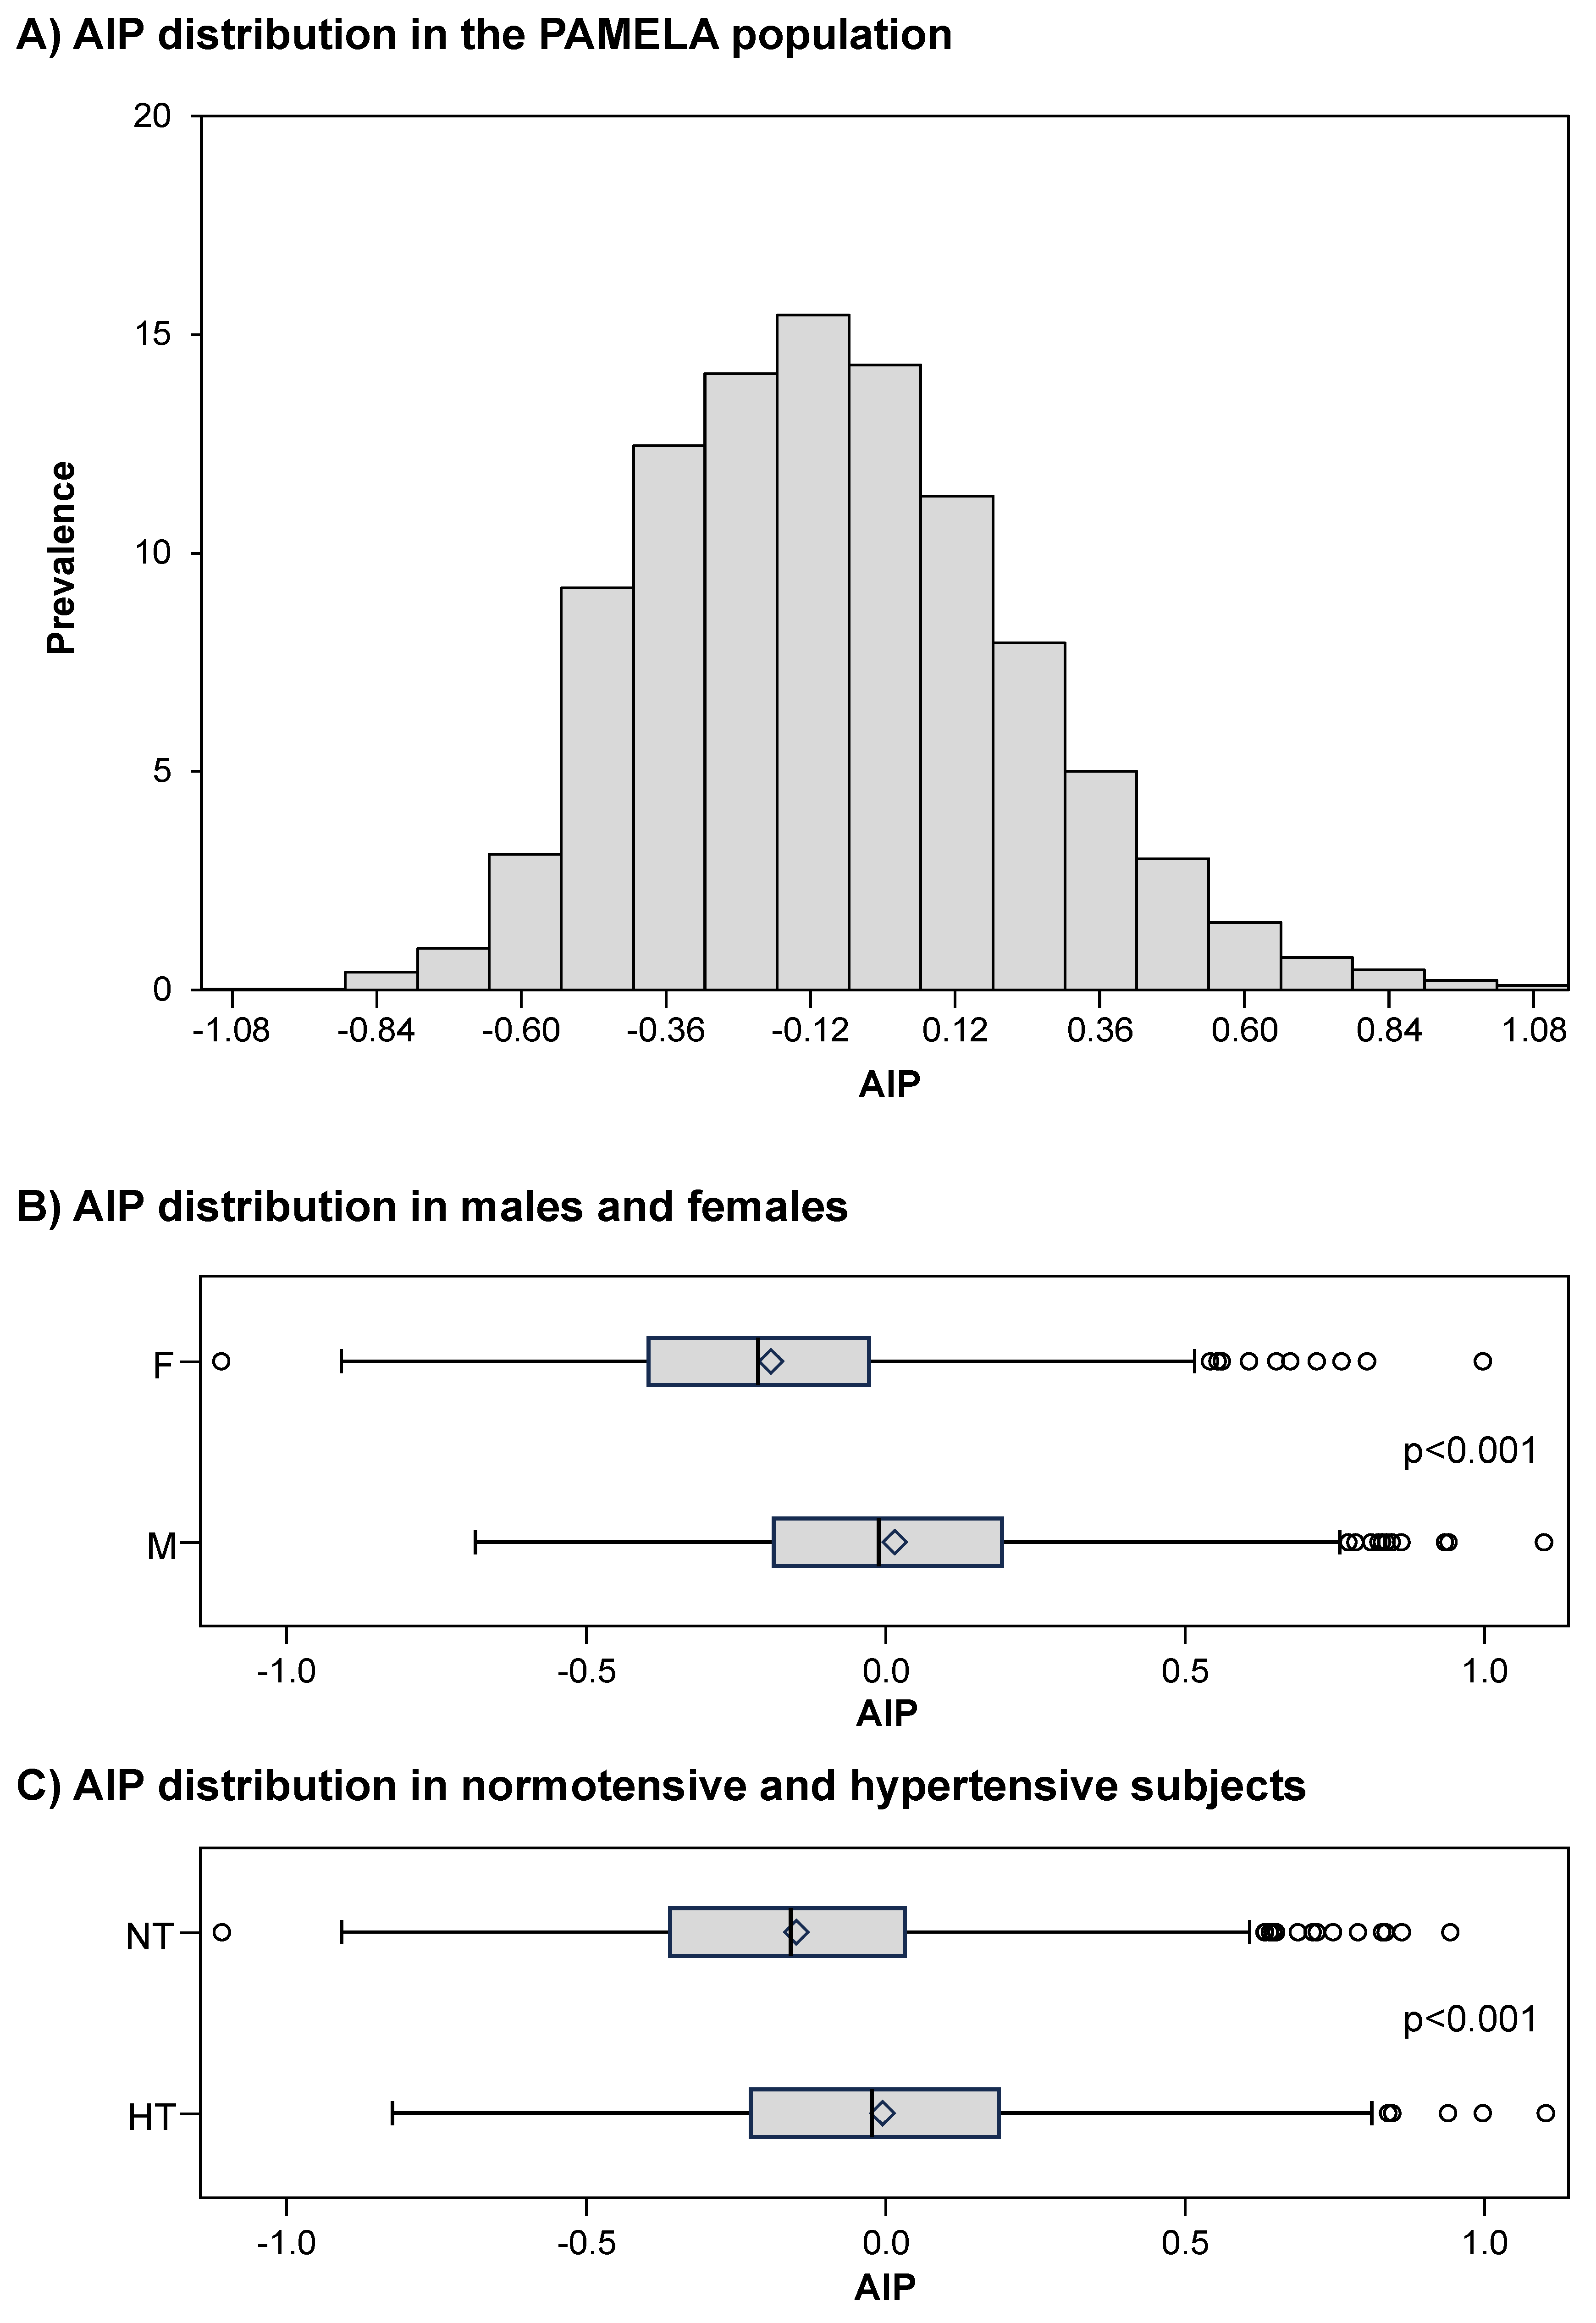
Figure 4.
Progressive increase in the Atherogenic Index of Plasma in different patients groups characterized by progressive increase in serum uric acid plasma levels.
Figure 4.
Progressive increase in the Atherogenic Index of Plasma in different patients groups characterized by progressive increase in serum uric acid plasma levels.
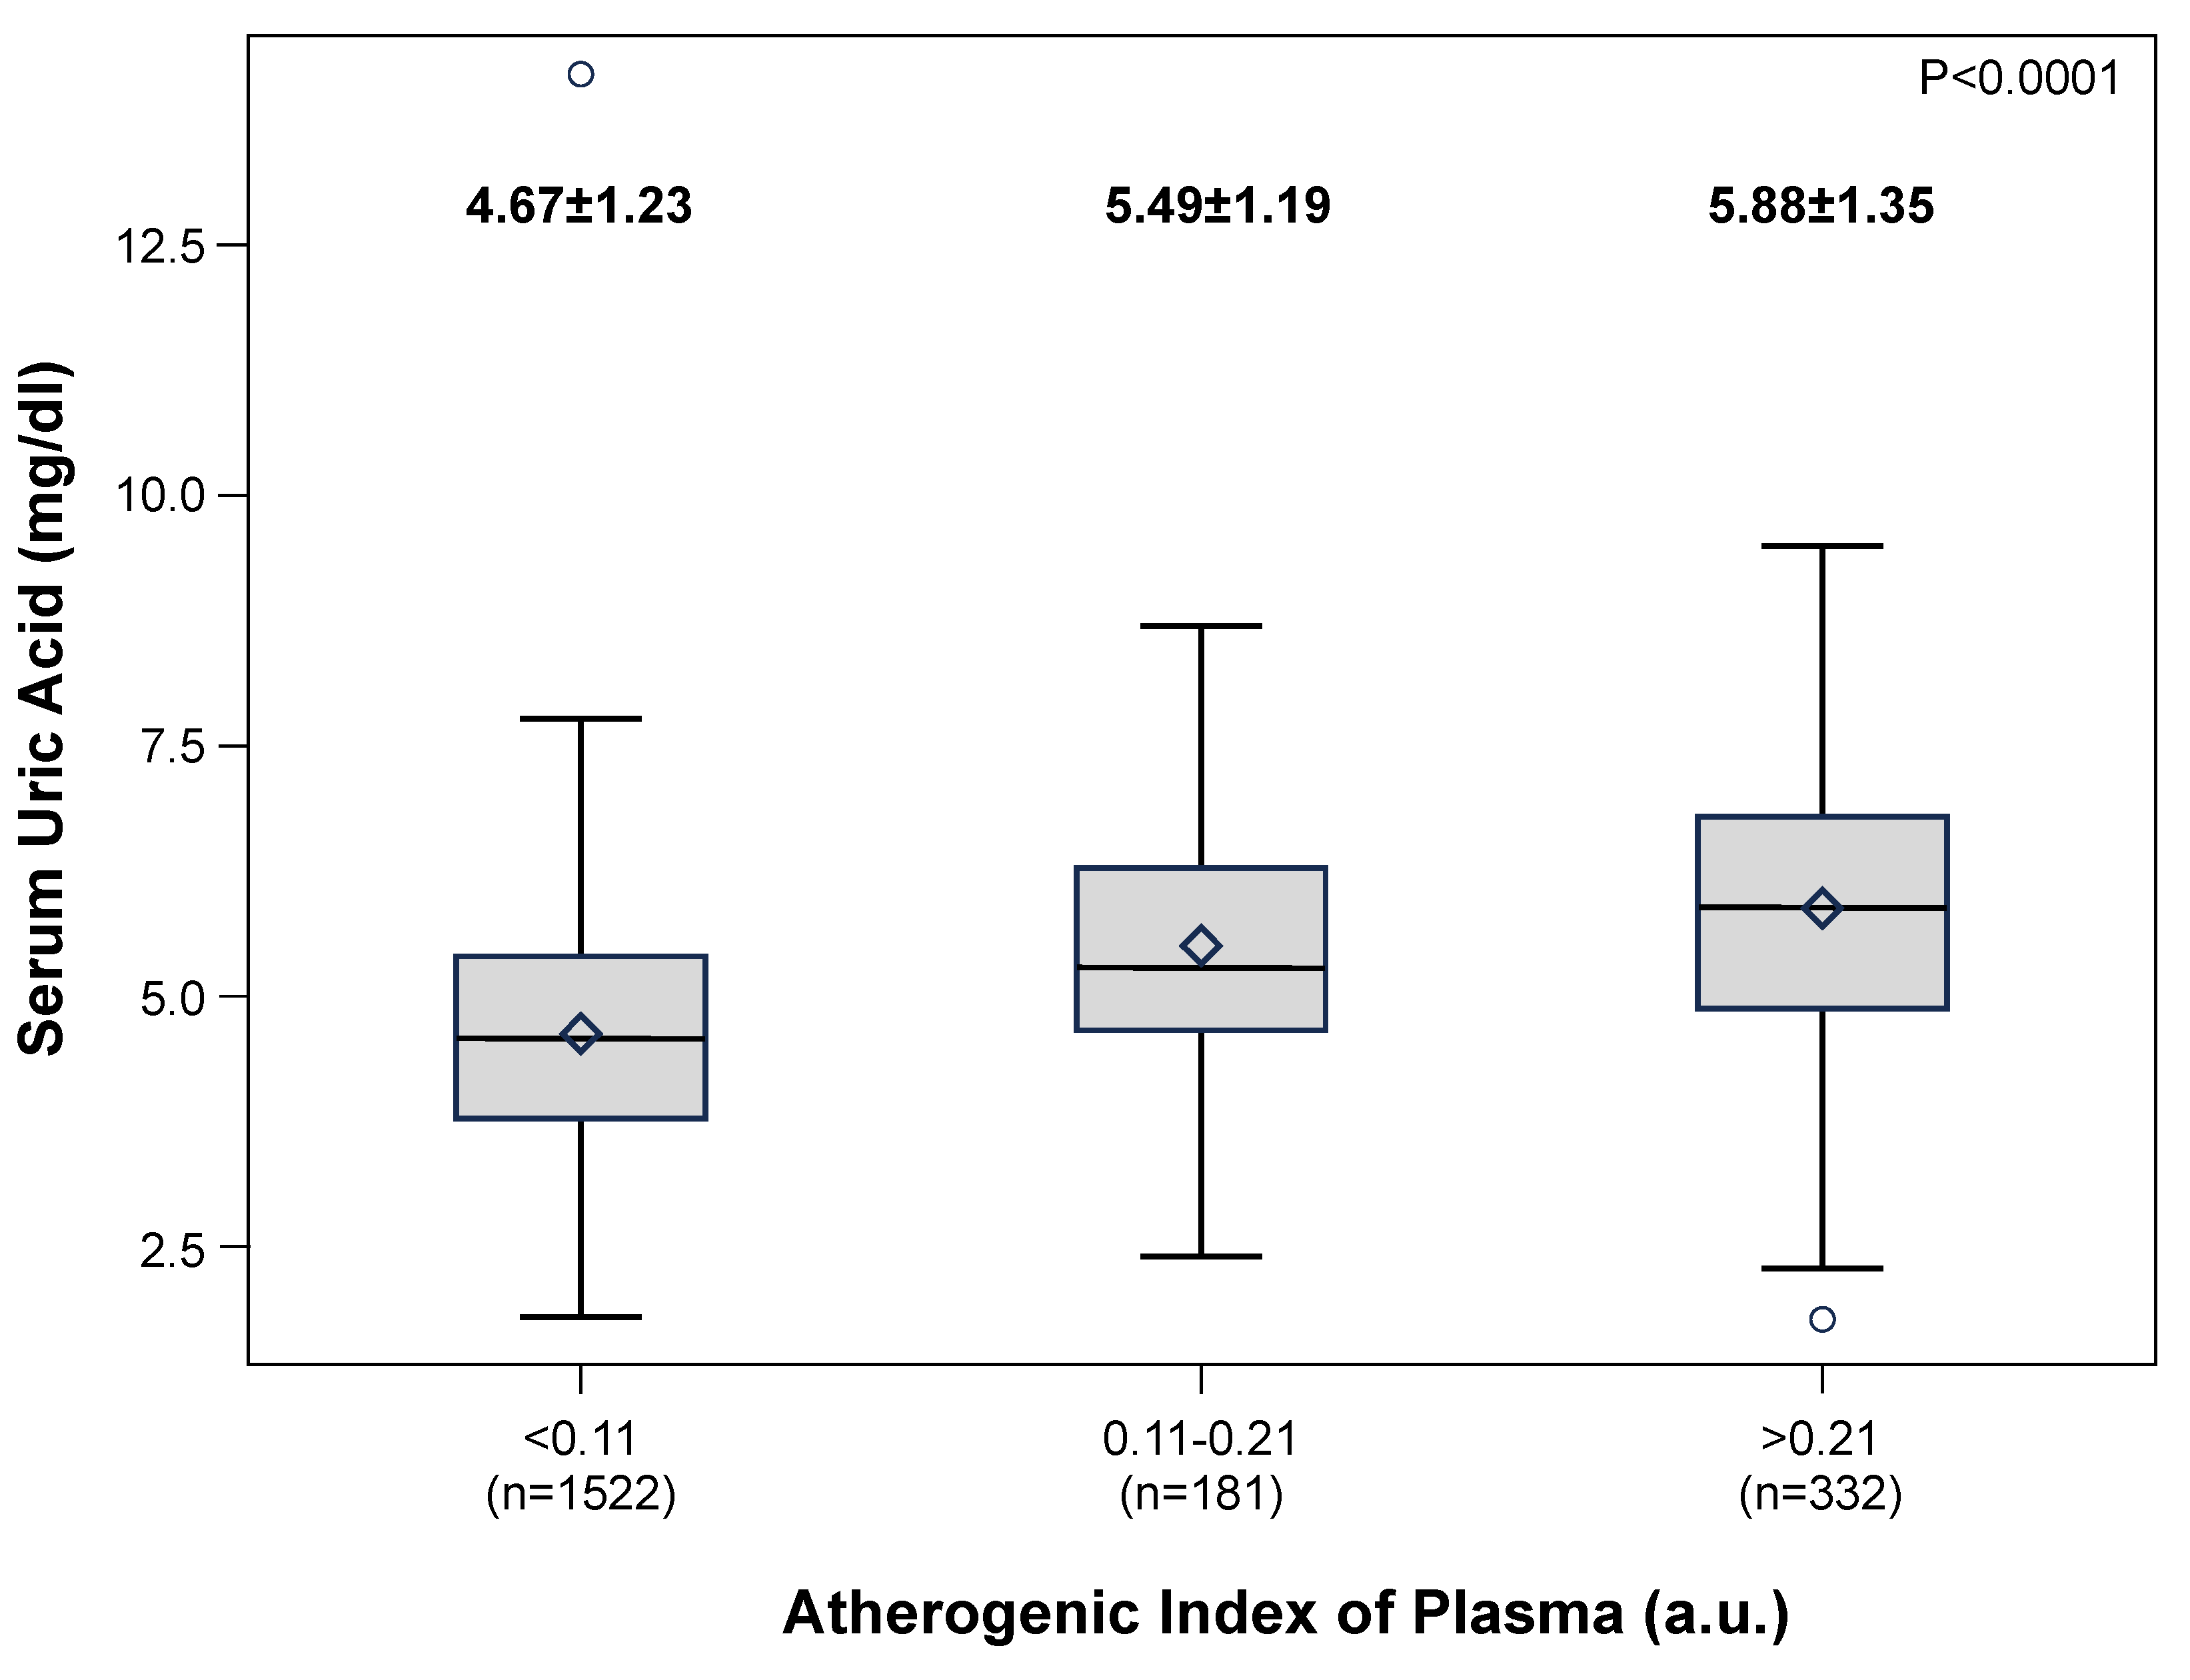

Table 1.
Atherogenic Index of Plasma univariate correlation analysis.
| Variable | r | P-value |
|---|---|---|
| Age | 0.24578 | <.0001 |
| Sex (males) | 0.34147 | <.0001 |
| BMI | 0.34527 | <.0001 |
| SBP Office | 0.25679 | <.0001 |
| DBP Office | 0.25837 | <.0001 |
| Heart Rate Office | -0.02744 | 0.2172 |
| Antihypertensive drug | 0.18966 | <.0001 |
| Glycemia* | 0.29839 | <.0001 |
| Total cholesterol | 0.24833 | <.0001 |
| HDL cholesterol | -0.73456 | <.0001 |
| Triglycerides* | 0.9382 | <.0001 |
| SUA | 0.43008 | <.0001 |
| Creatinine | 0.30255 | <.0001 |
| GFR | -0.14117 | <.0001 |
*log transformed variables. BMI = Body mass index; SBP = Systolic blood pressure; DBP = Diastolic blood pressure; HDL = High-density lipoprotein; SUA = Serum uric acid; GFR = Glomerular filtration rate.
Table 2.
Atherogenic Index of Plasma univariate correlation analysis with serum uric acid in subgroup analysis.
Table 2.
Atherogenic Index of Plasma univariate correlation analysis with serum uric acid in subgroup analysis.
| Variable | Number | r | P-value |
|---|---|---|---|
| Female | 1005 | 0.39015 | <.0001 |
| Male | 1030 | 0.25628 | <.0001 |
| Age<65 years | 1634 | 0.43106 | <.0001 |
| Age≥65 yearss | 401 | 0.35186 | <.0001 |
| No antihypertensive drug | 1637 | 0.42725 | <.0001 |
| Antihypertensive drug | 393 | 0.31914 | <.0001 |
| Office BP<140/90 mmhg | 1174 | 0.43525 | <.0001 |
| Office BP≥140/90 mmhg | 855 | 0.35746 | <.0001 |
| BMI <25 kg/m2 | 961 | 0.34454 | <.0001 |
| 25≤BMI<30 kg/m | 757 | 0.40381 | <.0001 |
| BMI≥30 kg/m2 | 271 | 0.30076 | <.0001 |
| No diabetes mellitus | 1964 | 0.44639 | <.0001 |
| diabetes mellitus | 71 | 0.06196 | 0.6078 |
BMI = Body Mass Index; BP = Blood Pressure.
Table 3.
Multiple linear regression model for AIP. Independent variables considered were age, sex, office systolic and diastolic blood pressure, antihypertensive treatment, glycemia, total cholesterol, creatinine, GFR, and UA, with stepwise selection applied.
Table 3.
Multiple linear regression model for AIP. Independent variables considered were age, sex, office systolic and diastolic blood pressure, antihypertensive treatment, glycemia, total cholesterol, creatinine, GFR, and UA, with stepwise selection applied.
| Variable | Beta (std error) | P-value |
|---|---|---|
| Age | 0.00048 (0.70585) | 0.0009 |
| Sex (Male) | 0.01369 (6.21816) | <.0001 |
| BMI | 0.00141 (6.10144) | <.0001 |
| Antihypertensive drug | 0.01664 (0.27906) | 0.0373 |
| Total cholesterol | 0.00014 (4.77346) | <.0001 |
| SUA | 0.00545 (4.85739) | <.0001 |
AdjR2=0.3019, For symbols and abrreviatiosn see previous tables.
Disclaimer/Publisher’s Note: The statements, opinions and data contained in all publications are solely those of the individual author(s) and contributor(s) and not of MDPI and/or the editor(s). MDPI and/or the editor(s) disclaim responsibility for any injury to people or property resulting from any ideas, methods, instructions or products referred to in the content. |
© 2025 by the authors. Licensee MDPI, Basel, Switzerland. This article is an open access article distributed under the terms and conditions of the Creative Commons Attribution (CC BY) license (http://creativecommons.org/licenses/by/4.0/).
Copyright: This open access article is published under a Creative Commons CC BY 4.0 license, which permit the free download, distribution, and reuse, provided that the author and preprint are cited in any reuse.


