Submitted:
19 September 2025
Posted:
30 September 2025
You are already at the latest version
Abstract
Background: Vaes et al. (2023)[@vaes2023] identified 13 symptom clusters in a large cohort of ME/CFS patients. Symptom intensity is broadly correlated with post-exertional malaise (PEM) severity, with variation across clusters that seems disorganized. Despite this research, no broadly accepted organizing principle has emerged from this paper or other attempts at phenotyping ME/CFS. Objective: To identify and characterize potential subgroups defined by symptom domain severity relative to PEM within the original Vaes symptom clusters. Our analysis identified two groups of patient clusters with distinct symptom-domain profiles. Anchoring symptom domains to PEM collapses the 13 Vaes clusters into two reproducible families: one characterized by parallel offsets (autonomic, neuroendocrine, other) and one by amplified slopes (pain, neurocognitive), with high-end convergence after accounting for a single influential cluster. This subgroup's symptom trends could align with those of fibromyalgia. Further exploration with individual patient data is needed to validate these findings.
Keywords:
Myalgic Encephalomyelitis
; ME/CFS
; patient clustering
; fibromyalgia
; post-exertional malaise
; PEM
1. Introduction
Dr. Anouk W. Vaes and her collaborators at CIRO performed one of the largest systematic surveys of ME/CFS symptom patterns, applying clustering methods to patient-reported outcomes to identify recurring constellations of symptoms1. They used symptom surveys based on the DePaul Symptom Questionnaire version 2 (DSQ-2) from 337 patients to identify a total of 45 patient clusters, of which 13 were of size ≥ 10 while the remaining were mostly of size ≤ 2 and approximately 9.4% of the total cohort. We used the publicly available data of their final 13 clusters for most of the analysis2 but we discuss the small clusters in Section 4.
While Vaes described each cluster, and noted some differences among symptom severity, an overall organizing principle was not proposed. Here we examine whether one might emerge from that dataset.
Our analysis suggests that the Vaes ME/CFS clusters can be organized into two overarching families defined by their relationship to PEM. This reduces the complexity of the cluster symptom intensities and highlights a subgroup within the Vaes clusters that has not been explicitly recognized in prior work. Once separated and profiled, this subgroup shows amplified PEM per symptom domain, consistent with current research on ME/CFS and fibromyalgia comorbidity. This paper invites further investigation with patient-level symptom data to validate or refute these findings and clarify their clinical and biological relevance.
Our central contribution is a PEM-referenced decomposition that reduces the Vaes clusters to two linear families (offsets vs. amplification) and explains much of the apparent heterogeneity.
2. Symptom Domains Relative to PEM
The strong weight of PEM symptoms makes the Vaes dataset tricky to interpret if you only look at raw intensity, so instead we compared overall symptom levels to PEM severity. From this comparison we identified two groups of clusters that maintain their integrity across most symptom domains. This PEM-anchored view is the organizing principle for all results that follow.
Because these analyses are exploratory and based on cluster-level data, the patterns described below should be interpreted as hypothesis-generating.
We first examine the areas of most similarity before highlighting how they differ. We add an “all” category to gauge overall symptom severity to the original symptom domains. Our use of the terms “high-intensity” and “low-intensity” does not reproduce the clusters described by Vaes or others but reflects a new organization based on how symptom domains scale with PEM. Vaes used the DePaul symptom groupings which we keep as-is.
Notes: The DSQ-2 uses a single symptom for fatigue. Also, for the “Overall” chart we used the arithmetic mean instead of geometric mean for the Y axis. All other graphs in this study use geometric means exclusively. Shaded bands represent the 95% confidence interval of the linear models when used. While this section focuses on visual inspection, we provide more statistical descriptions in Appendix B.
2.1. Similarities
In terms of fatigue, the two groups overlap completely, as ME/CFS patient clusters are expected to. See Figure 1, below. While the lines have a similar slope and offset we note the R2 value is significantly weaker in the low-intensity group (0.54 vs. 0.86).
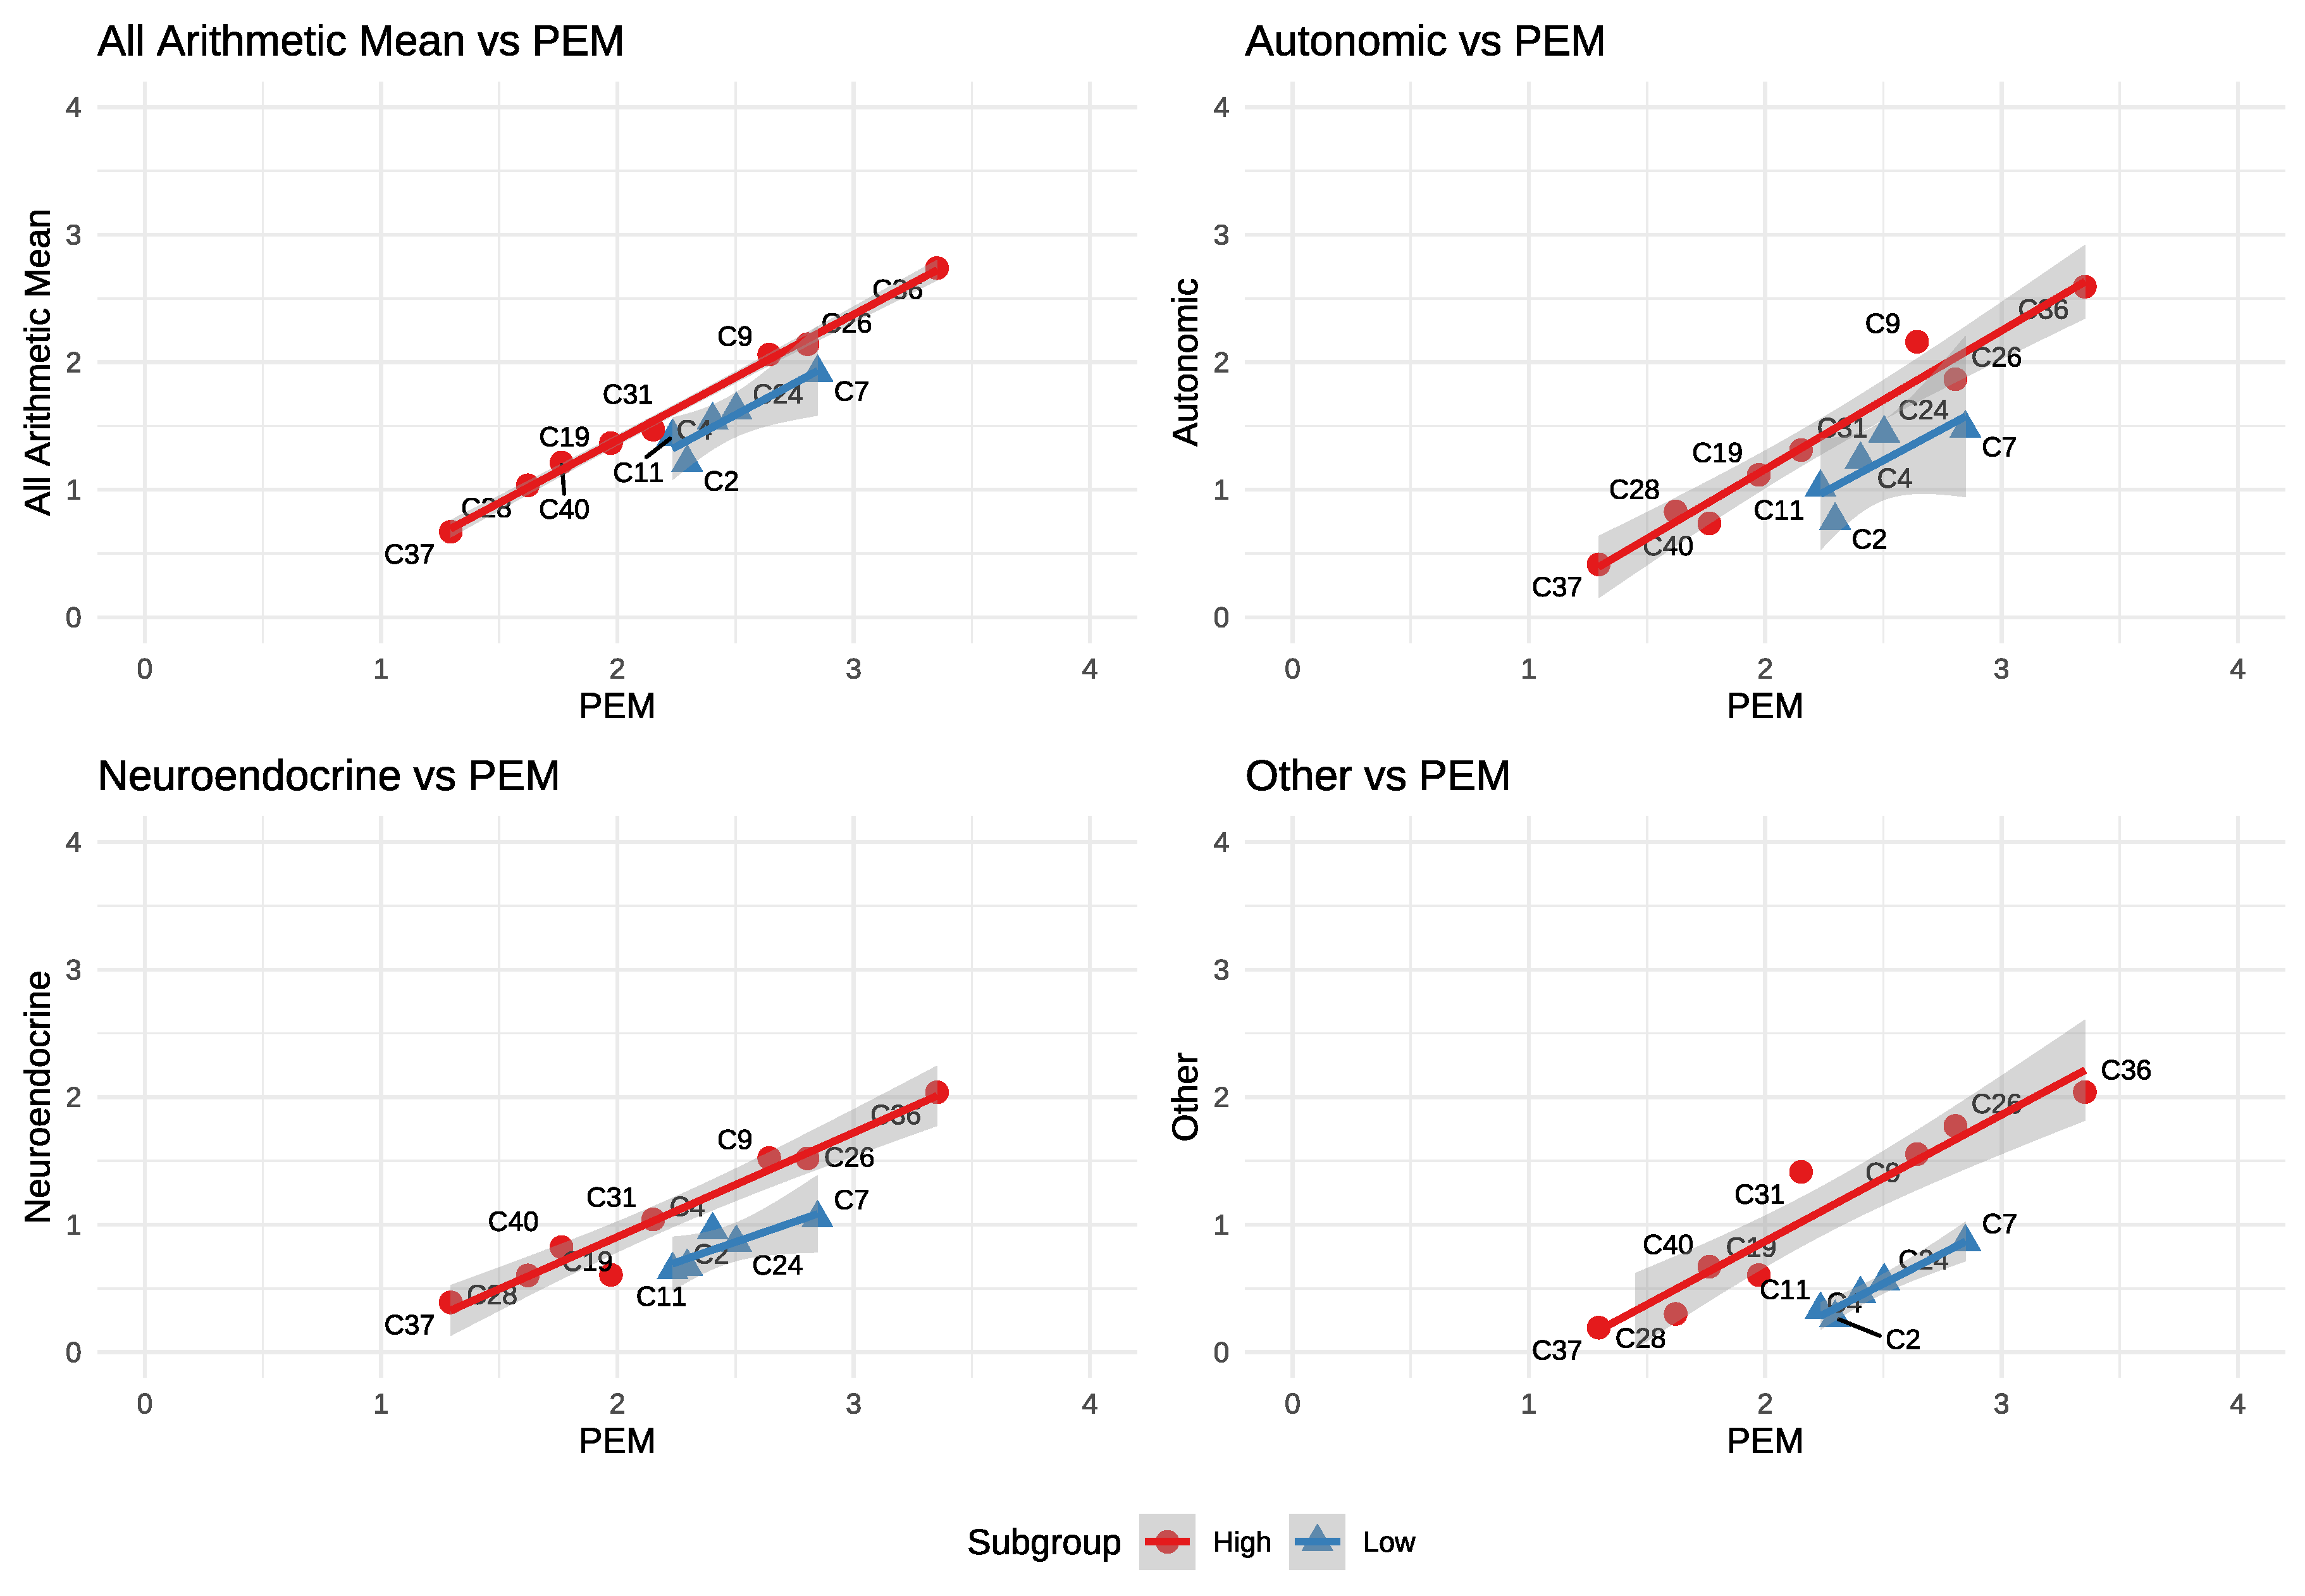
While fatigue shows complete overlap in our groups the next charts (Figure 2) show how they stand out. In the first chart (top left) we compare the average of all symptoms to PEM. In this chart one can easily discern two tiers of clusters. One has a higher overall symptom burden at any given PEM level compared to the other and this relationship is where we derive the names for our groups: high and low-intensity.
Autonomic, Neuroendocrine and Other also follow a similar pattern: Parallel but lower than the high-intensity group.
We note that the limited range of PEM severity in the low-intensity group ( to 2.9) may have otherwise caused it to remain undetected.
Groupings: From visual inspection of the charts above we group clusters C9, C19, C26, C28, C31, C36, C37, C40 as high-intensity, C2, C4, C7, C11, C24 as low-intensity. We’ll keep these groupings for all plots that follow. The high and low groups are approximately 54.5% and 45.5% of the total cohort, respectively. We further discuss our grouping choices in Leave-one-out Analysis.
The last chart (Other vs. PEM) shows a markedly lower offset and is perhaps the most visibly obvious difference between the two groups. The two symptoms in `Other’ are sensitivity to mold and vibration.
While the groups maintain integrity, the parallelism observed in the charts above does not hold in the next charts and suggests a more complex physiological cause for the differences.
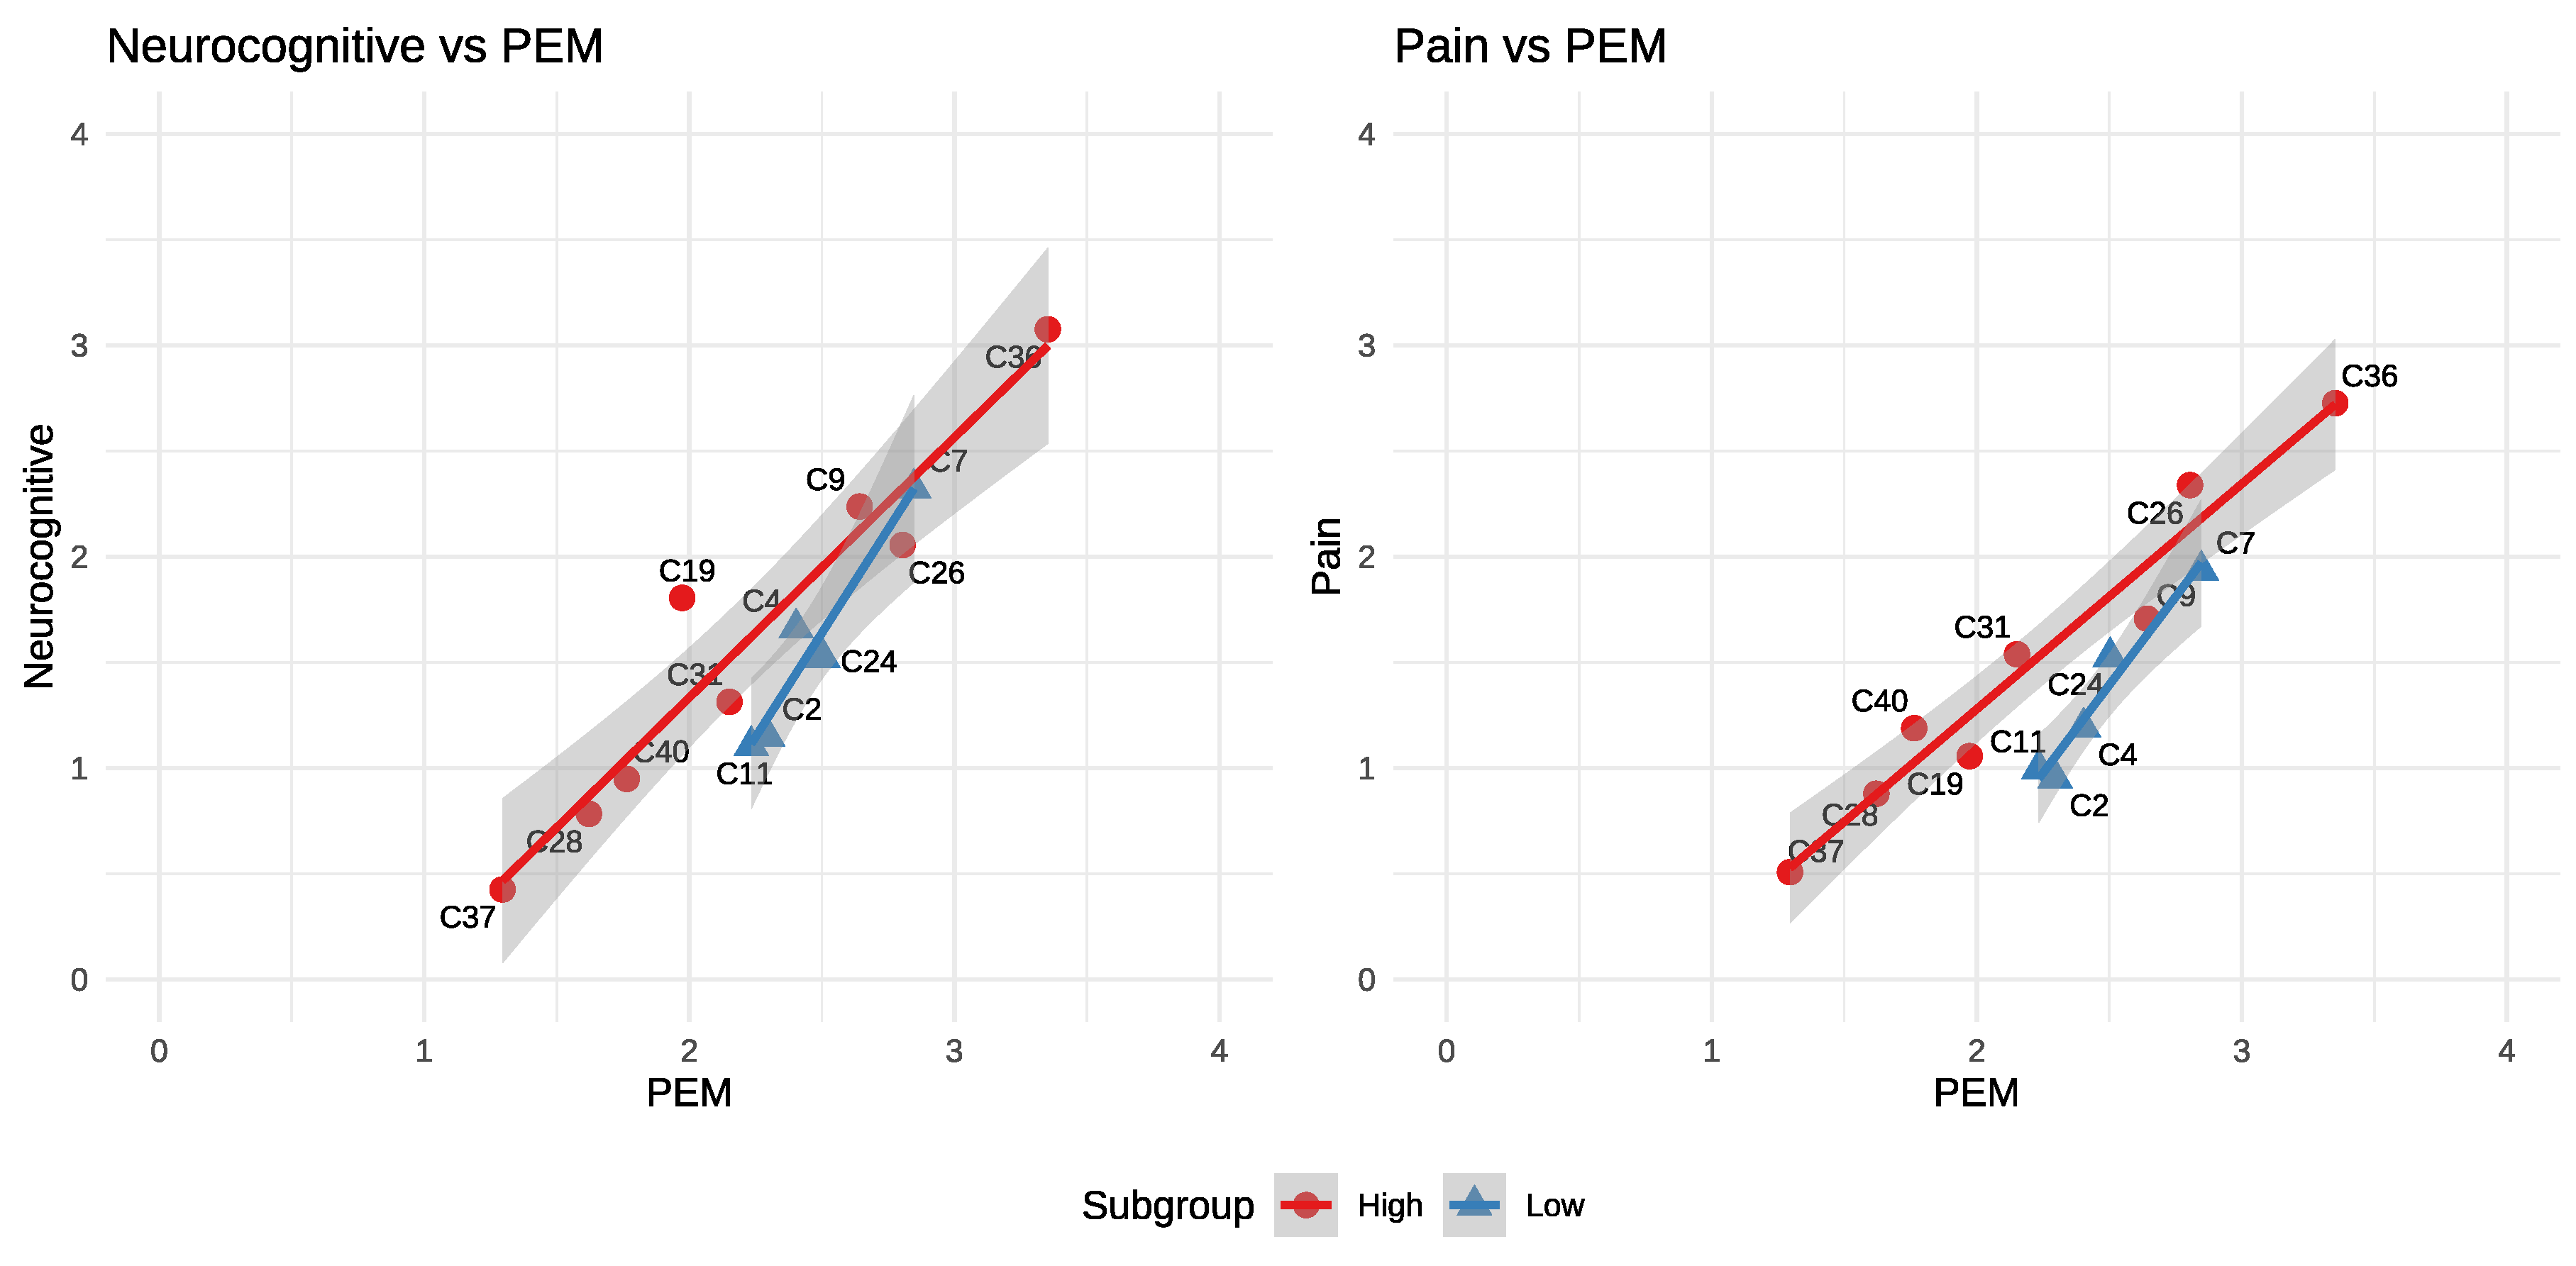
2.2. Separate Amplification Patterns Relative to PEM
Pain and neurocognitive domains show that while the low-intensity group remains offset, symptom domain amplification is increased. As PEM increases to 3, C7 comes very close to the high-intensity line.
Figure 3.
Pain and Neurocognitive vs. PEM.
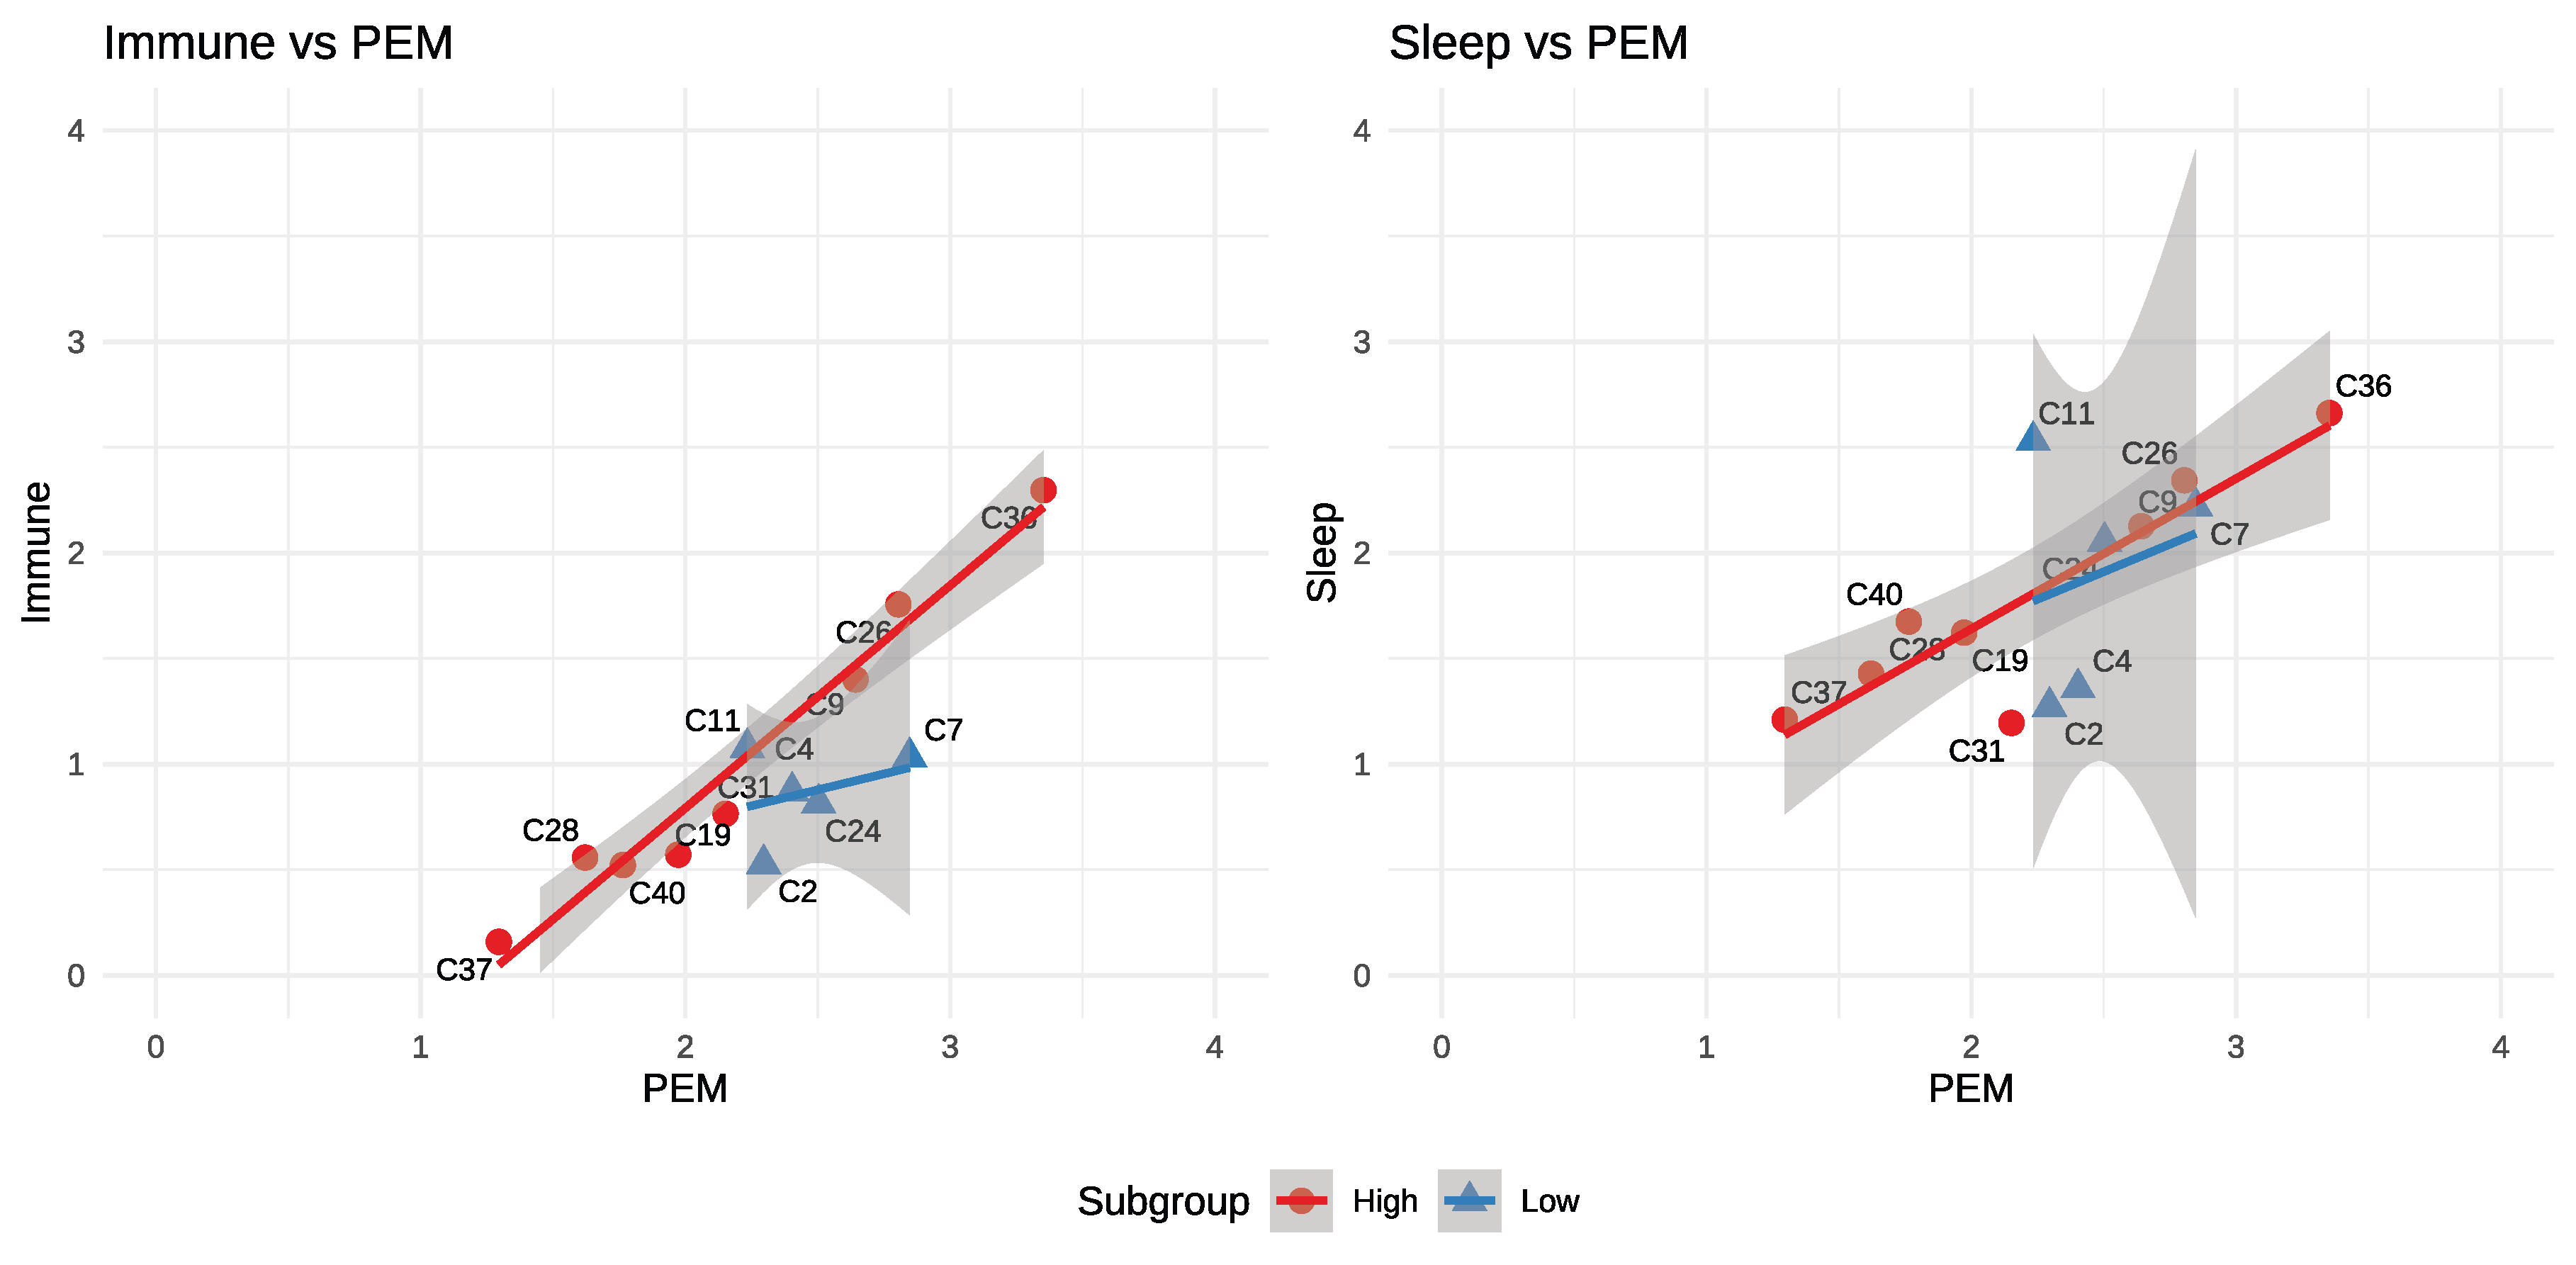
2.3. Weak Correlations Relative to PEM
In all of the previous charts we’ve shown that both groups maintain a strong but distinct relationship to PEM. By contrast, the immune and sleep domains show little to no correlation with PEM severity in the low-intensity group. Notably, despite this lack of correlation, sleep disturbance can be pronounced in the low-intensity group.
Figure 4.
Immune and Sleep vs. PEM.
2.4. Summary of Differences
High-intensity: Has a consistent amplification pattern: as PEM increases, all other symptom domains rise together. Important to note C36 as an outlier for the entire cohort. Without it the upper limits of PEM, Neurocognitive and Pain would match around C7 and C26.
Low-intensity: Presents a more selective profile. Pain, neurocognitive, and neuroendocrine symptoms escalate more rapidly with PEM, while sleep and immune symptoms show little or no correlation. Additionally, the low-intensity group is notably nestled in the middle of the overall PEM range which could allow it to hide among the other clusters if not actively searched for.
We summarize these differences in the table below.

Table 1.
Summary of Group Differences.
| Feature | High group | Low group |
|---|---|---|
| Overall vs. PEM | Higher | Lower - esp. “Other” |
| Fatigue | R2 - 0.86 | Weaker R2 - 0.54 |
| PEM range | – 3.4 | Narrower – 2.9 |
| Neurocognitive | Tracks PEM | Elevated amplification |
| Pain | Tracks PEM | Elevated amplification |
| Immune | Tracks PEM | Flat at |
| Sleep | Tracks PEM | – 2.5, but uncorrelated |
Symptom Severity: In terms of overall symptom range the two groups largely overlap. The high-intensity group, by symptom intensity alone, could be considered a superset of the low-intensity group. It is the differing relationships to PEM and the selective amplification of pain and neurocognitive symptom domains in the low-intensity group that set the two groups apart. We discuss this further in Section 3, below.
3. Exploring the Low-intensity Subgroup
Based on the trends noted in Section 2.2, a discussion of whether the low-intensity group could relate to fibromyalgia is warranted. We note that Vaes1 did not model fibromyalgia diagnoses, nor did they report excluding patients with fibromyalgia from their cohort. We cannot assert that the subgroup is clinically fibromyalgia, only that its domain profile aligns with what would be expected if fibromyalgia were present within this cohort.
Patterns in the low-intensity group have higher PEM burdens for all symptom domains except Immune and Sleep, which are uncorrelated with PEM. Further, Neurocognitive and Pain regression lines are amplified.
Vaes1 recruited participants who self-reported ME/CFS and later mapped them to multiple case definitions, yielding a broad spectrum of clinical presentations:
Almost 90% of the participants fulfilled the Fukuda case definition, compared to 80%, 59% and 39% fulfilling the IOM, CCC and ME-ICC case definitions, respectively. More than a quarter of the participants met the criteria for all four different case definitions, whilst 5% of the participants met none of the abovementioned case definitions,…
This breadth makes mixed phenotypes plausible. Independent evidence also indicates that fibromyalgia frequently co-occurs with ME/CFS3,4, and comorbidity has been associated with more frequent and severe PEM in ME/CFS patients5, which could explain the subgroup’s right-shift along the PEM axis.
Because the Vaes analysis used cluster-level summaries and did not model comorbidities, we cannot identify fibromyalgia directly here. Confirmation would require patient-level data we do not have access to.
4. Characteristics of the Smallest Clusters
Vaes1 identified 32 additional clusters6. These were mostly of size 1, with 4 clusters of size 2 and represent approximately 9.4% of the cohort. We examined these smaller clusters in light of our two-group hypothesis.
Taken as a whole the 13 large clusters appear to have captured the broad trends of the entire dataset with the remaining clusters spread across and beyond our two subgroups. This may suggest that the two groups are not distinct but artifacts of the clustering constraints when applied to data that is widespread.
Specifically however, the small clusters mostly had sleep scores above the high-intensity group’s regression lines and showed similar upper pain and neurocognitive limits as described in Section 3.
Finally, the small clusters, when added to the large clusters, did not significantly move their location or regression lines.
5. Discussion
We have shown that the Vaes clusters can be organized into two subgroups defined by symptom domains relative to PEM, and that these subgroups remain consistent across most domains. Grouping them by their relationship to PEM simplifies the original complexity at both the domain and cluster levels. From this perspective, the 13 Vaes clusters can be reduced to two groups of linear models, where membership in one group combined with PEM intensity allows inference of the intensity of other symptom domains. We view this PEM-referenced, two-family reduction (offsets vs. amplification, with C36 sensitivity at the high end) as the main conceptual advance over prior descriptions of the Vaes clusters.
While these patterns are striking, our analysis is a secondary exploration based on symptom-domain summaries of the Vaes patient data. The small subgroup sizes (eight and five clusters) and the original clustering approach may distort some relationships, and the plots can suggest trends that do not necessarily exist at the patient level. The apparent high/low separation may therefore reflect artifacts of the clustering algorithm averaging a broad underlying distribution rather than true biological subgroups, which would render our suggested distinctions essentially coincidental. The framework is compatible with FM enrichment as a downstream hypothesis, but the PEM-referenced structure stands independently of comorbidity.
These considerations highlight the need for validation before our findings can be clinically relevant. We see challenges in at least three areas: whether the groupings hold when tested with individual patient data; whether symptom-domain analysis can reliably identify the group to which a given patient belongs; and how these subgroups relate—or fail to relate—to fibromyalgia.
As an example, Vaes1 provided cluster-specific summaries of standout symptoms; some of those align with our domain-based charts while others show a different emphasis, demonstrating the challenge of reconciling symptom-level observations with domain-level analyses.
Despite these limitations, we believe further steps are justified. Analyses using the original patient scores could validate, refine, or repudiate these subgroups and help identify a short list of differentiating symptoms. If that proves useful, examining biological markers across these subgroups could help reveal underlying pathophysiological differences. In addition, applying similar analyses to fibromyalgia and long-COVID could clarify relationships among these overlapping conditions or even help refine how ME/CFS and fibromyalgia are classified.
6. Conclusions
Our secondary analysis suggests that the 13 clusters identified by Vaes can be organized into two broader structures defined by overall symptom intensity relative to PEM severity. These two groups remain coherent across symptom domains and display distinct, largely linear relationships with PEM. Although exploratory and limited to cluster-level data, these findings offer a reproducible framework for further research, specifically for validating these potential subgroups and exploring their clinical and biological relevance.
Author Contributions
Erik K. Squires conceived the study, performed the analysis, and wrote the manuscript. This work presents an original investigative method and resulting framework which were both developed and first reported by the author in this preprint.
Funding
This work received no external funding.
Institutional Review Board Statement
This study reanalyzed publicly available reports and published symptom cluster data (Vaes 2023). No new patient data were collected.
Data Availability Statement
A copy of the original Vaes spreadsheets are available in the GitHub repository, above, and from the original Vaes publication1 at https://doi.org/10.1186/s12967-023-03946-6. All other data files are created from the original Vaes spreadsheets using the code in the GitHub repository, above. All data manipulation and analysis scripts are available at https://github.com/eriksquires/VaesSubgroups
Acknowledgments
This paper could not exist without the foundational work of Dr. Anouk W. Vaes and her colleagues at CIRO, whose clustering study1 and publicly available cluster summary data2 provided the basis for our analysis. We are deeply grateful for their contribution to the field. Dr. Vaes had no role in the writing of this paper, and all errors or misinterpretations are the responsibility of the author.
Conflicts of Interest
The author declares no competing interests.
Appendix A. Cluster Summary Data
We use the Vaes cluster spreadsheet2 exclusively as our data source. We use R for significant cleaning and transformation from Excel to CSV. After removing everything but the mean severity of the symptoms in the 13 clusters we:
- Group each cluster by symptom domain and calculate geometric means for each symptom domain within each cluster.
- Rotate the table
- Add a new column, “all_mean” which is the arithmetic mean of all symptoms within each cluster.
- Save this file as cluster_grouped_tidy.csv
This file is what we then used for our analysis, and the plots. We present the final data used below. Values were rounded and abbreviations were used for formatting. See the Code Availability section for links to the code used to generate this file.
Table A1.
Cluster Summary Data with Geometric Means by Symptom Domain.
| Cluster | All | PEM | Fatigue | Auto | Immune | NC | NE | Pain | Other |
|---|---|---|---|---|---|---|---|---|---|
| C2 | 1.21 | 2.30 | 2.79 | 0.76 | 0.53 | 1.15 | 0.67 | 0.95 | 0.27 |
| C4 | 1.55 | 2.40 | 3.13 | 1.24 | 0.87 | 1.66 | 0.96 | 1.19 | 0.46 |
| C7 | 1.92 | 2.85 | 3.20 | 1.48 | 1.03 | 2.32 | 1.05 | 1.94 | 0.86 |
| C9 | 2.06 | 2.64 | 2.85 | 2.16 | 1.40 | 2.24 | 1.52 | 1.71 | 1.55 |
| C11 | 1.42 | 2.23 | 2.94 | 1.02 | 1.08 | 1.11 | 0.64 | 1.00 | 0.33 |
| C19 | 1.37 | 1.97 | 2.53 | 1.12 | 0.57 | 1.81 | 0.61 | 1.06 | 0.60 |
| C24 | 1.63 | 2.50 | 2.95 | 1.44 | 0.82 | 1.52 | 0.86 | 1.53 | 0.56 |
| C26 | 2.14 | 2.80 | 3.28 | 1.87 | 1.76 | 2.06 | 1.52 | 2.34 | 1.77 |
| C28 | 1.03 | 1.62 | 2.50 | 0.83 | 0.56 | 0.78 | 0.60 | 0.88 | 0.30 |
| C31 | 1.47 | 2.15 | 2.73 | 1.31 | 0.77 | 1.31 | 1.04 | 1.54 | 1.41 |
| C36 | 2.74 | 3.35 | 3.50 | 2.59 | 2.30 | 3.08 | 2.04 | 2.73 | 2.04 |
| C37 | 0.67 | 1.30 | 2.39 | 0.41 | 0.16 | 0.43 | 0.39 | 0.51 | 0.19 |
| C40 | 1.21 | 1.76 | 2.80 | 0.74 | 0.52 | 0.95 | 0.82 | 1.19 | 0.67 |
Appendix B. Statistical Descriptions
In the body of the text, we used visual analysis to identify two subgroups of ME/CFS patient clusters defined by their symptom domain profiles relative to PEM severity. Here we present statistics that may help clarify the data in the plots. Given the exploratory nature of this study and the small number of clusters, these results should be interpreted as descriptive rather than confirmatory.
Appendix B.1. ANCOVA
We performed an analysis of covariance (ANCOVA) to identify the domains which could be most statistically significant and discriminatory. We compare our two groups for each symptom domain. We arrange the results by descending F-statistic and show the p-value rounded to three decimal places.
Table A2.
ANCOVA Analysis.
| Domain | F statistic | p-value | Significance |
|---|---|---|---|
| Other | 33.3 | < 0.001 | *** |
| Neuroendocrine | 11.6 | 0.007 | ** |
| Fatigue | 5.2 | 0.046 | * |
| Autonomic | 3.8 | 0.08 | . |
| Pain | 3.1 | 0.108 | NA |
| Immune | 1.4 | 0.268 | NA |
| All_mean | 1.0 | 0.33 | NA |
| Sleep | 0.2 | 0.647 | NA |
| Neurocognitive | 0.0 | 0.849 | NA |
Table A2 shows agreement with the charts that Other, Neuroendocrine and Autonomic domains show the most significant offsets between the two groups. The high F-statistic and low p-value for Fatigue, however, do not agree with the regression lines. As we note earlier in Section 2.1, the lines in Figure 1 are nearly identical but R2 is significantly weaker in the low-intensity group. The high F-statistic and low p-value in the ANCOVA analysis for fatigue is most likely an artifact of the wide spread and small sample count in the low-intensity group.
Appendix B.2. Leave-one-Out Analysis
We discovered our two groups by visual analysis, but we can re-identify the set using leave-one-out analysis. In this analysis we go through each domain and examine what happens when we remove one cluster at a time. The goal is to identify which clusters, when removed, improve R2 the most.
We summarize the mean R2 differences, in order of greatest improvement, in Table A3.
Table A3.
Leave-one-out Analysis.
| Cluster | Group | Domains Improved | Mean R2 |
|---|---|---|---|
| C2 | low | 9 | 0.0379 |
| C11 | low | 9 | 0.0271 |
| C4 | low | 8 | 0.0191 |
| C31 | high | 7 | 0.0163 |
| C7 | low | 5 | 0.0129 |
| C24 | low | 8 | 0.0126 |
Of the top 6 clusters only C31 is not part of the low-intensity group. While this does not prove the existence of two subgroups it does support the idea that the members of the low-intensity group are, overall, responsible for most of the R2 degradation in the combined group.
C31 does exhibit variability but it varies around the high-intensity group trend lines, which is why we include it with the high group despite this result.
Appendix B.3. R2 by Group
We compare the coefficient of determination (R2) of the symptom domains in three levels:
- Combined (all clusters)
- High-intensity group
- Low-intensity group
Table A4 shows that for almost every symptom domain, the high-intensity group has a higher R2 than the combined group, which in turn has a higher R2 than the low-intensity group. In some cases – such as neurocognitive, neuroendocrine, and Other – the combined R2 is significantly weaker than either of the subgroups.
Table A4.
R2 by Domain.
| Domain | Combined R2 | High-intensity R2 | Low-intensity R2 |
|---|---|---|---|
| All_mean | 0.91 | 1.00 | 0.84 |
| Autonomic | 0.79 | 0.96 | 0.62 |
| Fatigue | 0.84 | 0.86 | 0.54 |
| Immune | 0.78 | 0.96 | 0.11 |
| Neurocognitive | 0.85 | 0.92 | 0.93 |
| Neuroendocrine | 0.73 | 0.96 | 0.75 |
| Other | 0.52 | 0.92 | 0.96 |
| Pain | 0.81 | 0.95 | 0.95 |
| Sleep | 0.53 | 0.81 | 0.05 |
References
- Vaes, A. W. et al. Symptom-based clusters in people with ME/CFS: An illustration of clinical variety in a cross-sectional cohort. Journal of Translational Medicine. [CrossRef]
- Vaes, A. W. & collaborators. Supplementary dataset (excel): Additional file 3: Table S1 : 12967_2023_3946_MOESM3_ESM.xlsx. Journal of Translational Medicine, Springer Nature (2023). https://static-content.springer.com/esm/art%3A10.1186%2Fs12967-023-03946-6/MediaObjects/12967_2023_3946_MOESM3_ESM.
- Fall, E. A. et al. Chronic overlapping pain conditions in people with myalgic encephalomyelitis/chronic fatigue syndrome (ME/CFS): A sample from the multi-site clinical assessment of ME/CFS (MCAM) study. BMC Neurology. [CrossRef]
- Ramírez-Morales, R. , Bermúdez-Benítez, E., Martínez-Martínez, L.-A. & Martıínez-Lavín, M. Clinical overlap between fibromyalgia and myalgic encephalomyelitis: A systematic review and meta-analysis. Autoimmunity Reviews, 2022. [Google Scholar] [CrossRef]
- McManimen, S. L. & Jason, L. A. Post-exertional malaise in patients with ME and CFS with comorbid fibromyalgia. SRL Neurology & Neurosurgery, /: (2017). https, 2017. [Google Scholar]
- Vaes, A. W. & collaborators. Supplementary dataset (excel): Additional file 4 table S2 : 12967_2023_3946_MOESM4_ESM.xlsx. Journal of Translational Medicine, Springer Nature (2023). https://static-content.springer.com/esm/art%3A10.1186%2Fs12967-023-03946-6/MediaObjects/12967_2023_3946_MOESM4_ESM.
Figure 1.
Fatigue vs. PEM.
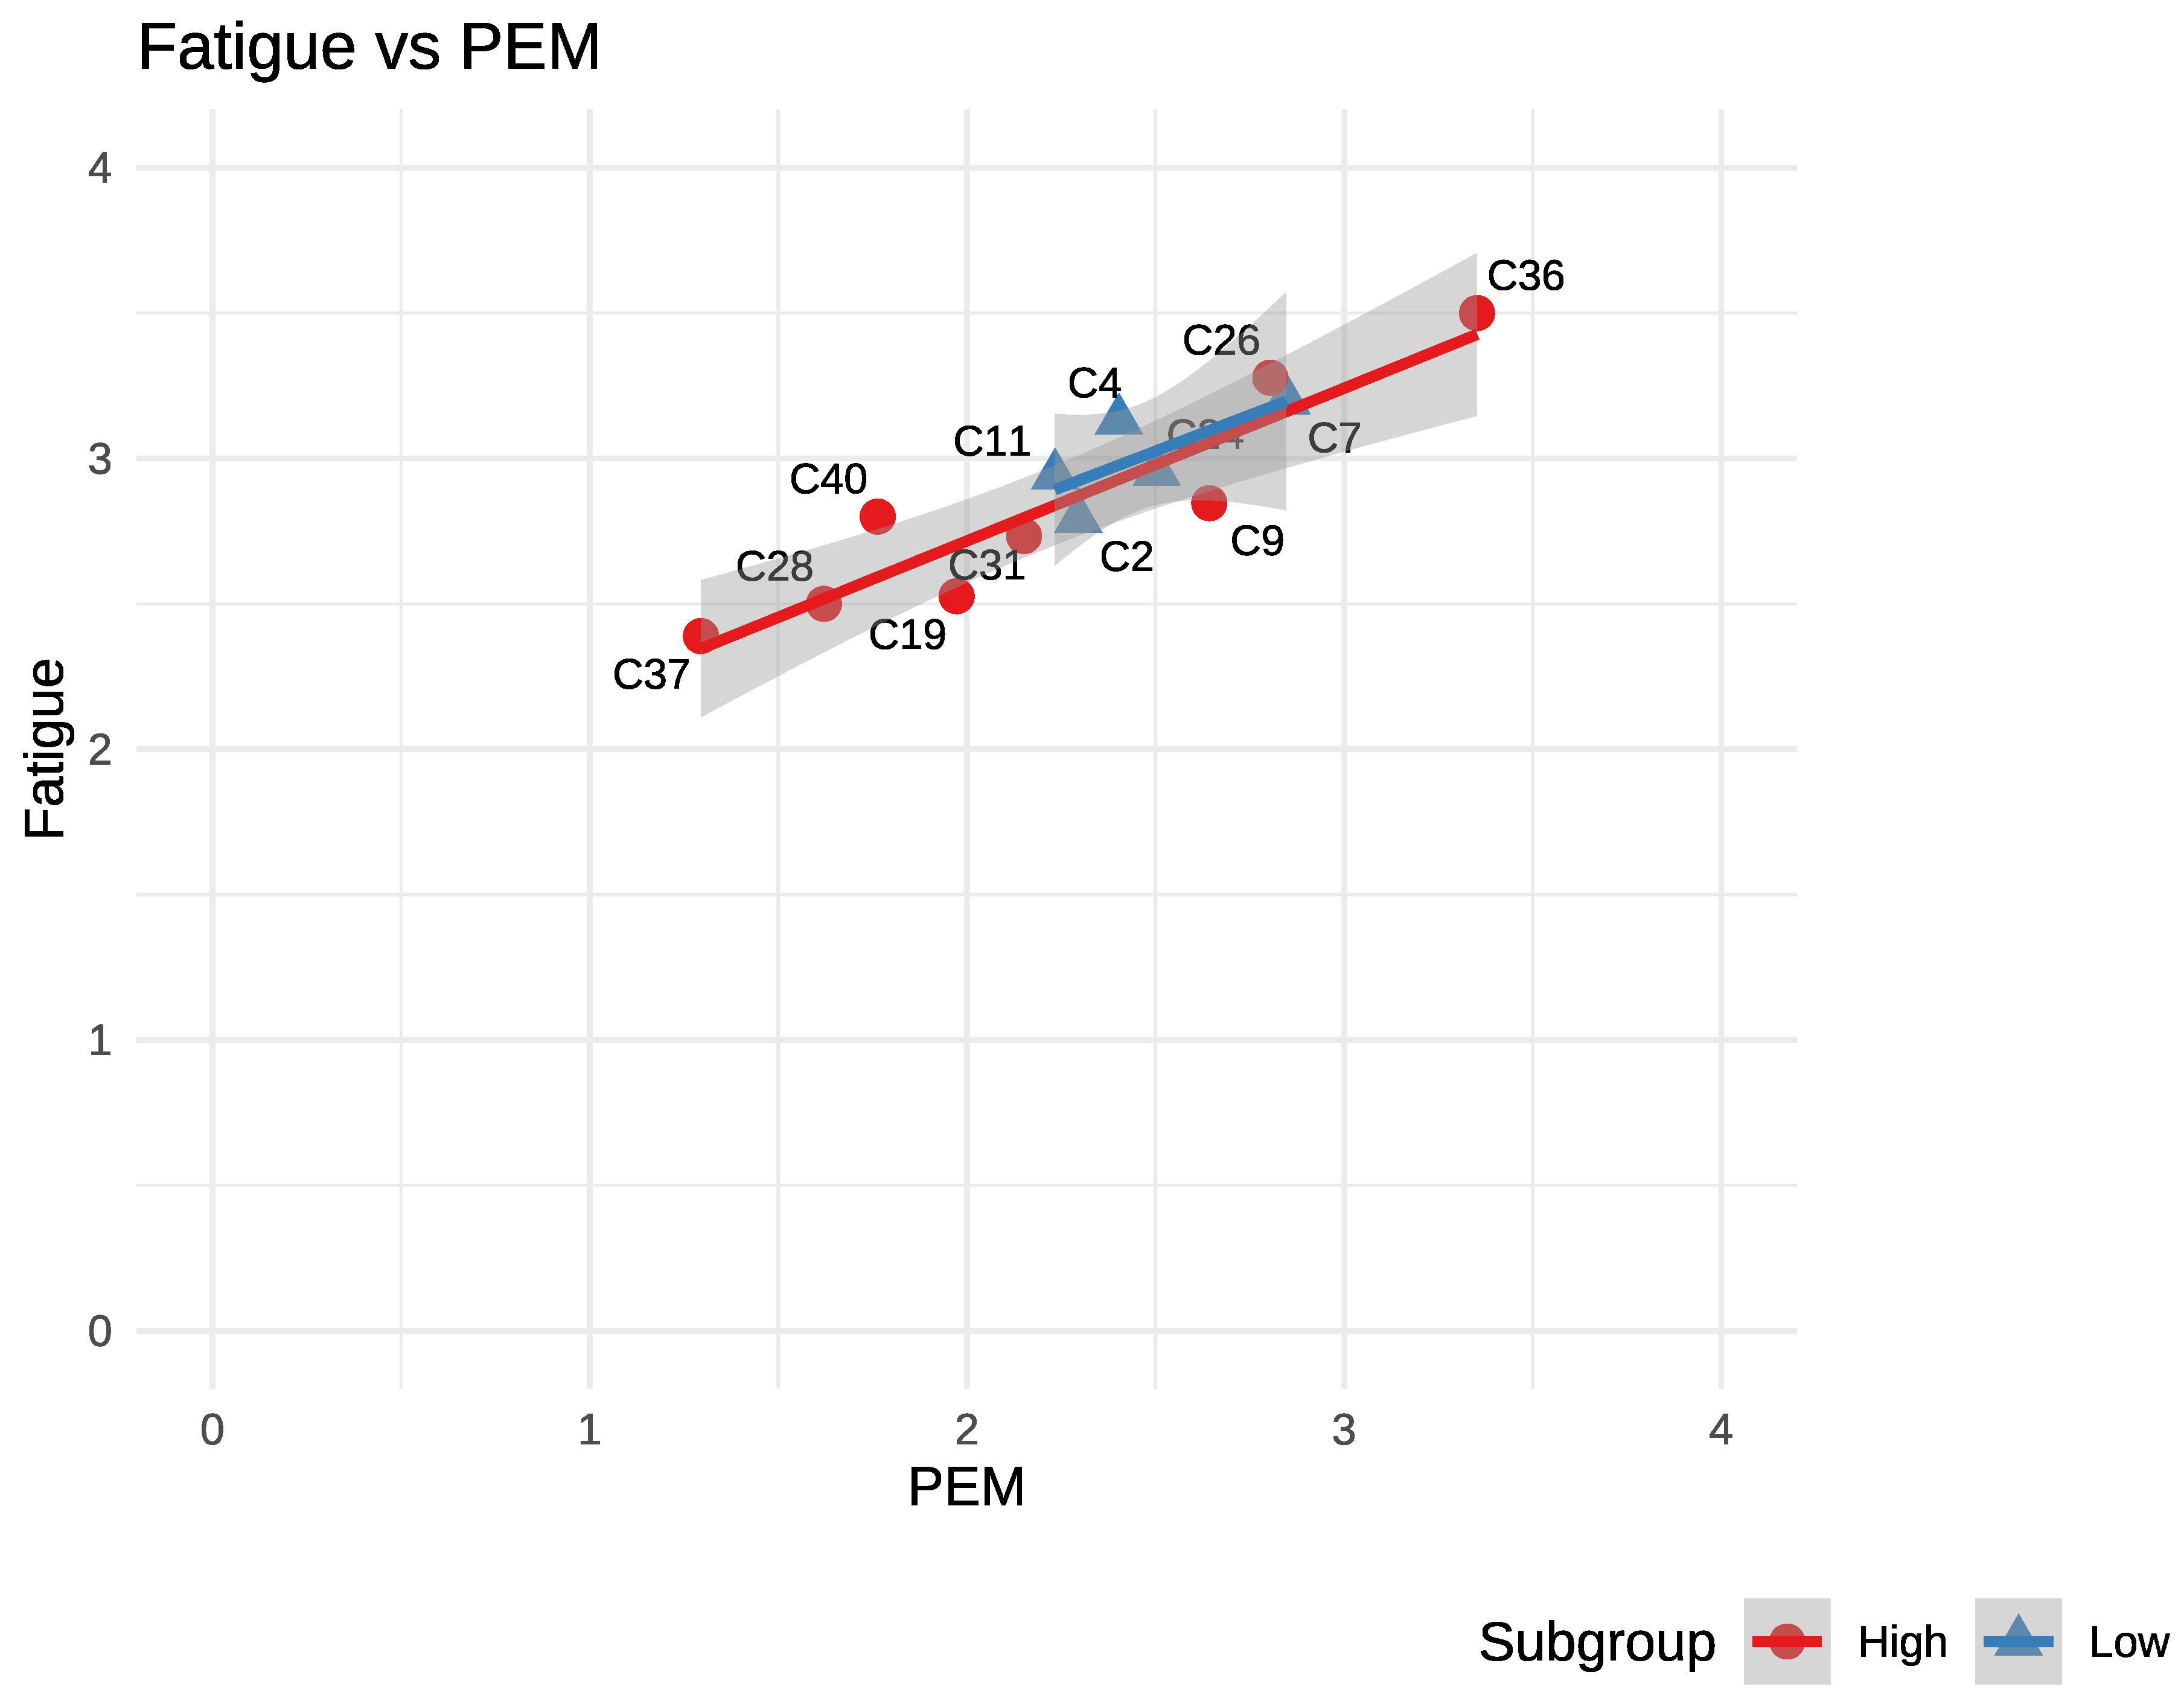
Figure 2.
Similar Symptom Domains vs. PEM.
Disclaimer/Publisher’s Note: The statements, opinions and data contained in all publications are solely those of the individual author(s) and contributor(s) and not of MDPI and/or the editor(s). MDPI and/or the editor(s) disclaim responsibility for any injury to people or property resulting from any ideas, methods, instructions or products referred to in the content. |
© 2025 by the authors. Licensee MDPI, Basel, Switzerland. This article is an open access article distributed under the terms and conditions of the Creative Commons Attribution (CC BY) license (http://creativecommons.org/licenses/by/4.0/).
Copyright: This open access article is published under a Creative Commons CC BY 4.0 license, which permit the free download, distribution, and reuse, provided that the author and preprint are cited in any reuse.


