

Submitted:
15 September 2025
Posted:
16 September 2025
Read the latest preprint version here
Abstract
Background: Vaes et al. (2023)[@vaes2023] identified 13 symptom clusters in a large cohort of ME/CFS patients. Symptom intensity is broadly correlated with post-exertional malaise (PEM) severity, with variation across clusters that seems heterogeneous. Despite this research, no broadly accepted organizing principle has emerged from this paper or other attempts at phenotyping ME/CFS. We identified two groups of patient clusters with distinct symptom-domain profiles. Separating the 13 clusters into these subgroups reduced heterogeneity within each. The first group showed a consistent amplification pattern across all symptom domains as PEM increased, whereas the second group exhibited selective amplification: pain and neurocognitive symptoms escalated more rapidly with PEM, while immune and sleep symptoms remained relatively flat. This subgroup's profile resembles that of fibromyalgia.
Keywords:
Myalgic Encephalomyelitis
; ME/CFS
; patient clustering
; fibromyalgia
; post-exertional malaise
; PEM
1. Introduction
Dr. Anouk W. Vaes and her collaborators at CIRO performed one of the largest systematic surveys of ME/CFS symptom patterns, applying clustering methods to patient-reported outcomes to identify recurring constellations of symptoms [1]. They used symptom surveys based on the DePaul Symptom Questionnaire version 2 (DSQ-2) from 337 patients to identify a total of 45 patient clusters of which 13 were of size ≥ 10. We used the publicly available data of their final 13 clusters for analysis.[2]
While Vaes described each cluster, and noted some differences among symptom severity, an overall organizing principle was not proposed. Other methods have been used to group ME/CFS phenotypes, including by severity alone, or a combination of severity and symptoms but no consensus has emerged on how to best group patients.
Our analysis suggests that the Vaes ME/CFS clusters can be organized into two overarching families defined by their relationship to PEM. This reduces the complexity of the cluster symptom intensities and highlights a fibromyalgia-like subgroup within the Vaes clusters that has not been explicitly recognized in prior work.
According to Vaes[1]:
Almost 90% of the participants fulfilled the Fukuda case definition, compared to 80%, 59% and 39% fulfilling the IOM, CCC and ME-ICC case definitions, respectively. More than a quarter of the participants met the criteria for all four different case definitions, whilst 5% of the participants met none of the abovementioned [sp.] case definitions,…
This means the patients in the Vaes study were diagnosed with broad and different criteria which, when taken together with our analysis, provides one of the first opportunities to quantitatively separate classic ME/CFS and fibromyalgia-like patients from a single, uniformly collected cohort.
2. Visual Analysis of Symptom Domains vs. PEM
The strong weight of PEM symptoms makes the Vaes dataset tricky to interpret if you only look at raw intensity, so instead we compared overall symptom levels to PEM severity. From this comparison we identified two groups of clusters that maintain their integrity across most symptom domains.
We will start by showing how the groups are most similar, then how they differ. We add an “all” category to gauge overall symptom severity to the original symptom domains. Our use of the terms “high” and “low intensity” does not reproduce the clusters described by Vaes or others but reflects a new organization based on how symptom domains scale with PEM. Vaes used the DePaul symptom groupings which we keep as-is.
Notes: The DSQ-2 uses a single symptom for fatigue. Also, for the “Overall” chart we used the arithmetic mean instead of geometric mean for the Y axis. All other graphs in this study use geometric means exclusively. Shaded bands represent the 95% confidence interval of the linear models when used.
2.1. Similarities
In terms of fatigue, the two groups overlap completely, as ME/CFS patient clusters are expected to. See Figure 1, below. While the lines have a similar slope and offset we note the R2 value is significantly weaker in the low intensity group (0.54 vs. 0.86).
While fatigue shows complete overlap in our groups the next charts (Figure 2) show how they stand out. In the first chart (top left) we compare the average of all symptoms to PEM. In this chart one can easily discern two tiers of clusters. One has a higher overall symptom burden at any given PEM level compared to the other and this relationship is where we derive the names for our groups: high and low intensity.
Autonomic, Neuroendocrine and Other also follow a similar pattern: Parallel but lower than the high intensity group.
We note that the limited range of PEM severity in the low intensity group (~2.2 to 2.9) may have otherwise caused it to remain undetected.
Groupings: From visual inspection of the charts above we group clusters C9, C19, C26, C28, C31, C36, C37, C40 as high intensity, C2, C4, C7, C11, C24 as low intensity. We’ll keep these groupings for all plots that follow. The high and low groups are approximately 54.5% and 45.5% of the total cohort, respectively.
The last chart (Other vs. PEM) shows a markedly lower offset and is perhaps the most visibly obvious difference between the two groups. The two symptoms in `other’ are sensitivity to mold and vibration.
While the groups maintain integrity, the parallelism observed in the charts above does not hold in the next charts and suggests a more complex physiological cause for the differences.
2.2. Increasing Amplification vs. PEM
Pain and neurocognitive domains show that while the low intensity group remains offset, symptom domain amplification is increased. As PEM increases to 3, C7 comes very close to the high intensity line.
Figure 3.
Pain and Neurocognitive vs. PEM.
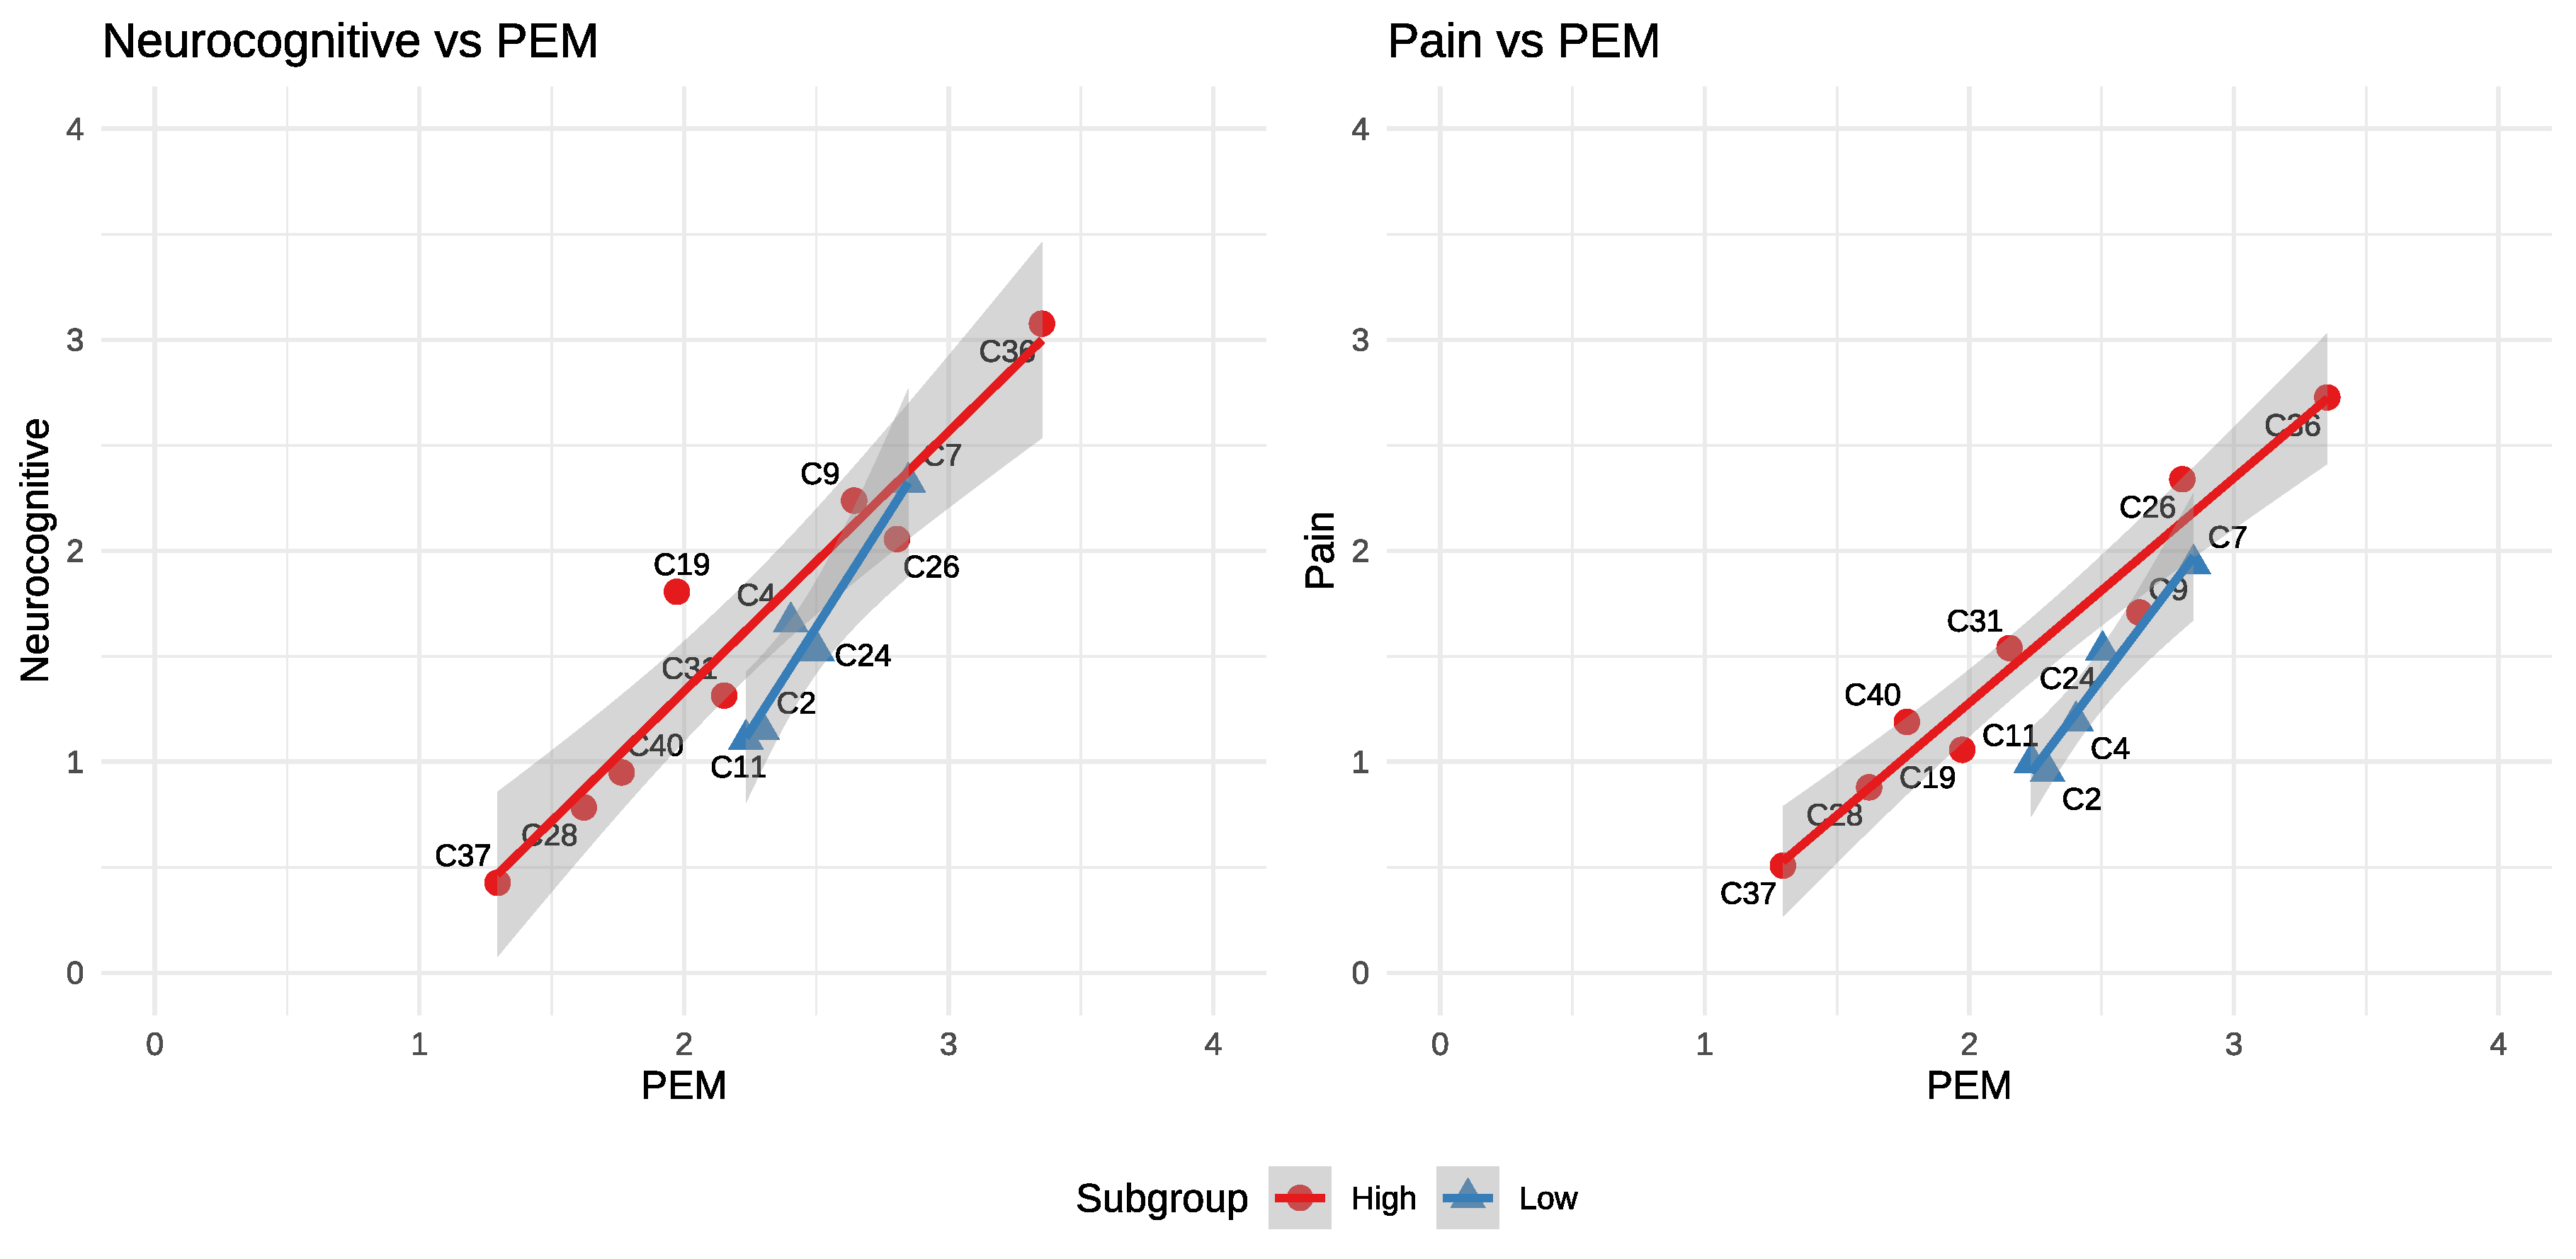
The two charts above, while not severe enough to claim this is fibromyalgia with PEM, begin to suggest it.
2.3. Different Correlations to PEM
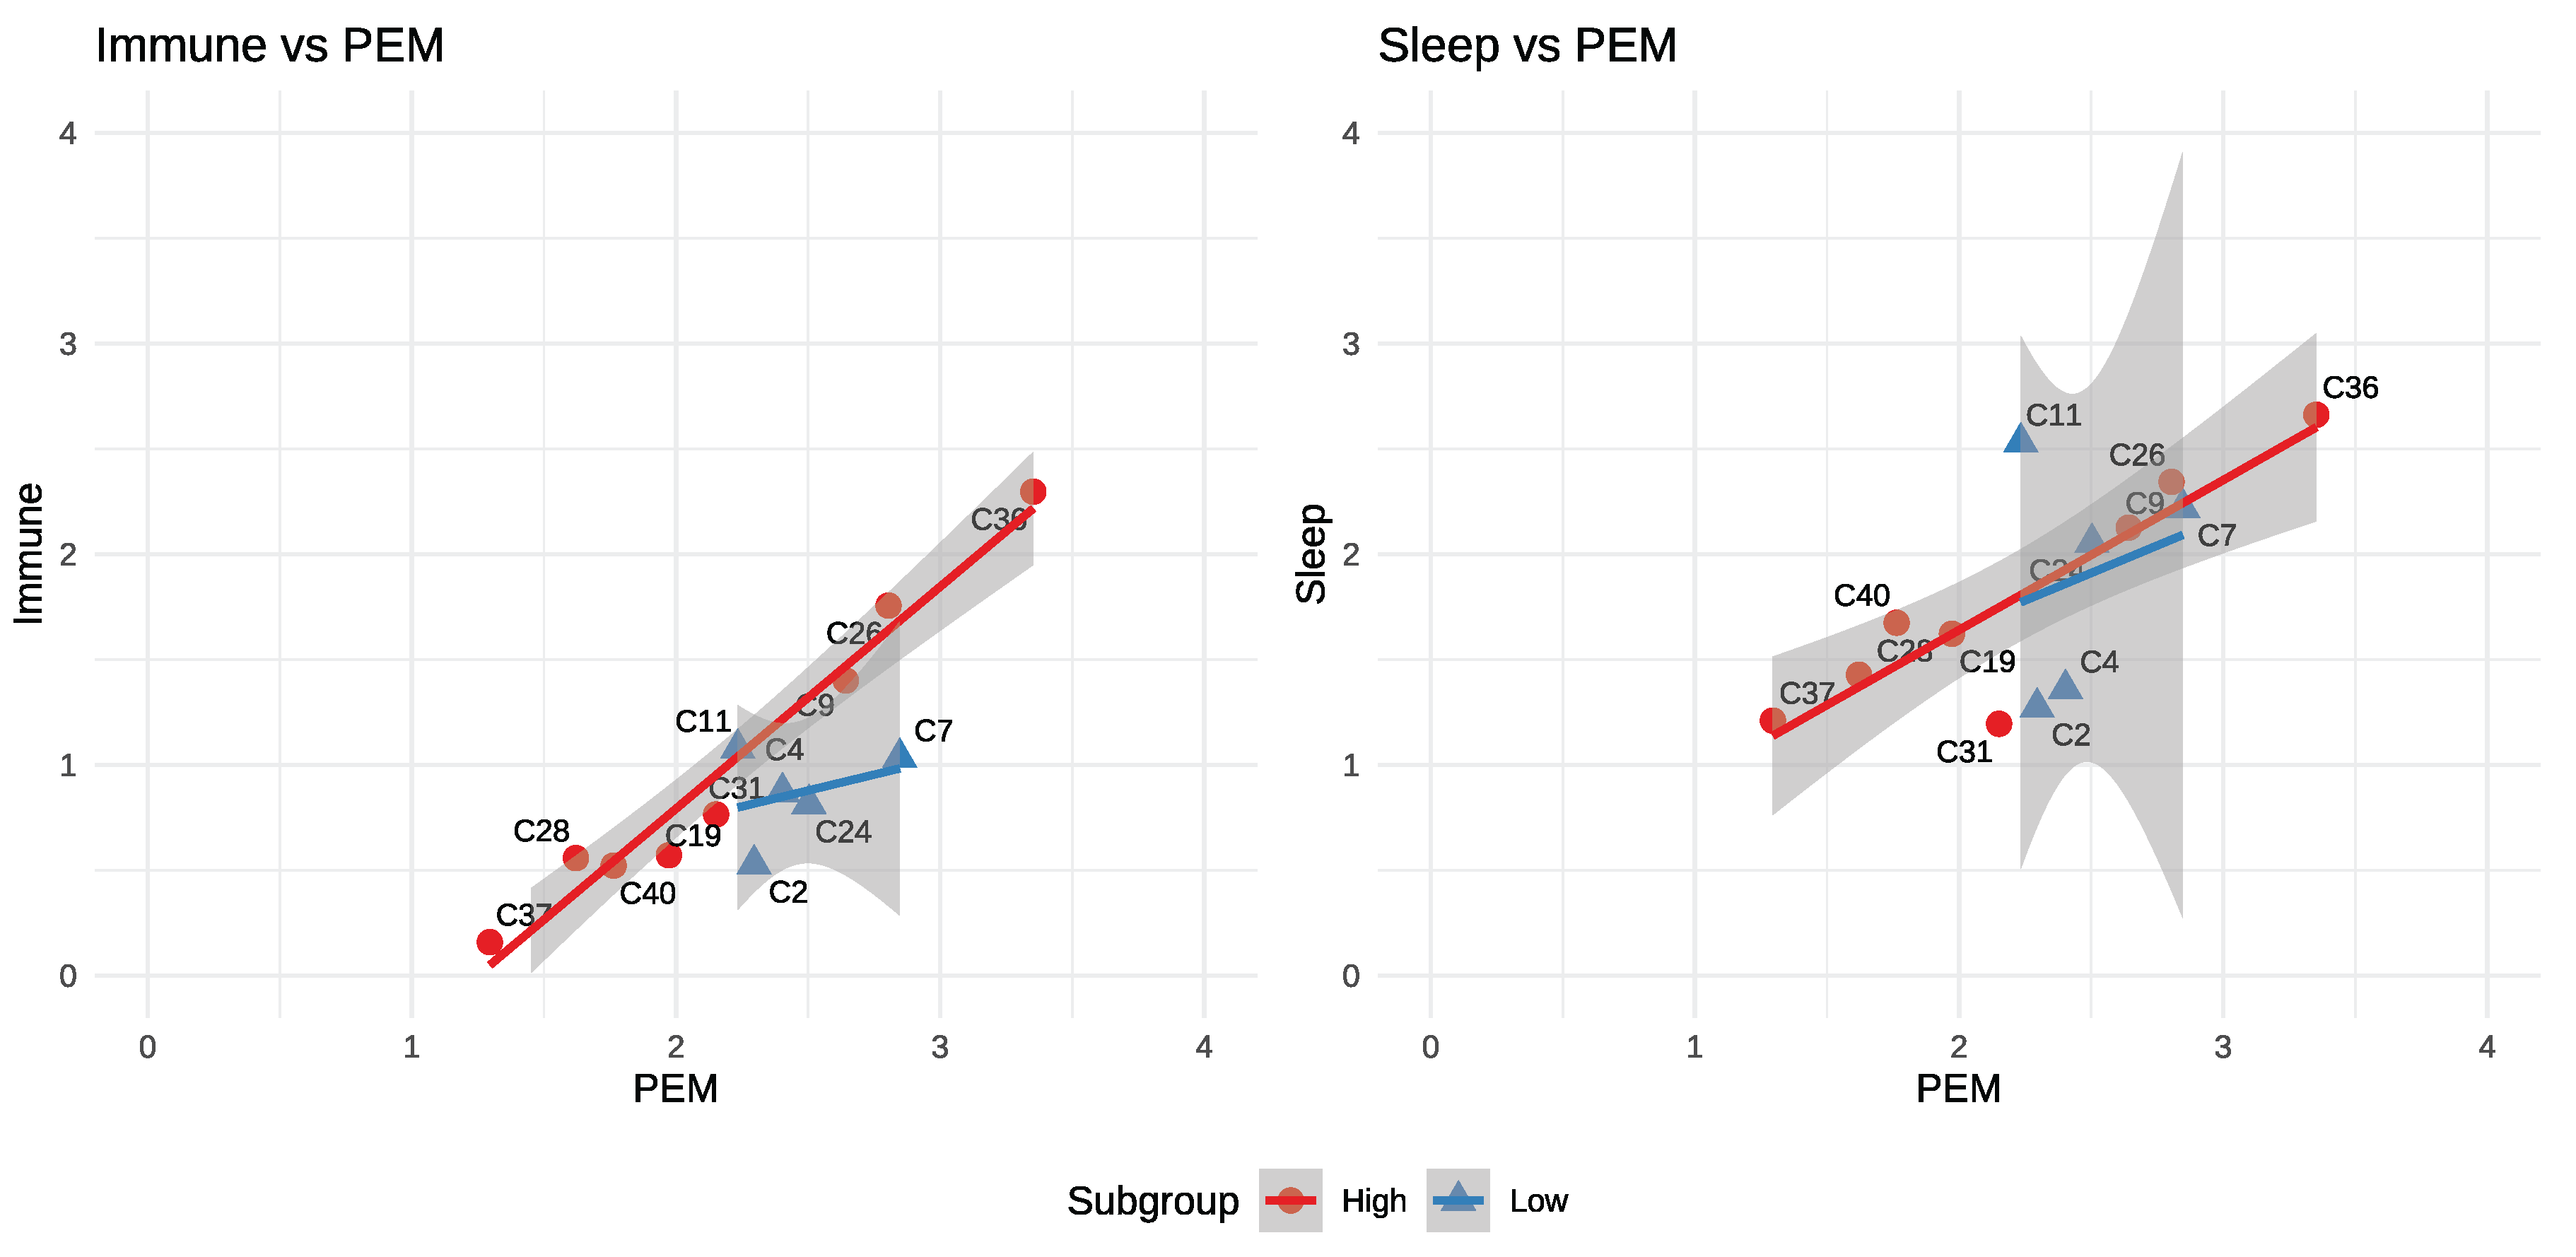
In all of the previous charts we’ve shown that both groups maintain a strong but distinct relationship to PEM. By contrast, the immune and sleep domains show little to no correlation with PEM severity in the low intensity group. Notably, despite this lack of correlation, sleep disturbance can be pronounced in the low intensity group.
Figure 4.
Immune and Sleep vs. PEM.
2.4. Summary of Differences
High Intensity: Has a consistent amplification pattern: as PEM increases, all other symptom domains rise together.
Low Intensity: Presents a more selective profile. Pain, neurocognitive, and neuroendocrine symptoms escalate more rapidly with PEM, while sleep and immune symptoms show little or no correlation. The elevated neurocognitive and pain symptoms, together with variable sleep symptom intensity makes the low-intensity group more suggestive of fibromyalgia than the high-intensity group. Additionally, the low intensity group is notably nestled in the middle of the overall PEM range which could allow it to hide among the other clusters if not actively searched for.
We summarize these differences in the table below.

Table 1.
Summary of Group Differences.
| Feature | High group | Low group |
| Overall vs. PEM | Higher | Lower - esp. “other” |
| Fatigue | R2 - 0.86 | Weaker R2 - 0.54 |
| PEM range | ~1.3 – 3.4 | Narrower ~2.2 – 2.9 |
| Neurocognitive | Tracks PEM | Elevated amplification |
| Pain | Tracks PEM | Elevated amplification |
| Immune | Tracks PEM | Flat at ~1 |
| Sleep | Tracks PEM | ~1.4 – 2.5, but uncorrelated |
Symptom Severity: In terms of overall symptom range the two groups largely overlap. The high intensity group, by symptom intensity alone, could be considered a superset of the low intensity group. It is the differing relationships to PEM and the selective amplification of certain symptom domains in the low intensity group that set the two groups apart.
3. Regression Analysis
In the preceding section we used visual analysis to identify two subgroups of ME/CFS patient clusters defined by their symptom domain profiles relative to PEM severity. Here we focus on quantifying the value of these groups.
3.1. R2 by Group
We compare the regression coefficient (R2) of the symptom domains in three levels:
- Combined (all clusters)
- High intensity group
- Low intensity group
We will show that R2 is consistently strengthened by removing the low intensity group, and we’ll also show that the high intensity group maintains a stronger correlation to PEM across most symptom domains.
Table 2 shows that for almost every symptom domain, the high intensity group has a higher R2 than the combined group, which in turn has a higher R2 than the low intensity group. This is consistent with our visual analysis and supports the existence of two distinct subgroups within the Vaes clusters.
In some cases, like neurocognitive, neuroendocrine, and Other the combined R2 is significantly weaker than either of the subgroups.
3.2. Leave-One-Out Analysis
We discovered our two groups by visual analysis, but we can rediscover the set using leave-one-out analysis. In this analysis we go through each domain and examine what happens when we remove one cluster at a time. The goal is to identify whether removing a cluster improves R2 or makes it worse.
We summarize the mean R2 differences, in order of greatest improvement, in Table 3. We see that removing any of the low intensity clusters improves R2.
Of the top 6 clusters only C31 is not part of the low intensity group.
The R2 by Group and Leave-one-out Analysis strongly support the existence of two distinct subgroups within the Vaes clusters.
4. Discussion
We have shown that the Vaes clusters can be organized into two subgroups defined by symptom domains relative to PEM, and that these subgroups remain consistent across most symptom domains.
ME/CFS is widely recognized as a heterogeneous condition with complex symptom presentations. Grouping the Vaes clusters by their relationship to PEM simplifies this complexity at the domain and cluster levels, but it only partially reduces heterogeneity at the individual-symptom level and may not translate directly to grouping individual patients. Vaes[1] provided cluster-specific summaries of standout symptoms; some of those align with our domain-based charts while others show a different emphasis, underscoring the challenge of reconciling symptom-level observations with domain-level analyses.
The wide net cast by Vaes in terms of diagnostic criteria may have helped to reveal these two subgroups. The high intensity group aligns more closely with classic ME/CFS presentations, while the low intensity group, with its fibromyalgia-like profile, suggests a different or overlapping pathophysiology. This is consistent with prior observations that fibromyalgia and ME/CFS often co-occur and may share underlying mechanisms.
Although these patterns may guide future phenotyping, several cautions are warranted. This is a secondary analysis of patient clusters defined by symptom domains with small subgroup sizes (8 and 5 clusters). The original clustering methods of Vaes et al. may have obscured or exaggerated some relationships we show here. Moreover, visual inspection of the plots may suggest directional trends where none truly exist.
Despite these limitations, we believe at least two further steps should be taken. Using the original patient scores could validate, refine, or repudiate these subgroups and possibly produce a short list of differentiating symptoms. If this proves useful then examining biological markers across these subgroups could help to reveal underlying pathophysiological differences.
5. Conclusions
Our secondary analysis shows that the many heterogeneous Vaes clusters can be organized into two broader structures defined by overall symptom intensity relative to PEM severity. These two groups remain coherent across symptom domains and display distinct, largely linear relationships with PEM. Although exploratory and limited to cluster-level data, these findings offer a reproducible framework that may help clarify apparent heterogeneity in ME/CFS.
Code Availability
All data manipulation and analysis scripts are available at https://github.com/eriksquires/VaesSubgroups
Author Contributions
Erik K. Squires conceived the study, performed the analysis, and wrote the manuscript. This work presents an original investigative method and resulting framework which were both developed and first reported by the author in this preprint.
Funding
This work received no external funding.
Institutional Review Board Statement
This study reanalyzed publicly available reports and published symptom cluster data (Vaes 2023). No new patient data were collected.
Acknowledgments
This paper could not exist without the foundational work of Dr. Anouk W. Vaes and her colleagues at CIRO, whose clustering study[1] and publicly available cluster summary data[2] provided the basis for our analysis. We are deeply grateful for their contribution to the field. Dr. Vaes had no role in the writing of this paper, and all errors or misinterpretations are the responsibility of the author.
Conflicts of Interest
The author declares no competing interests.
Appendix A
Appendix A.1. Cluster Summary Data
We use the Vaes cluster spreadsheet[2] exclusively as our data source. We use R for significant cleaning and transformation from Excel to CSV. After removing everything but the mean severity of the symptoms in the 13 clusters we:
- Group each cluster by symptom domain and calculate geometric means for each symptom domain within each cluster.
- Rotate the table
- Add a new column, “all_mean” which is the arithmetic mean of all symptoms within each cluster.
- Save this file as cluster_grouped_tidy.csv
This file is what we then used for our analysis, and the plots. We present the final data used below. Values were rounded and abbreviations used for formatting. See the Code Availability section for links to the code used to generate this file.
| cluster | all_mean | PEM | fatigue | Auto | Immune | NC | NE | pain | other |
| C2 | 1.21 | 2.30 | 2.79 | 0.76 | 0.53 | 1.15 | 0.67 | 0.95 | 0.27 |
| C4 | 1.55 | 2.40 | 3.13 | 1.24 | 0.87 | 1.66 | 0.96 | 1.19 | 0.46 |
| C7 | 1.92 | 2.85 | 3.20 | 1.48 | 1.03 | 2.32 | 1.05 | 1.94 | 0.86 |
| C9 | 2.06 | 2.64 | 2.85 | 2.16 | 1.40 | 2.24 | 1.52 | 1.71 | 1.55 |
| C11 | 1.42 | 2.23 | 2.94 | 1.02 | 1.08 | 1.11 | 0.64 | 1.00 | 0.33 |
| C19 | 1.37 | 1.97 | 2.53 | 1.12 | 0.57 | 1.81 | 0.61 | 1.06 | 0.60 |
| C24 | 1.63 | 2.50 | 2.95 | 1.44 | 0.82 | 1.52 | 0.86 | 1.53 | 0.56 |
| C26 | 2.14 | 2.80 | 3.28 | 1.87 | 1.76 | 2.06 | 1.52 | 2.34 | 1.77 |
| C28 | 1.03 | 1.62 | 2.50 | 0.83 | 0.56 | 0.78 | 0.60 | 0.88 | 0.30 |
| C31 | 1.47 | 2.15 | 2.73 | 1.31 | 0.77 | 1.31 | 1.04 | 1.54 | 1.41 |
| C36 | 2.74 | 3.35 | 3.50 | 2.59 | 2.30 | 3.08 | 2.04 | 2.73 | 2.04 |
| C37 | 0.67 | 1.30 | 2.39 | 0.41 | 0.16 | 0.43 | 0.39 | 0.51 | 0.19 |
| C40 | 1.21 | 1.76 | 2.80 | 0.74 | 0.52 | 0.95 | 0.82 | 1.19 | 0.67 |
References
- Vaes, A. W. et al. Symptom-based clusters in people with ME/CFS: An illustration of clinical variety in a cross-sectional cohort. Journal of Translational Medicine 21, 112 (2023).
- Vaes, A. W. & collaborators. Supplementary dataset (excel): Additional file 3: Table S1 : 12967_2023_3946_MOESM3_ESM.xlsx. Journal of Translational Medicine, Springer Nature (2023).
Figure 1.
Fatigue vs. PEM.
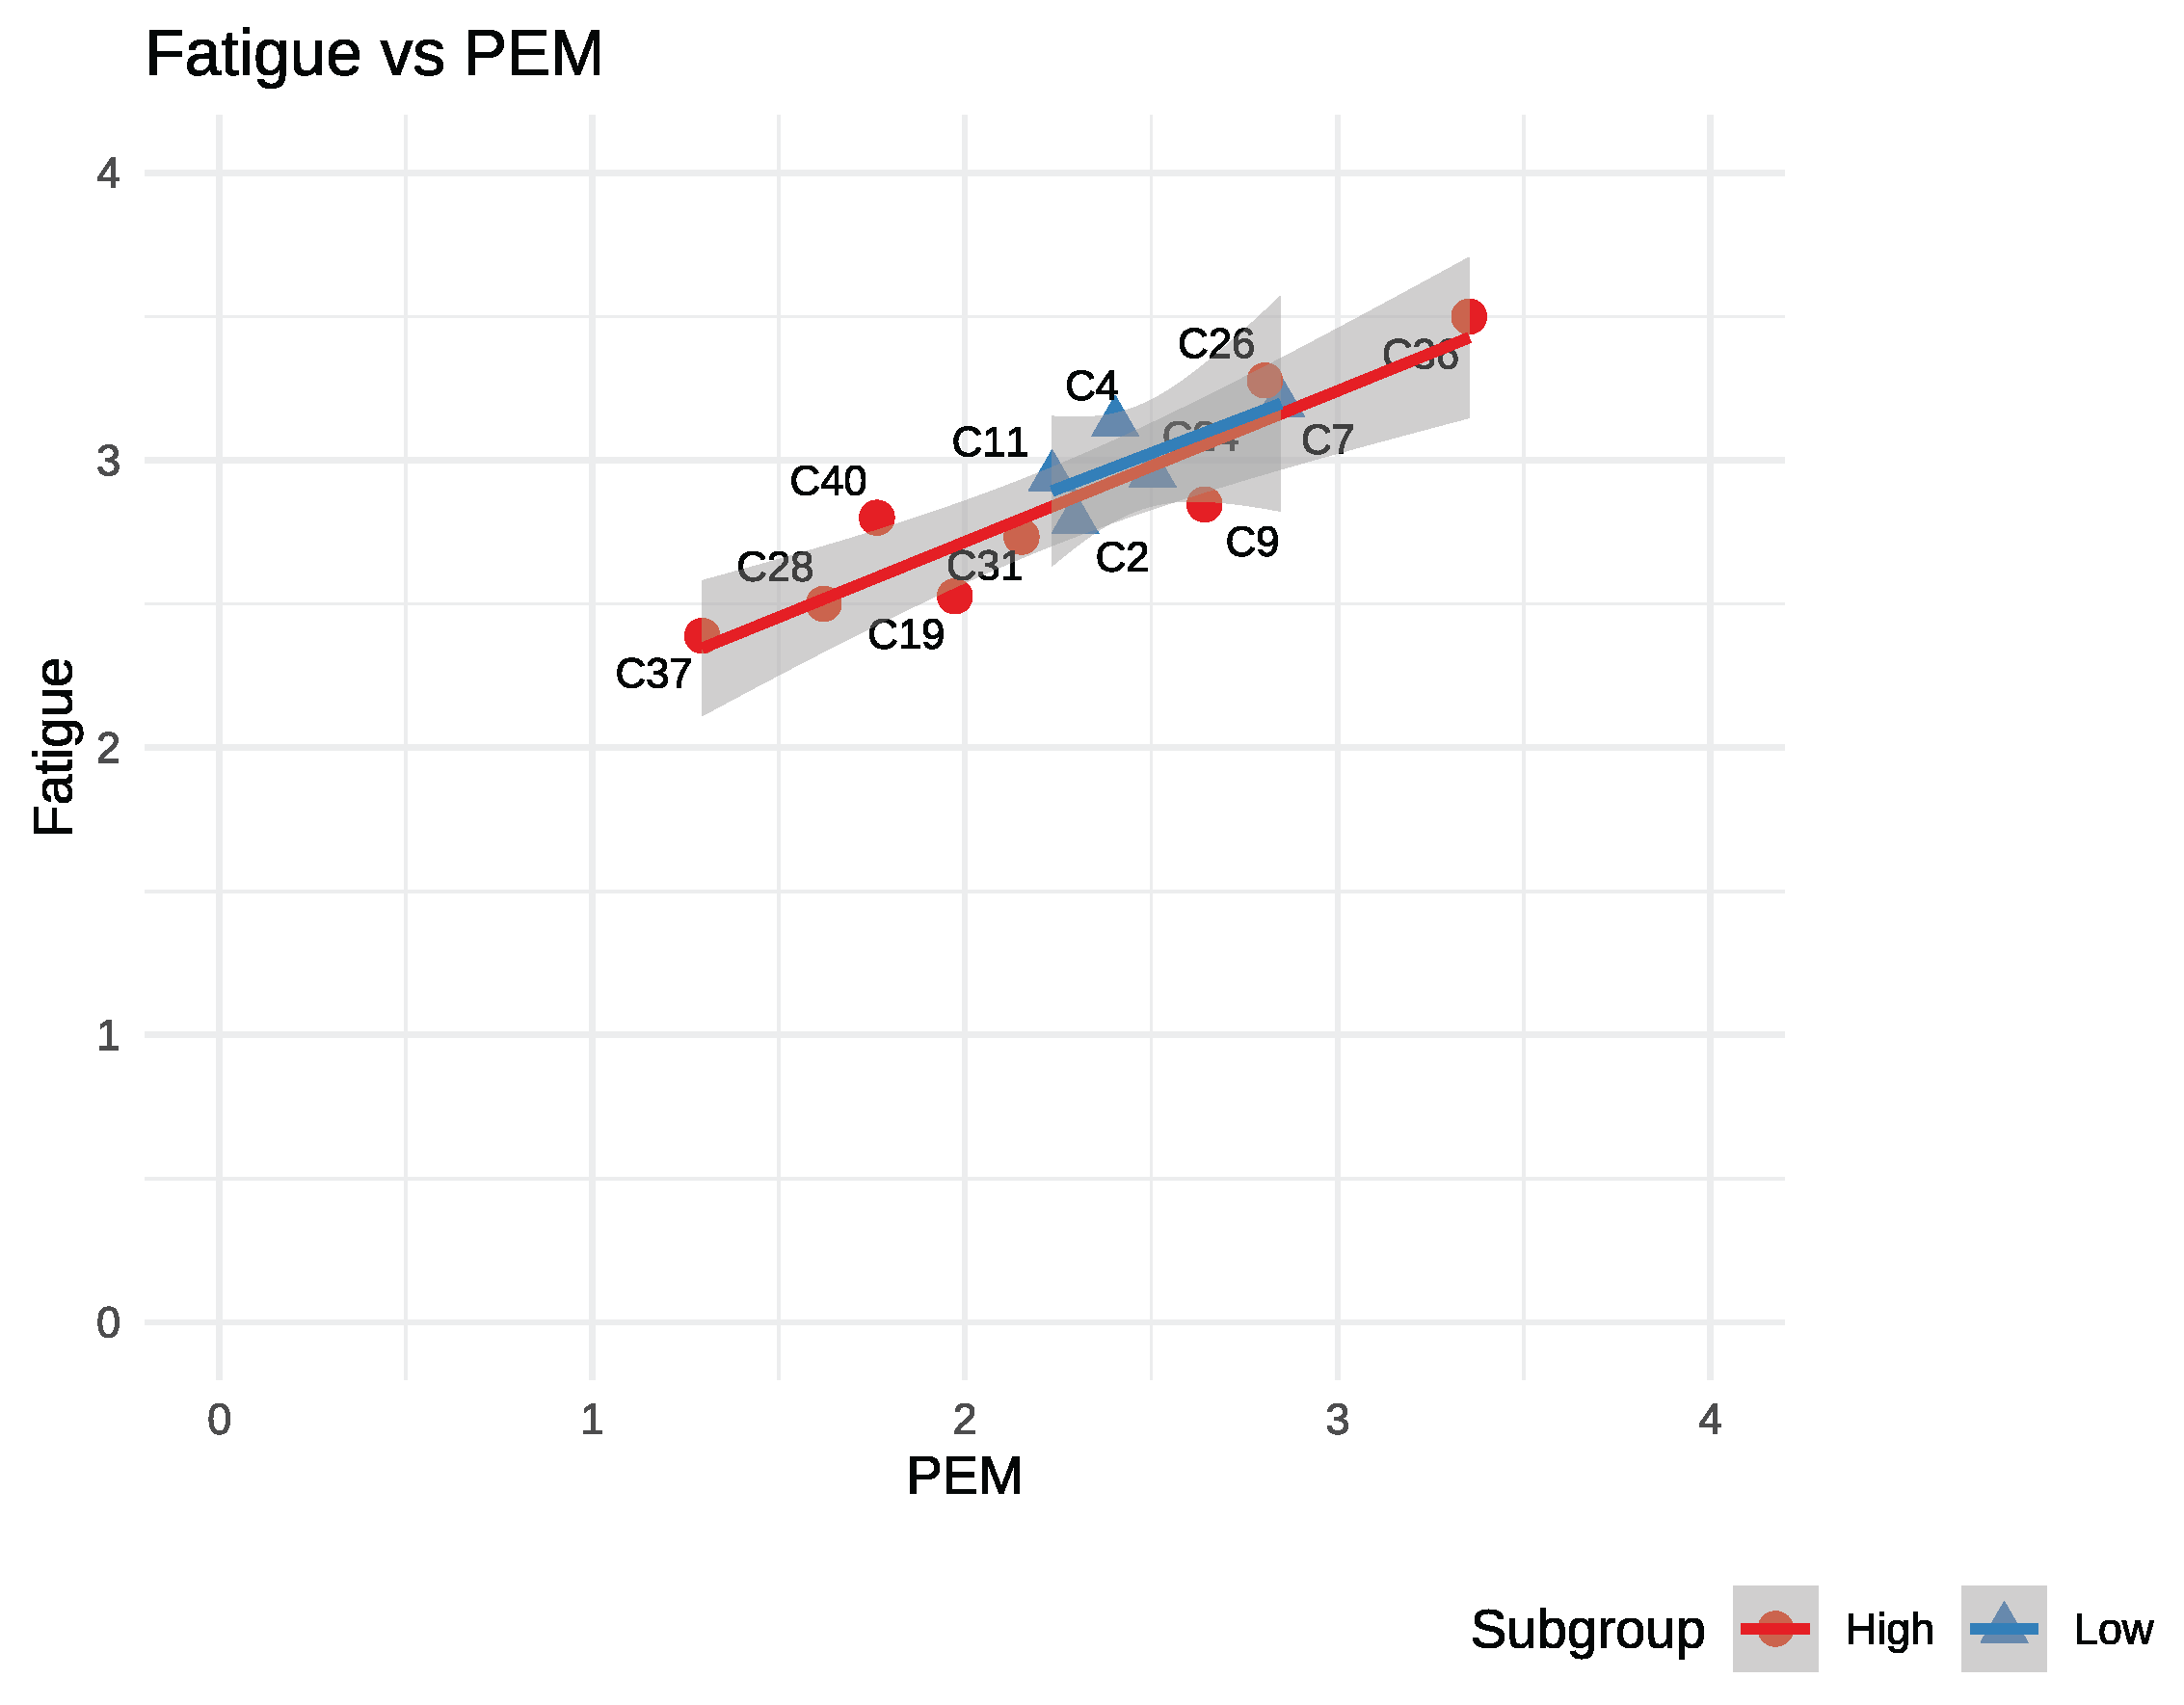
Figure 2.
Similar Symptom Domains vs. PEM.
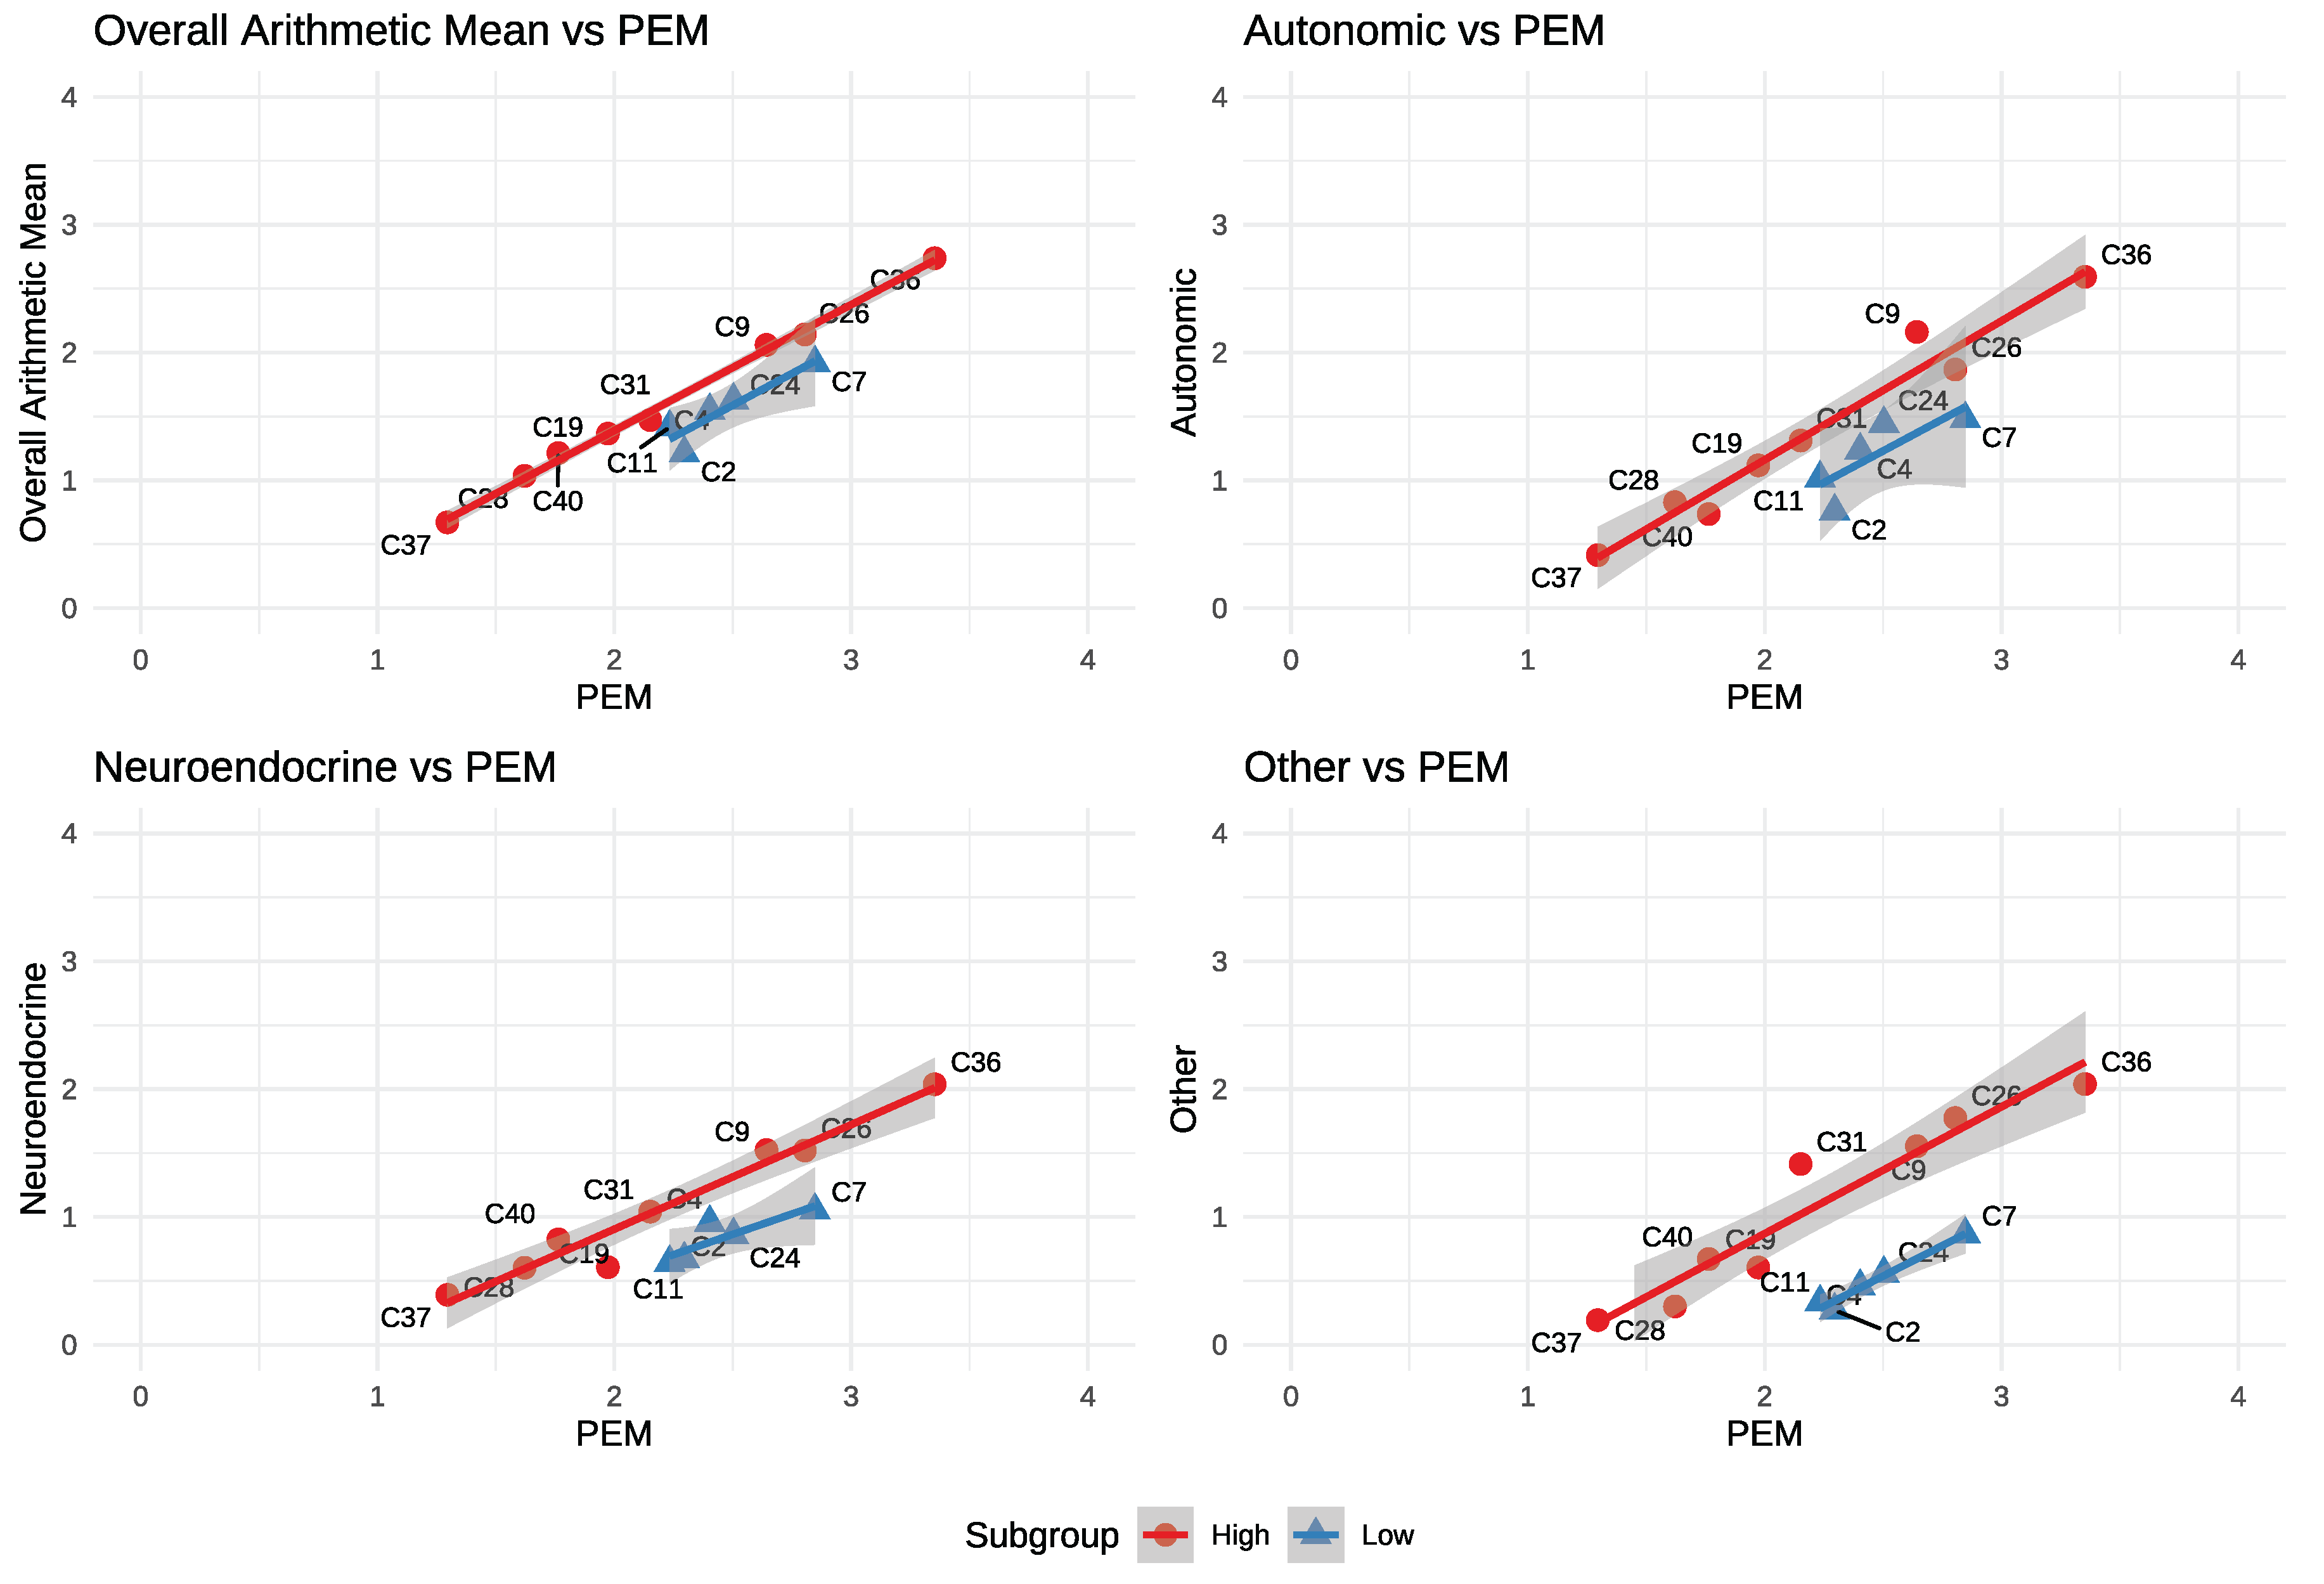
Table 2.
R2 by Domain.
| Domain | R2_combined | R2_high | R2_low |
| All_mean | 0.91 | 1.00 | 0.84 |
| Autonomic | 0.79 | 0.96 | 0.62 |
| Fatigue | 0.84 | 0.86 | 0.54 |
| Immune | 0.78 | 0.96 | 0.11 |
| Neurocognitive | 0.85 | 0.92 | 0.93 |
| Neuroendocrine | 0.73 | 0.96 | 0.75 |
| Other | 0.52 | 0.92 | 0.96 |
| Pain | 0.81 | 0.95 | 0.95 |
| Sleep | 0.53 | 0.81 | 0.05 |
Table 3.
Leave-one-out Analysis.
| Cluster | Group | Domains Improved | Mean R2 |
| C2 | low | 9 | 0.0379 |
| C11 | low | 9 | 0.0271 |
| C4 | low | 8 | 0.0191 |
| C31 | high | 7 | 0.0163 |
| C7 | low | 5 | 0.0129 |
| C24 | low | 8 | 0.0126 |
Disclaimer/Publisher’s Note: The statements, opinions and data contained in all publications are solely those of the individual author(s) and contributor(s) and not of MDPI and/or the editor(s). MDPI and/or the editor(s) disclaim responsibility for any injury to people or property resulting from any ideas, methods, instructions or products referred to in the content. |
© 2025 by the authors. Licensee MDPI, Basel, Switzerland. This article is an open access article distributed under the terms and conditions of the Creative Commons Attribution (CC BY) license (http://creativecommons.org/licenses/by/4.0/).
Copyright: This open access article is published under a Creative Commons CC BY 4.0 license, which permit the free download, distribution, and reuse, provided that the author and preprint are cited in any reuse.


