
Submitted:
11 September 2025
Posted:
12 September 2025
You are already at the latest version
Abstract
The research aimed to establish normal blood count values and evaluate influence of age in 56 Nguni cattle, raised in Mozambique. Were used blood samples to determine the blood count. Was performed Statistical analysis using the SAS package and Duncan's parametric test at 5% significance. The age influenced the blood count on in this research. The blood count values adopted outside the African continent for various breeds of cattle cannot be used to support clinical diagnosis in Mozambique. Based on the confidence interval, the following normal values can be presented for the erythrogram: red blood cells between 6.78 and 7.40 x10⁶ / µL; hemoglobin between 10.77 and 11.36 g/dL, hematocrit between 28.02 and 29.56%, MCV between 39.91 and 43.02 fL, MCH between 15.27and 16.44 pg, MCHC between 37.86 and 39.10 % and RDW between 16.98 and 19.40 %. For the leukogram, the following normal values were obtained: Total Leukocytes between 14,106 and 16,233 /µL, Basophils between 32 and 165 /µL, Eosinophils between 823 and 1262 /µL, Band Neutrophils between 25 and 87 /µL, Segmented Neutrophils between 2,510 and 3,249 /µL, Total Neutrophils between 2,565 and 3,306 /µL, Lymphocytes between 9,471 and 11,474 /µL and Monocytes between 154 and 296 /µL.
Keywords:
Age factor
; Erythrogram
; Leukogram
; Cattle
; Nguni
1. Introduction
Veterinary hematology is an auxiliary means for veterinarians to diagnose, monitor and determine an appropriate treatment for numerous diseases and establish prognoses regarding the future evolution of a disease in an individual [1,2,6,7,21,34,36,37,40]. Animals raised under different environmental, climatic and management conditions present evident variations in blood elements and the values obtained for animals raised in a given region cannot be considered, without an adequate evaluation, as a reference standard or normality for other locations [1,5,7,28]. The knowledge of fundamental importance for the interpretation of the blood count of cattle raised in tropical and subtropical regions refers to the fact that cattle raised in these regions present hemoparasitoses such as Anaplasmosis, Babesiosis and, in the case of the African continent, also Theileriosis. It is known that in endemic areas of Anaplasma sp. and Babesia spp., in which there is enzootic stability, there is a picture of leukocytosis due to lymphocytosis that makes it impossible for reference values obtained in the Northern Hemisphere to be used in these tropical and subtropical regions of the Southern Hemisphere without serious errors in the interpretation of the blood count occurring, invalidating the use of the reference values of the blood count established in the Northern Hemisphere [5,6,7].
The Landim (Nguni) breed, native to Central and East Africa, is the predominant breed in the family farming sector in Mozambique [13]. Although it belongs to the Bos taurus species, its morphological characteristics have led it to be considered a different subspecies from the taurines (Bos taurus taurus) and zebu cattle (Bos taurus indicus), with its scientific classification being Bos taurus africanus [39].This breed was recognized as important due to its robustness and resistance to diseases in 1988 [13]. When analyzing the literature, we found that there are no studies on the reference values for the blood count of cattle raised on the African continent, and there is no information on the constituents of the blood count for animals of the subspecies Bos taurus africanus (Nguni-Landim breed). Likewise, no hematological standards have been established for cattle raised in areas where Theileriosis is endemic. Thus, this research aims to establish normal values as well as evaluate the effect of age on the blood count of Nguni-Landim cattle (Bos taurus africanus) on the aforementioned parameters, in the districts of Xai-Xai, Limpopo and Chongoene, located in Gaza province in Mozambique.
2. Materials and Methods
All animal procedures were approved by the Animal Use Ethics Committee of the School of Veterinary Medicine and Animal Science, University of São Paulo (protocol number: 1548080523). The study was conducted on small farms in Mozambique. All sample animals were clinically examined and only healthy animals were included in the study.
2.1. Description of the Study Site
The animals used were from 3 districts, namely Xai-Xai, Chongoene and Limpopo (see map Figure 1) of the Gaza province in Mozambique, kept in an extensive or family farming system.
The three districts are located in the southern part of Gaza Province. Xai-Xai District is geographically bounded by Chibuto District to the north, Manjacaze to the east, the Indian Ocean to the south, and Bilene Macia to the west. Limpopo District is geographically bounded by Chibuto District to the north, Chongoene and Xai-Xai to the east, the Indian Ocean to the south, and Bilene to the west. Chongoene District is geographically bounded by Chibuto District to the north, Manjacaze to the east, the Indian Ocean to the south, and Limpopo to the west [26].
2.1. Sample Population and Procedures
Fifty-six healthy animals were used and divided into six groups according to age in months: G1 - seven animals up to six months; G2 - seven animals aged between six and 12 months; G3 - eleven animals aged between 12 and 24 months; G4 - ten animals aged between 24 and 48 months; G5 - thirteen animals aged between 48 and 72 months; G6 - eight animals older than 72 months. These groups were used to evaluate the influence of age on the hematological parameters.
2.3. Laboratory Analysis
Blood samples were collected from cattle before they were released into the pasture, between 6 and 8 a.m., by puncture of the coccygeal vein using the Vacutainer®® System. For hematological analysis, samples were collected in tubes containing ethylenediaminetetraacetic acid (EDTA). The erythrogram (number of red blood cells, packed cell volume, hemoglobin content, MCV, MCH and MCHC and total leukocyte count were analyzed using the Mindray®® BC-2800 Vet automatic counter at the hematology laboratory of the School of Veterinary Medicine of Eduardo Mondlane University. Using the “in natura” blood, blood smears were made for differential leukocyte count. The slides with the blood smears were dried naturally and stained using Giemsa and McGruwald staining (Rosenfeld Stain) [7].
In each blood smear, 100 leukocytes were differentiated, classified according to their morphological and staining characteristics as neutrophils with band nuclei, neutrophils with segmented nuclei; eosinophils, basophils, lymphocytes and monocytes.
2.4. Statistical Analysis
Statistical analysis was performed using the SAS - Statistical Analysis System (SAS - Institute, 1985) computer program. Residual normality tests were performed using the Shapiro-Wilk test, and the Levene test to assess the homogeneity of variance at a probability level of 5%. Analysis of variance was performed using the GLM procedure to test the equality of means, and mean contrasts were analyzed using the Duncan test with significance levels equal to 5% (p<0.05) [35]. To establish normality values, the 95% confidence interval for each variable was calculated.
Results
After statistical analysis the normal values of erythrogram and leukogram in Nguni or Landim cattle raised in Mozambique mentioned in (Table 1) in relation to their mean, standard deviation and 95 % confidence interval, are organized as follows. Based on the confidence interval, the following normal values can be presented for the erythrogram: red blood cells between 6.78 and 7.40 x10⁶ / µL; hemoglobin between 10.77 and 11.36 g/dL, hematocrit between 28.02 and 29.56%, MCV (between 39.91 and 43.02 fL, MCH between 15.27and 16.44 pg, MCHC between 37.86 and 39.10 % and RDW between 16.98 and 19.40 %. For the leukogram, the following normal values were obtained: Total Leukocytes between 14,106 and 16,233 /µL, Basophils between 32 and 165 /µL, Eosinophils between 823 and 1262 /µL, Band Neutrophils between 25 and 87 /µL, Segmented Neutrophils between 2,510 and 3,249 /µL, Total Neutrophils between 2,565 and 3,306 /µL, Lymphocytes between 9,471 and 11,474 /µL and Monocytes between 154 and 296 /µL.
In addition to the normal values, the effect of age on the erythrogram and leukogram of the cattle in the research was also evaluated. As can be seen in Table 2, the values of the number of red blood cells, globular volume and hemoglobin rate were not influenced by age factors and ranged, respectively, between 6.49 ± 0.71 and 7.54 ± 1.24 x 10 6 red blood cells/µL, between 27.50 ± 2.36 and 30.26 ± 3.00% and between 10.45 ± 1.22 and 11.65 ± 0.54 g/dL.
Regarding the absolute hematimetric indices (Table 2), it was observed that the Mean Corpuscular Volume (MCV) was influenced by age. The values observed in the group up to six months of age (37.20 ± 2.49 fL) increased with age, reaching the highest values in the group of animals aged 48 to 72 months (43.63 ± 3.76 µ3 ) and over 72 months of age (47.06 ± 6.10 fL) were significantly higher. Regarding Mean Corpuscular Hemoglobin, there was an influence of the age factor and a gradual increase in its values was observed, which went from 14.00 ± 1.33 pg (observed in the group of animals up to six months of age) to 14.85 ± 2.15 pg (observed in animals aged between 48 and 72 months) and 18.05 ± 1.77 pg (in animals over 72 months of age). MCHC was not influenced by age and ranged from 37.62 ± 2.51 to 39.52 ± 2.85 %. Likewise, no influence of age was observed on RDW values, which ranged between 16.73 ± 1.40 and 19.43 ± 6.88 %, without statistical differences being evident. Regarding the leukogram (Table 3), it was observed that the total number of leukocytes increased from 12,557 ± 4,587 cells/ µL, observed in the group up to six months of age, to 18,214 ± 4,355 cells/ µL observed in the group with ages ranging from 6 to 12 months of age. There was then a gradual decrease in the total number of leukocytes, reaching minimum values equal to 13,912 ± 3,472 cells/ µL in the group of animals over 72 months old. Variations in the total number of leukocytes largely reflect variations in the number of lymphocytes. The absolute number of lymphocytes was observed to increase from 9,493 ± 4,287 cells/ µL, observed in the group up to six months of age, to 13,252 ± 4,715 cells/ µL observed in the group with ages ranging from 6 to 12 months of age. There was then a gradual decrease in the number of lymphocytes, reaching minimum values equal to 8,074 ± 1,953 cells/ µL in the group of animals over 72 months old. As can be seen in (Table 3), the total number of neutrophils was not influenced by age and ranged, respectively, between 2,336 ± 942 and 4,008 ± 2,164 neutrophils /µL. Likewise, the influence of age on the total number of band and segmented neutrophils was not observed (Table 4).
The absolute number of eosinophils (Table 3) observed in the group of animals aged 48 to 72 months (1,216 ± 657 eosinophils /µL) and over 72 months (1,588 ± 563 eosinophils /µL) were significantly higher than those observed in the group under 6 months (359 ± 406 eosinophils / µL). As can be seen in Table 3, the absolute numbers of basophils and monocytes were not influenced by age factor and ranged, respectively, between 0 ± 0 and 280 ± 504 basophils /µL and between 87 ± 157 and 310 ± 244 monocytes /µL without statistical differences between the groups being observed.
4. Discussion
The results of the reference values of the hemogram for Nguni (Landim) cattle raised in Mozambique differ from others those reported in the world literature. A comparison of the results with taurine animals raised in the Northern Hemisphere, taurine animals raised in the Southern Hemisphere and zebu animals, shows that there is a difference in the values obtained for the hemogram when compared with taurine breeds (Bos taurus taurus) [5,6,11,19,24,28,31,34] and the results obtained in this study are closer to those reported for zebu breeds (Bos taurus indicus) raised in the Southern Hemisphere [1,3,4,12,17,32].
The red blood cell value of cattle raised in Mozambique (7.09 ± 1.13 x 10 6 /µl) was higher compared to the values obtained in the Aquitaine breed [15], Holstein breed [11,19], Gir breed[1], and above Nelore [3,4] and Guzerá breed [1]. The hemoglobin of the cattle in the research (11.07 ± 1.07 g/dL), was above the value obtained in the Aquitaine breed[15] and Guzerá breed [1], higher compared to Holstein breed[11,19], Gir breed, [1] and similar compared to Nelore breed [3,4]. The hematocrit (28.79 ± 2.80 %) also showed itself to be higher compared to the result obtained in dairy cattle in winter, Gir breed [1], Holstein breed [11,19], but below the values obtained in dairy cattle in summer and Holstein breed [29]. Regarding the MCV (41,47± 5.76 fL), they were within the parameters established for Nelore breed [3,4] and lower compared to the results obtained in the Holstein breed [11,19], Jersey breed [5], Aquitaine breed [15], and Guzerá breed [1]. The MCH (15.86 ± 2.16 pg) was lower compared to the results in the study of the Aquitaine breed [15], Jersey breed [5], Holstein breed [11,19], and higher for Nelore [3,4] and Guzerá breed [1]. The MCHC (38.48 ± 2.29 %) is within the standards established for cattle, but was higher than the results in the study of the Aquitaine breed [15], and Jersey breed [5]. In turn, its value was lower than that observed in the research in the Holstein breed [11,19,31]. Finally, the RDW (18.19 ± 4.46 %) was lower than that observed in the research in the Holstein breed [11].
Several factors probably influenced the variation in the erythrogram variables of the cattle in the study. These cattle travel long distances in search of food and water sources because they are from the extensive sector, where breeders do not have the means to supplement them, so we can also consider some vitamin deficiencies such as B12 and folate, as well as minerals, such as iron. However, genetics are also an influence, as they are different from the breeds described in other studies, in addition to their size and hardiness. This difference in the blood count values of the Landim breed is partly due to the environmental, climatic and livestock management conditions of the family sector in Mozambique, as well as to the breed standard.
Age, sex, stress, diet, body condition, reproductive status, recent activity, hydration, ambient temperature and altitude, are factors that contribute to physiological variations in the constituents of the blood count [5,6,7,28,36,40]. The diversity of tick genera, such as Amblyomma, Dermacentor, Boophilus, Rhipicephalus and Hyalomma mentioned in several studies [41,42,43], which infest cattle in Mozambique, unlike other countries, may be associated with the particularities observed in the erythrogram of Landim cattle.
Given the importance of Theileriosis as a bovine disease in Mozambique, causing fever, anemia, jaundice and hemoglobinuria [20,22,33] it was expected that there would be more significant changes in the erythrogram, with the reference values being significantly different from those adopted outside the African continent for several cattle breeds [23,30]. Similar to what is reported for endemic areas of Anaplasma sp. and Babesia spp., in which there is enzootic stability, the reference values used in the Northern Hemisphere can be used without making gross errors [5,6]. It is possible that the districts Xai-Xai, Chongoene and Limpopo in which we collected the blood samples are in areas of enzootic stability of Theileria parva. The occurrence of these areas of enzootic stability, with a reduction in the number of clinical cases, has been considered as occurring for theileriosis.
The comparison of the total number of leukocytes and absolute number of lymphocytes found in Landim animals raised in Mozambique are higher than those reported for taurine cattle raised in the Northern Hemisphere [11]. The mean values for the total number of leukocytes (15,146 ± 2,024 leukocytes/µL) and absolute number of lymphocytes (10,549 ± 2,057 lymphocytes/ µL) for the Landim breed are higher than the reference values recommended in the literature (ranged between 5,100 and 13,300 leukocytes/µL and between 1,800 and 8,100 lymphocytes/µL) [6,34]. Basophils were higher compared to those obtained in the Jersey breed [6]. Eosinophils were within the standards established by some authors, but higher than the values obtained in the Jersey breed, and Holstein cows [6,11,36]. The total neutrophils found were higher than the values obtained in the Jersey breed and lower in Holstein cows in China [6,11]. The total number of lymphocytes was higher than the values obtained in the cattle standards, Jersey breed, Holstein cows and dairy cows [6,11,29,36].
Monocytes were higher in the research when compared to those obtained in the study of Jersey breed [6] and Holstein cows [11]. The total number of band neutrophils observed in cattle in the research was higher than that observed in the research of Jersey breed [6,36]. The segmented neutrophils of the cattle involved in the current research were higher than those obtained, in the Jersey breed [6]. The variation in the different types of leukogram cells of these research cattle is related to the genetics of the cattle due to their rusticity in relation to their immunological response, breed and genetic inheritance, as the majority of them are descendants of Bos taurus.
In subtropical regions, where cattle are infested by ticks and hemoparasitosis caused by Anaplasma marginale and Babesia spp are enzootic diseases, a leukogram characterized by leukocytosis with lymphocytosis is observed [6]. In regions where hemoparasites are sporadic, such as in animals raised in the Northern Hemisphere (temperate or cold climate regions), it is observed that the total number of leukocytes and lymphocytes is lower [11,24,34]. Anaplasmosis and Babesiosis are diseases diagnosed in Mozambique and although the region is at the same latitude and has a similar climate to research carried out in the Southeast and Central-West regions of Brazil [6,12,18], it was observed that the number of leukocytes and lymphocytes were higher in the Landim breed raised in Mozambique than those reported for taurine breeds [6,18] and zebu breeds[12], raised in the Southeast and Central-West regions of Brasil.
In the African continent, in addition to these hemoparasitoses (Anaplasmosis and Babesiosis), we also have the occurrence of theileriosis, which is responsible for a clinical picture that specifically affects the lymphatic system and lymphocytes [33,41,42,43], and, therefore, is expected to influence the number of lymphocytes and leukocytes. The changes in the leukogram are probably manifestations of mesological variations and the influence of pathological pictures determined by Theileria parva that do not exist in other subtropical regions.
Regarding the eosinophil values observed for Landim cattle, it was found that they were higher than those reported for the taurine and zebu breeds [6,11,12]. The eosinophil values obtained by all these authors were within the reference values recommended on hematologic tools of diagnostic and ranged between 0 and 1,500 eosinophils/µL [34].
The occurrence of eosinophilia has been associated with type 1 hypersensitivity reaction or parasitic infections [34]. An increase in the number of circulating eosinophils in the blood has been correlated with low opg values in sheep feces and this phenomenon has been related to greater animal resistance to parasitic infection. In modern breeding and parasite control programs, by decreasing exposure to parasites, eosinophil counts are expected to be lower [34]. Eosinopenia has also been reported in situations where hemolytic anemia occurs and in acute infections by Theileria spp [34]. The fact that we did not observe animals with eosinopenia confirms that there were no acute cases of Theileriosis in the herds used, which is another indicator of enzootic stability for Theileria parva in cattle raised in Gaza province, in Xai-Xai, Chongoene and Limpopo districts of Mozambique.
When comparing the number of band neutrophils, segmented neutrophils, basophils, and monocytes obtained in this research with the values cited in the literature, it was found that there was equivalence with those presented for taurine cattle raised in the Northern Hemisphere for taurine breeds [11,24], taurine [6,18] and zebu breeds [12] raised in the Southern Hemisphere.
The values of band neutrophils, segmented neutrophils, basophils, and monocytes obtained by all these authors were ranged between 0 and 200 for band neutrophils/µL, between 1,000 and 6,000 for segmented neutrophils/µL, between 0 and 300 for basophils/µL and between 0 and 800 for monocytes/µL [34].
Based on leukocyte and lymphocyte variations, it is considered correct to state that leukogram reference values established in the Northern Hemisphere and other subtropical regions of the Southern Hemisphere should never be used to support clinical diagnosis in Mozambique [14].
In the evaluation of the effect of age factor on the erythrogram and leukogram, some variables were influenced, such as MCV and MCH in the erythrogram and leukocytes, eosinophils and lymphocytes, as described below.
From the research carried out in relation to the erythrogram, there was an influence of the age factor on the MCV, MCH. Variables such as hemoglobin, red blood cells, hematocrit, MCHC and RDW were not influenced by age, that is, they did not present a statistically significant difference by the Duncan test at 5% probability.
The mean corpuscular volume (MCV) of cattle in the study was influenced by the age factor between the groups of animals, and is in agreement with other authors who found a statistically significant difference, such, when studying the hematological profile of cattle Gir, Nelore, Guzerá breeds [1], Jersey breed [6], Holstein calves [10] and Curraleiro breed [23].
There was an influence of age on the mean corpuscular volume, on bovine females of Aquitanian breed, as it was reported that it increased significantly with the age of the animals [15]. A similar variation was reported by other researchers in the same line of research [8,9]. Some researchers did not verify the influence of age on the mean corpuscular volume [38]. This increase described by previous authors can be explained by the lower speed of erythrocyte replacement and the decrease in the number of red blood cells, which consequently increase in size in order to adequately fulfill their functions in the body.
The mean corpuscular hemoglobin of Nguni or Landim cattle was influenced by the age factor. Similar results were found by some authors in the same line of research [15]. Another studies showed, in turn, that there is an influence of age on MCH. In the other research, MCH had a significant decrease up to 3 to 11 months of age (12.67 ± 1.14 pg), and then increased with the evolution of the age of the cattle up to maximum values of (15.45 ± 1.01 pg) in animals over 60 months, erythrogram of Holstein [9,18,19,31,32]. Another author reported in his research the increase in MCH up to 24 and 48 months and that thereafter there is a constant and significant decline in values with the evolution of age [6].
Total leukocytes of Nguni or Landim cattle were influenced by the age, similar to that observed, on the effect of age factor on the leukogram of female zebu cattle of the Nelore [12], in healthy Curraleiro cattle [18,32], Jersey breed [6] and Pantaneira breed [8,9].
The lymphocytes of Nguni cattle were influenced by the age factor, in agreement with other researchers [6,9,18,27,36]. This increase in lymphocytes observed in the research is justified by the increase in lymphocytes during the growth phase of the animals combined with the immunogenic activity in their first months of life and their decline in adulthood caused by the reduction of T lymphocytes, due to the decrease in the thymus [25].
Eosinophils were influenced by age, as the averages showed a statistically significant difference. The number of these cells varied in all established groups. Researchers also observed in their research that the age of the animal influences the eosinophil values [6,9,12,17,18]. This increase in eosinophils in adult animals is the result of memory immunity particularly after parasitism.
5. Conclusions
Normal blood count values can variate according to region, breed and age. Factors such as genetics and management conditions also influence changes or variations in reference values as well as normal values in cattle. Age influenced erythrogram and leukogram values, thus requiring great care in their assessment and interpretation.
The reference values for the erythrogram established outside the African continent for various cattle can not be applied in areas endemic to Theileriosis, where enzootic stability exists, without introducing significant errors in the interpretation of the erythrogram. Based on the observed variations in leukocytes and lymphocytes, it appropriate to conclude that the leukogram reference values established in the Northern Hemisphere and other subtropical regions of the Southern Hemisphere should not be utilized to support clinical diagnosis in Mozambique. It is necessary to adopt local reference values obtained under African conditions.
Author Contributions
Carlos Francisco Macuvele: Conceptualization, preparation of the original draft, research, methodology, software and formal analysis, and writing. Atanásio Serafim Vidane: Methodology, formal analysis, data curation. Daniela Becker Birgel: research, methodology, data curation, supervision. Ana Cláudia Oliveira Carreira Nishiyama: formal analysis, methodology, supervision, validation. Eduardo Harry Birgel Júnior: formal analysis, investigation, resources, methodology, software, supervision, validation, visualization and writing.
Funding
The research was funded by the CAPES grant.
Institutional Review Board Statement
The research was approved by the Animal Use Ethics Committee of the School of Veterinary Medicine and Animal Science, University of São Paulo (protocol number: 1548080523).
Acknowledgments
The authors would like to thank the livestock owners as well as other researchers who helped in the evaluation and processing of the research data.
Conflicts of Interest
The authors declare no conflicts of interest
Abbreviations
EDTA- Ethylenediaminetetraacetic acid
G-Group
GLM- Generalized linear models
INA Instituto Nacional de Estatística
MCHC- Mean corpuscular hemoglobin concentration
MCV- Mean corpuscular hemoglobin
MCV- Mean corpuscular volume
RDW- Red blood cell distribution width
SAS- Statistical analysis system
References
- Alves Júnior, J.R.F.; et al. Perfil eritrocitário de bovinos zebuínos (Bos taurus indicus, Linnaeus, 1758) das raças Gir, Nelore e Guzerá de Uberaba-MG. PUBVET, Londrina, 2009. V. 3, N. 22, Art#602, Jun4.
- Argentino, I.N; Santos, L. M.A; Mattosinho, R. O. Avaliação hematológica de bovinos através da venopunção da veia jugular e coccígea media. Revista de Ciência Veterinária e Saúde Pública. UEM, Umuarama, v. 4, Suplem 2. Paraíba, 2017. [CrossRef]
- Ayres, M. C. C. “Eritrograma de zebuínos (Bos indicus, Linnaeus, 1758) da raça Nelore criados no Estado de São Paulo: influência dos fatores etários e do tipo racial. São Paulo.”São Paulo:[sn] (1993). Accessed on: July 17, 2025.
- Ayres, M. C. C.; et al. Avaliação da influência de fatores relacionados ao sexo sobre a variabilidade do eritrograma de zebuínos (Bos indicus, Linnaeus, 1758) da raça Nelore, criados no estado de São Paulo.Revista Brasileira de Saúde e Produção Animal, 2001. v. 1, n. 2.
- Birgel Junior, E.H.; et al. Valores de referência do eritrograma de bovinos da raça Jersey criados no Estado de São Paulo. Arquivo Brasileiro de Medicina Veterinária e Zootecnia, 2001a v. 53, p. 1-9.
- Birgel Junior, E. H.; et al. Valores de referência do leucograma de bovinos da raça Jersey criados no Estado de São Paulo. Arquivo Brasileiro de Medicina Veterinária e Zootecnia 2001, 38, 136–141. [Google Scholar] [CrossRef]
- Birgel, E. H. Hematologia clínica veterinária. Patologia clínica veterinária. São Paulo: Sociedade Paulista de Medicina Veterinária. 1982. Accessed on: July 8, 2025.
- Borges, A. C. Componentes sanguíneos de bovinos (Bos taurus) sadios da raça Pantaneira, em diferentes faixas etárias, criados extensivamente. 2008. Tese de Doutorado. Dissertação. 2008. Universidade Federal de Goiás.
- Borges, A.C.; et al. Características Hematológicas de Bovinos (Bos taurus) Sadios da Raça Pantaneira Corumbá: Embrapa Pantanal, 2011. 13 p. (Boletim de Pesquisa e Desenvolvimento / Embrapa Pantanal, ISSN 1981-7215; 104).
- Caxito, L.M. Influencia etária e nutricional na hematologia de bezerros da raça holandesa. Belo Horizonte, 2013. Dissertação.2013. Universidade Federal de Minas Gerais.
- Chen, H.; et al. Hematology reference intervals for Holstein cows in Southern China: a study of 786 subjects. Veterinary Sciences, 2022, 9, 565. [Google Scholar] [CrossRef] [PubMed]
- Costa, J. N.; et al. Fatores etários no leucograma de fêmeas zebuínas sadias da raça Nelore (Bos indicus). Ciência Rural, 2000, 30, 399–403. [Google Scholar] [CrossRef]
- De Almeida, A. M. , Lérias, J. R., & Cardoso, L. A. Raças bovinas autóctones da África do Sul-Importância no âmbito da pecuária Moçambicana. In: Atlas do congresso internacional saber tropical em Moçambique: História, Memória e Ciência. Portugal: Instituto de investigação científica tropical (IICT). CVZ_FMV, Lisboa, (2012). (pp. 1-15).
- Delfino, L.J. B et al. Efeito do estresse calórico sobre o eritrograma de ruminantes. Agropecuária científica no semiárido, 2012, 8, 01–07. [Google Scholar] [CrossRef]
- Dias Júnior, R. F.; et al. Valores de referência e influência da idade no eritrograma de fêmeas bovinas da raça Aquitânica. Arquivo Brasileiro de Medicina Veterinária e Zootecnia, 2006, 58, 311–315. [Google Scholar] [CrossRef]
- Duncan, J.R.; Prasse, K.W.; Mahaffey, E.A. Veterinary Laboratory Medicine: Clinical Pathology. 3rd ed. Ames, EUA: Iowa State University Press, 1994 300p.
- Fagliari, J. J.; et al. Constituintes sangüíneos de bovinos lactantes, desmamados e adultos das raças Nelore (Bos indicus) e Holandesa (Bos taurus) e de bubalinos (Bubalus bubalis) da raça Murrah. Arquivo Brasileiro de Medicina Veterinária e Zootecnia, v. 50, n. 3, p. 263-271 Belo Horizonte, 1998.
- Fioravanti, M. C. S.; et al. Valores hematológicos de bovinos sadios da raça Curraleiro Pé Duro (Bos taurus): efeito da idade, sexo e gestação. 2016.Processo Ibero-Americano sobre Conservação Animal, 2016 v. 7, p. 8-15.
- Galindo, R. C. G. Eritrograma de bovinos da raça Holandesa criados na Mesorregião Metropolitana do Recife: influência dos fatores sexuais e etário. Medicina Veterinária, 2009, 3, 1–6. [Google Scholar]
- Ganaie, Z.; et al. An overview of bovine theileriosis. International Journal of Veterinary Sciences and Animal Husbandry, 2019, 4, 09–13. [Google Scholar]
- Garcia-Navarro, C. E. K; PACHALY, J. R. Manual de hematologia veterinária. rev. São Paulo: Livraria Varela Editora, 2005.
- Gebrekidan, H.; et al. An appraisal of oriental theileriosis and the Theileria orientalis complex, with an emphasis on diagnosis and genetic characterization. Parasitology research, 2020, 119, 11–22. [Google Scholar] [CrossRef] [PubMed]
- Gurjão, T. A.; et al. Perfil hematológico de bovinos (Bos taurus) sadios da Raça Carraleiro Pé-duro no Estado da Paraíba. 2015. Trabalho de culminaçao de curso de Medicina Veterinária. Universidade Federal de Campina Grande, Centro de Saúde e Tecnologia Rurtal.
- Herman, N.; et al. Hematology reference intervals for adult cows in France using the Sysmex XT-2000iV analyzer. Journal of Veterinary Diagnostic Investigation, 2018, 30, 678–687. [Google Scholar] [CrossRef] [PubMed]
- Holman, H. H. Changes associated with age in the blood picture of calves and heifers. British Veterinary Jounal, 1956, 112, 91–104. [Google Scholar] [CrossRef]
- Instituto Nacional de Estatística. Estatísticas do Distrito de Limpopo, 2017 – 2021. Gaza, 2023.
- Latimer, K. S.; Mahaffey, E. A.; Prasse, K. W. Duncan & Prasse’s veterinary laboratory medicine: clinical pathology. 4. ed. Ames: Iowa State University Press, 2003. 450p.
- Mammerickx, M.; et al. Bovine Hematology 1 IV. Comparative Breed Studies on the Erythrocyte Parameters of 16 European Cattle Breeds as Determined in the Common Reference Laboratory 2. Zentralblatt für Veterinärmedizin Reihe B, v. 25, n. 6, p. 484-498, 1978.
- Meirelles, J. P.; et al. Padrões hematológicos de vacas leiteiras no período de transição. Núcleo de Pesquisa, Ensino e Extensão em Pecuária. v. 13. Pelotas, 2009. Universidade Federal de Pelotas.
- Ministério de Agricultura e Desenvolvimento Rural. Relatório de fitossanidade e sanidade animal campanha agrária 2020-2021. Moçambique, 2021.
- Mohri, M; Sharifi, K; Eidi, S. Hematology and serum biochemistry of Holstein dairy calves: age related changes and comparison with blood composition in adults. Research in veterinary science, 2007v. 83, n. 1, p. 30-39.
- Neto, J. B. P. Hemogramas de bovinos (Bos taurus) sadios da raça curraleiro de diferentes idades, machos e fêmeas, gestantes e não gestantes. 2004. 65f. Dissertação (Mestrado em Ciência Animal) Escola de Veterinária, Universidade Federal de Goiás, Goiânia.
- Pipano, E; Shkap, V. Theileria annulata theileriosis in Infectious Diseases of Livestock JA W. COETZER & RC TUSTIN. 2004.
- Roland, L; Drillich, Marc; Iwersen, M. Hematology as a diagnostic tool in bovine medicine. Journal of Veterinary Diagnostic Investigation, 2014 v. 26, n. 5, p. 592-598.
- Sampaio, I.B.M. Estatística aplicada à experimentação animal. Belo Horizonte: Fundação de ensino de medicina veterinária e zootecnia, 1998. 221 p.
- Schalm, O. W.; Jain, N. C.; Carroll, E. J. Veterinary hematology. 3.ed. Philadelphia: Lea & Febiger, 1975. p. 122-143.
- Silva, M. N.; Monteiro, M.V.B. Hematologia Veterinária: Produção de Material Didático. Pará: EditAEDI-UFPA, 2017.
- Silva, R. M. N.; et al. Efeito do sexo e da idade sobre os parâmetros fisiológicos e hematológicos de bovinos da raça Sindi no semi-árido. Ciência e Agrotecnologia. Campina, 2005. v. 29, p. 193-199.
- Strydom, P. E.; Frylinck, L.; Smith, M. F. Variation in meat quality characteristics between Sanga (Bos taurus africanus) and Sanga-derived cattle breeds and between Sanga and Brahman (Bos indicus). Animal, 2011 v. 5, n. 3, p. 483–491.
- Thrall, M.A.; et al. Hematologia e Bioquímica Clínica Veterinária. 1ª ed. Roca: São Paulo: Roca, 2007. 582 p.
- Ullah, R.; et al. Epidemiology and molecular characterization of Theileria annulata in cattle from central Khyber Pakhtunkhwa. PloS one. Pakistan, 2021.v. 16, p.1-17.
- Valente, D.; et al. Prevalence and risk factors associated with Theileria annulata infection in two bovine portuguese autochthonous breeds. Pathogens 2023, 12, 669. [Google Scholar] [CrossRef] [PubMed]
- Yaghfoori, S.; et al. Molecular detection of Theileria annulata among dairy cattle and vector ticks in the Herat area, Afghanistan. Archives of Razi Institute 2021, 76, 79. [Google Scholar]
Figure 1.
Map of Gaza province, indicating the districts of Chongoene, Xai-Xai and Limpopo. Scheme 2023.
Figure 1.
Map of Gaza province, indicating the districts of Chongoene, Xai-Xai and Limpopo. Scheme 2023.
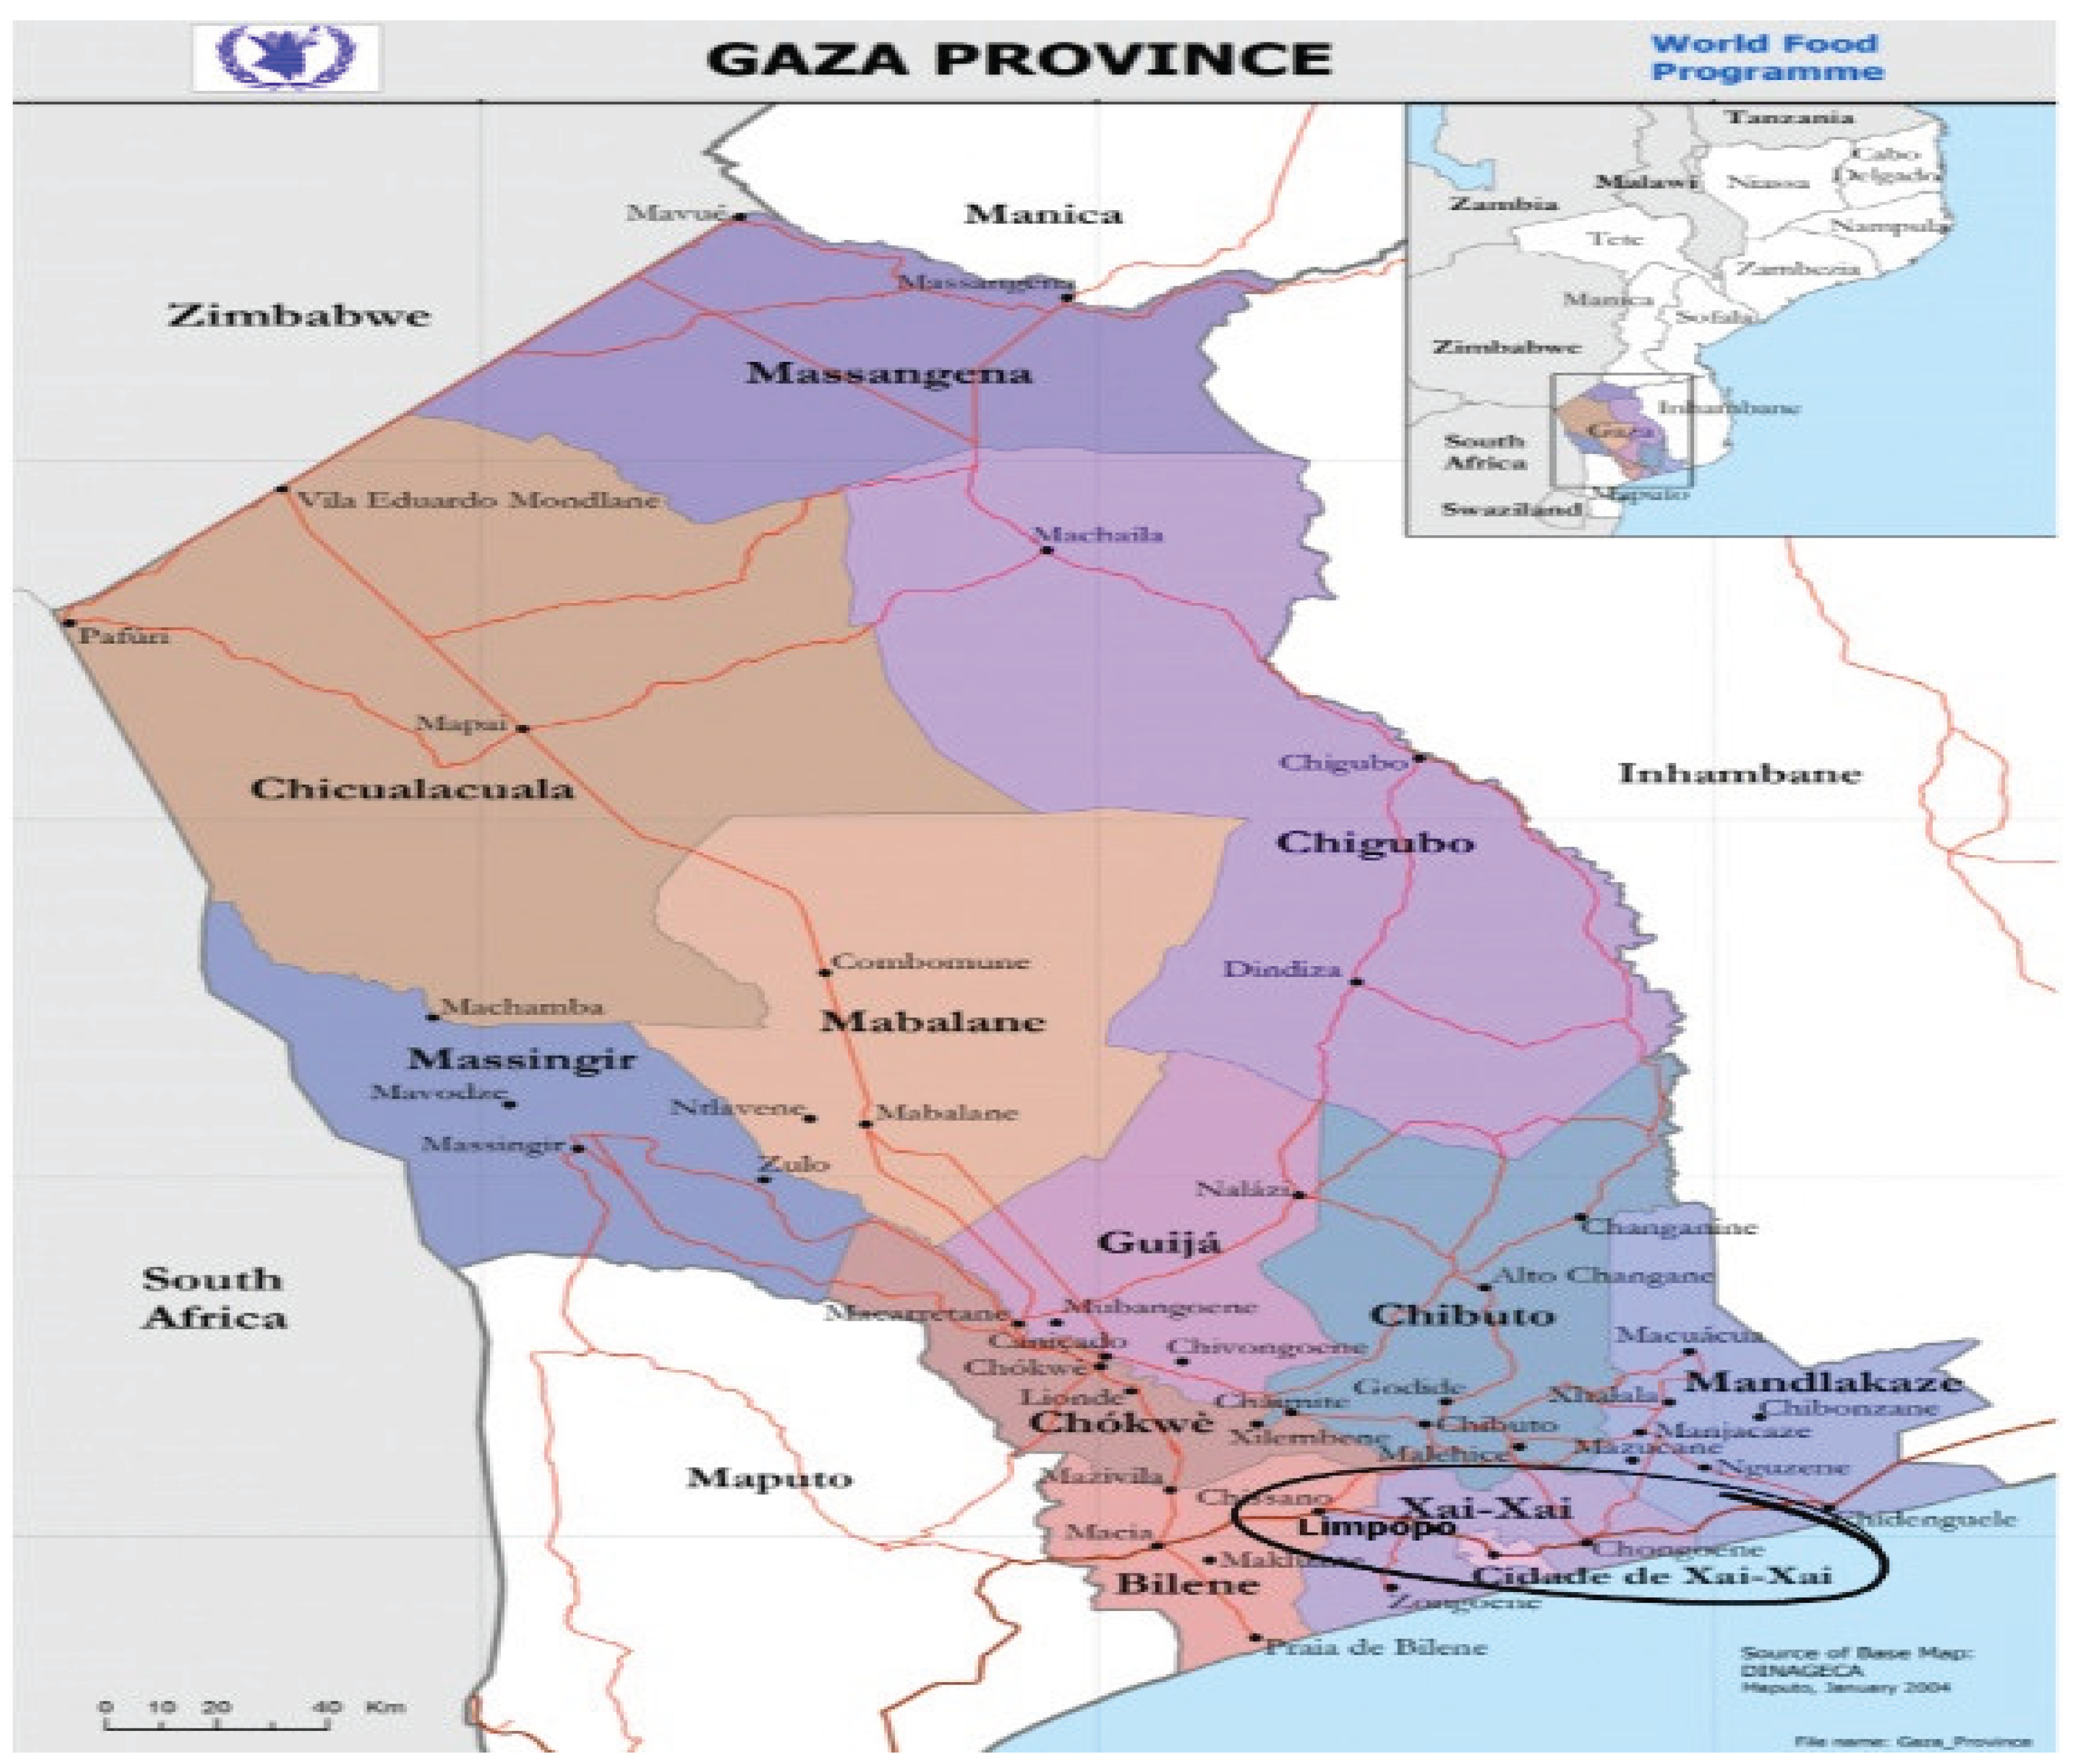

Table 1.
Normal values of erythrogram and leukogram of Nguni or Landim cattle, raised in Mozambique, according to statistical characteristics (mean, standard deviation and 95 % confidence interval).
Table 1.
Normal values of erythrogram and leukogram of Nguni or Landim cattle, raised in Mozambique, according to statistical characteristics (mean, standard deviation and 95 % confidence interval).
| Variable | Mean ± standard deviation |
Normality Values (95% confidence interval) |
| Red blood cells (x106 / µL) | 7.09 ± 1.13 | 6.78 - 7.40 |
| Hemoglobin (g/dL) | 11.07 ± 1.07 | 10.77 - 11.36 |
| Hematocrit (%) | 28.79 ± 2.80 | 28.02 - 29.56 |
| MCV (fL) | 41.47 ± 5.76 | 39.91 - 43.02 |
| MCH (pg) | 15.86 ± 2.16 | 15.27 - 16.44 |
| MCHC (%) | 38.48 ± 2.29 | 37.86 - 39.10 |
| RDW (%) | 18.19 ± 4.46 | 16.98 – 19.40 |
| Leukocytes (/µL) | 15,169 ± 3970 | 14,106 – 16,233 |
| Basophils (/µL) | 98 ± 247 | 32 – 165 |
| Eosinophils (/µL) | 1,042 ± 795 | 823 – 1262 |
| Band Neutrophils (/µL) | 56 ± 115 | 25 – 87 |
| Segmented neutrophils (/µL) | 2,879 ± 1380 | 2,510 – 3,249 |
| Total Neutrophils (/µL) | 2,936 ± 1,385 | 2,565 – 3,306 |
| Lymphocytes (/µL) | 10,473 ± 3,739 | 9,471 – 11,474 |
| Monocytes (/µL) | 225 ± 227 | 154 - 296 |
MCV=Mean corpuscular volume, MCH=Mean corpuscular hemoglobin, MCHC=Mean corpuscular hemoglobin concentration, RDW=Red blood cell distribution width. Source: Prepared by the author
Table 2.
Influence of age on the erythrogram of cattle raised in Mozambique, according to statistical characteristics (mean, standard deviation).
Table 2.
Influence of age on the erythrogram of cattle raised in Mozambique, according to statistical characteristics (mean, standard deviation).
| Age (months) | Number of Animals | Red blood cells (x 10 6 /µl) | Hemoglobin (g/dL) | Hematocrit (%) | MCV (fL) | MCH (pg) | MCHC (%) | RDW (%) |
| 0 —| 6 | 7 | 7.54 ± 1.24 a | 10.45 ± 1.22 a | 27.84 ± 3.34 a | 37.20 ± 2.49 a | 14.00 ± 1.33 a | 37.62 ± 2.51 a | 18.04 ± 1.45 a |
| 6—| 12 | 7 | 7.20 ± 0.68 a | 11.00 ± 1.39 a | 28.80 ± 2.80 a | 40.34 ± 3.43 ab | 15.30 ± 1.87 ab | 38.01 ± 2.30 a | 18.28 ± 3.72 a |
| 12—| 24 | 11 | 7.23 ± 1.50 a | 10.89 ± 1.19 a | 27.50 ± 2.36 a | 39.78 ± 6.66 ab | 15.55 ± 2.20 ab | 39.52 ± 2.85 a | 18.99 ± 5.96 a |
| 24—| 48 | 10 | 7.53 ± 1.29 a | 10.99 ± 0.68 a | 29.17 ± 2.30 a | 39.65 ± 6.20 ab | 14.85 ± 2.15 b | 37.75 ± 1.64 a | 16.98 ± 1.52 a |
| 48 —| 72 | 13 | 6.72 ± 0.90 a | 11.28 ± 1.16 a | 29.10 ± 2.97 a | 43.63 ± 3.76 b | 16.84 ± 1.45 bc | 38.79 ± 1.54 a | 19.43 ± 6.88 a |
| > 72 | 8 | 6.49 ± 0.71 a | 11.65 ± 0.54 a | 30.26 ± 3.00 a | 47.06 ± 6.10 c | 18.05 ± 1.77 c | 38.73 ± 2.99 a | 16.73 ± 1.40 a |
| P | 0.2652 | 0.3700 | 0.3712 | 0.0048 | 0.0006 | 0.4673 | 0.7294 |
a, b, c - different letters in the columns mean statistically significant difference between the values average pairs by Duncan’s test (p ≤ 0.05). Source: prepared by the author
Table 3.
Influence of age on the leukogram of Landim cattle raised in Mozambique, according to statistical characteristics (mean and standard deviation).
Table 3.
Influence of age on the leukogram of Landim cattle raised in Mozambique, according to statistical characteristics (mean and standard deviation).
| Age (months) | Number of Animals | Leukocytes (/µL) | Basophils(/µL) | Eosinophils(/µL) | Total Neutrophils (/µL) | Lymphocytes(/µL) | Monocytes(/ µL) |
| 0 —| 6 | 7 | 12,557 ± 4,587 a | 0 ± 0 to | 359 ± 406 a | 2,336 ± 942 a | 9,493 ± 4,287 ab | 136 ± 186 a |
| 6 —| 12 | 7 | 18,214 ± 4,355 b | 280 ± 504 the | 1,112 ± 990 ab | 3,028 ± 930 a | 13,252 ± 4,715 c | 253 ± 219 a |
| 12 —| 24 | 11 | 16,727 ± 3,561 bc | 96 ± 199 a | 988 ± 935 ab | 2,733 ± 1,440 a | 12,473 ± 3,500 ac | 87 ± 157 a |
| 24 —| 48 | 10 | 14,740 ± 3,532 abc | 167 ± 192 a | 891 ± 753 ab | 2,571 ± 867 a | 10.34 4 ± 2.904 abc | 336 ± 237 a |
| 48 —| 72 | 13 | 14,723 ± 3,503 abc | 66 ± 237 a | 1,216 ± 657 b | 3.002 ± 1.271 a | 9,389 ± 3,345 ab | 310 ± 244 a |
| > 72 | 8 | 13,912 ± 3,472 ac | 0 ± 0 to | 1,588 ± 563 b | 4,008 ± 2,164 a | 8,074 ± 1,953 b | 160 ± 237 a |
| p | 0.0232 | 0.2088 | 0.0470 | 0.2127 | 0.0283 | 0.1975 |
abc - different letters in the columns mean statistically significant difference between the values average pairs by Duncan’s test (p ≤ 0.05). Source: prepared by the author
Table 4.
Influence of age on the leukogram of Landim cattle, raised in Mozambique, according to statistical characteristics (mean and standard deviation).
Table 4.
Influence of age on the leukogram of Landim cattle, raised in Mozambique, according to statistical characteristics (mean and standard deviation).
| Age (months) | Number of Animals | Band Neutrophils (/µL) | Segmented Neutrophils(/µL) | Total Neutrophils(/µL) |
| 0 —| 6 | 7 | 91 ± 159 a | 2,245 ± 841 a | 2,336 ± 942 a |
| 6 —| 12 | 7 | 111 ± 195 a | 2.917 ± 1.022 a | 3,028 ± 930 a |
| 12 —| 24 | 11 | 49 ± 89 a | 2,684 ± 1,440 a | 2,733 ± 1,440 a |
| 24 —| 48 | 10 | 36 ± 84 a | 2,535 ± 875 a | 2,571 ± 867 a |
| 48 —| 72 | 13 | 63 ± 112 a | 2,939 ± 1,265 a | 3.002 ± 1.271 a |
| > 72 | 8 | 0 ± 0 to | 4,008 ± 2,164 a | 4.008 ± 2.164 a |
| P | 0.4936 | 0.1700 | 0.2127 |
a - equal letters in the columns mean non-significant statistical difference between the values by average pairs Duncan’s test (p > 0.05). Source: prepared by the author.
Disclaimer/Publisher’s Note: The statements, opinions and data contained in all publications are solely those of the individual author(s) and contributor(s) and not of MDPI and/or the editor(s). MDPI and/or the editor(s) disclaim responsibility for any injury to people or property resulting from any ideas, methods, instructions or products referred to in the content. |
© 2025 by the authors. Licensee MDPI, Basel, Switzerland. This article is an open access article distributed under the terms and conditions of the Creative Commons Attribution (CC BY) license (http://creativecommons.org/licenses/by/4.0/).
Copyright: This open access article is published under a Creative Commons CC BY 4.0 license, which permit the free download, distribution, and reuse, provided that the author and preprint are cited in any reuse.


