

Submitted:
11 September 2025
Posted:
12 September 2025
You are already at the latest version
Abstract
Background/Objectives: Work environments play a crucial role in shaping lifestyle behaviors that influence body weight, yet the relationship between occupational factors and obesity remains underexplored. This study assessed the impact of work-related conditions on body mass index (BMI) trends in a large cohort of tertiary sector employees in France. Methods: A retrospective observational analysis was conducted using occupational health data from 23,853 employees in Paris. BMI changes were assessed through linear regression models, and associations between occupational exposures (e.g. night work, sedentary roles) and BMI variation were examined. Results: Mean BMI at baseline was 23.5 kg/m2 for women and 24.7 kg/m2 for men, with an average BMI increase of 0.15 kg/m2/year and 0.12 kg/m2/year, respectively (p<0.05). Night work and call center employment were associated with significantly higher BMI increases compared to other roles (0.18 vs. 0.13 kg/m2/year and 0.25 vs. 0.13 kg/m2/year, respectively; p<0.05). BMI progression was inversely correlated with socio-professional category, with employees in lower-status jobs exhibiting greater weight gain (p<0.05). Additionally, workers with overweight or obesity at baseline experienced a greater BMI increase, particularly among night shift employees. Conclusions: Work-related factors, particularly night shifts, sedentary roles and lower occupational status, contribute to BMI increases among tertiary sector employees.
Keywords:
obesity
; body mass index
; occupational health
; night shift work
; sedentary lifestyle
; job-related stress
; socio-professional disparities
; weight gain
; tertiary sector
; workplace health interventions
1. Introduction
Over the past two decades, the prevalence of obesity has risen sharply in France, affecting 17% of adults in 2020 compared to just 6.1% in 1980 [1,2]. This multifactorial condition results from a complex interplay of genetic and environmental factors. Dietary changes and reduced physical activity are well-established contributors, driven by larger portion sizes, higher food energy density, increased availability, and price fluctuations [3,4,5,6]. Additionally, modern sedentary lifestyles, marked by prolonged screen time, video games, and reliance on cars and public transport, have significantly reduced energy expenditure. Other environmental and behavioral factors, such as chronic stress, sleep disturbances, certain medications, gut microbiota composition, and exposure to pollutants, further exacerbate obesity risk [6].
The relationship between obesity and work is complex and bidirectional. On the one hand, obesity can be a professional disadvantage, limiting employment opportunities and affecting productivity. On the other, specific work conditions, such as prolonged sedentary behavior, chronic stress, and shift work, can promote weight gain and increase the risk of obesity [7]. This phenomenon, characteristic of modern societies, raises concerns about evolving work environments that are increasingly sedentary and stressful. Moreover, the growing prevalence of obesity in the workplace generates substantial economic costs due to increased absenteeism and healthcare expenditure [8,9].
As in the general population, the prevalence of obesity continues to rise among workers. However, this increase is more pronounced among manual laborers and agricultural workers compared to executives and professionals, widening the gap between socioeconomic groups [10]. Given this alarming trend, preventing obesity and identifying at-risk individuals have become critical public health priorities [9].
This study investigated work-related risk factors influencing body mass index (BMI) by analyzing a large cohort of tertiary-sector employees across diverse fields, including commerce, administration, transportation, finance, real estate, business and personal services, education, healthcare, and social work in France. By identifying occupational conditions linked to a higher risk of obesity, this research aims to inform targeted prevention strategies and enhance workplace health initiatives.
2. Materials and Methods
Study Design
This retrospective, observational study was based on data from employees in the tertiary sector in France, collected between January 1, 2005 and December 31, 2015, by physicians at the Centre Médical Bourse (CMB). The latter is an inter-company occupational health service, located in Paris (France). The CMB’s multidisciplinary team advises and supports employers in the tertiary sector on the implementation of occupational risk prevention and monitors the occupational health of their employees. The CMB also aims to develop prevention actions in the workplace and information about occupational risks to raise the awareness of employers and employees.
The CMB uses specially designed software to collect and record employee data at each doctor visit. The encrypted data, including age, weight, BMI, waist circumference, and seniority, must be entered manually, as well as certain non-encrypted data, such as sex, contract, and type of job. To ensure privacy, each employee was identified by an alphanumeric code. The data extracted from the software were divided into several sections: the number of visits by each employee; the average weight and average BMI recorded during the different visits; the BMI coefficient (kg/m2/year), that is, the linear regression of BMI according to the examination dates of the different visits; the socio-professional category (SPC), and the working characteristics. With regard to the SPC section, the classification was the following: senior manager (A), executive (B), intermediate (C), and master/supervisor (D). The working characteristics were categorized according to the following: day/night work; function with strong human responsibility; functional organization of the activity; physically heavy work; work requiring road travel; thermal environment work with the risk of physical or verbal aggression; mental load; work requiring a long business trip; repetitive movements of the upper limbs; prolonged sitting posture; display screen; phone call; standing posture; emotionally charged work; remote working; displacement disrupting chronobiology (time difference); work under time pressure; handling; and regular contact with the public.
Study Objectives
The primary objective was to study the change in BMI between the medical consultations each employee had at the CMB during the period considered. Secondary objectives were to investigate the relationship between working conditions and BMI, the association between socio-professional categories and BMI, and identified employee profiles at risk of obesity.
In order to show changes in BMI, the trend or linear regression between at least two BMIs was calculated, hence, from at least two medical consultations. Two sub-groups of employees were created based on their number of visits: group 1 included employees who had had at least two visits, and group 2 included those who had had at least four visits. Employees with fewer than 2 visits were excluded from the study. A flow chart of the study population is shown in Figure 1.
Moreover, in order to assess the knowledge and degree of motivation for the management of obesity by CMB doctors, a 10-question questionnaire was created on the SurveyMonkey site (Supplementary Scheme 1). The questionnaire was sent to the 19 CMB doctors and 100% of the doctors replied.
Statistical Analysis
To calculate the rate of change of BMI/year (BMI coefficient) of a given employee, linear regression was applied to the data corresponding to all the visits of the employee. This linear regression aimed to evaluate the BMI change according to the visit dates, making it possible to find the trend in BMI evolution in kg/m2/year for employees with two or more visits. Employees with only one visit had zero linear regression. Being a linear regression using the least squares method with a single explanatory variable, the result is a straight line (y=mx+b) where the parameters of the affine function are given by the following formulae:
(m: rate of change in BMI/year; i: one visit; n: number of visits; Xi: date of visit expressed in years; Yi: BMI of the employee during the visit; : average of visits; : mean BMI).
Continuous demographic variables are expressed as mean ± standard deviation (SD) and range (min-max). Categorical variables are reported as number and percentage. Continuous outcome variables are generally reported as mean ± SD, and range. The Student’s t-test was used to measure the difference between two mean rates of change in BMI/year with different variances. To identify the different factors implicated in the definition of the BMI coefficient, the data were analyzed from different angles: men vs. women; across categories; day work vs. night work; and across BMI groups (underweight, normal, overweight, obese). The following were also considered: men/women and categories; men/women and day/night work; categories and day/night work; men/women, categories, and day/night work. Sectors of activity and exhibitions were studied separately.
A p value <0.05 was considered statistically significant.
3. Results
Study Population
The total number of employees analyzed during the study period was 23,853. Group 1 included 12,433 employees who had had at least two visits and group 2 included 5912 employees who had had at least four visits. The majority of the 12,433 employees identified with two or more visits were women (59%). The main characteristics studied in this patient population are summarized in Table 1.
In the group 1 of employees, mean BMI was 23.5 kg/m2 (range: 15.1–53.7) for women and 24.7 kg/m2 (range: 15.2–55.7) for men, with a mean rate of change in BMI of 0.15 kg/m2/year for women and 0.12 kg/m2/year for men (p<0.05). For employees who had four or more visits (n=5912), mean age was 48.4 years and mean number of visits was 5.6, with a mean time of 1.6 years between two visits. Mean BMI in women was 23.6 kg/m2 vs. 24.8 kg/m2 in men (p<0.05). The mean rate of change in BMI in women was significantly higher than in men (0.14 kg/m2/year vs. 0.11 kg/m2/year; p<0.05). With a mean of 5.6 consultations per employee at the CMB, the mean rate of change in BMI/year was 0.13 (Table 1).
Socio-Professional Categories, Sectors of Activity, and BMI
In both groups of employees, more than half of the population studied belonged to the manager or intermediate categories. The rate of increase in BMI was inversely proportional to the socio-professional category, and this was independent of sex, even if it seemed more marked in women (0.09 kg/m2/year in category A vs. 0.15 kg/m2/year in category D (p<0.05)) (Table 2).
Concerning the different types of occupational exposure, night work and call center duty significantly increased the rate of change in BMI compared to other employees (0.18 vs. 0.13 kg/m2/year and 0.25 vs. 0.13 kg/m2/year; p<0.05). Seventy percent of people who worked in the call center were women, with a significantly higher rate of increase in BMI compared to men (0.3 kg/m2/year vs. 0.12 kg/m2/year; p<0.05). Meanwhile, protective factors were jobs needing professional travel, occupations with imposed time limits, functions with high human responsibility, and jobs with the need to carry heavy loads (Table 3).
Night Work and BMI
Of the total female employee sample with two or more visits (n=7370), only 1.3% were working at night (n=96). In this sub-group, the mean age was 41 years, while it was 45 years among female day workers (p<0.05). The mean rate of change in BMI/year was 0.14 among female day workers (n=7274) vs. 0.29 among night workers (n=96) (p=NS). Among men (n=5063), the proportion of employees working at night was higher (n= 419, 8.2%) with a lesser a priori impact on BMI (0.16vs. 0.12 kg/m2/year for day workers, p=NS).
Among the employees who had four or more visits to the CMB, 5647 employees worked during the day (96%) and 265 employees worked at night (4.5%). On average, day workers had fewer visits than night workers (5.54 vs. 6.13, respectively; p<0.05). Day workers had a significantly lower weight (68.6 kg), a lower average BMI (24.1 kg/m2), and a lower mean rate of change in BMI/year (0.13 kg/m2/year) than night workers (75.2 kg, 25 kg/m2, and 0.18 kg/m2/year; p<0.05). Among women, there were 3579 working day employees and 48 working nights (1.3%). The mean BMI/year change rates were higher among night workers than day workers, but the difference was not significant (0.23 vs. 0.14 kg/m2/year; p>0.05). Among men, there were 2068 employees working during the day and 217 working at night (9.5%). The mean rate of change in BMI/year was higher among night workers than day workers (0.17 vs. 0.10 kg/m2/year; p<0.05) (Figure 2).
Overweight and Obesity Among Employees
In the population of employees with two or more visits, 24% (n=2982) were overweight and 8.5% (n=1052) had obesity, and 24% (n=252) of these had a BMI ≥35 (severe or morbid obesity) (Figure 3). The BMI coefficient was significantly higher for patients with overweight and with obesity (0.19 kg/m2/year vs. 0.11 kg/m2/year for BMI <25; p<0.05). In the sub-group of employees working at night, the rate of increase in BMI was greater than that of day workers, and this difference was accentuated for groups with a BMI >25 kg/m2 (0.22 kg/m2/year vs. 0.16 kg/m2/year for BMI >25; p<0.05). Considering the results by sex, among overweight woman (BMI between 25 and 30 Kg/m2) working at night, the rate of increase in BMI was more than double compared to overweight men working at night (0.45 kg/m2/year vs. 0.19 kg/m2/year).
In the population of employees with four or more visits, 25% of patients had a BMI >25 kg/m2 (n=1483), and 8.7% (n=517) had a BMI >30 kg/m2. In this group of employees, the mean rate of increase in BMI was higher among night workers with overweight and with obesity compared to day workers with the same BMI (0.24 kg/m2/year and 0.48 kg/m2/year vs. 0.17 kg/m2/year and 0.22 kg/m2/year, respectively; p<0.05). Moreover, female employees with overweight showed a significantly higher increase in BMI coefficient than male employees with the same BMI (0.24 vs. 0.11 kg/m2/year; p<0.05.
Online Questionnaire
Concerning the online questionnaire answers, the results showed how the participating occupational medicine doctors were globally aware of the obesity problem. In particular, they almost always calculated the patient’s BMI and discussed with the patient the possible solutions to be undertaken to treat the disease (Supplementary Scheme 1).
Online Questionnaire
Concerning the online questionnaire answers, the results showed how the participating occupational medicine doctors were globally aware of the obesity problem. In particular, they almost always calculated the patient’s BMI and discussed with the patient the possible solutions to be undertaken to treat the disease (Supplementary Scheme 1).
4. Discussion
Multiple studies have already established a correlation between work activity and obesity. In particular, factors such as professional position, occupational stress, night work, and sedentary work can lead to changes in eating behavior, a disorganization of eating patterns, a marked reduction in physical activity, and an alteration of the duration and quality of sleep, which all contribute to weight gain [10,11,12].
The present study focused on the possible correlations between night work and BMI increase. According to many studies, the temporal disorganization induced by the succession of shifts at alternating times has important consequences for the health of the worker, including obesity [13,14]. Alteration of the physiological sleep cycle seems to be one of the possible explanations. In particular, this alteration leads to so-called sleep debt, since daytime sleep following a night shift is on average shorter and of worse quality. In the present cohort of employees, objective data concerning the repercussions of shift work and night work on BMI and the relationship between BMI and the different socio-professional categories were studied. The initial sample of 12,433 employees, with a mean number of occupational health visits of less than four, did not allow us to highlight a significant difference in the rate of BMI variation over time as a correlation of the employees’ time constraints and professional categories. A sub-group of these employees who had undergone at least four visits to occupational medicine was also studied. Since the mean time between two visits was 1.6 years, it was possible to outline more precisely the BMI change patterns and determine the factors underlying these changes. It emerged that night work and call center or switchboard activity (for example, in hotels or hospitals) were associated with a statistically significant rate of increase in BMI.
These results are consistent with other studies regarding the correlation between night work and obesity. Marquezea et al. recorded a BMI coefficient of 0.24 kg/m2/year for night shift nurses, although total daily sleep duration was greater than for day work staff [15]. Rohmer et al. also found a direct correlation between night work and weight gain, even though the motor activity of night work nurses with obesity was higher than those who worked during the day [16]. According to these studies, the weight gain linked to night work would not appear to be linked solely to the amount of sleep or to the physical activity performed; rather, it could depend on much more complex hormonal mechanisms regulated by the circadian rhythm. Concerning this factor, several studies suggest a correlation between the desynchronization of circadian rhythm and alterations in metabolic regulatory network, in particular, lipid homeostatic genes, which could lead to an increase in BMI [17]. Moreover, Scheer et al. discovered in 2009 that a change in the circadian rhythm leads to a decrease in leptin secretion (a hormone involved in the feeling of satiety), and the importance of the decrease was directly linked to the desynchronization duration. This hormonal imbalance, in reducing satiety, could lead to a change in eating behavior for night workers, increasing their tendency to snack [18].
According to the French Agency for Food, Environmental and Occupational Health Safety (ANSES) report, the population involved in night work, whether usual or occasional, has almost doubled in 20 years. In 2012, it represented 15.4% of employees (i.e. 3.5 million people) and this continues to increase [19]. Given the close link between night work and health, night workers are currently subject to enhanced medical monitoring (4.3 visits on average vs. 3.8 for day workers) in the CMB. Our results seem to support this attitude. By stratifying day and night workers according to their BMI, the study demonstrated a significant increase in the BMI coefficient of overweight night workers and especially in workers with obesity (0.24 kg/m2/year vs. 0.48 kg/m2/year among day workers; p<0.05). It can be deduced that in employees who are already overweight or have obesity, a desynchronization of their circadian rhythm would increase the rate of weight gain. These preliminary results could encourage the employer to advise against exercising at night for some of these employees above a critical BMI threshold.
Furthermore, in this population sample of tertiary sector workers in the Paris region, despite the existence of various biases (lifestyle, social status, ethnic origin, age, smoking or alcohol consumption, family history of obesity, diet, and stress level), the results of this study are consistent with the French National Institute of Statistics and Economic Studies (INSEE) report in 2007 [20] that highlighted that the gap between the different social categories with regard to obesity had increased. In the present study, a significantly lower coefficient of increase in BMI was observed in upper-management employees than in supervisors (0.09 vs. 0.15 kg/m2/year). Education level and salary level therefore seem to have a direct consequence on BMI.
In the general population, the prevalence of obesity is higher in women (17.6%) than in men (16.1%). It can be doubled or even tripled in underprivileged areas, particularly among women [1,2]. These results can be partly explained by the different eating behavior of women, less physical activity, successive pregnancies, and/or a higher proportion of women in precarious situations or with sedentary jobs. This phenomenon can be illustrated by considering the employees in the current study declaring on-call duty: 70% of them were women, and the rate of increase in their BMI was significantly higher than that of men (0.12 kg/m2/year vs. 0.3 kg/m2/year; p<0.05). In this study, about 9% of the population studied had obesity (BMI ≥30 kg/m2), and the majority were women, unlike the category of overweight employees (24%), where the majority were men. Female employees with overweight had a significantly higher increase in their BMI coefficient than men (0.24 kg/m2/year vs. 0.11 kg/m2/year). This difference was not recorded for the other BMI categories. For this reason, a therapeutic education program for women at risk of progressing from overweight to obesity would be more than justified, as proposed by Sanguignol et al., to motivate long-term behavior change [21].
This study is based on data collected by occupational physicians who have to evaluate different aspects of employee health. For this reason, a lack of knowledge of the obesity problem and its impact on the quality of work would have reduced the reliability of the data, constituting an important bias in the study. According to the results of the online questionnaire sent to the CMB doctors, it appears that they are generally aware of the problem of obesity. The majority (73.6%) expressed a desire to take care of the affected employees by setting up a specialized care network. In the event of morbid obesity (2% of the initial sample of this study), the doctor should be able to offer the employee multidisciplinary care that could ultimately lead to bariatric surgery.
5. Conclusions
Obesity is influenced by multiple factors, including work-related conditions. This study shows that BMI increases similarly in men and women, but at a faster rate in lower socio-professional categories. Night work and call center duty significantly contribute to weight gain, particularly in employees already overweight or obese. These high-risk individuals should receive targeted support, including psychological, nutritional, and physical coaching. Occupational health programs should systematically track BMI to better identify at-risk employees and justify closer monitoring of night workers.
Supplementary Materials
The following supporting information can be downloaded at the website of this paper posted on Preprints.org.
Author Contributions
AS: AS and SC conceptualized the study and overviewed study methodology. AS performed data curation and formal analysis; AI, performed data visualization and wrote the original draft. AS, AS and SC supervised the study. AI, SC and VZ participated in manuscript writing, reviewing and editing. All authors confirm that they had full access to all the data in the study and accept responsibility to submit for publication.
Funding
There was no funding for this paper.
Ethical Approval
The study was conducted in accordance with the Declaration of Helsinki, and approved by the Ethics Committee of Ramsey Group (protocol code 128/CB-89; 10/29/2022).
Informed Consent Statement
Due to the anonymous nature of the data, patient consent is not required.
Data Availability Statement
Availability of Data: Data collected for the study, including deidentified participant data and a data dictionary defining each field, will be made available to authorized researchers upon request. Data sharing will comply with ethical guidelines for medical research. Types of Data Available: Researchers may access deidentified participant data and the data dictionary defining variables used in the study. No directly identifiable information (e.g., names, social security numbers) will be shared. Additional data sets may be available upon request, subject to regulatory approval. Access Criteria: Data will be shared only with qualified researchers affiliated with recognized institutions.Researchers must submit a formal proposal detailing the intended analyses. Access is subject to approval by an ethics committee and/or CNIL A data access agreement (DAA) must be signed, ensuring compliance with GDPR, data security, and confidentiality rules.
Acknowledgments
The authors thank Mme Sissi Soprani for her role in the data analysis, writing of the paper and production of the Tables and Figures. The authors also thank Newmed Publishing Ltd. for reviewing the paper and English editing.
Conflicts of Interest
Authors state no conflicts of interest.
References
- OMS. Obesity and Overweight. Updated August 20, 2020. Available online: http://www.who.int/mediacentre/factsheets/fs311/fr/ (accessed on 16 April 2025).
- Fontbonne, A.; Currie, A.; Tounian, P.; et al. Prevalence of overweight and obesity in France: the 2020 Obepi-Roche study by the “Ligue Contre l’Obésité.”. J Clin Med 2023, 12, 925. [Google Scholar] [CrossRef] [PubMed]
- Di Angelantonio, E.; Bhupathiraju, S.N.; Wormser, D.; et al. Body-mass index and all-cause mortality: individual-participant-data meta-analysis of 239 prospective studies in four continents. Lancet 2016, 388, 776–786. [Google Scholar] [CrossRef] [PubMed]
- Seravalle, G.; Grassi, G. Obesity and hypertension. Pharmacol Res 2017, 122, 1–7. [Google Scholar] [CrossRef] [PubMed]
- Bray, G.A.; Kim, K.K.; Wilding, J.P.H. Obesity: a chronic relapsing progressive disease process. A position statement of the World Obesity Federation. Obes Rev 2017, 18, 715–723. [Google Scholar] [CrossRef] [PubMed]
- INSERM. Obesitè. Updated November 22, 2019. Available online: https://www.inserm.fr/thematiques/physiopathologie-metabolisme-nutrition/dossiers-d-information/obesite (accessed on 16 April 2025).
- Fitzgerald, S.; Kirby, A.; Murphy, A.; Geaney, F. Obesity, diet quality and absenteeism in a working population. Public Health Nutr 2016, 19, 3287–3295. [Google Scholar] [CrossRef] [PubMed]
- Apovian, C.M. Obesity: definition, comorbidities, causes, and burden. Am J Manag Care 2016, 22, s176–s185. [Google Scholar] [PubMed]
- Haute Autorité de Santé (HAS). Surpoids et obésité de l’adulte: prise en charge de premier recours. September 2011. Available online: www.has-sante.fr/portail/upload/docs/application/pdf/2011-09/2011_09_27_surpoids_obesite_adulte_v5_pao.pdf (accessed on 16 April 2025).
- Saulle, R.; Bernardi, M.; Chiarini, M.; Backhaus, I.; La Torre, G. Shift work, overweight and obesity in health professionals: a systematic review and meta-analysis. Clin Ter 2018, 169, e189–e197. [Google Scholar] [PubMed]
- van den Berge, M.; van der Beek, A.J.; Türkeli, R.; van Kalken, M.; Hulsegge, G. Work-related physical and psychosocial risk factors cluster with obesity, smoking and physical inactivity. Int Arch Occup Environ Health 2021, 94, 741–750. [Google Scholar] [CrossRef] [PubMed]
- Swinburn, B.A.; Sacks, G.; Hall, K.D.; et al. The global obesity pandemic: shaped by global drivers and local environments. Lancet 2011, 378, 804–814. [Google Scholar] [CrossRef] [PubMed]
- Singh, M.; Drake, C.L.; Roehrs, T.; Hudgel, D.W.; Roth, T. The association between obesity and short sleep duration: a population-based study. J Clin Sleep Med 2005, 1, 357–363. [Google Scholar] [CrossRef] [PubMed]
- Taheri, S.; Lin, L.; Austin, D.; Young, T.; Mignot, E. Short sleep duration is associated with reduced leptin, elevated ghrelin, and increased body mass index. PLoS Med 2004, 1, 210–217. [Google Scholar] [CrossRef] [PubMed]
- Marquezea, E.C.; Lemosa, L.C.; Soaresa, N.; Lorenzi-Filhob, G.; Morenoa, C.R.C. Weight gain in relation to night work among nurses. Work 2012, 41 (Suppl. 1), 2043–2048. [Google Scholar] [CrossRef] [PubMed]
- Rohmer, O.; Bonnefond, A.; Muzet, A.; Tassi, P. Sleep-wake cycle, motor activity and eating habits in obese shift workers: a case study of nurses. Trav Hum 2004, 67, 359–377. [Google Scholar] [CrossRef]
- Cho, H.; Zhao, X.; Hatori, M.; et al. Regulation of circadian behavior and metabolism by REV-ERB-α and REV-ERB-β. 2012, 485, 123–127. [Google Scholar] [PubMed]
- Scheer, F.A.J.L.; Hilton, M.F.; Mantzoros, C.S.; Shea, S.A. Adverse metabolic and cardiovascular consequences of circadian misalignment. Proc Natl Acad Sci U S A 2009, 106, 4453–4458. [Google Scholar] [CrossRef] [PubMed]
- Anses. Évaluation des risques sanitaires liés au travail de nuit. June 2016. Available online: https://www.anses.fr/fr/system/files/AP2011SA0088Ra.pdf (accessed on 16 April 2025).
- INSEE. Évolution et structure de la population en 2007. Updated June 30, 2010. Available online: https://www.insee.fr/fr/statistiques/2044737 (accessed on 16 April 2025).
- Sanguignol, F.; Lagger, G.; Golay, A. L’efficacité médico-économique de l’éducation thérapeutique chez des patients obèses. Educ Ther Patient 2009, 1, 57–62. [Google Scholar] [CrossRef]
Figure 1.
Flow chart of the study population.
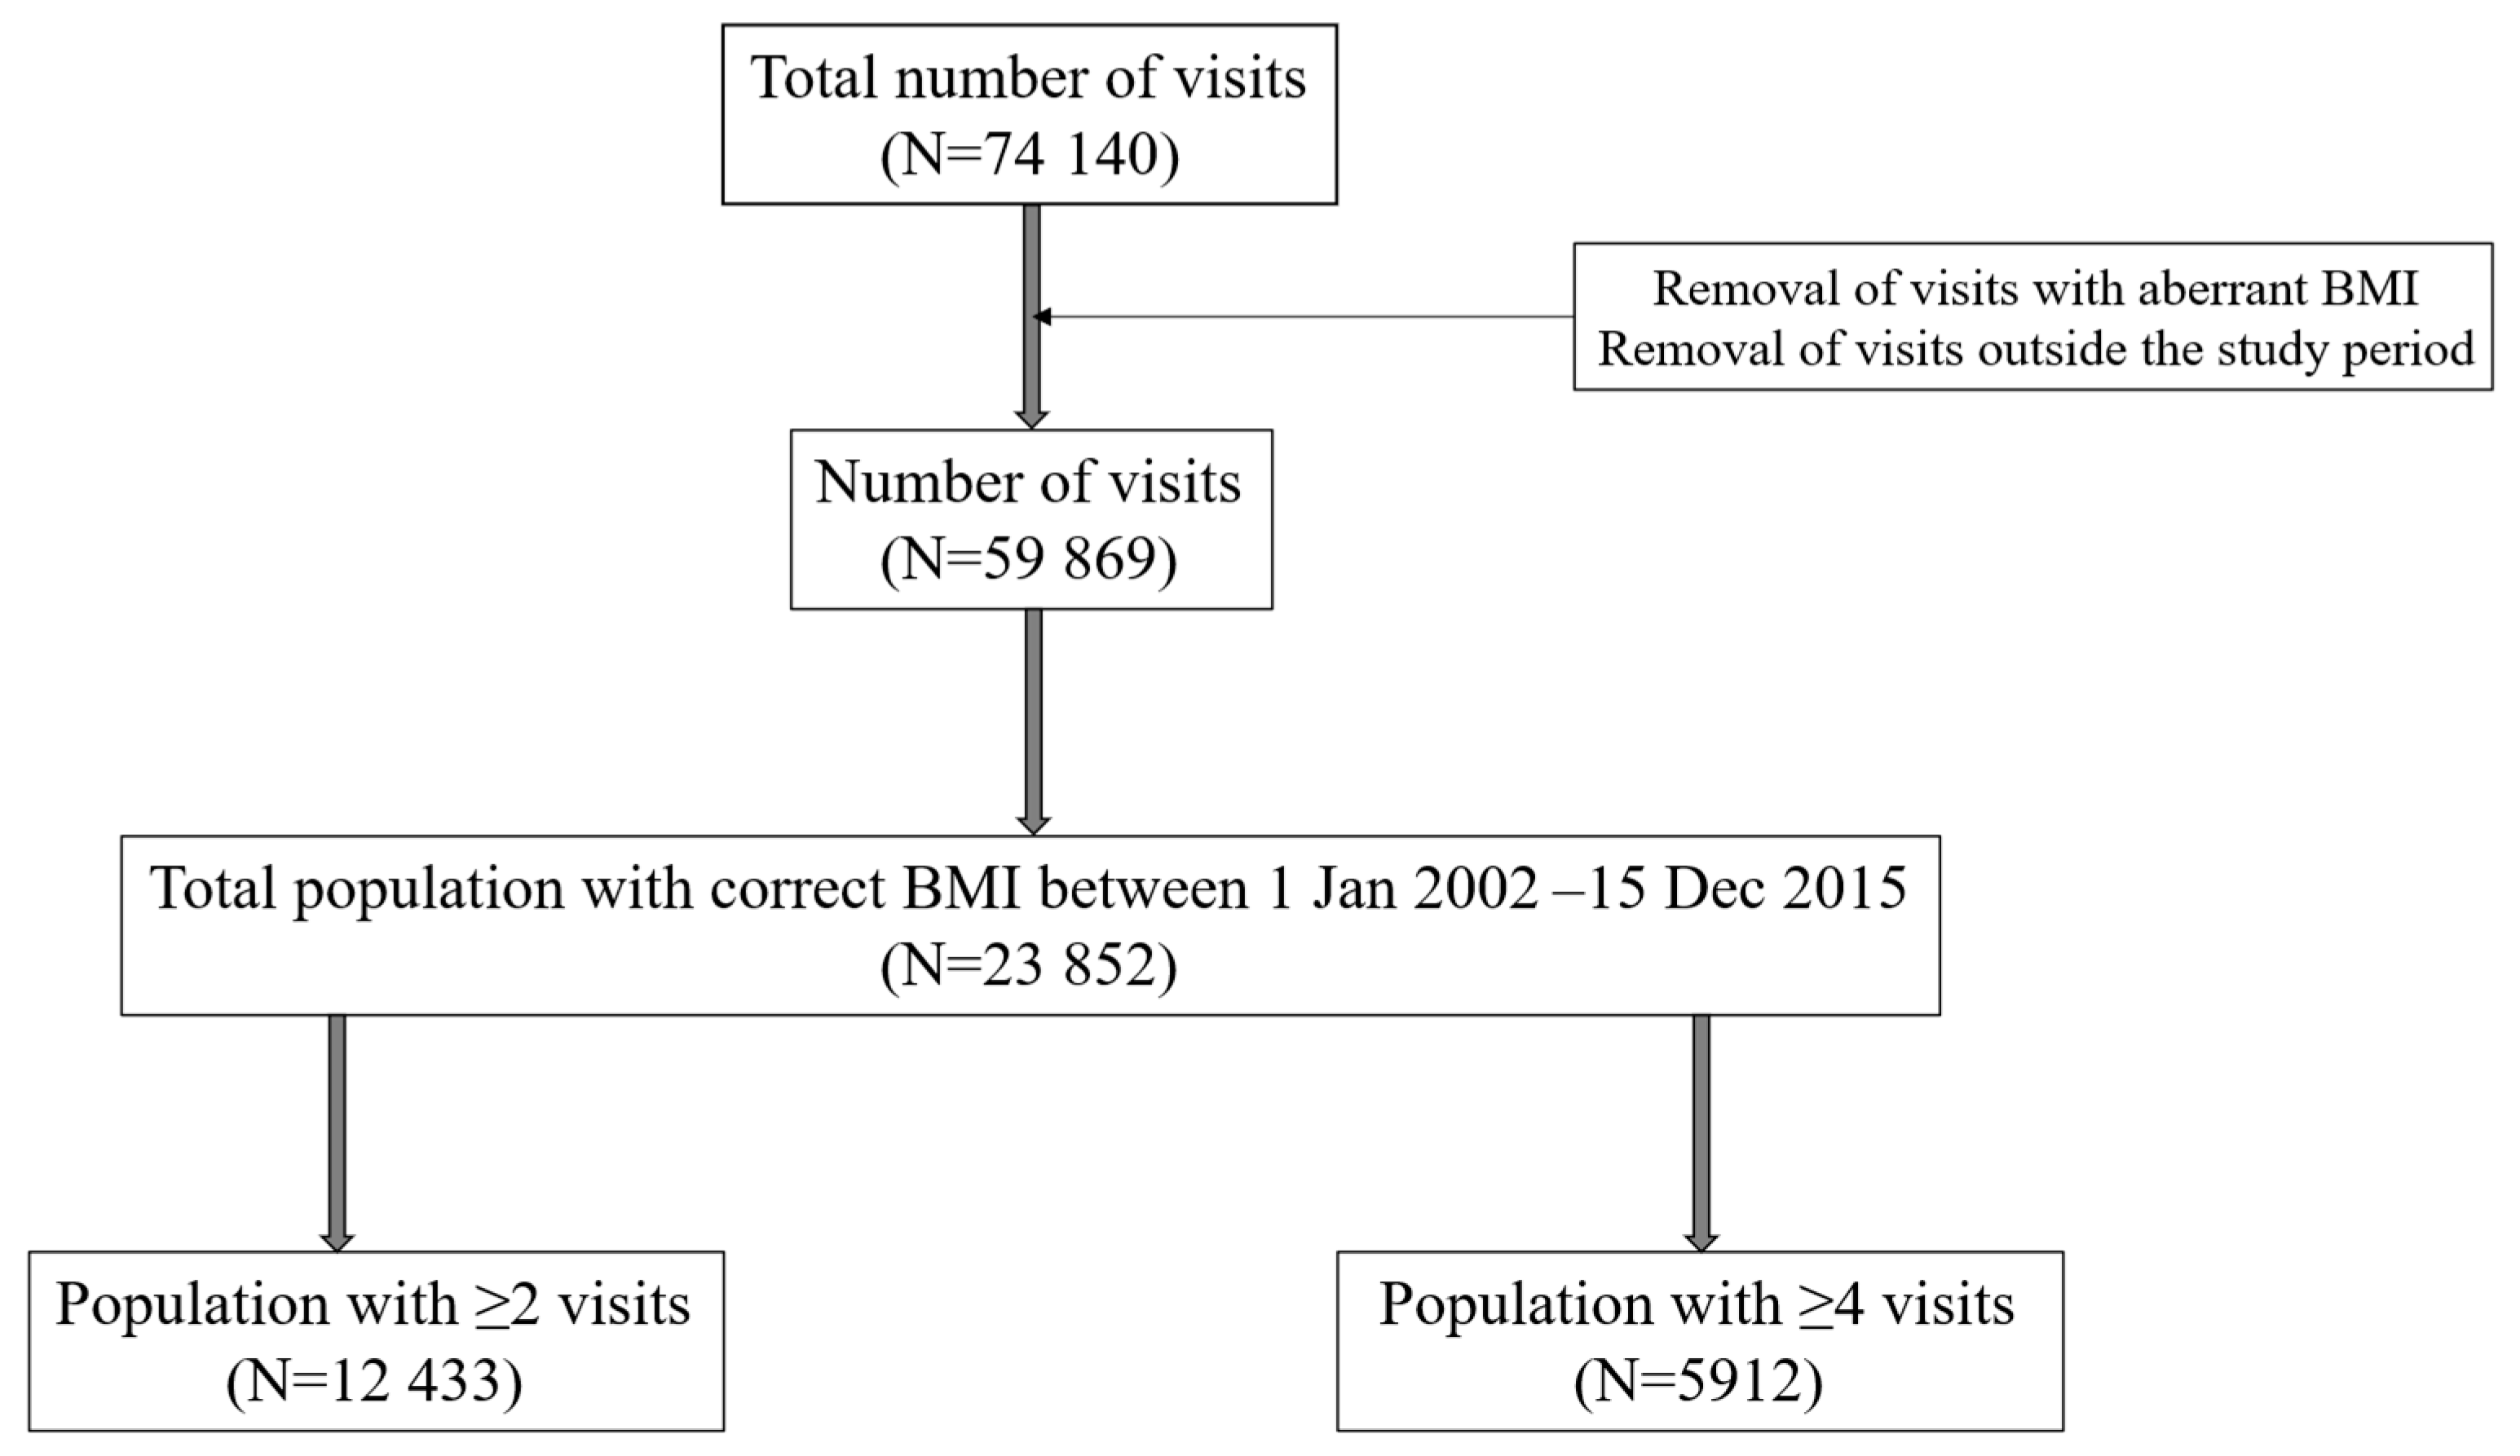
Figure 2.
Mean increase in BMI (kg/m2/year) in day workers vs. night workers having more than four visits to the CMB.
Figure 2.
Mean increase in BMI (kg/m2/year) in day workers vs. night workers having more than four visits to the CMB.
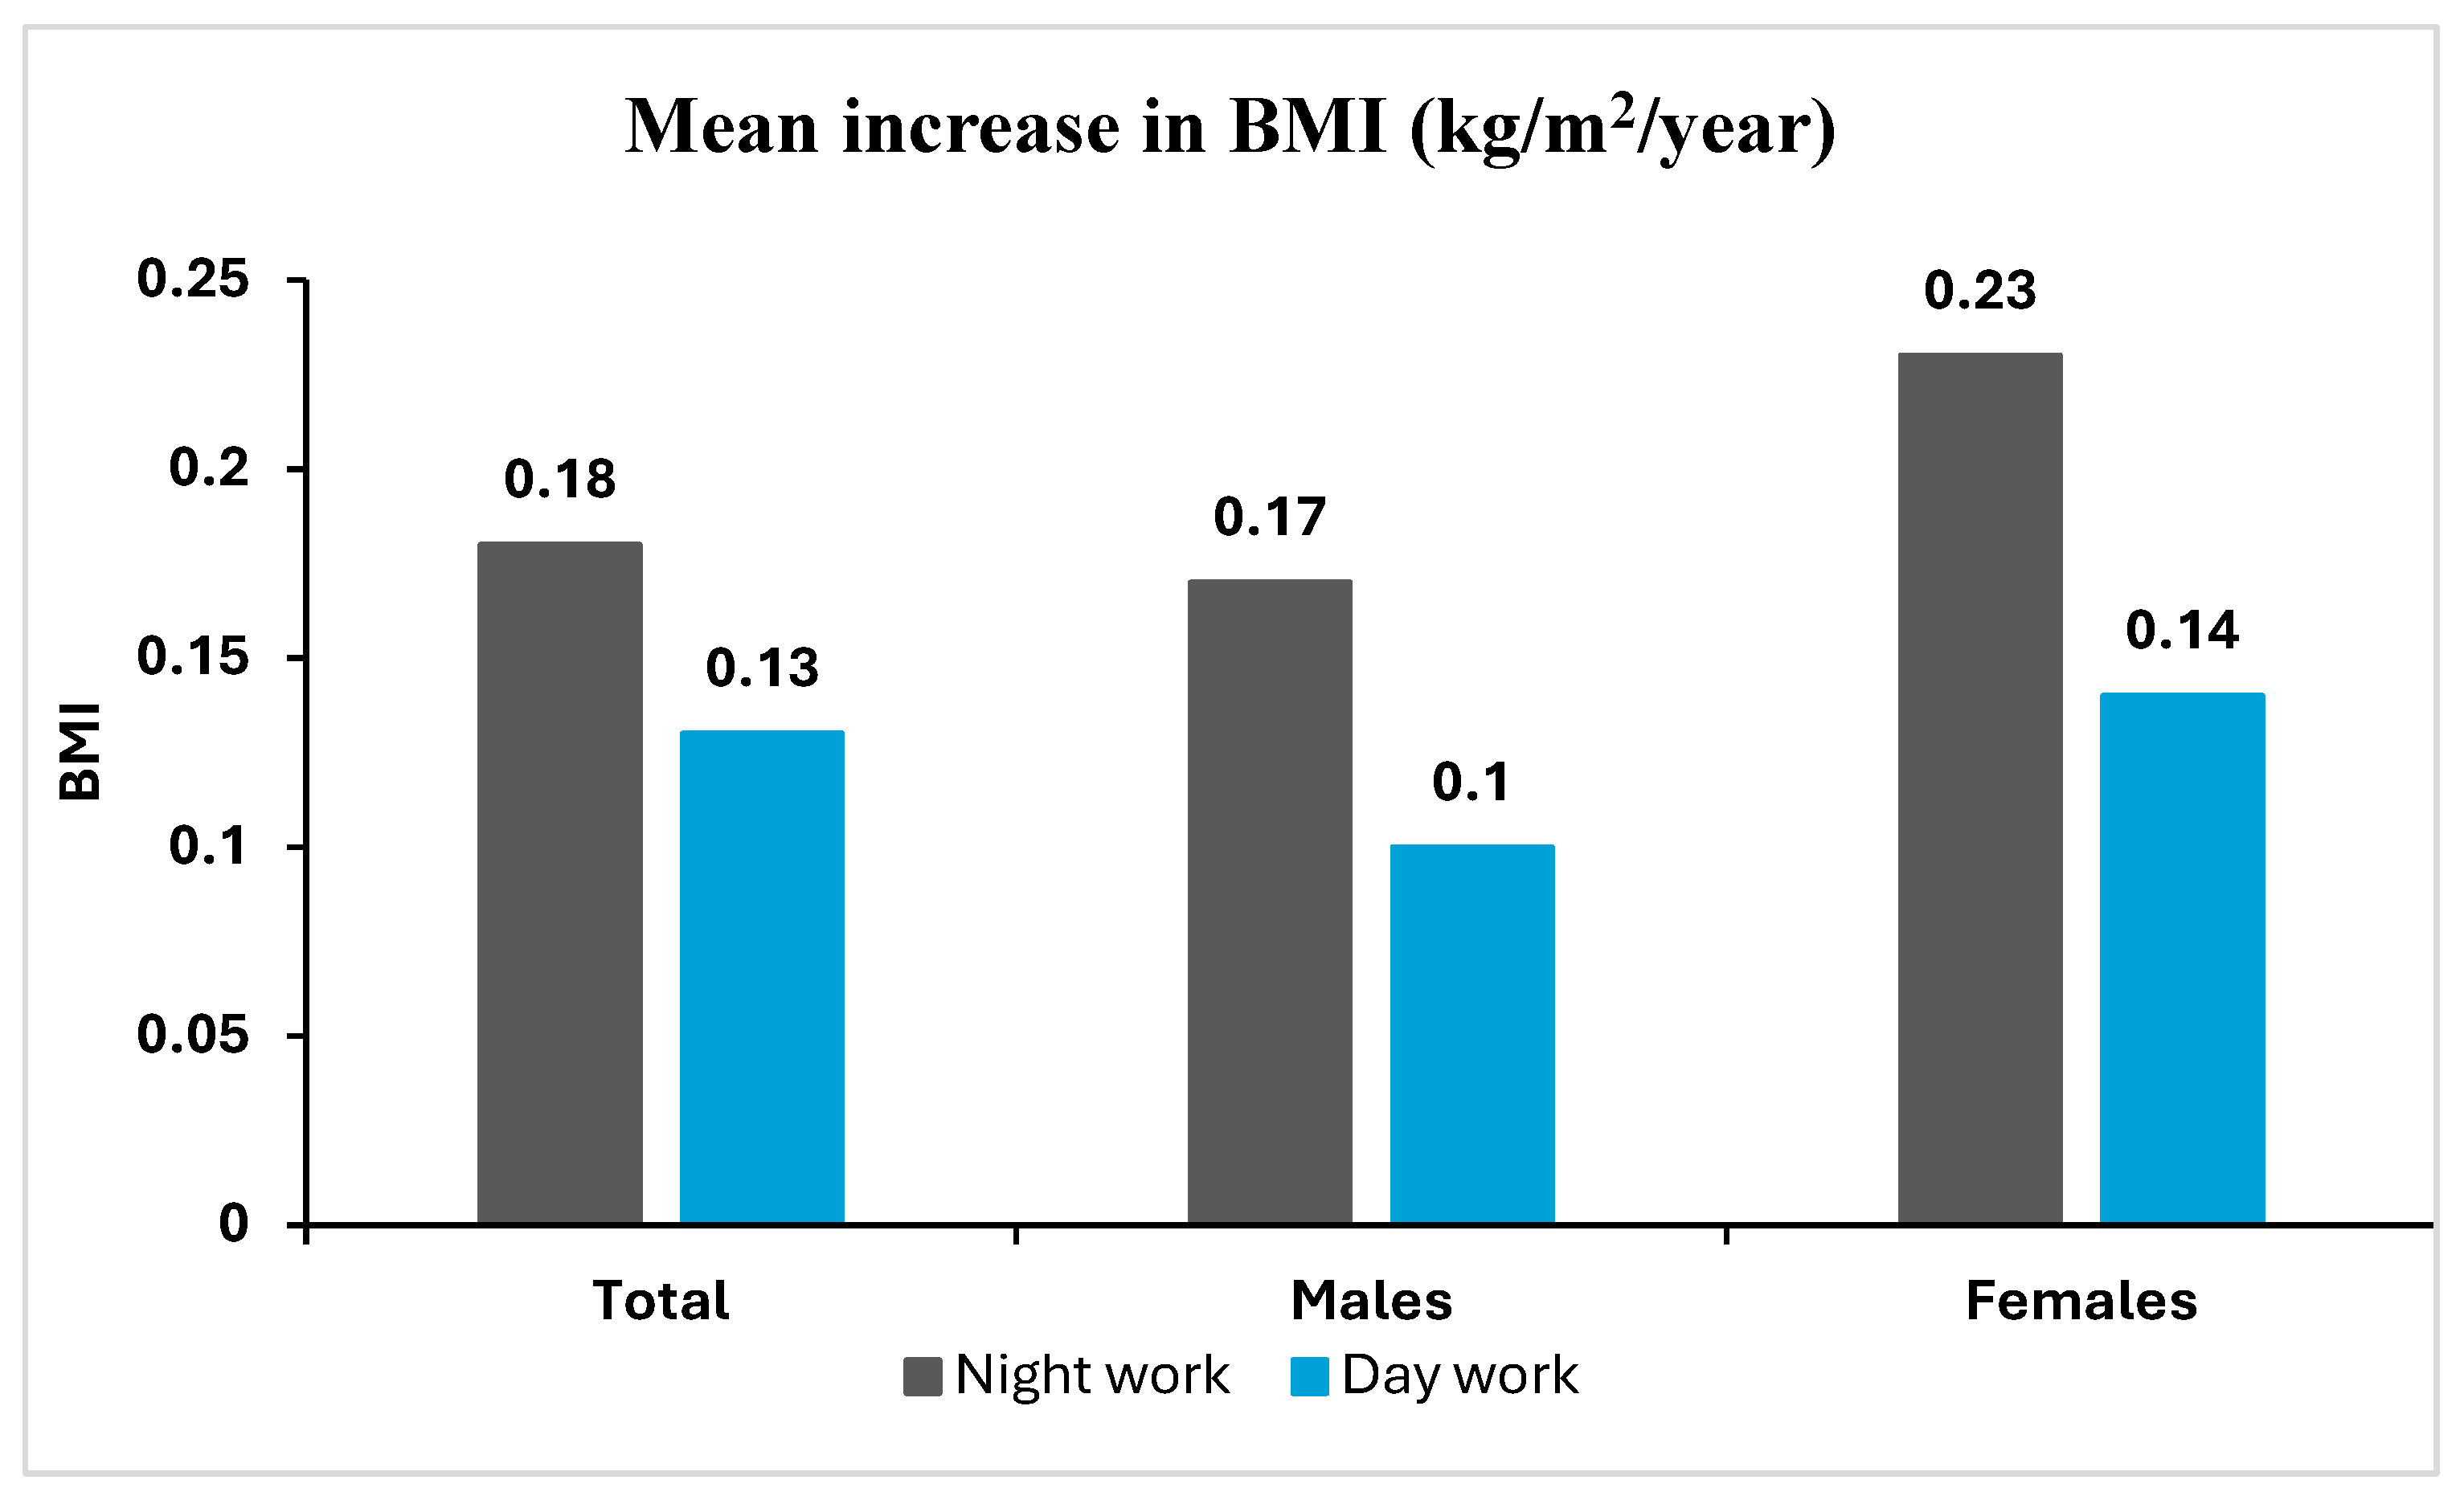
Figure 3.
Proportion of subjects with more than two visits to the CMB in each BMI category.
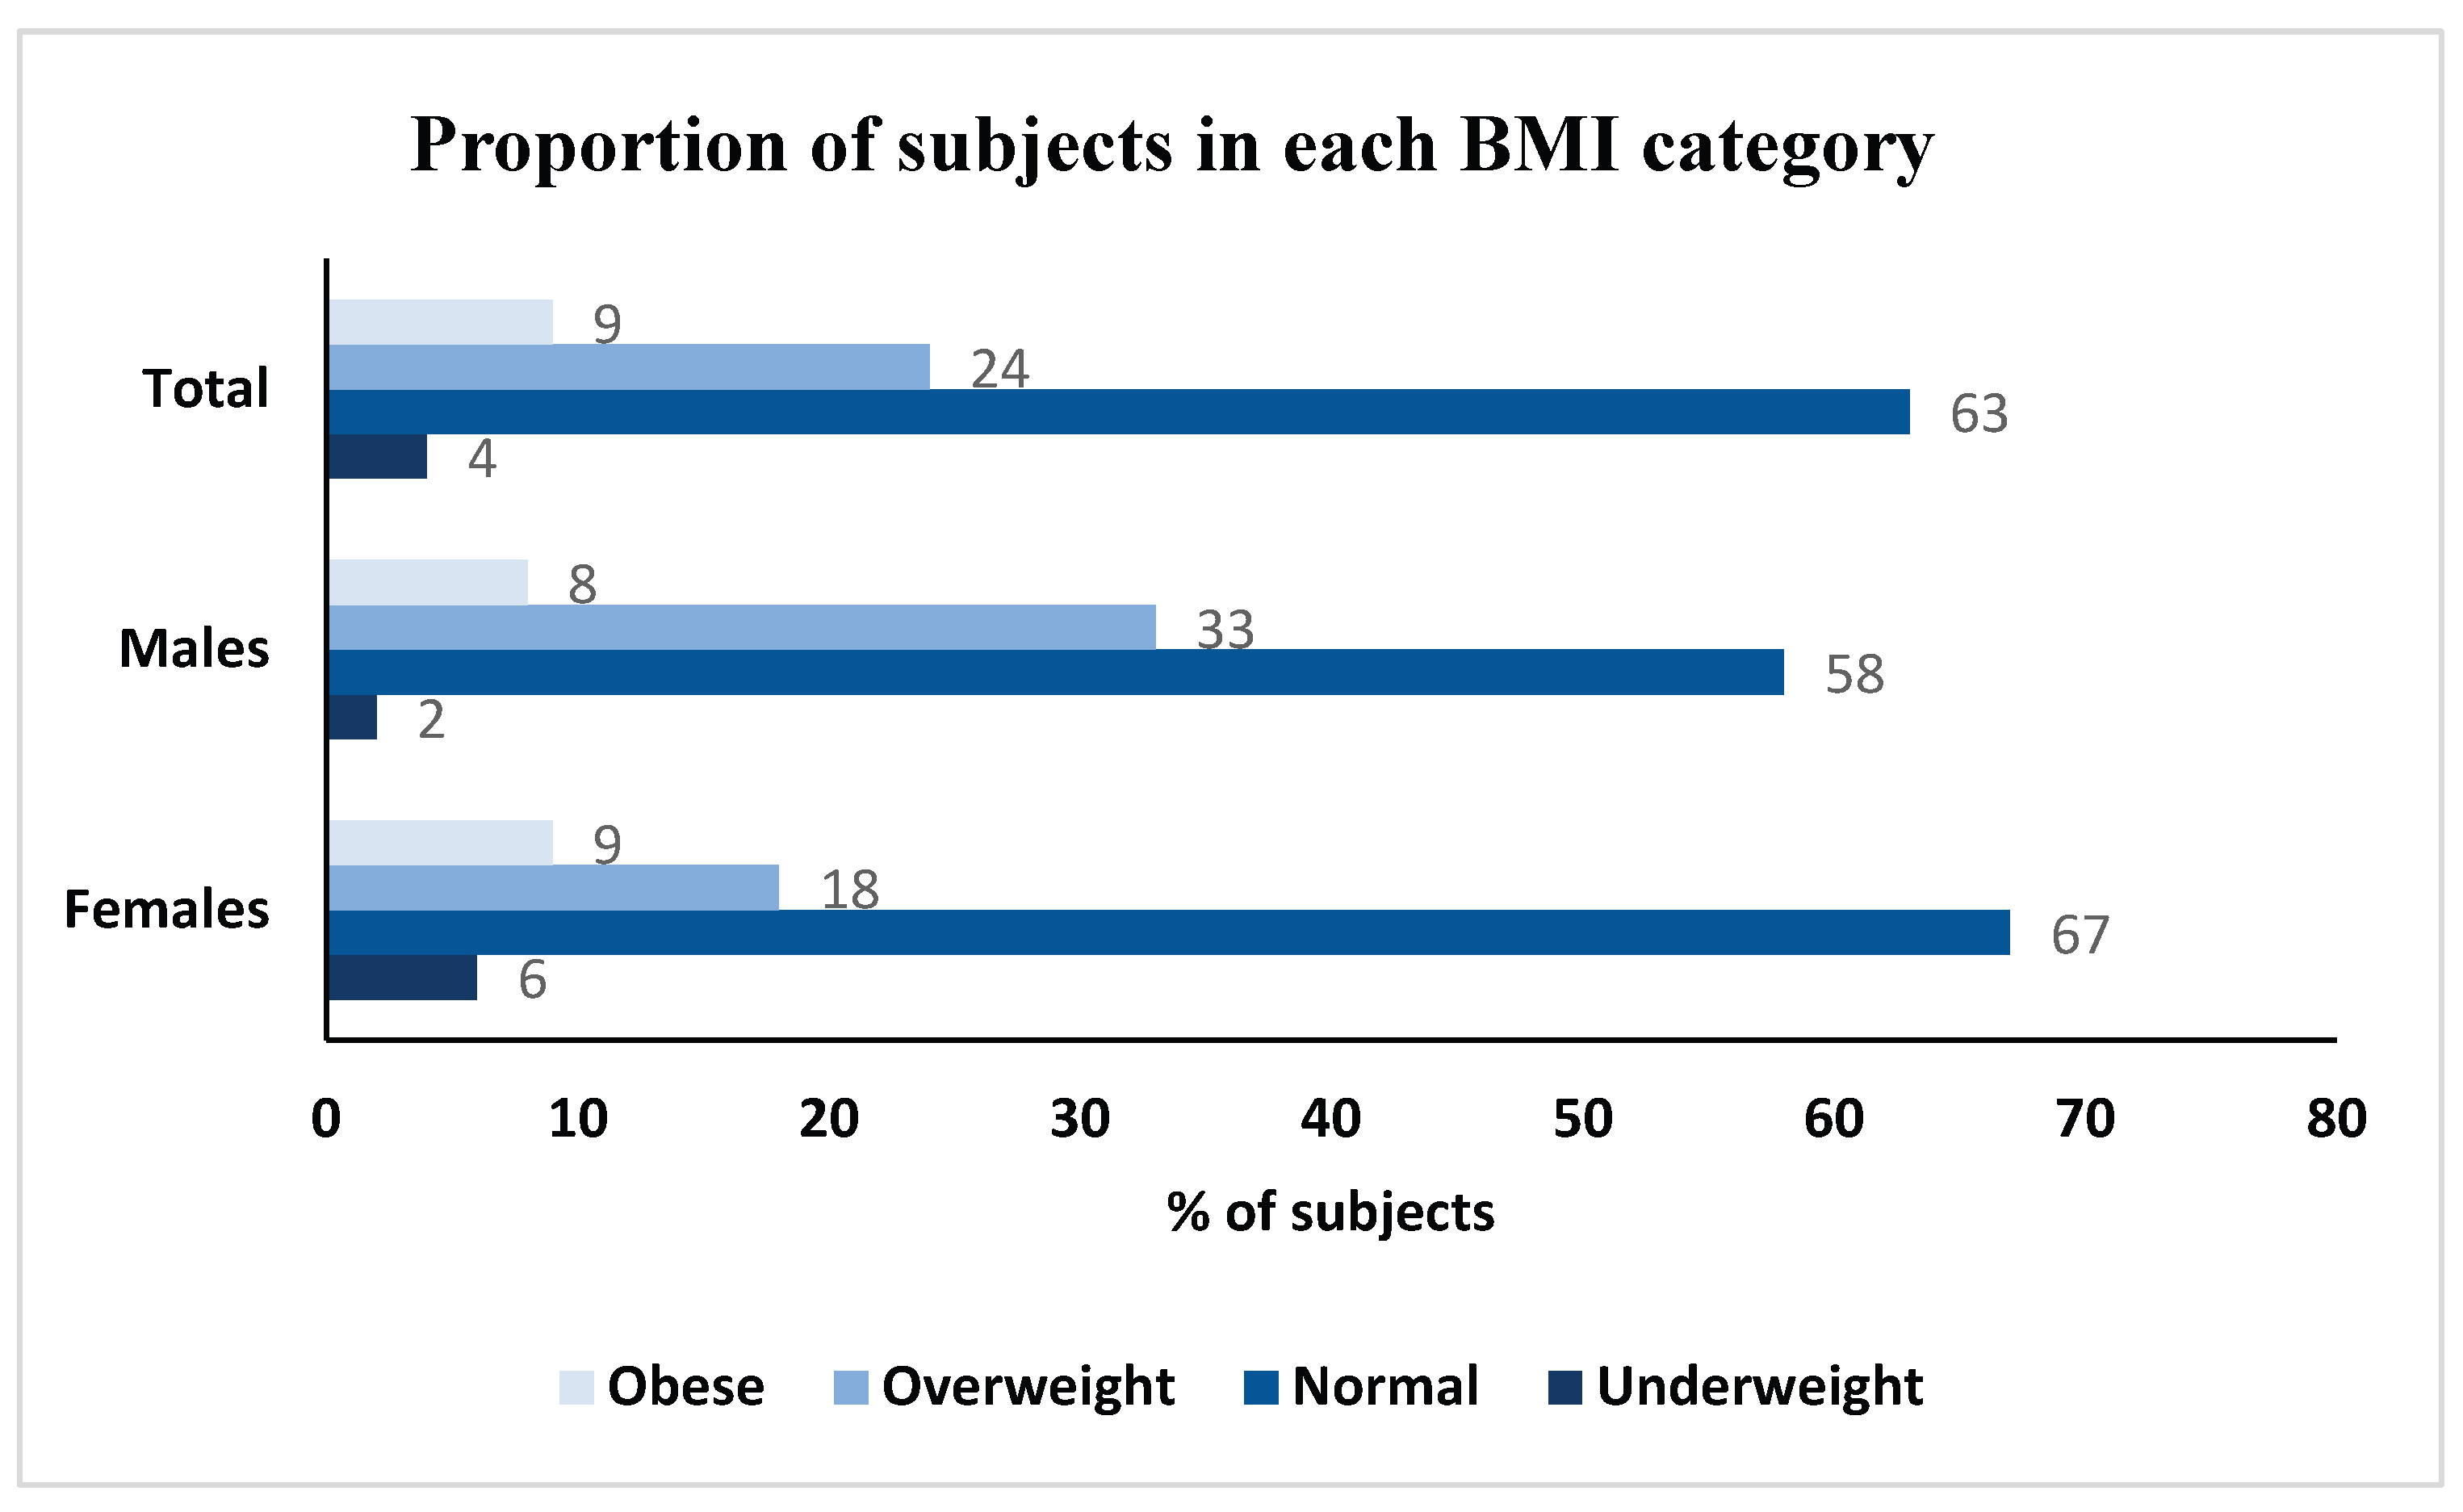

Table 1.
Characteristics of the study population with ≥2 and ≥4 visits to the CMB.
| ≥2 visits to the CMB | ≥4 visits to the CMB | |||||
|---|---|---|---|---|---|---|
| Variable | Females (n=7370) |
Males (n=5063) |
Total (n=12,433) |
Females (n=3627) |
Males (n=2285) |
Total (n=5912) |
| Sex (%) | 59.3 | 40.7 | 100 | 61.3 | 38.7 | 100 |
| Number of visits to the CMB Mean ± SD Range (min–max) |
3.9 ± 1.9 (2.0–19.0) |
3.8 ± 2.0 (2.0–17.0) |
3.9 ± 1.9 (2.0–19.0) |
5.6 ± 1.5 (4.0–19.0) |
5.6 ± 1.6 (4.0–17.0) |
5.6 ± 1.5 (4.0–19.0) |
| Age at first visit (years) Mean ± SD Range (min-max) |
45.5 ± 10.1 (16.0–79.0) |
45.2 ± 10.3 (17.0–82.0) |
45.4 ± 10.2 (16.0–82.0) |
48.2 ± 9.0 (26.0–79.0) |
48.6 ± 9.1 (18.0–76.0) |
48.4 ± 9.1 (18.0–79.0) |
| BMI (kg/m2) Mean ± SD Range (min–max) |
23.5 ± 4.5 (15.1–53.7) |
24.7 ± 3.6 (15.2–55.7) |
24.0 ± 4.2 (15.1–55.7) |
23.6 ± 4.4 (15.6–49.7) |
24.8 ± 3.6 (15.2–55.7) |
24.1 ± 4.2 (15.2–55.7) |
| Rate of increase of BMI (kg/m2/year) * Mean ± SD Range (min–max) |
0.15 ± 0.8 (-15.73 – 22.16) |
0.12 ± 0.5 (-5.11 – 5.51) |
0.14 ± 0.7 (-15.73 – 22.16) |
0.14 ± 0.4 (-3.59 – 3.03) |
0.11 ± 0.3 (-3.12 – 1.72) |
0.13 ± 0.4 (-3.59– 3.03) |
*p value females vs. males: p<0.05 for ≥2 visits and p<0.05 for ≥4 visits.
Table 2.
Weight gain according to socio-professional category (≥4 visits to the CMB).
| Variable | Category A |
Category B |
Category C |
Category D |
P value | Total |
|---|---|---|---|---|---|---|
| Category (%) | 8.0 | 40.0 | 34.0 | 18.0 | 100 | |
| Number of visits with measured BMI Mean ± SD Range (min–max) |
5.3 ± 1.5 (4–13) |
5.4 ± 1.4 (4–12) |
5.6 ± 1.5 (4–17) |
5.9 ± 1.8 (4–19) |
<0.05 |
5.6 ± 1.6 (4–19) |
| Age at first visit (years) Mean ± SD Range (min-max) |
52.6 ± 7.8 (29.0–71.0) |
47.3 ± 8.9 (26.0–76.0) |
47.9 ± 8.9 (27.0–78.0) |
49.8 ± 9.3 (18.0–79.0) |
<0.05 |
48.4 ± 9.1 (18.0–79.0) |
| BMI (kg/m2) Mean ± SD Range (min–max) |
24.3 ± 3.8 (17.2–39.7) |
23.7 ± 4.0 (15.6–49.7) |
23.9 ± 4.3 (15.8–48.6) |
25.0 ± 4.3 (15.2–55.7) |
B vs. D <0.05 A vs. D <0.05 |
24.1 ± 4.2 (15.2–55.7) |
| Rate of increase of BMI (kg/m2/year) * Mean ± SD Range (min–max) |
0.09 ± 0.33 (-1.81 – 3.03) |
0.12 ± 0.33 (-3.59 – 2.18) |
0.13 ± 0.38 (-31.2–2.98) |
0.15 ± 0.37 (-31.5–2.26) |
A vs. D <0.05 |
0.13 ± 0.36 (-3.59–3.03) |
A: senior executive; B: executive; C: intermediate; D: staff with low qualifications.
Table 3.
List of occupations significantly associated with weight gain or protective occupations.
| Occupation | Mean rate of BMI increase/ (kg/m2/year) |
p value | |
|---|---|---|---|
| Exposure | Rest of the population | ||
| Night work | 0.18 | 0.13 | <0.05 |
| Telephone-based work | 0.25 | 0.13 | <0.05 |
| Professional travel | 0.10 | 0.13 | <0.05 |
| Work with time constraints | 0.0 | 0.13 | <0.05 |
| Carrying heavy loads | -0.04 | 0.13 | <0.05 |
| Jobs with human responsibility | 0.06 | 0.13 | <0.05 |
p values in bold indicate risk factors for weight gain.
Disclaimer/Publisher’s Note: The statements, opinions and data contained in all publications are solely those of the individual author(s) and contributor(s) and not of MDPI and/or the editor(s). MDPI and/or the editor(s) disclaim responsibility for any injury to people or property resulting from any ideas, methods, instructions or products referred to in the content. |
© 2025 by the authors. Licensee MDPI, Basel, Switzerland. This article is an open access article distributed under the terms and conditions of the Creative Commons Attribution (CC BY) license (https://creativecommons.org/licenses/by/4.0/).
Copyright: This open access article is published under a Creative Commons CC BY 4.0 license, which permit the free download, distribution, and reuse, provided that the author and preprint are cited in any reuse.


