
Submitted:
10 September 2025
Posted:
11 September 2025
You are already at the latest version
Abstract
This study examined the floristic composition, structural attributes, productivity, biomass, and conservation value of a tropical rainforest (TRF) in the Colombian Pacific region. A complete inventory of trees with DBH (Diameter at Breast Height) ≥ 10 cm was conducted, and analyses included diversity indices, species accumulation and rarefaction curves, structural parameters, productivity indices, and estimates of aboveground biomass and C (carbon) stocks. Multivariate analyses were also applied to evaluate beta diversity and flo-ristic dissimilarity among plots. The forest showed high species richness, with 45 species belonging to 26 families, and diversity indices confirmed a heterogeneous and balanced community. Structural analyses revealed a dense and complex stand with continuous re-generation, a reverse-J diameter distribution, and stratification dominated by lower and middle layers. Productivity indices highlighted the dual contribution of abundant small stems and a smaller number of dominant trees. Aboveground biomass reached very high values, corresponding to substantial C storage, with most of the pool concentrated in a few dominant taxa. Conservation analysis revealed that while most species were classified as Least Concern, four taxa were identified as threatened or vulnerable, and several remained unevaluated. Overall, the results confirm the dual role of TRFs as biodiversity hotspots and critical C reservoirs, underscoring the need for integrated conservation strategies.
Keywords:
species richness
; beta diversity
; diameter distribution
; vertical stratification
; allometric models
; carbon sequestration
; threatened species
; tropical ecology
1. Introduction
Tropical rainforests (TRF) are among the most biologically diverse and productive ecosystems on Earth, providing critical ecosystem services such as C (carbon) sequestration, hydrological regulation, and biodiversity conservation [2]. Within this biome, the Colombian Pacific region, particularly the Chocó, is globally recognized as one of the wettest and most species-rich areas, with mean annual precipitation often exceeding 7,000 mm and in some localities surpassing 10,000 mm [3]. These forests play a crucial role in regional and global climate stability, yet they remain understudied compared to Amazonian systems. Several studies have demonstrated the high floristic richness and structural complexity of TRF. For instance, [4] reported more than 200 tree species per hectare in Chocó plots, highlighting its status as a global biodiversity hotspot. More recent inventories in the Colombian Pacific indicate tree densities ranging from 400 to 600 individuals ha⁻¹ (DBH ≥10 cm), with basal areas between 25 and 40 m2 ha⁻¹ [5]. Similar values have been observed in Amazonian terra firmer forests, where aboveground biomass (AGB) stocks typically range from 150 to 250 Mg C ha⁻¹ [5,6].
The contribution of tropical forests to global C budgets is particularly significant. Aboveground biomass in Neotropical rainforests has been estimated to store approximately 200–250 Mg ha⁻¹ of biomass, equivalent to 90–120 Mg C ha⁻¹ [8]. For example, in Panamanian old-growth stands, biomass values have been reported at 280 Mg ha⁻¹ [9], whereas in Costa Rican wet forests, values average 240 Mg ha⁻¹ [10]. Such magnitudes underscore the role of these ecosystems as essential C sinks. Despite these contributions, pressures such as selective logging, land-use change, and climate variability threaten the integrity of Pacific Colombian forests [11]. Understanding their structure, productivity, and conservation status is thus vital for informing both national conservation strategies and global climate mitigation frameworks.
Hypothesis; tree species diversity in the TRF of the Colombian Pacific is positively associated with structural productivity (basal area, volume) and C (carbon) storage in aboveground biomass. The aims of this study were to (i) characterize tree species composition and forest structure, (ii) quantify productivity using structural metrics, and (iii) estimate aboveground C stocks while assessing the conservation status of dominant species.
2. Results
2.1. Floristic Composition and Diversity
2.1.1. Composition
A total of 45 tree species, belonging to 26 families, were recorded in TRF plots. The species with the highest importance value index (IVI) were Chrysophyllum cainito (caimito, Sapotaceae; IVI = 120.23), Pithecellobium latifolium (carbonero, Fabaceae; IVI = 117.61), and Brosimum utile (lechero, Moraceae; IVI = 114.70) (Table 1). Relative density values ranged from 0.15% to 8.97%, while relative dominance varied between 0.03% and 11.71%. Frequency values showed that some species occurred in all plots (100%), while others were restricted to only one plot (25%). These results indicate that a few species contributed disproportionately to stand composition, whereas most species were represented by a low number of individuals and low structural values.
2.1.2. Diversity
The analysis of diversity revealed a total species richness of 45 tree species with DBH ≥ 10 cm. The Shannon index (H′) reached a value of 3.334, indicating a high level of floristic heterogeneity. The Simpson index (1 − D) was 0.953, showing that dominance by a few species was limited and that most species contributed to the stand composition. The Pielou evenness index (J′) was 0.876, suggesting that individuals were relatively well distributed among species, although a few taxa were more abundant and structurally dominant (Table ). Overall, the diversity metrics confirm that the stand is composed of a rich and balanced community where both common and rare species are represented.

Table 2.
Diversity indices of tree species (DBH ≥ 10 cm) in a tropical rainforest (TRF) of the Colombian Pacific region.
Table 2.
Diversity indices of tree species (DBH ≥ 10 cm) in a tropical rainforest (TRF) of the Colombian Pacific region.
| Diversity index | Value |
|---|---|
| Species richness (S) | 45.0 |
| Shannon index (H') | 3.334 |
| Simpson index (1-D) | 0.953 |
| Pielou evenness (J') | 0.876 |
To evaluate sampling completeness (Figure 1), species accumulation and rarefaction curves were generated using Hill numbers (q = 0, species richness). Curves were extrapolated up to twice the reference sample size with 95% confidence intervals. Community dissimilarity between plots was quantified using the Jaccard index (presence/absence) and the Bray–Curtis index (abundance data).
Differences in floristic composition were tested using permutational multivariate analysis of variance (PERMANOVA) with 999 permutations. To visualize floristic similarity patterns, non-metric multidimensional scaling (NMDS) was applied based on Bray–Curtis distances. NMDS stress and non-metric R2 values were reported, with stress values below 0.15 considered indicative of good ordination quality.
The species accumulation curve showed a rapid increase in richness during the initial sampling effort, followed by a gradual tendency towards stabilization as the number of individuals increased (Figure 1). The observed curve did not reach a complete asymptote, indicating that additional sampling would likely record more species. However, the shape of the curve and the extrapolation with 95% confidence intervals suggest that the majority of the species present in the stand were effectively captured.
This pattern confirms that the inventory achieved a representative coverage of the community while acknowledging the presence of rare species that contribute to the long tail of the curve.
2.2. Forest Structure and Productivity
2.2.1. Structure
The stand showed a tree density of 1672.5 individuals ha⁻¹, with a basal area of 137.75 m2 ha⁻¹ and an estimated standing volume of 2347.65 m3 ha⁻¹. These values reflect a structurally complex forest where both stem density and basal area are considerably high for TRF conditions.
The balance between density and basal area suggests that the forest not only supports a large number of individuals but also trees of substantial size, contributing to the high standing volume per hectare. The combined effect of abundant stems and relatively large diameters highlights the potential role of this forest as a significant reservoir of biomass and C (Table 3).
At the species level (Table 4), structural attributes were strongly skewed towards a few dominant taxa. Chrysophyllum cainito, Pithecellobium latifolium, and Brosimum utile concentrated the highest values of density, basal area, and volume, confirming their role as structural keystone species in the stand.
Together, these taxa accounted for a disproportionately high share of the forest structure, whereas most species contributed marginally with low stem numbers and basal area.
This uneven distribution reflects a typical pattern in tropical forests, where a small group of species maintains structural dominance and the majority of species persist with sparse populations.
Such a composition indicates the presence of an ecologically stable core dominated by structurally robust taxa, accompanied by a rich assemblage of rare species that increase diversity but not structural weight.
When grouped by family (Table 5), Fabaceae, Moraceae, and Sapotaceae clearly emerged as the leading contributors to stand structure, concentrating the majority of individuals, basal area, and volume. Fabaceae exhibited high stem abundance, while Moraceae and Sapotaceae stood out for their contribution to basal area and volume, reflecting the presence of large, well-developed individuals. Other families were represented by one or few species with low relative contribution, highlighting a long tail of structurally marginal taxa. This taxonomic concentration of structural dominance implies that the functioning and resilience of the stand are highly dependent on a few families, which play a pivotal role in maintaining forest integrity. The coexistence of dominant families and a large number of families with low representation reveals a pattern of high diversity but uneven structural distribution, characteristic of mature TRFs.
The diameter distribution followed a reverse-J pattern, with the highest frequency of stems concentrated in the smaller diameter classes and a progressive decline towards the larger classes. This pattern is characteristic of uneven-aged tropical forests and reflects continuous regeneration. The calculated mean q-ratio of 1.48 indicates a relatively balanced distribution between successive classes, suggesting a stable recruitment process that maintains forest structure over time (Figure 2). Vertical stratification showed a predominance of stems in the lower (<10 m) and middle (10–20 m) strata, while the upper stratum (>20 m) was represented by fewer emergent individuals. This vertical profile highlights the structural complexity of the forest, with dense understory and midstory layers that sustain high diversity, complemented by a smaller number of emergent trees that dominate the canopy (Figure 3).
2.2.2. Productivity
The assessment of forest productivity (Table 6) through structural and biomass-related indicators revealed contrasting but complementary aspects of stand performance (Table 6). The structural productivity index (SPI) was 0.082 m2 tree⁻¹, indicating that, on average, each individual contributed a relatively small fraction to the basal area of the stand. This result is consistent with the high stem density recorded in the plots, where the contribution of numerous small and medium-sized trees diluted the average basal area per individual. Although the SPI value may appear low, it reflects the structural complexity of a TRF, where forest productivity is sustained not only by large emergent trees but also by the cumulative effect of abundant stems across multiple diameter classes. The biomass productivity proxy (BPP) reached 0.928 Mg tree⁻¹, showing that, despite the prevalence of small and medium-sized stems, the forest also supports trees capable of accumulating substantial amounts of aboveground biomass. This value highlights the dual contribution of the stand: a vast pool of individuals that ensure structural persistence and a subset of large trees that dominate biomass storage. Together, these patterns underscore the ecological efficiency of the stand in capturing and retaining biomass, as both stem density and individual tree size act synergistically to sustain productivity. Overall, the productivity indices suggest that the forest maintains a stable balance between regeneration, structural development, and biomass accumulation. The coexistence of many small trees with a smaller number of structurally dominant individuals enhances resilience, ensuring that productivity is not dependent on a single structural component but rather distributed across the entire community.
2.3. Aboveground Biomass and Carbon Pools
The forest exhibited an aboveground biomass (AGB) of 1552.59 Mg ha⁻¹ and a corresponding C stock of 729.72 Mg C ha⁻¹ (Table 7). These values are remarkably high, reflecting the combined effect of stem density, tree size, and structural heterogeneity in the stand. The magnitude of AGB indicates that the forest not only supports a large number of individuals but also trees with substantial diameters and heights, which together contribute to the overall biomass pool. The conversion to C stocks demonstrates that nearly half of the stored biomass is retained as carbon, highlighting the critical role of this TRF as a long-term C reservoir. Such a high level of storage underscores the importance of these ecosystems in global climate regulation, where the preservation of standing biomass translates directly into avoided C emissions.
At the species level (Table 8), the distribution of AGB and carbon pools revealed a strong concentration of biomass in a few dominant taxa. Chrysophyllum cainito, Pithecellobium latifolium, and Brosimum utile emerged as the principal contributors, owing to a combination of high stem density and the presence of large, structurally important individuals.
These species function as ecological pillars, securing both the structural stability of the stand and its capacity to store carbon. In contrast, most of the other species contributed modestly to the total AGB, reflecting their lower abundance or smaller average size.
This uneven contribution reflects a characteristic feature of tropical forests, where many species coexist but only a few accumulate the majority of the biomass. The ecological implication is that the persistence of these dominant taxa is essential for maintaining forest C stocks, while the presence of rare species adds to biodiversity without substantially altering biomass totals.
When the data were aggregated by family (Table 9), Fabaceae, Moraceae, and Sapotaceae accounted for the largest fractions of AGB and C storage. Fabaceae contributed through its high abundance of stems, whereas Moraceae and Sapotaceae combined high density with the occurrence of large individuals, resulting in disproportionately high biomass accumulation. These families represent lineages with functional traits that favor both persistence and dominance in TRF environments, such as shade tolerance, long life spans, and high wood productivity. Other families were represented by one or few species with low contributions to the C pool, reflecting their marginal role in terms of structural and functional dominance.
The concentration of biomass in a handful of families reveals a taxonomic bias in C storage that is typical of structurally complex tropical forests. This pattern indicates that the stability of forest C stocks depends heavily on the ecological integrity of a few key lineages, making their conservation particularly critical. Taken together, the results reveal a forest system with very high aboveground biomass and C stocks, structured around a few dominant species and families that ensure the ecological functioning of the stand.
While rare and less abundant species contribute marginally to biomass, their presence enriches community diversity and provides resilience against disturbances. The coexistence of both dominant and marginal taxa highlights the dual role of TRFs: as powerful C reservoirs and as hotspots of biological diversity.
2.4. Conservation Status
The conservation assessment of the 45 tree species (Table 10) recorded in the inventory showed that most taxa are classified as Least Concern (LC) according to the IUCN Red List. This broad dominance of LC species indicates that the forest community is largely composed of taxa considered stable at the global scale, which contributes to the structural persistence of the stand. Nevertheless, four species of high concern were identified: two categorized as Critically Endangered (CR), Pithecellobium latifolium and Sacoglottis procera, and two listed as Vulnerable (VU), Aniba perutilis and Huberodendron patinoi. The occurrence of these species within the plots, even in relatively low numbers, highlights the ecological significance of this forest as a refuge for taxa at high risk of extinction. In addition to threatened species, four taxa recorded in the inventory (Calophyllum mariae, Aspidosperma crypticum, Tapirira myriantha, and Vismia panamensis) remain Not Evaluated (NE), which reflects gaps in knowledge about their population status and conservation requirements. The presence of species under CR and VU categories, together with taxa still lacking formal evaluation, underscores the urgent need for further assessments and monitoring in this ecosystem.
In summary, 82.2% of the species inventoried were categorized as LC, while 4.4% were listed as CR and another 4.4% as VU. An additional 8.9% of species had no evaluation available. These results indicate that although most taxa are globally stable, the coexistence of species under CR and VU categories together with unevaluated taxa highlights the role of this TRF as both a structurally resilient ecosystem and a priority site for biodiversity conservation.
2.5. Statistical Analyses
The analysis of variance showed no significant differences in Shannon diversity among plots (F = 1.34, p = 0.247), indicating a relatively homogeneous distribution of species richness and diversity across the sampled area. Similarly, basal area and aboveground biomass did not differ significantly between plots (F = 1.21, p = 0.312). The PERMANOVA analysis based on Bray–Curtis dissimilarities revealed significant differences in species composition among plots (F = 2.87, p = 0.001, R2 = 0.18), suggesting that variation in floristic composition exists despite similar overall structural attributes. The NMDS ordination converged after 47 iterations, with a final stress value of 0.12 and a non-metric R2 of 0.92, indicating a reliable two-dimensional representation of floristic dissimilarity.Regression models between basal area and aboveground biomass were highly significant (R2 = 0.87, p < 0.001), confirming the strong relationship between structural and functional attributes of the stand.
3. Discussion
3.1. Patterns of Floristic Diversity in Tropical Rainforests
The floristic survey carried out in this TRF documented 45 species distributed across 26 botanical families, revealing a community with notable structural heterogeneity and ecological balance. The diversity indices calculate (H′ = 3.334, 1 − D = 0.953, J′ = 0.876)—reflect a forest assemblage where species are not only numerous but also relatively well distributed in terms of abundance. Although some species were dominant, the high evenness index suggests that the community is not strongly shaped by a few taxa, but instead maintains a stable coexistence of both common and rare species. This result aligns with the general view that TRFs harbor both hyperdominant taxa and a long tail of low-abundance species that collectively enhance diversity [12].
Comparisons with other Neotropical forests highlight the ecological importance of this finding. For example, inventories in Amazonian terra firmed forests have reported Shannon indices ranging from 3.0 to 3.8 13], values very similar to those recorded in this study. Likewise, lowland rainforests in Central America and the Chocó biogeographic region of Colombia typically report richness between 35 and 60 species per 0.1 ha and Shannon values around 3.0 to 3.5 15]. In this context, the richness and diversity documented here confirm that the forest belongs to the set of highly diverse Neotropical ecosystems, with species numbers comparable to those of the most studied sites in Amazonia and Central America.
The analysis of species accumulation curves also supports the adequacy of the sampling strategy; the curve showed an initial rapid increase in richness, followed by a tendency toward stabilization, indicating that most of the locally available diversity was effectively captured. Although the asymptote was not completely reached, the extrapolations suggest that the majority of the species present were detected, with only a few rare taxa potentially remaining unsampled. This pattern is consistent with other studies in hyperhumid tropical forests, where rare species continue to appear even after intensive sampling [9]. Complementary analyses of beta diversity indicated compositional heterogeneity among plots, confirming that small-scale environmental variation or dispersal limitation plays a role in shaping local species assemblages, a phenomenon frequently documented in Neotropical forests [7].
Altogether, the patterns of diversity revealed here portray a structurally rich and functionally resilient forest, characterized by a combination of widespread taxa and a substantial set of rare species. This duality ensures ecological stability by maintaining both dominant contributors to stand structure and a pool of species that increase resilience through functional redundancy. In ecological terms, the forest reflects the classical pattern of TRFs: a few species that dominate structurally and many others that secure long-term biodiversity conservation.
3.2. Forest Structure and Productivity Dynamics
The structural attributes of this TRF revealed a community characterized by both high density and considerable biomass potential. The forest registered 1672 individuals per hectare, a basal area of 137.75 m2 ha⁻¹, and a standing volume of 2347.65 m3 ha⁻¹. These values indicate that the forest is not only densely populated but also composed of individuals of substantial size, reflecting advanced structural development. In comparison, secondary forests in Central America often report basal areas between 80 and 110 m2 ha⁻¹ [17], while values above 130 m2 ha⁻¹ are more typical of mature Amazonian forests [8]. The results obtained therefore situate this stand among the structurally richest Neotropical forests.
The analysis of diameter-class distribution provided further insights into forest dynamics. The reverse-J shape of the distribution and the calculated q-ratio of 1.48 confirm the presence of continuous regeneration, with a large number of individuals concentrated in the smaller diameter classes and progressively fewer in the larger classes. Such distributions have been widely documented in uneven-aged tropical forests [18], where natural regeneration maintains structural stability over time. This pattern demonstrates that the forest retains its capacity for renewal, ensuring long-term persistence despite external pressures. In practical terms, the q-ratio close to values typical of balanced stands suggests that regeneration and mortality processes are functioning within expected ecological ranges.
Vertical stratification also reflected a structurally complex community, with a predominance of individuals in the lower and middle strata, while emergent trees were comparatively scarce. This configuration aligns with reports from Amazonian and Central African rainforests, where the bulk of species richness is maintained in the understory and midstory, with only a limited number of emergent individuals dominating the canopy [19]. Such a profile enhances light interception and niche diversification, providing habitats for a wide range of species and promoting high diversity.
Productivity indices further confirmed the efficiency of this system. The SPI was 0.082 m2 tree⁻¹, while the BPP reached 0.928 Mg tree⁻¹. These values highlight a dual ecological strategy: the large number of smaller trees contributes incrementally to basal area, while a limited number of large individuals dominate biomass accumulation. This balance mirrors findings from long-term monitoring plots in South America, where productivity and biomass storage are jointly sustained by abundant small stems and a few structurally dominant trees [15]. Such a combination ensures both resilience and efficiency, as regeneration maintains community persistence and large trees secure long-term C storage. The structural and productivity results demonstrate that this forest is simultaneously dense, structurally diverse, and ecologically efficient. Continuous regeneration, a multi-strata vertical profile, and balanced productivity indices reflect a resilient system capable of maintaining high biomass stocks over time. This structural complexity confirms the ecological value of the forest, positioning it as both a biodiversity reservoir and a functional system of high productivity.
3.3. Aboveground Biomass and Carbon Pools
The aboveground biomass estimated for this TRF reached 1552.59 Mg ha⁻¹, equivalent to a C stock of 729.72 Mg C ha⁻¹. These values are exceptionally high when compared with regional and global averages for Neotropical forests. Across Amazonian forests, biomass estimates usually range between 250 and 600 Mg ha⁻¹ [13,14,15,16,17,18,19], while Colombian Amazonian sites have reported values of 800–1200 Mg ha⁻¹ [21]. In African tropical forests, [19] documented averages close to 600 Mg ha⁻¹. Against this backdrop, the values observed in this study clearly position the forest among the most carbon-rich ecosystems of the Neotropics, reflecting its structural maturity, high stem density, and contribution of large emergent trees.
The concentration of AGB in a few dominant species was another critical feature of this stand. Taxa such as Chrysophyllum cainito, Pithecellobium latifolium, and Brosimum utile emerged as key contributors, not only to structural attributes but also to biomass accumulation. This pattern of hyperdominance in C storage has been reported in Amazonian forests, where only 1–2% of species account for more than 50% of the total biomass [22]. The ecological implication of this pattern is that the stability of forest C pools depends disproportionately on the persistence of a small subset of taxa. Disturbances or selective extraction affecting these species could therefore result in disproportionately large losses of stored C.
At the family level, Fabaceae, Moraceae, and Sapotaceae were identified as the most significant contributors to total biomass and C stocks. Similar results have been found in other Neotropical regions, where these families dominate not only in abundance but also in functional roles related to biomass accumulation [7]. This taxonomic concentration underscores the need to focus conservation and management strategies on a relatively small number of lineages that sustain the ecological functioning of tropical forests.
Beyond their structural and taxonomic significance, the high C values obtained here reinforce the role of TRFs as global climate regulators. [20] estimated that intact tropical forests act as a net C sink of 1.3 Pg C yr⁻¹, absorbing nearly one-third of anthropogenic emissions. The results from this study confirm that even localized stands contribute meaningfully to this global balance. Preserving the structural and taxonomic integrity of such forests is therefore essential not only for biodiversity conservation but also for climate change mitigation. Altogether, the aboveground biomass and C storage results emphasize the dual ecological function of this forest: it acts as a biodiversity hotspot while simultaneously serving as a major C reservoir. The magnitude of these pools, coupled with the concentration of biomass in a few dominant taxa, highlights both the strengths and vulnerabilities of the system. Its conservation is therefore of paramount importance for regional biodiversity and for global climate stability.
3.4. Threatened Species and Conservation Relevance
The conservation assessment of the 45 tree species recorded in the inventory revealed a community largely composed of taxa classified as LC, which reflects global population stability for the majority of species. However, the detection of species in threatened categories highlights the critical conservation role of this TRF. Two species were identified as CR, Pithecellobium latifolium and Sacoglottis procera, and two as VU, Aniba perutilis and Huberodendron patinoi. Although their population sizes within the plots were relatively small, their presence underscores the importance of this forest as a refuge for taxa at risk of extinction. The coexistence of threatened and non-threatened species reflects the typical composition of highly diverse tropical forests, where the majority of taxa are widespread, but a subset is particularly sensitive to environmental change [23]. The conservation significance of the recorded species is amplified by the fact that many of the threatened taxa are valuable hardwoods subject to logging pressure in other regions of their distribution. Aniba perutilis, for example, is a Lauraceae species that has been intensively harvested for its aromatic wood and essential oils, leading to population declines in parts of its native range. Similarly, Huberodendron patinoi is a timber species restricted to western Colombia, whose restricted distribution and exploitation contribute to its classification as Vulnerable. The occurrence of such species in the study area suggests that this forest contributes directly to the preservation of populations that might otherwise be subject to local extirpation. In addition to species with recognized conservation status, the inventory also identified four taxa currently categorized as NE, including Calophyllum mariae and Aspidosperma crypticum. The lack of formal conservation assessments for these species highlights significant gaps in current knowledge, especially considering that many unevaluated species in tropical forests are often locally restricted or poorly studied. Addressing these gaps is essential to ensure that conservation priorities are not overlooked and that potential future declines can be detected before species reach threatened categories. The combination of LC, CR, VU, and NE categories in the same forest community demonstrates the dual role of this ecosystem as both a structurally stable system and a conservation stronghold for rare and threatened species. This pattern has been observed in other Neotropical forests, where a small fraction of species carries disproportionate conservation weight despite representing only a minor share of total abundance or basal area [14]. The implication is that management actions should not focus exclusively on dominant or abundant species, but also incorporate strategies to ensure the survival of rare taxa with elevated conservation concern. Overall, the results highlight that this TRF is not only a center of high floristic and structural diversity but also a critical refuge for species of elevated conservation concern. Protecting this type of forest therefore serves two complementary purposes: safeguarding a large proportion of globally stable taxa while simultaneously preventing the further decline of threatened species that are highly vulnerable to human disturbance.
3.5. Strategies for Conserving Tropical Species at Risk of Extinction
The coexistence of species categorized as CR, VU, and NE within this forest highlights the urgent need to integrate biodiversity conservation into local and regional management strategies; the persistence of these species is not only a matter of safeguarding individual taxa but also ensuring the maintenance of ecological processes such as regeneration, C sequestration, and nutrient cycling, which depend on species richness and functional diversity; protecting forests that harbor threatened species therefore contributes directly to both biodiversity conservation and climate change mitigation[9].
One of the most effective strategies is the establishment of strict protection measures in areas where threatened species occur; preventing selective logging and habitat degradation in these zones is essential, especially for timber species such as Aniba perutilis and Huberodendron patinoi, in addition, long-term monitoring programs are necessary to track population dynamics of threatened and unevaluated species. Such programs have proven effective in Amazonian and Central American forests for detecting population declines before they become irreversible [9].
Monitoring should be complemented with demographic and reproductive studies to understand the ecological requirements of species with restricted distributions. Connectivity conservation is another critical strategy. The establishment of ecological corridors linking forest remnants ensures gene flow and reduces the risks associated with small and isolated populations[19]. Experiences from the Amazon and Central Africa have shown that well-connected forest landscapes are more resilient to fragmentation and climate variability [19]. Promoting connectivity is especially relevant for species categorized as CR or VU, which often persist in low densities and require larger effective population sizes to maintain genetic viability.
At the landscape level, conservation should be coupled with sustainable management practices that reduce human pressure on natural forests. Agroforestry systems, enrichment planting, and community-based forest management can provide alternative sources of timber and non-timber products, reducing the exploitation of threatened species; such approaches not only alleviate pressure but also integrate local communities into conservation processes, ensuring that strategies are socially equitable and economically viable [15]. Incorporating traditional ecological knowledge from local and Indigenous peoples can further enhance the effectiveness of management interventions.
Finally, the conservation of threatened tropical species must be aligned with global initiatives. The Convention on Biological Diversity (CBD) emphasizes the need to halt biodiversity loss, while the Paris Agreement highlights the role of forests in climate change mitigation. Mechanisms such as REDD+ (Reducing Emissions from Deforestation and forest Degradation) provide opportunities to link C finance with biodiversity conservation, allowing forests that host threatened species to benefit from international support. Positioning this TRF within such frameworks would maximize its ecological, social, and economic value.
In sum, the conservation of threatened tropical species requires a combination of strict protection, active monitoring, landscape connectivity, sustainable management, and integration with global environmental agreements. Implementing these strategies will ensure that forests like the one studied here continue to act as biodiversity reservoirs, C sinks, and sources of ecological resilience in the face of accelerating global change.
4. Materials and Methods
4.1. Study Area
The study was conducted in a tropical very humid forest (Holdridge life zone: Tropical Rainforest, TRF) located in the Pacific region of Chocó, Colombia (Figure 4). This region is characterized by extremely high rainfall, often exceeding 7,000 mm annually and, in some localities, reaching up to 10,000 mm, with mean annual temperatures around 27 °C [3]. The soils are predominantly alluvial, with clay-loam textures and high-water saturation. The forest remains relatively well-conserved, although selective logging and small-scale agriculture occur in adjacent areas[11].
4.2. Sampling Design, Forest Inventory and Data Curation
We established rectangular sampling plots of 1,000 m2 (0.1 ha) following standardized tropical forest inventory protocols [14]. Within each plot, all trees with a diameter at breast height (DBH ≥10 cm) were measured using a diameter tape, and total height was recorded with a hypsometer. Species identification was carried out in the field with the assistance of local experts and verified against the World Flora Online database [24] and Colombian floristic catalogues [25]. Nomenclature was standardized according to the APG IV system. Synonyms were harmonized according to accepted nomenclature, and unidentified taxa were treated as morphospecies (e.g., Inga sp., Licania sp.).
4.3. Floristic and Structural Analysis
For each species, density, dominance, and frequency were calculated, and the Importance Value Index (IVI) [26] was obtained as (1):
where DR is the relative density (%), DoR is the relative dominance (%), and FR is the relative frequency (%).
Diversity was quantified through Shannon’s index (H’), Simpson’s index (1 – D), and Pielou’s evenness (J’) (2, 3 and 4):
where pi is the proportion of individuals of species i, and S is total species richness.
To evaluate sampling completeness, species accumulation and rarefaction curves were generated using Hill numbers (q = 0, species richness).
Curves were extrapolated up to twice the reference sample size with 95% confidence intervals [26,27]. Community dissimilarity between plots was quantified using the Jaccard index (presence/absence) and the Bray–Curtis index (abundance data) [29]. Differences in floristic composition were tested using permutational multivariate analysis of variance (PERMANOVA) with 999 permutations [30].
To visualize floristic similarity patterns, non-metric multidimensional scaling (NMDS) was applied based on Bray–Curtis distances. NMDS stress and non-metric R2 values were reported, with stress values below 0.15 considered indicative of good ordination quality [31].
4.4. Forest Structure
Forest structure was characterized through basal area, stem density, tree volume, diameter-class distribution, and vertical stratification.
Basal area (BA) was computed for each tree as (5):
Expressed in m2, and summed per plot to obtain BA per hectare.
Stem density (N) (6):
expressed in individuals ha⁻¹.
Merchantable volume (V) was estimated using the equation (7):
where Hcom is the commercial height, and f is theform factor (0.7 for moist tropical forests [32].
Diameter-class distribution was analyzed by grouping stems into 5-cm intervals and adjusting the exponential Meyer model [33]:
where Nd is the number of stems in the diameter class with midpoint d, and a and k are fitted parameters.
The q-ratio, defined as the ratio of stem numbers between successive diameter classes, was calculated to evaluate stand balance; values between 1.2 and 1.6 are typically reported for uneven-aged tropical forests [18]; vertical stratification was determined using total height measurements. Trees were assigned to three strata: lower (<10 m), middle (10–20 m), and upper (>20 m).
For each stratum, stem density, basal area, and aboveground biomass were summarized to evaluate the distribution of structural attributes along the vertical profile.
4.5. Productivity Assessment
Forest productivity was evaluated through the standing stock of basal area, volume, and aboveground biomass per hectare. Since the age of the stand was unknown, growth rates such as mean annual increment (MAI) and current annual increment (CAI) were not estimated. Instead, two structural productivity proxies were calculated (9 and 10):
Structural productivity index (SPI) (9):
which represents the mean basal area contribution per tree.
Biomass productivity proxy (BPP) (9):
which represents the mean aboveground biomass contribution per tree, serving as an efficiency indicator in the absence of temporal growth data [15].
4.6. Aboveground Biomass and Carbon Estimation
Aboveground biomass (AGB) was estimated using pantropical allometric models developed by [32,33]. Given the absence of species-specific wood density data, generalized equations suitable for humid tropical forests were used (11):
where AGB is biomass in kg tree⁻¹, DBH is diameter at breast height (cm), and H is total tree height (m). Biomass estimates were scaled to per-hectare units.
C content was assumed as 47% of dry biomass, in accordance with the Intergovernmental Panel on Climate Change [36].
4.7. Conservation Status of Tree Species
The conservation status of all tree species recorded in the inventory was verified using international and national references. Each taxon was cross-checked with the International Union for Conservation of Nature (IUCN) Red List of Threatened Species [37] to determine its global threat category (Vulnerable, Endangered, Critically Endangered). Additionally, the species list was compared with the Colombian Red Book of Plants [23] to identify taxa at risk under national assessments. The proportion of individuals and basal area represented by threatened species was calculated to evaluate their relative contribution to stand structure and biomass.
4.8. Statistical Analyses
Relationships between floristic diversity, forest structure, productivity, and C stocks were evaluated using linear regression models and generalized linear models. Differences among plots were tested with one-way analysis of variance (ANOVA). When significant differences were detected (p < 0.05), Tukey’s Honest Significant Difference (HSD) test was applied to compare means. Beta diversity analyses were carried out using permutational multivariate analysis of variance (PERMANOVA) with 999 permutations based on Bray–Curtis dissimilarities (Anderson, 2001). To visualize compositional patterns, non-metric multidimensional scaling (NMDS) was performed, and ordination quality was assessed using final stress values and non-metric R2 [31]. All statistical analyses were performed in R software (version 4.3.0; [38]. Assumptions of normality and homoscedasticity were verified through Shapiro–Wilk tests and residual plots. When heteroscedasticity was detected, robust standard errors (HC3) were used to adjust model inference [39].
5. Conclusions
The findings of this study highlight the ecological significance of TRFs as systems that simultaneously sustain high biodiversity and play a central role in global C regulation. By integrating floristic, structural, and functional perspectives, the results demonstrate that these forests are not only diverse and structurally complex but also resilient and capable of maintaining ecological stability over time. This reinforces the view of TRFs as irreplaceable ecosystems with both local and global relevance.
From a conservation standpoint, the coexistence of widespread taxa with rare and threatened species underscores the need for management strategies that go beyond species richness alone. Protecting these forests ensures the persistence of ecological functions such as regeneration, productivity, and C storage while also safeguarding species at risk of extinction. Strategies must therefore combine strict protection of sensitive habitats with sustainable use practices that involve and benefit local communities.
Looking ahead, the conservation of TRFs requires an integrated approach that aligns local and regional actions with international agendas such as the Convention on Biological Diversity and the Paris Agreement. Long-term monitoring of populations, comprehensive evaluation of unevaluated species, and the incorporation of traditional ecological knowledge will be essential to sustain these ecosystems. Only through such coordinated efforts can TRFs continue to act as biodiversity hotspots, climate regulators, and sources of resilience in the face of accelerating environmental change.
Author Contributions
Conceptualization, B.B.R-B., E.H-A., R.M.B-P. and D.A.C.C.; methodology, B.A.R-B., R.M.B-P., E.O-M., and N.R.C.; software, Y.M.C.N., J.L.M.M., and D.A.C.C.; validation, B.A.R-B., E.H-A. and Y.M.C.N.; formal analysis, J.L.M.M.; investigation, B.A.R-B.; resources, E.H-A.; data curation, B.A.R-B., R.M.B-P. and E.O-M.; writing—original draft preparation, B.A.R-B., E.H-A. and E.O-M.; writing—review and editing, B.A.R-N., E.H-A., R.M.B-P., N.R.C., E.O-M., J.L.M.M., Y.M.C.N. and D.A.C.C.; visualization, Y.M.C.N.; supervision, E.H-A. and R.M.B-P.; project administration, E.H-A.; funding acquisition, B.A.R-B. and E.H-A. All authors have read and agreed to the published version of the manuscript.
Funding
This research received no external funding.
Data Availability Statement
All data are available in the manuscript for consultation. For additional information, please contact the first author or correspondence author.
Acknowledgments
The main author is deeply grateful to Lovren Aleksander Ruiz Guzmán (RIP), Marilyn Zuleth Ruiz Guzmán and Magnolia Ruiz Echeverry for being an indirect part of the project.
Conflicts of Interest
The authors declare no conflicts of interest.
Abbreviations
The following abbreviations are used in this manuscript:
| TRF | Tropical rainforest |
| DBH | Diameter at Breast Height |
| Mg | Megagramos |
| C | Carbon |
| IVI | Importance value index |
| DR | Relative density |
| DoR | Relative dominance |
| FR | Relative frequency |
| H′ | Shannon index |
| 1 − D | Simpson index |
| J′ | Pielou evenness index |
| NMDS | Non-metric multidimensional scali |
| SPI | Structural productivity index |
| BPP | Biomass productivity proxy |
| AGB | Aboveground biomass |
| LC | Least Concern |
| CR | Critically Endangered |
| VU | Vulnerable |
| NE | Not Evaluated |
| CBD | Convention on Biological Diversity |
| REDD+ | Reducing Emissions from Deforestation and forest Degradation |
| IUCN | International Union for Conservation of Nature |
References
- Al-Ansi, A.N.; Al-Khatri, S.A.; Al-Shekaili, S.A.; Al-Saadi, N.B.; Rizvi, S.A.H. Effects of Trap Locations, Pheromone Source, and Temperature on Red Palm Weevil Capture. Fla. Entomol. 2022, 105, 9–15. [Google Scholar] [CrossRef]
- Malhi, Y.; Aragão, L.E.O.C.; Galbraith, D.; Huntingford, C.; Fisher, R.; Zelazowski, P.; Sitch, S.; McSweeney, C.; Meir, P. Exploring the Likelihood and Mechanism of a Climate-Change-Induced Dieback of the Amazon Rainforest. Proc. Natl. Acad. Sci. 2009, 106, 20610–20615. [Google Scholar] [CrossRef]
- Poveda, G.; Mesa, O.J. On the Existence of Lloró (the Rainiest Locality on Earth): Enhanced Ocean-Land-Atmosphere Interaction by a Low-Level Jet. Geophys. Res. Lett. 2000, 27, 1675–1678. [Google Scholar] [CrossRef]
- Arizmendi, Ma. del C.; Ornelas, J.F. Hummingbirds and Their Floral Resources in a Tropical Dry Forest in Mexico. Biotropica 1990, 22, 172–180. [Google Scholar] [CrossRef]
- Forest Biomass Density across Large Climate Gradients in Northern South America Is Related to Water Availability but Not with Temperature | PLOS One . Available online: https://journals.plos.org/plosone/article?id=10.1371/journal.pone.0171072 (accessed on 9 September 2025).
- Chave, J.; Réjou-Méchain, M.; Búrquez, A.; Chidumayo, E.; Colgan, M.S.; Delitti, W.B.C.; Duque, A.; Eid, T.; Fearnside, P.M.; Goodman, R.C.; et al. Improved Allometric Models to Estimate the Aboveground Biomass of Tropical Trees. Glob. Change Biol. 2014, 20, 3177–3190. [Google Scholar] [CrossRef]
- Quesada, C.A.; Phillips, O.L.; Schwarz, M.; Czimczik, C.I.; Baker, T.R.; Patiño, S.; Fyllas, N.M.; Hodnett, M.G.; Herrera, R.; Almeida, S.; et al. Basin-Wide Variations in Amazon Forest Structure and Function Are Mediated by Both Soils and Climate. Biogeosciences 2012, 9, 2203–2246. [Google Scholar] [CrossRef]
- Malhi, Y.; Wood, D.; Baker, T.R.; Wright, J.; Phillips, O.L.; Cochrane, T.; Meir, P.; Chave, J.; Almeida, S.; Arroyo, L.; et al. The Regional Variation of Aboveground Live Biomass in Old-Growth Amazonian Forests. Glob. Change Biol. 2006, 12, 1107–1138. [Google Scholar] [CrossRef]
- Condit, R.; Chisholm, R.A.; Hubbell, S.P. Thirty Years of Forest Census at Barro Colorado and the Importance of Immigration in Maintaining Diversity. PLOS ONE 2012, 7, e49826. [Google Scholar] [CrossRef] [PubMed]
- Clark, D.B.; Clark, D.A. Landscape-Scale Variation in Forest Structure and Biomass in a Tropical Rain Forest. For. Ecol. Manag. 2000, 137, 185–198. [Google Scholar] [CrossRef]
- Etter, A.; McAlpine, C.; Wilson, K.; Phinn, S.; Possingham, H. Regional Patterns of Agricultural Land Use and Deforestation in Colombia. Agric. Ecosyst. Environ. 2006, 114, 369–386. [Google Scholar] [CrossRef]
- ter Steege, H.; Pitman, N.C.A.; Phillips, O.L.; Chave, J.; Sabatier, D.; Duque, A.; Molino, J.-F.; Prévost, M.-F.; Spichiger, R.; Castellanos, H.; et al. Continental-Scale Patterns of Canopy Tree Composition and Function across Amazonia. Nature 2006, 443, 444–447. [Google Scholar] [CrossRef]
- Malhi, Y.; Wood, D.; Baker, T.R.; Wright, J.; Phillips, O.L.; Cochrane, T.; Meir, P.; Chave, J.; Almeida, S.; Arroyo, L.; et al. The Regional Variation of Aboveground Live Biomass in Old-Growth Amazonian Forests. Glob. Change Biol. 2006, 12, 1107–1138. [Google Scholar] [CrossRef]
- Phillips, O.L.; Malhi, Y.; Phillips, O.L.; Baker, T.R.; Arroyo, L.; Higuchi, N.; Killeen, T.J.; Laurance, W.F.; Lewis, S.L.; Lloyd, J.; et al. Pattern and Process in Amazon Tree Turnover, 1976–2001. Philos. Trans. R. Soc. Lond. B. Biol. Sci. 2004, 359, 381–407. [Google Scholar] [CrossRef]
- Álvarez-Dávila, E.; Cayuela, L.; González-Caro, S.; Aldana, A.M.; Stevenson, P.R.; Phillips, O.; Cogollo, Á.; Peñuela, M.C.; Hildebrand, P. von; Jiménez, E.; et al. Forest Biomass Density across Large Climate Gradients in Northern South America Is Related to Water Availability but Not with Temperature. PLOS ONE 2017, 12, e0171072. [Google Scholar] [CrossRef]
- Rütting, T.; Björk, R.G.; Meyer, A.; Klemedtsson, L.; Sikström, U. Reduced Global Warming Potential after Wood Ash Application in Drained Northern Peatland Forests. For. Ecol. Manag. 2014, 328, 159–166. [Google Scholar] [CrossRef]
- Mesterton-Gibbons, M. Games Nectarivores Play: A Perspective on Possingham. Ecology 1992, 73, 1913–1915. [Google Scholar] [CrossRef]
- Lamprecht, H. (1989) Silviculture in the Tropics Tropical Forest Ecosystems and Their Tree Species-Possibilities and Methods for Their Long-Term Utilization. Federal Republic of Germany, Eschborn. - References - Scientific Research Publishing. Available online: https://www.scirp.org/reference/referencespapers?referenceid=1832405 (accessed on 9 September 2025).
- Lewis, S.L.; Lopez-Gonzalez, G.; Sonké, B.; Affum-Baffoe, K.; Baker, T.R.; Ojo, L.O.; Phillips, O.L.; Reitsma, J.M.; White, L.; Comiskey, J.A.; et al. Increasing Carbon Storage in Intact African Tropical Forests. Nature 2009, 457, 1003–1006. [Google Scholar] [CrossRef] [PubMed]
- Pan, Y.; Birdsey, R.A.; Fang, J.; Houghton, R.; Kauppi, P.E.; Kurz, W.A.; Phillips, O.L.; Shvidenko, A.; Lewis, S.L.; Canadell, J.G.; et al. A Large and Persistent Carbon Sink in the World’s Forests. Science 2011, 333, 988–993. [Google Scholar] [CrossRef]
- Therrell, M.D.; Stahle, D.W.; Mukelabai, M.M.; Shugart, H.H. Age, and Radial Growth Dynamics of Pterocarpus Angolensis in Southern Africa. For. Ecol. Manag. 2007, 244, 24–31. [Google Scholar] [CrossRef]
- Fauset, S.; Johnson, M.O.; Gloor, M.; Baker, T.R.; Monteagudo M, A.; Brienen, R.J.W.; Feldpausch, T.R.; Lopez-Gonzalez, G.; Malhi, Y.; ter Steege, H.; et al. Hyperdominance in Amazonian Forest Carbon Cycling. Nat. Commun. 2015, 6, 6857. [Google Scholar] [CrossRef] [PubMed]
- García, N (ed) Libro Rojo de Plantas de Colombia. Volumen 5: Las Magnolias, Las Miristicáceas y Las Podocarpáceas; 2007; ISBN 978-958-8343-13-6.
- The WFO Plant List | World Flora Online. Available online: https://wfoplantlist.org/ (accessed on 9 September 2025).
- Bernal, R.; Gradstein, S.; Celis, M. Catálogo de Plantas y Líquenes de Colombia; 2016; ISBN 978-958-775-726-2.
- Curtis, J.T.; McIntosh, R.P. An Upland Forest Continuum in the Prairie-Forest Border Region of Wisconsin. Ecology 1951, 32, 476–496. [Google Scholar] [CrossRef]
- Chao, A.; Jost, L. Coverage-Based Rarefaction and Extrapolation: Standardizing Samples by Completeness Rather than Size. Ecology 2012, 93, 2533–2547. [Google Scholar] [CrossRef] [PubMed]
- Chao, A.; Gotelli, N.J.; Hsieh, T.C.; Sander, E.L.; Ma, K.H.; Colwell, R.K.; Ellison, A.M. Rarefaction and Extrapolation with Hill Numbers: A Framework for Sampling and Estimation in Species Diversity Studies. Ecol. Monogr. 2014, 84, 45–67. [Google Scholar] [CrossRef]
- Legendre, P.; Legendre, L. Numerical Ecology; Elsevier, 2012; ISBN 978-0-444-53869-7.
- Anderson, M.J. A New Method for Non-Parametric Multivariate Analysis of Variance. Austral Ecol. 2001, 26, 32–46. [Google Scholar] [CrossRef]
- Clarke, K.R. Non-Parametric Multivariate Analyses of Changes in Community Structure. Aust. J. Ecol. 1993, 18, 117–143. [Google Scholar] [CrossRef]
- Brown, S. Estimating Biomass and Biomass Change of Tropical Forests: A Primer. FAO For. Pap. 1997, 134. [Google Scholar]
- Meyer, H.A. Structure, Growth, and Drain in Balanced Uneven-Aged Forests.
- Chave, J.; Andalo, C.; Brown, S.; Cairns, M.A.; Chambers, J.Q.; Eamus, D.; Fölster, H.; Fromard, F.; Higuchi, N.; Kira, T.; et al. Tree Allometry and Improved Estimation of Carbon Stocks and Balance in Tropical Forests. Oecologia 2005, 145, 87–99. [Google Scholar] [CrossRef] [PubMed]
- Chave, J.; Réjou-Méchain, M.; Búrquez, A.; Chidumayo, E.; Colgan, M.S.; Delitti, W.B.C.; Duque, A.; Eid, T.; Fearnside, P.M.; Goodman, R.C.; et al. Improved Allometric Models to Estimate the Aboveground Biomass of Tropical Trees. Glob. Change Biol. 2014, 20, 3177–3190. [Google Scholar] [CrossRef]
- Report of AUuthors Meeting on IPPU Volume (2006 IPCC Guidelines).
- The IUCN Red List of Threatened Species. Available online: https://www.iucnredlist.org/en (accessed on 9 September 2025).
- R Core Team (2023) R A Language and Environment for Statistical Computing. R Foundation for Statistical Computing, Vienna. - References - Scientific Research Publishing. Available online: https://www.scirp.org/reference/referencespapers?referenceid=3582659 (accessed on 9 September 2025).
- Long, J.S.; Ervin, L.H. Using Heteroscedasticity Consistent Standard Errors in the Linear Regression Model. Am. Stat. 2000, 54, 217–224. [Google Scholar] [CrossRef]
Figure 1.
Species accumulation curve (q = 0) for trees with DBH ≥ 10 cm in a tropical rainforest (TRF) of the Colombian Pacific region.
Figure 1.
Species accumulation curve (q = 0) for trees with DBH ≥ 10 cm in a tropical rainforest (TRF) of the Colombian Pacific region.
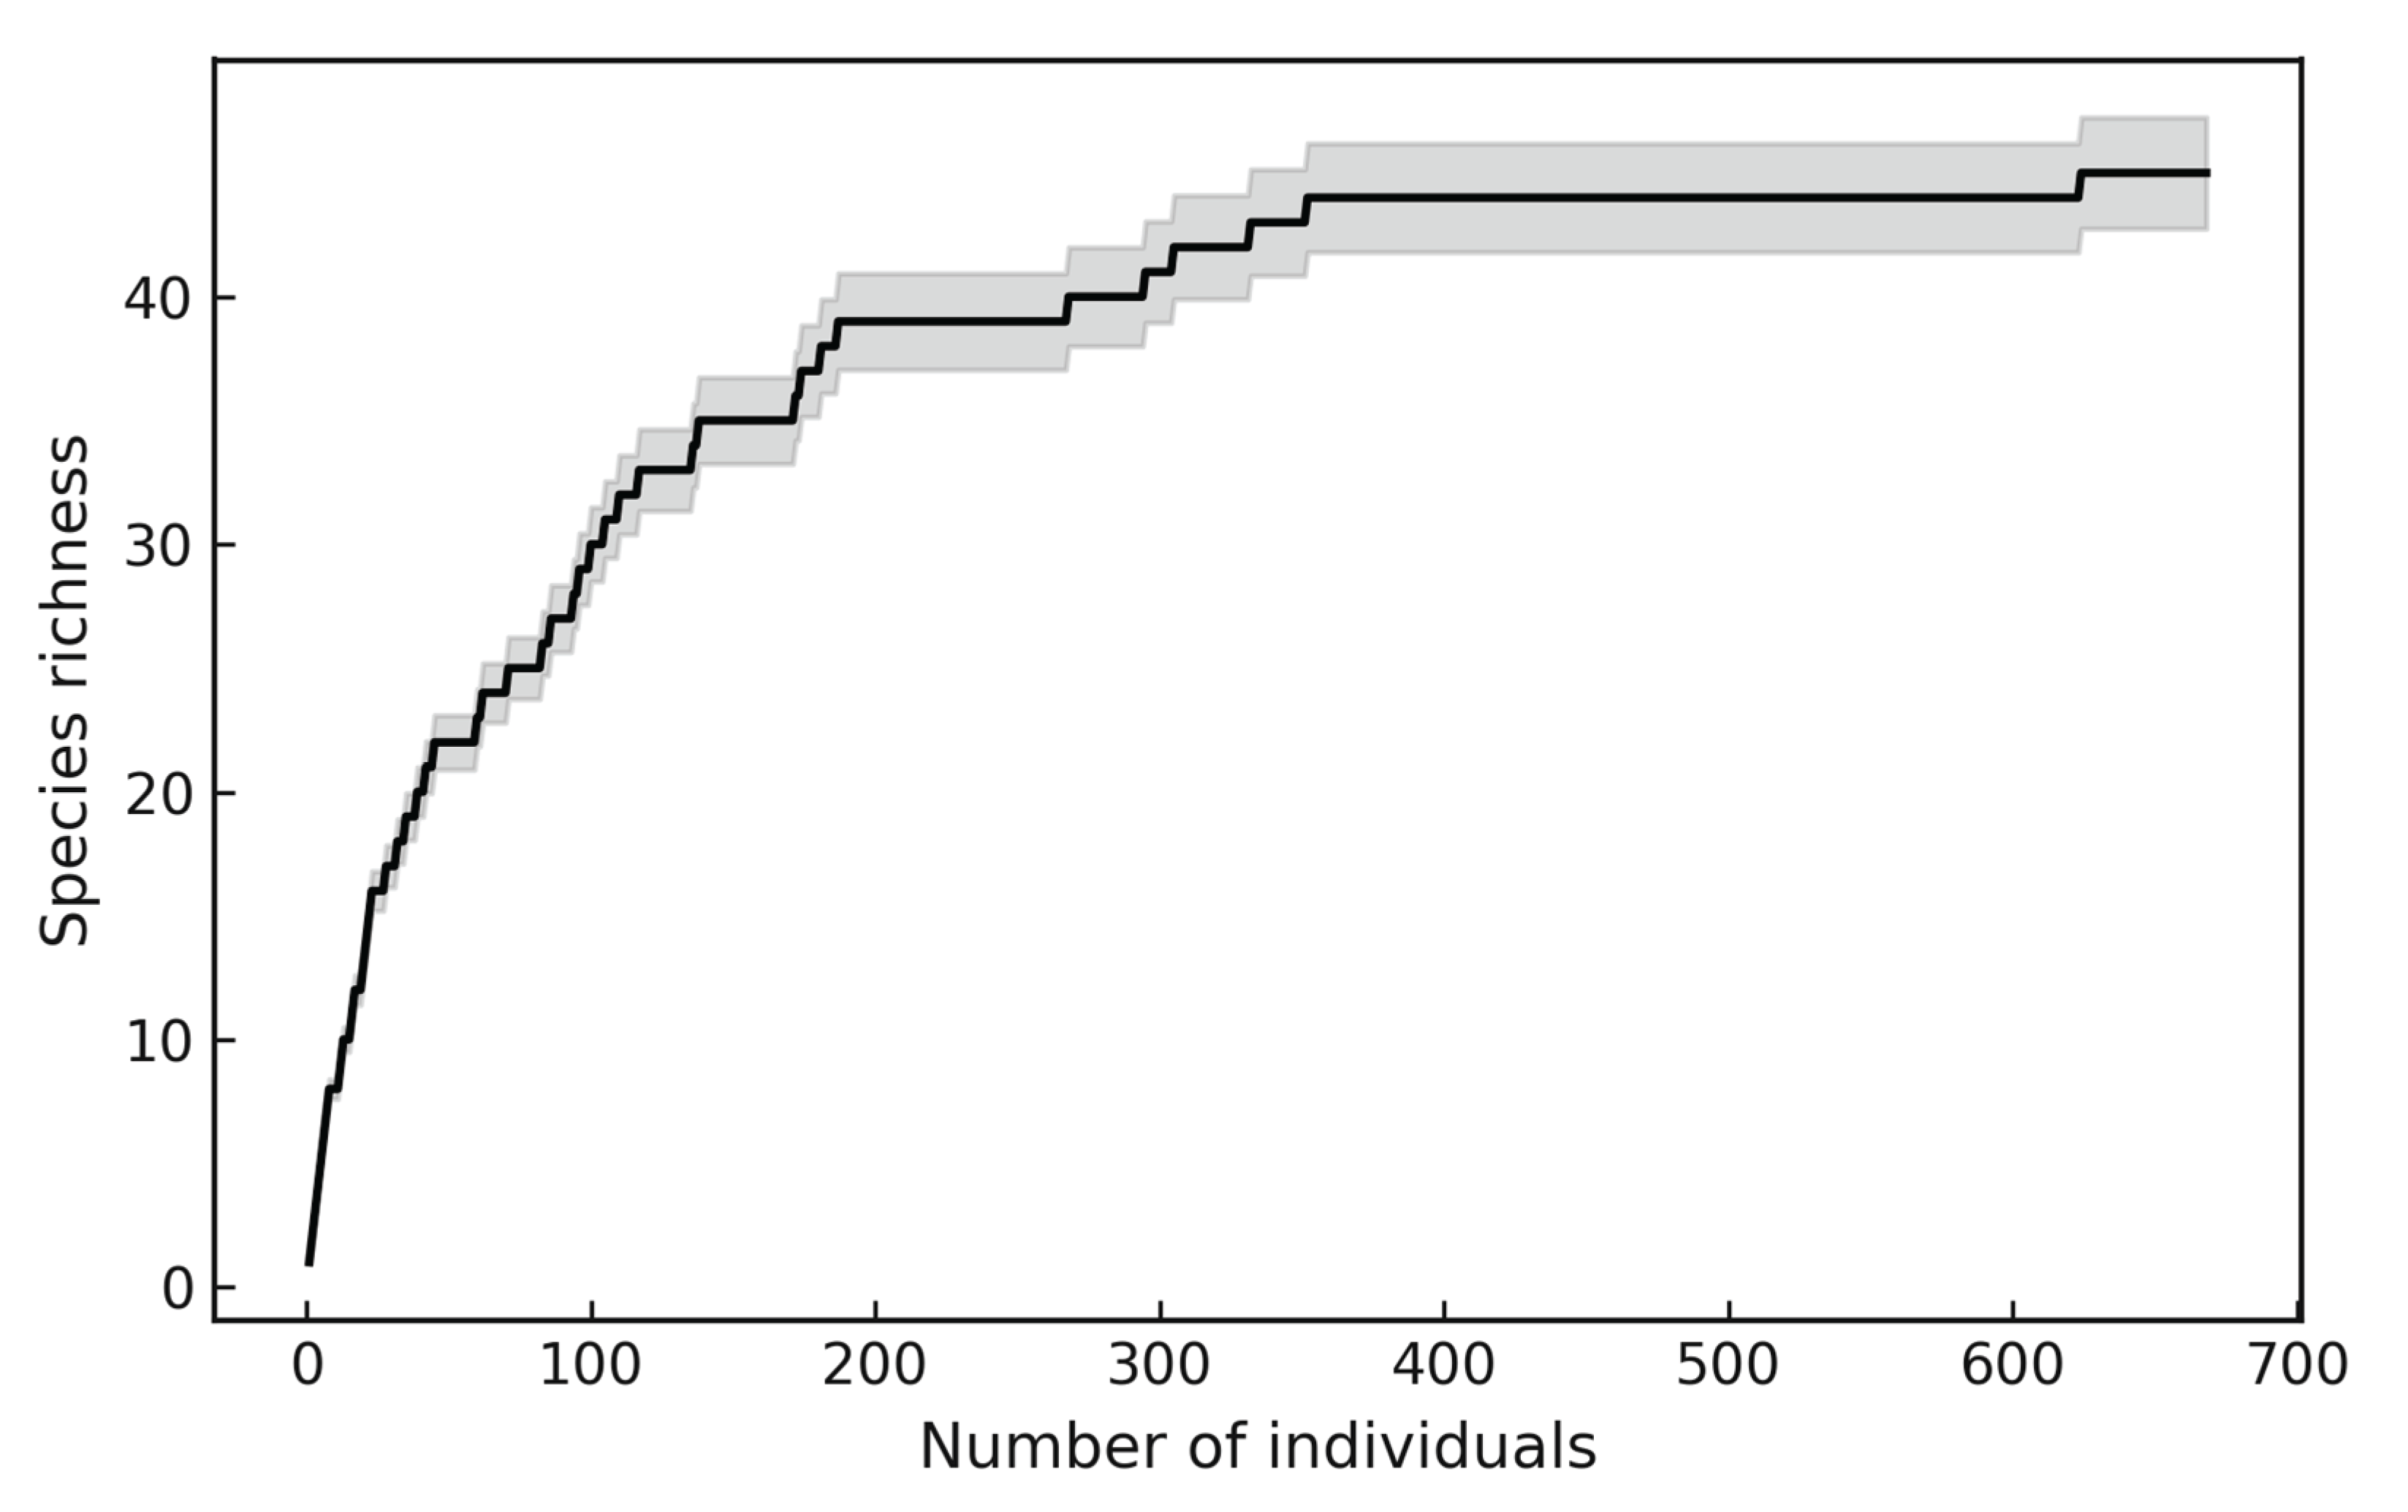
Figure 2.
Diameter distribution of trees with DBH ≥ 10 cm in a tropical rainforest (TRF) of the Colombian Pacific region. Bars represent the number of individuals in 10 cm diameter classes. The distribution follows a reverse-J shape, and the mean q-ratio between classes was 1.48, indicating continuous regeneration and the persistence of younger cohorts.
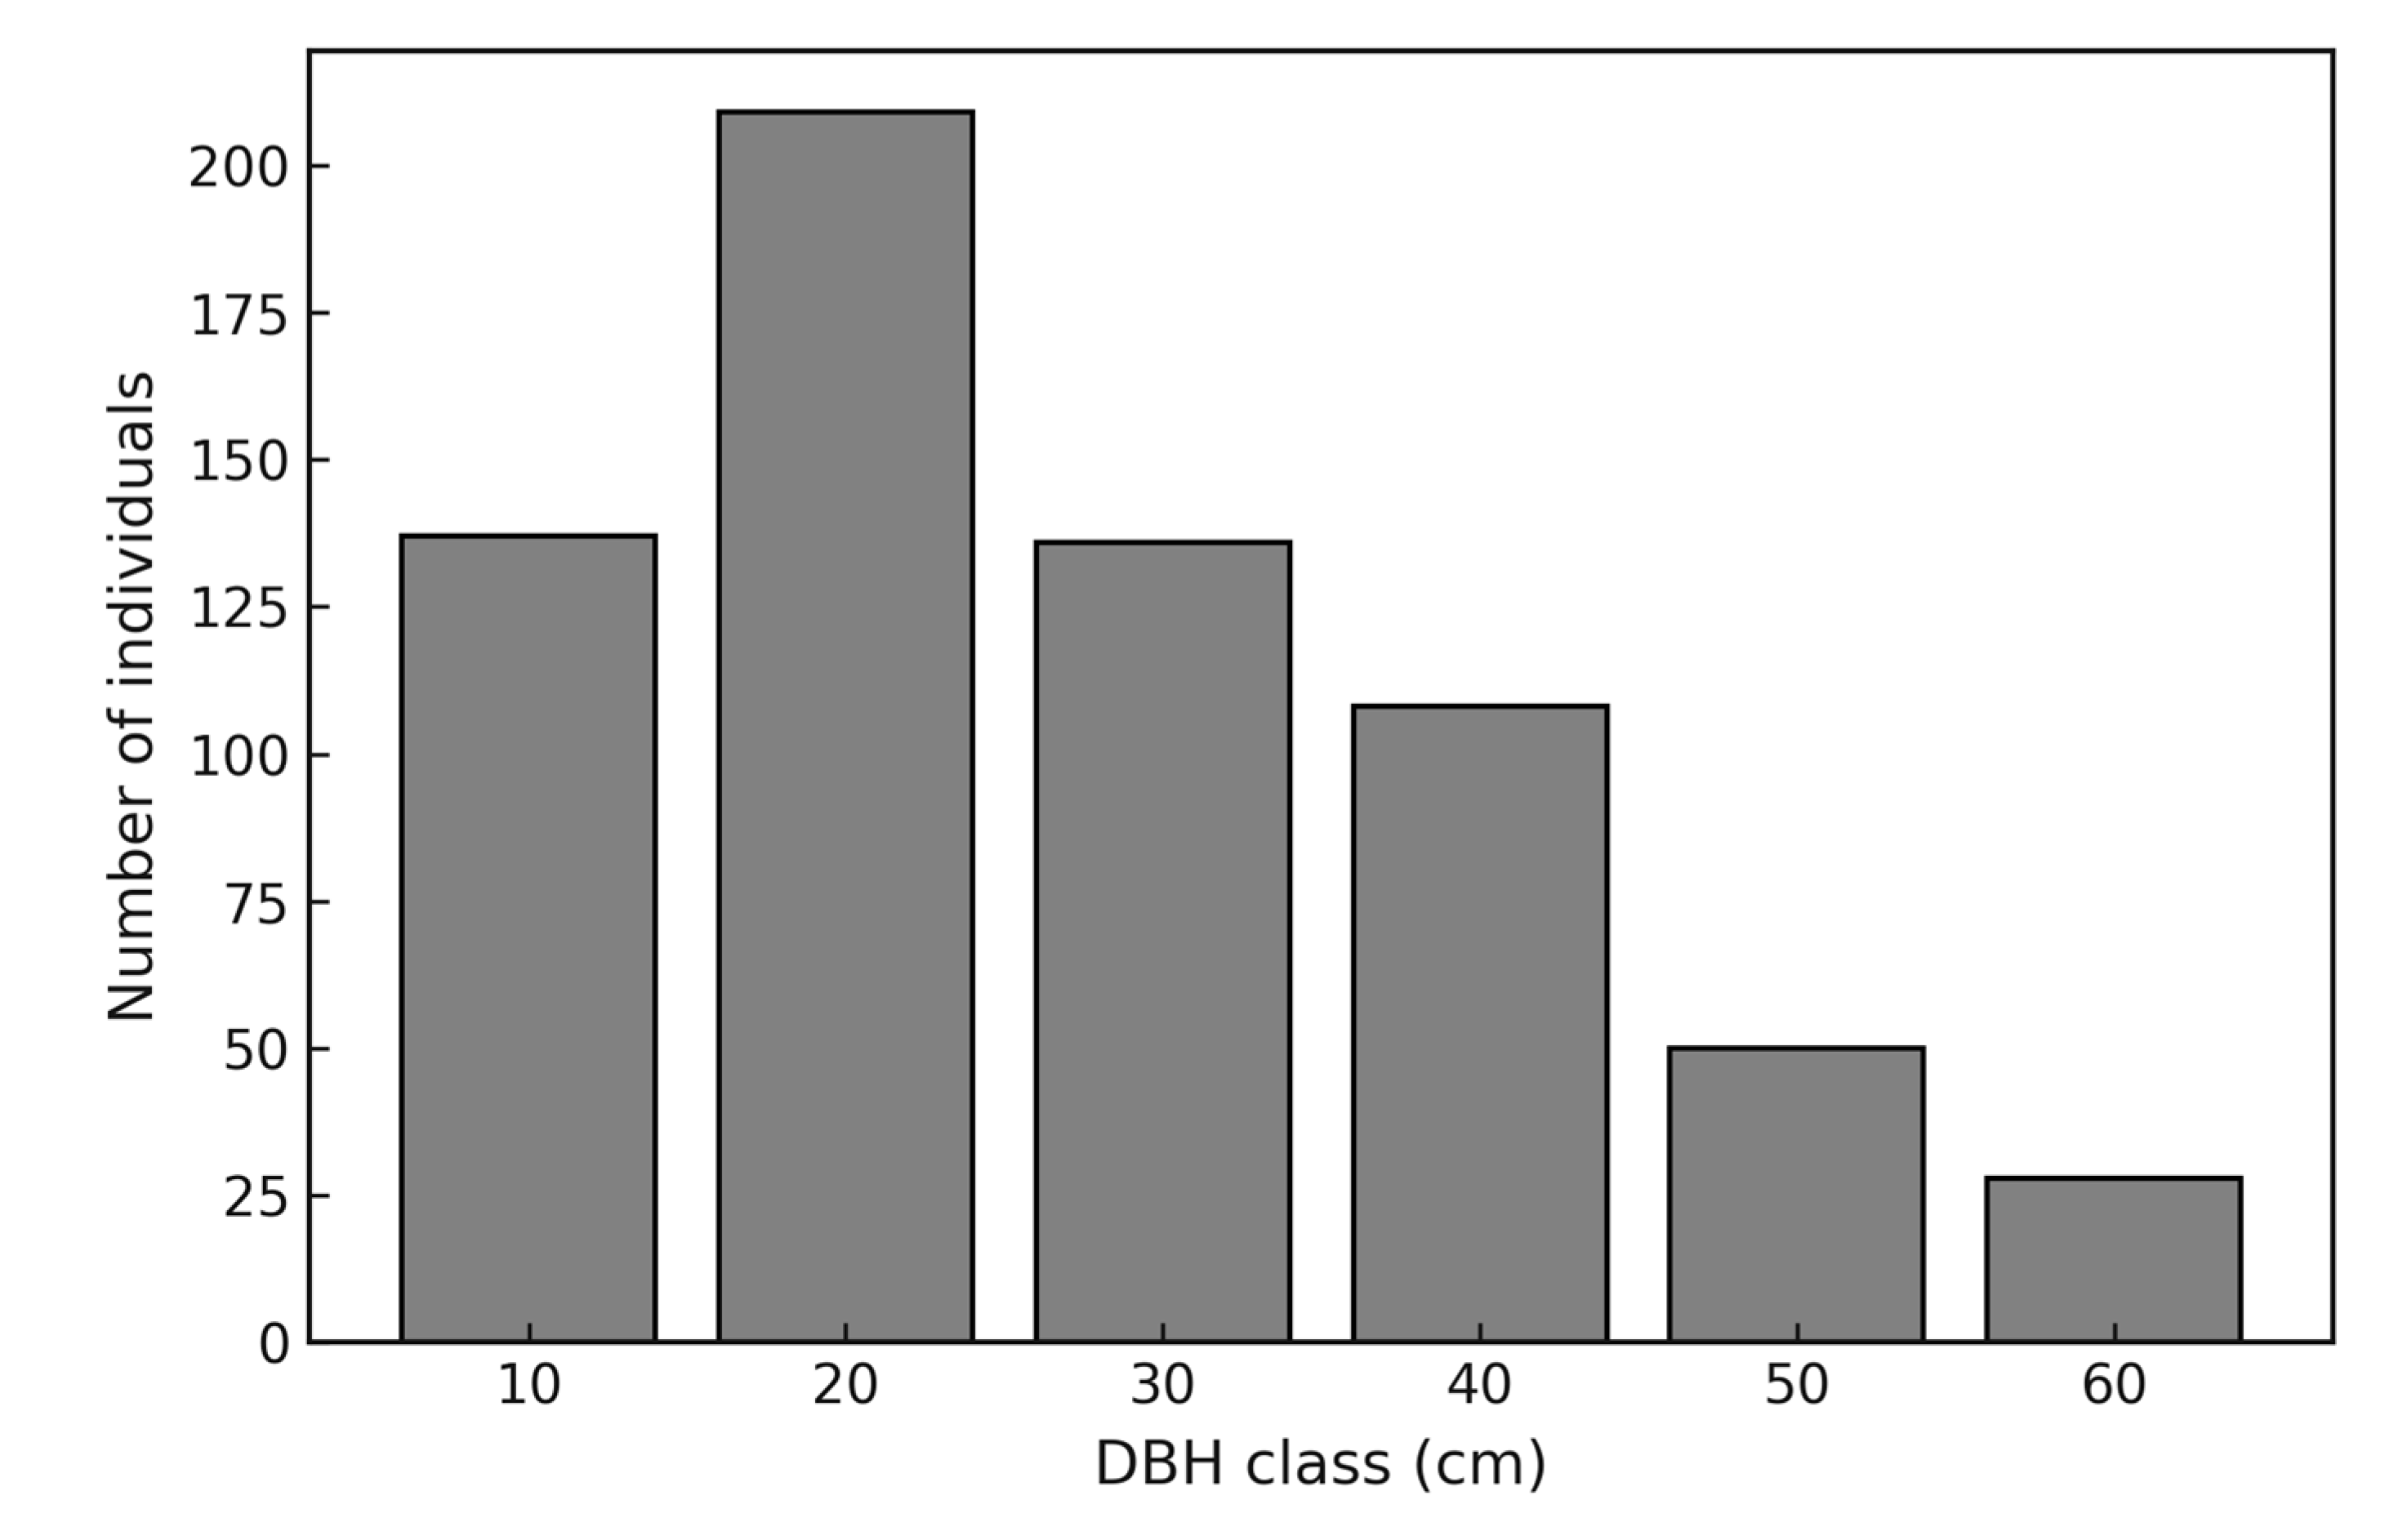
Figure 3.
Vertical stratification of trees in a tropical rainforest (TRF) of the Colombian Pacific region. Bars represent the number of individuals in three vertical strata: lower (<10 m), middle (10–20 m), and upper (>20 m). The results show the predominance of the lower and middle strata, with a reduced proportion of emergent individuals.
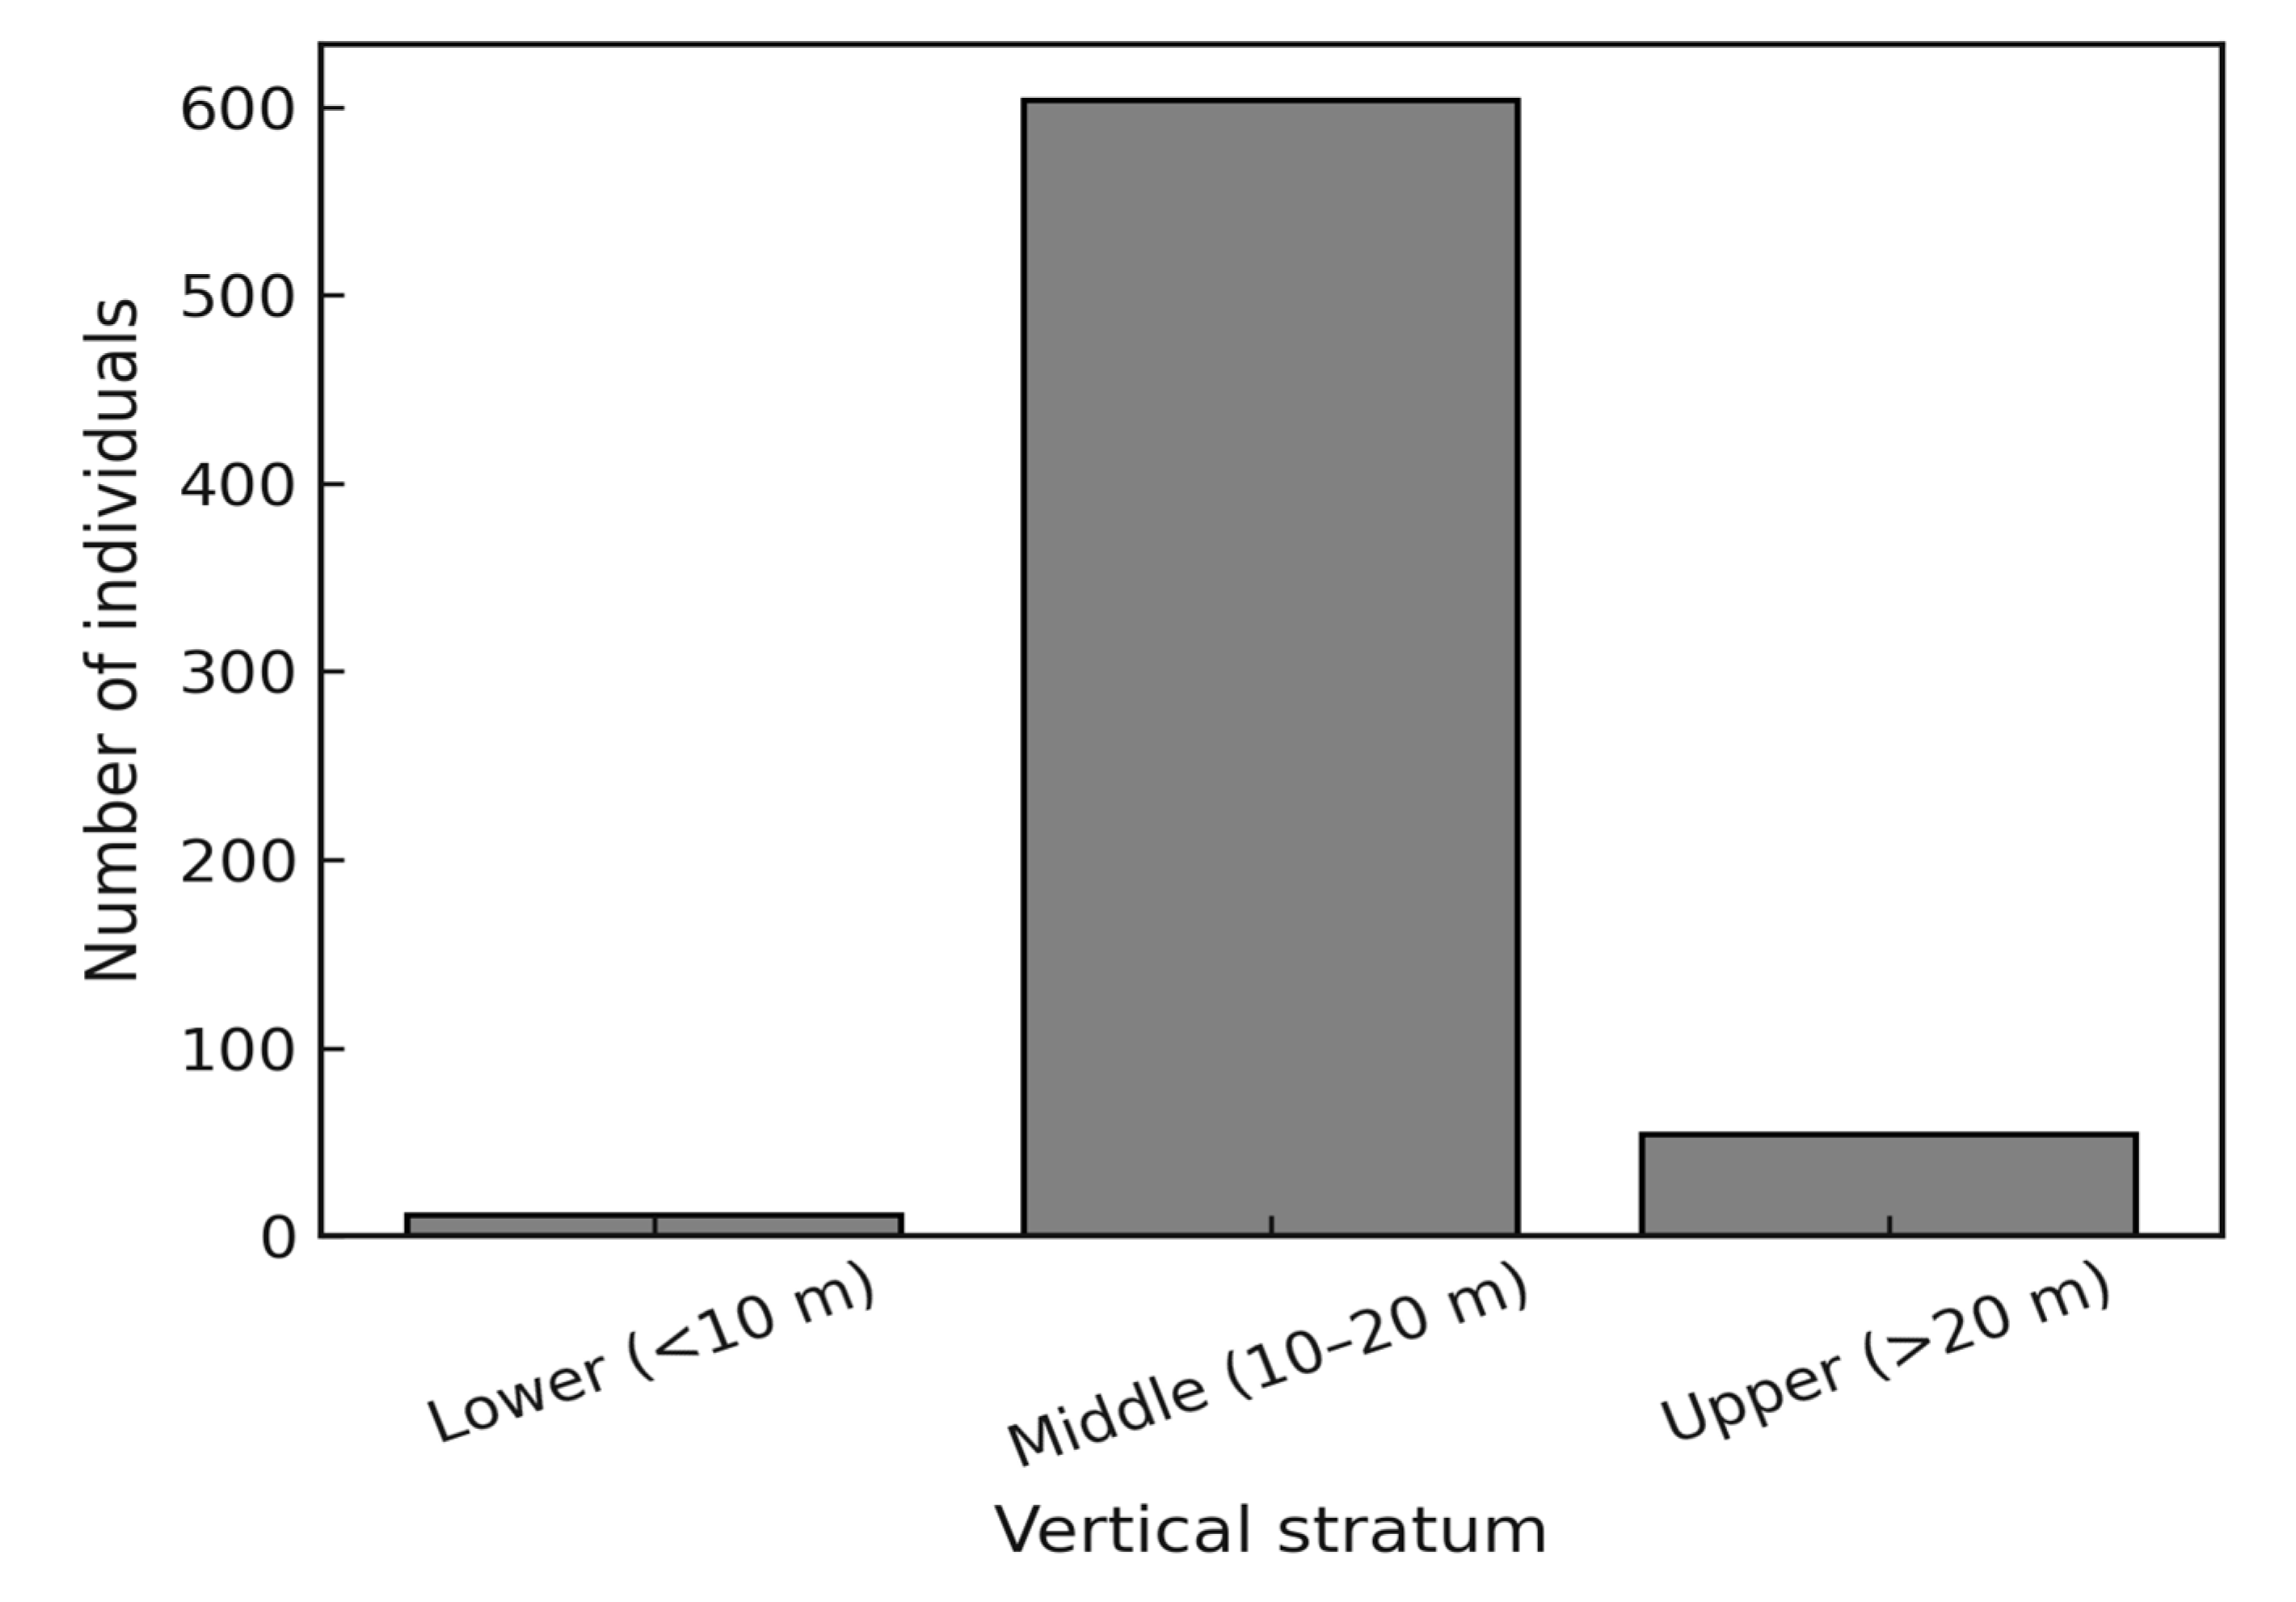
Figure 4.
Geolocation of a very humid tropical forest in the Department of Chocó, Colombia.
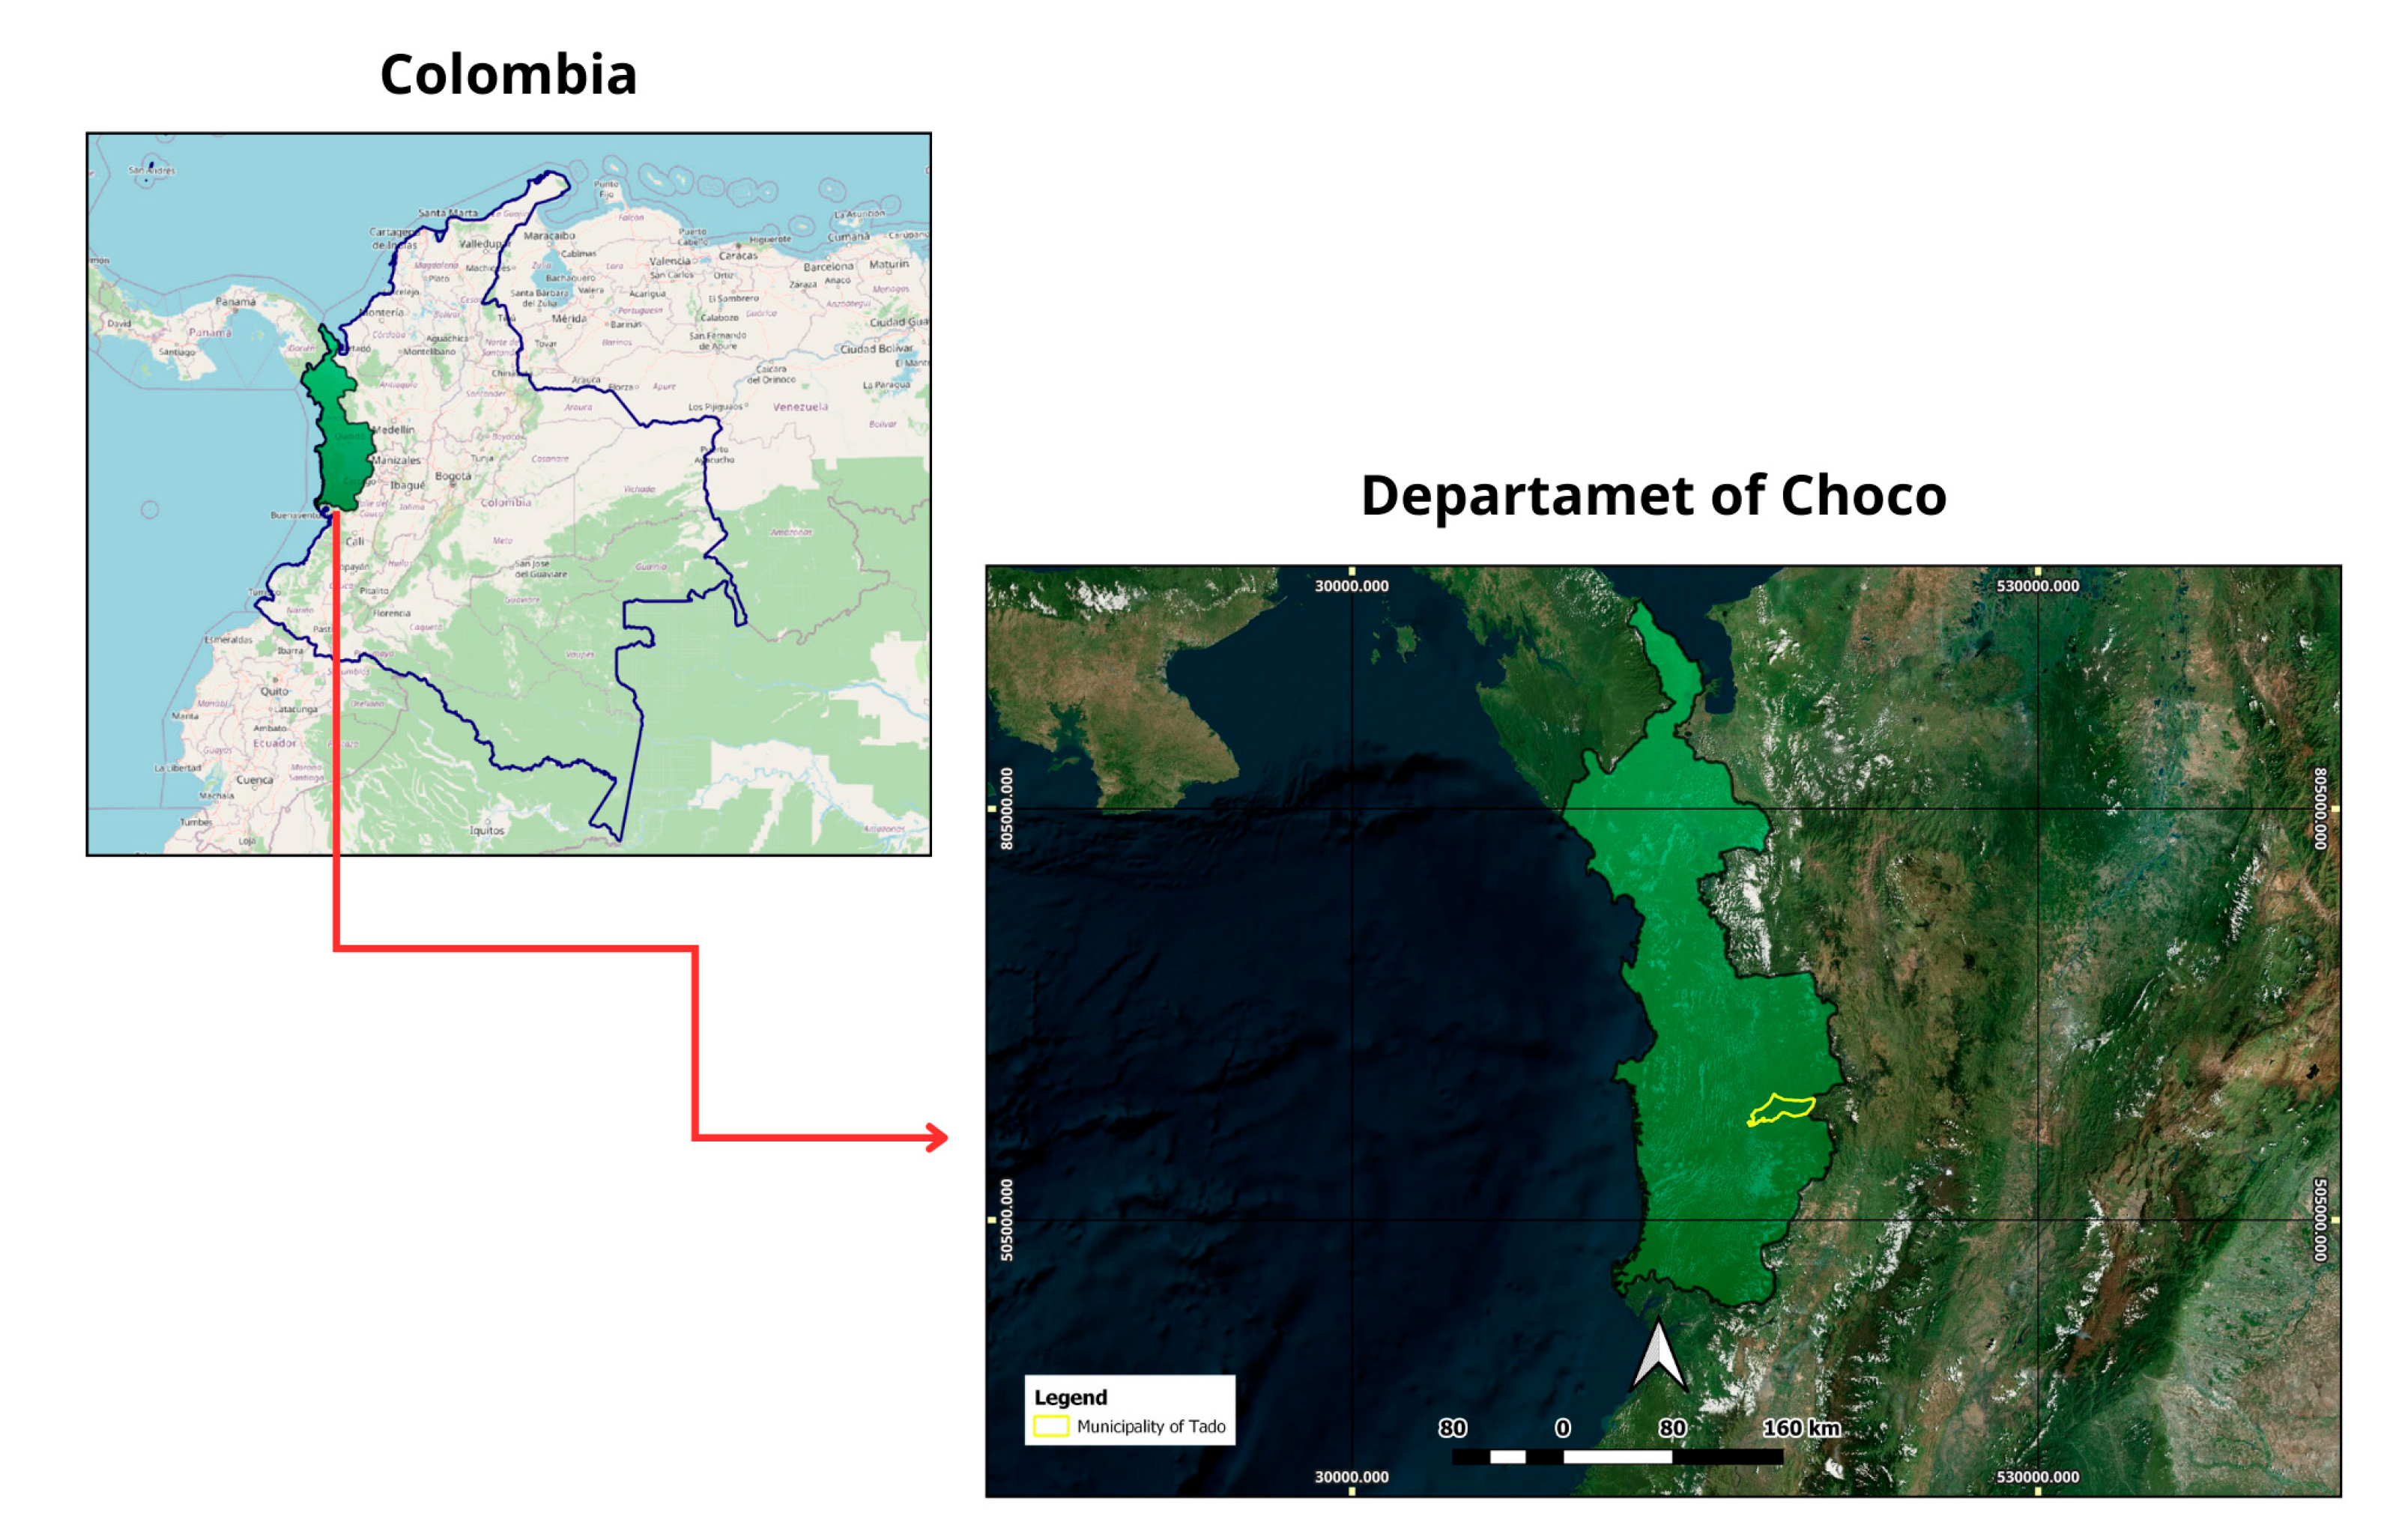
Table 1.
Floristic composition and importance value index (IVI) of tree species (DBH ≥ 10 cm) in a tropical rainforest (TRF) of the Colombian Pacific region.
Table 1.
Floristic composition and importance value index (IVI) of tree species (DBH ≥ 10 cm) in a tropical rainforest (TRF) of the Colombian Pacific region.
| Scientific name | Common name | Family | N | DR(%) | DoR(%) | FR(%) | IVI |
|---|---|---|---|---|---|---|---|
| Chrysophyllum cainito | Caimito | Sapotaceae | 57 | 8.52 | 11.71 | 100.0 | 120.23 |
| Pithecellobium latifolium | Carbonero | Fabaceae | 60 | 8.97 | 8.65 | 100.0 | 117.61 |
| Brosimum utile | Lechero | Moraceae | 45 | 6.73 | 7.98 | 100.0 | 114.7 |
| Eschweilera sclerophylla | Guasca | Lecythidaceae | 43 | 6.43 | 5.15 | 100.0 | 111.57 |
| Pourouma cecropiifolia | Yarumo uva | Cecropiaceae | 44 | 6.58 | 4.48 | 100.0 | 111.05 |
| Inga edulis | Guamo | Fabaceae | 34 | 5.08 | 4.31 | 100.0 | 109.39 |
| Sterculia apetala | Vaina | Malvaceae | 33 | 4.93 | 4.37 | 100.0 | 109.3 |
| Simaba cedron | Cedron | Simaroubaceae | 20 | 2.99 | 4.06 | 100.0 | 107.05 |
| Minquartia guianensis | Guayacan | Olacaceae | 19 | 2.84 | 2.87 | 100.0 | 105.71 |
| Carapa guianensis | Guino | Meliaceae | 15 | 2.24 | 2.16 | 100.0 | 104.4 |
| Gustavia superba | Paco | Lecythidaceae | 17 | 2.54 | 1.44 | 100.0 | 103.98 |
| Bursera tomentosa | Caraño | Burseraceae | 13 | 1.94 | 1.94 | 100.0 | 103.89 |
| Lunania parviflora | Hormigo | Salicaceae | 15 | 2.24 | 1.29 | 100.0 | 103.53 |
| Calophyllum mariae | Aceite María | Calophyllaceae | 11 | 1.64 | 1.56 | 100.0 | 103.21 |
| Protium colombianum | Anime | Burseraceae | 9 | 1.35 | 1.65 | 100.0 | 103.0 |
| Hymenaea courbaril | Algarrobo | Fabaceae | 14 | 2.09 | 2.65 | 75.0 | 79.75 |
| Couma macrocarpa | Lirio | Apocynaceae | 11 | 1.64 | 2.77 | 75.0 | 79.41 |
| Sacoglottis procera | Chano | Humiriaceae | 11 | 1.64 | 2.72 | 75.0 | 79.36 |
| Ceiba pentandra | Ceiba | Malvaceae | 12 | 1.79 | 2.37 | 75.0 | 79.16 |
| Compsoneura atopa | Castaño | Myristicaceae | 12 | 1.79 | 0.91 | 75.0 | 77.7 |
| Brosimum guianense | Oquendo | Moraceae | 10 | 1.49 | 1.0 | 75.0 | 77.5 |
| Tapirira guianensis | Manteco | Anacardiaceae | 7 | 1.05 | 1.04 | 75.0 | 77.09 |
| Patinoa almirajo | Almirajó | Malvaceae | 8 | 1.2 | 0.78 | 75.0 | 76.98 |
| Osteophloeum platyspermum | Otobo | Myristicaceae | 6 | 0.9 | 0.74 | 75.0 | 76.64 |
| Pourouma tomentosa | Uva | Urticaceae | 3 | 0.45 | 0.32 | 75.0 | 75.77 |
| Aspidosperma crypticum | Amargo | Apocynaceae | 3 | 0.45 | 0.32 | 75.0 | 75.77 |
| Aspidosperma excelsum | Costillo | Apocynaceae | 5 | 0.75 | 1.58 | 50.0 | 52.33 |
| Helianthostylis sprucei | Mestizo | Moraceae | 6 | 0.9 | 1.11 | 50.0 | 52.01 |
| Tapirira myriantha | Cedro macho | Anacardiaceae | 5 | 0.75 | 0.96 | 50.0 | 51.7 |
| Phyllanthus acuminatus | Barbasquillo | Phyllanthaceae | 3 | 0.45 | 0.92 | 50.0 | 51.37 |
| Ochroma pyramidale | Balso | Malvaceae | 4 | 0.6 | 0.5 | 50.0 | 51.1 |
| Alibertia edulis | Guayabo | Rubiaceae | 3 | 0.45 | 0.27 | 50.0 | 50.72 |
| Crescentia cujete | Taparo | Bignoniaceae | 2 | 0.3 | 0.52 | 25.0 | 25.82 |
| Nectandra acutifolia | Incibe | Lauraceae | 2 | 0.3 | 0.29 | 25.0 | 25.58 |
| Dipteryx oleifera | Choiba | Fabaceae | 1 | 0.15 | 0.23 | 25.0 | 25.38 |
| Manilkara bidentata | Nispero | Sapotaceae | 1 | 0.15 | 0.13 | 25.0 | 25.28 |
| Aniba perutilis | Chachajo | Lauraceae | 1 | 0.15 | 0.06 | 25.0 | 25.21 |
| Dendropanax arboreus | Canelo | Araliaceae | 1 | 0.15 | 0.06 | 25.0 | 25.21 |
| Hieronyma alchorneoides | Pantano | Phyllanthaceae | 1 | 0.15 | 0.03 | 25.0 | 25.18 |
| Dussia lehmannii | Bagata | Fabaceae | 7 | 1.05 | 1.54 | nan | nan |
| Huberodendron patinoi | Carra | Malvaceae | 7 | 1.05 | 1.85 | nan | nan |
| Clarisia biflora | Cauchillo | Moraceae | 15 | 2.24 | 2.06 | nan | nan |
| Vismia panamensis | Manchara | Hypericaceae | 11 | 1.64 | 1.35 | nan | nan |
| Virola sebifera | Nuanamo | Myristicaceae | 53 | 7.92 | 6.24 | nan | nan |
| Vochysia ferruginea | Soroga | Vochysiaceae | 9 | 1.35 | 1.08 | nan | nan |
Relative density (DR) = number of individuals of the species/total number of individuals × 100; Relative dominance (DoR) = basal area of the species/total basal area × 100; Relative frequency (FR) = number of plots with the species/total number of plots × 100; Importance Value Index (IVI) = DR + DoR + FR.
Table 3.
Structural attributes of trees with DBH ≥ 10 cm in a tropical rainforest (TRF) of the Colombian Pacific region.
Table 3.
Structural attributes of trees with DBH ≥ 10 cm in a tropical rainforest (TRF) of the Colombian Pacific region.
| Structural variable | Value |
|---|---|
| Tree density | 1672.5 ind ha-1 |
| Basal area | 137.75 m2 ha⁻¹ |
| Volume | 2347.65 m3 ha⁻¹ |
Table 4.
Structural attributes by species (DBH ≥ 10 cm) in a tropical rainforest (TRF) of the Colombian Pacific region.
Table 4.
Structural attributes by species (DBH ≥ 10 cm) in a tropical rainforest (TRF) of the Colombian Pacific region.
| Scientific name | Family | Tree density (ind ha-1) |
Basal area (m2 ha⁻¹) |
Volume (m3 ha⁻¹) |
|---|---|---|---|---|
| Alibertia edulis | Rubiaceae | 7.5 | 0.38 | 0.24 |
| Aniba perutilis | Lauraceae | 2.5 | 0.08 | 0.01 |
| Aspidosperma crypticum | Apocynaceae | 7.5 | 0.44 | 0.39 |
| Aspidosperma excelsum | Apocynaceae | 12.5 | 2.17 | 11.66 |
| Brosimum guianense | Moraceae | 25.0 | 1.38 | 3.65 |
| Brosimum utile | Moraceae | 112.5 | 10.99 | 327.95 |
| Bursera tomentosa | Burseraceae | 32.5 | 2.68 | 15.88 |
| Calophyllum mariae | Calophyllaceae | 27.5 | 2.15 | 12.47 |
| Carapa guianensis | Meliaceae | 37.5 | 2.97 | 19.62 |
| Ceiba pentandra | Malvaceae | 30.0 | 3.26 | 28.84 |
| Chrysophyllum cainito | Sapotaceae | 142.5 | 16.13 | 655.49 |
| Clarisia biflora | Moraceae | 37.5 | 2.84 | 21.01 |
| Compsoneura atopa | Myristicaceae | 30.0 | 1.25 | 2.73 |
| Couma macrocarpa | Apocynaceae | 27.5 | 3.81 | 44.34 |
| Crescentia cujete | Bignoniaceae | 5.0 | 0.71 | 1.17 |
| Dendropanax arboreus | Araliaceae | 2.5 | 0.08 | 0.01 |
| Dipteryx oleifera | Fabaceae | 2.5 | 0.31 | 0.27 |
| Dussia lehmannii | Fabaceae | 17.5 | 2.12 | 10.82 |
| Eschweilera sclerophylla | Lecythidaceae | 107.5 | 7.09 | 132.81 |
| Gustavia superba | Lecythidaceae | 42.5 | 1.98 | 10.68 |
| Helianthostylis sprucei | Moraceae | 15.0 | 1.53 | 5.61 |
| Hieronyma alchorneoides | Phyllanthaceae | 2.5 | 0.04 | 0.0 |
| Huberodendron patinoi | Malvaceae | 17.5 | 2.55 | 17.48 |
| Hymenaea courbaril | Fabaceae | 35.0 | 3.66 | 34.59 |
| Inga edulis | Fabaceae | 85.0 | 5.94 | 77.19 |
| Lunania parviflora | Salicaceae | 37.5 | 1.78 | 6.61 |
| Manilkara bidentata | Sapotaceae | 2.5 | 0.18 | 0.07 |
| Minquartia guianensis | Olacaceae | 47.5 | 3.95 | 39.07 |
| Nectandra acutifolia | Lauraceae | 5.0 | 0.39 | 0.5 |
| Ochroma pyramidale | Malvaceae | 10.0 | 0.69 | 1.27 |
| Osteophloeum platyspermum | Myristicaceae | 15.0 | 1.03 | 2.73 |
| Patinoa almirajo | Malvaceae | 20.0 | 1.08 | 2.54 |
| Phyllanthus acuminatus | Phyllanthaceae | 7.5 | 1.27 | 4.69 |
| Pithecellobium latifolium | Fabaceae | 150.0 | 11.91 | 351.15 |
| Pourouma cecropiifolia | Cecropiaceae | 110.0 | 6.17 | 81.97 |
| Pourouma tomentosa | Urticaceae | 7.5 | 0.44 | 0.41 |
| Protium colombianum | Burseraceae | 22.5 | 2.27 | 14.36 |
| Sacoglottis procera | Humiriaceae | 27.5 | 3.75 | 41.21 |
| Simaba cedron | Simaroubaceae | 50.0 | 5.6 | 91.52 |
| Sterculia apetala | Malvaceae | 82.5 | 6.01 | 83.06 |
| Tapirira guianensis | Anacardiaceae | 17.5 | 1.44 | 5.14 |
| Tapirira myriantha | Anacardiaceae | 12.5 | 1.32 | 5.82 |
| Virola sebifera | Myristicaceae | 132.5 | 8.6 | 167.51 |
| Vismia panamensis | Hypericaceae | 27.5 | 1.86 | 7.35 |
| Vochysia ferruginea | Vochysiaceae | 22.5 | 1.49 | 5.75 |
Table 5.
Structural attributes by family (DBH ≥ 10 cm) in a tropical rainforest (TRF) of the Colombian Pacific region.
Table 5.
Structural attributes by family (DBH ≥ 10 cm) in a tropical rainforest (TRF) of the Colombian Pacific region.
| Familia | Tree density (ind ha-1) |
Basal area (m2 ha⁻¹) |
Volume (m3 ha⁻¹) |
|---|---|---|---|
| Anacardiaceae | 30.0 | 2.75 | 10.96 |
| Apocynaceae | 35.0 | 4.25 | 44.72 |
| Apocynaceae | 12.5 | 2.17 | 11.66 |
| Araliaceae | 2.5 | 0.08 | 0.01 |
| Bignoniaceae | 5.0 | 0.71 | 1.17 |
| Burseraceae | 55.0 | 4.95 | 30.24 |
| Calophyllaceae | 27.5 | 2.15 | 12.47 |
| Cecropiaceae | 110.0 | 6.17 | 81.97 |
| Fabaceae | 290.0 | 23.94 | 474.02 |
| Humiriaceae | 27.5 | 3.75 | 41.21 |
| Hypericaceae | 27.5 | 1.86 | 7.35 |
| Lecythidaceae | 150.0 | 9.07 | 143.49 |
| Malvaceae | 160.0 | 13.59 | 133.19 |
| Meliaceae | 37.5 | 2.97 | 19.62 |
| Moraceae | 190.0 | 16.74 | 358.23 |
| Myristicaceae | 45.0 | 2.27 | 5.46 |
| Olacaceae | 47.5 | 3.95 | 39.07 |
| Phyllanthaceae | 10.0 | 1.31 | 4.69 |
| Rubiaceae | 7.5 | 0.38 | 0.24 |
| Salicaceae | 37.5 | 1.78 | 6.61 |
| Sapotaceae | 145.0 | 16.31 | 655.57 |
| Simaroubaceae | 50.0 | 5.6 | 91.52 |
| Urticaceae | 7.5 | 0.44 | 0.41 |
| Vochysiaceae | 22.5 | 1.49 | 5.75 |
| Lauraceae | 7.5 | 0.47 | 0.51 |
| Myristicaceae | 132.5 | 8.6 | 167.51 |
Table 6.
Productivity indices of trees with DBH ≥ 10 cm in a tropical rainforest (TRF) of the Colombian Pacific region.
Table 6.
Productivity indices of trees with DBH ≥ 10 cm in a tropical rainforest (TRF) of the Colombian Pacific region.
| Productivity index | Value |
|---|---|
| Structural productivity index (SPI) | 0.082 m2 tree⁻¹ |
| Biomass productivity proxy (BPP) | 0.928 Mg tree⁻¹ |
Table 7.
Aboveground biomass (AGB) and carbon stock of trees with DBH ≥ 10 cm in a tropical rainforest (TRF) of the Colombian Pacific region.
Table 7.
Aboveground biomass (AGB) and carbon stock of trees with DBH ≥ 10 cm in a tropical rainforest (TRF) of the Colombian Pacific region.
| Variable | Value |
|---|---|
| AGB | 1552.59 Mg ha⁻¹ |
| C pools | 729.72 Mg C ha⁻¹ |
Table 8.
Aboveground biomass (AGB) and C (carbon) stock by species (DBH ≥ 10 cm) in a tropical rainforest (TRF) of the Colombian Pacific region.
Table 8.
Aboveground biomass (AGB) and C (carbon) stock by species (DBH ≥ 10 cm) in a tropical rainforest (TRF) of the Colombian Pacific region.
| Scientific name | Family | AGB (Mg ha⁻¹) | C (Mg C ha⁻¹) |
|---|---|---|---|
| Chrysophyllum cainito | Sapotaceae | 180.76 | 84.96 |
| Pithecellobium latifolium | Fabaceae | 137.92 | 64.82 |
| Brosimum utile | Moraceae | 133.34 | 62.67 |
| Virola sebifera | Myristicaceae | 89.5 | 42.07 |
| Eschweilera sclerophylla | Lecythidaceae | 84.05 | 39.51 |
| Simaba cedron | Simaroubaceae | 69.47 | 32.65 |
| Sterculia apetala | Malvaceae | 64.96 | 30.53 |
| Inga edulis | Fabaceae | 62.65 | 29.45 |
| Pourouma cecropiifolia | Cecropiaceae | 62.14 | 29.21 |
| Couma macrocarpa | Apocynaceae | 48.05 | 22.59 |
| Sacoglottis procera | Humiriaceae | 46.12 | 21.68 |
| Minquartia guianensis | Olacaceae | 41.21 | 19.37 |
| Hymenaea courbaril | Fabaceae | 40.62 | 19.09 |
| Ceiba pentandra | Malvaceae | 39.63 | 18.63 |
| Clarisia biflora | Moraceae | 33.43 | 15.71 |
| Carapa guianensis | Meliaceae | 30.03 | 14.11 |
| Huberodendron patinoi | Malvaceae | 29.9 | 14.05 |
| Protium colombianum | Burseraceae | 29.63 | 13.93 |
| Bursera tomentosa | Burseraceae | 27.35 | 12.86 |
| Aspidosperma excelsum | Apocynaceae | 26.49 | 12.45 |
| Calophyllum mariae | Calophyllaceae | 25.98 | 12.21 |
| Dussia lehmannii | Fabaceae | 23.26 | 10.93 |
| Gustavia superba | Lecythidaceae | 22.97 | 10.8 |
| Vismia panamensis | Hypericaceae | 18.95 | 8.91 |
| Tapirira myriantha | Anacardiaceae | 18.52 | 8.7 |
| Vochysia ferruginea | Vochysiaceae | 17.89 | 8.41 |
| Lunania parviflora | Salicaceae | 16.31 | 7.67 |
| Helianthostylis sprucei | Moraceae | 16.1 | 7.57 |
| Phyllanthus acuminatus | Phyllanthaceae | 15.79 | 7.42 |
| Tapirira guianensis | Anacardiaceae | 14.63 | 6.88 |
| Brosimum guianense | Moraceae | 12.3 | 5.78 |
| Osteophloeum platyspermum | Myristicaceae | 11.29 | 5.31 |
| Patinoa almirajo | Malvaceae | 10.96 | 5.15 |
| Compsoneura atopa | Myristicaceae | 9.75 | 4.58 |
| Ochroma pyramidale | Malvaceae | 8.67 | 4.08 |
| Crescentia cujete | Bignoniaceae | 8.2 | 3.86 |
| Nectandra acutifolia | Lauraceae | 5.2 | 2.44 |
| Aspidosperma crypticum | Apocynaceae | 4.42 | 2.08 |
| Pourouma tomentosa | Urticaceae | 4.05 | 1.9 |
| Dipteryx oleifera | Fabaceae | 3.26 | 1.53 |
| Alibertia edulis | Rubiaceae | 3.07 | 1.44 |
| Manilkara bidentata | Sapotaceae | 1.83 | 0.86 |
| Aniba perutilis | Lauraceae | 0.82 | 0.38 |
| Dendropanax arboreus | Araliaceae | 0.71 | 0.34 |
| Hieronyma alchorneoides | Phyllanthaceae | 0.4 | 0.19 |
Table 9.
Aboveground biomass and carbon stock by family (DBH ≥ 10 cm) in a tropical rainforest (TRF) of the Colombian Pacific region.
Table 9.
Aboveground biomass and carbon stock by family (DBH ≥ 10 cm) in a tropical rainforest (TRF) of the Colombian Pacific region.
| Family | AGB (Mg ha⁻¹) | C (Mg C ha⁻¹) |
|---|---|---|
| Fabaceae | 267.71 | 125.82 |
| Moraceae | 195.17 | 91.73 |
| Sapotaceae | 182.59 | 85.82 |
| Malvaceae | 154.12 | 72.44 |
| Lecythidaceae | 107.02 | 50.3 |
| Myristicaceae | 89.5 | 42.07 |
| Simaroubaceae | 69.47 | 32.65 |
| Cecropiaceae | 62.14 | 29.21 |
| Burseraceae | 56.98 | 26.78 |
| Apocynaceae | 52.47 | 24.66 |
| Humiriaceae | 46.12 | 21.68 |
| Olacaceae | 41.21 | 19.37 |
| Anacardiaceae | 33.15 | 15.58 |
| Meliaceae | 30.03 | 14.11 |
| Apocynaceae | 26.49 | 12.45 |
| Calophyllaceae | 25.98 | 12.21 |
| Myristicaceae | 21.04 | 9.89 |
| Hypericaceae | 18.95 | 8.91 |
| Vochysiaceae | 17.89 | 8.41 |
| Salicaceae | 16.31 | 7.67 |
| Phyllanthaceae | 16.19 | 7.61 |
| Bignoniaceae | 8.2 | 3.86 |
| Lauraceae | 6.01 | 2.83 |
| Urticaceae | 4.05 | 1.9 |
| Rubiaceae | 3.07 | 1.44 |
| Araliaceae | 0.71 | 0.34 |
Table 10.
Conservation status of recorded tree species (DBH ≥ 10 cm) in a tropical rainforest (TRF) of the Colombian Pacific region.
Table 10.
Conservation status of recorded tree species (DBH ≥ 10 cm) in a tropical rainforest (TRF) of the Colombian Pacific region.
| Scientific name | Family | IUCN status |
|---|---|---|
| Chrysophyllum cainito | Sapotaceae. | LC |
| Pithecellobium latifolium | Fabaceae | CR |
| Brosimum utile | Moraceae | LC |
| Eschweilera sclerophylla | Lecythidaceae | LC |
| Pourouma cecropiifolia | Cecropiaceae | LC |
| Inga edulis | Fabaceae | LC |
| Sterculia apetala | Malvaceae | LC |
| Simaba cedron | Simaroubaceae | LC |
| Minquartia guianensis | Olacaceae | LC |
| Carapa guianensis | Meliaceae | LC |
| Gustavia superba | Lecythidaceae | LC |
| Bursera tomentosa | Burseraceae | LC |
| Lunania parviflora | Salicaceae | LC |
| Calophyllum mariae | Calophyllaceae | NE |
| Protium colombianum | Burseraceae | LC |
| Hymenaea courbaril | Fabaceae | LC |
| Couma macrocarpa | Apocynaceae | LC |
| Sacoglottis procera | Humiriaceae | CR |
| Ceiba pentandra | Malvaceae | LC |
| Compsoneura atopa | Myristicaceae | LC |
| Brosimum guianense | Moraceae | LC |
| Tapirira guianensis | Anacardiaceae | LC |
| Patinoa almirajo | Malvaceae | LC |
| Osteophloeum platyspermum | Myristicaceae | LC |
| Pourouma tomentosa | Urticaceae | LC |
| Aspidosperma crypticum | Apocynaceae | NE |
| Aspidosperma excelsum | Apocynaceae | LC |
| Helianthostylis sprucei | Moraceae | LC |
| Tapirira myriantha | Anacardiaceae | NE |
| Phyllanthus acuminatus | Phyllanthaceae | LC |
| Ochroma pyramidale | Malvaceae | LC |
| Alibertia edulis | Rubiaceae | LC |
| Crescentia cujete | Bignoniaceae | LC |
| Nectandra acutifolia | Lauraceae | LC |
| Dipteryx oleifera | Fabaceae | LC |
| Manilkara bidentata | Sapotaceae | LC |
| Aniba perutilis | Lauraceae | VU |
| Dendropanax arboreus | Araliaceae | LC |
| Hieronyma alchorneoides | Phyllanthaceae | LC |
| Dussia lehmannii | Fabaceae | LC |
| Huberodendron patinoi | Malvaceae | VU |
| Clarisia biflora | Moraceae | LC |
| Vismia panamensis | Hypericaceae | NE |
| Virola sebifera | Myristicaceae | LC |
| Vochysia ferruginea | Vochysiaceae | LC |
NT: Near Threatened, VU: Vulnerable, EN: Endangered, CR: Critically Endangered, NE: Not Evaluated, LC: Least Concern.
Disclaimer/Publisher’s Note: The statements, opinions and data contained in all publications are solely those of the individual author(s) and contributor(s) and not of MDPI and/or the editor(s). MDPI and/or the editor(s) disclaim responsibility for any injury to people or property resulting from any ideas, methods, instructions or products referred to in the content. |
© 2025 by the authors. Licensee MDPI, Basel, Switzerland. This article is an open access article distributed under the terms and conditions of the Creative Commons Attribution (CC BY) license (http://creativecommons.org/licenses/by/4.0/).
Copyright: This open access article is published under a Creative Commons CC BY 4.0 license, which permit the free download, distribution, and reuse, provided that the author and preprint are cited in any reuse.


