Submitted:
11 September 2025
Posted:
12 September 2025
You are already at the latest version
Abstract
Understanding production interdependencies is essential for economic modeling, yet existing approaches to constructing large-scale input-output networks are resource-intensive and demand specialized expertise. This study introduces an AI agent-based framework that leverages Large Language Models (LLMs) in conjunction with the Harmonized System (HS) classification of goods to infer and validate production linkages. The method automates the identification of input-output relationships at both the two-digit (HS2) and four-digit (HS4) levels, reducing reliance on manual mapping. The resulting networks are assessed through structural comparison with the World Input-Output Database (WIOD) and statistical analysis of international trade data. Structural validation demonstrates high recall and strong temporal stability, while statistical evaluation confirms that the majority of inferred input-output pairs align with observed trade flows and exhibit positive import-export correlations. These findings indicate that LLMs can effectively reason about and model production processes, providing a scalable and systematic alternative to conventional methods. Overall, this work highlights the potential of LLM-driven approaches to advance the analysis of production structures and offers practical implications for applications in trade analysis, economic modeling, and industrial policy.
Keywords:
input-output analysis
; production networks
; AI agents
; large language models (LLMs)
; harmonized system (HS)
; economic modeling
; world input-output database (WIOD)
1. Introduction
Understanding the relationships between input and output goods is fundamental for analyzing production processes, supply chains, and broader economic networks. Traditional approaches to constructing input-output models rely on extensive data collection, manual classification, and sector-specific expertise, making the process both time-consuming and resource-intensive. Recent advancements in Large Language Models (LLMs) offer a promising alternative by enabling the automated identification of production dependencies based on general economic knowledge and reasoning capabilities.
In our study, we propose an AI agent-based approach to identifying input-output relationships using the Harmonized System (HS) classification. Specifically, we use an LLM to determine the necessary input goods required for the production of a given output product. Our approach is applied at both the two-digit (HS2) and four-digit (HS4) levels of the HS classification, allowing for analysis at varying levels of granularity. By systematically querying the LLM, we construct a directed input-output network that captures production dependencies between products.
The proposed methodology consists of three key steps. First, we construct an initial input-output network at the HS2 level to establish broad production relationships between product categories. Second, we refine this network to the HS4 level, increasing the level of detail by identifying specific product-level dependencies. Third, we validate the HS4-based network using an LLM-driven approach.
This research contributes to the literature by demonstrating that large language models can be used to infer production relationships and construct large-scale input-output networks. The contribution is twofold. First, it advances economic modeling by generating a comprehensive input-output network, and second, it evaluates the ability of LLMs to analyze production processes. The findings have important implications for economic modeling, trade analysis, and industrial policy, providing a scalable and systematic approach that offers an alternative to traditional data collection and classification methods.
2. Related Work
The research on input-output models and networks has expanded across many domains, including methodological advancements, database development, economic analysis, and industrial optimization applications.
Several studies have focused on improving the construction and integration of input-output models. In [1], Rodrigues et al. introduce a network-based approach for assembling and linking input-output models, addressing issues related to the absence of uniform flow data. In [2], Wachs et al. present a modular bottom-up approach for developing Physical Input-Output Tables (PIOTs) using process engineering models, which enables better automation and physical accuracy. Additionally, in [3], Xu et al. explore input-output network analysis, demonstrating its potential to enhance economic structure understanding using modern network analysis techniques.
The development and organization of large-scale input-output databases have also been widely studied. The World Input-Output Database (WIOD) is discussed by Timmer et al. [4], who provide an overview of its structure and applications in global economic research. Cerina et al. [5] analyze WIOD from a network perspective, examining structural properties and changes in international production systems. Another study [6] applies Markovian modeling to assess the evolution of the global input-output network, using time series analysis to investigate economic interdependencies.
Network-based methods have been applied extensively to study economic structures. Carvalho examines how production networks propagate economic shocks and affect aggregate fluctuations [7]. Another study [8] employs a random-walk approach to detect communities in the global input-output network, improving the understanding of regional economic clusters. Wang et al. [9] introduce a graphlet-based input-output network analysis to optimize production processes in the ethylene industry, demonstrating its usefulness in enhancing industrial efficiency. Also, Carvalho et al., in [10], provide a comprehensive review of macroeconomic production networks, discussing the role of input-output linkages in economic fluctuations and empirical methodologies used to study these effects.
The intersection of economic complexity and input-output models has also gained attention. In [11], Zoran et al. present an interpretable model of economic complexity using Bayesian techniques to assess productive structures. In [12], the authors extend machine learning methods to industrial resilience by combining semantic proximity and economic complexity measures, helping industries adapt to disruptions such as those caused by the COVID-19 crisis.
Recent studies have further expanded the understanding of input diffusion, structural change, and firm-level network reconstruction within input-output networks. Carvalho et al. [13] examine the diffusion of inputs in production networks, showing that firms are more likely to adopt inputs already used by their suppliers, with significant long-term effects on technological evolution. Giammetti et al. [14] analyze the European production network in the context of Brexit, identifying key industries and their systemic importance to trade relationships. Valentinyi [15] explores structural transformation and productivity growth, emphasizing the role of sectoral input-output linkages in aggregate total factor productivity (TFP) and economic development. Mundt [16] investigates the formation of input-output architecture in the European Union, employing a stochastic actor-oriented model to estimate the evolution of input-output networks and addressing key issues related to endogeneity and dynamic network effects on aggregate economic outcomes.
Other works have focused on the dynamics and structural changes within production networks. In [17], Gaggle et al. investigate structural transformation in input-output and investment networks, highlighting the declining role of goods sectors and the increasing prominence of services. In [18], Bacilieri et al. address the challenge of reconstructing firm-level input-output networks from incomplete data, proposing a maximum entropy approach to estimate transaction values. In [19], Hang et al. develop a framework for assessing misallocation in input-output networks, revealing that standard value-added models may underestimate productivity losses when intermediate input distortions are present. In [20], Liu et al. introduce a dynamic model of input-output networks, incorporating adjustment costs and demonstrating that temporary shocks to upstream sectors can have significant long-term economic impacts.
Overall, these works contribute to the advancement of input-output modeling, network-based economic analysis, and industrial applications, demonstrating the increasing relevance of network approaches in understanding and optimizing economic structures.
3. Methodology
In this section, we describe the methodology for constructing input-output production networks. First, we outline the classification system used to categorize products (i.e., goods). Next, we explain the AI agent-based approach for constructing the networks. Finally, we detail the validation process, which involves using international trade data and correlation-based methods to assess the accuracy of the constructed network.
3.1. Product Classification
In our research, we use the Harmonized System1 for classifying goods, as it provides a standardized framework for categorizing products based on their economic function and material composition. This classification system is widely used in international trade and economic analysis, making it well-suited for our objective of identifying input-output relationships between goods.
The HS classification is structured into four hierarchical levels: sections, chapters, headings, and subheadings. Sections and chapters define broad categories of goods, offering a high-level classification of product groups. Headings and subheadings provide more detailed categorizations, differentiating products based on specific characteristics. Each product within the HS system is assigned a six-digit code, where the first two digits represent the chapter under which the product is classified, the next two digits correspond to the heading within that chapter, and the final two digits indicate the subheading within the heading.
For our study, we focus on the second and third hierarchical levels, chapters (HS2) and headings (HS4), which correspond to two-digit and four-digit HS codes, respectively. The HS2 classification provides a broad overview of product categories, allowing us to establish general input-output relationships, while the HS4 classification offers a more detailed representation, capturing product-level dependencies. We consider these levels to be the most appropriate for our analysis as they provide a sufficient level of detail while maintaining a clear and structured classification of goods.
3.2. Construction of the Input-Output Production Network
We define an input-output production network as , where V represents the set of all identified vertices, either product categories at the two-digit level (HS2) or individual products at the four-digit level (HS4) of the Harmonized System, depending on the level of classification used. The set E consists of directed edges , where . Each directed edge signifies that the input product or category i is required for the production of the corresponding output product or category o. This network structure enables the representation of production dependencies at different levels of granularity, providing insight into the relationships between inputs and outputs across industries.
We employ an AI agent-based workflow consisting of three sequential steps to construct input-output production networks. First, the LLM generates an initial input-output network by identifying production relationships between product categories classified at the two-digit level of the Harmonized System. This step establishes a broad structural foundation and captures high-level interdependencies in production. Next, the LLM expands on this foundation by refining the network to the four-digit level of the Harmonized System. It systematically maps the input-output relationships between product categories at the HS2 level, as products at the HS4 level, while maintaining the structure established at the HS2 level. This process enhances the network’s granularity, capturing more specific production dependencies. Finally, the LLM evaluates and validates the input-output production network at the HS4 level. For each output good, it reviews all proposed input goods and determines whether they are essential for production. Only confirmed input-output relationships are retained, ensuring the final directed HS4-based network accurately reflects real production dependencies. In Figure 1, we illustrate each stage of the process, from the initial network generation to the final validation step, highlighting the role of the LLM in identifying and refining the input-output relationships.
3.2.1. Development of the HS2-Based Input-Output Network
To construct the HS2-based input-output network, we first generate all possible ordered pairs of product categories classified under the Harmonized System at the two-digit level. In each pair, the first category represents the potential input, while the second represents the potential output. Next, the LLM systematically evaluates each ordered pair to determine whether any goods within the input category are necessary for producing goods in the output category. The LLM is explicitly instructed to provide a binary response, either "Yes" or "No", to indicate the presence or absence of a production relationship. Based on these responses, we construct a directed network where nodes represent HS2 product categories, and directed edges signify the determined input-output dependencies. This network provides a structured representation of production relationships between product categories based on the HS2 classification. In Figure 2 and Figure 3, we present the system prompt and user prompt, respectively.
3.2.2. Refinement to an HS4-Based Input-Output Network
To construct the HS4-based input-output network, we examine each directed edge in the previously constructed HS2-based network. For each input category and its corresponding output category at the HS2 level, we identify all individual products classified under the Harmonized System at the four-digit level. We then generate all possible ordered pairs of input and output products within these HS2 categories. For each ordered pair, the LLM determines whether the input good is required for the production of the output good. The LLM is explicitly instructed to provide a binary response, either "Yes" or "No", to indicate the presence or absence of a production dependency. We provide the system prompt and user prompt used for prompting the LLM in Figure 4 and Figure 5, respectively. This process ensures that the HS4-based input-output network is constructed with a higher level of detail, capturing more precise production dependencies while maintaining consistency with the broader HS2-based structure.
- Box 1: The user prompt used in the construction of the input-output production network based on the HS4 classification
3.2.3. Validation of the HS4-Based Input-Output Network
In the final step, the LLM validates the HS4-based input-output network to ensure the accuracy of the identified production relationships. For each output good in the network, we retrieve the set of all associated input goods. Specifically, we identify all ordered pairs , where i belongs to the input set if and only if . The LLM then evaluates all ordered pairs , determining which inputs are indeed required for producing the given output. This assessment is based on general knowledge, logical reasoning, and industry practices. Only validated input-output relationships are retained, ensuring that the final HS4-based network accurately reflects real-world production dependencies. The system and user prompts used in the validation process are provided in Figure 6 and Figure 7.
3.3. Validation of the Constructed Networks
To validate the constructed input-output production networks, we conduct a structural and a statistical analysis.
We validate the HS2-based network using WIOD [21] as a reference. Each HS2 product is mapped to an ISIC2 industry, and WIOD is filtered to include only these mapped sectors. We then build an input-output table showing monetary flows between sectors. A directed link from sector to is inferred if the flow from to is greater than the average flow from to all other sectors. This WIOD-based network serves as a ground truth. We compare it to our constructed network to identify false positives (links in our network but not in WIOD) and false negatives (links in WIOD but missing from our network). Since WIOD covers 2000–2014, we also check whether each link is persistent over time, focusing on temporal coherence.
Meanwhile, the statistical analysis validates the final HS4-based network. It consists of two key steps: flow analysis and correlation analysis, based on international trade data. In the flow analysis, we assess whether a country that exports a given output also imports the necessary inputs identified in the network. It is important to note that this assumption does not always hold, as some inputs may be produced domestically rather than imported. However, to validate the network, we proceed with this assumption to evaluate the overall consistency of input-output relationships. In the correlation analysis, we examine whether there is a strong positive Spearman correlation between the imported value of an input and the exported value of the corresponding output. This analysis is conducted for each input-output pair in the network across all countries in the dataset. A significant positive correlation further supports the validity of the identified production dependencies.
3.3.1. World Input-Output Database (WIOD)
For structural validation, we use data from the World Input-Output Database (WIOD)3. WIOD provides harmonized input-output tables across countries, capturing inter-industry monetary flows based on the ISIC classification. The dataset covers 43 countries and a "rest of the world" aggregate for 56 industry sectors over 15 years (2000–2014) with annual resolution. It includes both national and international production linkages between industry sectors, enabling the reconstruction of global value chains. This makes WIOD a suitable reference for evaluating the structural consistency of the HS2-based input-output network.
3.3.2. Structural Analysis
If the constructed input-output production network shows that product is used as an input to produce product , and product is associated with industry while product is associated with industry , then we can infer that industry relies on inputs from industry . This forms the basis for identifying inter-industry linkages. The core idea behind structural analysis is that if industry depends on inputs from industry , we should consistently observe significant monetary flows from to over time.
For our structural analysis, we use data from the WIOD, specifically the world input-output tables covering the years 2000 to 2014. These tables report monetary flows between industries, both within and across countries. To construct a global inter-industry transaction matrix, we aggregate the monetary flows from industry to industry across all regions r. This means we sum all flows from to , regardless of the country or region. The result is a single-region (world) input-output model that captures industry-to-industry linkages without considering regional differences.
We then map each HS2 product from the input-output production network to an ISIC industry from the aggregated world input-output table. This step converts the product-level input-output network into an industry-level network. Formally, this involves defining a many-to-one mapping from the set of HS2 products P to the set of industries S in the input-output table. Every product in P is assigned to an industry in S, but not every industry in S has a product mapped to it. In other words, the mapping is not a surjection. We denote the subset of industries in S that have at least one mapped product as .
In addition to the translated HS2-based network, we construct a "ground-truth" structural network from the WIOD. To do this, we consider all pairs of industries , and compute the Relative Input Intensity index as defined in Equation 1. Here, denotes the monetary flow from industry to industry in year t. The index measures how large the flow from to is, relative to the average flow from to all industries in in that same year. This gives us a normalized measure of the strength of the connection from to over time.
Next, we construct a structural network for each year t from 2000 to 2014. In each year’s network, we include a directed edge from industry to industry if the Relative Input Intensity index . This indicates that the flow from to is higher than the average flow from to all industries in for that year, suggesting a meaningful structural link. If , no edge is added.
Then, we evaluate the "industry-translated" HS2-based input-output network by comparing it to each structural network for the years from 2000 to 2014. Specifically, we classify the links in the HS2-based network as true positives (links that match those in the structural network), false positives (links present in the HS2-based network but not in the structural network), true negatives (links correctly absent in both networks), and false negatives (links missing in the HS2-based network but present in the structural network). Based on these classifications, we compute standard evaluation metrics: precision, recall, and F1 score. This allows us to assess how well the product-level network captures the underlying industry-level structure and its stability over time.
As a final step, we assess the temporal consistency of each predicted edge in the HS2-based network. For each edge, we check whether its corresponding Relative Input Intensity (RII) is greater than 1 in a given percentage of years between 2000 and 2014. This allows us to identify edges that represent persistent structural links, rather than those that appear only sporadically. By incorporating this temporal dimension, we ensure that the evaluation accounts not only for accuracy in individual years but also for the stability of inter-industry relationships over time.
3.3.3. Global Trade Data
For statistical validation, we use international trade data from the United Nations (UN) Comtrade database4. This dataset contains detailed records of import and export values classified at the four-digit HS4 level. It covers 243 countries over a 28-year period (1994–2021) with annual granularity. The dataset captures country-to-country trade flows for all HS4-classified products, allowing for a precise analysis of trade patterns. This level of detail provides a solid foundation for assessing global trade flows and validating the constructed HS4-based input-output production network.
3.3.4. Flow Analysis
The flow analysis aims to determine whether a country that exports a specific output also imports the necessary inputs identified in the input-output network. As previously noted, this assumption does not always hold since some inputs may be produced domestically rather than imported. However, for network validation, we proceed with this assumption.
For each output product in the network, we analyze all countries and years in which that product is exported. We then check whether the exporting country, in the corresponding year, imports the identified input products from the network. To account for the possibility of domestic production, we consider an input-output relationship as validated if the country imports either all or all but one of the required inputs.
To formalize the flow analysis, let be the set of all ordered pairs , where o is an output good in the input-output production network . The set represents the inputs required to produce o, meaning that and is a non-empty set containing all inputs such that .
For each ordered pair , we identify all ordered pairs , where Y is the set of years and C is the set of countries in our dataset, for which country c exports the output product o in year y. Let this set be denoted as S. For each , we then determine whether country c imports all or all but one of the inputs . Let the subset of S that satisfies this condition be denoted as . As a result of this analysis, for each , we compute the proportion , which indicates the extent to which the production relationship between the output product o and its associated inputs is validated.
3.3.5. Correlation Analysis
The correlation analysis examines whether a strong positive Spearman correlation exists between each input-output pair in the network. For each directed edge, we assess the monotonic relationship between the import value of the input product and the export value of the corresponding output product.
To quantify this relationship, we calculate the Spearman correlation coefficient between the imported value of the input product and the exported value of the output product for each country over the period from 1994 to 2021. A moderate to strong positive correlation provides additional evidence supporting the validity of the identified input-output dependencies.
Formally, for each edge in the input-output production network , we identify all countries that import the input product i and export the output product o for each year , where Y is the set of years and C is the set of countries in the dataset. Let denote this subset of countries. Then, for each , we check if the Spearman correlation coefficient s between the imported value of i and the exported value of o over the time period T is greater than 0.3. The time period T is the ordered sequence of years . Let the subset of that satisfies this condition be denoted as . As a result of this analysis, for each , we compute which represents the proportion of countries for which the input-output relationship is supported by a moderate to strong positive correlation.
4. Results
In this section, we present the constructed input-output networks and the results from the structural and statistical analyses. The constructed input-output networks are available in the public GitHub repository at https://github.com/peshevskidimitar/io-production-networks.
4.1. The Constructed Input-Output Networks
In our methodology, we construct three distinct input-output networks: (1) the HS2-based input-output network, which serves as the structural foundation; (2) the raw HS4-based input-output network, which expands upon the HS2 network by incorporating more detailed product classifications; and (3) the validated HS4-based input-output network, which refines the raw HS4 network based on validation procedures.
For the construction of the HS2-based input-output network, we use GPT-4o Mini, as the task primarily involves identifying broad input-output relationships between high-level product categories. Similarly, GPT-4o Mini is also used for generating the raw HS4-based input-output network, as this step follows the same structured approach and does not require complex reasoning.
However, we employ a more advanced and capable model, GPT-4o, for the validation process. This decision is based on the need for more precise assessments of production dependencies, as validation requires deeper reasoning, domain knowledge, and the ability to differentiate between essential and non-essential inputs in real-world production processes.
The constructed HS2-based input-output network consists of 97 nodes, representing all 97 product categories at the two-digit (HS2) level of the Harmonized System. It contains 976 directed edges, indicating identified input-output relationships among these categories. We present the constructed HS2-based input-output network in Figure 8. For the layout of the network, we use the Fruchterman-Reingold algorithm [22].
The raw HS4-based input-output network consists of 1 254 nodes, representing 1 254 of the 1 260 products classified at the four-digit (HS4) level of the Harmonized System. This network contains 18 159 directed edges, indicating the identified input-output relationships between these products.
The validated HS4-based input-output network, which incorporates an additional validation step based on assessments from an LLM, consists of 1 243 nodes, representing 1 243 of the 1 260 HS4 products. This network contains 7 288 directed edges, indicating the validated input-output relationships between these products. In Figure 9, we present the validated input-output network based on the HS4 classification. As in the case of the HS2-based network, for the layout, we use the Fruchterman-Reingold algorithm.
Furthermore, we provide an interactive visualization of both the HS2-based and the validated HS4-based input-output networks on our online platform. This tool allows users to explore the structure of the networks, examine specific input-output relationships, and analyze the connections between different product categories. The interactive visualization is accessible at https://data-macedonia.dev.finki.ukim.mk/networks.
Additionally, in Figure 10, we present a specific segment of this network, where "Vinegar" (HS4 code: 2209) is the output product. In this segment, the network identifies three input products required for vinegar production: Grapes (HS4 code: 0806), Micro-Organism Culture Preparations (HS4 code: 3821), and Water (HS4 code: 2201). These inputs align with common industrial vinegar production processes, where fermentation of grape-based substrates with microbial cultures results in acetic acid formation.
4.2. Validation of the Constructed Networks
In this section, we present the results from the structural analysis of the HS2-based IO network and flow and correlation analysis of the final HS4-based IO network.
4.2.1. Structural Validation of the HS2-Based Network
For the structural validation of the HS2-based network, we perform the structural analysis over the initial HS2-based input-output production network as defined in Section 3.3.2.
We evaluate the validity of the constructed HS2-level input-output production network by comparing it to the industry-level structural networks derived from WIOD data over the years 2000–2014. Each structural network is built by identifying industry-to-industry links where the Relative Input Intensity index , indicating above-average input dependence from industry to industry in year t.
Using the product-to-industry mapping, we translate the HS2-based input-output network into a set of predicted inter-industry links. We then compare these predicted links to the structural links in each year’s network. For each year, we compute the number of true positives, false positives, true negatives, and false negatives. From these counts, we calculate precision, recall, and F1 score. We present the results in Table 1.
The results indicate that the "industry-translated" HS2-based network has relatively high recall but low precision. This means that while the network captures a large share of the actual structural dependencies (true positives), it also predicts many links that are not supported by the WIOD-derived structural networks (false positives). The F1 score, which balances precision and recall, remains moderate, around 0.51 to 0.53, reflecting this trade-off.
A possible explanation for the low precision is that the input-output (IO) production network is designed to model direct production relationships between products, whereas the WIOD structural network reflects aggregated monetary flows between industries. Not all direct product-level dependencies necessarily translate into significant inter-industry transactions, especially if the input is low in value, produced in-house, or not captured distinctly in industry-level reporting. This discrepancy can lead to the inclusion of links in the HS2-based network that do not appear in the aggregated WIOD data, contributing to false positives.
Despite this limitation, the performance is consistent across the 15 years, with minimal fluctuations in evaluation metrics. This stability suggests that the product-level network structure is robust over time and consistently captures many core inter-industry connections.
Although the HS2-based network does not achieve high precision, its strong recall and temporal robustness indicate that it is valuable for identifying a comprehensive set of potential structural relationships. These findings support its use in studies of global production systems, particularly where coverage and inference of plausible input-output links are prioritized.
Additionally, we assess the temporal consistency of the predicted links in the HS2-based network by examining how often each link is supported by the WIOD structural networks over the 2000–2014 period. Specifically, we count how many years each link is validated by having a corresponding Relative Input Intensity (RII) greater than 1. We find that 70 links are persistent in at least 10 out of the 15 years, indicating a stable alignment with long-term structural patterns. This temporal persistence reinforces the reliability of many of the inferred production relationships in the HS2-based network and further supports its application in the analysis of global production structures.
4.2.2. Statistical Validation of the Final HS4-Based Network
For the statistical validation of the final HS4-based network, we perform the flow and correlation analysis over the final HS4-based input-output production network as defined in Section 3.3.4 and Section 3.3.5, correspondingly.
In the flow analysis, for each output product in the network, we analyze all countries and years in which that product is exported. We then check whether the exporting country, in the corresponding year, imports the identified input products from the network. To account for the possibility of domestic production, we consider an input-output relationship as validated if the country imports all or all but one of the required inputs. From the flow analysis, we find that 78% of the input-output relationships , where o represents the output product and denotes the set of associated input products required for that output, are validated in more than 80% of the analyzed country and year pairs. This indicates a strong alignment between the constructed input-output relationships and observed international trade patterns.
Since reporting the values for all is impractical, we summarize the results in Table 2. The table presents t and the ratio , where t is the threshold for , and represents the set of for which . Thus, indicates the proportion of validated with .
The correlation analysis shows that 56% of the input-output pairs , where each pair represents a directed edge in the constructed network, have a Spearman correlation coefficient greater than 0.3 in more than 30% of the analyzed countries. This indicates a moderate to strong positive relationship between the import value of the input product i and the export value of the corresponding output product o, supporting the validity of the identified production dependencies.
As in the flow analysis, reporting the values for all individually is impractical. Instead, we summarize the results in Table 3. The table presents the threshold t for proportion and the ratio , where denotes the subset of all with .
5. Conclusion and Future Work
In this study, we introduce an AI agent-based approach to constructing input-output production networks using the Harmonized System classification. By leveraging a large language model, we identified production dependencies at both the HS2 and HS4 levels, creating a structured network of input-output relationships. Our validation process, which incorporated international trade data and statistical analyses, demonstrated the consistency of the constructed network with observed trade patterns. The results showed that the identified production dependencies align well with real-world economic structures, supporting the feasibility of using LLMs for large-scale input-output modeling.
Despite these results, several areas remain for future research. First, the accuracy of the constructed network could be further improved by incorporating additional validation sources, such as firm-level production data or expert knowledge from industry professionals. Second, refining the LLM’s decision-making process by integrating economic constraints or probabilistic reasoning could enhance the reliability of input-output relationships. Third, extending this approach to more granular levels of classification, such as the six-digit HS codes, could provide even more detailed insights into production structures. Finally, exploring the applicability of this method to other economic contexts, such as regional supply chains or sector-specific analyses, could broaden its usefulness in trade and industrial policy research.
Overall, our study demonstrates the potential of LLMs in economic modeling and network analysis. By improving and expanding this approach, future research can contribute to more efficient and scalable methods for understanding global production systems.
Author Contributions
Conceptualization, D.P., L.K. and D.T.; methodology, D.P., L.K. and D.T.; software, D.P.; investigation, D.P., L.K. and D.T.; resources, D.P., L.K. and D.T.; data curation, D.P.; writing—original draft preparation, D.P.; writing—review and editing, D.P., L.K. and D.T.; visualization, D.P.; supervision, L.K. and D.T.. All authors have read and agreed to the published version of the manuscript..
Funding
This research received no external funding.
Data Availability Statement
The data generated during this study is available at the public GitHub repository https://github.com/peshevskidimitar/io-production-networks.
Conflicts of Interest
The authors declare no conflicts of interest.
References
- João Rodrigues, Alexandra Marques, R.W.; Tukker, A. A network approach for assembling and linking input–output models. Economic Systems Research 2016, 28, 518–538. [CrossRef]
- Wachs, L.; Singh, S. A modular bottom-up approach for constructing physical input–output tables (PIOTs) based on process engineering models. Journal of Economic Structures 2018, 7, 26. [Google Scholar] [CrossRef]
- Xu, M.; Liang, S. Input–output networks offer new insights of economic structure. Physica A: Statistical Mechanics and its Applications 2019, 527, 121178. [Google Scholar] [CrossRef]
- Timmer, M.P.; Dietzenbacher, E.; Los, B.; Stehrer, R.; de Vries, G.J. An Illustrated User Guide to the World Input–Output Database: the Case of Global Automotive Production. Review of International Economics 2015, 23, 575–605. [Google Scholar] [CrossRef]
- Cerina, F.; Zhu, Z.; Chessa, A.; Riccaboni, M. World Input-Output Network. PLOS ONE 2015, 10, e0134025. [Google Scholar] [CrossRef] [PubMed]
- Moosavi, V.; Isacchini, G. A Markovian model of evolving world input-output network. PLOS ONE 2017, 12, 1–18. [Google Scholar] [CrossRef] [PubMed]
- Carvalho, V.M. From Micro to Macro via Production Networks. Journal of Economic Perspectives 2014, 28, 23–48. [Google Scholar] [CrossRef]
- Piccardi, C.; Riccaboni, M.; Tajoli, L.; Zhu, Z. Random walks on the world input–output network. Journal of Complex Networks 2017, 6, 187–205. [Google Scholar] [CrossRef]
- Wang, Z.; Han, Y.; Li, C.; Geng, Z.; Fan, J. Input-output networks considering graphlet-based analysis for production optimization: Application in ethylene plants. Journal of Cleaner Production 2021, 278, 123955. [Google Scholar] [CrossRef]
- Carvalho, V.M.; Tahbaz-Salehi, A. Production networks: A primer. Annual Review of Economics 2019, 11, 635–663. [Google Scholar] [CrossRef]
- Utkovski, Z.; Pradier, M.F.; Stojkoski, V.; Perez-Cruz, F.; Kocarev, L. Economic complexity unfolded: Interpretable model for the productive structure of economies. PLOS ONE 2018, 13, 1–24. [Google Scholar] [CrossRef] [PubMed]
- Pachot, A.; Albouy-Kissi, A.; Albouy-Kissi, B.; Chausse, F. Production2Vec: a hybrid recommender system combining semantic and product complexity approach to improve industrial resiliency. In Proceedings of the 2021 2nd International Conference on Artificial Intelligence and Information Systems, New York, NY, USA, 2021; ICAIIS 2021. [CrossRef]
- Carvalho, V.M.; Voigtländer, N. Input diffusion and the evolution of production networks. Technical report, National Bureau of Economic Research, 2014.
- Giammetti, R.; Russo, A.; Gallegati, M. Key sectors in input–output production networks: An application to Brexit. The World Economy 2020, 43, 840–870. [Google Scholar] [CrossRef]
- Valentinyi, A. Structural transformation, input-output networks, and productivity growth. Structural Transformation and Economic Growth (STEG) Pathfinding paper 2021.
- Mundt, P. The formation of input–output architecture: Evidence from the European Union. Journal of Economic Behavior & Organization 2021, 183, 89–104. [Google Scholar] [CrossRef]
- Gaggl, P.; Gorry, A.; Vom Lehn, C. Structural change in production networks and economic growth. Technical report, CESifo Working Paper, 2023.
- Bacilieri, A.; Austudillo-Estevez, P. Reconstructing firm-level input-output networks from partial information. arXiv preprint arXiv:2304.00081 2023.
- Hang, J.; Krishna, P.; Tang, H. Input-output networks and misallocation. Technical report, National Bureau of Economic Research, 2020.
- Liu, E.; Tsyvinski, A. A dynamic model of input–output networks. Review of Economic Studies 2024, 91, 3608–3644. [Google Scholar] [CrossRef]
- Timmer, M.P.; Dietzenbacher, E.; Los, B.; Stehrer, R.; De Vries, G.J. An illustrated user guide to the world input–output database: the case of global automotive production. Review of International Economics 2015, 23, 575–605. [Google Scholar] [CrossRef]
- Fruchterman, T.M.; Reingold, E.M. Graph drawing by force-directed placement. Software: Practice and experience 1991, 21, 1129–1164. [Google Scholar] [CrossRef]
| 1 | |
| 2 | |
| 3 | |
| 4 |
Figure 1.
An illustration of the construction and validation of the input-output production network using an AI agent-based approach.
Figure 1.
An illustration of the construction and validation of the input-output production network using an AI agent-based approach.
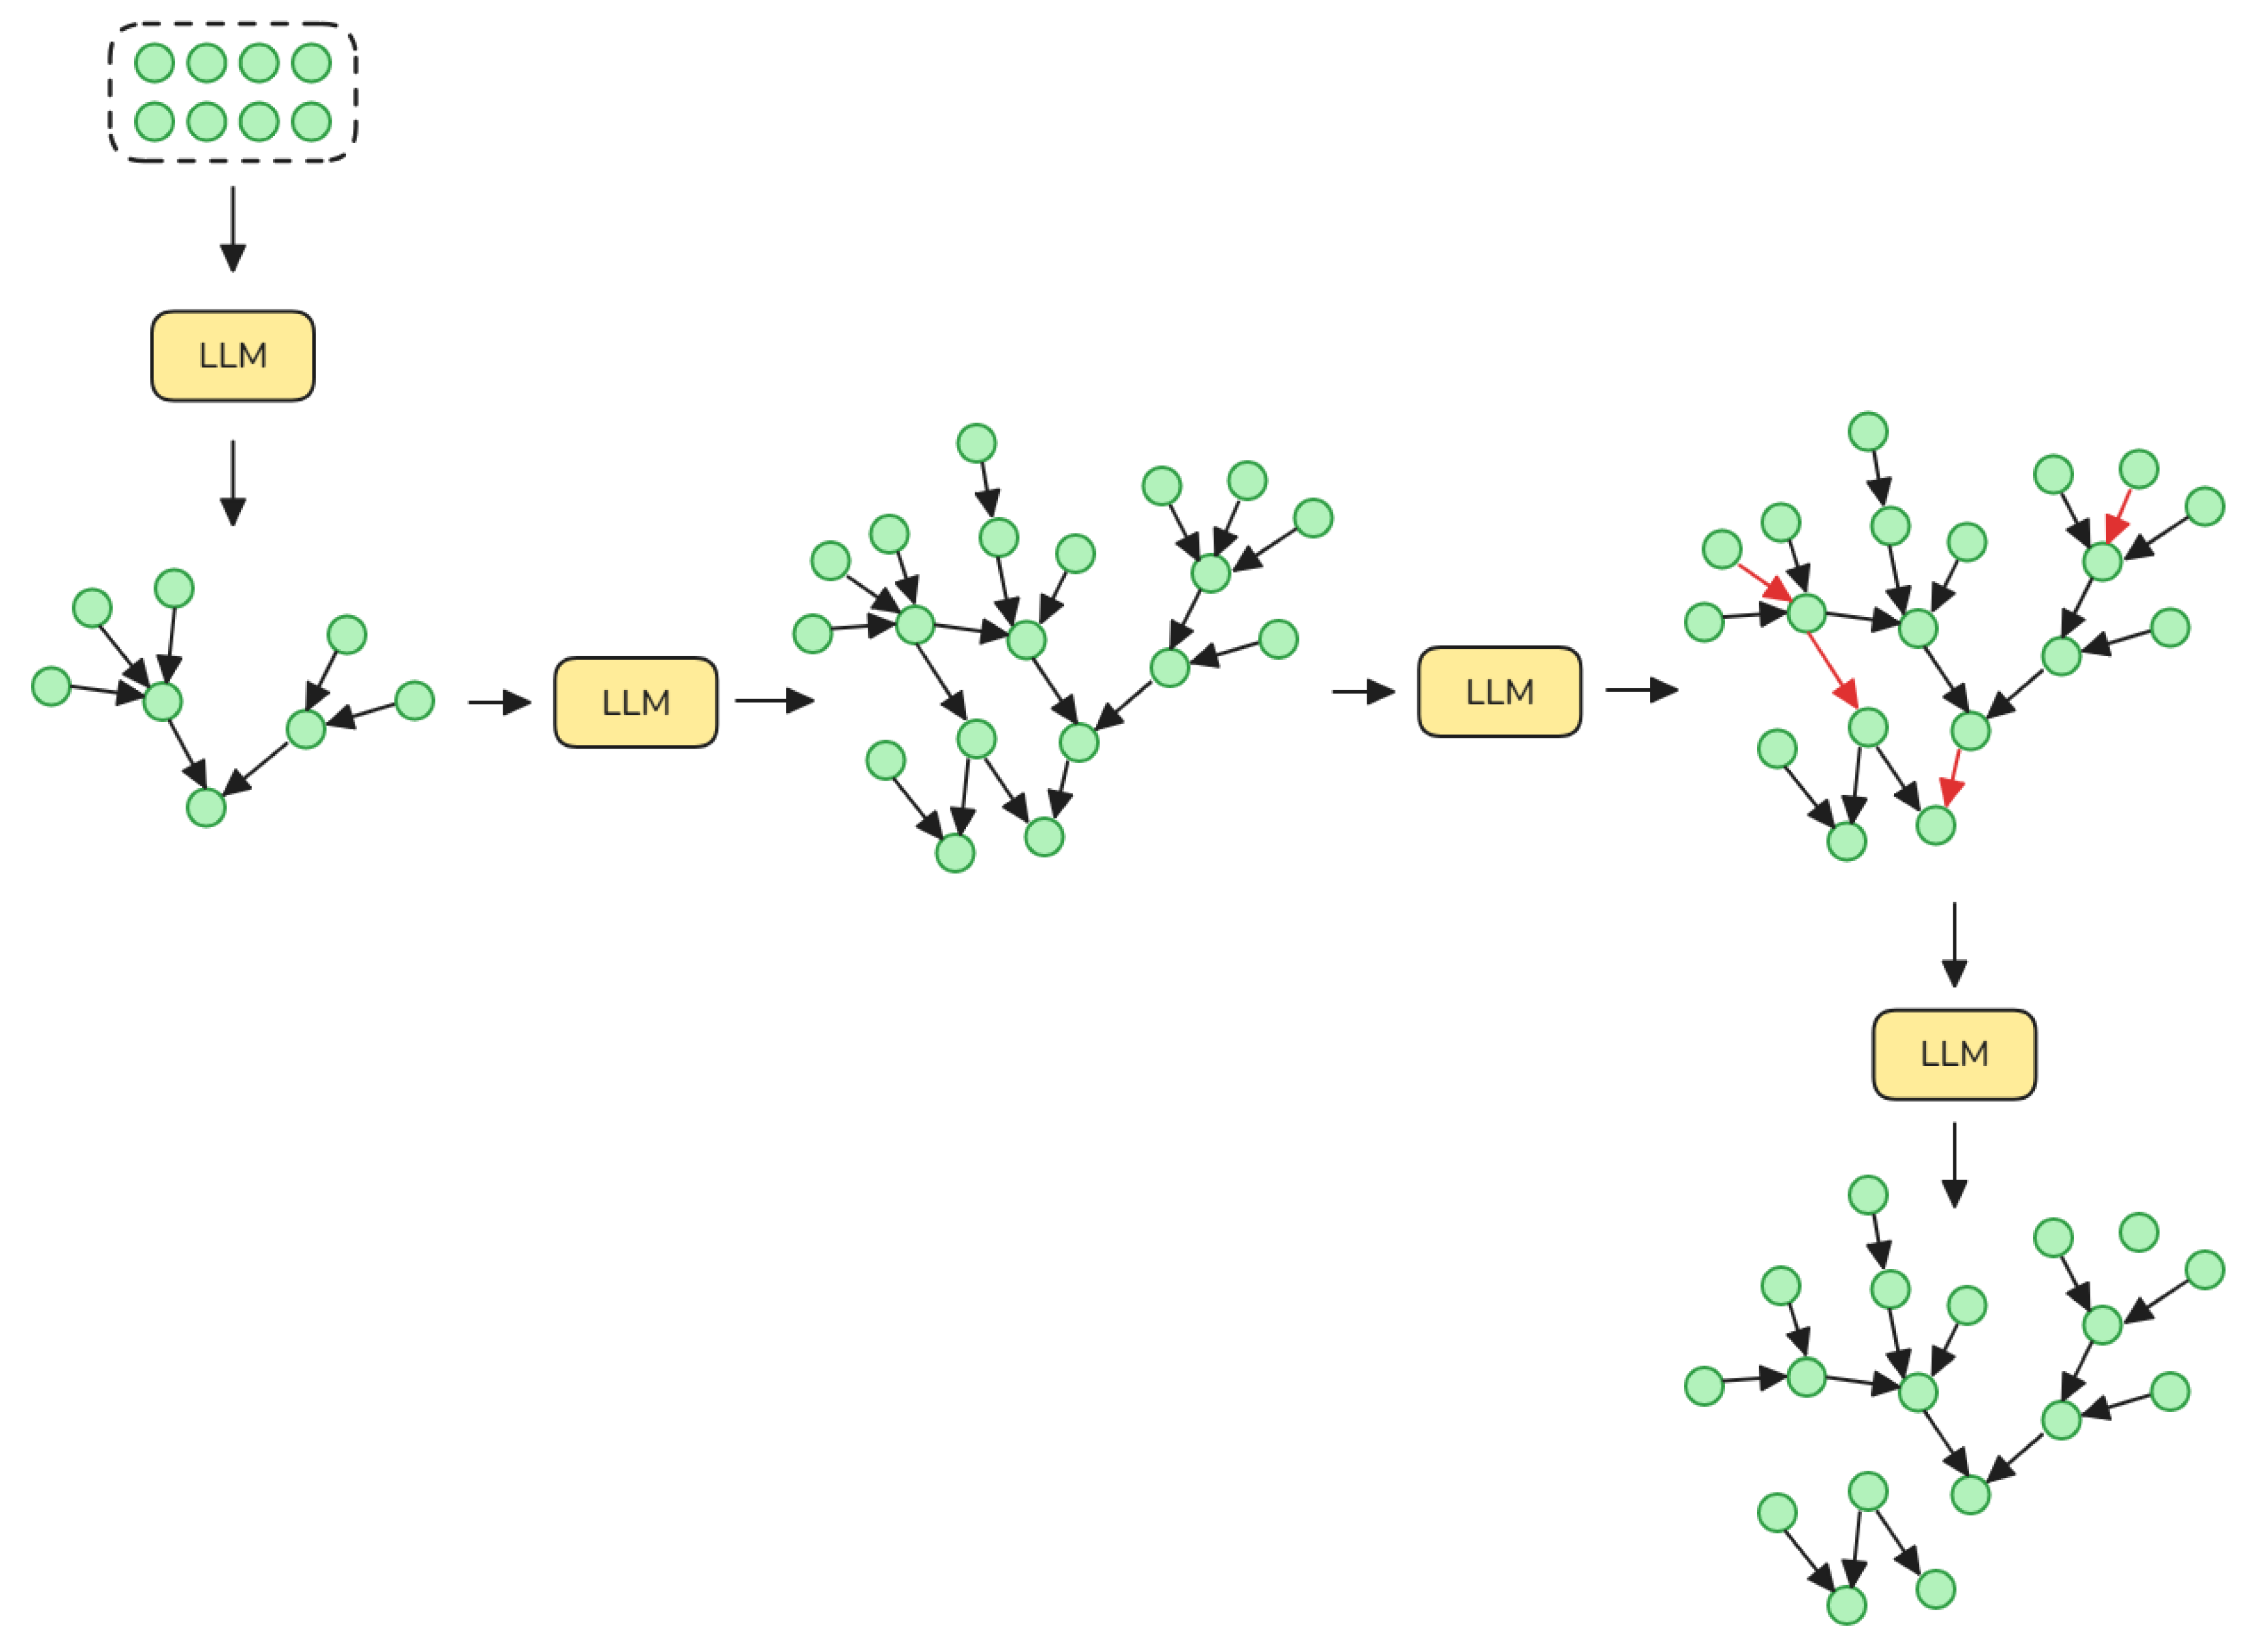
Figure 2.
The system prompt used in the construction of the input-output production network based on the HS2 classification.
Figure 2.
The system prompt used in the construction of the input-output production network based on the HS2 classification.
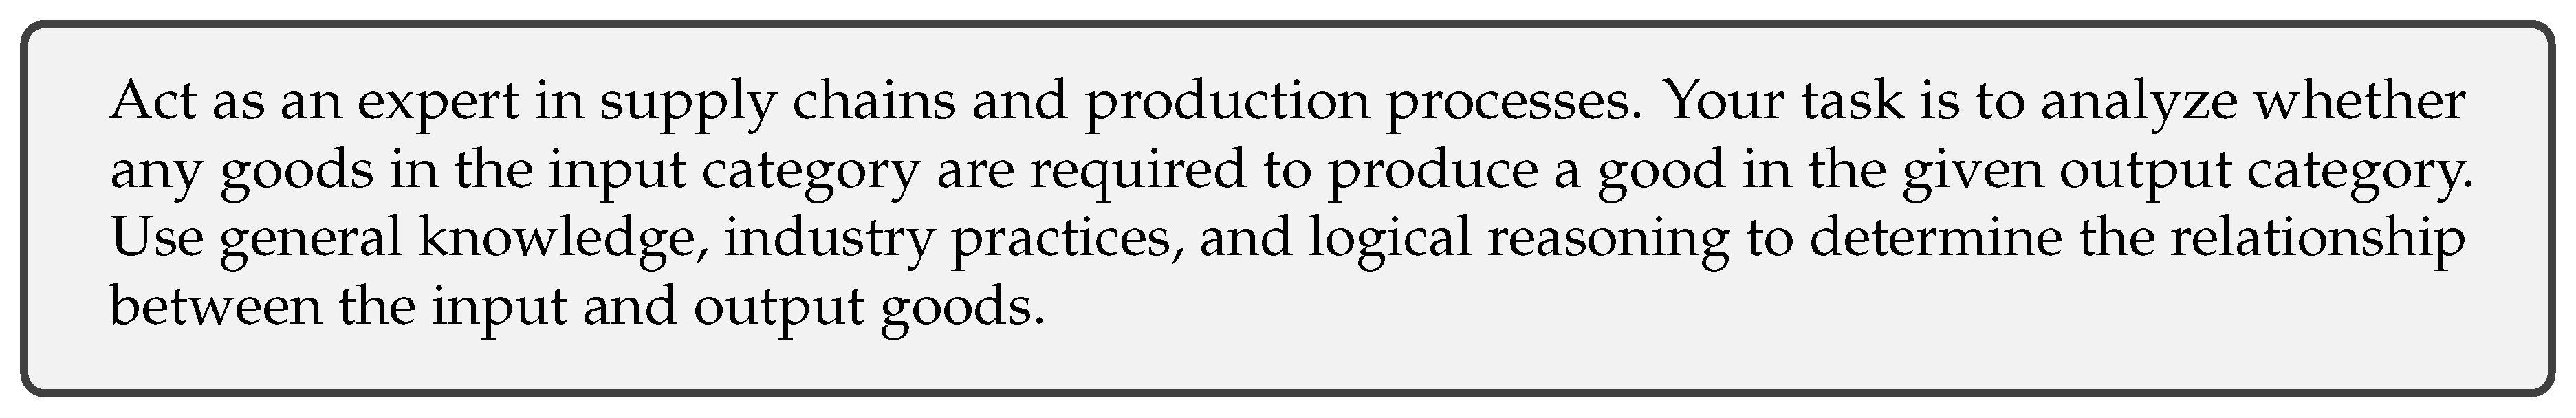
Figure 3.
The user prompt used in the construction of the input-output production network based on the HS2 classification.
Figure 3.
The user prompt used in the construction of the input-output production network based on the HS2 classification.
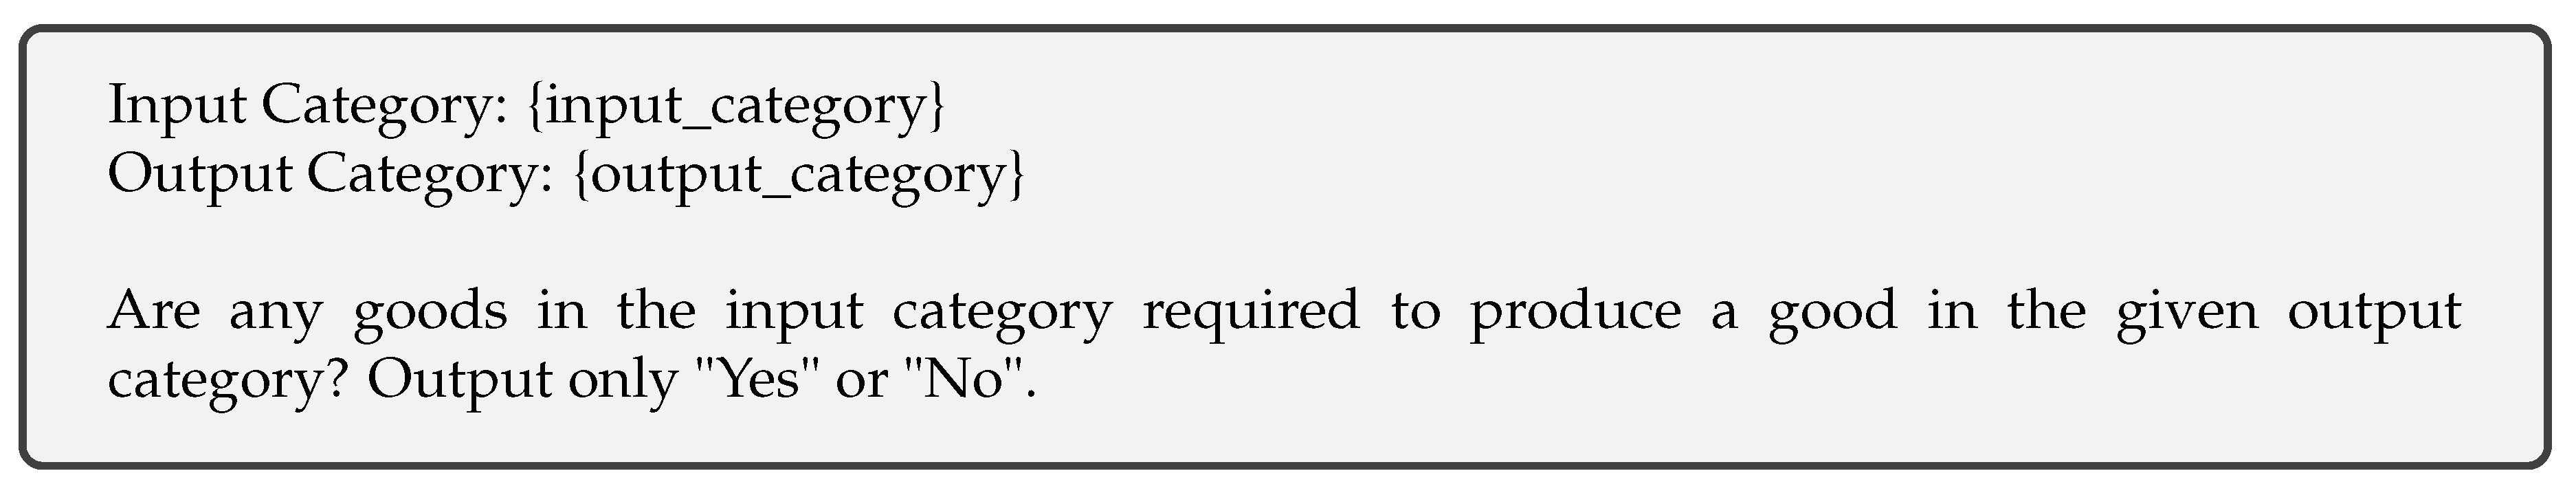
Figure 4.
The system prompt used in the construction of the input-output production network based on the HS4 classification.
Figure 4.
The system prompt used in the construction of the input-output production network based on the HS4 classification.
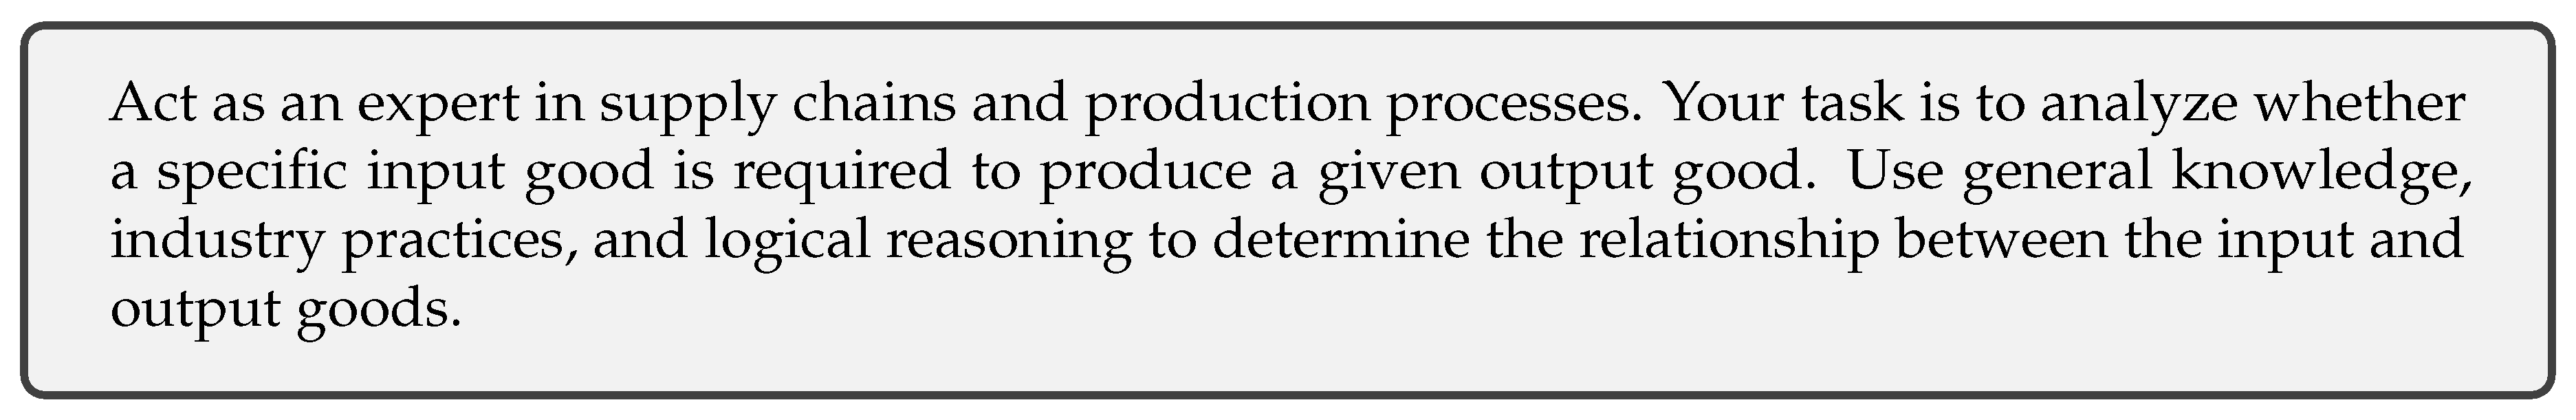
Figure 5.
The user prompt used in the construction of the input-output production network based on the HS4 classification.
Figure 5.
The user prompt used in the construction of the input-output production network based on the HS4 classification.
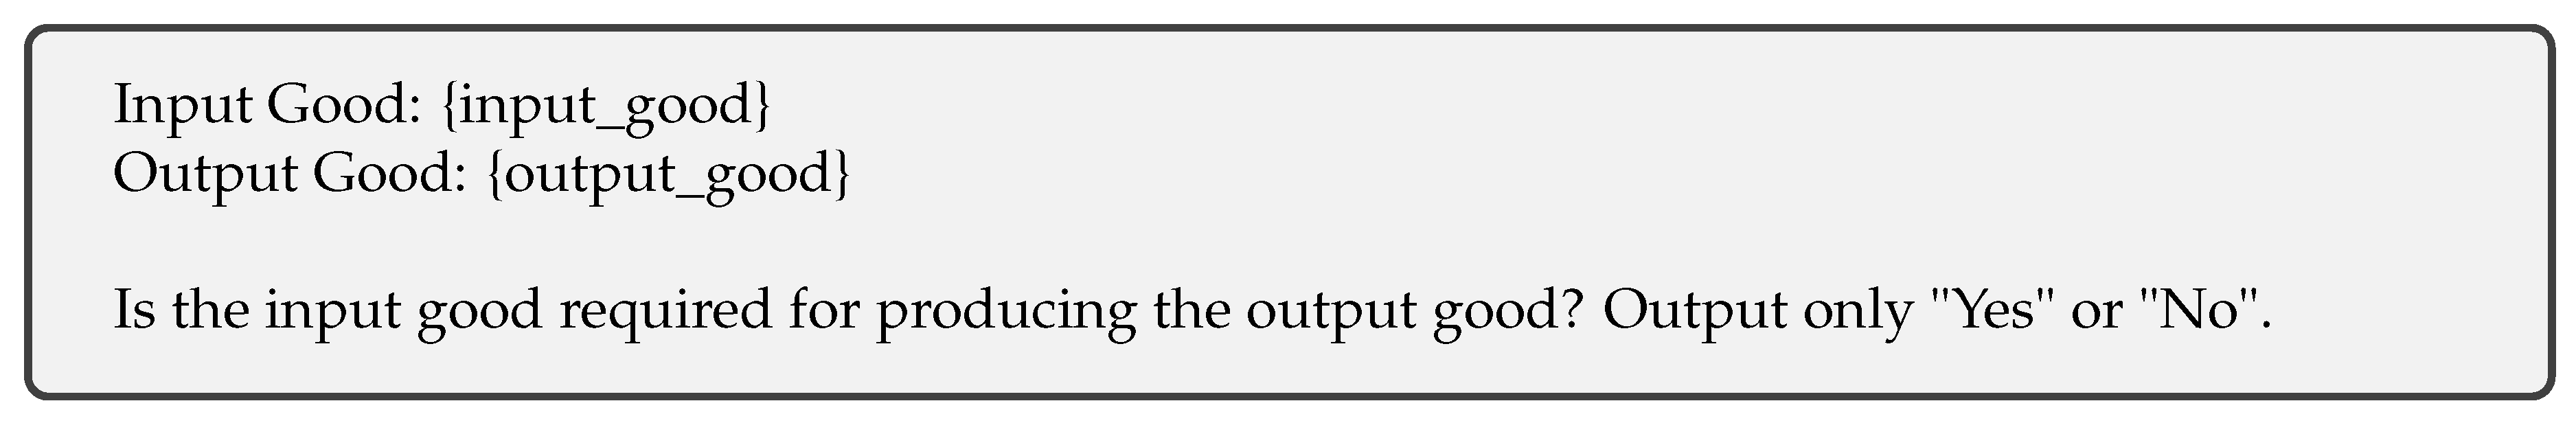
Figure 6.
The system prompt used in the validation of the input-output production network based on the HS4 classification.
Figure 6.
The system prompt used in the validation of the input-output production network based on the HS4 classification.
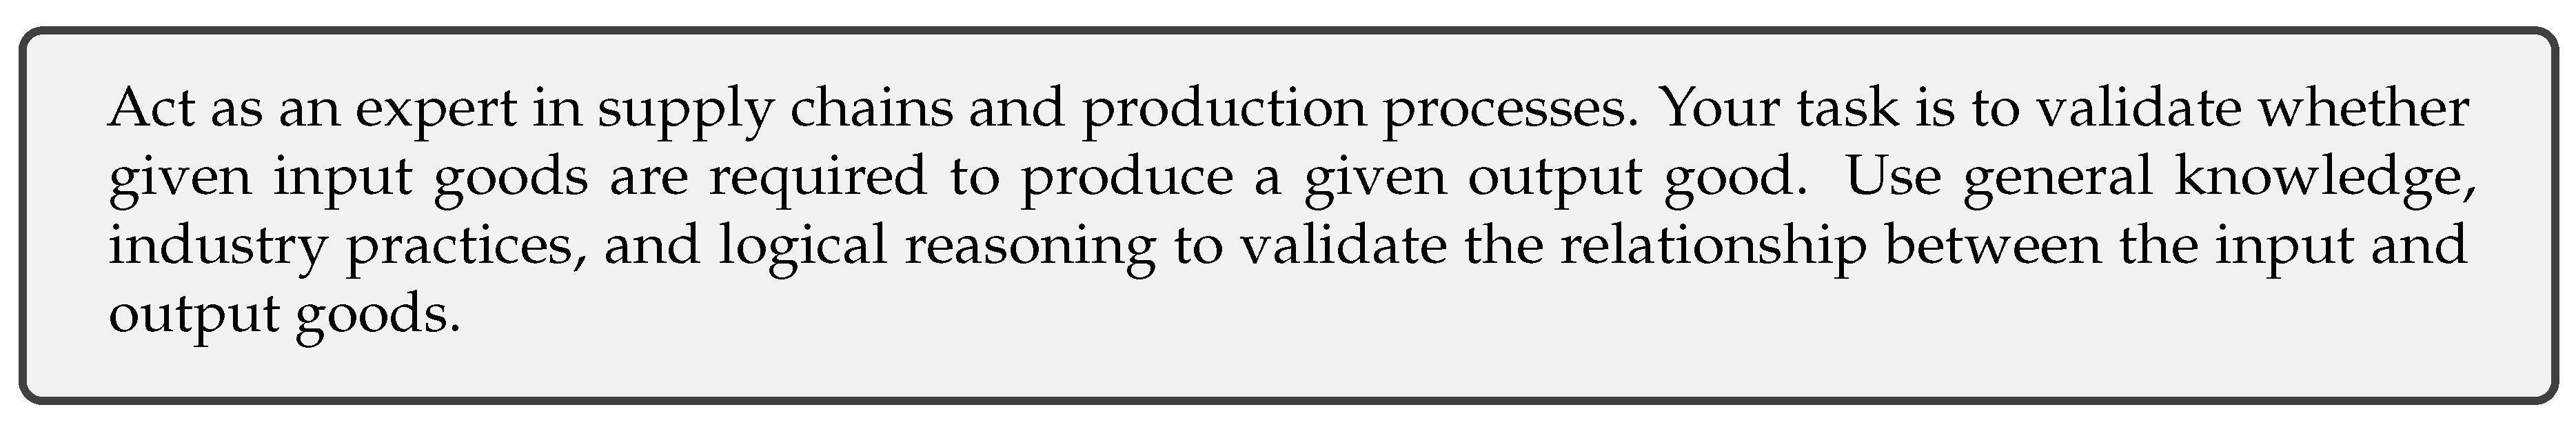
Figure 7.
The user prompt used in the validation of the input-output production network based on the HS4 classification.
Figure 7.
The user prompt used in the validation of the input-output production network based on the HS4 classification.
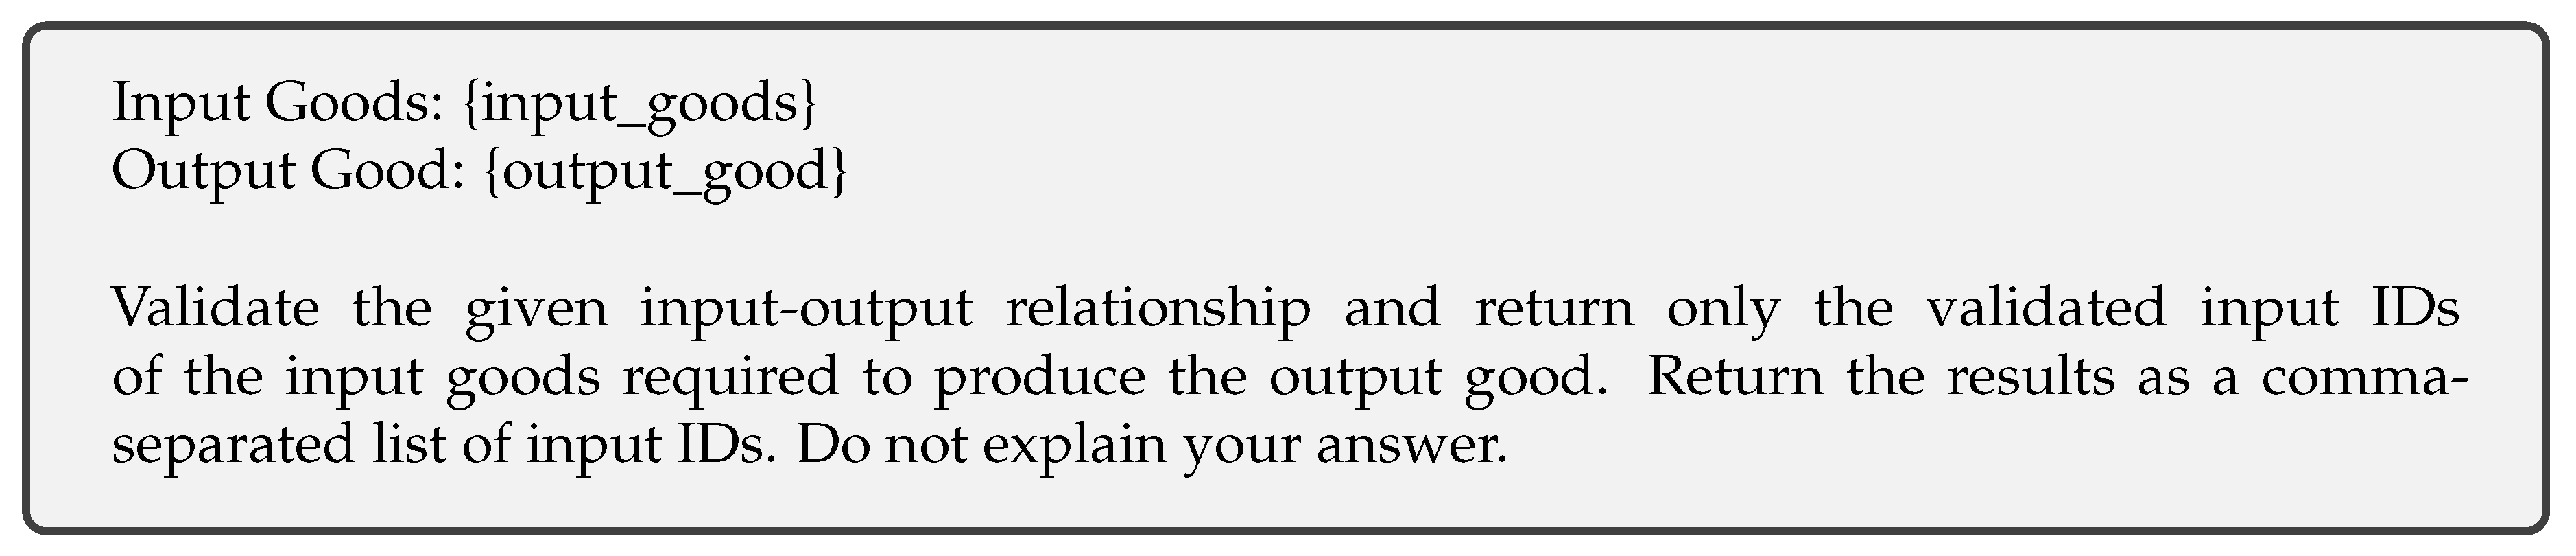
Figure 8.
The constructed input-output production network based on the HS2 classification. The coloring of the nodes represents different sections within the HS classification
Figure 8.
The constructed input-output production network based on the HS2 classification. The coloring of the nodes represents different sections within the HS classification
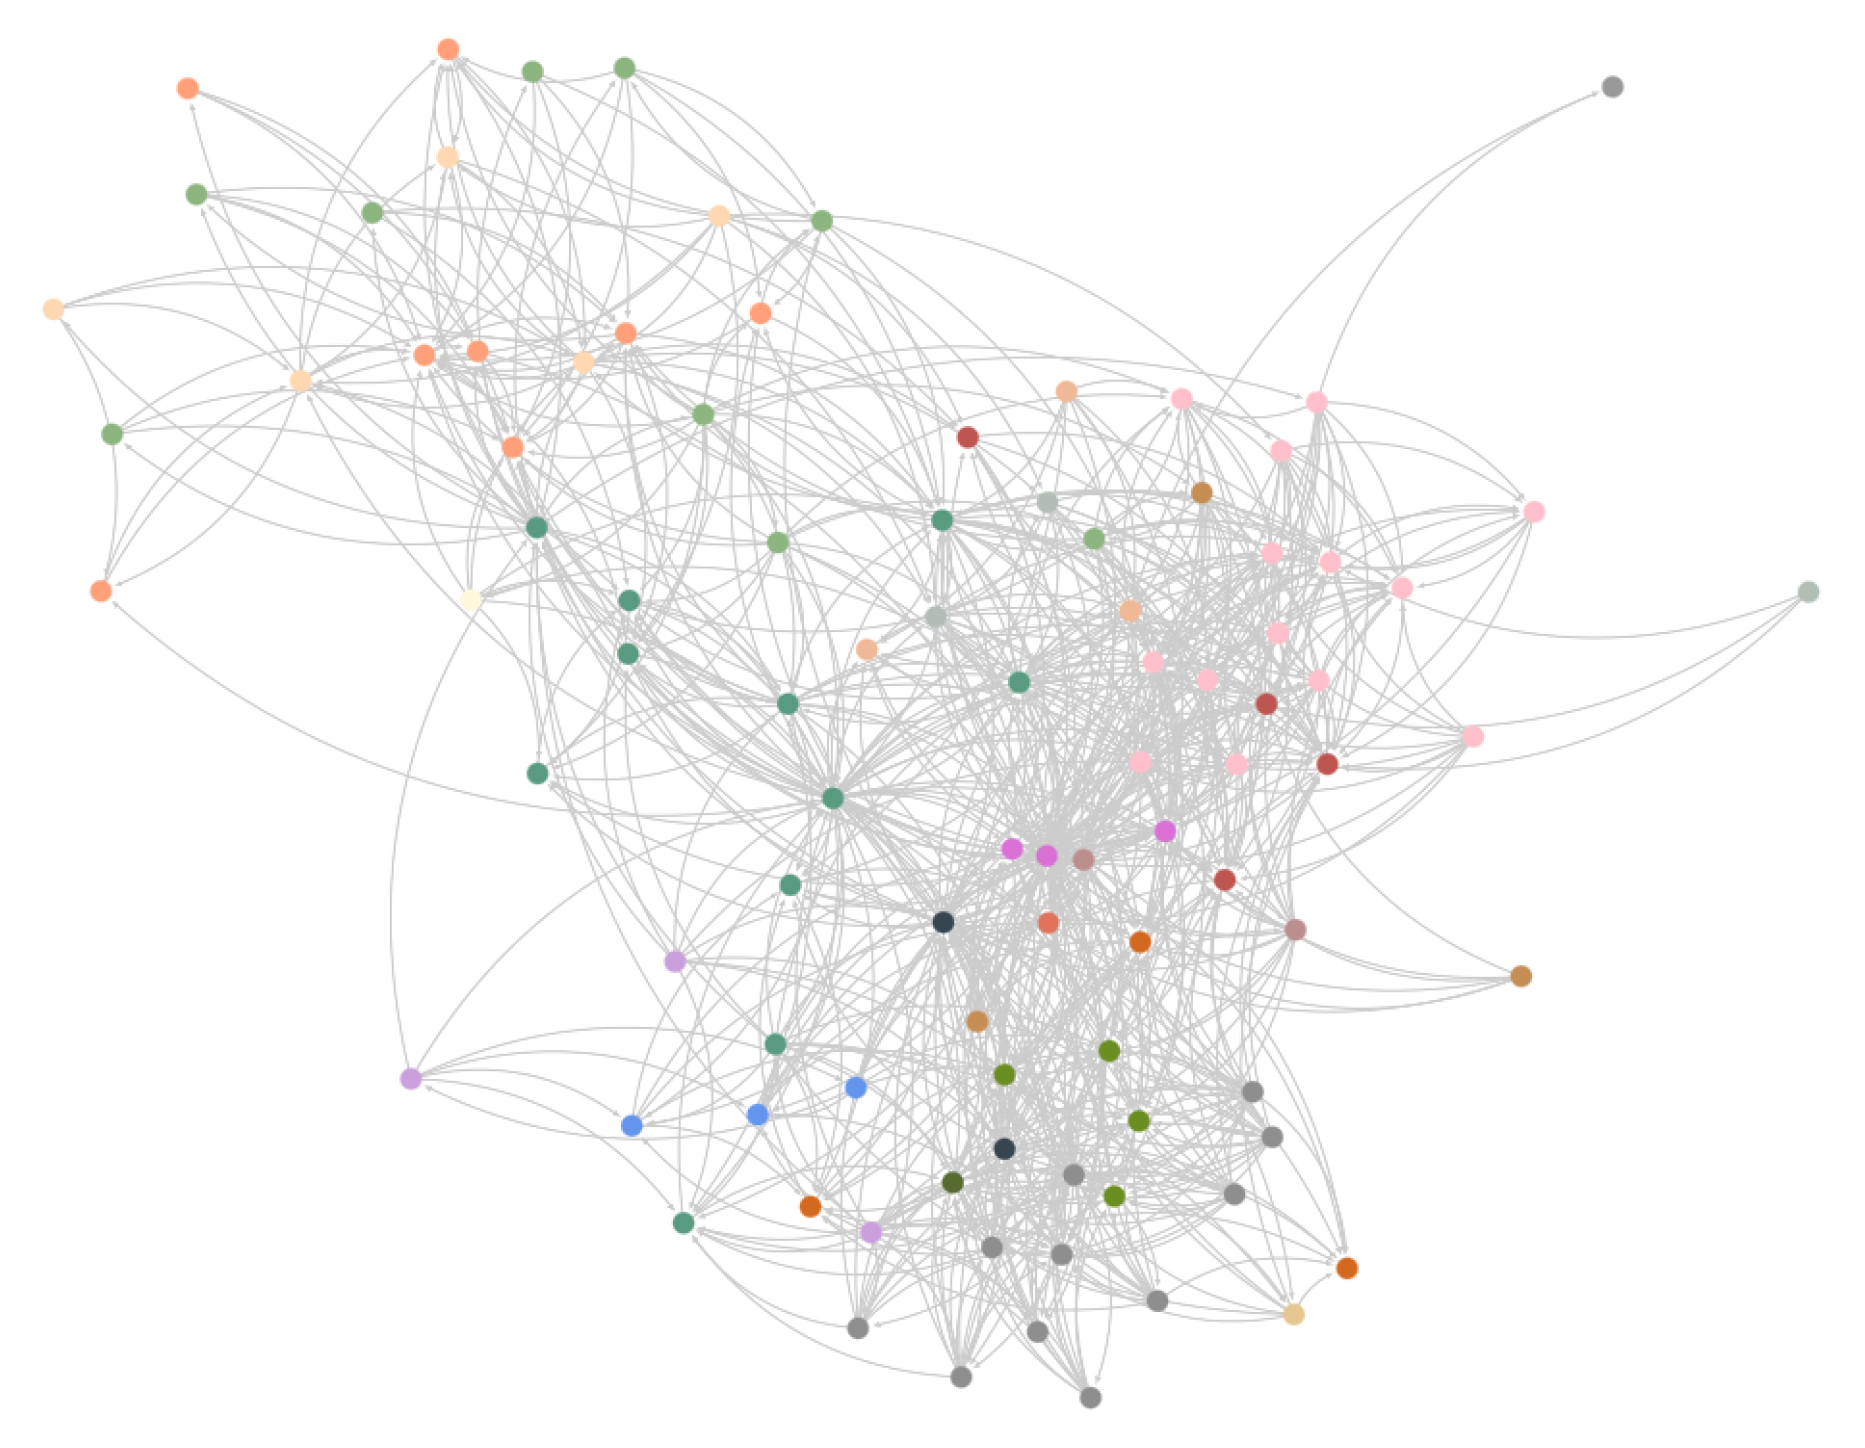
Figure 9.
The validated input-output production network based on the HS4 classification. The coloring of the nodes represents different sections within the HS classification
Figure 9.
The validated input-output production network based on the HS4 classification. The coloring of the nodes represents different sections within the HS classification
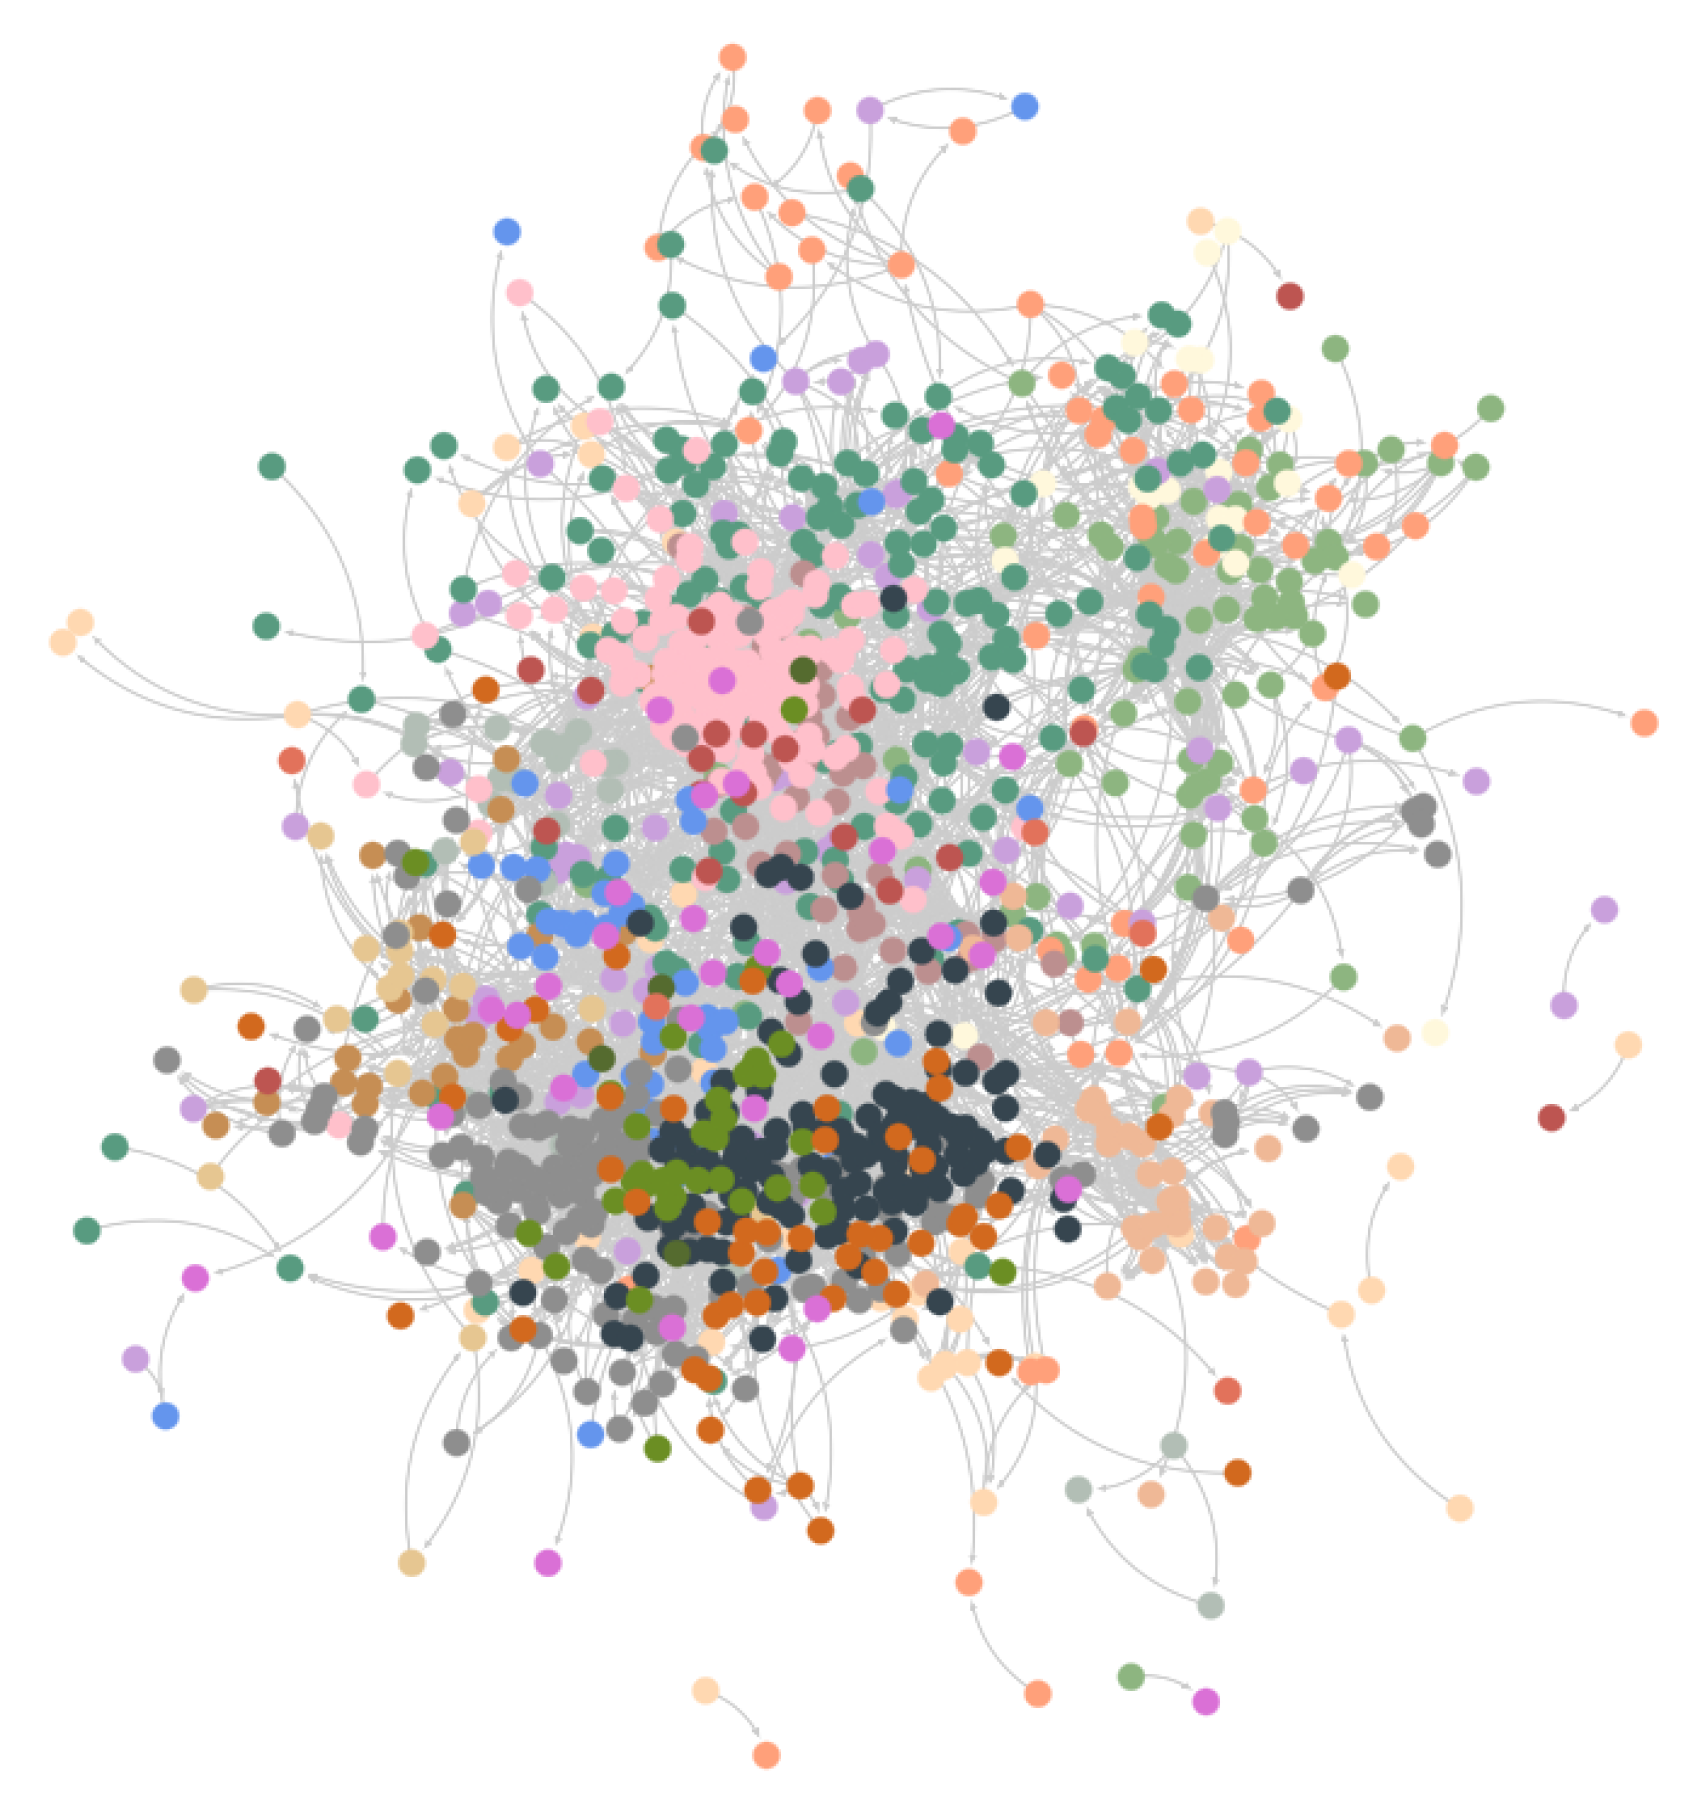
Figure 10.
A segment of the validated HS4-based input-output network showing production dependencies between selected products. "Grapes" (HS4 code: 0806) are used as a raw material, which, with the aid of "Micro-Organism Culture Preparations" (HS4 code: 3821), undergoes fermentation to produce "Vinegar" (HS4 code: 2209). "Water" (HS4 code: 2201) is also included as a potential input in this process.
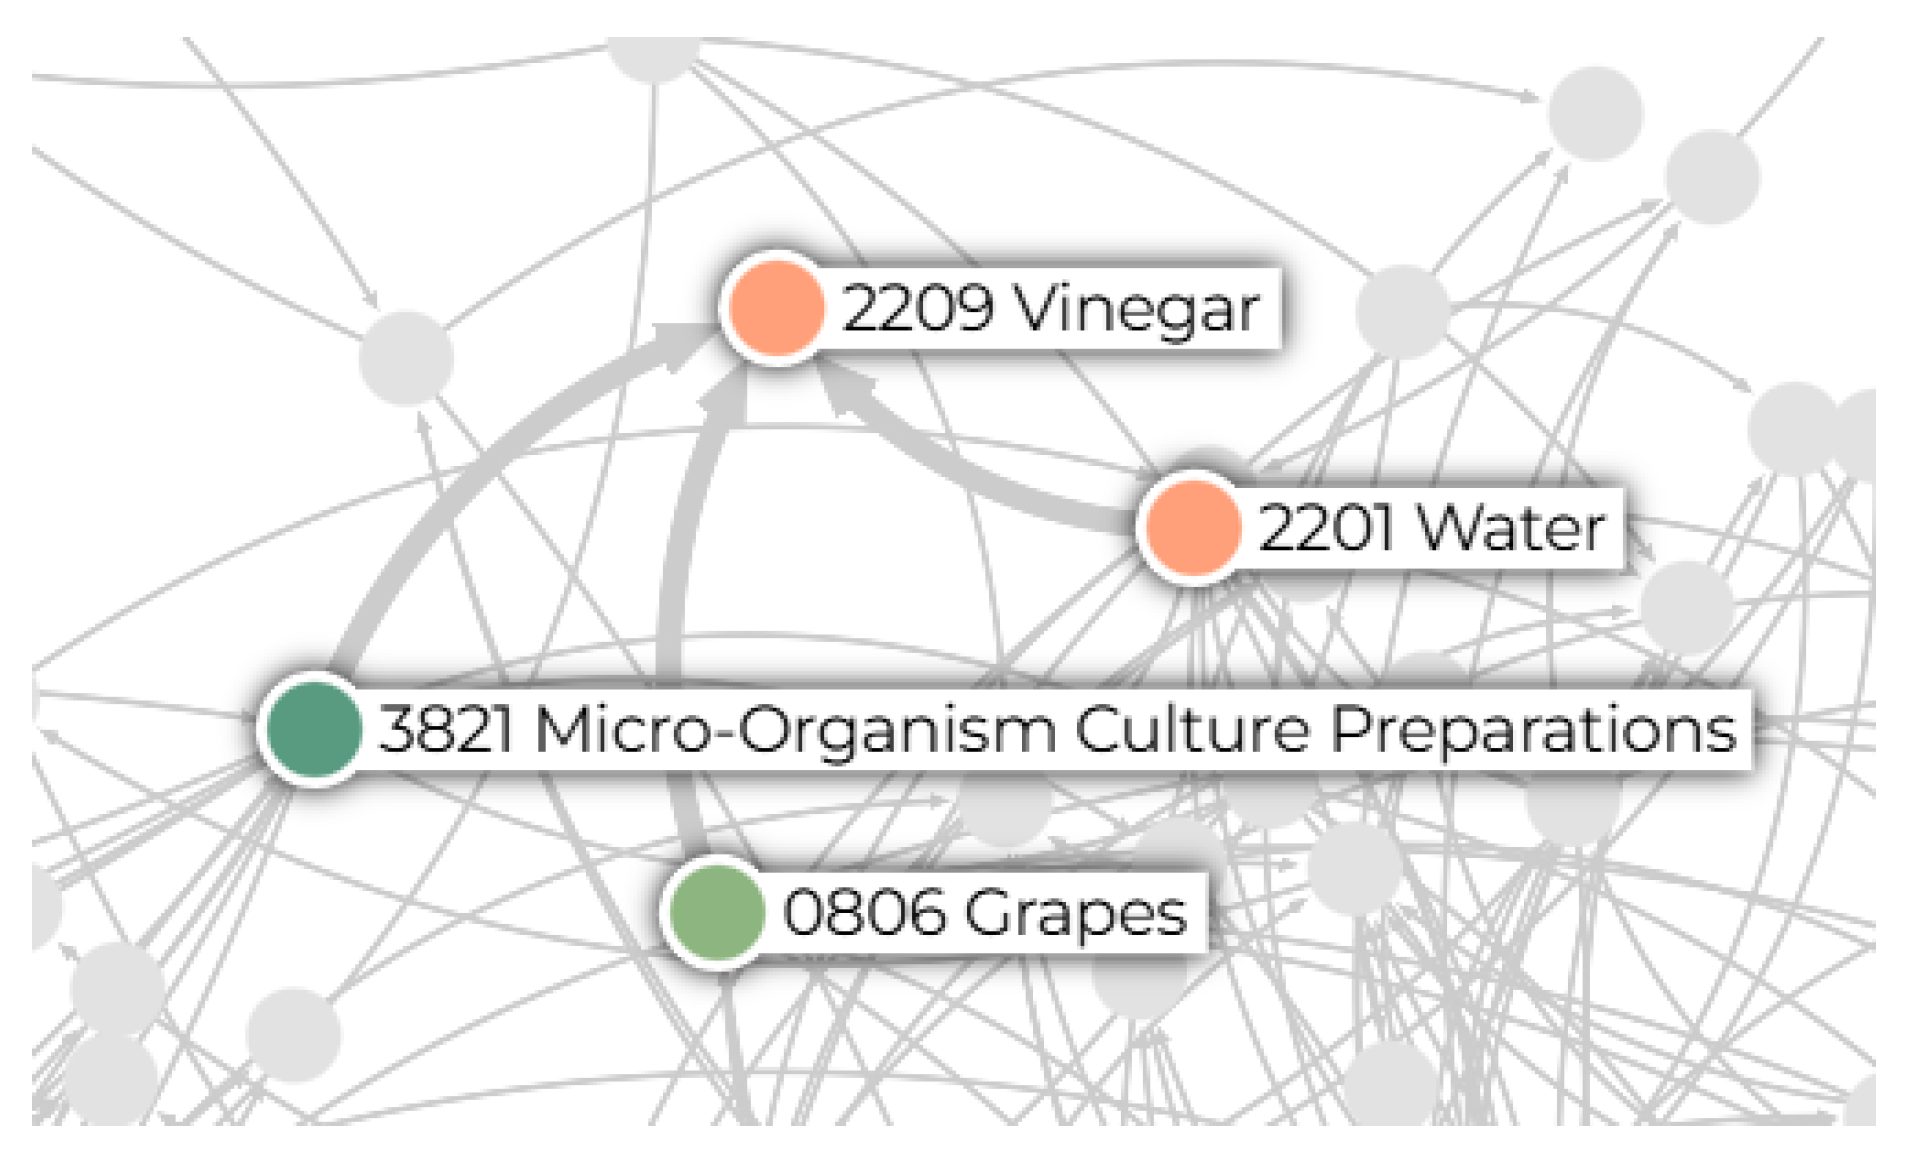

Table 1.
Yearly classification results comparing the "industry-translated" HS2-based input-output network to industry-level structural networks from 2000 to 2014. For each year, the table reports the number of true positives (TP), false positives (FP), true negatives (TN), and false negatives (FN), along with the derived evaluation metrics: precision, recall, and F1 score. These metrics assess the alignment between product-level inferred links and observed inter-industry dependencies based on WIOD data.
| Year | TP | FP | TN | FN | Precision | Recall | F1 Score |
|---|---|---|---|---|---|---|---|
| 2000 | 75 | 111 | 317 | 26 | 0.40 | 0.74 | 0.52 |
| 2001 | 76 | 110 | 318 | 25 | 0.41 | 0.75 | 0.53 |
| 2002 | 73 | 113 | 319 | 24 | 0.39 | 0.75 | 0.52 |
| 2003 | 72 | 114 | 318 | 25 | 0.39 | 0.74 | 0.51 |
| 2004 | 72 | 114 | 318 | 25 | 0.39 | 0.74 | 0.51 |
| 2005 | 73 | 113 | 318 | 25 | 0.39 | 0.74 | 0.51 |
| 2006 | 74 | 112 | 320 | 23 | 0.40 | 0.76 | 0.52 |
| 2007 | 75 | 111 | 321 | 22 | 0.40 | 0.77 | 0.53 |
| 2008 | 73 | 113 | 318 | 25 | 0.39 | 0.74 | 0.51 |
| 2009 | 75 | 111 | 316 | 27 | 0.40 | 0.74 | 0.52 |
| 2010 | 74 | 112 | 316 | 27 | 0.40 | 0.73 | 0.52 |
| 2011 | 74 | 112 | 315 | 28 | 0.40 | 0.73 | 0.51 |
| 2012 | 76 | 110 | 314 | 29 | 0.41 | 0.72 | 0.52 |
| 2013 | 75 | 111 | 315 | 28 | 0.40 | 0.73 | 0.52 |
| 2014 | 75 | 111 | 314 | 29 | 0.40 | 0.72 | 0.52 |
Table 2.
Proportion of validated input-output relationships at different validation thresholds t in the flow analysis. Higher values of t indicate stricter validation criteria, with the proportion decreasing as the threshold increases.
Table 2.
Proportion of validated input-output relationships at different validation thresholds t in the flow analysis. Higher values of t indicate stricter validation criteria, with the proportion decreasing as the threshold increases.
| t | 0.50 | 0.55 | 0.60 | 0.65 | 0.70 | 0.75 | 0.80 | 0.85 | 0.90 | 0.95 |
| 0.93 | 0.92 | 0.90 | 0.88 | 0.85 | 0.82 | 0.78 | 0.72 | 0.64 | 0.46 |
Table 3.
Proportion of input-output pairs with exceeding threshold t in the correlation analysis. The results indicate the proportion of countries for which the input-output relationship is supported by a moderate to strong positive correlation.
Table 3.
Proportion of input-output pairs with exceeding threshold t in the correlation analysis. The results indicate the proportion of countries for which the input-output relationship is supported by a moderate to strong positive correlation.
| t | 0.10 | 0.20 | 0.30 | 0.40 | 0.50 | 0.60 | 0.70 | 0.80 | 0.90 |
| 0.85 | 0.70 | 0.56 | 0.44 | 0.32 | 0.21 | 0.11 | 0.05 | 0.00 |
Disclaimer/Publisher’s Note: The statements, opinions and data contained in all publications are solely those of the individual author(s) and contributor(s) and not of MDPI and/or the editor(s). MDPI and/or the editor(s) disclaim responsibility for any injury to people or property resulting from any ideas, methods, instructions or products referred to in the content. |
© 2025 by the authors. Licensee MDPI, Basel, Switzerland. This article is an open access article distributed under the terms and conditions of the Creative Commons Attribution (CC BY) license (http://creativecommons.org/licenses/by/4.0/).
Copyright: This open access article is published under a Creative Commons CC BY 4.0 license, which permit the free download, distribution, and reuse, provided that the author and preprint are cited in any reuse.


