Submitted:
10 September 2025
Posted:
11 September 2025
You are already at the latest version
Abstract
Accessible datasets of greenhouse gas (GHG) concentrations help defining long term trends on a global scale, and also provide significant information on the variability of emission sources and sinks. The integration of stable carbon isotope data of carbon dioxide (CO2) and methane (CH4) can significantly increase the accuracy and reliability of source apportionment efforts, due to the isotopic fractionation processes and fingerprint that characterize each mechanism. Via isotopic parameters such as δ13C, the ratio of 13C to 12C compared to an international standard, it is in fact possible to discriminate, for example, between thermogenic and microbial sources of CH4, thus ensuring a more detailed understanding of global balances. A number of stations within the Italian network of atmospheric observation sites have been equipped with Picarro G2201-i CRDS (Cavity Ring-Down Spectrometry) analyzers capable of measuring the stable carbon isotopic ratios of CO2 and CH4. The first dataset (Lamezia Terme, Calabria) resulting from these measurements was released, and a second dataset (Potenza, Basilicata) from another station was also released, relying on the same format to effectively standardize this new type of datasets. This work provides details on the data, format, and methods used to generate these products, and describes a framework for the format and processing of similar data products based on CRD spectroscopy.
Keywords:
stable carbon isotopes
; δ13C
; atmospheric measurements
; carbon dioxide
; methane
; VPDB
; CRDS
; dataset
1. Summary
The analysis and evaluation of isotopic fingerprints in greenhouse gases provides an unprecedented detail in the characterization of emission sources, as well as the balance between emissions and sinks [1]. Several mechanisms affect the relative abundance of isotopologues, thus allowing their study to provide information concerning the mechanisms themselves: for this reason, the isotopic “fingerprint” is frequently used as an effective tracer [2,3,4,5,6]. These evaluations consequently allow to better understand global budgets, which are affected by anthropic perturbations of natural balances; the effects may vary based on the characteristic of each parameter, and the study of isotopic trends can provide substantial evidence in favor of the models explaining global variability. For instance, carbon dioxide (CO2) shows trends and isotopic seasonal patterns consistent with anthropogenic emissions attributable to fossil fuel burning [7], while methane (CH4) is characterized by alternating global growth rates and an isotopic fingerprint indicating notable contributions from microbial sources of emission such as wetlands, waste, and the agricultural sector [8,9]. Isotopic fingerprints in either parameter are measured as deviations per mille (‰) from an international standard, the Vienna Pee Dee Belemnite (VPDB) [10,11], and are reported as δ13C.
In Italy, four atmospheric stations operated by a number of research institutions have been implemented stable carbon isotope analyzers of CO2 and CH4, specifically the Picarro G2201-i CRDS (Cavity Ring-Down Spectrometry) analyzers. Under the ITINERIS (Italian Integrated Environmental Research Infrastructures System) project, the first dataset of continuous atmospheric measurements of δ13CO2 and δ13CH4 in the country was released, based on six months of measurements performed at the Lamezia Terme (code: LMT) World Meteorological Organization / Global Atmosphere Watch (WMO/GAW) Regional observation site in the region of Calabria, fully operated by CNR-ISAC (National Research Council of Italy – Institute of Atmospheric Sciences and Climate), between July and December 2024. Specifically, the measurements were performed from CNR-ISAC’s laboratory (Lat: 38.8774 N; Lon: 16.2364 E; Elev: 10 meters a.s.l.).
The cross-country consortium does not currently have a calibration procedure to correct data from deviations; a second dataset with an identical format [12], released under project ITINERIS by CNR-IMAA (National Research Council of Italy – Institute of Methodologies for Environmental Analysis) Potenza in the neighboring region of Basilicata, features a few months of observations, falling within the limit recommended by the manufacturer for long term calibration procedures, which is four months of operation [13]. The dataset was consequently used in the first scientific publication from the national consortium aimed at the assessment of stable carbon isotope variability in CO2 and CH4; the site is a tall tower with a sampling height of 104 meters above ground level [14]. Two other atmospheric stations, operated by ENEA (Italian National Agency for New Technologies, Energy and Sustainable Economic Development) and CNR-ISAC, are also equipped with G2201-i analyzers [15]. Overall, the national consortium includes Lamezia Terme (LMT, in the region of Calabria), Potenza (POT, Basilicata), Monte Cimone (CMN, Emilia-Romagna), and Lampedusa (LMP, Sicily) [14,15].
The present work illustrates the characteristics of the first dataset, with references to the second product released by the consortium sharing an identical format, in the scope of proposing a framework for the release of data products based on CRDS analyzer measurements.
2. Data Description
The product is based on the hourly averages, and their respective standard deviations, of key parameters provided by the instrument and used to characterize the isotopic fingerprints of CO2 and CH4. The first measurements became available on July 2nd, 2024, however the product has been set to start with 00:00UTC on July 1st, thus making the integration with any other dataset more convenient. The first columns provide clear and specific information concerning each hourly-aggregated concentration: date in extended format (DD/MM/YYYY), year, month, weekday, day, and hour. The hour_prog parameter is an integer in the 1-4416 range unambiguously defining each hour elapsed between July and December 2024.
The weekday column, set up to match the Monday to Sunday (MON-SUN) format, has been implemented to associate each day with an integer representative of the specific weekday (e.g., 1 for Monday, 7 for Sunday). This parameter allows to calculate tendencies of specific weekdays, and may be grouped to create broader weekday (MON-FRI, 1-5) and weekend (SAT-SUN, 6-7) categories, which can in turn be used to evaluate the statistical significance of reported weekly cycles.
The Q/A status flags and descriptions are used to provide information concerning the status of the instrument and the validity of its measurements. Details concerning these flags and their characteristics are available in Table 1. Some of the flags described in the table are not part of presently released data products; however, they are being used in the early versions of additional datasets, meant to be released in the future.
ANTE is solely limited to the hours elapsed between 00:00UTC on July 1st, 2024 to July 2nd at 13:00UTC, and is meant to optimize the interoperability of the dataset with any record of hourly data by associating the beginning of the dataset with the beginning of a calendar month.
OP_NORMAL reflects hourly data which have been measured under optimal conditions and have met sufficient quality assurance criteria. The flag is intended to be used as a filter in evaluations (prior to analysis, only measurements with this status flag should be considered, and adequate filters need to be applied).
OP_EXCLUDED indicates measurements performed when the instrument was in operation, however they did not reflect the minimum standards of quality assurance. The flag is commonly applied to hourly data that follow major power shortages.
OP_NONAF is a very specific applied for the first set of measurements at the LMT site, during which the instrument was not equipped with a PERMA PURE Nafion dryer meant to reduce H2O concentrations and possible interferences with measurements. In Table 1, the validity of this flag is “Limited” as it may still be used in data analysis, however it needs to be properly differentiated from OP_NORMAL. Once installed, the Nafion dried ambient air prior to measurement by the G2201-i. It is worth mentioning that, according to the manual provided by the manufacturer, the guaranteed spec range is within 0-2.4% H2O, while the operational range is 0-5% H2O [13]; although these values are above measured water vapor, measurements without a Nafion have been flagged to allow the end user to differentiate these measurements from standard, dried ambient air data.
NOOP indicates that no measurements were in place, i.e., that the instrument was not operating at the time. Data having this flag are sporadic across the dataset, with the exception of a continuous period from October 21st to Oct. 29th, due to an extreme weather event which compromised most instruments used at the LMT observation site.
OP_CALIB is presently not featured in released datasets, however its use is planned for other products meant to be released in the future. It refers to hourly data aimed at calibration procedures, i.e., the measurement of calibrated standards intended to adjust the instrument. These measurements should not be included in evaluations of ambient air, as calibration gas is measured during this period.
OP_EXPER is also a planned flag which is presently not used in a released dataset. The flag refers to laboratory experiments and similar circumstances that do not involve calibration standards, and should be excluded from ambient air analysis.
The main parameters of the dataset are differentiated by unit of measurement: concentrations are in ppm (parts per million), while water vapor is reported as percentage, and isotopic details are shown as deviations per mille (or per mil) from the VPDB standard. The “_sd” suffix indicates the standard deviations calculated for each hourly average, and used as an indicatory of measurement stability and data variability.
The G2201-i does not provide the mole fractions of CO2 and CH4. Therefore, these need to be calculated via the sum of 12C and 13C isotopologues in either parameter, using the HP (High Precision) variant of CH4 when available, and dry mole fractions. The HP variant is used for standard atmospheric concentrations of CH4, when they fall within the 1.8-12 ppm range; the alternate mode, HR (High Dynamic Range), is to be used for concentrations between 10 and 500 ppm [13]. Considering the entirety of the available CH4 record at LMT, also accounting for the strong daily cycles observed at the site and the influence of wind circulation, all measurements fall in the HP range, which is the one used in the data product. Consequently, the HP variant of CH4’s isotopic delta is also used instead of its HR variant.
The CH4_2201 and CO2_2201 parameters in the dataset therefore identify the mole fractions measured by the instrument, which are distinct from the isotopic deltas. The “_2201” suffix is used to differentiate the employed G2201-i from other instrument such as the Picarro G2401, which measures carbon dioxide (CO), CO2, and CH4, thus allowing to perform direct comparisons between instruments. These comparison between G2201 and G2401 measurements of mole fractions have been performed at POT station via the Bland and Altman methodology [16,17], as described in the work by Buono et al. [14]. The G2401 used for this comparison was characterized by the Integrated Carbon Observation System (ICOS) Atmosphere Thematic Centre (ATC).
Data not suitable for analysis (e.g., NOOP) are marked with a value of -999.999 in the data products.
3. Methods and Results
Raw data have been processed in R to generate the hourly averages and their respective standard deviations. An algorithm was set up to exclude all data not yielding the optimal status flags reported by the manufacturer; measurements affected by temperature and pressure warnings, for example, have been excluded from processing [13]. However, as the instrument was subject to long power shortages and similar events falling outside the coverage of UPS, all hourly data have been quality checked manually and flagged when required, as shown in Table 1.
In the case of the CNR-IMAA dataset featuring measurements performed at the tall tower site of Potenza (code: POT) [12], 10-minute aggregates have been generated by implementing an additional R algorithm attributing a value between 1 and 6 to each 10-minute block within a given hour.
Figure 1 shows two Keeling plots [18], one per chemical parameter, computed using the dataset. The plots are intended to provide an insights into the dataset and do not constitute a detailed evaluation of the measurements performed at LMT, which will be addressed in future research papers. The Keeling plot is an effective method to determine sources of emissions, as the y-axis intercept of regression lines identifies the isotopic fingerprint of the emission source. The x-axis represents the reciprocal of the evaluated parameter (e.g., 1/CO2 ppm-1), while the y-axis shows its respective delta. Seasons, in this plot, have been defined using the standard trimesters seen in climate and GHG studies, adapted to the coverage of the LMT dataset (Winter: December; Fall: September to November; Summer: July and August). The general outline of these plots is based on the results of Buono et al. [14], which relied on a lm (linear regression model in R). It is worth mentioning that results of Keeling plots are susceptible to fitting methods, as evidenced in literature [19,20,21,22].
From the plots, it is possible to infer that in CO2’s case the majority of peaks are attributable to a source which is compatible with fossil fuel burning, according to the ranges and values provided by a number of studies on stable carbon isotope analyses [23,24], while CH4 – which has a lower atmospheric concentration, i.e., ≈2 ppm compared to CO2’s ≈425 ppm – is characterized by a number of fluctuations in data distribution, which can still allow to pinpoint possible microbial/landfill related emission sources.
4. Perspectives
While datasets of greenhouse gas and aerosol concentrations are commonly used across international networks and research infrastructures, data products resulting from continuous stable isotope measurements are not as common [25,26,27,28,29]. In the context of the Italian consortium of atmospheric observation sites, the implementation of consistent formats and methodologies employed to generate δ13C-CO2 and δ13C-CH4 datasets has become a tool to propose a framework for the management and processing these measures. The network presently lacks calibration standards, however the modular nature of the datasets and the introduction of new quality assurance flags can effectively integrate calibrations at later stages. A standard format for these measurements, such as the one used in the LMT and POT datasets, also allows a new degree of interoperability which in turn can result in more accurate source apportionment efforts, possibly aimed at various scales, based on the characteristics of each observation site [30,31].
Author Contributions
Conceptualization, F.D.; methodology, F.D.; software, F.D., G.D.B., L.M., S.S. and D.G. ; validation, F.D., I.A. and T.L.F.; formal analysis, F.D.; investigation, F.D. and L.M.; data curation, F.D., I.A., G.D.B., L.M., S.S., T.L.F. and D.G.; writing—original draft preparation, F.D.; writing—review and editing, F.D., I.A., G.D.B., L.M., S.S., T.L.F., D.G. and C.R.C..; visualization, F.D.; supervision, C.R.C.; funding acquisition, C.R.C. All authors have read and agreed to the published version of the manuscript.
Funding
This research was funded by AIR0000032 – ITINERIS, the Italian Integrated Environmental Research Infrastructures System (D.D. n. 130/2022 - CUP B53C22002150006) under the EU - Next Generation EU PNRR - Mission 4 “Education and Research” - Component 2: “From research to business” - Investment 3.1: “Fund for the realization of an integrated system of research and innovation infrastructures”.
Institutional Review Board Statement
Not applicable.
Informed Consent Statement
Not applicable.
Data Availability Statement
The datasets mentioned in this work are available on the ITINERIS HUB: https://hub.itineris.cnr.it/datasets.
Acknowledgments
The authors would like to acknowledge the effort of the other institutions (National Research Council of Italy – Institute of Atmospheric Sciences and Climate; National Research Council of Italy – Institute of Methodologies for Environmental Analysis) that host the laboratories and instruments used to generate the datasets described in this work. The author would also like to acknowledge the effort of the Italian National Agency for New Technologies, Energy and Sustainable Economic Development, which operates the G2201-i analyzer used to perform the first data analyses of this kind within the network.
Conflicts of Interest
The authors declare no conflicts of interest.
References
- Zazzeri, G.; Lowry, D.; Fisher, R.E.; France, J.L.; Lanoisellé, M.; Grimmond, C.S.B.; Nisbet, E.G. Evaluating methane inventories by isotopic analysis in the London region. Sci. Rep. 2017, 7, 4854. [Google Scholar] [CrossRef]
- Lopez, M.; Schmidt, M.; Delmotte, M.; Colomb, A.; Gros, V.; Janssen, C.; Lehman, S.J.; Mondelain, D.; Perrussel, O.; Ramonet, M.; et al. CO, NOx and 13CO2 as tracers for fossil fuel CO2: results from a pilot study in Paris during winter 2010. Atmos. Chem. Phys. 2013, 13, 7343–7358. [Google Scholar] [CrossRef]
- Meija, J. Isotopic measurements of carbon dioxide: the role of measurement science and standards. Anal. Bioanal. Chem. 2024, 416, 2013–2021. [Google Scholar] [CrossRef]
- Hoheisel, A.; Schmidt, M. Six years of continuous carbon isotope composition measurements of methane in Heidelberg (Germany) – a study of source contributions and comparison to emission inventories. Atmos. Chem. Phys. 2023, 24, 2951–2969. [Google Scholar] [CrossRef]
- Woolley Maisch, C.A.; Fisher, R.E.; France, J.L.; Lowry, D.; Lanoisellé, M.; Bell, T.G.; Forster, G.; Manning, A.J.; Michel, S.E.; Ramsden, A.E.; et al. Methane source attribution in the UK using multi-year records of CH4 and δ13C. J. Geophys. Res. Atmos. 2023, 128, e2023JD039098. [Google Scholar] [CrossRef]
- Michel, S.E.; Lan, X.; Miller, J.; Tans, P.; Clark, J.R.; Schaefer, H.; Sperlich, P.; Brailsford, G.; Morimoto, S.; Moossen, H.; Li, J. Rapid shift in methane carbon isotopes suggests microbial emissions drove record high atmospheric methane growth in 2020-2022. Proc. Natl. Acad. Sci. U.S.A. 2024, 121, e2411212121. [Google Scholar] [CrossRef]
- Keeling, C.D.; Mook, W.G.; Tans, P.P. Recent trends in the 13C/12C ratio of atmospheric carbon dioxide. Nature 1979, 277, 121–123. [Google Scholar] [CrossRef]
- Nisbet, E.G.; Dlugokencky, E.J.; Manning, M.R.; Lowry, D.; Fisher, R.E.; France, J.L.; Michel, S.E.; Miller, J.B.; White, J.W.C.; Vaughn, B.; et al. Rising atmospheric methane: 2007-2014 growth and isotopic shift. Global Biogeochem. Cycles 2016, 30, 1356–1370. [Google Scholar] [CrossRef]
- Nisbet, E.G.; Manning, M.R.; Dlugokencky, E.J.; Fisher, R.E.; Lowry, D.; Michel, S.E.; Lund Myhre, C.; Platt, S.M.; Allen, G.; Bousquet, P.; et al. Very strong atmospheric methane growth in the 4 years 2014-2017: implications for the Paris Agreement. Global Biogeochem. Cycles 2019, 33, 318–342. [Google Scholar] [CrossRef]
- Craig, H. The geochemistry of the stable carbon isotopes. Geochim. Cosmochim. Acta 1953, 3, 53–92. [Google Scholar] [CrossRef]
- Craig, H. Isotopic standards for carbon and oxygen and correction factors for mass-spectrometric analysis of carbon dioxide. Geochim. Cosmochim. Acta 1957, 12, 133–149. [Google Scholar] [CrossRef]
- Buono, A.; Zaccardo, I.; D’Amico, F.; Mona, L.; Ripepi, E.; Dema, C.; Continuous δ13C-CO2 and δ13C-CH4 measurements in the atmosphere – data gathered at Potenza (Basilicata, Southern Italy) in 2025. Version 1. Available online: https://hub.itineris.cnr.it/datasets/ (accessed on 18 July 2025). [CrossRef]
- Picarro. G2201-i analyzer user manual for isotopic CO2/CH4. https://www.picarro.com/environmental/g2201i_analyzer_user_manual_for_isotopic_CO2_CH4. (accessed on 18 July 2025).
- Buono, A.; Zaccardo, I.; D’Amico, F.; Lapenna, E.; Cardellicchio, F.; Laurita, T.; Amodio, D.; Colangelo, C.; Di Fiore, G.; Giunta, A.; et al. Expanding Continuous Carbon Isotope Measurements of CO2 and CH4 in the Italian ICOS Atmospheric Consortium: First Results from the Continental POT Station in Potenza (Basilicata). Atmosphere 2025, 16, 951. [Google Scholar] [CrossRef]
- D’Amico, F.; Di Iorio, T.; Zazzeri, G.; Sferlazzo, D.; Apadula, F.; Cristofanelli, P.; Calidonna, C.R.; Ammoscato, I.; Malacaria, L.; Sinopoli, S.; et al. Continuous CH4 carbon isotope measurements in Italy: preliminary results from the Lampedusa observatory (Strait of Sicily) and general outline of the developing cross-country network. ICOS Science Conference, Versailles, France, 10-12 September 2024. https://www.icos-cp.eu/media/409.
- Altman, D.G.; Bland, J.M. Measurement in Medicine: The Analysis of Method Comparison Studies. J. R. Stat. Soc. D 1983, 32, 307–317. [Google Scholar] [CrossRef]
- Bland, J.M.; Altman, D.G. Statistical methods for assessing agreement between two methods of clinical measurement. Lancet 1986, 327, 307–310. [Google Scholar] [CrossRef]
- Keeling, C.D. The concentration and isotopic abundances of atmospheric carbon dioxide in rural areas. Geochim. Cosmochim. Acta 1958, 13, 322–334. [Google Scholar] [CrossRef]
- York, D.; Evensen, N.M.; López Martı́nez, M.; De Basabe Delgado, J. Unified equations for the slope, intercept, and standard errors of the best straight line. Am. J. Phys. 2004, 72, 367–375. [Google Scholar] [CrossRef]
- Zobitz, J.M.; Keener, J.P.; Schnyder, H.; Bowling, D.R. Sensitivity analysis and quantification of uncertainty for isotopic mixing relationships in carbon cycle research. Agric. For. Meteorol. 2006, 136, 56–75. [Google Scholar] [CrossRef]
- Menoud, M.; van der Veen, C.; Lowry, D.; Fernandez, J.M.; Bakkaloglu, S.; France, J.L.; Fisher, R.E.; Maazallahi, H.; Stanisavljević, M.; Nęcki, J.; et al. New contributions of measurements in Europe to the global inventory of the stable isotopic composition of methane. Earth Syst. Sci. Data 2022, 14, 4365–4386. [Google Scholar] [CrossRef]
- Defratyka, S.M.; France, J.L.; Fisher, R.E.; Lowry, D.; Fernandez, J.M.; Bakkaloglu, S.; Yver-Kwok, C.; Paris, J.-D.; Bousquet, P.; Arnold, T.; Rennick, C.; Helmore, J.; Yarrow, N.; Nisbet, E.G. Evaluation of data processing strategies for methane isotopic signatures determined during near-source measurements. Tellus B 2025, 77, 1–17. [Google Scholar] [CrossRef]
- Bush, S.E.; Pataki, D.E.; Ehleringer, J.R. Sources of variation in δ13C of fossil fuel emissions in Salt Lake City, USA. Appl. Geochem. 2007, 22, 715–723. [Google Scholar] [CrossRef]
- Wang, P.; Zhou, W.; Xiong, X.; Wu, S.; Niu, Z.; Yu, Y.; Liu, J.; Feng, T.; Cheng, P.; Du, H.; Lu, X.; et al. Source attribution of atmospheric CO2 using 14C and 13C as tracers in two Chinese megacities during winter. J. Geophys. Res. Atmos. 2022, 127, e2022JD036504. [Google Scholar] [CrossRef]
- Graven, H.; Keeling, R.F.; Rogelj, J. Changes to carbon isotopes in atmospheric CO2 over the Industrial Era and into the future. Glob. Biogeochem. Cycles. 2020, 34, e2019GB006170. [Google Scholar] [CrossRef] [PubMed]
- Dasgupta, B.; Menoud, M.; van der Veen, C.; Levin, I.; Veidt, C.; Moossen, H.; Englund Michel, S.; Sperlich, P.; Morimoto, S.; Fujita, R.; et al. Harmonisation of methane isotope ratio measurements from different laboratories using atmospheric samples, EGUsphere [preprint]. https://doi.org/10.5194/egusphere-2025-2439 (accessed on 10 August 2025). [CrossRef]
- Röckmann, T.; van der Veen, C.; Menoud, M. Atmospheric GHG data product (ch4, ch4_stdev, 13ch4, 13ch4_stdev, d2h_ch4, d2h_ch4_stdev) from Lutjewad (60.0 m), 2016-11-01–2017-04-01, Miscellaneous, 2025. https://hdl.handle.net/11676/9jW2BVY29QNL54EDuTwTLl8l. (accessed on 10 August 2025).
- Röckmann, T.; van der Veen, C.; van Es, J. Atmospheric GHG data product (ch4, ch4_stdev, 13ch4, 13ch4_stdev, d2h_ch4, d2h_ch4_stdev) from Hamburg Geomatikum (90.0 m), 2021-08-01–2022-03-28, Miscellaneous, 2025. https://hdl.handle.net/11676/Z0tUrtsffqCJYBbcGy8UxH8y. (accessed on 10 August 2025).
- Engel, A.; Arduni, J.; Arnold, T.; Chung, E.; Frumau, A.; Ganesan, A.; Garrard, N.; Grant, A.; Hermansen, O.; Kikaj, D.; et al. Atmospheric measurements results archive from the European AGAGE network, the UK DECC network and the Cabauw tall tower, 2025. [CrossRef]
- World Meteorological Organization. Global Atmosphere Watch measurements guide. WMO/TD-No. 1073, GAW Report No. 143. https://library.wmo.int/idurl/4/41180. (accessed on 13 August 2025).
- Storm, I.; Karstens, U.; D’Onofrio, C.; Vermeulen, A.; Peters, W. A view of the European carbon flux landscape through the lens of the ICOS atmospheric observation network. Atmos. Chem. Phys. 2023, 23, 4993–5008. [Google Scholar] [CrossRef]
Figure 1.
Keeling plots of (Top) δ13C-CO2 and (Bottom) δ13C-CH4, including the main parameters of the regression lines.
Figure 1.
Keeling plots of (Top) δ13C-CO2 and (Bottom) δ13C-CH4, including the main parameters of the regression lines.
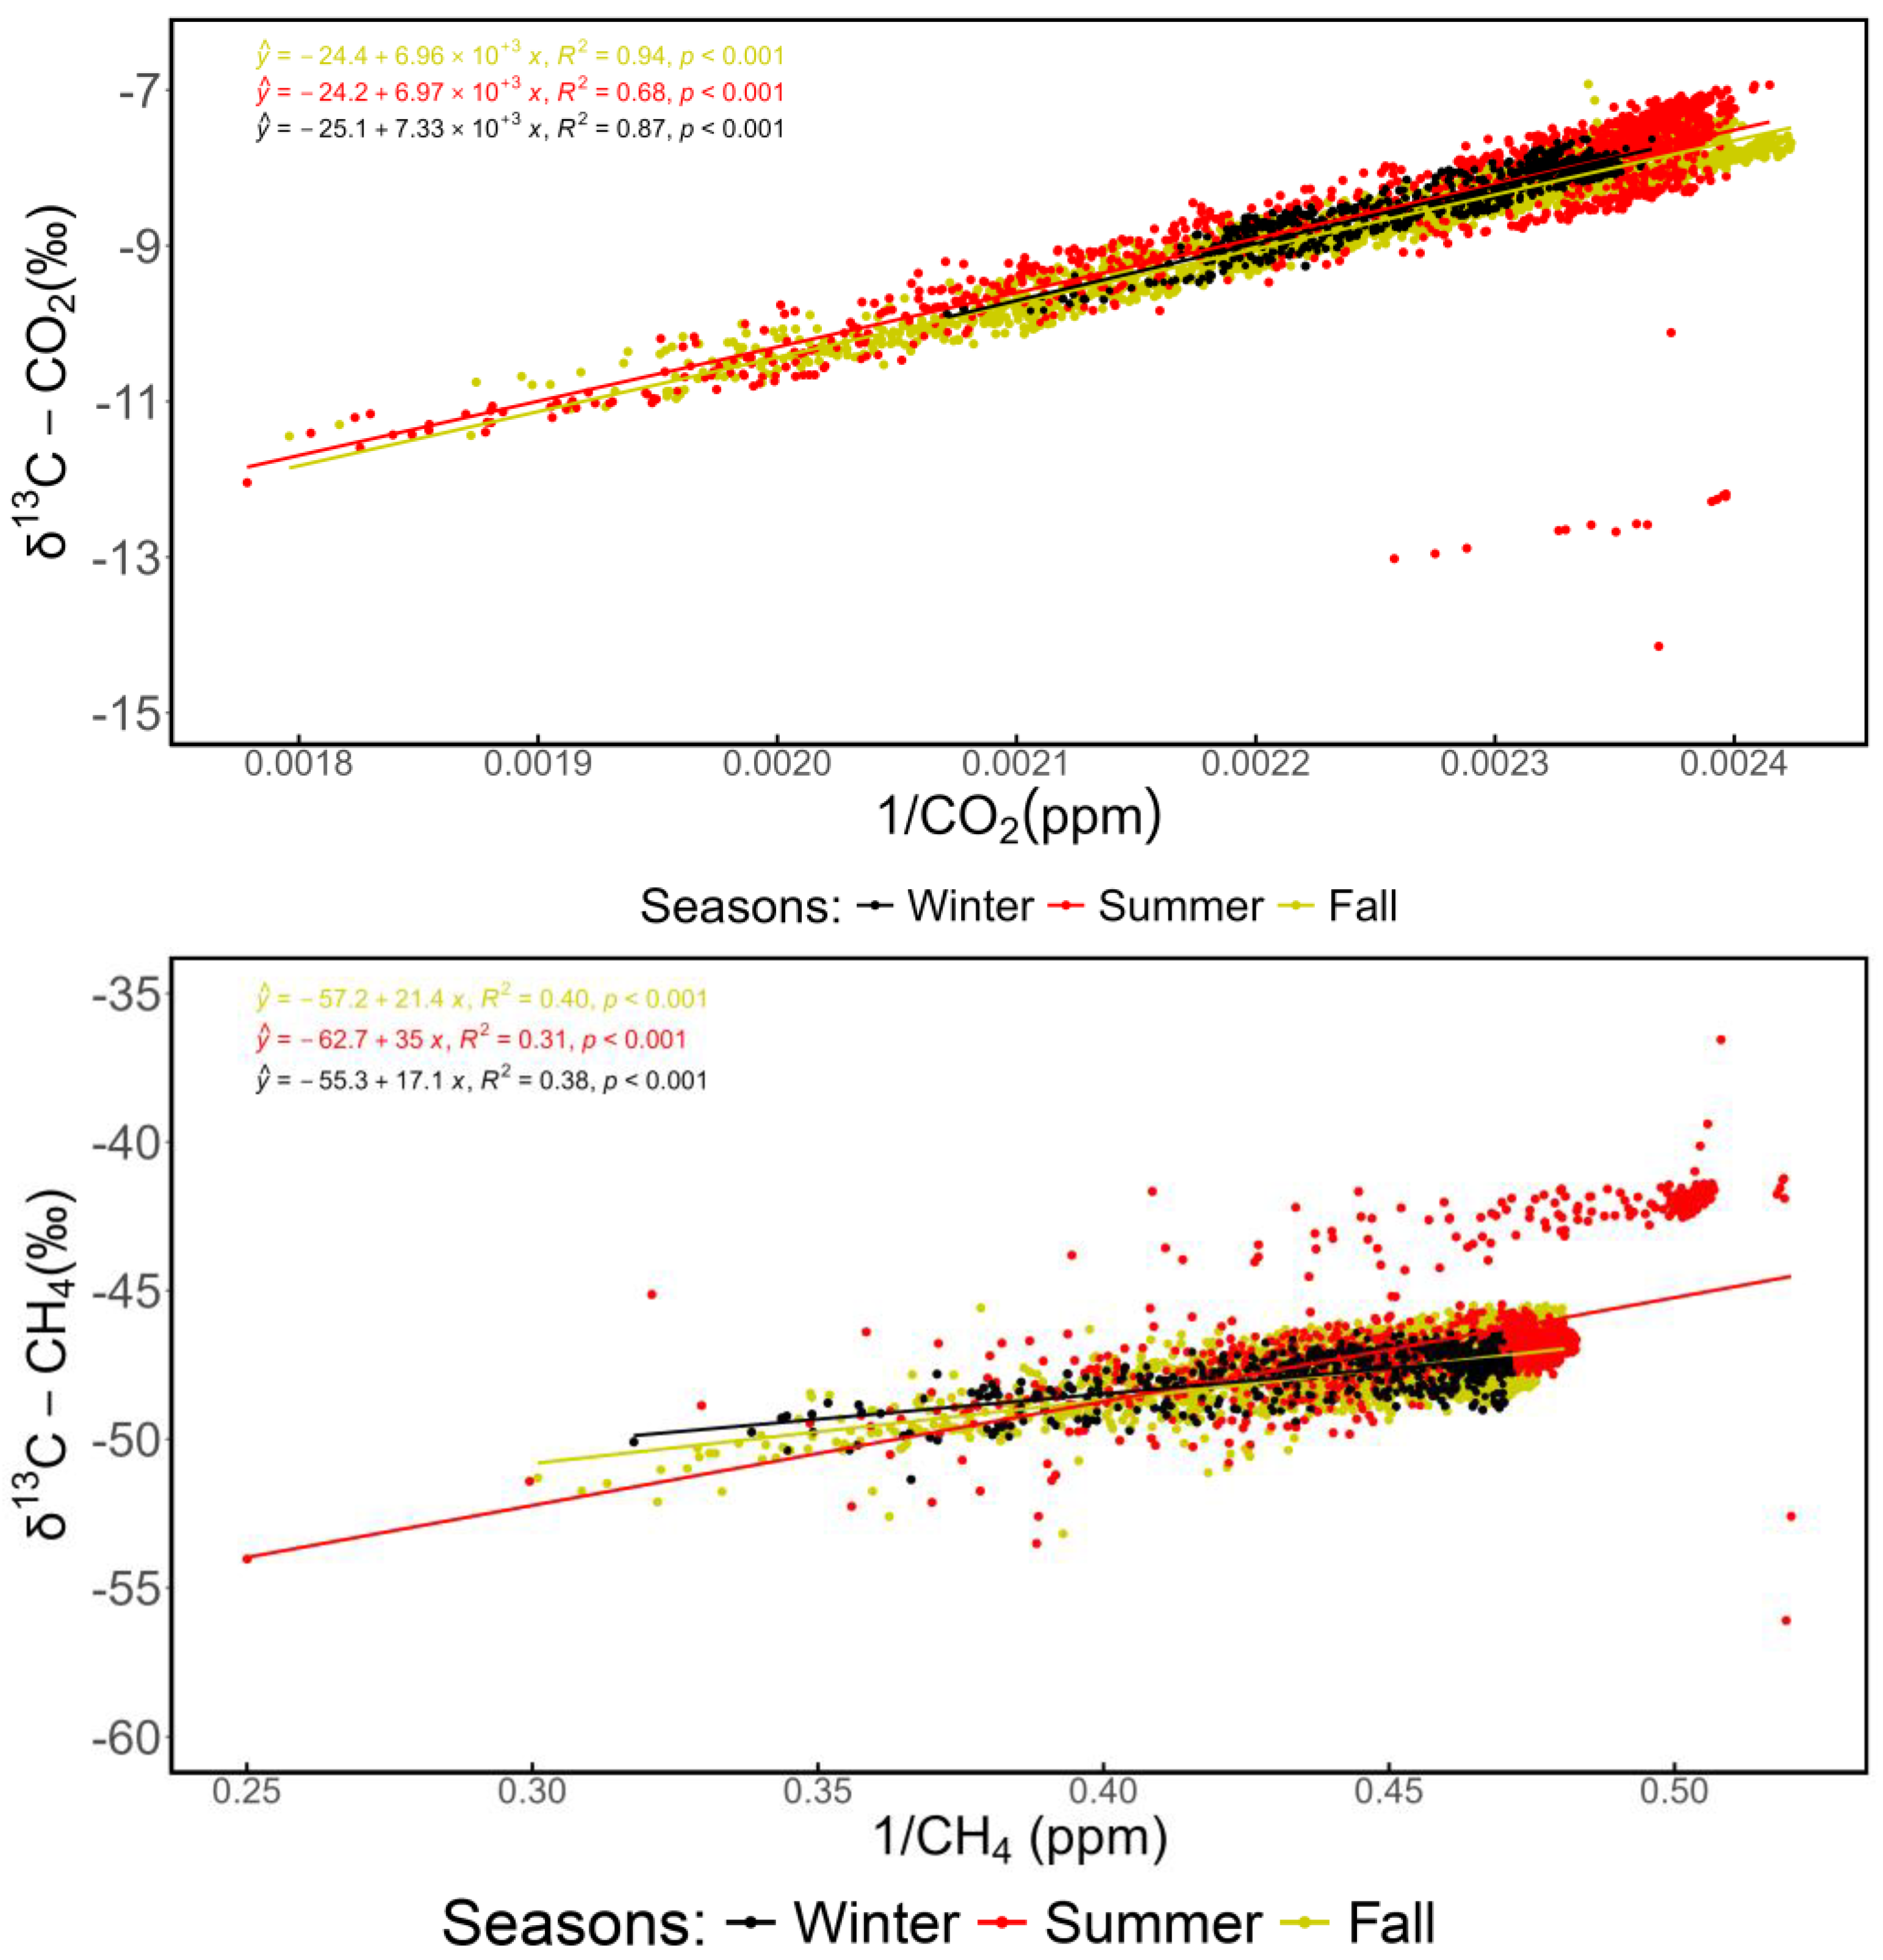

Table 1.
Identifiers of the quality assurance flags used for each hourly data in the product, also including a description. The Data Validity column indicates whether each flag can be associated with validated data. Release status indicates whether the flag is used in readily available datasets, or other – work in progress – datasets.
| Q/A status | Description | Data Validity | Release status |
|---|---|---|---|
| ANTE | No measurement in place | No | Released |
| OP_NORMAL | Validated data | Yes | Released |
| OP_EXCLUDED | Data excluded for quality assurance purposes | No | Released |
| OP_NONAF | Data gathered without a Nafion dryer | Limited | Released |
| NOOP | Instrument not in operation | No | Released |
| OP_CALIB | Calibration procedure | Other | Planned |
| OP_EXPER | Experiment | Other | Planned |
Disclaimer/Publisher’s Note: The statements, opinions and data contained in all publications are solely those of the individual author(s) and contributor(s) and not of MDPI and/or the editor(s). MDPI and/or the editor(s) disclaim responsibility for any injury to people or property resulting from any ideas, methods, instructions or products referred to in the content. |
© 2025 by the authors. Licensee MDPI, Basel, Switzerland. This article is an open access article distributed under the terms and conditions of the Creative Commons Attribution (CC BY) license (http://creativecommons.org/licenses/by/4.0/).
Copyright: This open access article is published under a Creative Commons CC BY 4.0 license, which permit the free download, distribution, and reuse, provided that the author and preprint are cited in any reuse.


